Preprint
Article

Extraction of Carotenoid from Pumpkin (Cucurbita moschata) and Spinach (Spinacia oleracea) Using Environmentally Friendly Deep Eutectic Solvents (DESs)

Submitted:

19 December 2024

Posted:

20 December 2024

You are already at the latest version

A peer-reviewed article of this preprint also exists.

Abstract

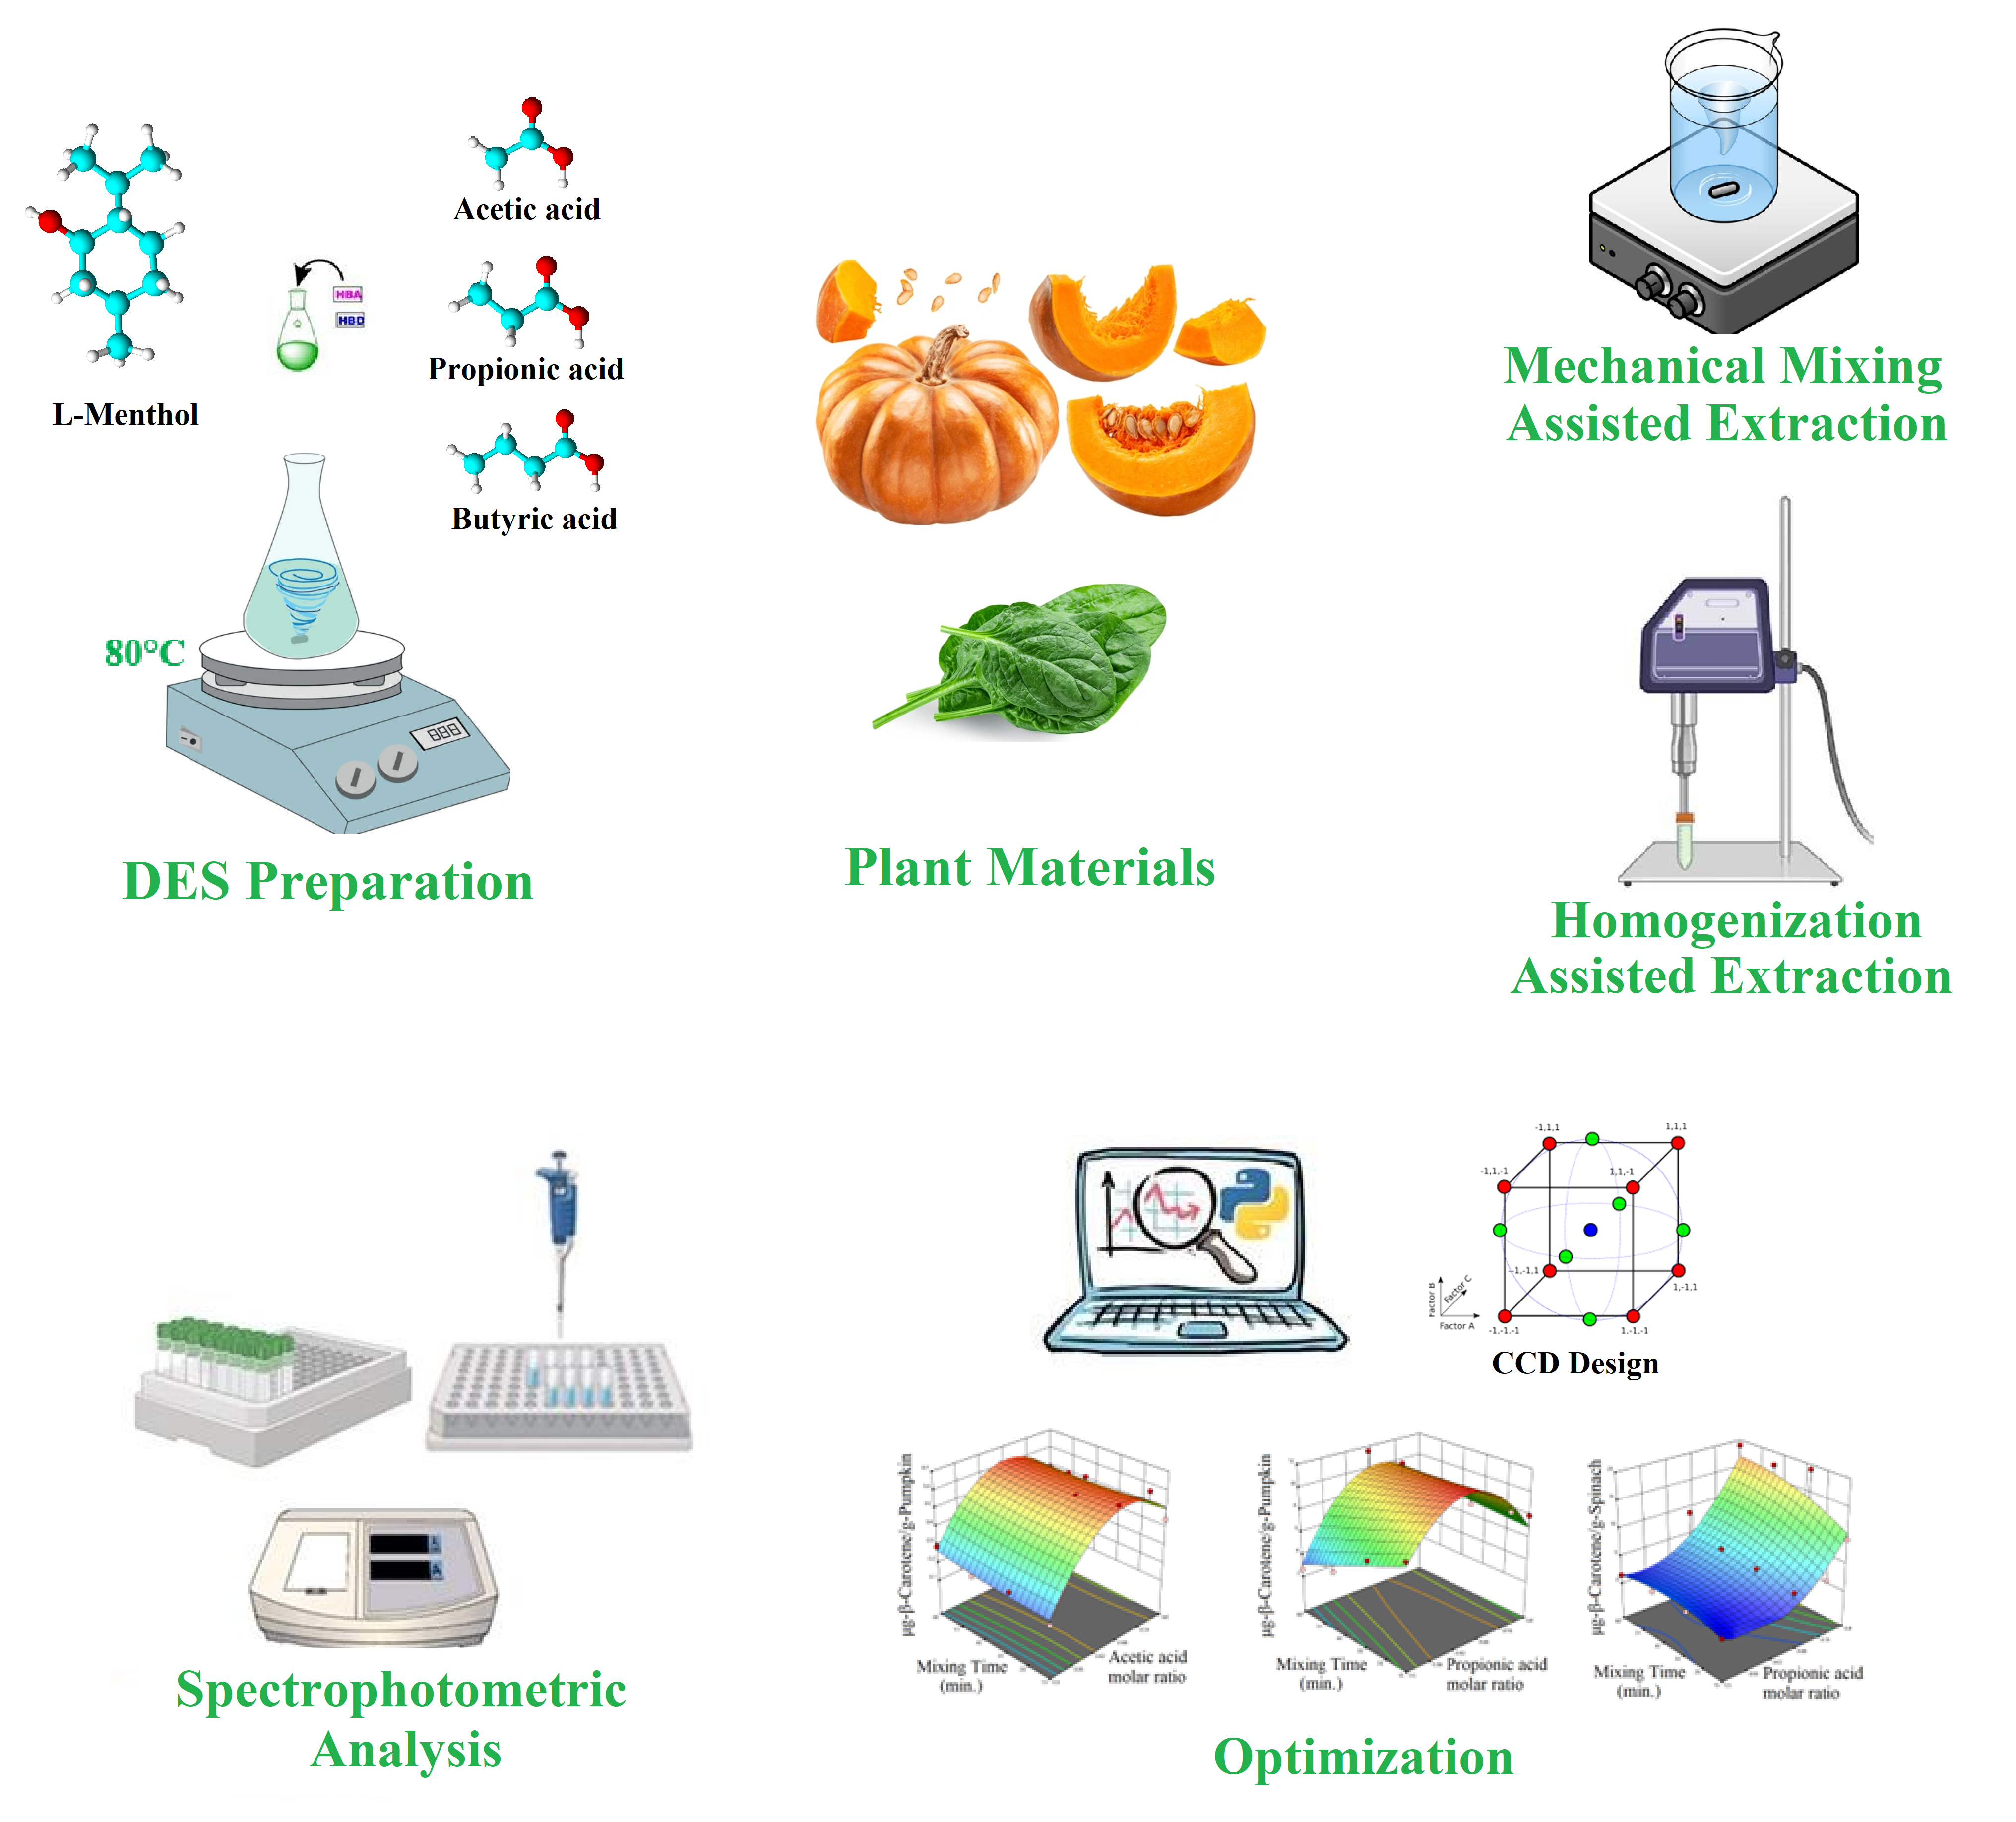
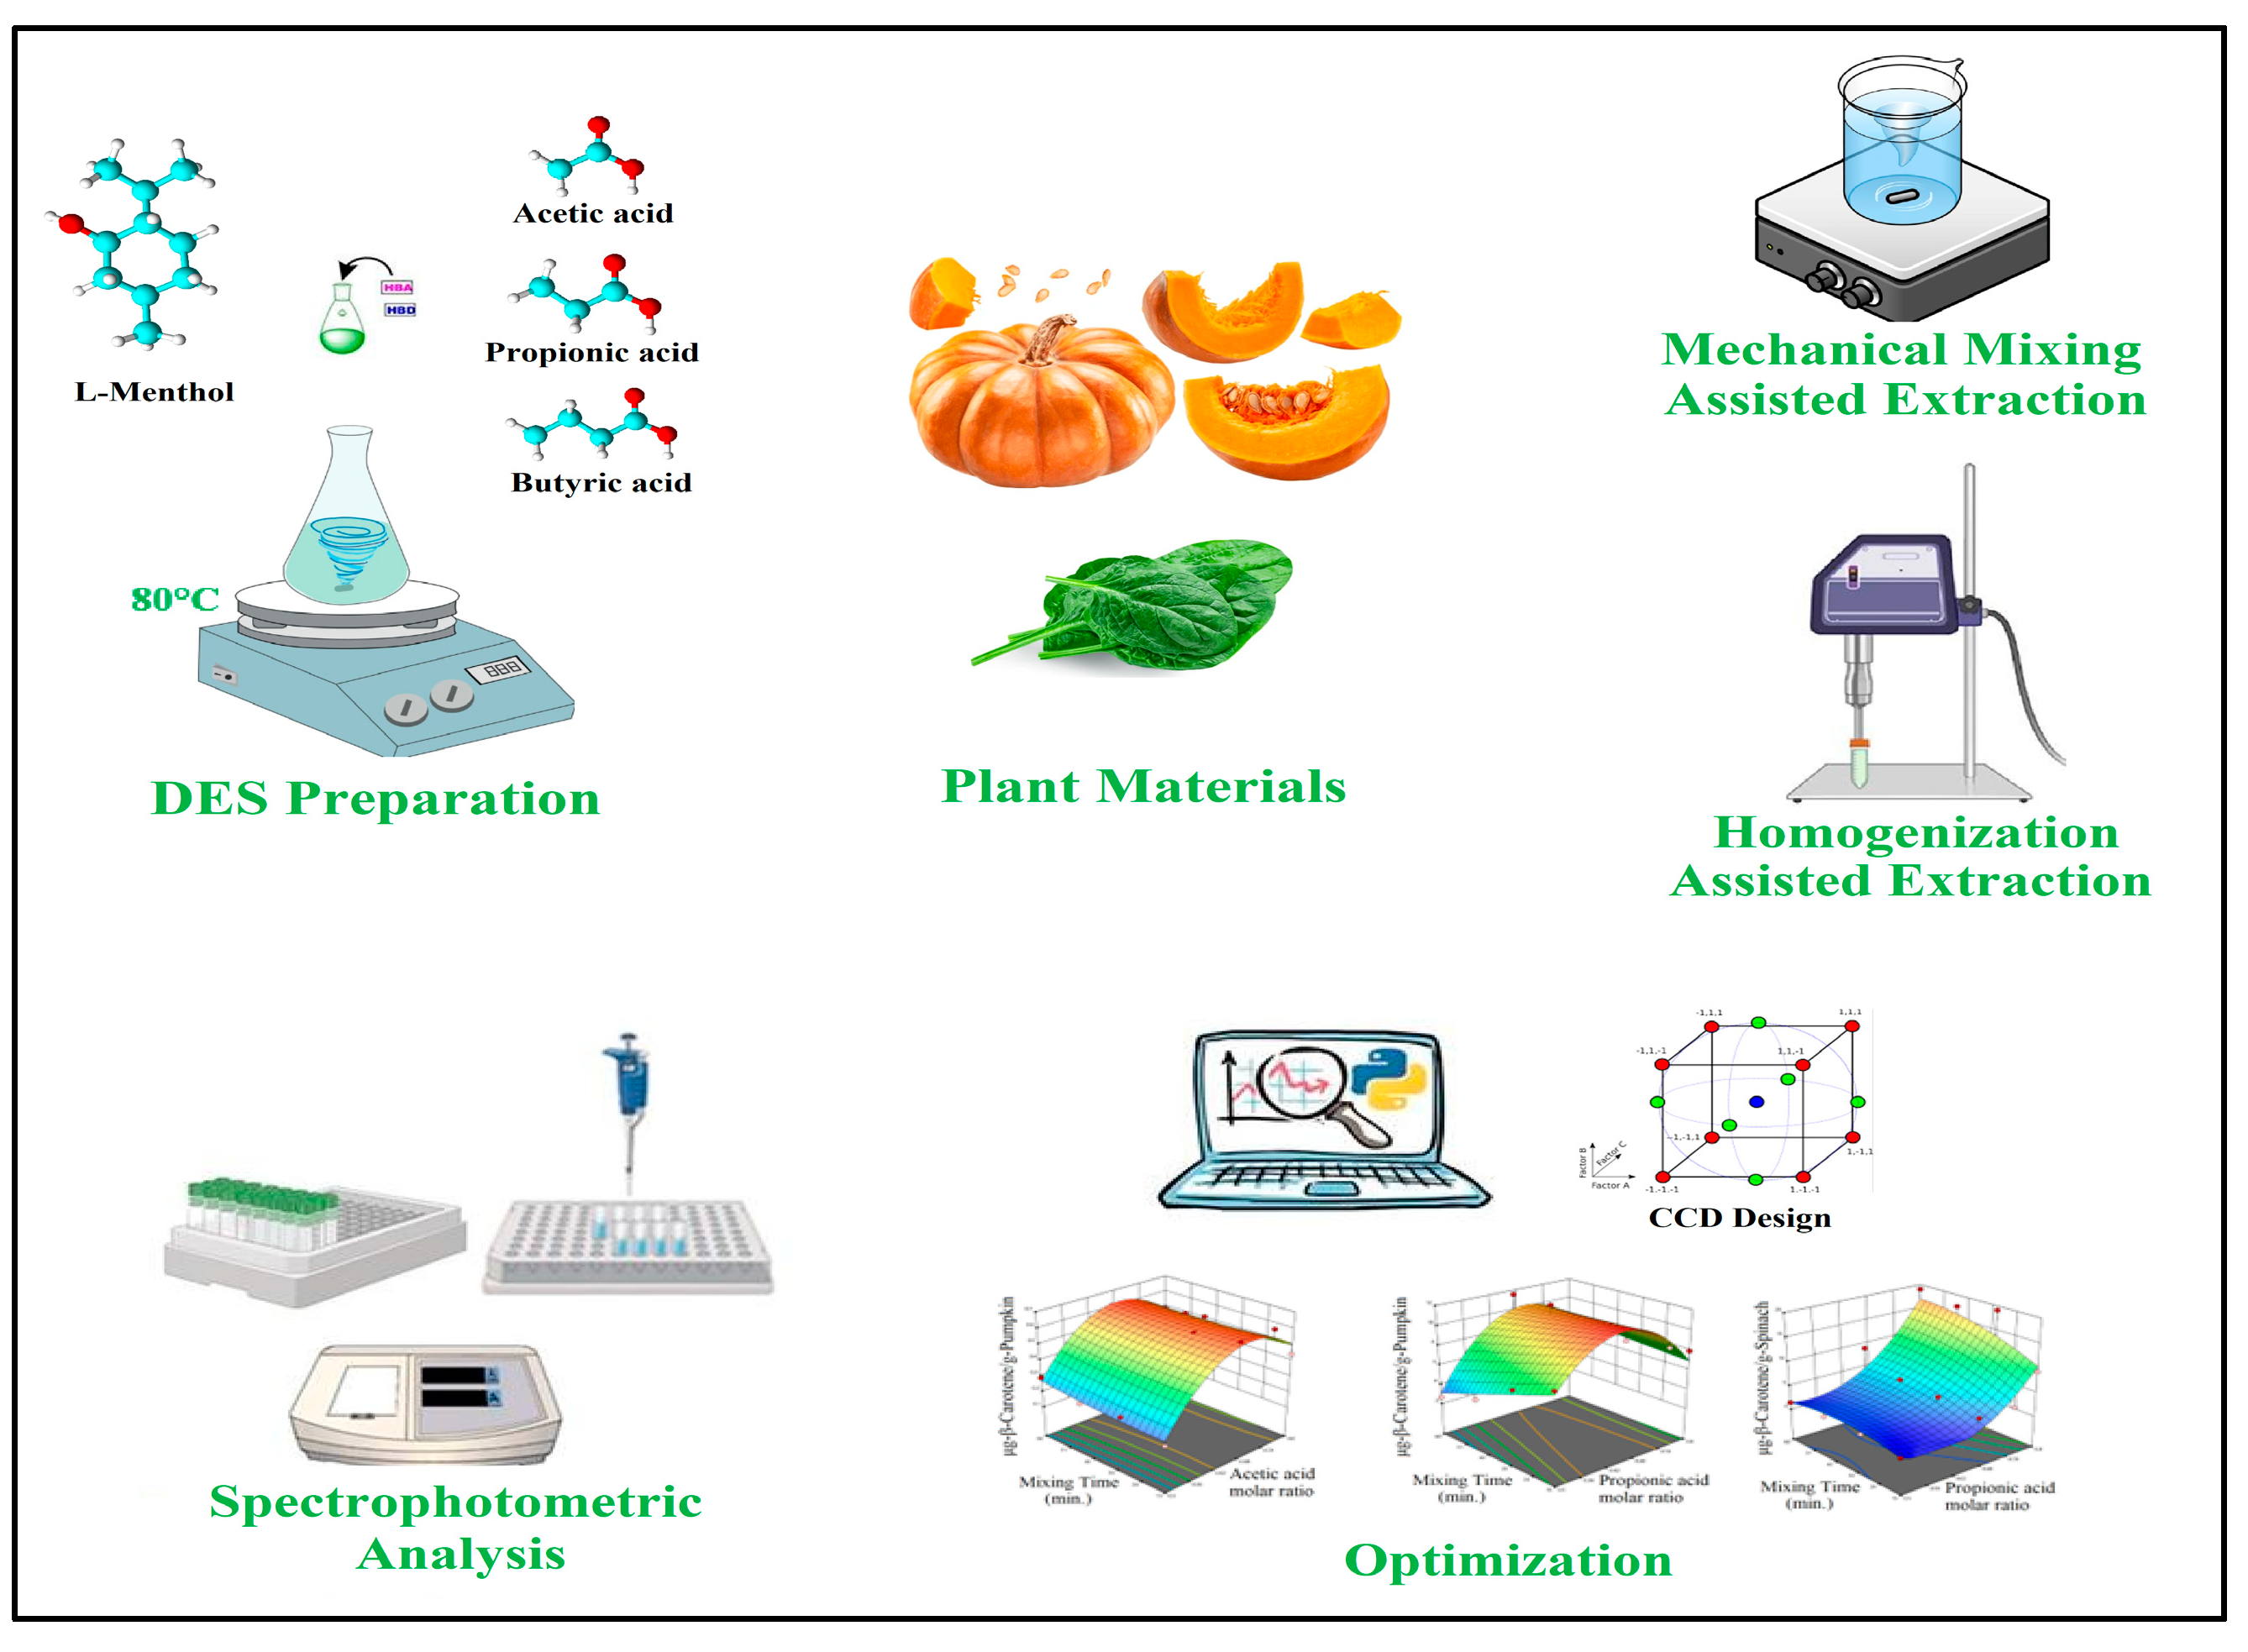
The annually wasted amount of food had surpassed 1 billion metric tons. Food waste is considered as an important source for recovery of bioactive compounds, such as carotenoids. There is a demand for antioxidants, nutraceuticals and natural colorants in various industries and carotenoids are one of the commonly used compounds which fit with this description. Pumpkin and spinach waste, whose combined amount is over 2 million metric tons, contains bioactive compounds and these wasted foods could be utilized for recovery of carotenoids. Carotenoids are hydrophobic molecules; therefore, commercial extraction processes often use highly non-polar solvents, and these are rarely environmentally friendly. The aim of this research was to develop effective extraction processes for carotenoids from pumpkin and spinach using environmentally friendly green chemicals. A series of deep eutectic solvents (DESs) composed with L-menthol and carboxylic aliphatic acids were made for extraction of carotenoids from pumpkin (Cucurbita moschata) and spinach (Spinacia oleracea) via mechanical mixing assisted extraction (MMAE) and homogenization assisted extraction (HAE). Response surface methodology (RSM) and analysis of variance (ANOVA) analysis were used to analyze the data and optimization. The DESs composed from L-Menthol and Propionic Acid had the best effect on the extraction of total carotenoid content (TCC) (represented as ß-Carotene) from pumpkin and spinach via solutions with 1:2 and 1:4 molar ratios, respectively. The yield of carotenoid extraction is expressed in μg-ß-Carotene/g of pumpkin or spinach. Under the calculated optimum conditions, the yields are estimated to be 11.528 μg-ß-Carotene/g-pumpkin for MMAE method, 8.966 μg-ß-Carotene/g-pumpkin for HAE method, 16.924 μg-ß-Carotene/g-spinach for MMAE method and 18.870 μg-ß-Carotene/g-spinach for HAE method.

Keywords: 
;  ;  ;  ;  ;  ;  ;  ;  ;  ;  

1. Introduction

Carotenoids are a group of natural pigments widely used in the food industry. ß-carotene is an important compound in this group and the significance of this component has recently increased due to its high provitamin-A content, coloring properties and its antioxidant effect [1]. Carotenoids are natural pigments that occur in bacteria, fruits, plants and fungi [2]. They cannot be synthesized by human, and they must be obtained from food sources. One of the most important sources of carotenoids for humans are plants. The fruits and vegetables we eat provide most of the 40 - 50 different carotenoids found in our diet. The most common carotenoids found in the human diet are: α-carotene, β-carotene, β-cryptoxanthin, lutein, zeaxanthin and lycopene [3]. In particular, α-carotene, β-carotene and β-cryptoxanthin are vitamin A precursor carotenoids. Once in the body, these molecules can be converted into retinol by the body. The carotenoid compounds that are found in relatively high concentrations in fruits and vegetables are lycopene, β-carotene, lutein, zeaxanthin, β-cryptoxanthin and α-carotene [4].
ß-Carotene is an important carotenoid, and it is also the most common carotenoid found in the plants [5]. It is an organic compound, which has red-orange color, that is found in plants, fruits and fungi [2]. ß-Carotene is best known for being precursor to vitamin A, which is essential for vision, immune functions and skin health.
ß-Carotene is isolated from plants and fruits, which have ample amounts of carotenoids, by extraction process following by separation using column chromatography. Aside from that, it is industrially manufactured by chemical synthesis or by extraction from biological sources such as vegetables rich in ß-Carotene and microalgae (especially Dunaliella salina). In order to separate ß-Carotene among the mixture of carotenoids, polarity of the compound needs to be taken into account. ß-Carotene is a non-polar hydrocarbon based (C40H56) compound. Therefore, it is separated via utilization of non-polar solvents such as hexane. The other environmentally non-friendly solvent choices could be tetrahydrofuran, methyl t-butylether, benzene and solvents being halogenated derivatives of hydrocarbons due to their specific advantage over other non-polar solvents in terms of solubility of ß-Carotene [6]. None of these solvents are attractive due to their negative effects on the environment and human health (especially benzene is suspected to cause cancer [7] and considered to be class-I (very dangerous for human health) solvent [8] in the pharmaceutical industry).
“Food waste” is a hot topic. With the increasing population, the production of food also increased. On the other hand, approximately 25-30% of the food produced is turning into waste without being used [9]. In 2022, the globally wasted amount of food was 1.052 billion metric tons [10], and this number keeps increasing over time. The economic value of the lost food is surpassing 1 trillion United States Dolars (USD) annually [10]. From an environmental point of view, 8-10% of the greenhouse gas emissions are estimated to originate from food waste [10]. The main source of food waste is the production stage, where more than 500 million metric tons are lost due to crop pests, ineffective harvesting and irrigation. This is followed by “post-harvest processing”, “storage” and “consumption” with about 350 million metric tons, where these three stages account for approximately 75% of overall food waste [11]. With the rapid increase in human population, it is expected that by 2050, the amount of municipal solid waste worldwide will reach 3.4 billion tons, with food and organic waste accounting for the largest portion [12]. Food losses are not only an agricultural problem but also they affect global climate change and cause other environmental damage. According to the Food and Agriculture Organization of the United Nations [13], the carbon footprint of lost and wasted food was equivalent to 3.3 billion tons of CO2 emissions per year in 2007 and 3.6 billion tons in 2011.
Pumpkin and spinach have also a place in this food loss and waste. Based on the 2022 Food and Agriculture Organization Statistics (FAOSTAT) statistics, the global production of pumpkin, squash and gourds was approximately 22.8 million metric tons [14]. Especially, one of the major sources of pumpkin waste is originated from Halloween decorations. In 2016, more than 1.3 billion pounds (~589,670 metric tons) of pumpkins were discarded as waste after Halloween in United States alone [15]. In 2022, following the Halloween period, approximately 22.2 million pumpkins were discarded as garbage, where these were considered to be edible. The economic value of this wasted pumpkins is estimated to be approximately 32.6 million British Pound Sterling (GBP) [16]. Hence, the importance of recovery of carotenoids from the aforementioned waste can be emphasized by taking the wasted amount of pumpkins and the fact that raw pumpkins comprise ~3596 μg ß-carotene in 1 cup measure (~116g) [17] into account. Loss of spinach is also considered in the context of vegetables. As a highly perishable leafy green vegetable, spinach contributes significantly to vegetable waste. In 2020, approximately 31.0 million metric tons of spinach manufactured globally where 6.5% of this spinach (over 2 million metric tons) was estimated to be lost during retail phase and approximately 35% (~10.85 million metric tons) was lost in the house hold consumption [18]. Solely, in the UK, 24.8% of the spinach is wasted within the farm, grading, storage, packaging and retail before reaching households, which corresponds to ~15,384 metric tons [19]. As described above, the importance of recovery of carotenoids from the spinach waste can be also emphasized with the information that spinach is also rich in carotenoids (raw spinach comprise ~1688 μg ß-carotene in 1 cup measure (~30g) [17]).
Considering the importance of Carotenoids, and the pumpkin and spinach that go to the waste, a need for environmentally safer “green” solvents arises for the extraction of Carotenoids from vegetables and fruits (such as pumpkin and spinach leaves).When compared with traditional extraction solvents, DESs have environmental and economic advantages. The DES components (L-menthol, acetic acid, propionic acid and butyric acid) used in the work presented in this paper have very low toxicity when compared to traditional hydrophobic solvents used in the extraction such as hexane (considering LD50 values). Aside from this; the biodegradation time for menthol, acetic acid, propionic acid and butyric acid are 28 days [20], 7 days [21], 11 days (half-life) [22], 6 days [23], respectively. Hayyan et. al. also reported more than 60% biodegradability within 28 days for the DESs they have produced in the study in 2024 [24]. Deep Eutectic Solvents are generally used at lower temperatures (40–120°C), often within the range of 40–80°C depending on the application in the field of extraction processes. With traditional organic solvents extractions could be operated at room temperature to moderate temperatures (25–80°C) or at higher temperatures (up to 100°C or more) for specific methods like reflux extraction. By using DES, the energy input required for extraction processes could be potentially reduced and high temperatures often needed for traditional solvents could be avoided which contribute to both economic and environmental sustainability.
With regards to Carotenoids’ extraction, some of the following studies could be given as examples. Sebdani and Abbasi used ultrasound-assisted extraction (UAE) method with using sunflower oil as the green solvent in 2023 [25]. In their study, Sebdani and Abbasi first freeze-dried the pumpkin (Cucurbita pepo) and obtained a powder. Following that, this powder was mixed with sunflower oil (with various solid/solvent ratios from 0.01 to 0.10) and placed in the ultrasonic bath at 20-60°C for 10-70 minutes. Later, the carotenoids were determined by measuring the absorption of oil cyclohexane at 450 nm wavelength. As a result of this study, the researchers had reported that they have obtained 5.3 to 20.7 μg ß-carotene per 100g sample and concluded that solid-solvent ratio, temperature, and ultrasonic time have a considerable effect on the carotenoid content but no effect on the oil oxidation parameters. No DESs were used in Sebdani and Abbasi’s research where this paper describes the utilization of DESs as green solvent systems. Also in this work MMAE and HAE methods were used instead of UAE method. Stupar et.al. had used several natural deep eutectic solvents (NADESs) to extract ß-Carotene from pumpkin (Cucurbita maxima) with the support of ultrasonic power in 2021 [26]. The team first mixed the components at 50°C and cooled down the mixtures to room temperature to obtain the following NADESs: Caprylic acid:Capric acid (with molar ratios 2:1, 3:1, 4:1), Caprylic acid:Lauric acid (3:1), Pelargonic acid:Lauric acid (3:1), Capric acid:Lauric Acid (2:1), Pelargonic acid:Capric acid:Lauric acid (3:1:1), DL-Menthol:Capric acid (2:1), DL-Menthol:Caprylic acid (1:1) and DL-Menthol:Lauric acid (2:1). After freeze-drying the pumpkin for 48 hours, the samples were pulverized and treated with NADESs (1:10 ratio) for extraction via utilization of shaker for 24 hours and 450 rpm shaking speed. To intensify the extraction and recovery of ß-carotene, Caprylic acid:Capric acid (3:1) NADES was combined with UAE (at 37 kHz frequence) since this NADES showed to have best affinity and solubility of ß-carotene. The team had evaluated results by response surface methodology (RSM) and concluded that fatty acid based NADESs with the applied extraction method had shown very promising environmentally friendly method from the point of green chemistry and Caprylic acid:Capric acid (3:1) NADES showed the highest solubility of ß-carotene and good stability of recovered compound over the time. The NADESs in Stupar et.al.‘s research were made from fatty acids (C8 to C12 chain lengths) and DL-menthol in combination with C8, C10 and C12 fatty acids, where in this very paper the hydrogen bond donors (HBDs) were carboxylic acids that comprise less than 5 carbons in their structures. Following that; in this research, the team has utilized MMAE and HAE methods instead of using UAE method. Makrygiannis et.al. synthesized two DESs and used them in the extraction of antioxidant polyphenols and carotenoid pigments from apricot pulp in 2022 [27]. The DESs first synthesized as glycerol:choline chloride at molar ratio 2:1 and glycerol:citric acid:L-proline at a ratio of 2:1:1. Finally 20% water was added to the DESs before they were used for the extraction. The extraction of carotenoid pigments was carried out at 47C for 60 minutes under reflux and under stirring (250 rpm). The optimum conditions was reported to be the same in the article and using these conditions, the total carotenoid content was calculated to be 171.2 ± 9.2 mg/ 100g dried weight. Lazzarini et.al. [28] synthesized different categories of solvents, both traditional and green in the year 2022. Two of green solvents were DESs which were composed of DL-menthol:lactic acid with molar ratio of 8:1 and ethyl acetate:ethyl lactate ratio of 70:30 v/v. These solvent systems were utilized in the extraction of carotenoids from tomato pomace. The extract obtained using ethyl acetate:ethyl lactate DES with non-thermal air drying showed the highest contents of lycopene and ß-carotene (75.86 and 3950.08 µg/g of dried sample, respectively). Terlidis et.al. synthesized hydrophobic DESs with the combinations of thymol:hexanoic acid, thymol:octanoic acid and hexanoic acid:octanoic acid in 2023 [29]. Each of these DESs were prepared with 2:1, 1:1 and 1:2 molar ratio combinations. The team used the synthesized DESs in the extraction process of carotenoids from orange peels via mechanical mixing. The reported that the optimal hydrophobic DES was found to be thymol:hexanoic acid (2:1) and the optimum extraction was achieved using solvent-to-solid ratio 12:1 and temperature of 20°C for 78 minutes which resulted in a recovery of 259.45 µg of total carotenoids per g of dry matter.
The work in this paper uses DESs instead of CO2 or traditional solvents of extraction (i.e. hexane) as the main driver of the extraction process. All research examples given above [25,26,27,28,29] use freeze-dried samples. The freeze-drying process utilizes electrical energy and vacuum power which create additional load on consumption of resources and costs for the preparation of sample. In this work, the pumpkin and spinach samples were directly used after sizing without any additional preparative process, where this resulted in saving of time, energy and cost.
In this regard, utilization of Deep Eutectic Solvents (DESs) could come into the picture as a solution. A “Deep Eutectic Solvent” (DES) is a mixture of two or more compounds that have lower melting point than the compounds make it up. One of these compounds is typically a hydrogen bond donor (HBD) and the other one is a hydrogen bond acceptor (HBA). Combining an HBD and HBA forms a eutectic mixture, which has a melting point considerably lower than that of the individual components. The DESs are often used in green chemistry due to their adjustable properties, their lower toxicity, and environmental beneficial factors.
The aim of this study is to extract carotenoids (quantified by means of ß-Carotene) from both pumpkin (Cucurbita moschata) and spinach (Spinacia oleracea) by using L-menthol and carboxylic acid based natural DESs with the assistance of mechanical mixing and homogenization and constructing mathematical models to determine the parameters of maximum efficiency for each extraction method. The natural DESs were obtained by mixing L-menthol as the hydrogen bond acceptor (HBA) and Acetic Acid, Propionic Acid and Butyric Acid as the hydrogen bond donors (HBD). Menthol is an organic compound which naturally occurs in the oils of several plants in the mint family, such as peppermint and corn mint. Menthol is a cheap and natural compound to form a DES, where it will be used as the hydrogen bond acceptor (HBA). The hydrogen bond donors (HBD) are selected among Acetic Acid, Propionic Acid and Butyric Acid, where all these acids are naturally found in the foods and plants (i.e. vinegar, potatoes, butter…etc.). The study described in this paper has several advancements when compared to previous studies. First and foremost; the DESs used in this research work are environmentally friendly DESs which are synthesized from naturally occurring components to start with, unlike many of the solvents used in the extraction processes for hydrophobic substances such as ß-carotene. The second important point is not using expensive and power consuming pre-treatment methods in the sample preparation. As given in the examples above and in almost all the previous studies, the samples are pre-treated with drying (freeze drying, vacuum drying or simple evaporation). The DESs in this study allowed the team to use the samples just after they were chopped down and sized without any further pre-treatment. The last point is that; L-Menthol:Propionic acid and L-Menthol:Butyric acid combinations were rarely used in the prior art for the preparation of DESs. When forming the DESs, the hydrogen bond acceptors (HBAs) are generally selected among the quaternary salts such as choline chloride instead of menthol. Despite their foul-smelling odors to work with, due to their oily-like nature propionic acid and butyric acid are selected as HBDs. The synthesized aforementioned DESs were used in this study for the first time in the extraction of carotenoids from pumpkin and spinach. Experimental results of MMAE and HAE of total carotenoid content (TCC) (quantified by means of ß-Carotene) from pumpkin and spinach with these DESs were modeled, and formulae were created for each extraction setup. Optimum conditions were obtained depending on the formulae.

2. Materials and Methods

2.1. Materials

The pumpkins (Cucurbita moschata) were obtained in its raw form from local a farm located in Ordu/Türkiye. The spinach (Spinacia oleracea) leaves were obtained as leaves in their raw form from a market located in Istanbul/Türkiye. The pumpkins were peeled and cut into pieces, where the pieces were sized around ≤2 mm and used as the pumpkin samples. The spinach leaves were washed and cleaned, then chopped into small pieces (also ≤2mm) and used as the spinach samples. The calibration curves were prepared with ß-Carotene (≥97.0%) Sigma Aldrich Chemie GmbH (Albuch/Germany). L-Menthol flakes (≥99.7%) were purchased from BASF SE (Ludwigshafen/Germany). DES ingredients such as acetic acid (≥99.5%) was purchased from Merck (Darmstadt/Germany), propionic acid (≥99.0%) and butyric acid (≥99.0%), were purchased from Merck Schuchardt OHG (Hohenbrunn/Germany). The 0.45 μm RC filters were purchased from Sartorius Türkiye (Istanbul/Türkiye).

2.2. Preparation of Deep Eutectic Solvents (DESs)

The DESs used in the extraction ß-Carotene were prepared by mixing L-menthol flakes, used as the hydrogen bond acceptor (HBA) and acetic acid, propionic acid and butyric acid as hydrogen bond donors (HBD). The amounts to be mixed were dispensed by using an analytical balance (Shimadzu Corporation, Type: ATX224, Kyoto/Japan) with an accuracy of ± 0.0001 gr in accordance with the required molar ratios as shown in Table 1.
Afterwards, HBA and HBD at predetermined ratios were mixed and heated on a hotplate stirrer (Daihan Scientific Co., Ltd., model: MSH-20D, South Korea) up to 80°C and kept there until a homogeneous transparent liquid was obtained. Afterwards the mixtures were cooled down to room temperature (25°C). The pH and the densities of the obtained DESs were measured with Mettler-Toledo, SevenCompact pH/Ion S220 and Mettler-Toledo, DM40, respectively. The pH and density results that were obtained are provided in Table S1 along with the physical state observation at temperatures 5°C and -18°C.
Table 1. HBA, HBD, molar ratios and the abbreviations of DESs used in this study.
Hydrogen bond acceptor (HBA) Hydrogen bond donor (HBD) Molar Ratio
(HBA:HBD)
Abbreviations
L-Menthol Acetic acid 1:1 M1ACA1
L-Menthol Acetic acid 1:2 M1ACA2
L-Menthol Acetic acid 1:3 M1ACA3
L-Menthol Acetic acid 1:4 M1ACA4
L-Menthol Propionic acid 1:1 M1PRA1
L-Menthol Propionic acid 1:2 M1PRA2
L-Menthol Propionic acid 1:3 M1PRA3
L-Menthol Propionic acid 1:4 M1PRA4
L-Menthol Butyric acid 1:1 M1BTA1
L-Menthol Butyric acid 1:2 M1BTA2
L-Menthol Butyric acid 1:3 M1BTA3
L-Menthol Butyric acid 1:4 M1BTA4

2.3. Calibration Curve Study for ß-Carotene in Deep Eutectic Solvents (DESs)

To establish the calibration curvers for determination of ß-Carotene concentration in the extraction samples, the reference ß-Carotene was dissolved in each of the obtained DESs with concentrations of 20 ppm, 40 ppm, 60 ppm, 80 ppm and 100 ppm for each measurement. The prepared samples were analyzed in the UV/Visible Spectrophotometer (PG Instruments Limited, model: T60 U) under wavelength of λ=450 nm [26]. Based on the results obtained from UV Spectrophotometer, ß-Carotene calibration curve equations were calculated for each and every DES used in this study. The calibration curve equations of ß-Carotene for each DES are given in Table S2.

2.4. Mechanical Mixing Assisted Extraction (MMAE) of ß-Carotene

The pumpkin samples were dispensed with mass of 320±25mg and dissolved in 10 ml in the DESs M1ACA1, M1ACA2, M1ACA3, M1ACA4, and with mass of 120±13mg and dissolved in 10 ml in the DESs M1PRA1, M1PRA2, M1PRA3, M1PRA4. Spinach samples were dispensed with mass of 40±20mg and dissolved in 10 ml in the DESs M1ACA1, M1ACA2, M1ACA3, M1ACA4, with mass of 105±6mg and dissolved in 10 ml in the DESs M1PRA1, M1PRA2, with mass of 160±60mg and dissolved in 10 ml in the M1PRA3, with mass of 28±8mg and dissolved in 10 ml in the M1PRA4, and with mass of 78±40mg and dissolved in 10 ml in the DESs M1BTA1, M1BTA2, M1BTA3, M1BTA4. The sample amounts were determined in a manner that the read absorbance values would not exceed the meaningful upper limit of UV Spectrophotometer (1.000). After putting samples into the DESs, the items were stirred with mechanical mixer (Daihan Scientific Co., Ltd., model: MSH-20A, South Korea) at 500 rpm speed at the room temperature (25°C) under atmospheric pressure. The samples were mechanically stirred for 15, 30, 45 and 60 minutes.

2.5. Homogenization Assisted Extraction (HAE) of ß-Carotene

The pumpkin samples were dispensed with mass of 315±30mg and dissolved in 10 ml in the DESs M1ACA1, M1ACA2, M1ACA3, M1ACA4, and with mass of 117±17mg and dissolved in 10 ml in the DESs M1PRA1, M1PRA2, M1PRA3, M1PRA4. Spinach samples were dispensed with mass of 25±10mg and dissolved in 7 ml in the DESs M1ACA1, M1ACA2, M1ACA3, M1ACA4, with mass of 35±21mg and dissolved in 7 ml in the DESs M1PRA1, M1PRA2, M1PRA3, M1PRA4, and with mass of 45±16mg and dissolved in 7 ml in the DESs M1BTA1, M1BTA2, M1BTA3, M1BTA4.The sample amounts were determined in a manner that the read absorbance values would not exceed the meaningful upper limit of UV Spectrophotometer (1.000). After putting samples into the DESs, the items were treated with homogenizer (IKA T25 Ultra Turrax) at 7000 rpm, 10500 rpm and 14000 rpm speeds at the room temperature (25°C) under atmospheric pressure. The samples were treated for 30, 60, 90 and 120 seconds.

2.6. Analysis of Samples with UV/Visible Spectrophotometer for Total Carotenoid Content

After the mixing and homogenization, the mixtures were filtered through 0.45 μm RC filters and the UV absorbance measurements were collected. UV/Vis spectrophotometer (PG Instruments, T60/Leicestershire, England) was used. Each sample was measured with 3 replicates in glass/quartz UV cuvettes at λ=450 nm wavelength against the blank sample (the relevant DES itself without any solute in it). The obtained absorbance values were used in the corresponding calibration curve equation of each DES (Table S2) to calculate the concentration of the carotenoids in ppm (mg/L) which was followed by calculation of mass of obtained carotenoid content via multiplying the ppm value with volume of the DES. The quantitative results for total carotenoid content (TCC) were given in micrograms of ß-Carotene per gram of pumpkin (μg-ß-Carotene/g-pumpkin) and spinach (μg-ß-Carotene/g-spinach) samples.

2.7. Statistical Design of Experiments

In order to design the experimental plan, mathematical modelling and optimization of parameters, a statistical method called Response Surface Methodology (RSM) was used. The response surface methodology is a statistical and mathematical method which creates a relationship between a dependent variable (response), which could be denoted as “y” and one or more independent variables, which could be denoted as “x1, x2,…,xn” [30]. In this research work, in order to evaluate the obtained data and the affecting factors, the necessary calculations and data processing algorithms were performed by utilization of Stat-Ease 360® software (trial version) and Minitab 21.4.1 (64-bit) (trial version). Prior to beginning of the study, the appropriate experimental design type for quadratic response surfaces had to be selected [31]. Within the several design classes (3-level factorial design, Doehlert design, Box-Behnken and central composite designs), central composite design (CCD) was selected. It is also the most commonly applied design type [30]. The number of experiments (N) is calculated by equation (1):
N=k2+2k+Cp
k= Number of process parameter
Cp= Number of replicate at centre points.

3. Results

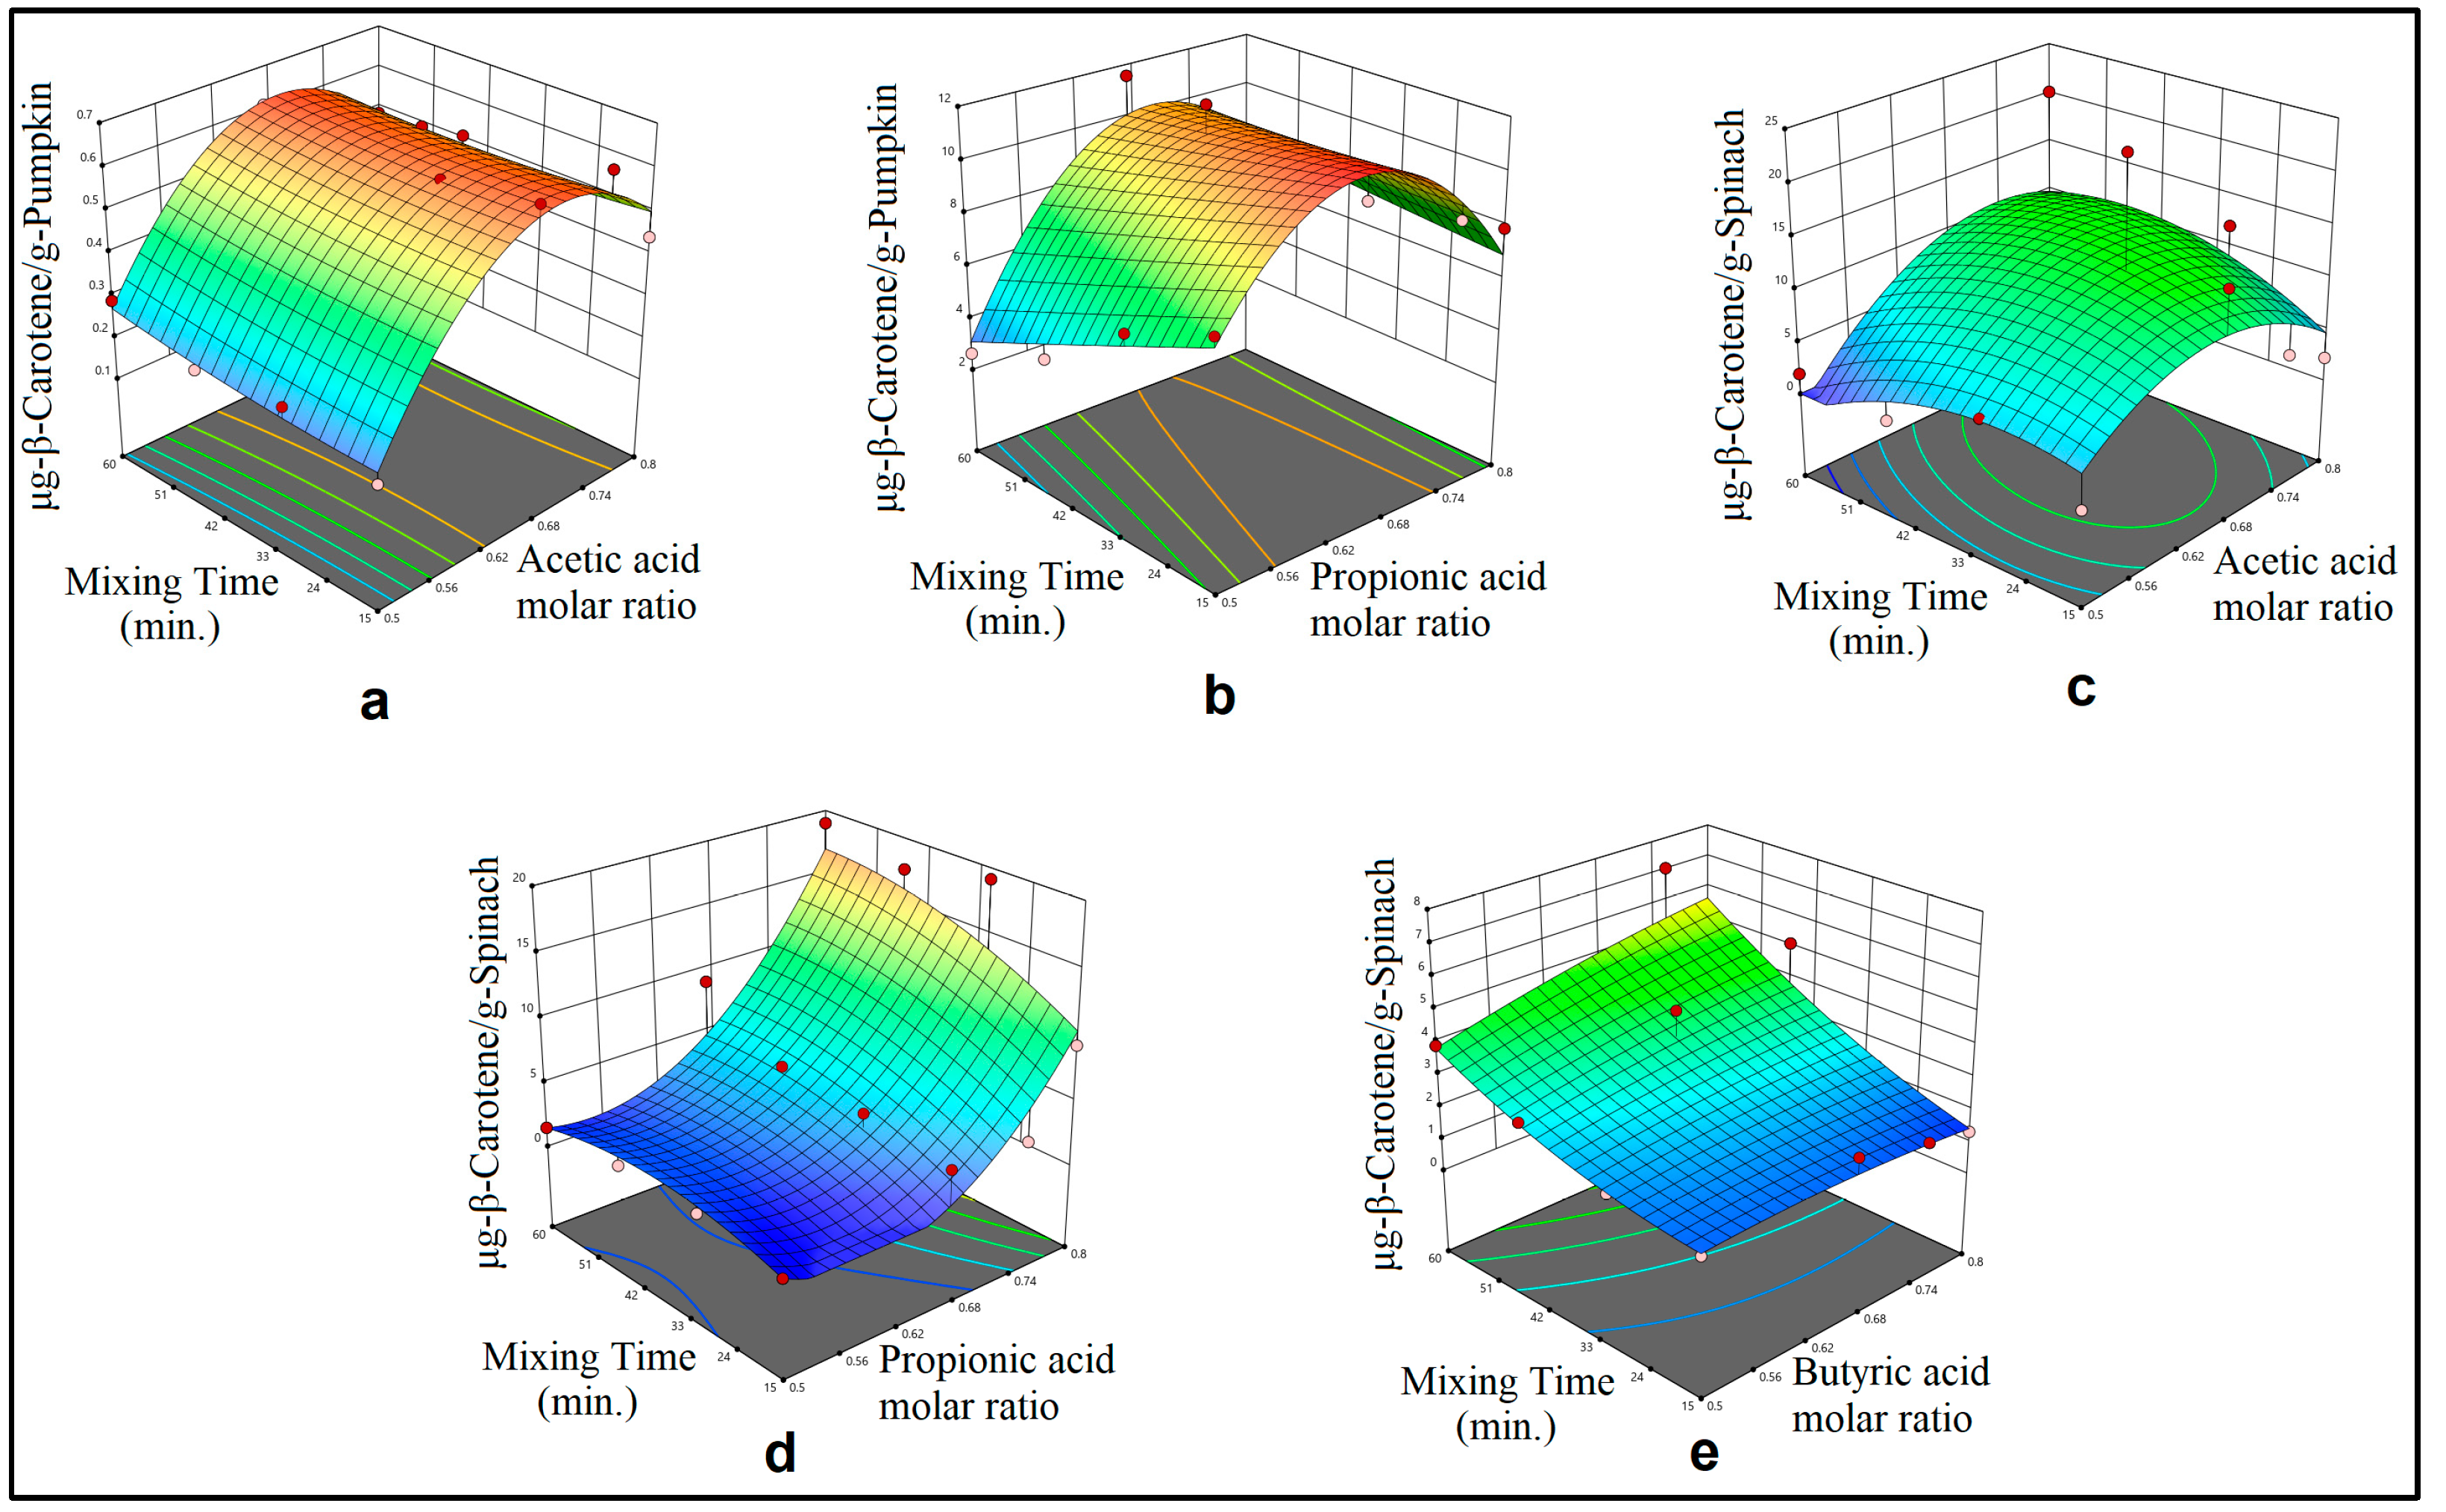
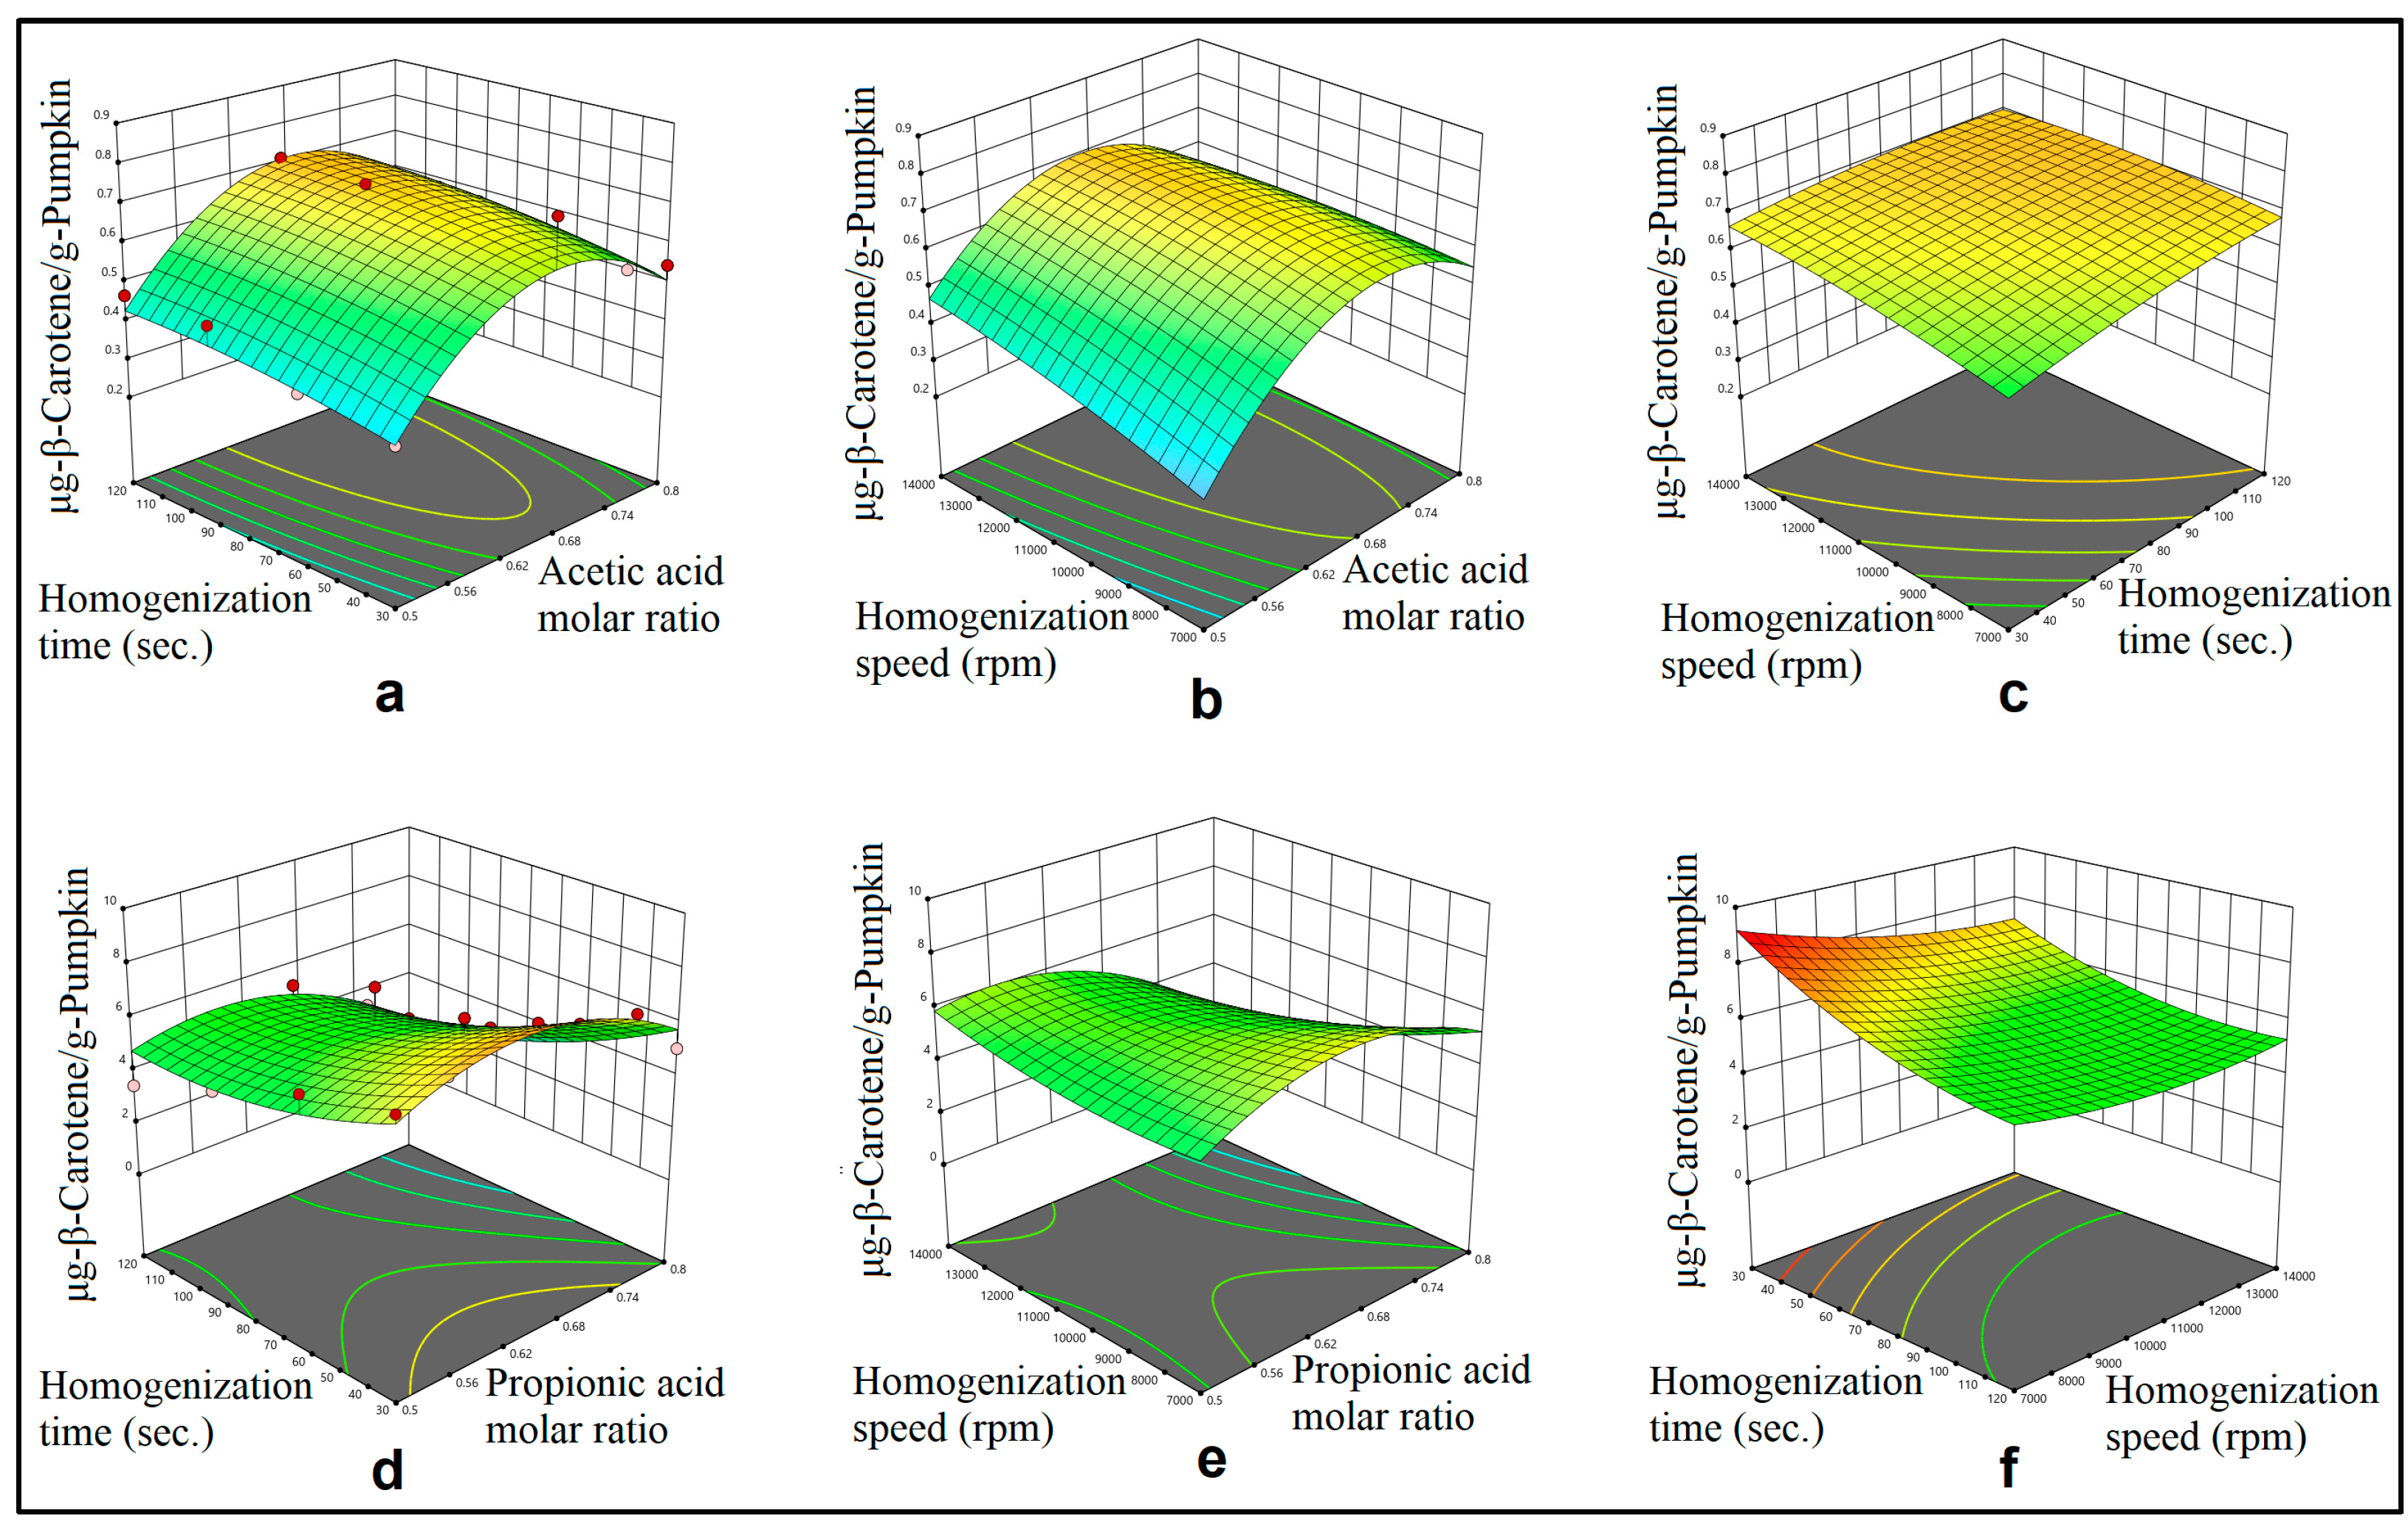
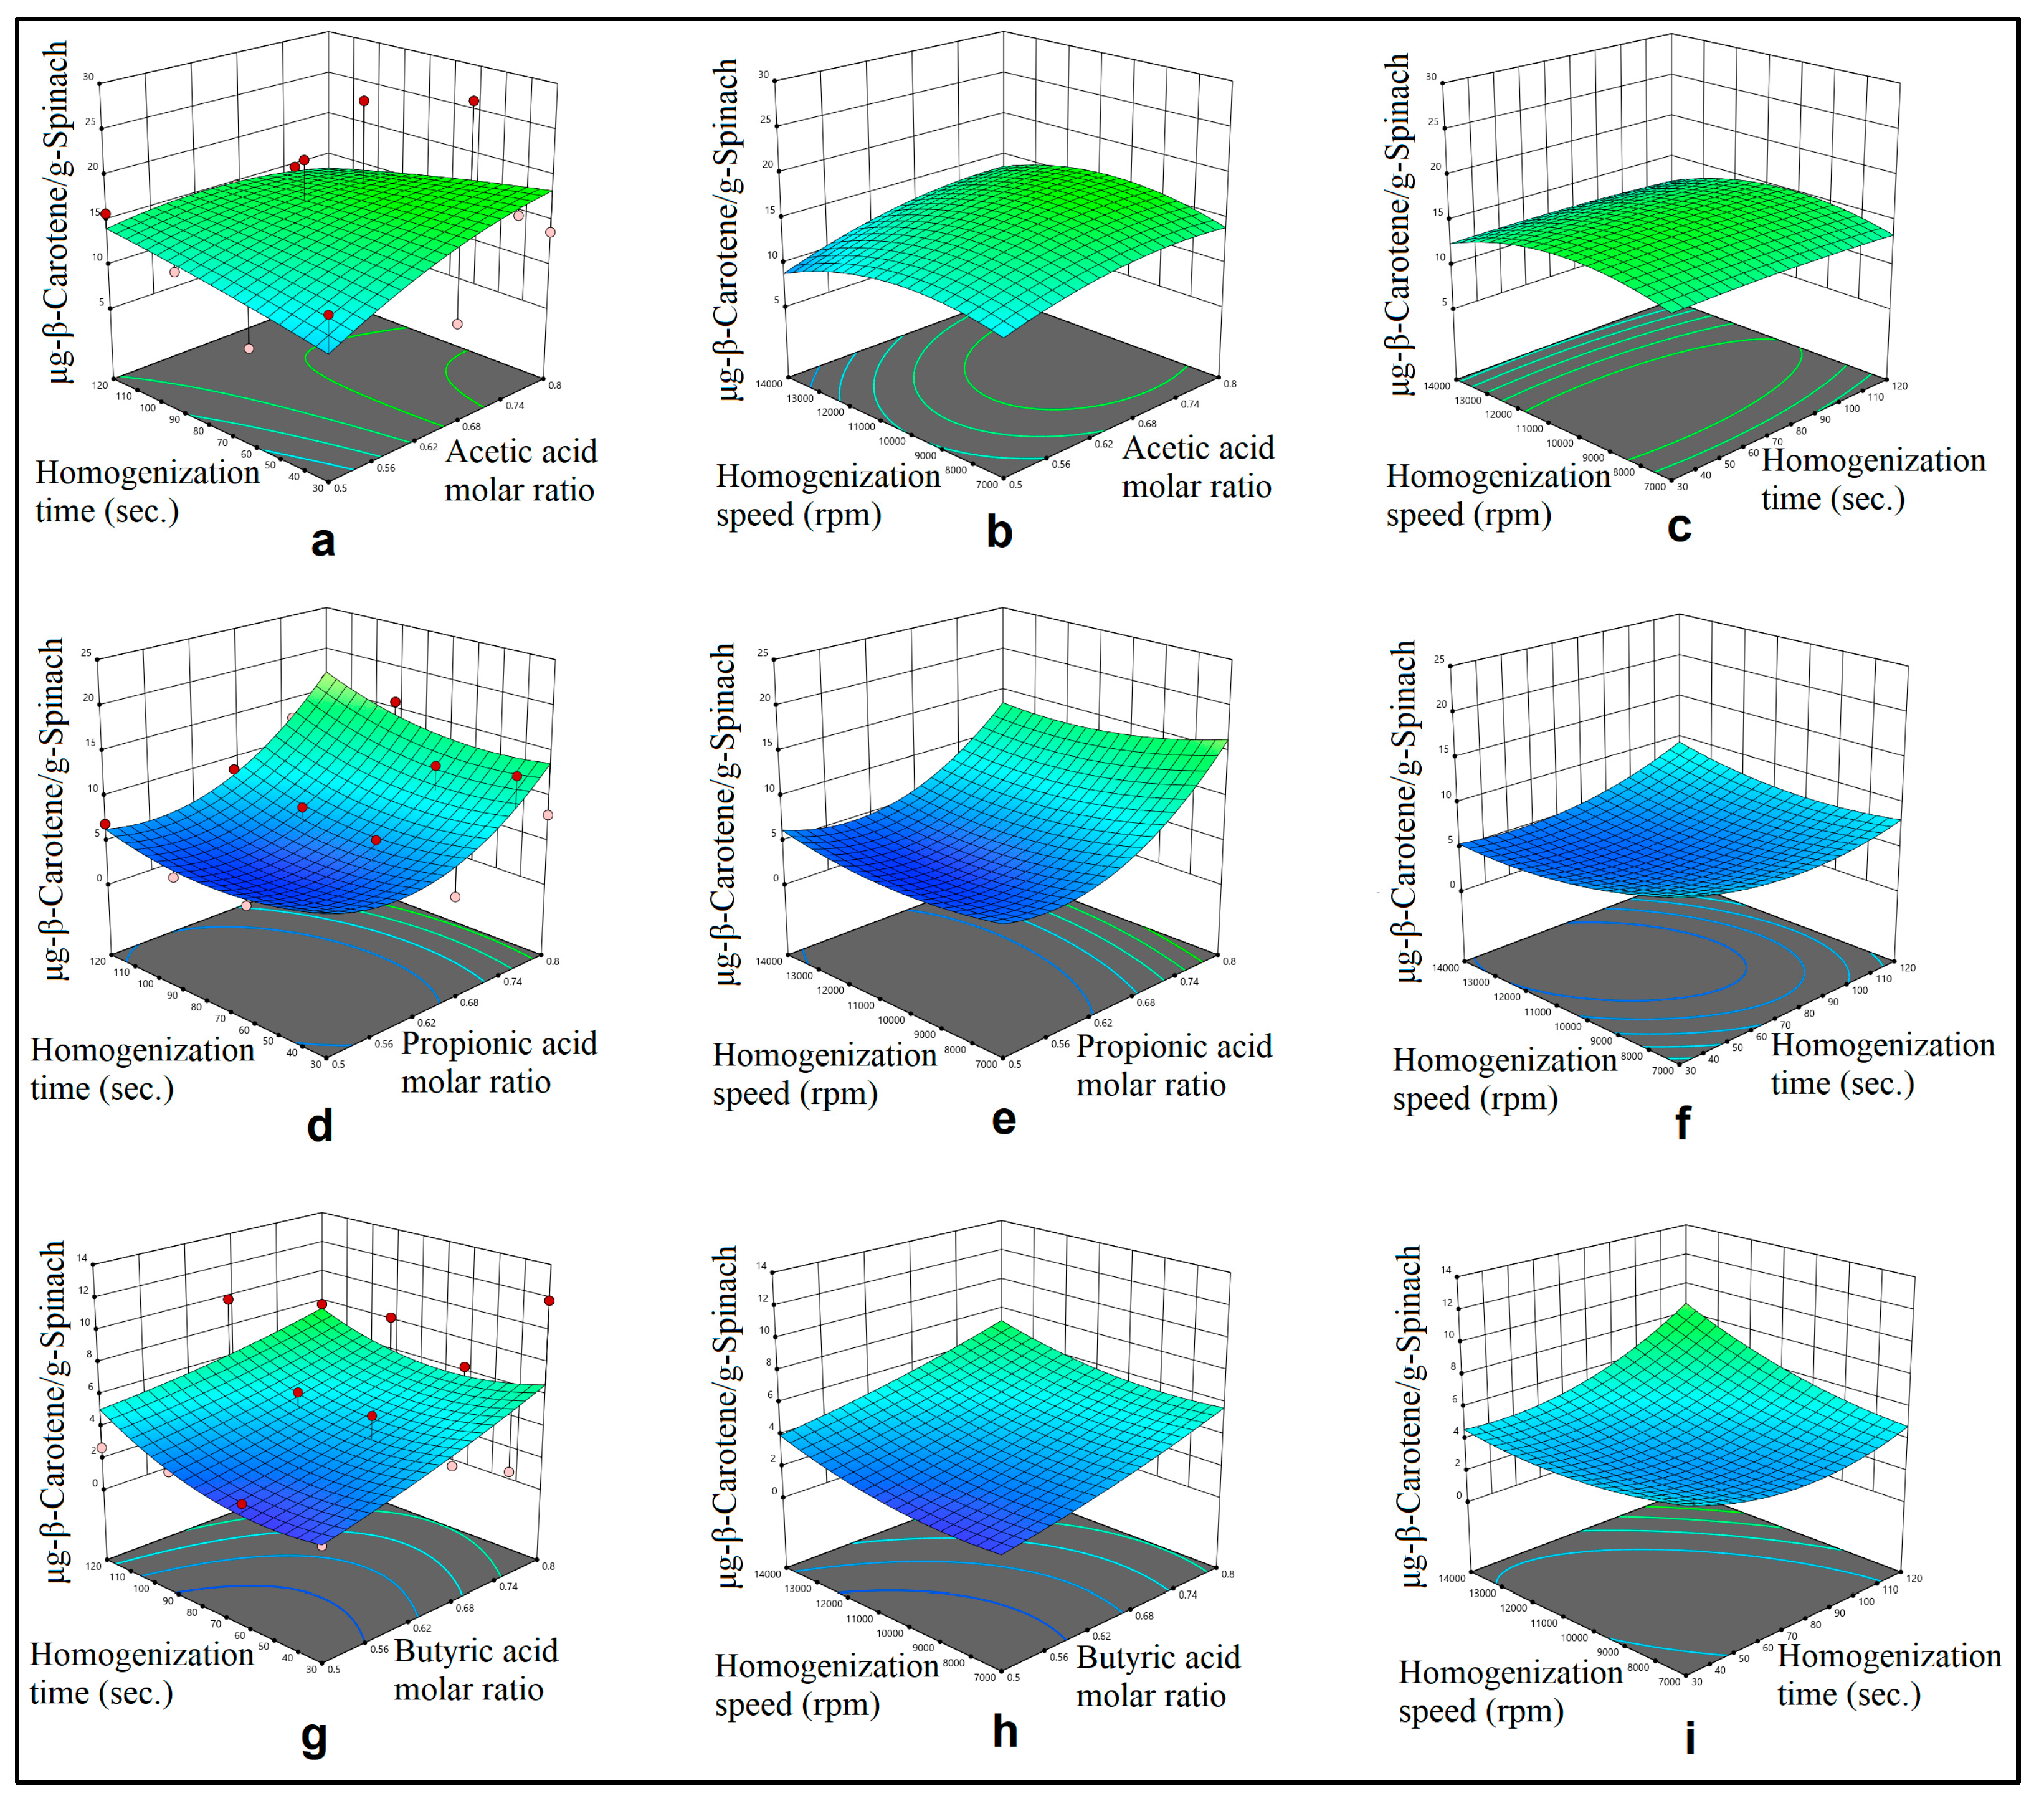
3.1. Mechanical Mixing Assisted Extraction (MMAE) and Homogenization Assisted Extraction (HAE) of ß-Carotene

UV absorbance values were measured in accordance with section 2.6 for each of the samples prepared in accordance with section 2.4 and 2.5. The respective calibration lines (equations in Table S2) were used to calculate the extracted total carotenoid content (TCC) represented by means of ß-carotene for each sample. The calculated experimental TCC results are collected in Table 2 for MMAE method and Table 3 for HAE method by means of “μg-β-Carotene/g-Pumpkin” and “μg-β-Carotene/g-Spinach”. It should be noted that, pumpkin samples were not used for utilization of M1BTA1, M1BTA2, M1BTA3 and M1BTA4 DESs with MMAE and HAE methods.
Table 2. The experimental results of ß-Carotene extraction from pumpkin and spinach samples by using DESs with mechanical mixing assisted extraction.
DES1 Mixing Time (min.) μg-β-Carotene
/g-Pumpkin
(mean value ± S.D.)2,3
μg-β-Carotene
/g-Spinach
(mean value ± S.D.)2,3
M1ACA1 15 0.196 c,A ± 0.043 0.714 a,A ± 0.025
M1ACA1 30 0.254 c,A ± 0.011 5.093 a,A ± 0.032
M1ACA1 45 0.229 c,A ± 0.012 1.083 a,A ± 0.016
M1ACA1 60 0.290 c,A ± 0.026 1.959 a,A ± 0.031
M1ACA2 15 0.637 a,A ± 0.011 13.867 a,A ± 0.069
M1ACA2 30 0.603 a,A ± 0.009 23.238 a,A ± 0.075
M1ACA2 45 0.566 a,A ± 0.006 9.348 a,A ± 0.108
M1ACA2 60 0.610 a,A ± 0.004 6.186 a,A ± 0.026
M1ACA3 15 0.639 a,A ± 0.020 4.447 a,A ± 0.029
M1ACA3 30 0.558 a,A ± 0.012 10.994 a,A ± 0.029
M1ACA3 45 0.572 a,A ± 0.010 6.863 a,A ± 0.040
M1ACA3 60 0.561 a,A ± 0.003 5.058 a,A ± 0.028
M1ACA4 15 0.442 b,A ± 0.008 2.202 a,A ± 0.039
M1ACA4 30 0.483 b,A ± 0.010 12.089 a,A ± 0.035
M1ACA4 45 0.510 b,A ± 0.007 7.820 a,A ± 0.069
M1ACA4 60 0.486 b,A ± 0.009 20.168 a,A ± 0.044
M1PRA1 15 7.873 c,A ± 0.023 0.866 b,A ± 0.019
M1PRA1 30 6.452 c,A ± 0.040 1.803 b,A ± 0.009
M1PRA1 45 3.960 c,A ± 0.019 1.869 b,A ± 0.009
M1PRA1 60 2.631 c,A ± 0.014 1.476 b,A ± 0.005
M1PRA2 15 10.816 a,A ± 0.044 3.567 b,A ± 0.020
M1PRA2 30 10.585 a,A ± 0.045 4.508 b,A ± 0.026
M1PRA2 45 11.542 a,A ± 0.034 5.044 b,A ± 0.027
M1PRA2 60 11.566 a,A ± 0.044 8.986 b,A ± 0.033
1 M: L-menthol, ACA: Acetic Acid, PRA: Propionic acid; 2 data are given as means (3 replicates) ± standard deviation; 3 Different lowercase letters indicate significant differences (one-way ANOVA, Tukey’s HSD, p < 0.05) among the calculated μg-ß-Carotene/g-sample and HBD molar ratio. Different capitalcase letters indicate significant differences (one-way ANOVA, Tukey’s HSD, p < 0.05) among the calculated μg-ß-Carotene/g-sample and mixing time.
Table 2. Continued.
Table 2. Continued.
DES 1 Mixing Time (min.) μg-β-Carotene
/g-Pumpkin
(mean value ± S.D.) 2,3,4
μg-β-Carotene
/g-Spinach
(mean value ± S.D.) 2,3
M1PRA3 15 8.796 a,b,A ± 0.051 3.256 b,A ± 0.011
M1PRA3 30 8.234 a,b,A ± 0.042 5.889 b,A ± 0.019
M1PRA3 45 9.264 a,b,A ± 0.023 6.944 b,A ± 0.017
M1PRA3 60 8.939 a,b,A ± 0.072 5.915 b,A ± 0.023
M1PRA4 15 7.917 b,c,A ± 0.041 9.312 a,A ± 0.049
M1PRA4 30 8.063 b,c,A ± 0.031 19.156 a,A ± 0.122
M1PRA4 45 7.757 b,c,A ± 0.047 17.580 a,A ± 0.043
M1PRA4 60 7.465 b,c,A ± 0.043 18.990 a,A ± 0.057
M1BTA1 15 1.552 a,C ± 0.045
M1BTA1 30 1.944 a,B,C ± 0.039
M1BTA1 45 2.774 a,A,B ± 0.031
M1BTA1 60 3.925 a,A ± 0.024
M1BTA2 15 2.193 a,C ± 0.040
M1BTA2 30 1.718 a,B,C ± 0.044
M1BTA2 45 4.321 a,A,B ± 0.036
M1BTA2 60 4.142 a,A ± 0.029
M1BTA3 15 1.593 a,C ± 0.032
M1BTA3 30 2.280 a,B,C ± 0.026
M1BTA3 45 2.720 a,A,B ± 0.021
M1BTA3 60 7.036 a,A ± 0.032
M1BTA4 15 1.319 a,C ± 0.024
M1BTA4 30 2.226 a,B,C ± 0.028
M1BTA4 45 5.109 a,A,B ± 0.029
M1BTA4 60 4.468 a,A ± 0.017
1 M: L-menthol, PRA: Propionic acid, BTA: Butyric acid; 2 data are given as means (3 replicates) ± standard deviation; 3 Different lowercase letters indicate significant differences (one-way ANOVA, Tukey’s HSD, p < 0.05) among the calculated μg-ß-Carotene/g-sample and HBD molar ratio. Different capitalcase letters indicate significant differences (one-way ANOVA, Tukey’s HSD, p < 0.05) among the calculated μg-ß-Carotene/g-sample and mixing time.; 4 Pumpkin samples were not used for utilization of M1BTA1, M1BTA2, M1BTA3 and M1BTA4 DESs with MMAE method.
Table 3. The experimental results of ß-Carotene extraction from pumpkin and spinach samples by using DESs with homogenization assistance.
DES 1 Hmj. 1 Time (sec.) Hmj. 1 Speed (rpm) μg-β-Carotene
/g-Pumpkin
(mean value ± S.D.)2,3
μg-β-Carotene
/g-Spinach
(mean value ± S.D.)2,3
M1ACA1 30 7000 0.287 c,A,A ± 0.002 8.830 a,A,A ± 0.027
M1ACA1 60 7000 0.295 c,A,A ± 0.002 13.459 a,A,A ± 0.084
M1ACA1 90 7000 0.241 c,A,A ± 0.005 12.948 a,A,A ± 0.056
M1ACA1 120 7000 0.291 c,A,A ± 0.003 11.703 a,A,A ± 0.012
M1ACA1 30 10500 0.359 c,A,A ± 0.003 14.116 a,A,A ± 0.054
M1ACA1 60 10500 0.390 c,A,A ± 0.002 7.225 a,A,A ± 0.021
M1ACA1 90 10500 0.471 c,A,A ± 0.005 12.260 a,A,A ± 0.047
M1ACA1 120 10500 0.467 c,A,A ± 0.004 15.822 a,A,A ± 0.044
M1ACA1 30 14000 0.464 c,A,A ± 0.002 7.731 a,A,A ± 0.078
M1ACA1 60 14000 0.449 c,A,A ± 0.002 7.511 a,A,A ± 0.070
M1ACA1 90 14000 0.441 c,A,A ± 0.003 7.239 a,A,A ± 0.020
M1ACA1 120 14000 0.506 c,A,A ± 0.002 9.139 a,A,A ± 0.106
M1ACA2 30 7000 0.553 a,A,A ± 0.039 19.093 a,A,A ± 0.074
M1ACA2 60 7000 0.666 a,A,A ± 0.019 13.158 a,A,A ± 0.067
M1ACA2 90 7000 0.637 a,A,A ± 0.028 9.728 a,A,A ± 0.056
M1ACA2 120 7000 0.811 a,A,A ± 0.032 12.469 a,A,A ± 0.056
M1ACA2 30 10500 0.762 a,A,A ± 0.044 7.622 a,A,A ± 0.014
M1ACA2 60 10500 0.652 a,A,A ± 0.041 15.598 a,A,A ± 0.053
M1ACA2 90 10500 0.707 a,A,A ± 0.008 20.129 a,A,A ± 0.041
M1ACA2 120 10500 0.711 a,A,A ± 0.002 14.714 a,A,A ± 0.029
M1ACA2 30 14000 0.562 a,A,A ± 0.038 18.474 a,A,A ± 0.017
M1ACA2 60 14000 0.632 a,A,A ± 0.020 9.334 a,A,A ± 0.016
M1ACA2 90 14000 0.771 a,A,A ± 0.006 11.925 a,A,A ± 0.081
M1ACA2 120 14000 0.670 a,A,A ± 0.006 17.460 a,A,A ± 0.107
M1ACA3 30 7000 0.434 a,b,A,A ± 0.003 6.767 a,A,A ± 0.027
M1ACA3 60 7000 0.639 a,b,A,A ± 0.005 8.553 a,A,A ± 0.031
M1ACA3 90 7000 0.651 a,b,A,A ± 0.054 16.257 a,A,A ± 0.048
M1ACA3 120 7000 0.640 a,b,A,A ± 0.000 15.457 a,A,A ± 0.098
M1ACA3 30 10500 0.571 a,b,A,A ± 0.002 16.982 a,A,A ± 0.024
M1ACA3 60 10500 0.563 a,b,A,A ± 0.010 15.152 a,A,A ± 0.015
1 M: L-menthol, ACA: Acetic Acid, Hmj: homogenization; 2 data are given as means (3 replicates) ± standard deviation; 3 Different lowercase letters indicate significant differences (one-way ANOVA, Tukey’s HSD, p < 0.05) among the calculated μg-ß-Carotene/g-sample and HBD molar ratio. Different capitalcase letters indicate significant differences (one-way ANOVA, Tukey’s HSD, p < 0.05) among the calculated μg-ß-Carotene/g-sample and homogenization time. Different underlined italic capitalcase letters indicate significant differences (one-way ANOVA, Tukey’s HSD, p < 0.05) among the calculated μg-ß-Carotene/g-sample and homogenization speed.
Table 3. Continued.
Table 3. Continued.
DES 1 Hmj. 1 Time (sec.) Hmj. 1 Speed (rpm) μg-β-Carotene
/g-Pumpkin
(mean value ± S.D.)2,3
μg-β-Carotene
/g-Spinach
(mean value ± S.D.)2,3
M1ACA3 90 10500 0.645 a,b,A,A ± 0.003 24.930 a,A,A ± 0.057
M1ACA3 120 10500 0.588 a,b,A,A ± 0.002 14.775 a,A,A ± 0.042
M1ACA3 30 14000 0.606 a,b,A,A ± 0.018 13.767 a,A,A ± 0.053
M1ACA3 60 14000 0.611 a,b,A,A ± 0.002 11.293 a,A,A ± 0.028
M1ACA3 90 14000 0.689 a,b,A,A ± 0.000 15.814 a,A,A ± 0.039
M1ACA3 120 14000 0.644 a,b,A,A ± 0.000 13.564 a,A,A ± 0.027
M1ACA4 30 7000 0.449 b,A,A ± 0.012 22.831 a,A,A ± 0.056
M1ACA4 60 7000 0.548 b,A,A ± 0.020 20.749 a,A,A ± 0.062
M1ACA4 90 7000 0.629 b,A,A ± 0.029 12.540 a,A,A ± 0.014
M1ACA4 120 7000 0.579 b,A,A ± 0.005 7.834 a,A,A ± 0.041
M1ACA4 30 10500 0.545 b,A,A ± 0.004 13.751 a,A,A ± 0.063
M1ACA4 60 10500 0.534 b,A,A ± 0.008 26.006 a,A,A ± 0.092
M1ACA4 90 10500 0.572 b,A,A ± 0.005 11.626 a,A,A ± 0.014
M1ACA4 120 10500 0.554 b,A,A ± 0.011 9.568 a,A,A ± 0.038
M1ACA4 30 14000 0.581 b,A,A ± 0.003 18.883 a,A,A ± 0.055
M1ACA4 60 14000 0.525 b,A,A ± 0.017 14.477 a,A,A ± 0.080
M1ACA4 90 14000 0.581 b,A,A ± 0.050 7.578 a,A,A ± 0.053
M1ACA4 120 14000 0.543 b,A,A ± 0.006 7.993 a,A,A ± 0.069
M1PRA1 30 7000 7.675 a,A,A ± 0.030 6.081 b,A,A ± 0.039
M1PRA1 60 7000 5.030 a,A,A ± 0.023 7.450 b,A,A ± 0.020
M1PRA1 90 7000 3.769 a,b,B,A ± 0.013 5.234 b,A,A ± 0.014
M1PRA1 120 7000 4.698 a,b,B,A ± 0.023 8.447 b,A,A ± 0.034
M1PRA1 30 10500 6.896 a,b,A,A ± 0.013 11.252 b,A,A ± 0.027
M1PRA1 60 10500 6.088 a,b,A,B,A ± 0.021 4.241 b,A,A ± 0.019
M1PRA1 90 10500 4.712 a,b,B,A ± 0.019 4.010 b,A,A ± 0.019
M1PRA1 120 10500 3.456 a,b,B,A ± 0.014 6.955 b,A,A ± 0.013
M1PRA1 30 14000 6.120 a,b,A,A ± 0.024 8.539 b,A,A ± 0.020
M1PRA1 60 14000 7.147 a,b,A,B,A ± 0.013 3.704 b,A,A ± 0.020
M1PRA1 90 14000 6.487 a,b,B,A ± 0.023 6.080 b,A,A ± 0.012
M1PRA1 120 14000 5.340 a,b,B,A ± 0.020 8.139 b,A,A ± 0.028
M1PRA2 30 7000 8.762 a,A,A ± 0.029 4.731 b,A,A ± 0.082
M1PRA2 60 7000 6.586 a,A,B,A ± 0.037 5.323 b,A,A ± 0.013
1 M: L-menthol, ACA: Acetic Acid, PRA: Propionic Acid, Hmj: homogenization; 2 data are given as means (3 replicates) ± standard deviation; 3 Different lowercase letters indicate significant differences (one-way ANOVA, Tukey’s HSD, p < 0.05) among the calculated μg-ß-Carotene/g-sample and HBD molar ratio. Different capitalcase letters indicate significant differences (one-way ANOVA, Tukey’s HSD, p < 0.05) among the calculated μg-ß-Carotene/g-sample and homogenization time. Different underlined italic capitalcase letters indicate significant differences (one-way ANOVA, Tukey’s HSD, p < 0.05) among the calculated μg-ß-Carotene/g-sample and homogenization speed.
Table 3. Continued.
Table 3. Continued.
DES 1 Hmj. 1 Time (sec.) Hmj. 1 Speed (rpm) μg-β-Carotene
/g-Pumpkin
(mean value ± S.D.)2,3
μg-β-Carotene
/g-Spinach
(mean value ± S.D.)2,3
M1PRA2 90 7000 8.579 a,B,A ± 0.043 6.669 b,A,A ± 0.021
M1PRA2 120 7000 6.472 a,B,A ± 0.039 11.232 b,A,A ± 0.013
M1PRA2 30 10500 7.316 a,A,A ± 0.045 2.958 b,A,A ± 0.033
M1PRA2 60 10500 6.561 a,A,B,A ± 0.038 6.132 b,A,A ± 0.011
M1PRA2 90 10500 6.411 a,B,A ± 0.043 6.950 b,A,A ± 0.058
M1PRA2 120 10500 5.201 a,B,A ± 0.032 8.706 b,A,A ± 0.013
M1PRA2 30 14000 6.935 a,A,A ± 0.040 8.774 b,A,A ± 0.032
M1PRA2 60 14000 5.880 a,A,B,A ± 0.031 10.494 b,A,A ± 0.053
M1PRA2 90 14000 4.935 a,B,A ± 0.039 4.587 b,A,A ± 0.048
M1PRA2 120 14000 6.839 a,B,A ± 0.017 7.195 b,A,A ± 0.035
M1PRA3 30 7000 8.596 b,A,A ± 0.021 14.763 a,A,A ± 0.034
M1PRA3 60 7000 5.541 b,A,B,A ± 0.045 10.024 a,A,A ± 0.044
M1PRA3 90 7000 3.802 b,B,A ± 0.043 17.005 a,A,A ± 0.031
M1PRA3 120 7000 4.888 b,B,A ± 0.039 14.631 a,A,A ± 0.048
M1PRA3 30 10500 6.981 b,A,A ± 0.041 13.676 a,A,A ± 0.052
M1PRA3 60 10500 5.321 b,A,B,A ± 0.039 12.177 a,A,A ± 0.034
M1PRA3 90 10500 1.803 b,B,A ± 0.033 9.143 a,A,A ± 0.035
M1PRA3 120 10500 3.367 b,B,A ± 0.039 12.853 a,A,A ± 0.035
M1PRA3 30 14000 5.253 b,A,A ± 0.041 10.178 a,A,A ± 0.065
M1PRA3 60 14000 2.010 b,A,B,A ± 0.032 5.838 a,A,A ± 0.052
M1PRA3 90 14000 0.631 b,B,A ± 0.038 11.197 a,A,A ± 0.045
M1PRA3 120 14000 3.596 b,B,A ± 0.043 13.982 a,A,A ± 0.049
M1PRA4 30 7000 8.898 b,A,A ± 0.031 24.598 a,A,A ± 0.126
M1PRA4 60 7000 6.158 b,A,B,A ± 0.027 19.838 a,A,A ± 0.113
M1PRA4 90 7000 7.714 b,B,A ± 0.031 15.597 a,A,A ± 0.069
M1PRA4 120 7000 1.773 b,B,A ± 0.045 12.177 a,A,A ± 0.118
M1PRA4 30 10500 5.064 b,A,A ± 0.028 7.972 a,A,A ± 0.091
M1PRA4 60 10500 4.638 b,A,B,A ± 0.037 10.282 a,A,A ± 0.065
M1PRA4 90 10500 3.145 b,B,A ± 0.030 15.900 a,A,A ± 0.056
M1PRA4 120 10500 2.184 b,B,A ± 0.025 16.399 a,A,A ± 0.057
M1PRA4 30 14000 5.653 b,A,A ± 0.026 8.387 a,A,A ± 0.078
1 M: L-menthol, ACA: Acetic Acid, PRA: Propionic Acid, Hmj: homogenization; 2 data are given as means (3 replicates) ± standard deviation; 3 Different lowercase letters indicate significant differences (one-way ANOVA, Tukey’s HSD, p < 0.05) among the calculated μg-ß-Carotene/g-sample and HBD molar ratio. Different capitalcase letters indicate significant differences (one-way ANOVA, Tukey’s HSD, p < 0.05) among the calculated μg-ß-Carotene/g-sample and homogenization time. Different underlined italic capitalcase letters indicate significant differences (one-way ANOVA, Tukey’s HSD, p < 0.05) among the calculated μg-ß-Carotene/g-sample and homogenization speed.
Table 3. Continued.
Table 3. Continued.
DES 1 Hmj. 1 Time (sec.) Hmj. 1 Speed (rpm) μg-β-Carotene
/g-Pumpkin
(mean value ± S.D.)2,3,4
μg-β-Carotene
/g-Spinach
(mean value ± S.D.)2,3
M1PRA4 60 14000 3.880 b,A,B,A ± 0.034 14.157 a,A,A ± 0.115
M1PRA4 90 14000 2.029 b,B,A ± 0.040 13.669 a,A,A ± 0.100
M1PRA4 120 14000 1.318 b,B,A ± 0.025 24.910 a,A,A ± 0.071
M1BTA1 30 7000 2.563 c,A,A ± 0.033
M1BTA1 60 7000 3.240 c,A,A ± 0.032
M1BTA1 90 7000 3.129 c,A,A ± 0.033
M1BTA1 120 7000 4.082 c,A,A ± 0.035
M1BTA1 30 10500 2.244 c,A,A ± 0.023
M1BTA1 60 10500 2.768 c,A,A ± 0.032
M1BTA1 90 10500 2.889 c,A,A ± 0.039
M1BTA1 120 10500 2.701 c,A,A ± 0.021
M1BTA1 30 14000 2.979 c,A,A ± 0.022
M1BTA1 60 14000 4.285 c,A,A ± 0.029
M1BTA1 90 14000 3.862 c,A,A ± 0.050
M1BTA1 120 14000 6.460 c,A,A ± 0.038
M1BTA2 30 7000 4.171 a,b,A,A ± 0.046
M1BTA2 60 7000 4.609 a,b,A,A ± 0.038
M1BTA2 90 7000 4.188 a,b,A,A ± 0.027
M1BTA2 120 7000 6.461 a,b,A,A ± 0.026
M1BTA2 30 10500 3.844 a,b,A,A ± 0.042
M1BTA2 60 10500 5.263 a,b,A,A ± 0.042
M1BTA2 90 10500 5.191 a,b,A,A ± 0.031
M1BTA2 120 10500 9.820 a,b,A,A ± 0.077
M1BTA2 30 14000 5.457 a,b,A,A ± 0.045
M1BTA2 60 14000 7.097 a,b,A,A ± 0.050
M1BTA2 90 14000 6.782 a,b,A,A ± 0.034
M1BTA2 120 14000 13.221 a,b,A,A ± 0.044
M1BTA3 30 7000 5.708 b,c,A,A ± 0.045
M1BTA3 60 7000 4.283 b,c,A,A ± 0.020
M1BTA3 90 7000 3.736 b,c,A,A ± 0.032
M1BTA3 120 7000 3.884 b,c,A,A ± 0.020
1 M: L-menthol, PRA: Propionic Acid, BTA: Butyric Acid, Hmj: homogenization; 2 data are given as means (3 replicates) ± standard deviation; 3 Different lowercase letters indicate significant differences (one-way ANOVA, Tukey’s HSD, p < 0.05) among the calculated μg-ß-Carotene/g-sample and HBD molar ratio. Different capitalcase letters indicate significant differences (one-way ANOVA, Tukey’s HSD, p < 0.05) among the calculated μg-ß-Carotene/g-sample and homogenization time. Different underlined italic capitalcase letters indicate significant differences (one-way ANOVA, Tukey’s HSD, p < 0.05) among the calculated μg-ß-Carotene/g-sample and homogenization speed.; 4 Pumpkin samples were not used for utilization of M1BTA1, M1BTA2, M1BTA3 and M1BTA4 DESs with HAE method.
Table 3. Continued.
Table 3. Continued.
DES 1 Hmj. 1 Time (sec.) Hmj. 1 Speed (rpm) μg-β-Carotene
/g-Pumpkin
(mean value ± S.D.)2,3,4
μg-β-Carotene
/g-Spinach
(mean value ± S.D.)2,3
M1BTA3 30 10500 2.020 b,c,A,A ± 0.038
M1BTA3 60 10500 2.917 b,c,A,A ± 0.021
M1BTA3 90 10500 3.239 b,c,A,A ± 0.030
M1BTA3 120 10500 3.332 b,c,A,A ± 0.027
M1BTA3 30 14000 5.543 b,c,A,A ± 0.037
M1BTA3 60 14000 4.595 b,c,A,A ± 0.029
M1BTA3 90 14000 2.968 b,c,A,A ± 0.033
M1BTA3 120 14000 8.684 b,c,A,A ± 0.027
M1BTA4 30 7000 8.584 a,A,A ± 0.028
M1BTA4 60 7000 6.231 a,A,A ± 0.037
M1BTA4 90 7000 9.738 a,A,A ± 0.049
M1BTA4 120 7000 4.637 a,A,A ± 0.037
M1BTA4 30 10500 11.840 a,A,A ± 0.043
M1BTA4 60 10500 6.343 a,A,A ± 0.024
M1BTA4 90 10500 8.197 a,A,A ± 0.039
M1BTA4 120 10500 7.814 a,A,A ± 0.046
M1BTA4 30 14000 8.211 a,A,A ± 0.025
M1BTA4 60 14000 5.023 a,A,A ± 0.033
M1BTA4 90 14000 7.401 a,A,A ± 0.046
M1BTA4 120 14000 12.534 a,A,A ± 0.023
1 M: L-menthol, BTA: Butyric Acid, Hmj: homogenization; 2 data are given as means (3 replicates) ± standard deviation; 3 Different lowercase letters indicate significant differences (one-way ANOVA, Tukey’s HSD, p < 0.05) among the calculated μg-ß-Carotene/g-sample and HBD molar ratio. Different capitalcase letters indicate significant differences (one-way ANOVA, Tukey’s HSD, p < 0.05) among the calculated μg-ß-Carotene/g-sample and homogenization time. Different underlined italic capitalcase letters indicate significant differences (one-way ANOVA, Tukey’s HSD, p < 0.05) among the calculated μg-ß-Carotene/g-sample and homogenization speed.; 4 Pumpkin samples were not used for utilization of M1BTA1, M1BTA2, M1BTA3 and M1BTA4 DESs with HAE method.

3.2. Modelling

Based on the data obtained, the second-order models for the MMAE and HAE of TCC (by means of ß-Carotene) have been derived and shown in Table 4. Considering the fact that; the R2 values of these equations derived by the relevant design method are generally ≥0.7000 shows that the equations calculated for responses are satisfactory to provide explanation to the relationship between dependent and independent variables [32].
Table 4. Model equations and their compatibility indicators derived from CCD through RSM in MMAE and HAE of Carotenoids (by means of ß-Carotene) from pumpkin and spinach.
Extraction setup Independent Variables Model Equation R2
Sample: Pumkin
Method: MMAE &
L-Menthol:Acetic acid DESs
X1:Acetic acid molar ratio
X2:Mixing time (min.)
-4.45150+14.57986X1+0.001912X2-0.005262X1X2
-10.44080X12+0.000024X22
0.9642
Sample: Pumkin
Method: MMAE &
L-Menthol:Propionic acid DESs
X1:Propionic acid molar ratio
X2:Mixing time (min.)
-63.76949+241.35123X1-0.301289X2+0.401802X1X2
-191.69872X12+0.000041X22
0.9006
Sample: Spinach
Method: MMAE &
L-Menthol:Acetic acid DESs
X1:Acetic acid molar ratio
X2:Mixing time (min.)
-87.29436+291.71772X1-0.080113X2+0.815406X1X2
-232.20477X12-0.006091X22
0.3941
Sample: Spinach
Method: MMAE &
L-Menthol:Propionic acid DESs
X1:Propionic acid molar ratio
X2:Mixing time (min.)
81.41602-286.71718X1+0.011693X2
+0.437977X1X2+239.97280 X12-0.002896X22
0.7835
Sample: Spinach
Method: MMAE &
L-Menthol:Butyric acid DESs
X1:Butyric acid molar ratio
X2:Mixing time (min.)
0.019209+7.15429X1-0.089691X2+0.147515X1X2
-7.71617X12+0.000871X22
0.7688
Sample: Pumkin
Method: HAE &
L-Menthol:Acetic acid DESs
X1:Acetic acid molar ratio
X2:Homogenization time (sec.)
X3:Homogenization speed (rpm)
-4.30138+12.54252X1+0.003089X2+0.000103X3
+0.000543X1X2-0.000081X1X3-1.29643*10-7X2X3
-8.63510X12-8.37963*10-6X22-1.42092*10-9X32
0.8418
Sample: Pumkin
Method: HAE &
L-Menthol:Propionic acid DESs
X1:Propionic acid molar ratio
X2:Homogenization time (sec.)
X3:Homogenization speed (rpm)
-24.31624+109.68892X1-0.063963X2+0.000120X3
-0.068021X1X2-0.001957X1X3+2.65619*10-6X2X3
-69.07260X12+0.000334X22+3.75153*10-8X32
0.7052
Sample: Spinach
Method: HAE &
L-Menthol:Acetic acid DESs
X1:Acetic acid molar ratio
X2:Homogenization time (sec.)
X3:Homogenization speed (rpm)
-46.56104+104.57014X1+0.229675X2+0.003205X3
-0.333622X1X2+0.000977X1X3+2.93333*10-7X2X3
-59.45170X12-0.000142X22-1.93862*10-7X32
0.2725
Sample: Spinach
Method: HAE &
L-Menthol:Propionic acid DESs
X1:Propionic acid molar ratio
X2:Homogenization time (sec.)
X3:Homogenization speed (rpm)
88.81933-218.95677X1-0.304985X2-0.002093X3
+0.146208X1X2-0.001599X1X3+7.80619*10-6X2X3
+195.82812X12+0.000968X22+1.13311*10-7X32
0.6540
Sample: Spinach
Method: HAE &
L-Menthol:Butyric acid DESs
X1:Butyric acid molar ratio
X2:Homogenization time (sec.)
X3:Homogenization speed (rpm)
9.20900+1.75614X1-0.106600X2-0.001464X3
-0.073053X1X2-0.000142X1X3+7.09500*10-6X2X3
+12.70142X12+0.000667X22+5.99541*10-8X32
0.4718
The response surfaces formed by the equations provided in Table 4 are shown in the three-dimensional (3D) graphs through Figure 1, Figure 2 and Figure 3. Within these figures, effects of parameters and their corresponding interactions on the TCC (μg-ß-Carotene/g-sample studied) are also displayed visually.
In Figure 1; the effects of the two process parameters on the TCC (μg-ß-Carotene/g-sample) have been visualized. Each graphic in Figure-1 shows the quadratic relationship between TCC, HBD molar ratio in the DESs and mixing time as 3D surfaces which were obtained from the calculated models in Table 4. In Figure 2; the effects of the three process parameters on the TCC (μg-ß-Carotene/g-pumpkin) have been visualized where data were obtained via application of HAE method from pumpkin samples. Each graphic in For HAE method application on pumpkin samples; Figure-2 shows the three quadratic relationship for each DES system as 3D surfaces (which were obtained from the calculated models in Table 4) between the response and each of two process parameters selected among HBD molar ratio in the DESs, homogenization time and homogenization speed. For HAE method application on spinach samples; Figure 3 shows the three quadratic relationship for each DES system as 3D surfaces (which were obtained from the calculated models in Table 4) between the response and each of two process parameters selected among HBD molar ratio in the DESs, homogenization time and homogenization speed.
To determine the effects of each parameter, a suitable mathematical model, which fits the polynomial equation (2), was selected and statistical ANOVA was applied, where Y is response value (dependent variable), ß0 is constant, ßi, ßii, ßij are regression coefficients, xi and xj are independent variables (i and j represents numbers from 1 to n), ε is error term.
Y = β 0 + i = 1 k β i x i + i = 1 k β i i x i 2 + i = 1 k 1 j = i + 1 k β i j x i x j + ε
The ANOVA analyses results of the model equations derived for μg-ß-Carotene/g-pumpkin results of MMAE and HAE of ß-Carotene from pumpkin samples by using DESs are given in Table S3, Table S4, Table S8 and Table S9. The ANOVA analyses results of the model equations derived for μg-ß-Carotene/g-spinach results of MMAE and HAE of ß-Carotene from spinach samples by using DESs are given in Table S5, Table S6, Table S7, Table S10, Table S11 and Table S12. The high F values and P values <0.05 indicate that the model equations are suitable and statistically significant for the current experimental data sets.

4. Discussion

4.1. Evaluation of ANOVA Analyses Results

While determining the DES to be synthesized, the interaction of the HBA and HBD, the solubility of the ß-Carotene (representing Carotenoids) in the DESs and selecting HBA and HBD within natural compounds were taken into consideration. Being a non-polar and natural compound, L-Menthol, was selected as the HBA within the scope of this study due to its ability to form DESs that have high capacity to donate and accept protons when compared to common solvents [32]. Acetic acid, propionic acid and butyric acid were selected as the HBD within the scope of this study due to having carboxylic acids which possess alkyl chains and being naturally found in food and plants.
The F value in ANOVA is a key statistic that compares the variability between group means to the variability within groups. It is calculated as the ratio of the mean square between (MSB) to the mean square within (MSW). A high F value indicates that the between-group variance is significantly greater than the within-group variance, suggesting that there are meaningful differences between group means, while a low F-value implies that the observed differences are likely due to random chance. The F value is used to test the null hypothesis that all group means are equal, with a large F value (and corresponding low P value) providing evidence to reject the null hypothesis, while a small F value suggests that the differences are not statistically significant. This makes the F value crucial for determining whether the factors being tested have a significant effect on the response variable. The P value in statistics is a measure used to assess the strength of evidence against the null hypothesis in hypothesis testing. It represents the probability of obtaining test results at least as extreme as the results actually observed, assuming that the null hypothesis is true. A small P value (typically ≤ 0.05) indicates strong evidence against the null hypothesis, leading to its rejection, suggesting that the observed effect is statistically significant. Conversely, a large P value (> 0.05) suggests weak evidence against the null hypothesis, meaning that any observed difference or effect could likely be due to random chance, and the null hypothesis is not rejected. The P value is a fundamental component of inferential statistics, helping researchers make decisions about the validity of their hypotheses.
When the L-Menthol:Acetic acid DESs were taken into account in the case MMAE of Carotenoids from pumpkin samples, the most effective parameters (P<0.0001) were observed to be both acetic acid molar ratio and its quadratic power (Table S3). The models were found to be not significant for MMAE and HAE of Carotenoids from spinach samples via utilization L-Menthol:Acetic acid DESs (Table S5 and S10). Even though these models were found to be not significant, the acetic acid molar ratio was the most effective parameter in the HAE of ß-Carotene from spinach (P<0.05). For the HAE of Carotenoids from pumpkin samples via utilization L-Menthol:Acetic acid DESs, again the acetic acid molar ratio and its quadratic power were found to be the most effective parameters (P<0.0001), which were followed by homogenization speed and homogenization time (P<0.05). Additionally, the correlation effect between acetic acid molar ratio and homogenization speed was found to be significant (Table S8).
When the L-Menthol:Propionic acid DESs considered in the MMAE of Carotenoids from pumpkin samples, the most effective parameter was observed to be the second-order power of propionic acid molar ratio (P<0.0001), followed by propionic acid molar ratio and mixing time. Additionally, the interaction effect between propionic acid molar ratio and mixing time was also found to be significant in MMAE of Carotenoids from pumpkin (Table S4). When the L-Menthol:Propionic acid DESs considered in the MMAE of Carotenoids from spinach samples, the most effective parameter was observed to be the propionic acid molar ratio (P<0.05), followed by its quadratic power. No interaction effect between propionic acid molar ratio and mixing time was observed (Table S6). For the HAE of Carotenoids from pumpkin samples via utilization L-Menthol:Propionic acid DESs, the homogenization time was found to be the most effective parameter (P<0.0001), which was followed by propionic acid molar ratio and its second-order power and homogenization speed (P<0.05). Additionally, the interaction effect between propionic acid molar ratio and homogenization speed was found to be significant (Table S9). With regards to the HAE of Carotenoids from spinach samples via utilization L-Menthol:Propionic acid DESs, the most effective parameter was observed to be the propionic acid molar ratio (P<0.0001), followed by its quadratic power (P<0.05). No interaction effect between parameters was observed (Table S11).
The only effective parameter (P<0.05) was observed to be the mixing time, when the L-Menthol:Butyric acid DESs are taken into account in the MMAE of Carotenoids from spinach samples. No interaction effect between parameters was observed (Table S7). For the HAE of Carotenoids from spinach samples via utilization L-Menthol:Butyric acid DESs, the butyric acid molar ratio was found to be the most effective parameter (P<0.05), which was followed by homogenization time and homogenization speed (P<0.05). Additionally, the interaction effect between homogenization time and homogenization speed was found to be significant (Table S12).
HBD molar ratio is the most important parameter that can affect the process in this method. This study has also emphasized the significance of that phenomenon.
The polarizability parameter (π*) provides a measure of solvent’s dipolarity and polarizability [33]. The μg-ß-Carotene/g-pumpkin extracted via L-Menthol:Acetic acid DESs both by MMAE and HAE were considerably low when compared to L-Menthol:Propionic acid DESs. The partition coefficient (logP) measures how hydrophilic or hydrophobic a chemical substance is. The higher the logP value, the more hydrophobic the compound is. If logP>0, the compound is generally considered as non-polar and if logP<0 the compound is generally considered as polar. The logP values of acetic acid and propionic acid are -0.17 and 0.25 respectively [34,35]. This corresponds to the fact that acetic is not only more water-soluble compound than propionic acid but also giving it more affinity to dissolve or be dissolved in polar substances due to having a logP<0 (solubility in water > solubility in oily substances/mixtures). The DESs produced by acetic acid, then, would have more polar structure when compared to DESs produced by propionic acid. Since ß-Carotene is a hydrocarbon and a non-polar compound (logP=14.764 [36]), the extracted amount of ß-Carotene via L-Menthol:Propionic acid DESs was found considerable higher than L-Menthol:Acetic acid DESs.
In 2018, Florindo et.al. had reported in their article that; the polarizability parameter (π*) value is found to be decreasing with the increase of the alkyl chain of the HBD [33]. As a result, the increase of the non-polar part of the HBD decreases the overall polarizability of the DESs [33]. In other words, the amount of ß-Carotene (a non-polar compound) extracted is also expected to decrease with the increase of the alkyl chain of the HBD. Hence; the μg-ß-Carotene/g-spinach extracted via L-Menthol:Propionic acid (1:4) DES was found relatively higher than extracted amount via L-Menthol:Butyric acid (1:4) DES. Even though acetic acid’s alkyl chain is smaller than propionic acid, the μg-ß-Carotene/g-spinach extracted via L-Menthol:Acetic acid (1:2) DES was still observed to be less when compared to L-Menthol:Propionic acid (1:4) DES. This is, as explained above, considered to be due to the hydrophilic nature of acetic acid with logP<0 and hydrophobic nature of the extracted substance, ß-Carotene. The optimum extraction conditions calculated using RSM approach and the highest μg-ß-Carotene/g-spinach values observed under these conditions are presented in Table 6. With the HAE process; the best ß-Carotene value for extraction from spinach was obtained via HAE with L-Menthol:Propionic acid (1:4) DES. This was followed by L-Menthol:Acetic acid (1:4) DES and L-Menthol:Butyric acid (1:4) DES.
The differences in carotenoid extraction from pumpkin and spinach samples underline the importance of both the plant matrix and the choice of DES composition. The yield differences of TCC (by means of μg-ß-carotene/g-sample) from pumpkin and spinach using the DESs can be explained by the inherent differences in the composition and structure of pumpkin and spinach tissues, which may facilitate the difference of efficiency of extraction of carotenoids. Generally, a plant body’s cell walls have hydrophobic character due to lignin and the presence of cutin in some tissues which reduces water loss and makes these tissues more impermeable to water and external substances. This is particularly important in the stem and roots, where the main function is structural support and nutrient uptake. On the contrary, the leaves of a plant are more hydrophilic due to the higher content of cellulose and hemicellulose in the cell walls. This allows for greater interaction with water, supporting the leaf's function in transpiration and photosynthesis. While the leaf also has a waxy cuticle that helps reduce water loss, the overall cell wall composition is still more hydrophilic compared to the plant body.
When the actual results (Table 2 and Table 3) are evaluated; the average of TCC in pumpkin via L-menthol:acetic acid DESs is 0.477 μg-ß-carotene/g-pumpkin via MMAE, where the average of TCC in pumpkin L-menthol:propionic acid DESs is 8.241 μg-ß-carotene/g-pumpkin. A similar trend was observed in the HAE of carotenoids from pumpkin. The corresponding average values are 0.557 and 5.253 μg-ß-carotene/g-pumpkin for L-menthol:acetic acid DESs and L-menthol:propionic DESs, respectively. The effect of the increase in the alkyl chain length of HBD can be observed in the results. However, the drastic difference between the obtained results via two different DES systems can be explained by the more polar and hydrophilic nature of acetic acid (logP<0) and more hydrophobic nature of propionic acid (logP>0) resulting better interaction with the hydrophobic nature of cell walls the pumpkin, a plant body. As supporting evidence; the average values of the obtained TCC from spinach is much higher in L-menthol:acetic acid DESs (8.196 and 13.434 μg-ß-carotene/g-spinach for MMAE and HAE, respectively) when compared to pumpkin due to the hydrophilic nature of HBD (acetic acid) since the overall cell wall composition of the leaves is considered to be more hydrophilic compared to the plant body. The average values of the obtained TCC from spinach by MMAE are 8.196, 7.198 and 3.083 μg-ß-carotene/g-spinach for L-menthol:acetic acid DESs, L-menthol:propionic DESs and L-menthol:butyric acid DESs, respectively. A similar decreasing average values of the obtained TCC from spinach by HAE was also observed: 13.434, 10.276 and 5.516 μg-ß-carotene/g-spinach for L-menthol:acetic acid DESs, L-menthol:propionic DESs and L-menthol:butyric acid DESs, respectively. These results also support that, when the HBD of a DES get more hydrophobic, the extraction power of the for DESs for carotenoids decrease when a hydrophilic substrate is used such as spinach leaves whose cell walls have overall more hydrophilic nature.
This distinction highlights the need for plant-specific optimization when using DESs for carotenoid extraction. While the parameters of time, speed and solvent composition were optimized for both pumpkin and spinach, the differences in the plant matrices themselves necessitate different approaches for efficient extraction. For example, the presence of more hydrophilic components in spinach leaves may result in better extraction efficiencies using more polar DESs like L-Menthol:Acetic acid DESs, whereas pumpkin may benefit more from the use of L-Menthol:Propionic acid DESs, which can better interact with the carotenoids (i.e. non-polar ß-carotene).

4.2. Optimization

The optimum extraction conditions calculated using RSM approach and the highest μg-ß-Carotene/g-pumpkin values observed under these conditions are presented in Table 5. The best yield of TCC (represented as β-carotene) extraction from pumpkin was obtained via MMAE with L-Menthol:Propionic acid (1:2) DES. This was followed by L-Menthol:Propionic acid (1:2) DES for HAE process.
Table 5. Optimum ß-Carotene extraction conditions and maximum response values (predicted vs. actual*) obtained under these conditions calculated by CCD for DESs in MMAE and HAE of ß-Carotene from pumpkin samples.
Extraction method DESs (HBA:HBD) Optimum extraction conditions μg-β-Carotene/g-Pumpkin
Predicted 1 Actual 2,3,4
MMAE L-Menthol:Propionic acid HBD Molar Ratio: 0.6452
Mixing Time: 15.0 min.
11.528 ± 0.946 10.816 a,A ± 0.044
HAE L-Menthol:Propionic acid HBD Molar Ratio: 0.6198
Homogenization Time: 30.0 sec.
Homogenization Speed: 7061 rpm
8.966 ± 1.252 8.762 a,A,A ± 0.029
1 Predicted mean ± predicted standard deviation 2 Experimental data obtained at the conditions which were closest to the optimum extraction conditions 3 data are given as mean (3 replicates) ± standard deviation 4 Different lowercase letters indicate significant differences (one-way ANOVA, Tukey’s HSD, p < 0.05) among the calculated μg-ß-Carotene/g-sample and HBD molar ratio. Different capitalcase letters indicate significant differences (one-way ANOVA, Tukey’s HSD, p < 0.05) among the calculated μg-ß-Carotene/g-sample and mixing time.
Table 6. Optimum ß-Carotene extraction conditions and maximum response values (predicted vs. actual 1) obtained under these conditions calculated by CCD for DESs in MMAE and HAE of ß-Carotene from spinach samples.
Extraction method DESs (HBA:HBD) Optimum extraction conditions μg-β-Carotene/g-spinach
Predicted 1 Actual 2,3,4
MMAE L-Menthol:Propionic acid HBD Molar Ratio: 0.8000
Mixing Time: 60.0 min.
16.924 ± 3.518 18.990 a,A ± 0.057
HAE L-Menthol:Propionic acid HBD Molar Ratio: 0.8000
Homogenization Time: 120.0 sec.
Homogenization Speed: 7000 rpm
18.870 ± 3.302 12.177 a,A,A ± 0.118
1 Predicted mean ± predicted standard deviation 2 Experimental data obtained at the conditions which were closest to the optimum extraction conditions 3 data are given as mean (3 replicates) ± standard deviation 4 Different lowercase letters indicate significant differences (one-way ANOVA, Tukey’s HSD, p < 0.05) among the calculated μg-ß-Carotene/g-sample and HBD molar ratio. Different capitalcase letters indicate significant differences (one-way ANOVA, Tukey’s HSD, p < 0.05) among the calculated μg-ß-Carotene/g-sample and mixing time.
The optimum extraction conditions calculated using RSM approach and the highest μg-ß-Carotene/g-spinach values observed under these conditions are presented in Table 6. The best TCC (represented by ß-Carotene) extraction value from spinach was obtained via HAE with L-Menthol:Propionic acid (1:4) DES. This was followed by L-Menthol:Propionic acid (1:4) DES for MMAE process.

5. Conclusions

Utilization of deep eutectic solvents (DESs) are still considered to be a relatively young chemical method of extraction. They have a history of slightly over 20 years [37]. Synthesizing DESs with natural and green solvents not only provides affordable solution for extraction but also it is an environmentally safer approach. In this research work, carotenoids were extracted from pumpkin and spinach via utilization of the synthesized DESs for the first time.
It has been observed that L-Menthol:Propionic Acid (1:2) DES, where propionic acid has the smallest alkyl chain with having logP>0, had displayed the best effect on the extraction of TCC from pumpkin samples under the optimal conditions (11.528 μg-ß-Carotene/g-pumpkin for MMAE, 8.966 μg-ß-Carotene/g-pumpkin for HAE). Similarly, L-Menthol:Propionic Acid (1:4) DES had demonstrated the best effect on the extraction of TCC from spinach samples under the optimal conditions (16.924 μg-ß-Carotene/g-spinach for MMAE and 18.870 μg-ß-Carotene/g-spinach for HAE).
This study also highlighted the need for plant-specific optimization when using DESs for carotenoid extraction. Although the parameters of time, speed, and solvent composition were optimized for both pumpkin and spinach, the distinct characteristics of the plant matrices require different methods for effective extraction processes.
The preparation of samples, the synthesis of the DESs and the extraction methods mentioned in this paper are considered to be applicable in the industrial processes, especially for the recovery processes in the biorefinery concept. The preparation of samples is simple and easily applicable with utilization of industrial size choppers. When compared to the prior art, this method offers saving of resources which would not be used for the high energy consuming and costly pre-treatment process such as freeze-drying. Mechanical mixing and homogenization are already used and applied conventional processes within industry. Therefore, it would be easier to adapt the recommended method without additional new technological investments. Finally, waste solvent systems of the extraction process would be composed of naturally occurring compounds, that are found in plants and aren’t toxic for the environment. Thus, the work described by this research is considered to be applicable and scalable for industrial use.

Supplementary Materials

The following supporting information can be downloaded at the website of this paper posted on Preprints.org Table S1: pH and Density measurements of the DESs used in this study; Table S2: Equations and correlation coefficients of calibration curves for UV Spectrophotometer analysis of ß-Carotene dissolved in DESs used in this study. y=ß-Carotene concentration (ppm) and x=UV Absorbance reading at λ=450nm; Table S3: The ANOVA evaluation of second-order model equation derived for μg-ß-Carotene/g-pumpkin results of MMAE of ß-Carotene from pumpkin samples by using M1ACA1, M1ACA2, M1ACA3 and M1ACA4; Table S4: The ANOVA evaluation of second-order model equation derived for μg-ß-Carotene/g-pumpkin results of MMAE of ß-Carotene from pumpkin samples by using M1PRA1, M1PRA2, M1PRA3 and M1PRA4; Table S5: The ANOVA evaluation of second-order model equation derived for μg-ß-Carotene/g-spinach results of MMAE of ß-Carotene from spinach samples by using M1ACA1, M1ACA2, M1ACA3 and M1ACA4; Table S6: The ANOVA evaluation of second-order model equation derived for μg-ß-Carotene/g-spinach results of MMAE of ß-Carotene from spinach samples by using M1PRA1, M1PRA2, M1PRA3 and M1PRA4; Table S7: The ANOVA evaluation of second-order model equation derived for μg-ß-Carotene/g-spinach results of MMAE of ß-Carotene from spinach samples by using M1BTA1, M1BTA2, M1BTA3 and M1BTA4; Table S8: The ANOVA evaluation of second-order model equation derived for μg-ß-Carotene/g-pumpkin results of HAE of ß-Carotene from pumpkin samples by using M1ACA1, M1ACA2, M1ACA3 and M1ACA4; Table S9: The ANOVA evaluation of second-order model equation derived for μg-ß-Carotene/g-pumpkin results of HAE of ß-Carotene from pumpkin samples by using M1PRA1, M1PRA2, M1PRA3 and M1PRA4; Table S10: The ANOVA evaluation of second-order model equation derived for μg-ß-Carotene/g-spinach results of HAE of ß-Carotene from spinach samples by using M1ACA1, M1ACA2, M1ACA3 and M1ACA4; Table S11: The ANOVA evaluation of second-order model equation derived for μg-ß-Carotene/g-spinach results of HAE of ß-Carotene from spinach samples by using M1PRA1, M1PRA2, M1PRA3 and M1PRA4; Table S12: The ANOVA evaluation of second-order model equation derived for μg-ß-Carotene/g-spinach results of HAE of ß-Carotene from spinach samples by using M1BTA1, M1BTA2, M1BTA3 and M1BTA4.

Author Contributions

Conceptualization, K.T.; methodology, K.T. and S.Ş.S.; software, K.T. and İ.T.Y.; validation, K.T..; formal analysis, K.T.; investigation, K.T.; resources, K.T., M.B., S.Ş.S. and E.K.Ş.; data curation, K.T.; writing—original draft preparation, K.T.; writing—review and editing, K.T., M.B. and S.Ş.S.; visualization, K.T. and S.Ş.S.; supervision, K.T., M.B. and S.Ş.S.; project administration, K.T.; funding acquisition, K.T. All authors have read and agreed to the published version of the manuscript.

Funding

This research received no external funding.

Institutional Review Board Statement

Not applicable.

Informed Consent Statement

Not applicable.

Data Availability Statement

All data supporting the findings of this study are provided within the article and the Supplementary Materials.

Acknowledgments

The authors gratefully acknowledge BASF SE, Abdi İbrahim İlaç San. ve Tic A.Ş., World Medicine İlaç San. ve Tic. A.Ş. and Neutec İlaç San. Ve Tic A.Ş. companies for freely supplying some of the laboratory materials used in this study.

Conflicts of Interest

The authors declare no conflicts of interest.

References

  1. Şanal, İ.S.; Güvenç, A.; Salgın, U.; Mehmetoğlu, Ü.; Çalımlı, A. Recycling of apricot pomace by supercritical CO2 extraction. J. Supercrit. Fluids 2004, 32, 221–230. [Google Scholar] [CrossRef]
  2. Sandmann, G. Carotenoids and their biosynthesis in fungi. Molecules 2022, 27, 1431. [Google Scholar] [CrossRef] [PubMed]
  3. Wang, XD.; Ross, C.A.; Caballero, B.; Cousins, R.J.; Tucker, K.L.; Ziegler, T.R. 31-Carotenoids, In Modern Nutrition in Health and Disease, 11th ed.; Lippincott Williams & Wilkins, Philederphia, 2014; 427-439.
  4. Ozturk, B.; Parkinson, C.; Gonzalez-Miquel, M. Extraction of polyphenolic antioxidants from orange peel waste using deep eutectic solvents. Sep. Purif. Technol. 2018, 206, 1–13. [Google Scholar] [CrossRef]
  5. α-Carotene, β-Carotene, β-Cryptoxanthin, Lycopene, Lutein, and Zeaxanthin. URL: https://lpi.oregonstate.edu/mic/dietary-factors/phytochemicals/carotenoids#introduction, (accessed on 11th November 2024).
  6. Craft, N.E.; Soares, J.H.Jr. Relative Solubility, Stability, and absorptivity of lutein and β-Carotene in organic solvents. J. Agric. Food. Chem. 1992, 40, 431–434. [Google Scholar] [CrossRef]
  7. Huff, J. Benzene-induced cancers: Abridged history and occupational health impact. Int. J. Occup. Environ. Health. 2007, 13, 213–221. [Google Scholar] [CrossRef] [PubMed]
  8. ICH guideline Q3C (R9) on impurities: guideline for residual solvents (EMA/CHMP/ICH/82260/2006). Available online: https://www.ema.europa.eu/en/documents/scientific-guideline/ich-q3c-r9-guideline-impurities-guideline-residual-solvents-step-5_en.pdf, (accessed on 11th November 2024).
  9. Waste and Resources Action Programme - Why we need to take action on food waste. Available online: https://www.wrap.ngo/taking-action/food-drink/actions/action-on-food-waste#:~:text=Producing%20food%20requires%20significant%20resources,greenhouse%20gas%20(GHG)23%20emissions (accessed on 20 October 2024).
  10. United Nations Environment Programme. Food Waste Index Report 2024. Think Eat Save: Tracking Progress to Halve Global Food Waste, Knowledge Repository - UNEP. UNEP.: Nairobi, Kenya, 2024; pp.12.
  11. The World Counts - Food is lost in every step of the food “life cycle”. Available online: https://www.theworldcounts.com/challenges/people-and-poverty/hunger-and-obesity/food-waste-statistics, (accessed on 21st November 2024).
  12. Kee, P.E.; Cheng, Y.-S.; Chang, J.-S.; Yim, H.S.; Tan, J.C.Y.; Lam, S.S.; Lan, J.C.-W.; Ng, H.S. , Khoo, K.S. Insect biorefinery: A circular economy concept for biowaste conversion to value-added products. Environ. Res. 2023, 221, 115284. [Google Scholar] [CrossRef] [PubMed]
  13. Food and Agriculture Organization of the United Nations - Food wastage footprint & climate change. Available online: https://openknowledge.fao.org/server/api/core/bitstreams/7fffcaf9-91b2-4b7b-bceb-3712c8cb34e6/content, (accessed on 22nd October 2024).
  14. Food and Agriculture Organization of the United Nations (Crops and livestock productions Area: World + (Total) / Item: pumpkins, squash and gourds / Year: 2022-2022). Available online: https://www.fao.org/faostat/en/#data/QCL/visualize, (accessed on 11th November 2024).
  15. Oh my gourd! 1.3B pounds of pumpkins reach landfills every year. Available online: https://www.wastedive.com/news/oh-my-gourd-13b-pounds-of-pumpkins-reach-landfills-every-year/408341/, (accessed on 8th November 2024).
  16. United States Department of Energy – Office of Energy Efficiency & Renewable Energy - Reducing Waste and Harvesting Energy This Halloween. Available online: https://www.energy.gov/eere/articles/reducing-waste-and-harvesting-energy-halloween, (accessed on 9th November 2024).
  17. United States Department of Agriculture. National Nutrient Database for Standard Reference. USDA National Nutrient Database for Standard Reference 2015, Release 28, 4. [Google Scholar]
  18. Lin, H.; Black, M.J.; Walsh, L.; Giordano, F. S.; Borrion, A. Life cycle assessment of baby leaf spinach: Reduction of waste through interventions in growing treatments and packaging. J. Clean. Prod. 2024, 449, 141723. [Google Scholar] [CrossRef]
  19. Frankowska, A.; Jeswani, H.K.; Azapagic, A. Environmental impacts of vegetables consumption in the UK, Science of the Total Environment. Sci. Total Environ. 2019, 682, 80–105. [Google Scholar] [CrossRef] [PubMed]
  20. Menthols – OECD SIDS Initial Assessment Report. Available online: https://hpvchemicals.oecd.org/ui/handler.axd?id=463ce644-e5c8-42e8-962d-3a917f32ab90, (accessed on 16th December 2024).
  21. Environmental Assessment for Food Contact Notification FCN 1783. Available online: https://www.fda.gov/files/food/published/Environmental-Assessment-for-Food-Contact-Notification-No.-1783.pdf, (accessed on 16th December 2024).
  22. Gad, Shayne C. In Propionic acid. Elsevier eBooks, 2023, pp. 967–971.
  23. N-Butyric acid – OECD SIDS Initial Assessment Report. Available online: https://hpvchemicals.oecd.org/ui/handler.axd?id=ca33e5a6-65f4-412d-b22c-0f7ed839f886, (accessed on 16th December 2024).
  24. Hayyan, A.; Zainal-Abidin, M. H.; Putra, S. S. S.; Alanazi, Y. M.; Saleh, J.; Nor, M. R. M.; Hashim, M. A.; Gupta, B. S. Evaluation of biodegradability, toxicity and ecotoxicity of organic acid-based deep eutectic solvents. Sci. Total Environ. 2024, 948, 174758. [Google Scholar] [CrossRef] [PubMed]
  25. Sebdani, M.M.; Abbasi, H. Green extraction of carotenoids from pumpkin with ultrasound-assisted method; optimization using response surface methodology. Microchem. J. 2023, 193, 109092. [Google Scholar] [CrossRef]
  26. Stupar, A.; Šeregelj, V.; Ribeiro, B.D.; Pezo, L.; Cvetanović, A.; Mišan, A.; Marrucho, I. Recovery of β-carotene from pumpkin using switchable natural deep eutectic solvents. Ultrason. Sonochem. 2021, 76, 105638. [Google Scholar] [CrossRef]
  27. Zaib, Q.; Eckelman, M. J.; Yang, Y.; Kyung, D. Are deep eutectic solvents really green?: A life-cycle perspective. Green Chem., 2022, 24, 7924–7930. [Google Scholar] [CrossRef]
  28. Lazzarini, C.; Casadei, E.; Valli, E.; Tura, M.; Ragni, L.; Bendini, A.; Toschi, T.G. Sustainable Drying and Green Deep Eutectic Extraction of Carotenoids from Tomato Pomace. Foods, 2022, 11, 405. [Google Scholar] [CrossRef] [PubMed]
  29. Terlidis, K.; Athanasiadis, V.; Chatzimitakos, T.; Bozinou, E.; Lalas, S.I. Carotenoids Extraction from Orange Peels Using a Thymol-Based Hydrophobic Eutectic Solvent. AppliedChem, 2023, 3, 437–451. [Google Scholar] [CrossRef]
  30. Moradi, M.; Fazlzadehdavil, M.; Pirsaheb, M.; Mansouri, Y.; Khosravi, T.; Sharafi, K. Response surface methodology (RSM) and its application for optimization of ammonium ions removal from aqueous solutions by pumice as a natural and low cost adsorbent. Arch. Environ. Prot. 2016, 42, 33–43. [Google Scholar] [CrossRef]
  31. Bezerra, M.A.; Santelli, R.E.; Oliveira, E.P.; Villar, L.S.; Escaleira, L.A. Response surface methodology (RSM) as a tool for optimization in analytical chemistry. Talanta 2008, 76, 965–977. [Google Scholar] [CrossRef]
  32. Bhat, B.; Vaid, S.; Habib, B.; Bajaj, B.K. Design of experiments for enhanced production of bioactive exopolysaccharides from indigenous probiotic lactic acid bacteria. Indian J. Biochem. Biophys. 2020, 57, 539–551. [Google Scholar]
  33. Florindo, C.; McIntosh, A.J.S.; Welton, T.; Branco, L.C.; Marrucho, I.M. A closer look into deep eutectic solvents: exploring intermolecular interactions using solvatochromic probes. Phys. Chem. Chem. Phys., 2018, 20, 206–213. [Google Scholar] [CrossRef] [PubMed]
  34. Acetic acid (glacial) 100% SDS. Available online: https://www.merckmillipore.com/DE/en/product/msds/MDA_CHEM-100056 (accessed on 13th November 2024).
  35. Propionic acid for synthesis SDS. Available online: https://www.merckmillipore.com/DE/en/product/msds/MDA_CHEM-800605?Origin=PDP (accessed on 13th November 2024).
  36. Kwan, Y.H.; Tung, Y.K.; Kochhar, J.S.; Li, H.; Poh, A.L.; Kang, L. 6-Esstial Monographs, In Handbook of Cosmeceutical Excipients and their Safeties, 1st ed.; Woodhead Publishing: Kidlington, UK, 2014; p. 105. [Google Scholar]
  37. Abbott, A.P.; Capper, G.; Davies, D.L.; Rasheed, R.K.; Tambyrajah, V. Novel solvent properties of choline chloride/urea mixtures. Chem. Commun. 2023, 70–71. [Google Scholar]
Figure 1. Effect of acetic acid molar ratio and mixing time (a), propionic acid molar ratio and mixing time (b) on β-Carotene extract obtained by MMAE from pumpkin, and effect of acetic acid molar ratio and mixing time (c), propionic acid molar ratio and mixing time (d), butyric acid molar ratio and mixing time (e) on β-Carotene extract obtained by MMAE from spinach.
Preprints 143504 g001
Figure 2. Effect of acetic acid molar ratio and homogenization time (a), acetic acid molar ratio and homogenization speed (b), homogenization time and homogenization speed (c), and effect of propionic acid molar ratio and homogenization time (d), propionic acid molar ratio and homogenization speed (e), homogenization time and homogenization speed (f) on β-Carotene extract obtained by HAE from pumpkin.
Preprints 143504 g002
Figure 3. Effect of acetic acid molar ratio and homogenization time (a), acetic acid molar ratio and homogenization speed (b), homogenization time and homogenization speed (c), and effect of propionic acid molar ratio and homogenization time (d), propionic acid molar ratio and homogenization speed (e), homogenization time and homogenization speed (f), effect of butyric acid molar ratio and homogenization time (g), butyric acid molar ratio and homogenization speed (h), homogenization time and homogenization speed (i), on β-Carotene extract obtained by HAE from spinach.
Preprints 143504 g003
Figure 4. Graphical abstract.
Preprints 143504 g004
Disclaimer/Publisher’s Note: The statements, opinions and data contained in all publications are solely those of the individual author(s) and contributor(s) and not of MDPI and/or the editor(s). MDPI and/or the editor(s) disclaim responsibility for any injury to people or property resulting from any ideas, methods, instructions or products referred to in the content.
Copyright: This open access article is published under a Creative Commons CC BY 4.0 license, which permit the free download, distribution, and reuse, provided that the author and preprint are cited in any reuse.

Downloads

50

Views

58

Comments

0

Subscription

Notify me about updates to this article or when a peer-reviewed version is published.

Email

Prerpints.org logo

Preprints.org is a free preprint server supported by MDPI in Basel, Switzerland.

Subscribe

© 2025 MDPI (Basel, Switzerland) unless otherwise stated