1. Introduction
It is well known that motorcyclists are vulnerable road users. This is due to many aspects related to both the vehicle and the rider, such as the different sizes, weights, and powers of the motorcycle, the balance skills needed by the rider to control the bike, the high speeds that motorcycles can reach, and the low level of protection of their users, who are only protected by their safety equipment – if this is used effectively [
1].
Motorcycle designs vary significantly in size, weight, and performance capacity, allowing riders to choose models tailored to specific riding practices [
2]. However, the likelihood of motorcyclists being killed in road accidents remains disproportionately high—9 to 30 times greater than that of car drivers [
3]. The situation is further complicated by the global increase in motorcycle ownership, which contributes to changing road safety dynamics and patterns of risk exposure [
4].
Although the number of motorcyclist fatalities has decreased over the last ten years [
5], the decrease has been much slower than that of other road users: a 25% decrease compared to 33% of all other road fatalities. At the same time, it should be noted that the number of motorcyclists is increasing, and the patterns of road deaths are changing [
5]. Concurrently, the growing number of motorcyclists has introduced new challenges in maintaining road safety [
6]. These trends underscore the urgency of deepening our understanding of the factors contributing to fatal motorcycle accidents. Research has shown that advancements such as enhanced braking systems can mitigate some risks [
7], but the persistent overrepresentation of motorcyclists in fatality statistics highlights the need for broader and more targeted interventions [
8].
Motorcycle safety is (mainly) a male problem. Among motorcycle user deaths, 92% are male riders, 2% are male passengers, 3% are female riders and 3% are female passengers. Among the countries that monitor levels of speed compliance on urban roads with a 50 km/h speed limit countrywide, between 41% and 61% of power-two wheelers (PTWs) speed observations in free-flowing traffic are compliant with the legal speed. Among countries monitoring speed on rural non-motorway roads, from 27% to 81% of PTWs speed observations in free-flowing traffic are within the speed limit. Among the countries monitoring speed on motorways, the proportion of PTWs speeds observed in free-flowing traffic compliant with the speed limit ranges from 42% to 85% [
1].
For all these reasons, it is necessary to deepen the knowledge of the factors that lead to fatal accidents involving motorcyclists: only in this way is it possible to propose appropriate countermeasures that could reduce the number or at least the consequences of road accidents involving these users.
The present study aims to shed light on the safety level of motorcyclists in Slovenia by analysing the most recent road accident databases available at the national level to determine which factors influence the occurrence of fatal accidents caused by motorcyclists.
2. Literature Review
For several reasons, the motorcycle-rider-environment system is more demanding than the driver-vehicle-environment system. Firstly, the elements of motorcycle construction differ from that of passenger cars. Secondly, rider behaviour differs from driver behaviour [
9]. Thirdly, some road design elements (or their combinations) and road equipment elements could be entirely safe for motorised vehicles but can be very dangerous for motorcyclists (and there is no difference in terms of the road or roadside elements) [
10].
The issue of motorcyclist safety started getting the attention of researchers in the early 2000s when Clarke et al. [
11] were among the first researchers to conduct an in-depth analysis of motorcyclist road accidents. They used the analysis of a police database of road accidents involving motorcyclists and the results of questionnaires to identify the most common types of accidents involving these road users and the leading causes. Three causes were highlighted: accidents due to failure to give way, accidents due to losing control of the motorcycle, and overtaking. A few years later, Clabaux et al. [
12] pointed out another important aspect of motorcyclists' safety: their conspicuity. According to these researchers, many accidents are caused by an interfering user who has not noticed the motorcyclist despite» seeing it«. They have shown that one of the main factors influencing the conspicuity of motorcyclists is their speed: the higher their speed, the less visible they are to other road users. This finding aligns with the work of Crundall, Clarke, and Stedmon [
13], who explored how conspicuity factors, including clothing, lighting, and speed, impact the likelihood of collisions.
Recently, two interesting studies have been conducted, one in the U.S. [
14] and the other in the Czech Republic [
15], in which various aspects of motorcyclist safety were investigated. Jafari et al. [
14] focused on road infrastructure in the first study. They emphasised that curved elements are more challenging for motorcyclists due to vehicle handling and balancing. Similarly, Wu et al. [
16] highlighted that urban road geometries, including intersections and sharp curves, are particularly hazardous for motorcyclists due to increased vehicle manoeuvring complexity.
In the second study, Tmejova et al. [
15] examined 376 accidents involving motorcyclists in South Moravia. According to their results, due to incorrect speed, incorrect assessment of the situation, and inexperience, motorcyclists caused half of the road accidents. Boufous et al. [
17] confirmed that rider inexperience is a consistent risk factor globally, especially among young or newly licensed motorcyclists.
An interesting study was recently published by Bella et al. [
18], who focused on the overtaking manoeuvre, which has peculiarities, especially for motorcyclists. They developed an experiment in which a car equipped with a camera and a GPS device recorded the overtaking manoeuvres of motorcyclists. Based on this experiment, they analysed the duration of overtaking manoeuvres and the lateral clearance distance maintained by motorcyclists, factors that can significantly affect safety when overtaking. Recent work by Mulvihill and McLaughlin [
19] supports this by demonstrating that insufficient lateral clearance increases the likelihood of severe injuries during overtaking incidents.
Although the efforts to make technical improvements to motorcyclist safety are remarkable in Slovenia, little scientific work has been carried out on these road users. Only two papers were found on this topic: Šraml et al. [
20] prepared an analysis of the road safety of PTWs on Slovenian territory in 2012 and showed the main causes leading to road accidents involving PTWs. The second one, Renčelj et al. [
21], proposed an innovative approach, combining soft, educational, infrastructural, and enforcement measures to improve the road safety of motorcyclists. However, recent advancements in data collection and accident analysis methodologies offer new opportunities for a deeper understanding of these road users’ safety [
22].
The following presents a recent analysis of road accidents involving motorcyclists on Slovenian roads. The paper is structured as follows: first, a literature review was conducted to show the already-known aspects of fatal accidents caused by motorcyclists. Secondly, the databases and methods used to obtain valuable data on fatal motorcycle accidents are described. Finally, four analyses were conducted: first, an analysis of road accidents over ten years from the entire database considered – considering only motorcyclist accidents – was made to show recurrent patterns in the evolution of fatal accidents involving the mentioned road users; this analysis was then deepened by considering only accidents caused by motorcyclists to understand what factors influenced the misbehaviour of these road users. Finally, of all the accidents caused by a motorcyclist, only single-vehicle accidents were considered. In the end, a correlation analysis was carried out to understand which underlined factors also statistically influence the occurrence of such accidents.
3. Methodology
Four complementary databases were used as the starting point of this study to develop accurate, up-to-date, and comprehensive research. These are:
The road accident database by the Slovenian Traffic Safety Agency (TSA) contains essential information on road accidents recorded by the Police from 1994 to 2022. In this database, the data on road accidents are recorded for each road accident separately and contain information on the time and location of the road accident, its typology, cause, classification, and consequences, the characteristics of the road, which the accident occurred on, as well as much information about the users involved in the accidents. Data are displayed interactively on a road accident map and the TSA website, and they are open to download as a .xlsx file.
The road data bank (RDB) records technical data about public – national, and municipal – roads, facilities, traffic signs, and additional equipment on these roads. This database is maintained and upgraded by the Slovenian Infrastructure Agency DRSI, which takes care of data about national roads, and by municipalities for the data about municipal roads.
Additional Police data were used to obtain additional detailed information not contained in the TSA database. These data describe events on Slovenian roads in the last 24 hours. Records are available by days, months, and years and contain brief statistical overviews of what happened in the last 24 hours, reports of stolen vehicles, and descriptions of fatal road accidents.
Additional online media descriptions often report details about fatal road accidents on Slovenian roads.
To develop the desired analyses, it was necessary to create a unique database containing data on the road accidents themselves, the geometrical characteristics of the road, and the road users involved. To do so, four steps were followed (Fig. 1). Firstly, valuable data were extracted from TSA and RDB databases (Fig. 1 - step 1). The TSA database used data from 1/1/2013 – 31/12/2022 to analyse 10 years period. Additionally, accident data from all national roads, excluding motorways and expressways, were selected, and this decision was made because these types of roads are less attractive for motorcyclists in Slovenia. Finally, only road accidents where motorcycle riders were involved were considered. The RDB database extracted data about the direction, length and size (radius, curvature) of horizontal elements, longitudinal gradients and cross-sectional road dimensions. Since in both databases, data are related to road chainage, they could be merged (step 2).
Once the two central databases were merged, from the Police data and media descriptions, information about the rider's direction of travel was obtained (step 3). This information was vital since it allowed us to point out how riders approached different horizontal elements. Based on this information, the initial merged database was modified (
Figure 1 - step 4), and the effective direction and dimension of the horizontal elements (especially curves) were added.
Table 1 summarises all data considered in the final database.
A two-fold analysis was developed from the merged and modified database (
Figure 2). First, a three-step general analysis of the obtained data was worked out: firstly, considering all fatal accidents with involved motorcyclists, then restricting them to the fatal accidents caused by a motorcyclist, and finally, deepening the analysis in single-vehicle accidents, i.e. accidents, which involved only the motorcycle rider. After that, a statistical analysis was worked out, and the correlation between factors leading to the accident and its happening was searched. The first stage of analysis touched a total of 138 road accidents; the second stage reduced the number of accidents to 89 – these are the accidents caused by motorcyclists, and the last one limited to 44 single-vehicle accidents of all the considered fatal road accidents.
4. Results
In this section, the results of all analyses are described. For clarity, results will be divided into sub-sections, which refer to each analysis stage described in the Methodology. The sub-sections related to stages 1 – 3 are split into three parts, presenting the results associated with the involved road users, the cause and type of the accident and the design elements.
4.1. Analysis of All Fatal Road Accidents with Involved Motorcyclists
As shown in
Figure 3, 138 fatal road accidents involving motorcyclists happened in the 10-year period from 2013 to 2022. Their trend has been stable, though years 2014 and 2021 stand out, with 37.7 % and 44.9 % more accidents than the mean number in the considered 10-year period. In addition, the year 2022 is noticeable, with a decrease in road accidents to 7 in a year, i.e. 49.27 % less than the period's average. Most of these accidents (90.58 %) happened on non-urban areas' roads, while only 9.42 % were developed in urban areas. This finding could be expected since motorcyclists prefer riding on country, winding roads, and Slovenian non-urban area roads, which are particularly appealing for these road users.
4.1.1. Cause and Type Of Road Accident
Two fundamental characteristics of road accidents – especially fatal ones – that should be clearly understood to improve the road safety of a specific group of road users are the reasons for the accident and the type of accident. The graph in
Figure 4 shows that most of the fatal accidents under consideration were caused by unadjusted speed (47.10 %), followed by three other factors, i.e. disrespect of yielding rules, incorrect driving direction and incorrect overtaking, which have much lower percentages – 18.84 %, 15.22 % and 12.32 % respectively.
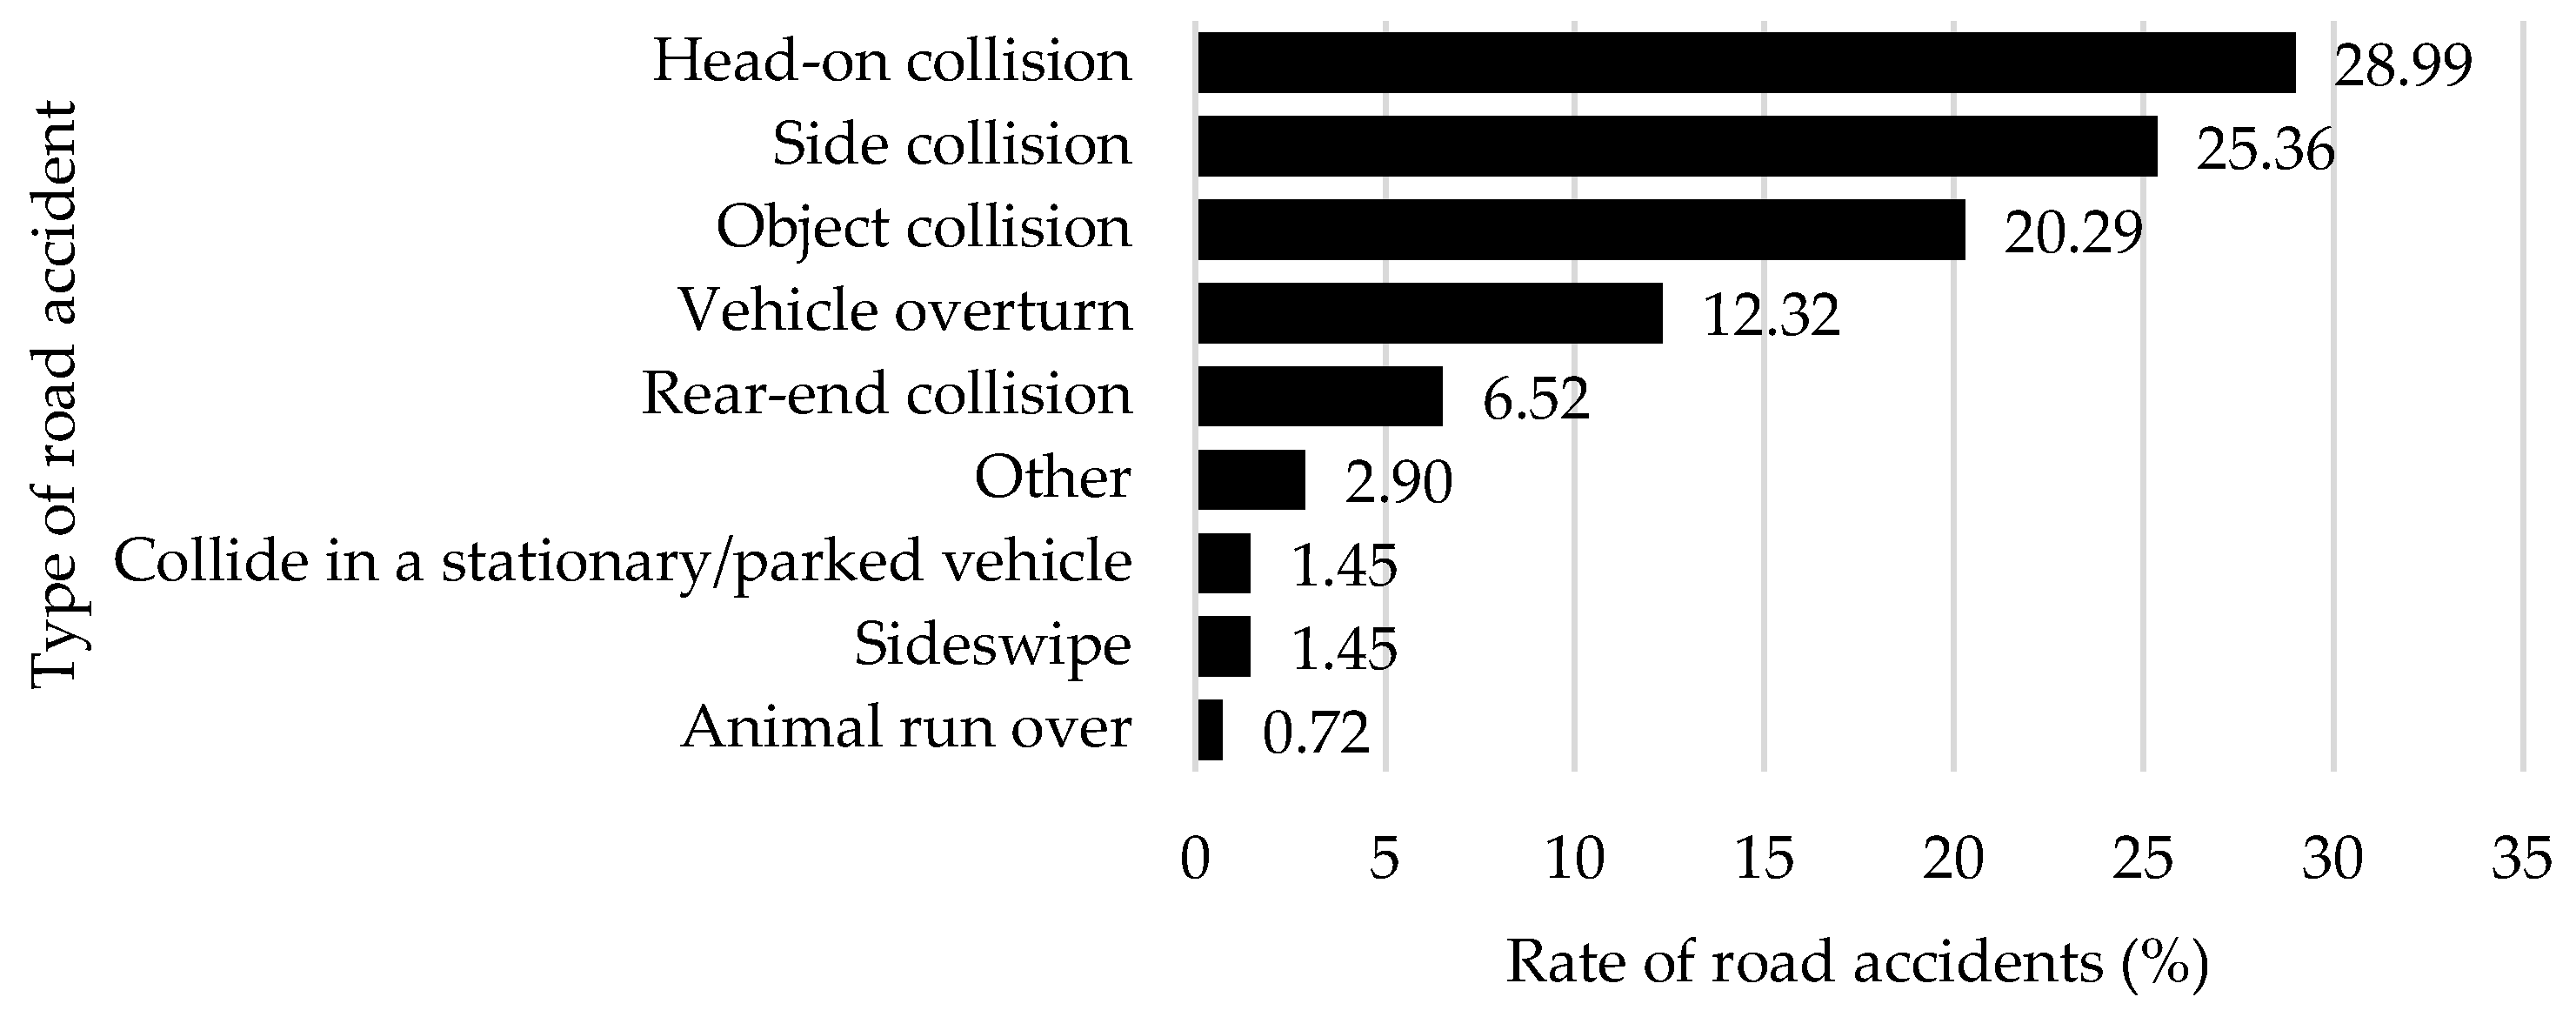
Figure 5 summarises the results regarding the type of road accidents. It can be noticed that three kinds of road accidents have higher rates, i.e. head-on, side and object collisions. This follows previous results regarding the causes of the accidents. It could be expected that an unadjusted speed could lead to the loss of control of the vehicle, causing a collision with an object or a head-on collision with another vehicle. Similarly, this can be said to be due to an incorrect overtaking or the partial use of the other driving lane. In addition, side collisions can be explained by the disrespect of yielding rules and probably also with some dynamics related to the other mentioned causes.
4.1.2. Involved Road Users
Interesting results are shown in
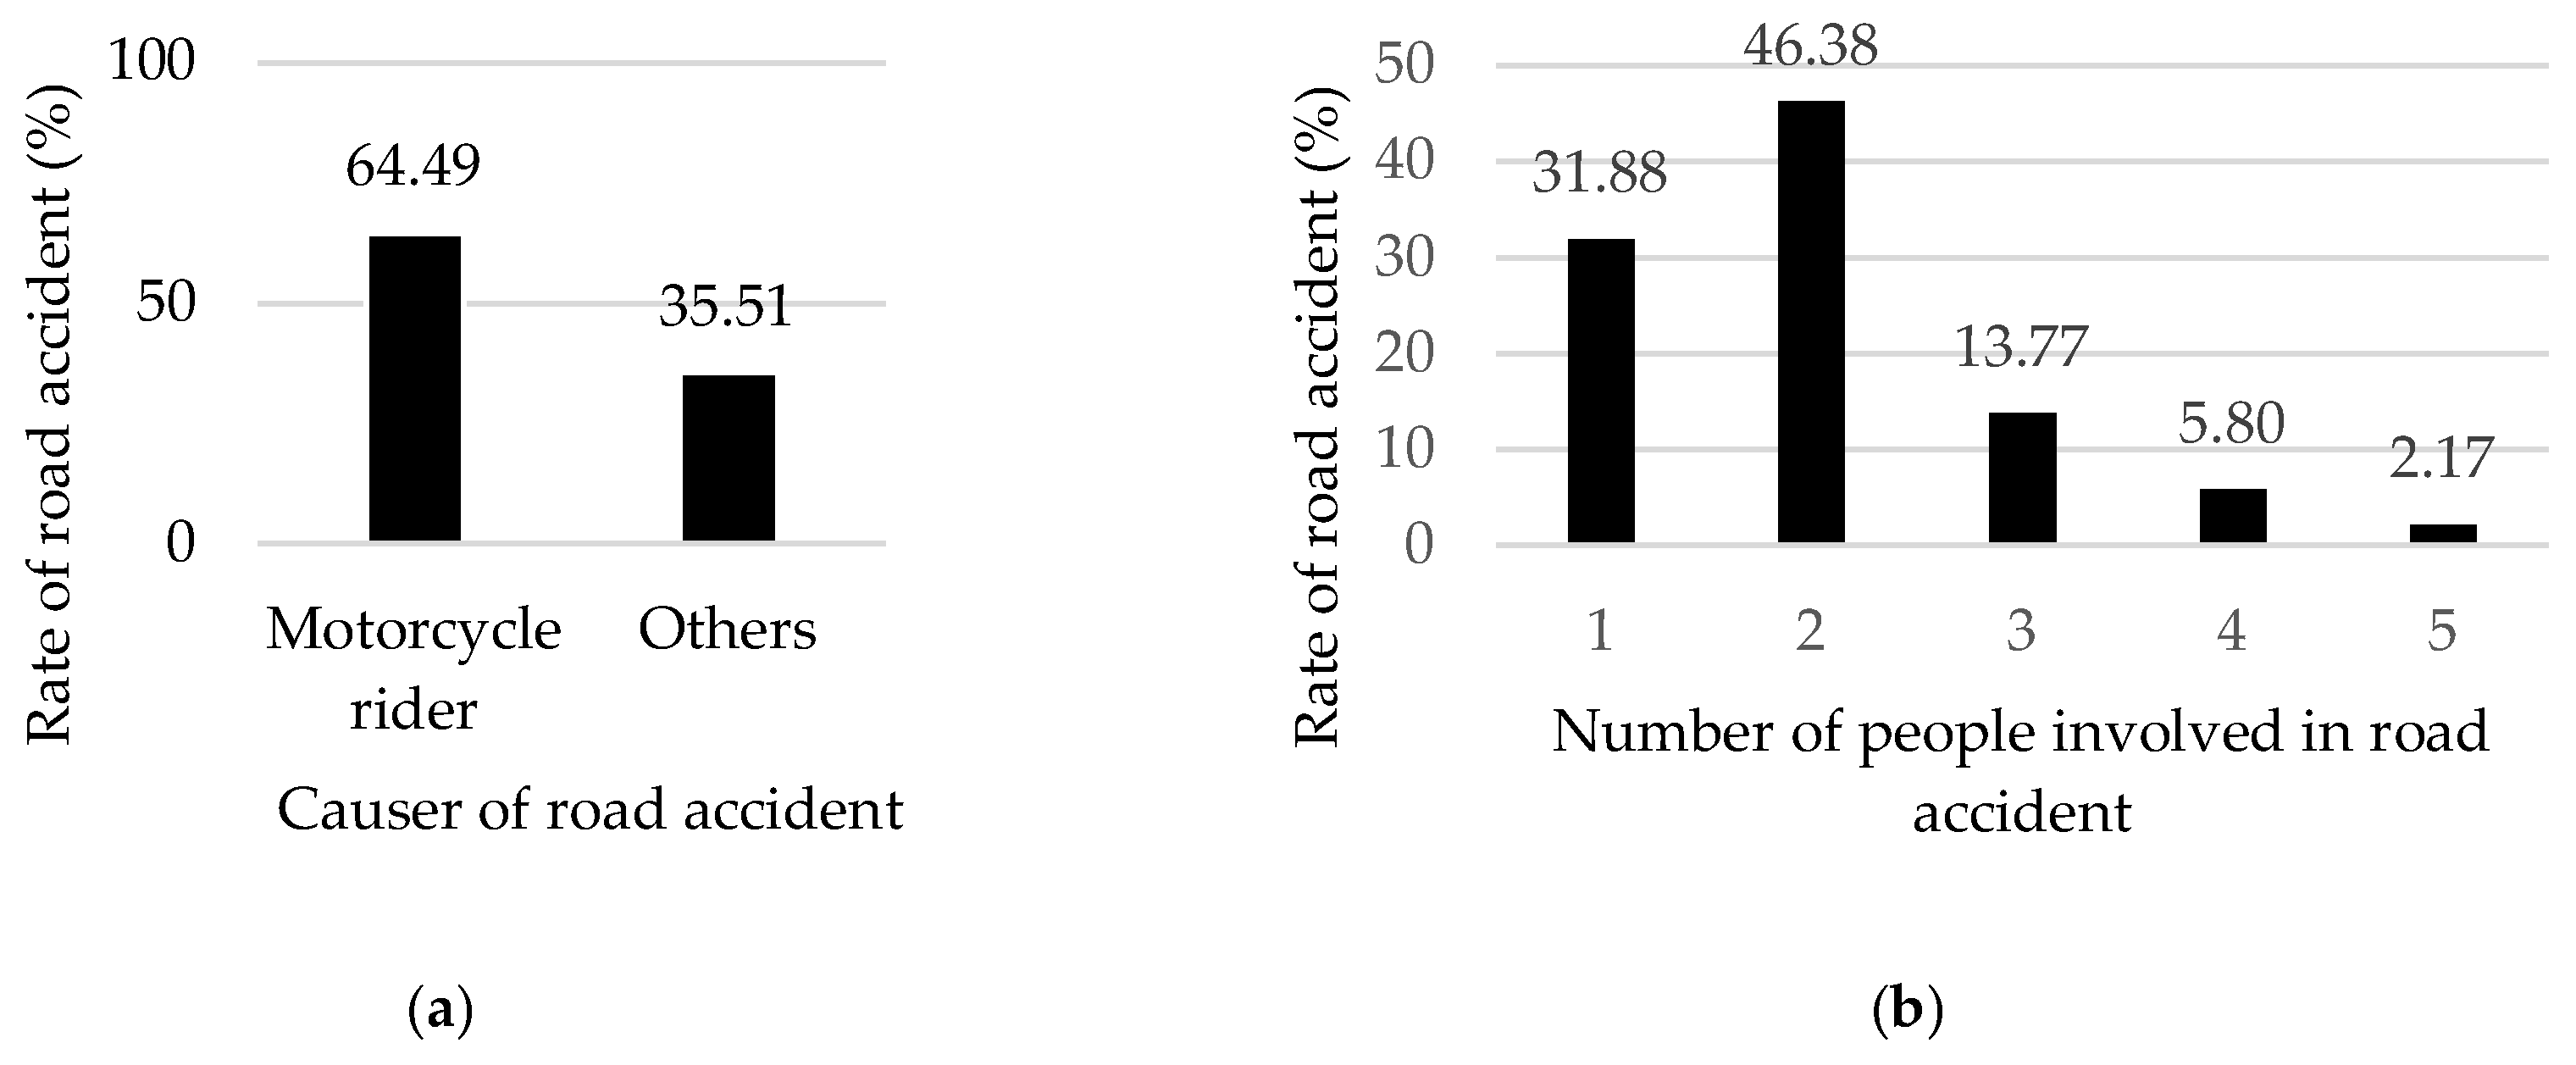
Figure 6a,b. The first graph (
Figure 6a) shows that in 64.49 % of all considered accidents, the motorcycle rider caused the accident. That is in accordance with the causes of the accident mentioned in the previous section. In addition, it can be noticed (
Figure 6b) that in most cases (46.38 %), two road users were involved in the accident, followed by single-vehicle accidents (31.88 %).
When analysing the driving experience (
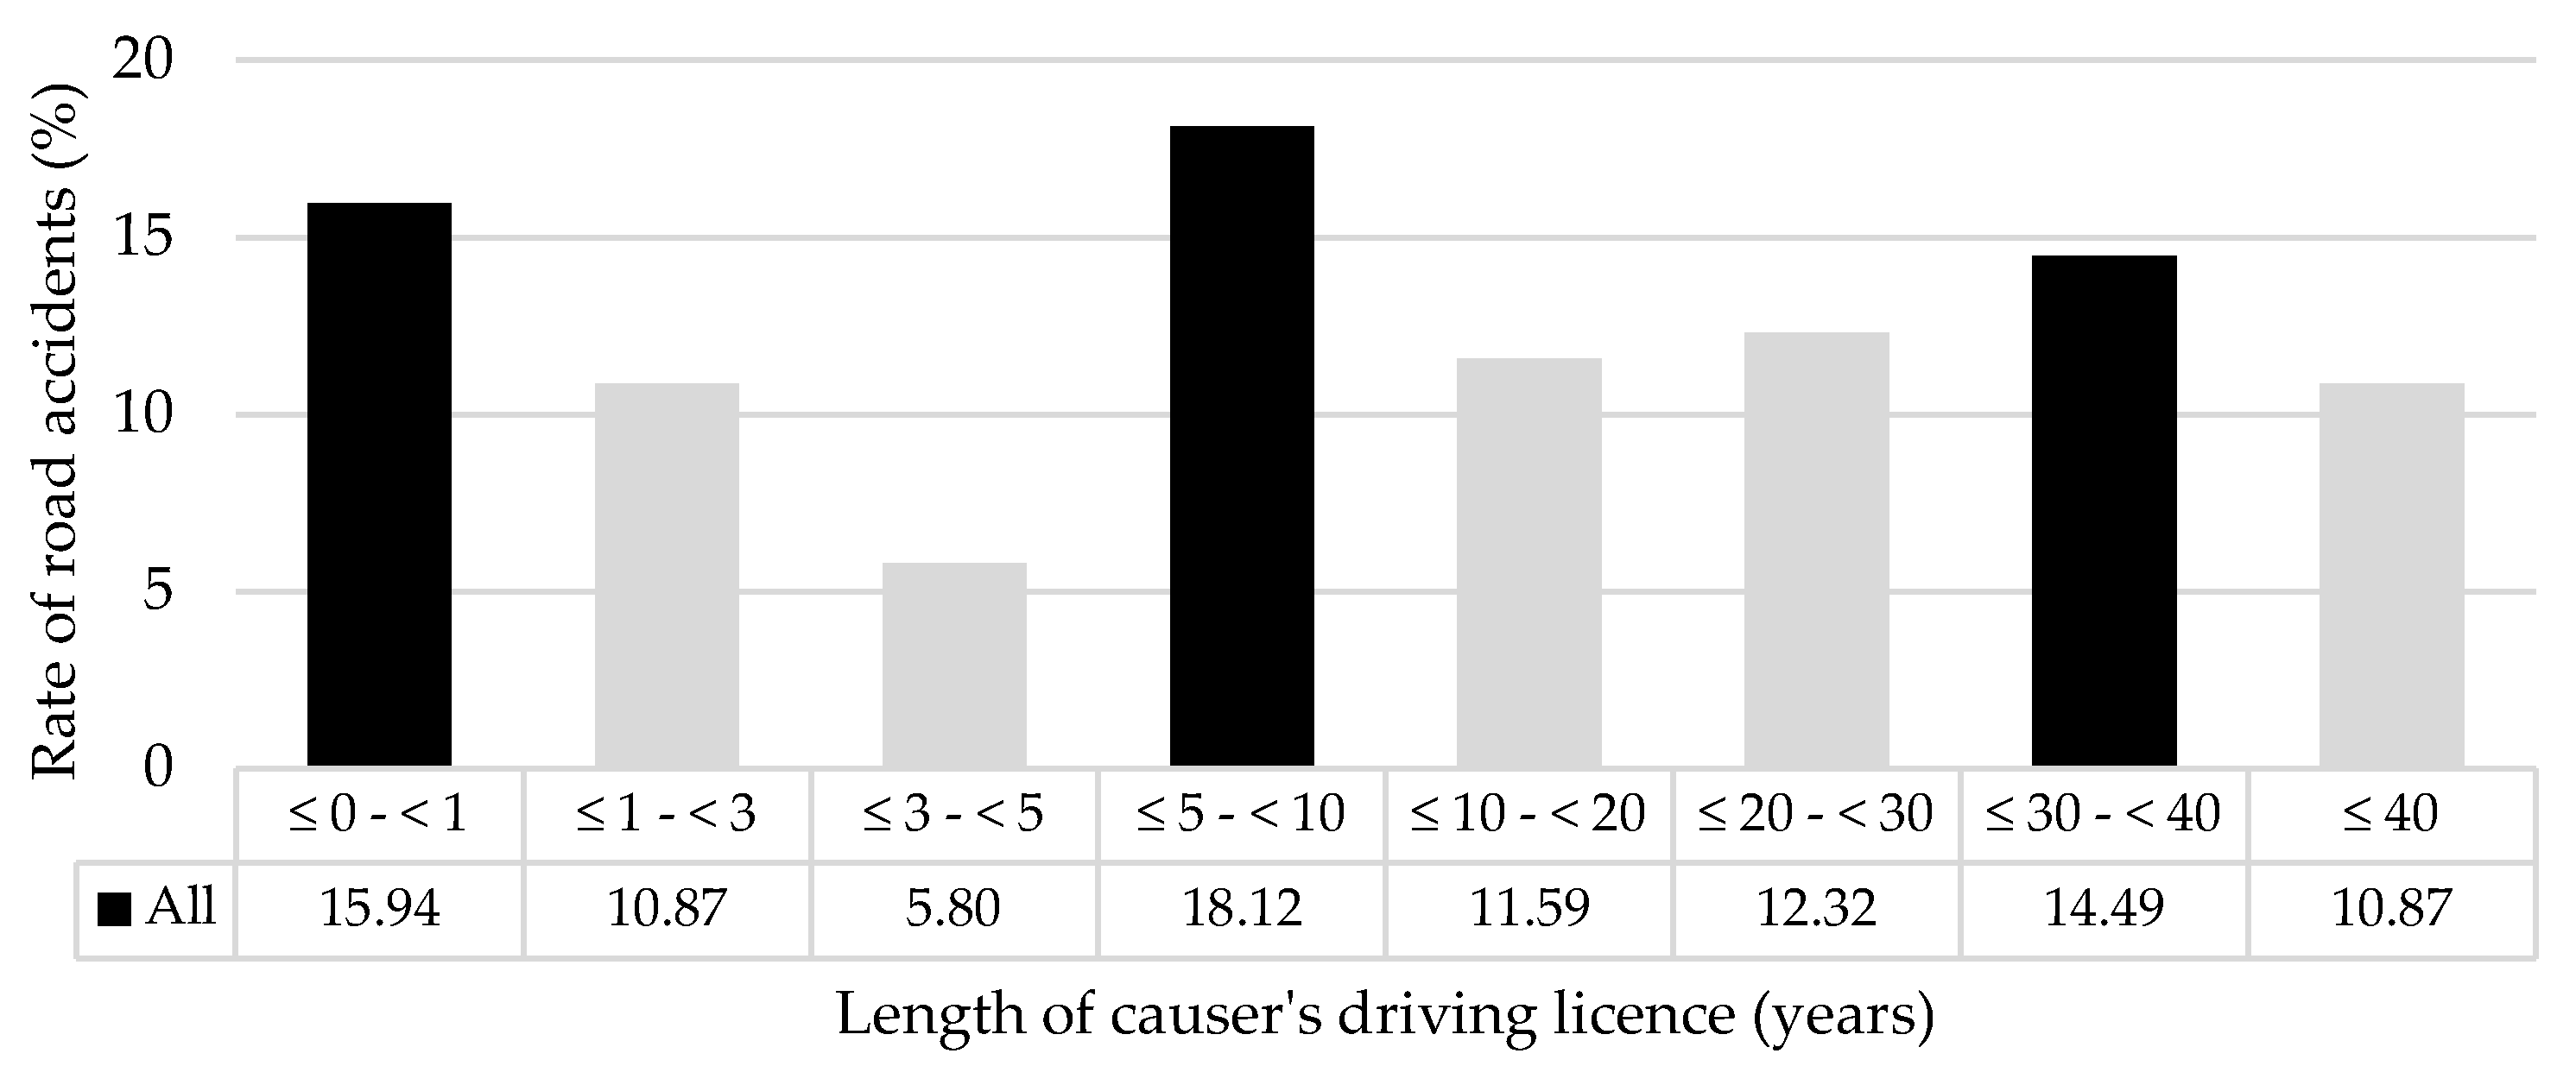
Figure 7) – in terms of years attaining the driving license – of the drivers causing the accidents, three age intervals stand out: drivers with 5 to 10 years’ experience – 18.12 %, novice drivers with less than 1 year experience – 15.94 %, and older drivers with 30 to 40 years of driving experience – 14.49 %.
According to these results, the age of the riders causing the accident is between 18 and 34 in 36.23 % of the cases and over 45 in 38.82 %.
4.1.3. Design Elements
When analysing the road geometrical characteristics, it can be noticed (
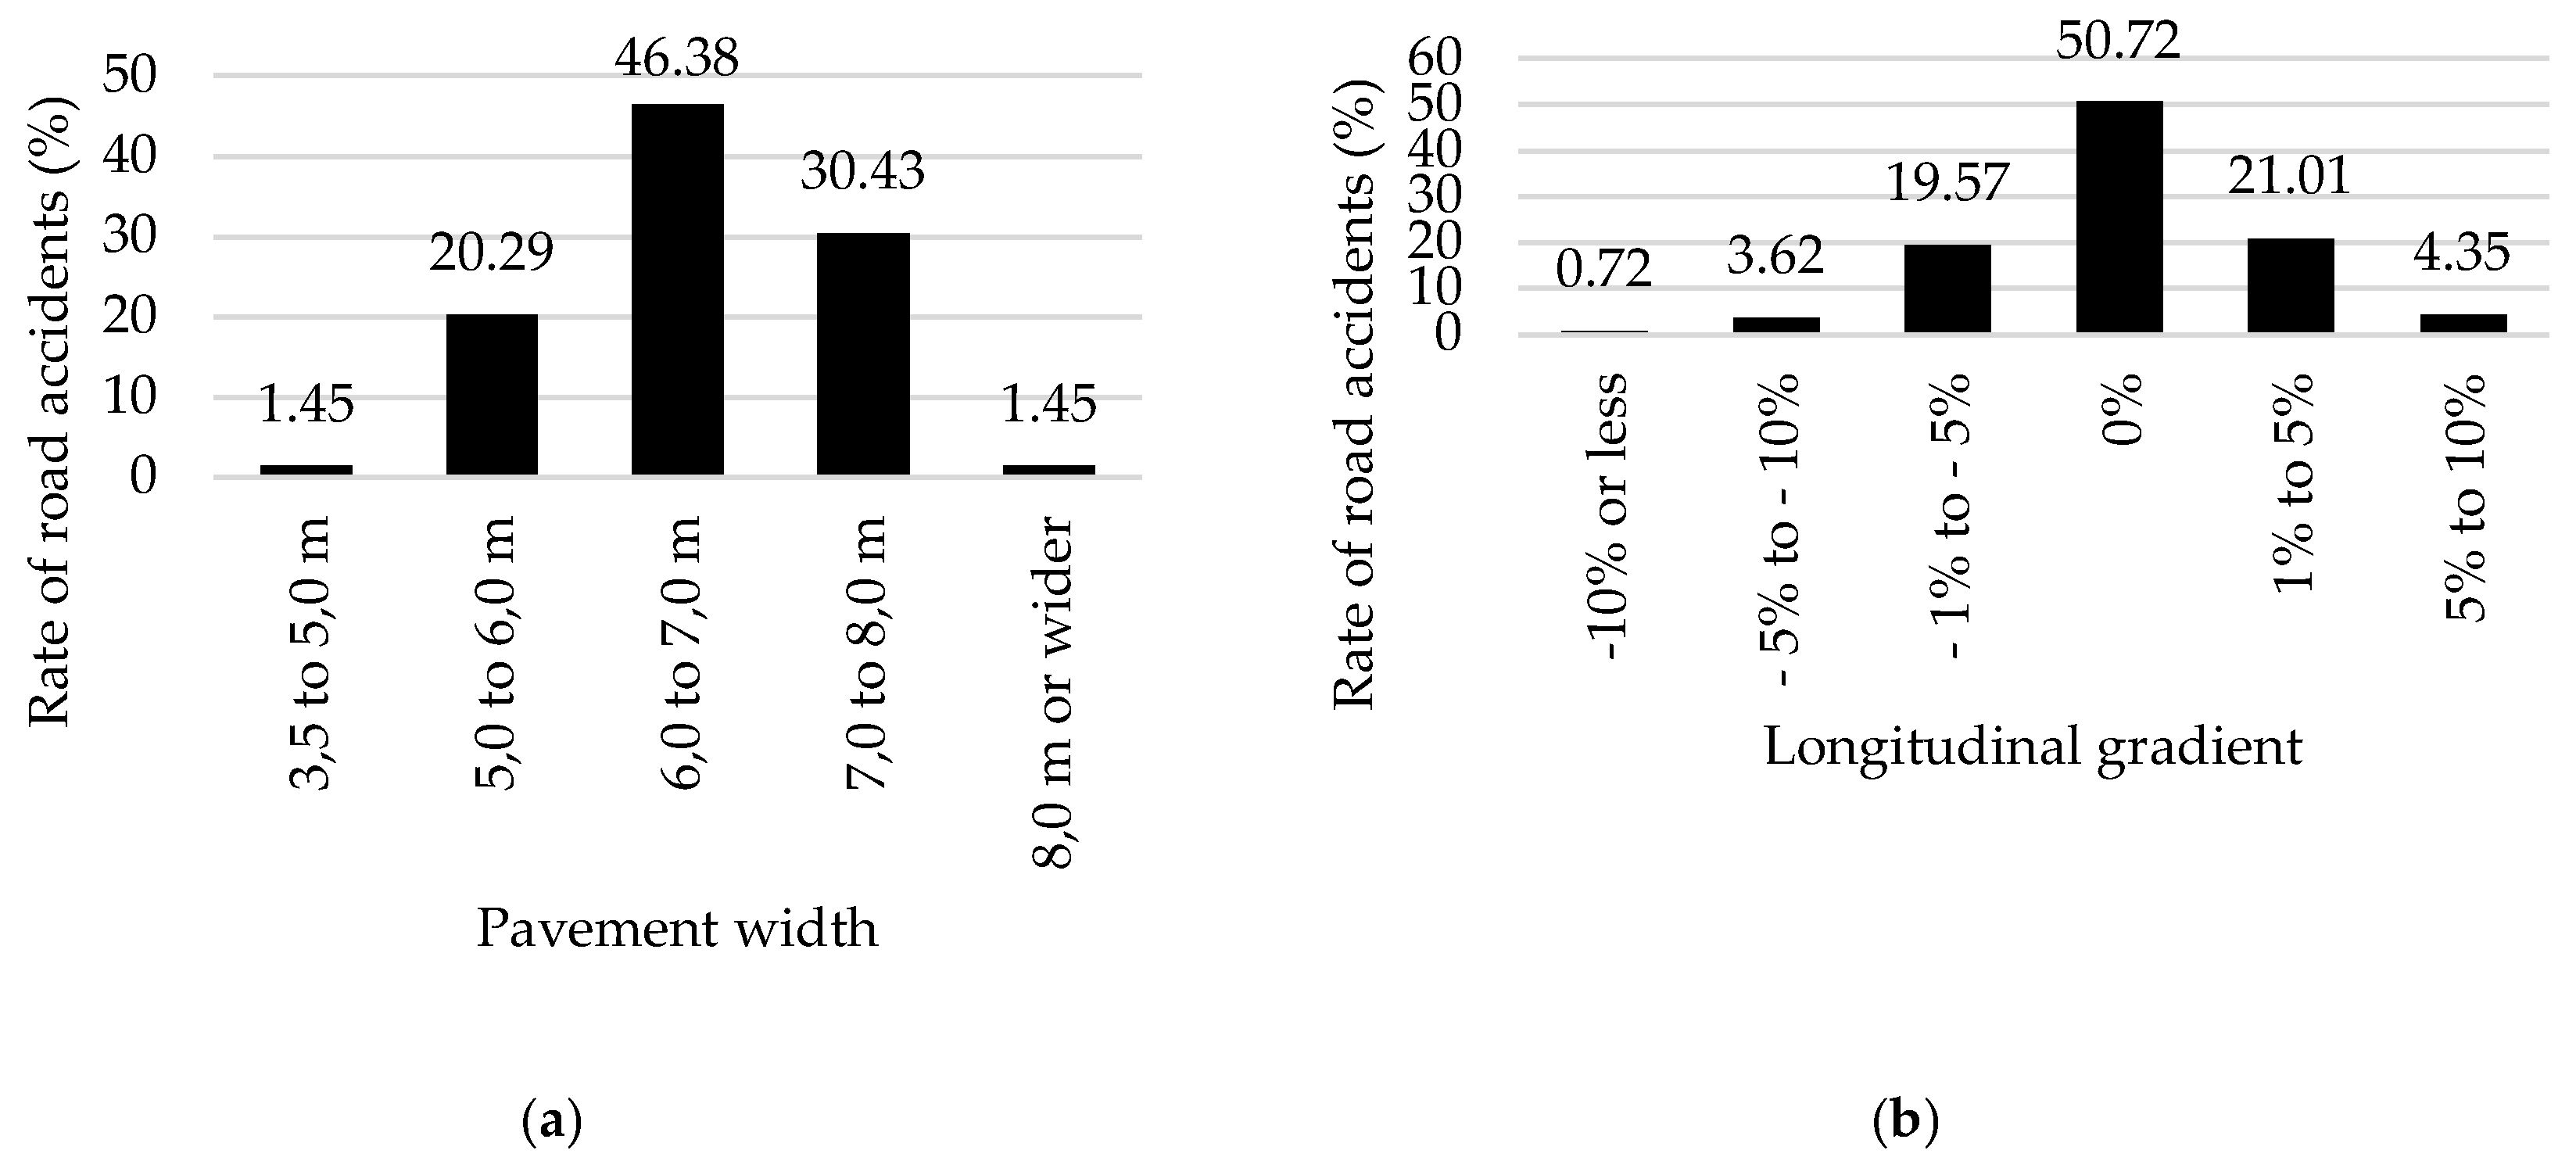
Figure 8a,b) that most of the accidents involving motorcyclists happen on roads with good lateral and longitudinal conditions: as a matter of fact, 46.38 % of the accidents happened on roads with a pavement width between 6 and 7 m, and with 0 % longitudinal gradient. This can be explained by a lack of motorcyclists' attention on these road segments, where the road conditions seem manageable. In addition, such conditions affect the choice of a higher speed, which is relatable to the previous results about the causes of the accidents.
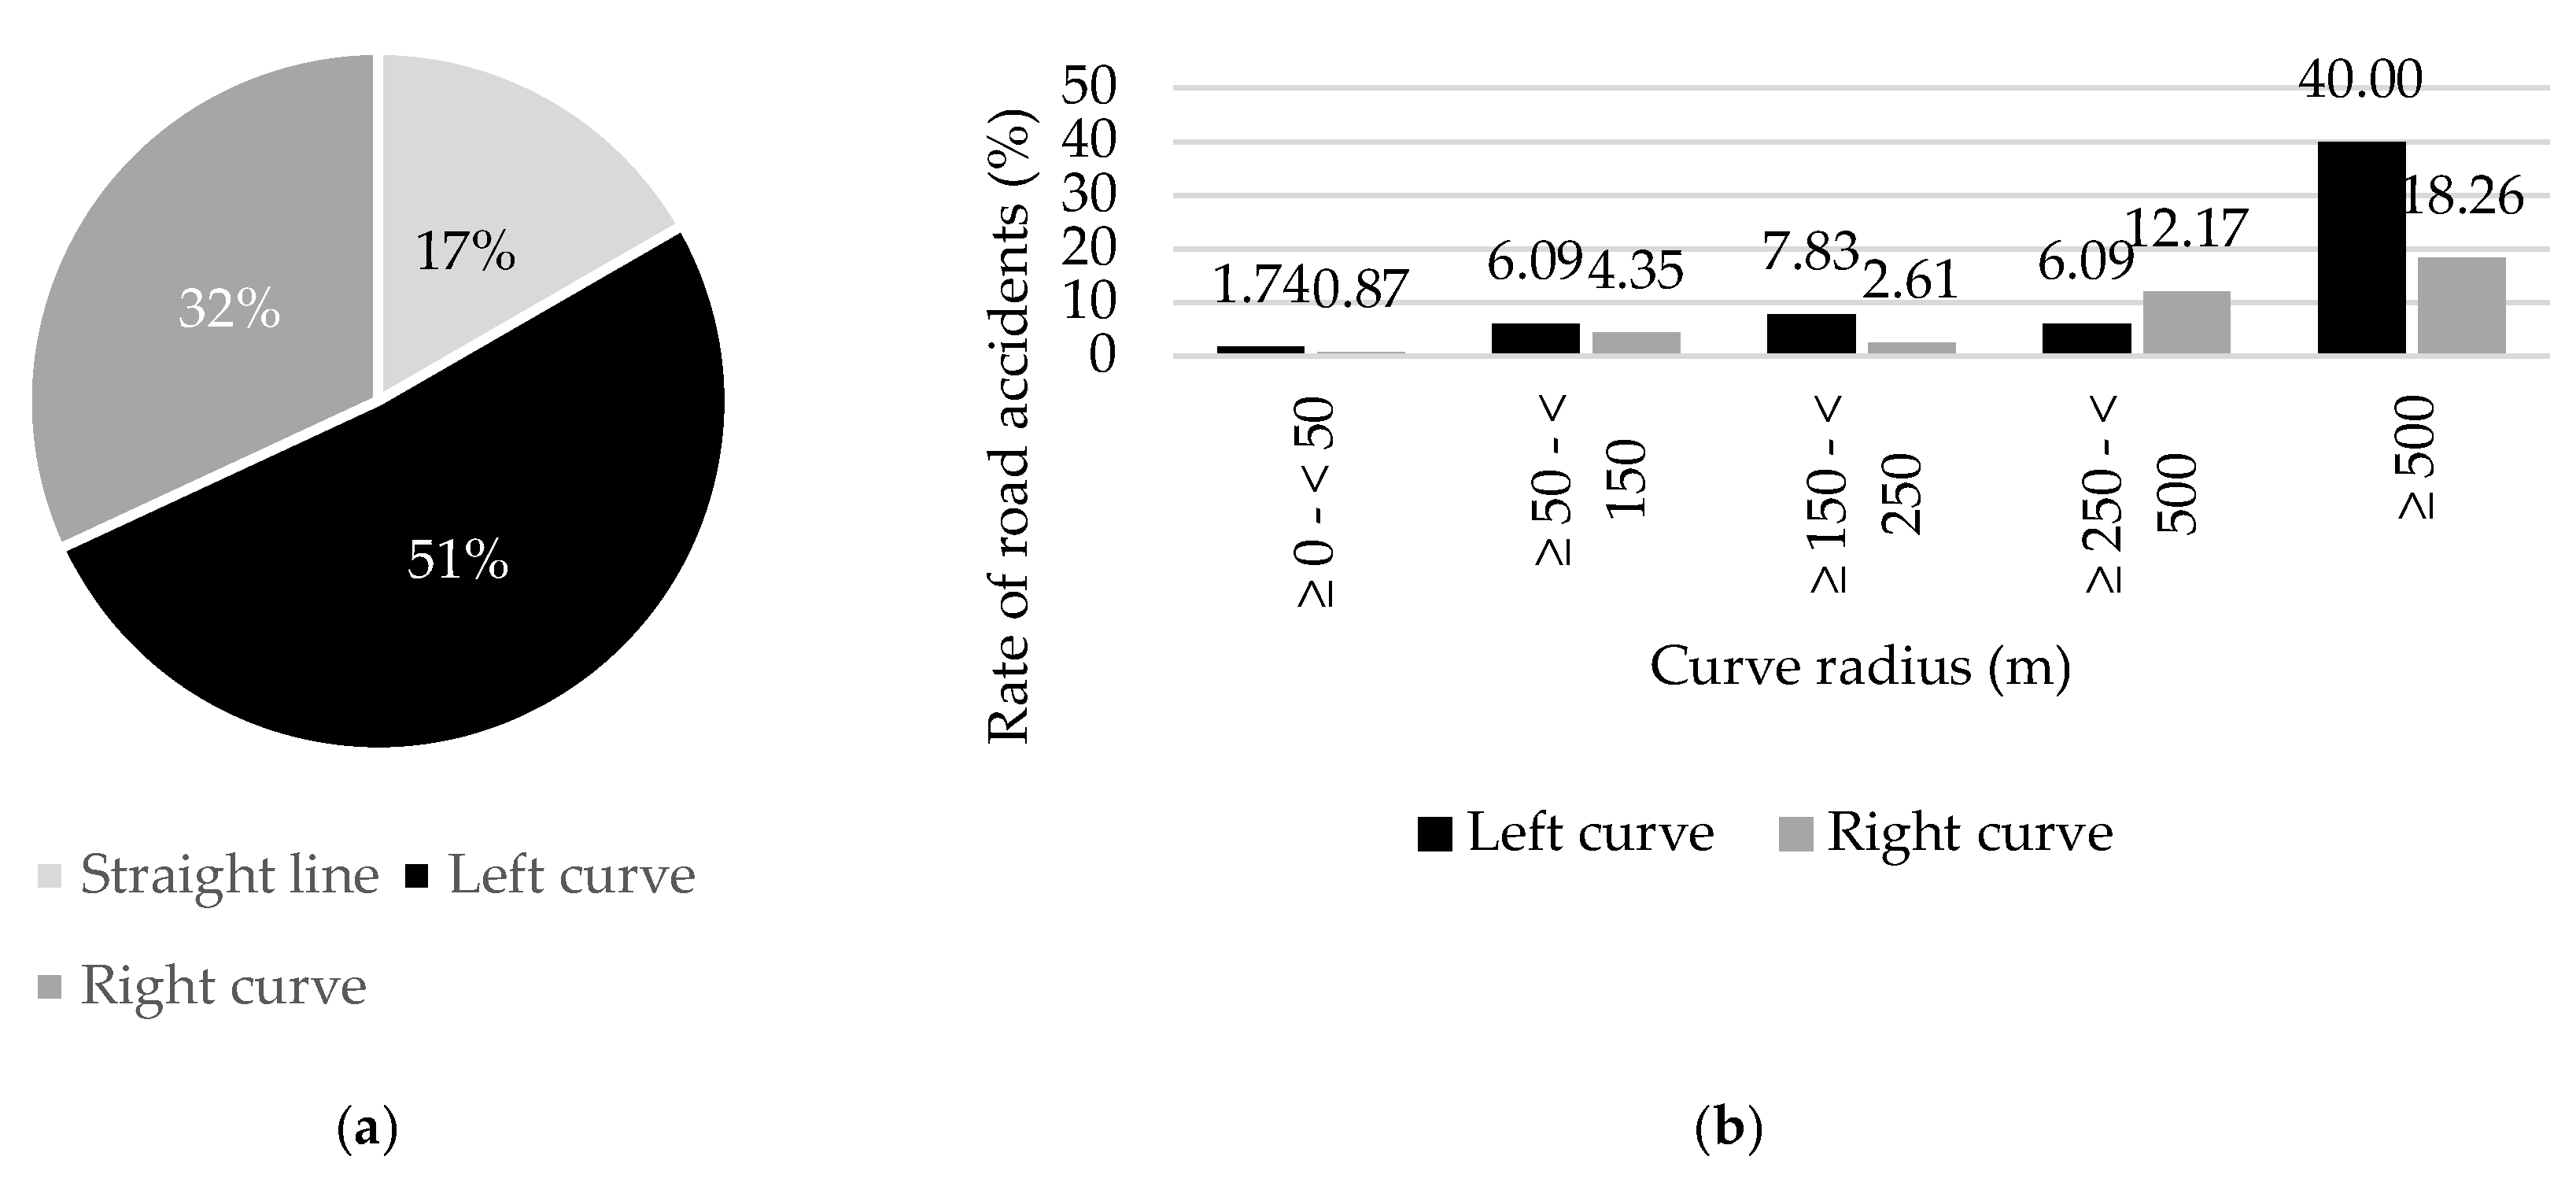
Focusing on the curve elements of the road, graphs in
Figure 9 a and b show that most of the accidents happened on left curves – 51 %, followed by right curves – 32 % and only 17 % of the considered accidents happened on straight road segments.
The radii of these curves are generally large, ≥ 500 m, both for the left and right-handed curves. This could be explained by the behaviour motorcyclists have to keep on curves, lean the vehicle and their body, and sometimes invade the lane in the opposite direction to be able to ride the curve (so-called “head-on” zone).
4.2. Analysis of Fatal Accidents Caused by Motorcyclists
In this section, the analysis focuses on 89 road accidents in which the motorcyclist was not only involved but also caused the accident. In addition, for this group of road accidents, the most tragic year was 2021 – with 13 road accidents, and the vast majority – 89.89 % – happened on non-urban roads, confirming previous results. As highlighted in the following subsections, some patterns can be recognised in each analysis performed for this study.
4.2.1. Cause and Type Of Road Accident
Once more, the most common cause of road accidents was unadjusted speed (
Figure 10). Nevertheless, it can be observed that this reason is followed by incorrect driving directions – 14.61 %, and incorrect overtaking – 12.36 %, instead of the disrespect of yielding rules, as was highlighted in the previous analysis. This fact highlights an issue in the behaviour motorcyclists keep, and that could be related to the infrastructural element they are riding on, e.g. the already mentioned lean angle they should keep on curves.
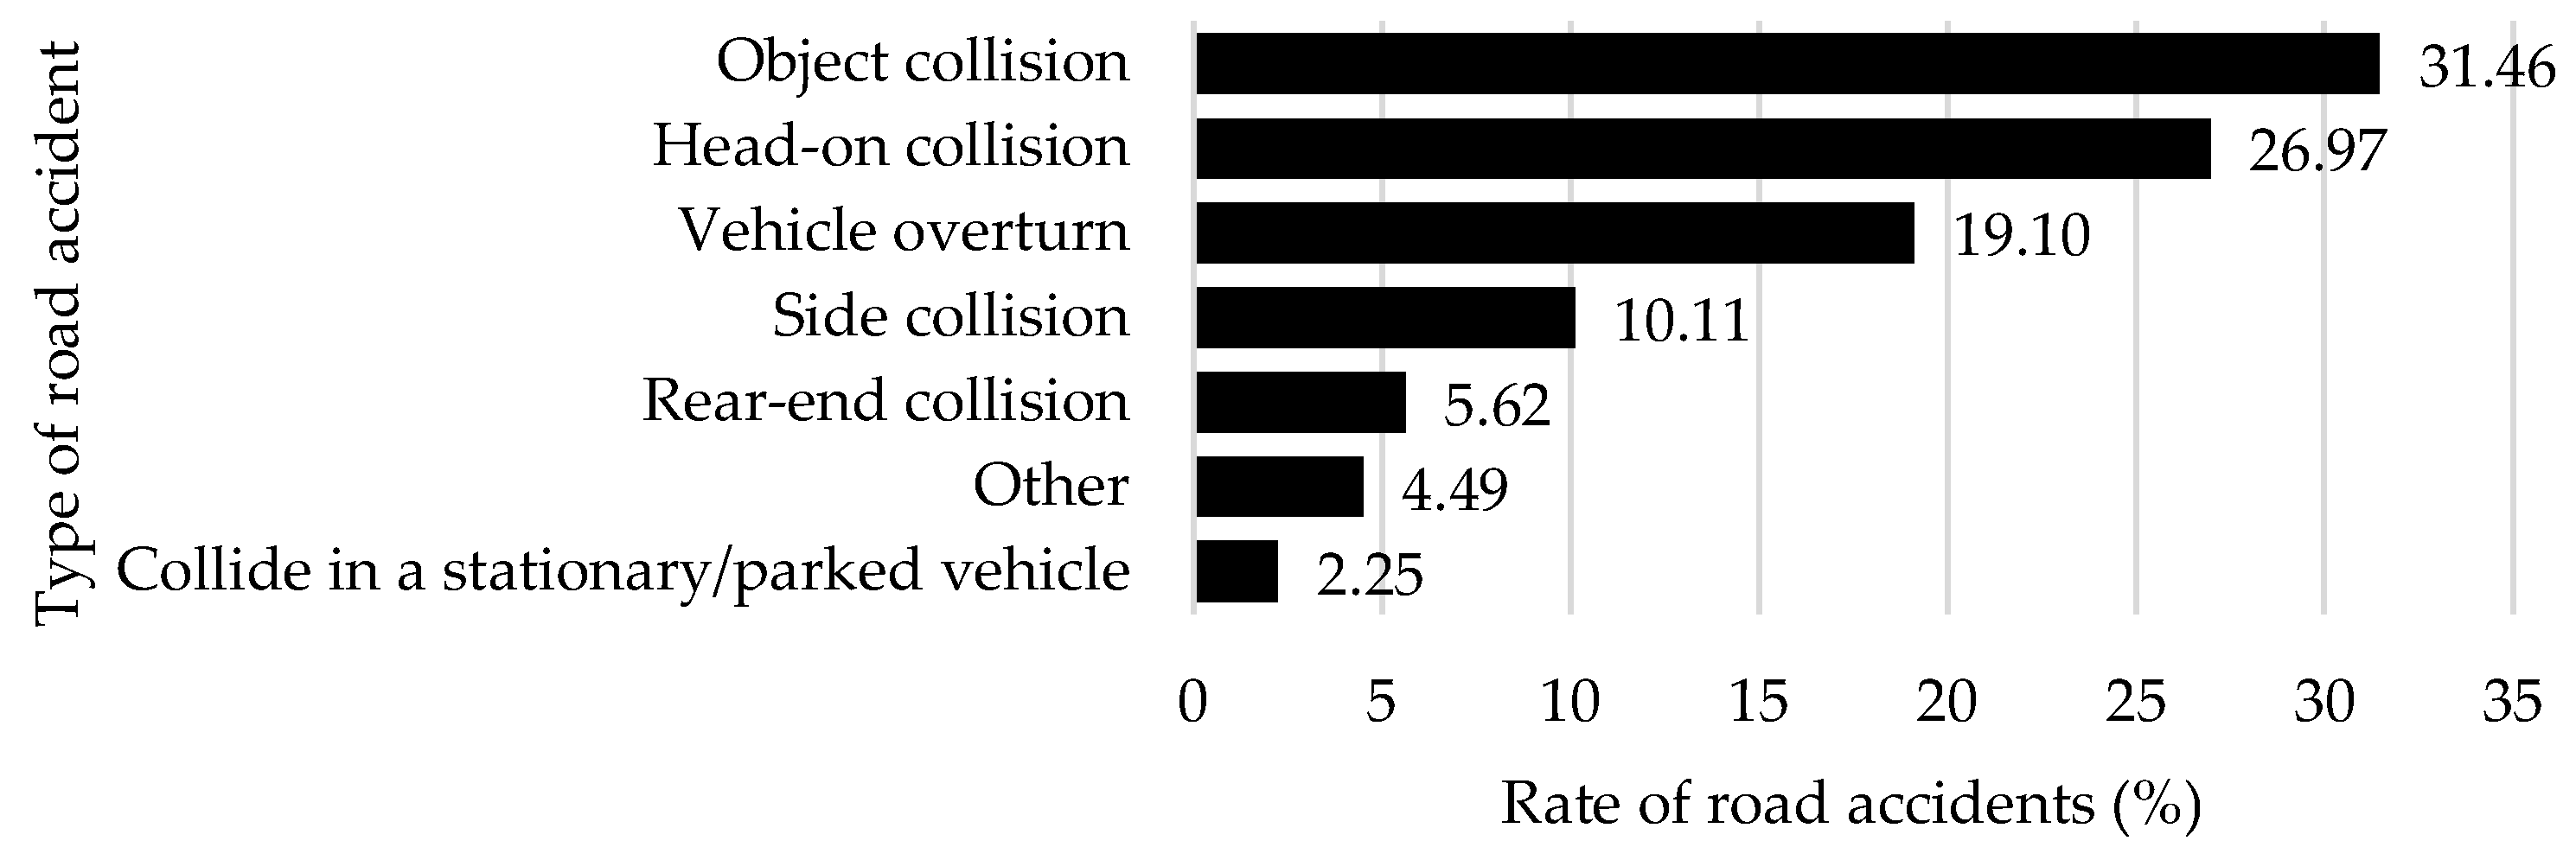
Interestingly, most accidents are a crash into an object or head-on collision, 31.46 % and 26.97 % of the road accidents, respectively, as shown in
Figure 11.
Of these accidents, in 46 % of the cases, the motorcyclist collided with a vehicle, while in 22 %, the motorcyclist veered off the road (run-off-road crashes).
4.2.2. Involved Road Users
When analysing the patterns of road users involved in accidents caused by a motorcyclist, it is interesting to notice that most of these accidents involve 1 or 2 road users (49.44 % and 30.34 %, respectively), highly decreasing when the number of participants increases (
Figure 12). This also explains the interest of this study in focusing on single-vehicle accidents.
The results related to the driving experience are slightly different from the previous analysis. As shown in
Figure 13, the motorcyclists causing the most accidents are novice riders (with less than 1 year of experience – 19.10 %). This rate is even higher than the rate of novice drivers causing a road accident (
Figure 13). This group is followed by riders with 5 to 10 years of experience and riders with 30 to 40 years of experience.
The age of the motorcyclists also confirms these results: respectively, in the age of 25-34, 45-54 and 55-64, as shown by the graph in
Figure 14.
4.2.3. Design Elements
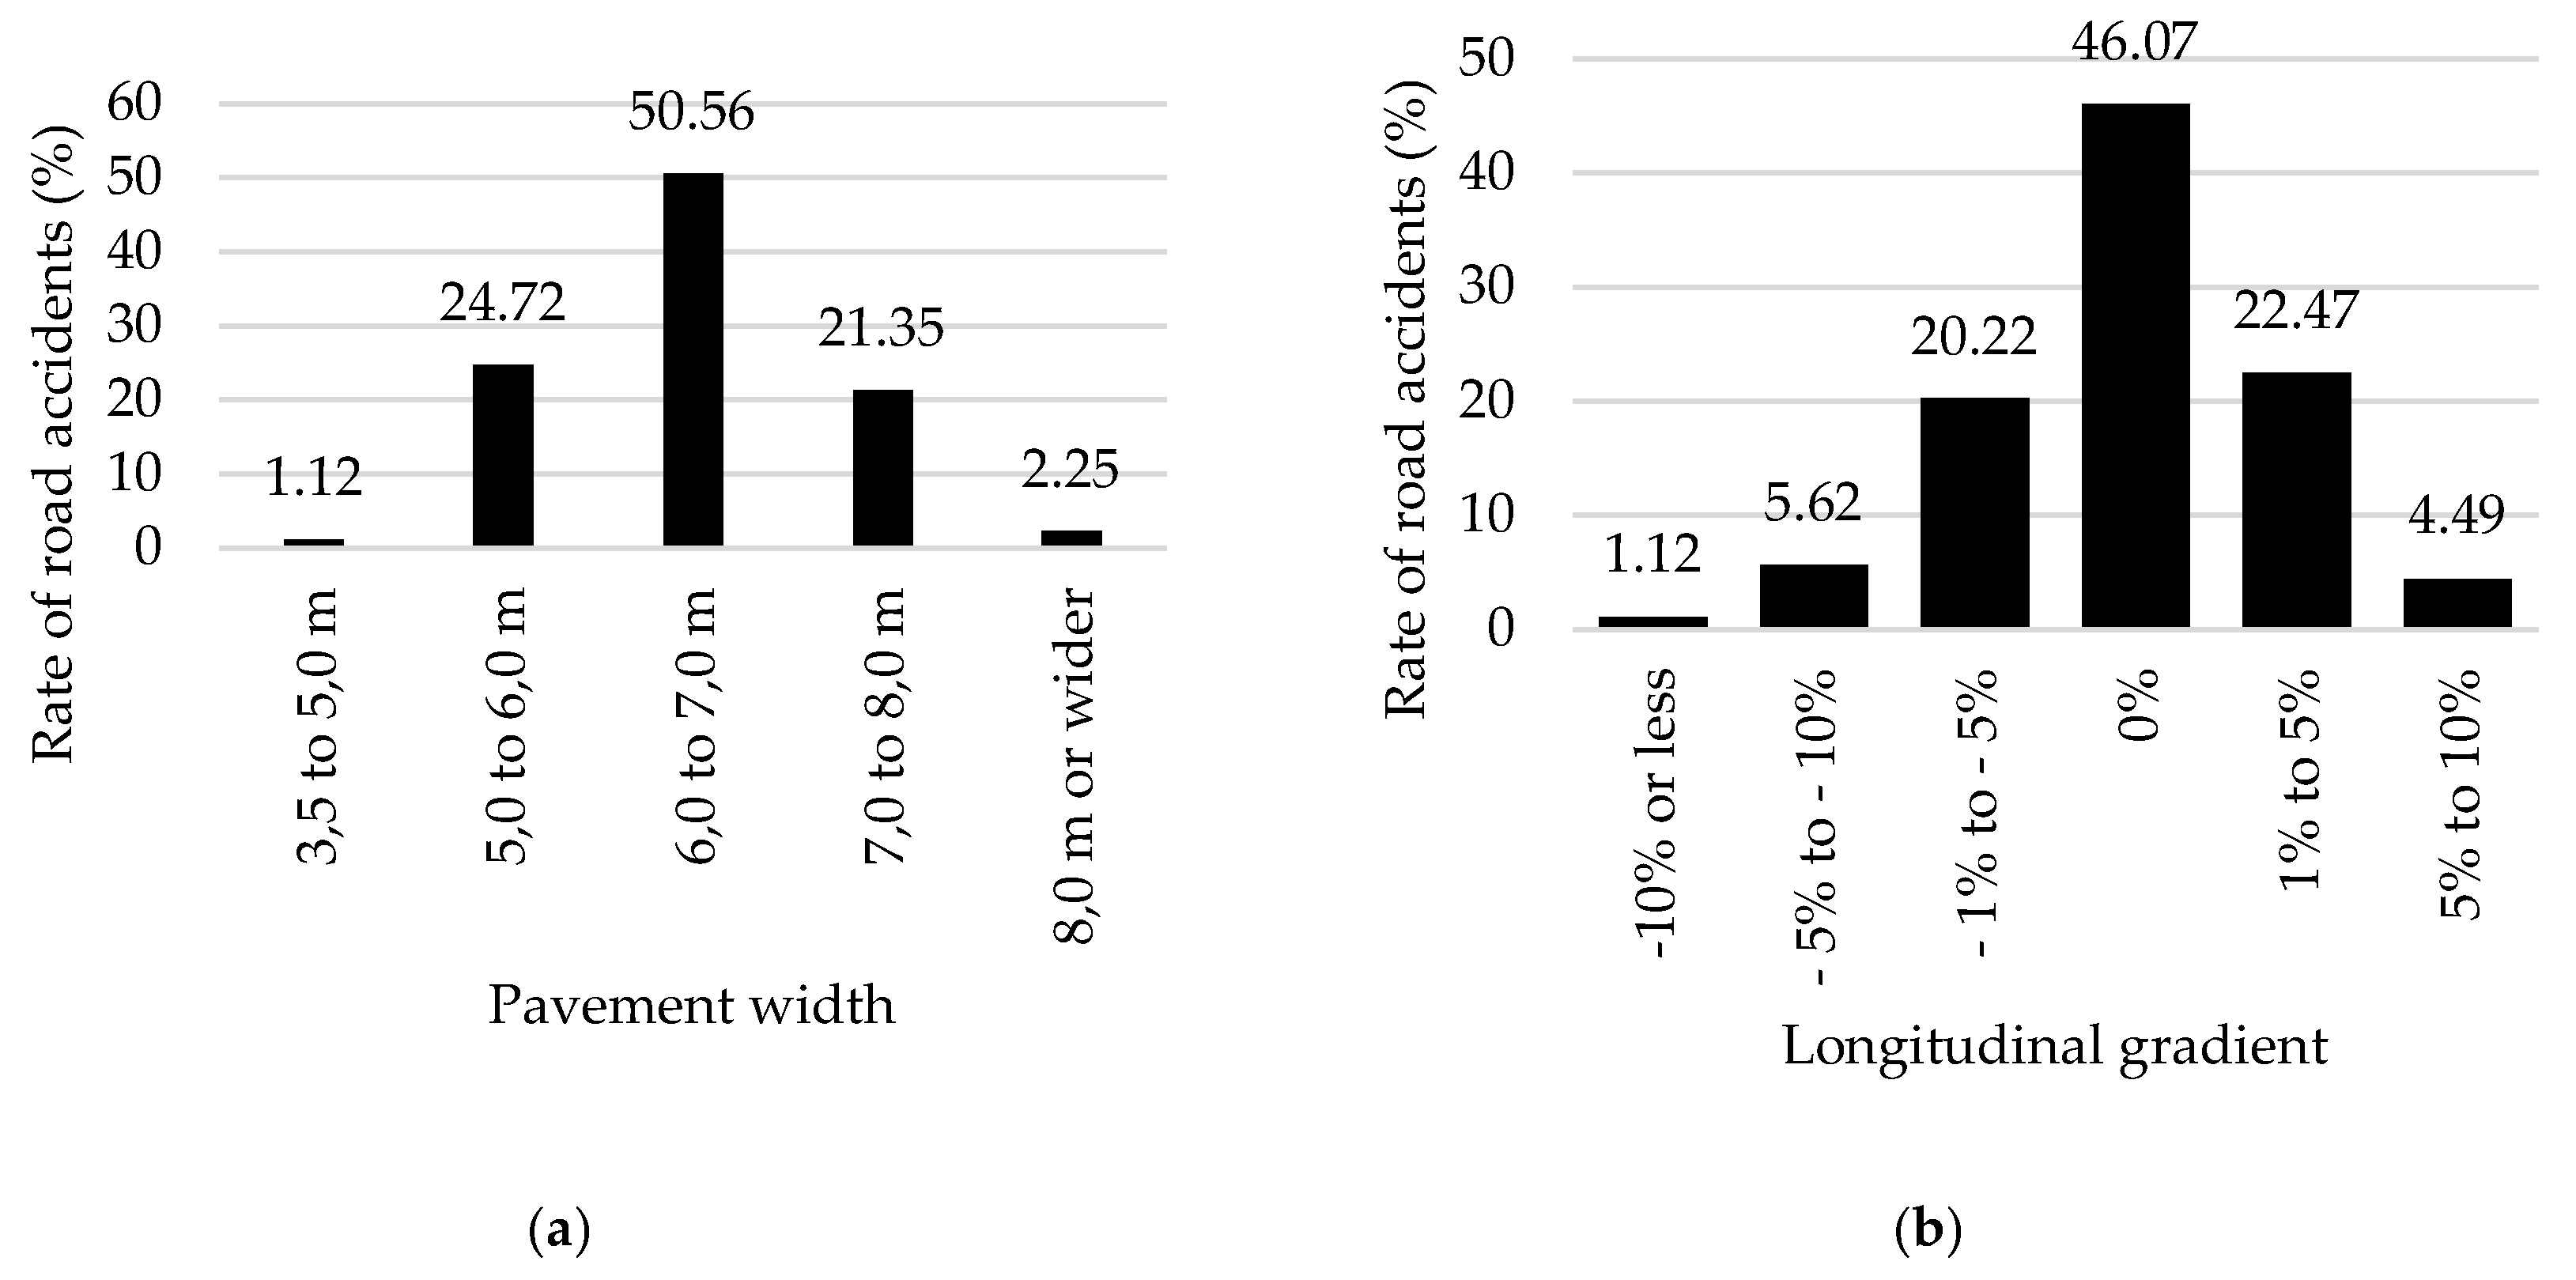
When analysing the longitudinal and lateral characteristics of the road, results like those obtained in the previous section are obtained. Most accidents happen on roads of appropriate width – 50.56 % of the accidents happen on a width between 6 and 7 m and with no longitudinal gradient – 46.07 %.
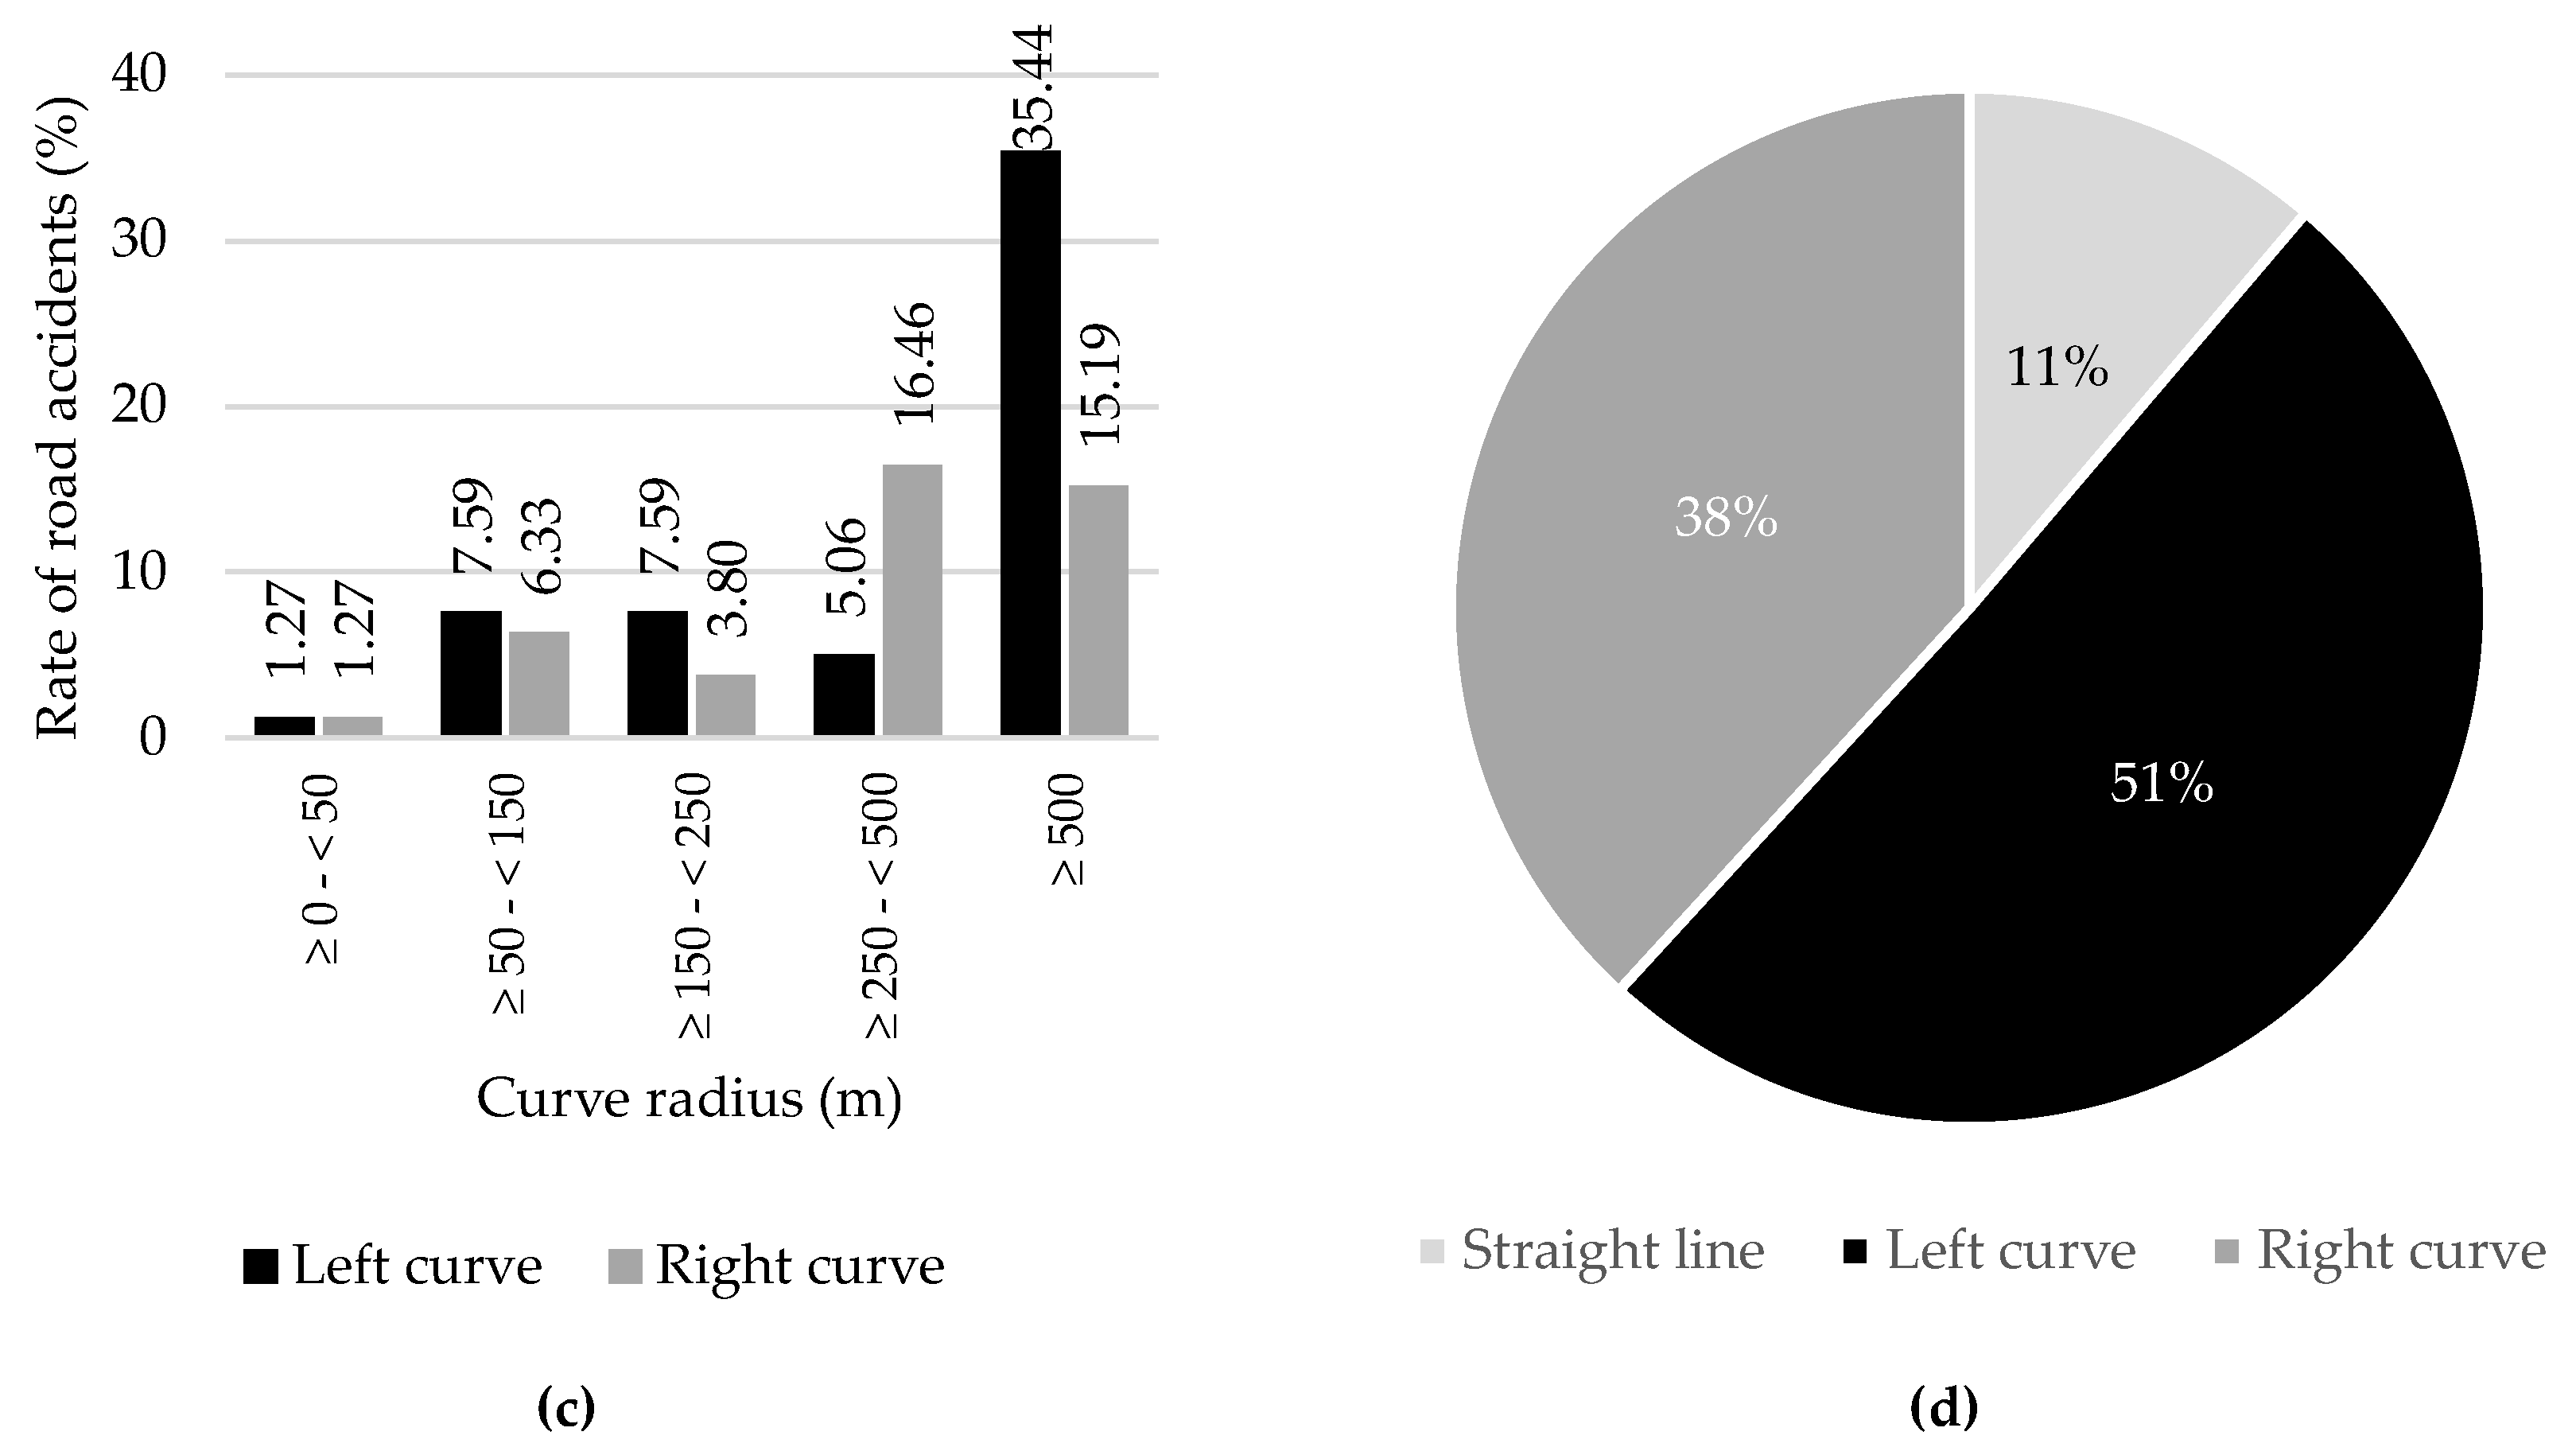
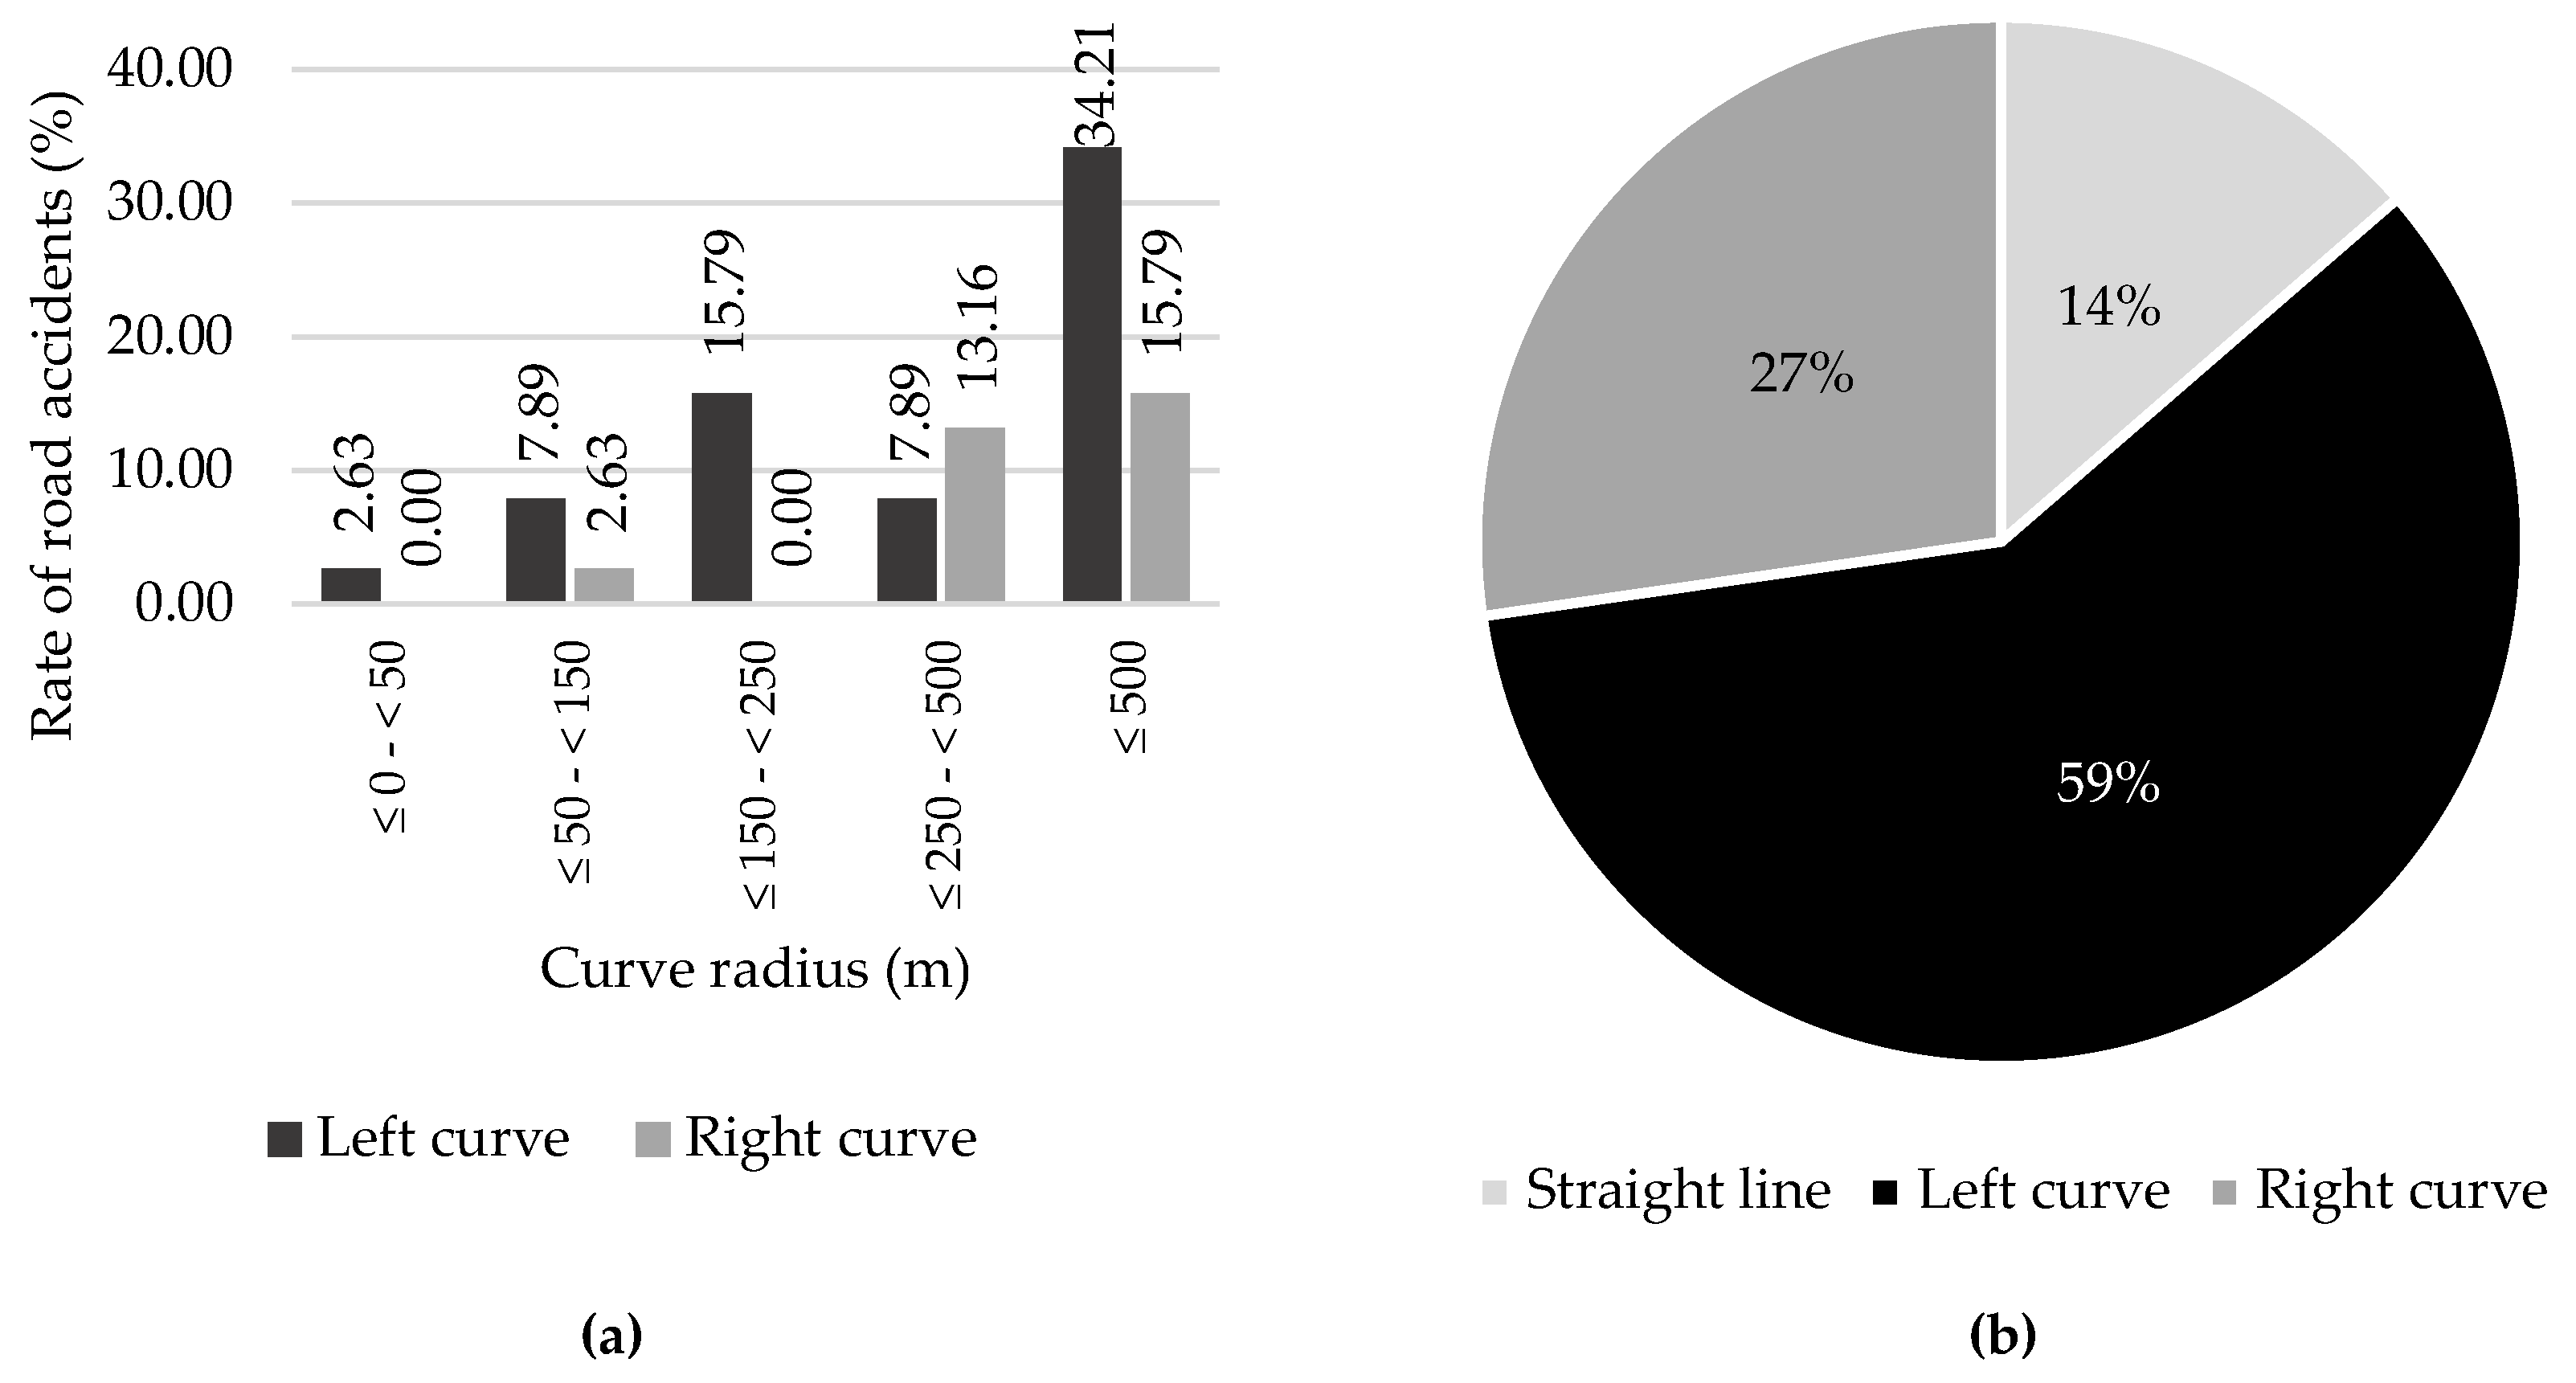
Similarly, left curves are the most dangerous – 51 % of road accidents, followed by right curves – 38 %, with large radiuses – more than 500 m. All these mentioned results are summarised in
Figure 15.
4.3. Analysis of Single-Vehicle Accidents
This section analyses the 44 single-vehicle accidents that happened in the 10-year period. Like the previously considered groups of accidents, in this case, the trend of accidents through the years shows a fall in 2020 – probably due to the COVID-19 restriction – and a peak in 2021. It is also confirmed that a significant % of single-vehicle accidents – 81.82 %, happen in non-urban areas.
4.3.1. Design Elements
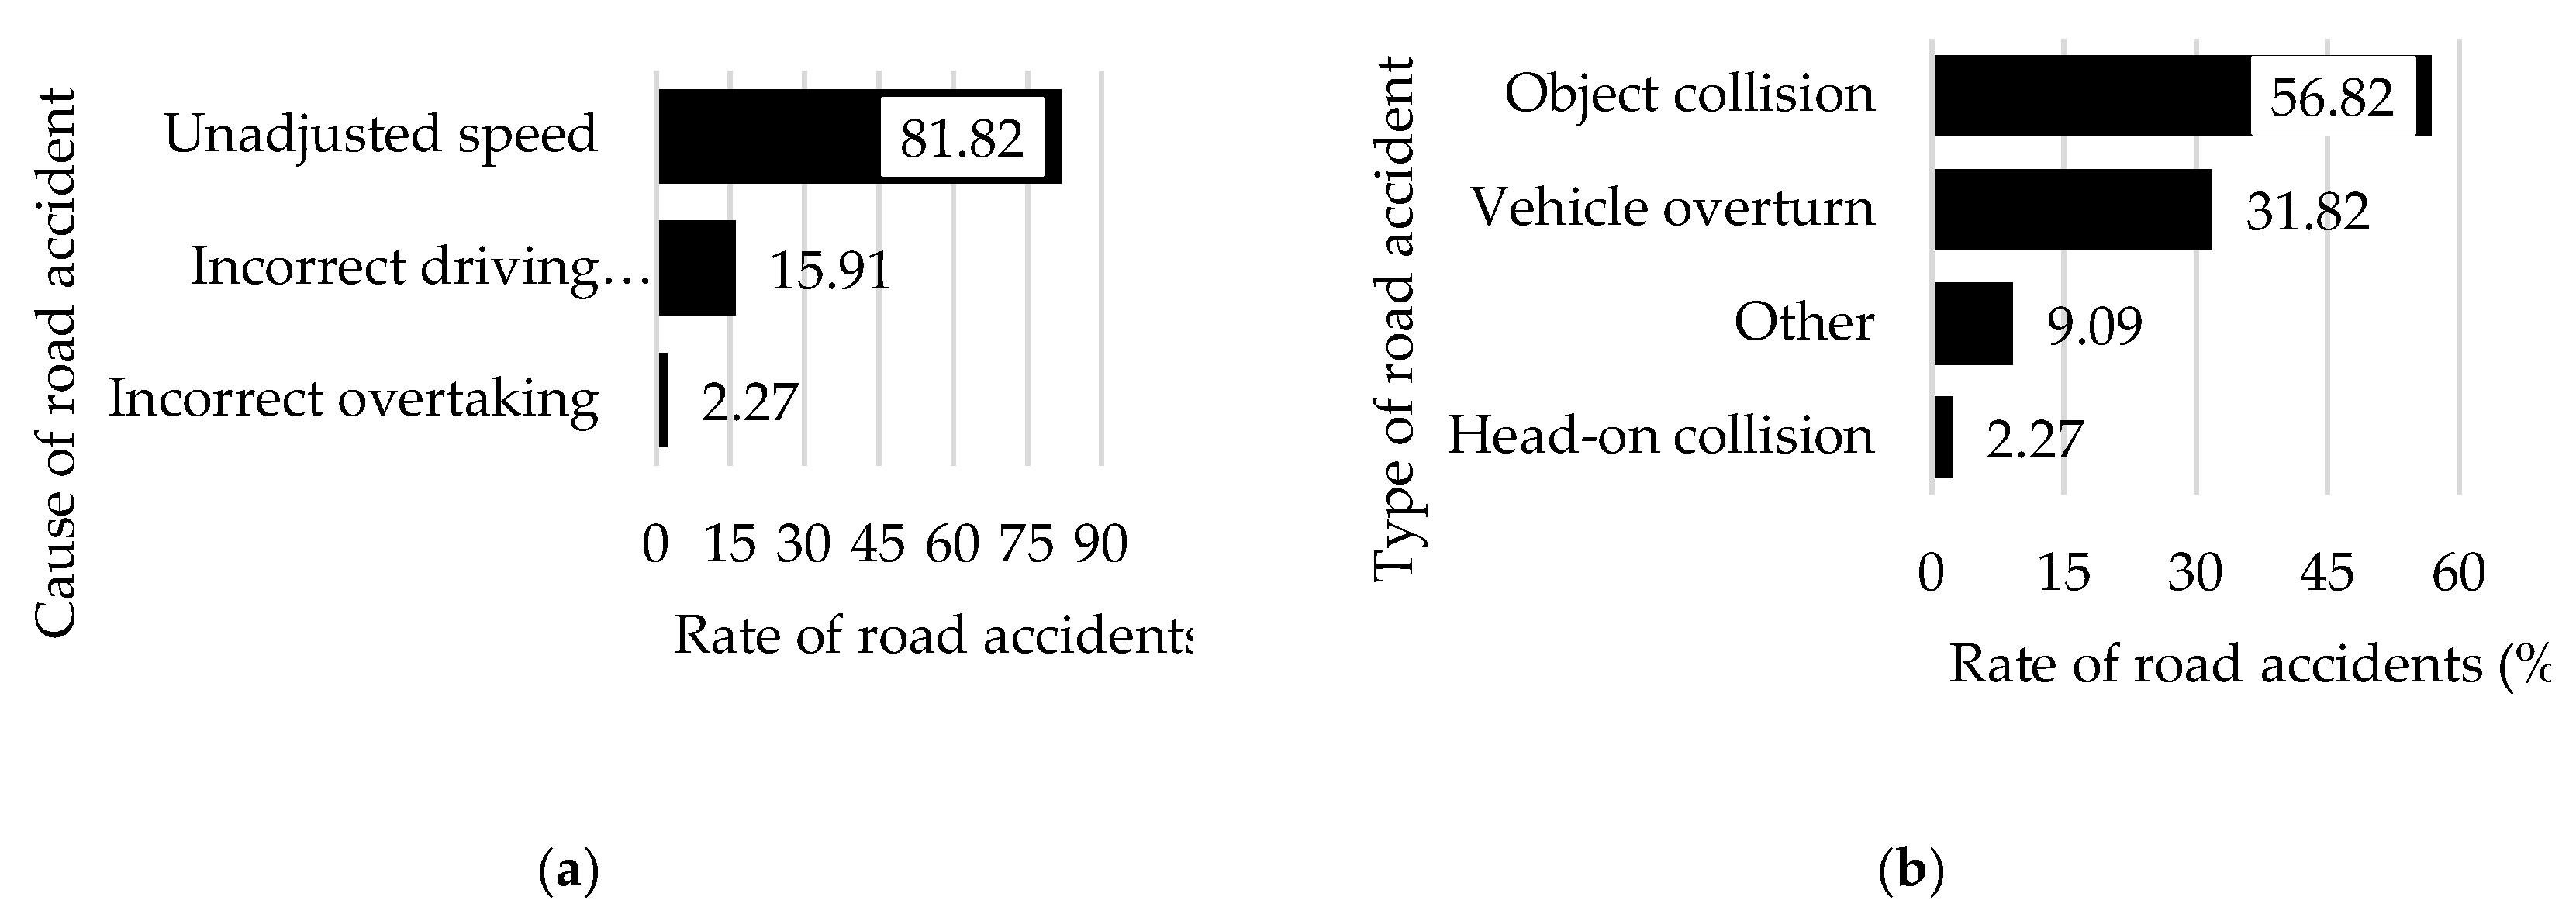
Also, for single-vehicle accidents, the most common cause leading to the accident is driving with unadjusted speed, followed by incorrect driving direction and incorrect overtaking (
Figure 16 a), resulting consequently in accidents involving the collision in an object (56.82 % of the accidents, or in the vehicle overturn – 31.82 % of the cases (
Figure 16 b).
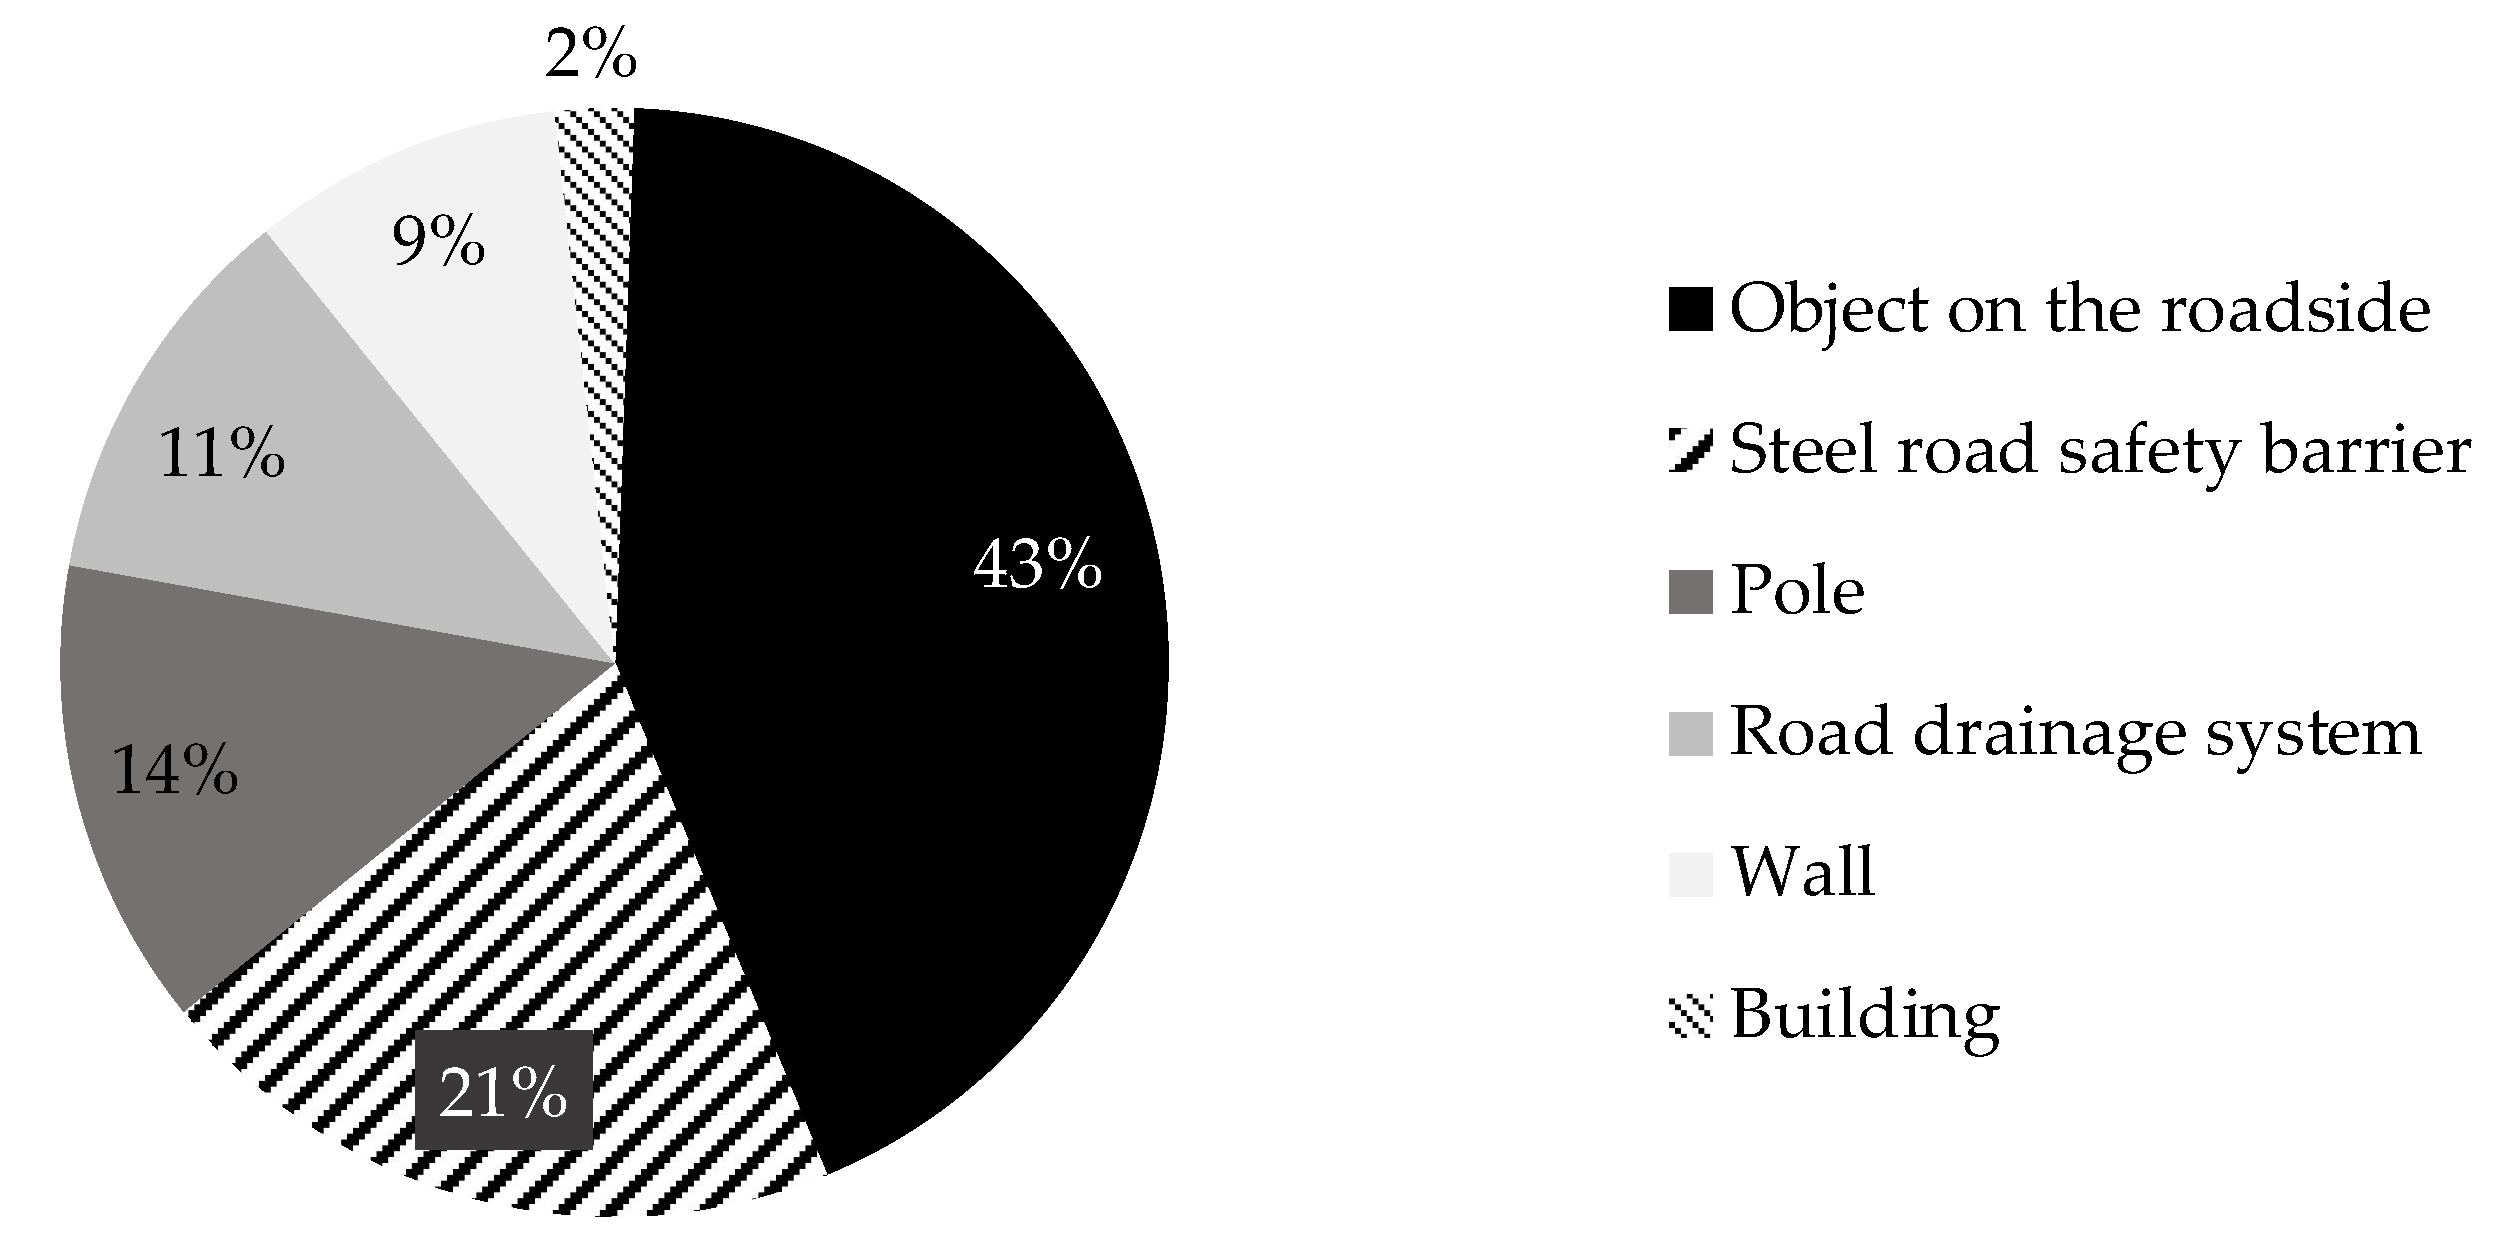
Deepening the analysis of single-vehicle accidents in an object, the graph in
Figure 17 shows that in 43 % of the cases, the motorcyclist collides with an object on the roadside – which, unfortunately, is not precisely defined in the database, followed by the steel road-safety barrier – 21 %, and a pole – 14 %, demonstrating that road equipment should still be improved – from the point of view of positioning, material and shape, to reduce the consequences of such accidents.
4.3.2. Involved Road Users
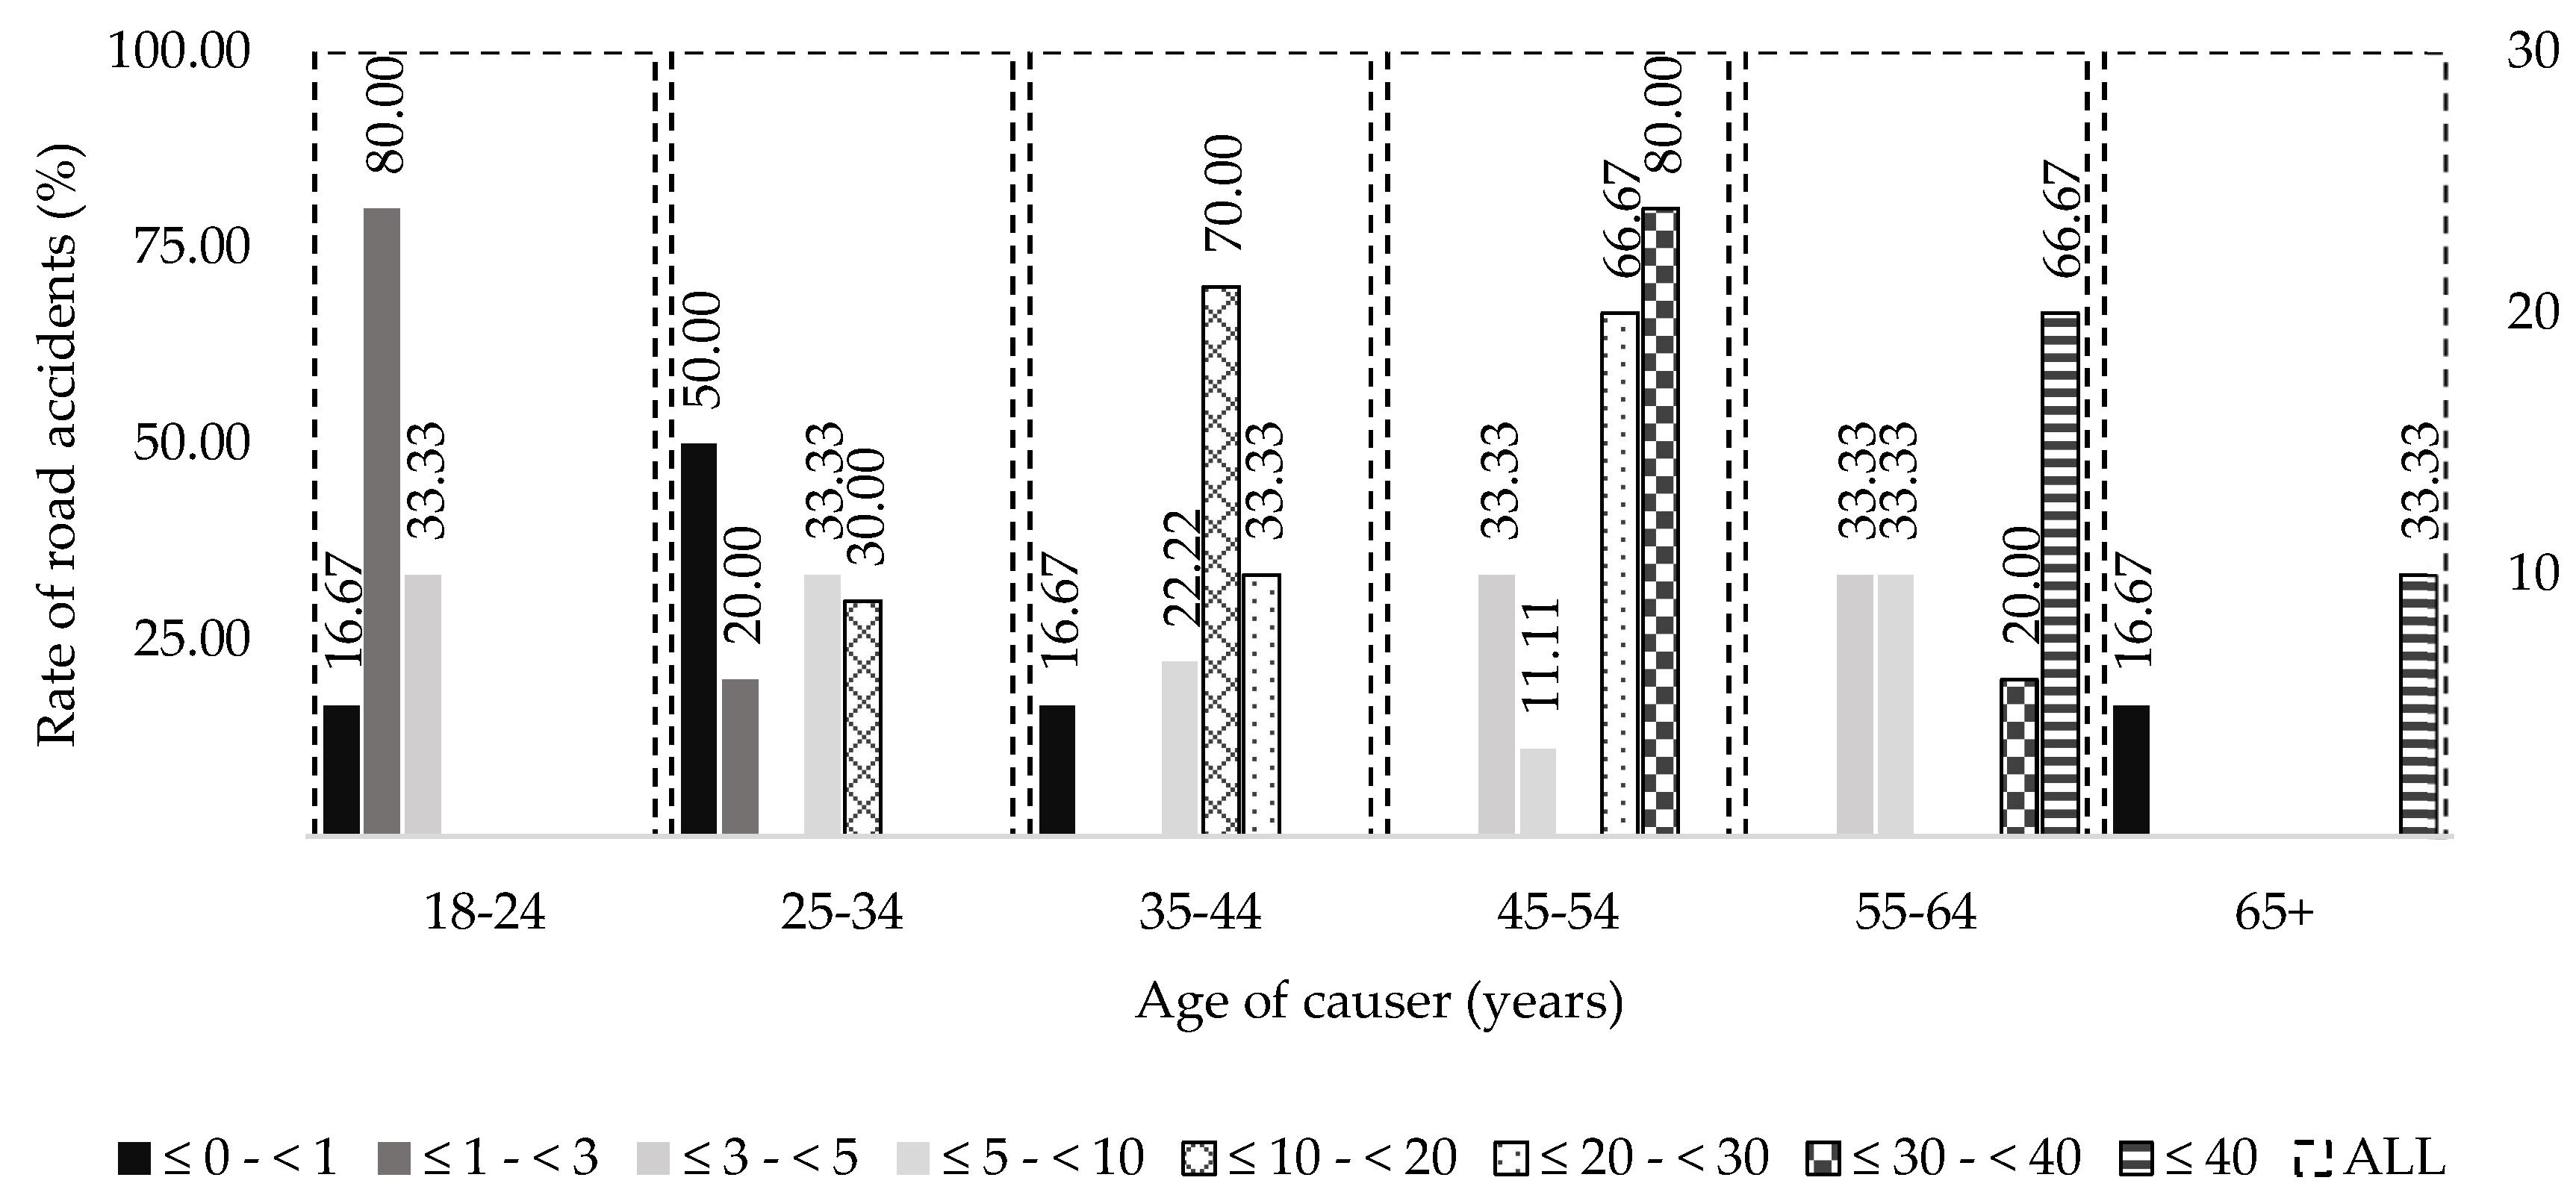
Considering the characteristics of the involved road user – so of the only involved motorcyclist – it can be noticed that there is a slight difference with the previous results: indeed, single-vehicle accidents generally happened to riders with 5 to 20 years of experience (43.18 % of the single-vehicle accidents) and belonging to an extended age group, from 25 to 54 years old. A deeper analysis of the age group revealed that 70% of motorcyclists who hold a driver's license for 10 to 20 years are aged 35 to 44.
4.3.3. Design Elements
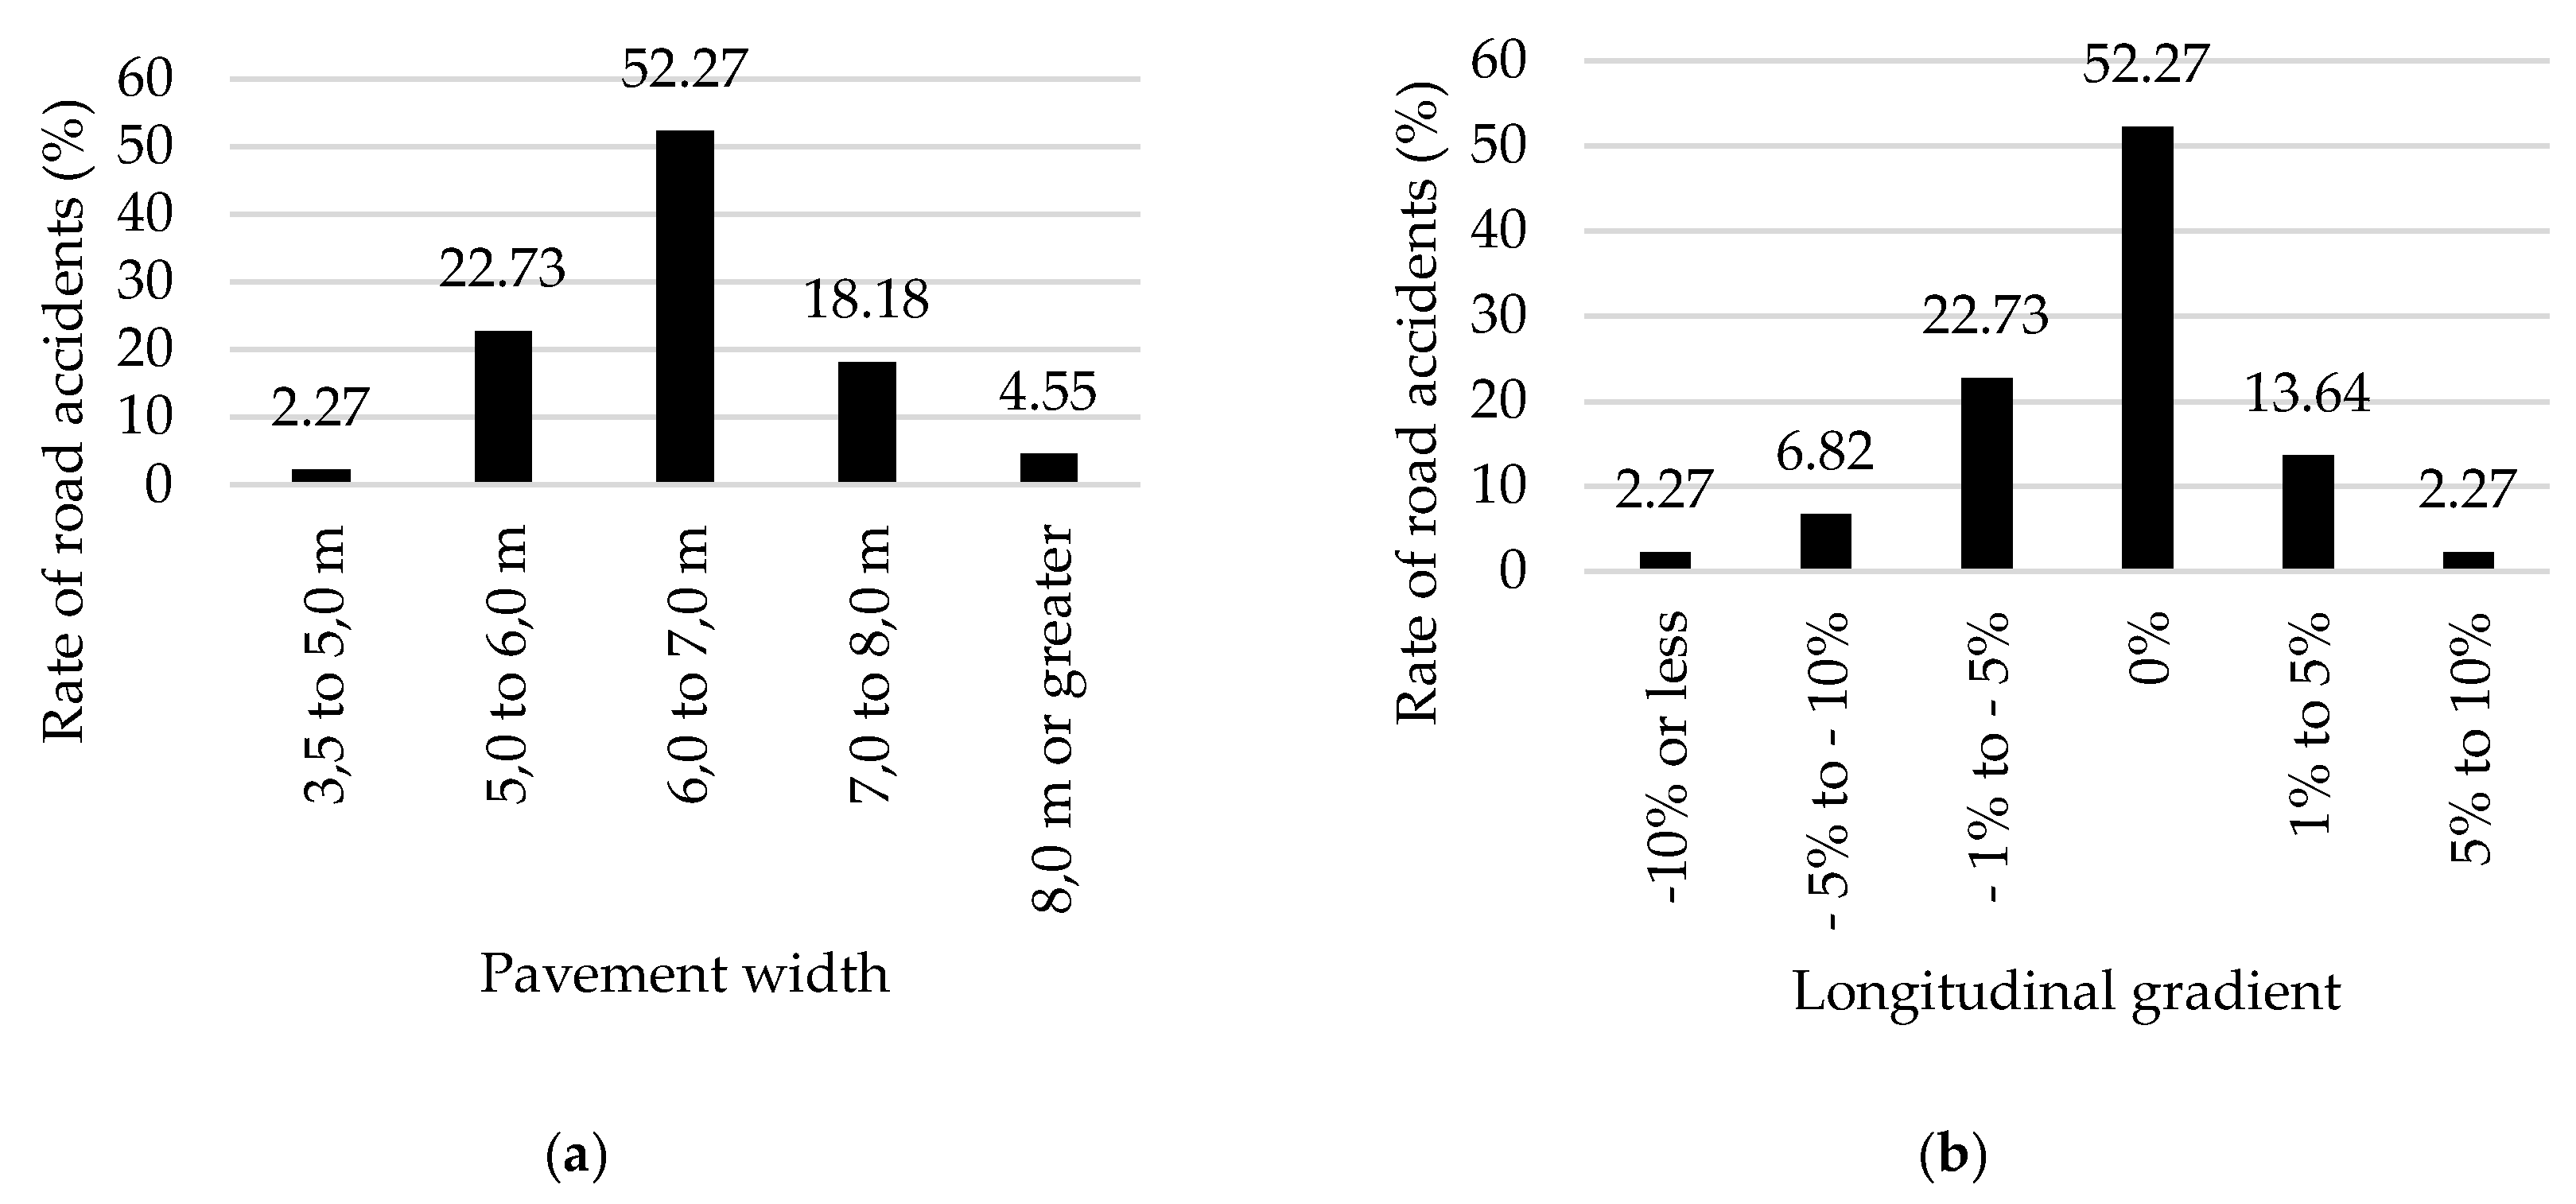
Like the previously analysed road accidents, in this case, most accidents happened on roads wide enough (6-7 m) and without any particular longitudinal slope. Left curves are the most problematic infrastructural elements, especially those with large radii (more than 500 m). These results are presented in
Figure 19 and
Figure 20.
4.4. Statistical Correlation Analysis
Previous sections have highlighted various factors characterising fatal road accidents involving motorcyclists. Nevertheless, these patterns were not always the same, as the analysis deepened and focused on single-vehicle accidents. This part of the study aims to determine if a statistical correlation exists between any of the considered factors and the motorcyclist being the cause of the accident.
To have a statistically valid sample of data, all fatal accidents were considered – 138, and an additional column with a binary indication of who was the causer was added. In this database, where the causer was the dependent variable, and all the other factors (see
Table 1) were the independent variables, a Spearmann rank order correlation (also known as Spearman's rho) analysis was developed. This analysis was chosen because it has fewer limitations compared to Pearson's correlation one, being able to analyse all monotonic relationships between continuous and ordinal variables, and it is much less sensitive to extreme values compared to Pearson's test. The analysis was worked out first by referring to all variables belonging to human factors, then to the infrastructure, and finally to external conditions. The results obtained for these analyses are matrices containing the values of Spearman's rho coefficient and the p-value for each couple of considered variables. A Spearman's rho coefficient that is highly different from zero indicates a positive or negative correlation between the two considered variables. In contrast, a p-value lower than 0.05 indicates that the previously stated correlation is also statistically significant.
Table 2,
Table 3 and
Table 4 report the results of the analysis.
Results show that there are seven factors statistically significantly correlated with the cause of fatal accidents: three of them belong to the human factors and are – age, driving experience and gender; one is part of the infrastructure, and specifically, its pavement width, while the last three belong to the external conditions, and are the type, cause and location of the accident on the road.
In addition, it can be noticed that all these factors are positively correlated with the dependent variable, while only three of them (pavement width, causes, and road location) are negatively related to the causer.
Finally, based on the values of Spearman's rho, the strength of the correlation can be commented on. It can be noticed that the strongest correlations are among human factors and the causer (over values of 0.700), followed by the type of accident (0.601 –
Table 4).
5. Discussion
The analyses worked out on the database of fatal road accidents with involved motorcyclists have highlighted some interesting common factors that can be useful in identifying measures to improve these road users' safety. Firstly, the two most common causes of fatal accidents are unadjusted speed and incorrect driving direction, especially when the motorcyclist is causing them. These causes highlight a problem in the behaviour of motorcyclists that should be tackled both in the early stages of the driving teaching activities and later with some additional training since – as it has been highlighted – many of the accidents have been caused by people with many years of riding experience. The most common types of road accidents are also closely related to the highlighted causes in all the worked-out analyses of head-on accidents and object collisions. Head-on collisions can be explained by the motorcyclist's incorrect driving direction, which generally tends to invade the opposite lane, especially when riding on curves. On the other side, object collision can be easily relatable to higher speed and the loss of control of the vehicle, suddenly riding off the road.
These hypotheses are also confirmed by the infrastructural elements leading to the majority of the accidents: if, on the one hand, segments with no longitudinal slope and enough pavement width have been stressed out, on the other hand, left-handed curves are the most dangerous for motorcyclists.
The statistical significance of the results obtained by the road accident analyses has also been confirmed by the correlation analysis, which highlighted the driving experience, age, type and cause and road location among the most influencing factors for fatal accidents with involved motorcyclists.
One way to prevent fatal accidents involving motorcyclists, or at least reduce their consequences, is to take additional infrastructural countermeasures. Two different types of countermeasures can be considered that can have a positive impact on motorcyclist safety. On the one hand, countermeasures that visually redirect motorcyclists unconsciously influence their position on the road. An example of these countermeasures is horizontally painted areas that increase the centreline between the two lanes, keeping motorcyclists away from the road axis (preventing head-on) and discouraging them from riding in the oncoming lane. On the other hand, measures relating to road equipment should also be considered, particularly concerning its positioning, material and shape. Motorcyclist-friendly safety barriers, passive safety bollards, crash cushions for motorcyclists, and breakaway devices are just a few examples of things that can positively impact the road safety of these road users.
6. Conclusions
Motorcyclist safety remains a significant problem in the European Union and other parts of the world. Although riding motorcycles has many advantages, there are also disadvantages, especially regarding road safety. The biggest safety issue with motorcycles is related to their physical characteristics: they are single-track vehicles with low weight and powerful engines that achieve higher acceleration and a higher top speed than most other vehicles. In addition, motorcyclists are not protected by a safety shell, and their balance is highly dependent on the rider’s skills [
23]. Furthermore, some aspects of road equipment that are perfectly safe for other road users can pose a significant risk to motorcyclists [
10]. For all these reasons, it is necessary to deepen the knowledge of the factors that cause fatal accidents involving motorcyclists: this would make it possible to propose appropriate countermeasures that could reduce the number or at least the consequences of road accidents involving these road users.
The present study aimed to shed light on the safety level of motorcyclists in Slovenia by analysing the latest traffic accident databases available at the national level to determine which factors influence the occurrence of fatal accidents involving motorcyclists. To conduct an accurate, up-to-date and comprehensive investigation, four complementary databases were merged and used as a starting point for this study. First, a three-stage general analysis of the data obtained was conducted: first, all fatal accidents involving motorcyclists were considered, then the data was limited to fatal accidents caused by a motorcyclist, and finally, the analysis was deepened to single-vehicle accidents. After that, a statistical analysis was developed to determine whether there is a correlation between the factors leading to the accident and the accident itself.
The results show that the majority of single-vehicle accidents (81.82%) occur outside urban areas, which is to be expected, as motorcyclists prefer roads with many curves and no intersections. The most common causes of this type of accident are excessive speed, wrong driving direction and incorrect overtaking, which subsequently leads to accidents involving the collision in an object (56.82%) or the vehicle overturns (31.82%). In 43% of the single-vehicle accidents analysed, the motorcyclist collided with an object on the roadside, followed by the steel safety barrier (21%) and a pole (14%). This demonstrates that roadside equipment should still be improved – in terms of positioning, material and shape - to reduce the consequences of such accidents.
Furthermore, the correlation analysis results show that seven factors statistically significantly correlated with the cause of fatal accidents: three belong to human factors, one is part of the road infrastructure, and the last three belong to external conditions.
Although the analysis developed gives an overview of the factors influencing fatal road accidents involving motorcyclists, it should be emphasised that it is limited to one severity level and that road accidents resulting in minor or severe injuries were not considered. This aspect could also be of interest, especially if it leads to understanding patterns associated with different levels of severity. Likewise, it would be interesting to analyse the behaviour of motorcyclists proactively, for example, by observing near misses on video recordings. This would make it possible to understand the process leading to near misses that could later turn into accidents.
Acknowledgements
This research was partially supported by the Slovenian Research Agency “ARIS” in the framework of the Research Program “Development, modelling and Optimization of Structures and Processes in Civil Engineering and Traffic P2-0129 (A)”.
References
- European Commission. European Road Safety Observatory – Road Safety Thematic Report – Motorcycles. Available online: https://road-safety.transport.ec.europa.eu/document/download/d2a20766-5e34-4eb1-8188-9e21a4d86727_en?filename=Road_Safety_Thematic_Report_Motorcycles_2023.pdf (accessed on 14 November 2024).
- Teoh, E. R.; Campbell, M. Role of motorcycle type in fatal motorcycle crashes. Journal of Safety Research 2010, 41, 507–512. [Google Scholar] [CrossRef] [PubMed]
- OECD/ITF. Improving Safety for Motorcycle, Scooter and Moped Riders; ITF Research Reports; OECD Publishing: Paris, 2015. [Google Scholar] [CrossRef]
- Lin, M. R.; Kraus, J. F. A review of risk factors and patterns of motorcycle injuries. Accident Analysis & Prevention 2009, 41(4), 710–722. [Google Scholar]
- ETSC. Reducing road deaths among powered two wheeler users (PIN Flash Report 44). Available online: https://etsc.eu/wp-content/uploads/ETSC_PINFLASH_44-digital.pdf (accessed on 14 November 2024).
- Haworth, N.; Rowden, P. Motorcycling safety in the global south: Challenges and opportunities. Accident Analysis & Prevention 2017, 103, 79–87. [Google Scholar]
- Savino, G.; Pierini, M.; Rizzi, M.; Frampton, R. Evaluation of an advanced motorcycle braking system for PTW safety improvement. Accident Analysis & Prevention 2013, 50, 274–282. [Google Scholar]
- Yannis, G.; Papantoniou, P.; Folla, K. Effect of road safety measures on serious injuries and fatalities in Europe. Accident Analysis & Prevention 2017, 100, 169–179. [Google Scholar]
- Tollazzi, T.; Moharić, M.; Gruden, C. A Preliminary Assessment of Rider/Driver Gaze Behaviour in Slovenian Urban Areas. Sustainability 2022, 14, 2056. [Google Scholar] [CrossRef]
- Tollazzi, T. Key components of motorcyclists’ safety: motorcycle - rider – environment; Generis Publishing, 2020. [Google Scholar]
- Clarke, D. D.; Ward, P.; Bartle, C.; Truman, W. In-depth Study of Motorcycle Accidents. 2004. Available online: https://smarter-usa.org/wp-content/uploads/2017/06/5.-in-depth-study-of-motorcycle-accidents-uk.pdf (accessed on 14 November 2024).
- Clabaux, N.; Brenac, T.; Perrin, C.; Magnin, J.; Canu, B.; Van Elslande, P. Motorcyclists’ speed and “looked-but-failed-to-see” accidents. Accident Analysis & Prevention 2012, 49, 73–77. [Google Scholar] [CrossRef]
- Crundall, D.; Clarke, D.; Stedmon, A. The role of motorcycle conspicuity in road traffic collisions. Ergonomics 2008, 51(8), 1164–1172. [Google Scholar]
- Jafari, M.; Starewich, M.; Hossain, A.; Barua, S.; Das, S. Motorcyclist Injury Severity on Curved Segments: Temporal Variations & Unobserved Heterogeneity. Available online: https://papers.ssrn.com/sol3/papers.cfm?abstract_id=4998398 (accessed on 14 November 2024).
- Tmejová, T.; Zůvala, R.; Bucsuházy, K. In-depth Crash Causation Analysis of Motorcyclist Crashes. Available online: https://www.scitepress.org/Papers/2022/110338/110338.pdf (accessed on 14 November 2024).
- Wu, K.; Liu, X.; Zhang, L. Road geometry and motorcycle accident risk: A review of global trends. Journal of Transportation Safety & Security 2019, 11(4), 391–405. [Google Scholar]
- Boufous, S.; de Rome, L.; Senserrick, T.; Ivers, R. Single-vehicle crashes: Why are they more common among younger motorcyclists? Traffic Injury Prevention 2017, 18(1), 31–36. [Google Scholar]
- Bella, F.; Gulisan, F.; Gagliardi, V. Safety analysis of motorcyclists’ overtaking maneuvers. Accident Analysis & Prevention 2024, 208. [Google Scholar] [CrossRef]
- Mulvihill, C.; McLaughlin, M. The impact of lateral clearance on motorcycle crash outcomes during overtaking maneuvers. Transportation Research Record 2020, 2674(6), 523–531. [Google Scholar]
- Šraml, M.; Tollazzi, T.; Renčelj, M. Traffic safety analysis of powered two-wheelers (PTWs) in Slovenia. Accident Analysis & Prevention 2024, 49. [Google Scholar] [CrossRef]
- Renčelj, M.; Tollazzi, T.; Turnšek, S.; Šraml, M. Measures for Improving Powered Two-Wheelers Riders’ Traffic Safety on Slovenian Roads. Procedia - Social and Behavioral Sciences 2012, 53, 645–654. [Google Scholar] [CrossRef]
- Høye, A. The effectiveness of road safety measures: A meta-analysis of studies on motorcycle safety interventions. Accident Analysis & Prevention 2021, 156. [Google Scholar] [CrossRef]
- Ferko, M.; Babić, D.; Babić, D.; Pirdavani, A.; Ševrović, M.; Jakovljević, M.; Luburić, G. Influence of Road Safety Barriers on the Severity of Motorcyclist Injuries in Horizontal Curves. Sustainability 2022, 14, 14790. [Google Scholar] [CrossRef]
Figure 1.
Four-step procedure to obtain the merged database of road accidents and technical data used in further analysis.
Figure 1.
Four-step procedure to obtain the merged database of road accidents and technical data used in further analysis.
Figure 2.
Scheme of the developed analyses.
Figure 2.
Scheme of the developed analyses.
Figure 3.
The trend of fatal road accidents involving motorcyclists happened in the 10-year period from 2013 to 2022.
Figure 3.
The trend of fatal road accidents involving motorcyclists happened in the 10-year period from 2013 to 2022.
Figure 4.
Rates of road accidents concerning their cause
Figure 4.
Rates of road accidents concerning their cause
Figure 5.
Rates of road accidents concerning their type.
Figure 5.
Rates of road accidents concerning their type.
Figure 6.
(a) Rates of road accidents according to the road user causing them; (b) rates of road accidents concerning the number of people involved.
Figure 6.
(a) Rates of road accidents according to the road user causing them; (b) rates of road accidents concerning the number of people involved.
Figure 7.
Rates of road accidents concerning the driving experience of the person causing the accident.
Figure 7.
Rates of road accidents concerning the driving experience of the person causing the accident.
Figure 8.
Rate of road accidents in relation to (a) the pavement width and (b) the longitudinal gradient of the road.
Figure 8.
Rate of road accidents in relation to (a) the pavement width and (b) the longitudinal gradient of the road.
Figure 9.
Rate of road accidents based on (a) horizontal elements and (b) curvature of the road segment.
Figure 9.
Rate of road accidents based on (a) horizontal elements and (b) curvature of the road segment.
Figure 10.
Rate of road accidents based on the cause of the accident.
Figure 10.
Rate of road accidents based on the cause of the accident.
Figure 11.
Rate of road accidents in relation to the type of road accident.
Figure 11.
Rate of road accidents in relation to the type of road accident.
Figure 12.
The trend of road accidents caused by motorcyclists in relation to the number of road users involved.
Figure 12.
The trend of road accidents caused by motorcyclists in relation to the number of road users involved.
Figure 13.
Driving experience of the motorcyclists causing the road accidents.
Figure 13.
Driving experience of the motorcyclists causing the road accidents.
Figure 14.
Age of the motorcyclists causing the road accidents.
Figure 14.
Age of the motorcyclists causing the road accidents.
Figure 15.
Rate of road accidents caused by the motorcyclist in relation to (a) pavement width; (b) longitudinal gradient of the road; (c) curve radius; (d) curve direction.
Figure 15.
Rate of road accidents caused by the motorcyclist in relation to (a) pavement width; (b) longitudinal gradient of the road; (c) curve radius; (d) curve direction.
Figure 16.
Rates of road accidents in relation to (a) their causes and (b) the type of road accident.
Figure 16.
Rates of road accidents in relation to (a) their causes and (b) the type of road accident.
Figure 17.
Objects in which the motorcyclist collided during the fatal single-vehicle accident
Figure 17.
Objects in which the motorcyclist collided during the fatal single-vehicle accident
Figure 18.
Rate of road accidents based on age of causer (single-vehicle accidents) and length of causer's driving licence (years).
Figure 18.
Rate of road accidents based on age of causer (single-vehicle accidents) and length of causer's driving licence (years).
Figure 19.
Rates of single-vehicle accidents in relation to different road characteristics: (a) pavement width; (b) longitudinal gradient.
Figure 19.
Rates of single-vehicle accidents in relation to different road characteristics: (a) pavement width; (b) longitudinal gradient.
Figure 20.
Rates of single-vehicle accidents in relation to different road characteristics: (a) curve radius; (b) curve direction.
Figure 20.
Rates of single-vehicle accidents in relation to different road characteristics: (a) curve radius; (b) curve direction.
Table 1.
Data recorded in the final, merged database.
Table 1.
Data recorded in the final, merged database.
| Accident |
Involved users |
External conditions |
Road |
Road elements |
| Severity |
Age group |
Statistical region |
Name of the road |
Curvature |
| Typology |
Gender |
Municipality |
Road identification number |
Radius |
| Cause |
Nationality |
Day |
Name of a road section |
Direction |
| |
|
|
Road section identification number |
|
| |
Causer |
Day time |
Urban area/non-urban area |
Longitudinal slope |
| |
Type of user |
Weather |
Pavement type |
Pavement width |
| |
Years of experience |
Traffic |
Road condition |
|
| |
DUI* |
Date |
Location within the road |
|
| |
|
|
Road chainage |
|
Table 2.
Spearman's correlation analysis between the causer and human factors.
Table 2.
Spearman's correlation analysis between the causer and human factors.
| |
|
Driving experience |
Age |
Gender |
| Causer |
Spearman's rho |
0.793 |
0.730 |
0.981 |
| p-value |
0.000 |
0.000 |
0.000 |
Table 3.
Spearman's correlation analysis between the causer and design elements.
Table 3.
Spearman's correlation analysis between the causer and design elements.
| |
|
Driving direction |
Longitudinal gradient |
Pavement width |
Radius |
| Causer |
Spearman's rho |
-0.073 |
-0.039 |
-0.229 |
-0.013 |
| p-value |
0.397 |
0.654 |
0.007 |
0.88 |
Table 4.
Spearman's correlation analysis between the causer and external conditions.
Table 4.
Spearman's correlation analysis between the causer and external conditions.
| |
Causer |
| |
Spearman's rho |
p-value |
| Day |
0.003 |
0.968 |
| Day/night |
0.073 |
0.393 |
| Hour |
-0.098 |
0.252 |
| Weather |
-0.065 |
0.448 |
| Road condition |
-0.053 |
0.540 |
| Pavement type |
-0.051 |
0.554 |
| Traffic |
0.038 |
0.657 |
| Type of accident |
0.601 |
0.000 |
| Cause of the accident |
-0.475 |
0.000 |
| Urban/non-urban area |
-0.032 |
0.710 |
| Location within the road |
-0.233 |
0.006 |
| Category of the road |
0.052 |
0.542 |
|
Disclaimer/Publisher’s Note: The statements, opinions and data contained in all publications are solely those of the individual author(s) and contributor(s) and not of MDPI and/or the editor(s). MDPI and/or the editor(s) disclaim responsibility for any injury to people or property resulting from any ideas, methods, instructions or products referred to in the content. |
© 2024 by the authors. Licensee MDPI, Basel, Switzerland. This article is an open access article distributed under the terms and conditions of the Creative Commons Attribution (CC BY) license (http://creativecommons.org/licenses/by/4.0/).


