1. Introduction
Cognitive dissonance is a psychological phenomenon that occurs when an individual’s behavior is inconsistent with their attitude, resulting in feelings of tension or discomfort (Cancino-Montecinos et al., 2020). The basis for this phenomenon is drawn from the Cognitive Dissonance Theory, developed by social psychologist Leon Festinger in 1957. Festinger believed that holding two or more contradictory beliefs would trigger cognitive dissonance in an individual, resulting in an internal burden that they would attempt to resolve by shifting their attitude or behavior. In the context of technology, dissonance may be triggered if one’s expectations of that technology do not align with its performance (Marikyan et al., 2020; Festinger et al., 1962). The development of new and innovative technologies in recent years has been shown to raise unrealistic expectations in consumers, a phenomenon that may contribute to growing instances of cognitive dissonance (Lv, Liu et al., 2022; Kim et al., 2011; Dhagarra et al., 2020). This study aims to add to the current understanding of dissonance by examining it through a wider lens of various technological applications, including but not limited to artificial intelligence (AI), Smart homes, autonomous vehicles, social media, and healthcare.
As technology rapidly advances, smart homes are becoming integral to people’s daily lives, changing how humans interact with their living spaces (Rock et al., 2022). A smart home is defined as “a residence equipped with computing and information technology, which anticipates and responds to the needs of the occupants, working to promote their comfort, convenience, security, and entertainment through the management of technology within the home and connections to the world beyond” (Aldrich et al., 2003). In the technology field, smart homes integrate software and hardware components, such as physical devices, wearable technology, and sensors. These systems are designed to observe and detect environmental changes and variations in the user’s physical state, enabling them to react accordingly (Arunvivek et al., 2015; Orwat et al., 2008).
The goal of incorporating smart home technologies is to assist individuals in their daily lives while providing benefits related to the environment, finances, health, and psychological well-being (Marikyan et al., 2019).
While smart homes benefit users considerably, their usage still needs to be widespread. This shows the importance of studying how people perceive and interact with this technology (Valencia-Arias et al., 2023). More studies and research are needed to investigate how users behave or react when technology falls short of their initial expectations or when they have conflicting views about it. Because of this, one part of this study’s objective is investigating cognitive dissonance and its relation to smart homes.
Additionally, explaining the changing trends of consumer acceptance in autonomous vehicles (AVs) has become increasingly important with the growing number of new technology developments. Autonomous vehicles “...refers to the replacement of some or all of the human labor of driving by electronic and/or mechanical devices” (Nowakowski et al., 2015). With a growing number of autonomous vehicles (AV) present in the market today, there comes a higher amount of associated cognitive dissonance due to safety or accident-related issues (Fleetwood et al., 2017).
The Deng & Guo 2022 study examining safety acceptance and behavioral interventions in AVs found that subjective norms, or people’s perceptions of social pressure, heavily influence their attitudes towards these technologies. This user cognitive bias (cognitive dissonance) about automated driving technologies brings certain risks to driving safety and affects user acceptance of AVs. Users may feel overconfident and need more trust in AVs or skepticism and underutilization of helpful safety features, ultimately leading to accidents in both scenarios (Deng & Guo et al., 2022).
While looking at the social dilemma of autonomous vehicles, the Bonnefon study in 2016 indirectly discusses cognitive dissonance when questionnaire participants express conflicting attitudes in choosing between types of AV. The study outlines two kinds of Autonomous Vehicles: Utilitarian AVs, which put their passengers in danger for the “greater good” (minimizing the number of casualties), and Self-Protecting AVs, which put the safety of their passengers in addition to the safety of pedestrians, regardless of how many pedestrians they may harm. Participants generally agreed passenger(s) should be sacrificed if ten people could be saved. Still, agreement decreased if family members were also passengers, and agreement further reduced as the number of people who could be saved was limited. Additionally, participants who ideally wanted utilitarian AVs on the road were less willing to purchase one, demonstrating high cognitive dissonance in these scenarios (Bonnefon et al. 2016).
Overall, these AV studies and their findings were used to create this study’s questionnaire and examine the cognitive dissonance concerning safety, feelings of reliability, and the morality behind the social dilemma of the technology.
Our study investigates how humans respond to various advanced technology designs. Human creativity has led to a plethora of new technologies that might result in conflicting behaviors and actions. Behavioral plasticity, “a strategy employed by many species to cope with both naturally occurring and human-mediated environmental variability” (Salinas-Melgoza et al., 2013; Cantor et al., 2018) is being investigated regarding this phenomenon.
Apart from more traditionally studied technologies, this study also focuses on novel innovations such as AI (ChatGPT, Gemini, Grammarly AI) and the increased influence of social media platforms such as Instagram or TikTok on the behaviors and beliefs of the younger generation (Atske & Atske et al., 2024). This is crucial as understanding how this new cohort of teenagers and young adults interact with new forms of technology can aid in predicting what the technological atmosphere will look like. For this reason, this study separates participants into distinct and specific age groups, hoping to capture the most accurate data regarding new technologies and the cognitive dissonance among their younger users (Zhang & Pan, 2023).
2. Methodology
The following hypotheses were examined during the study:
H1: There is a difference between perceived dissonance regarding various technologies between adults and adolescents.
H2: There will be correlations between levels of dissonance for different subsets of technology.
H3: There is a difference between perceived dissonance regarding various technologies between males and females.
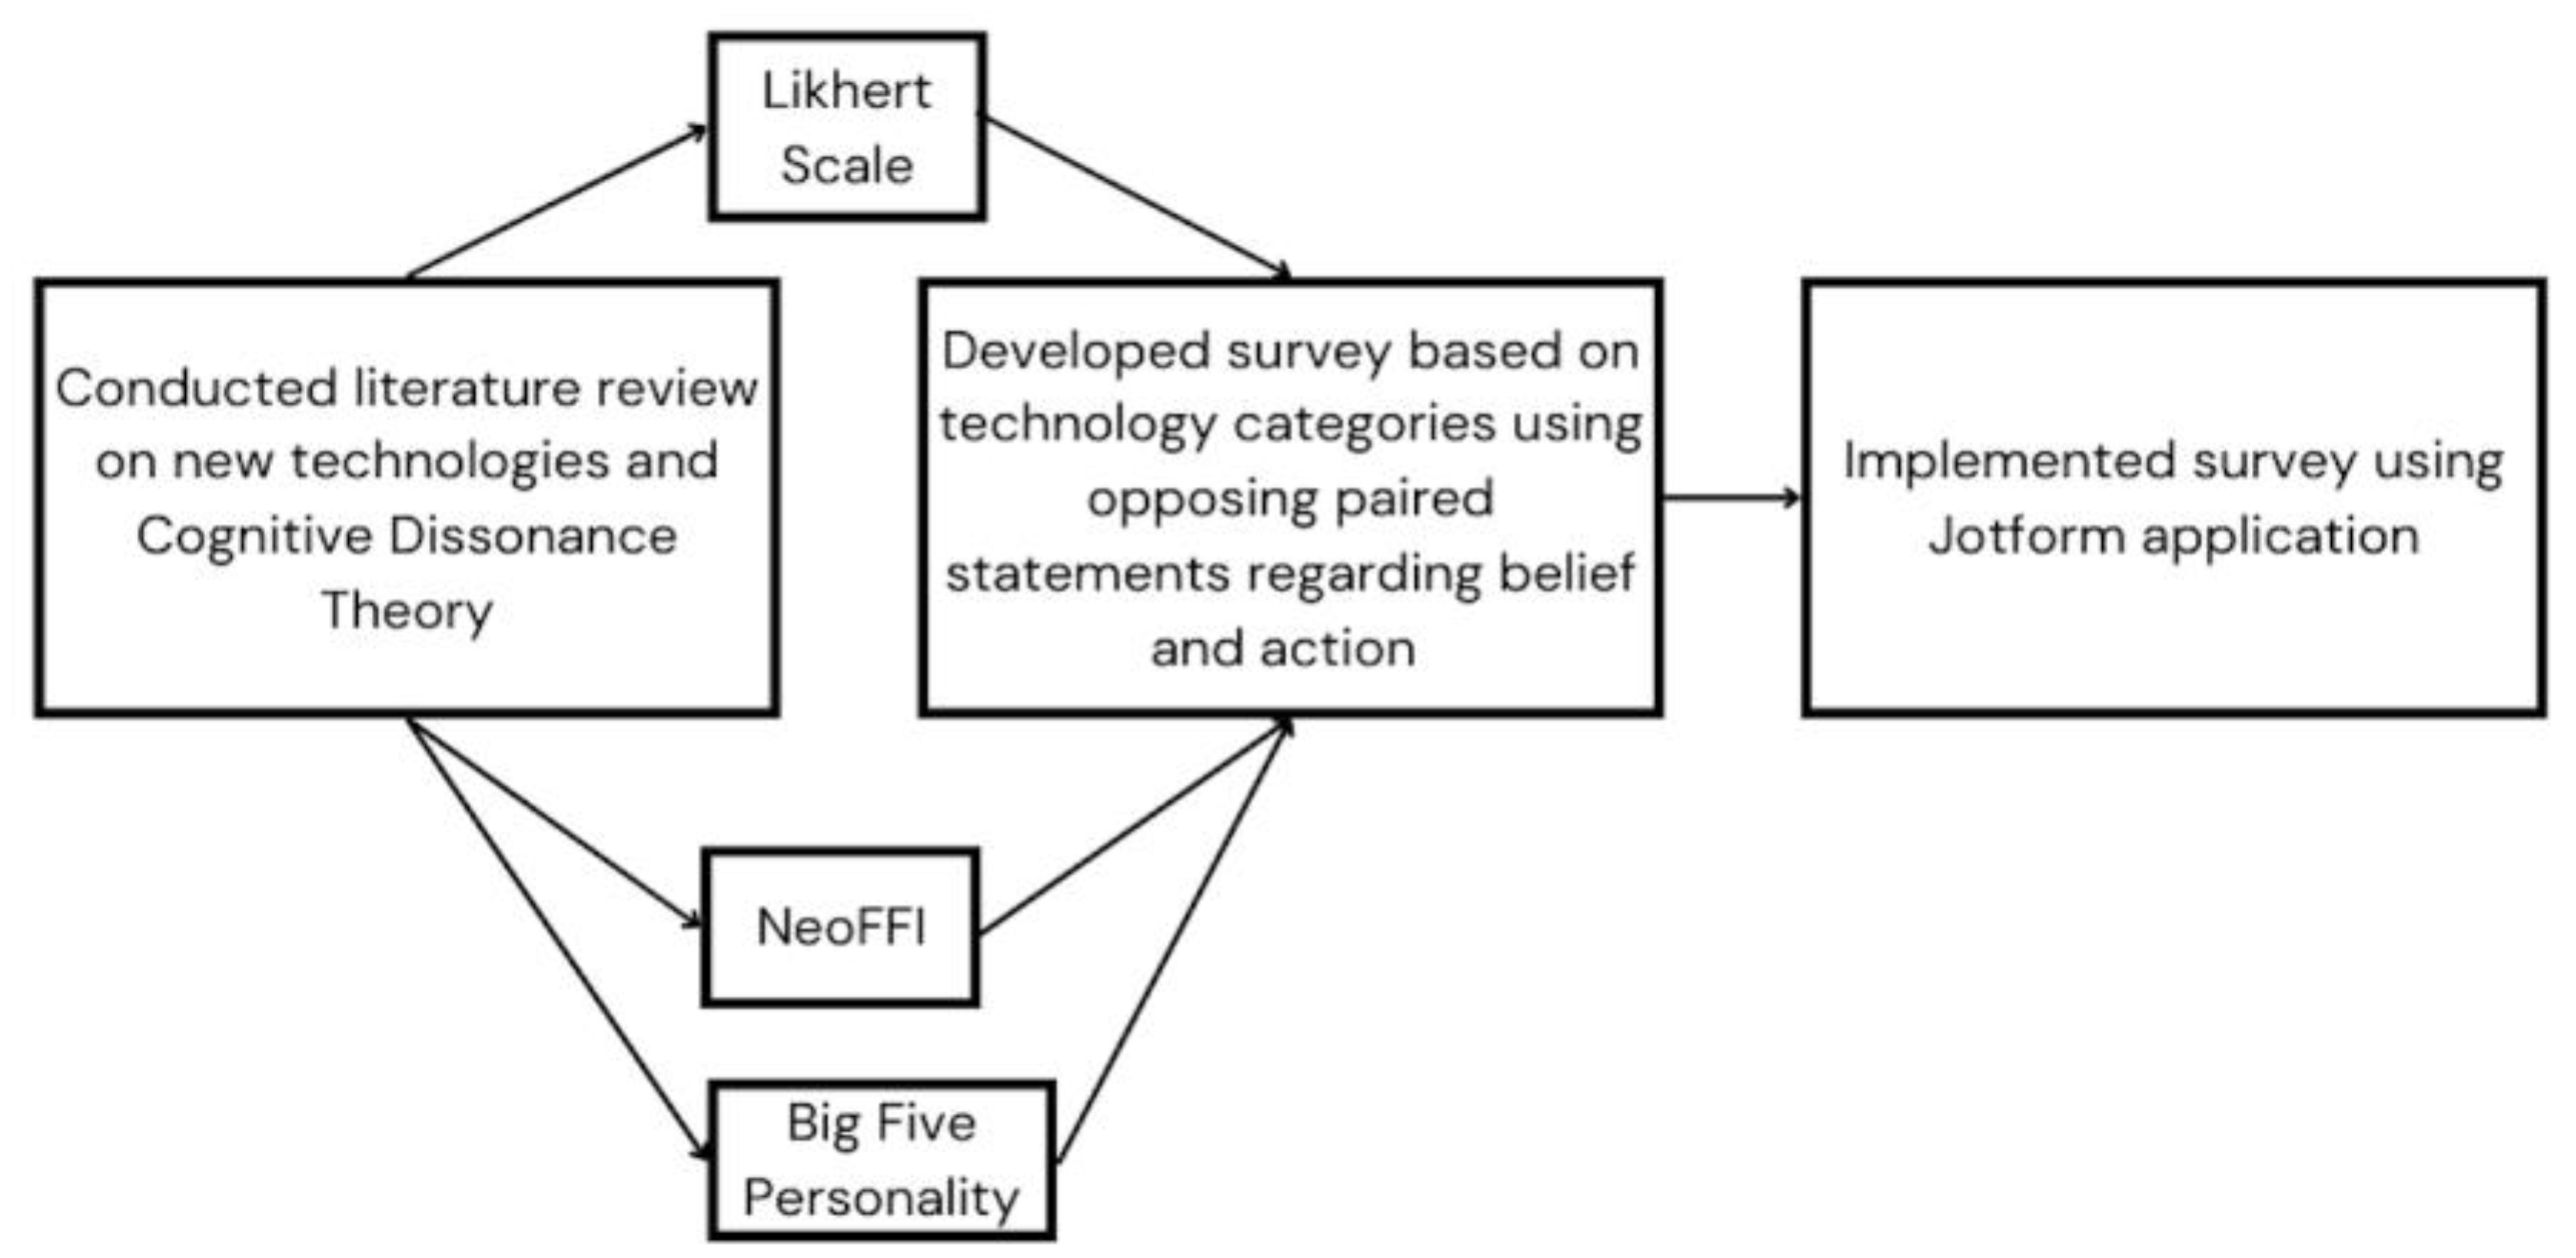
Our study includes a survey to measure cognitive dissonance concerning novel technologies, using the NEO Five-Factor Inventory (NEO-FFI) as a basis for designing it. NEO-FFI is a 60-question personality inventory that assesses an individual on five domains of personality: openness to experience, conscientiousness, extraversion/introversion, agreeableness, and neuroticism. Of these domains, this study’s self-reported survey focused on agreeableness and openness to measure suspicion regarding various technologies.
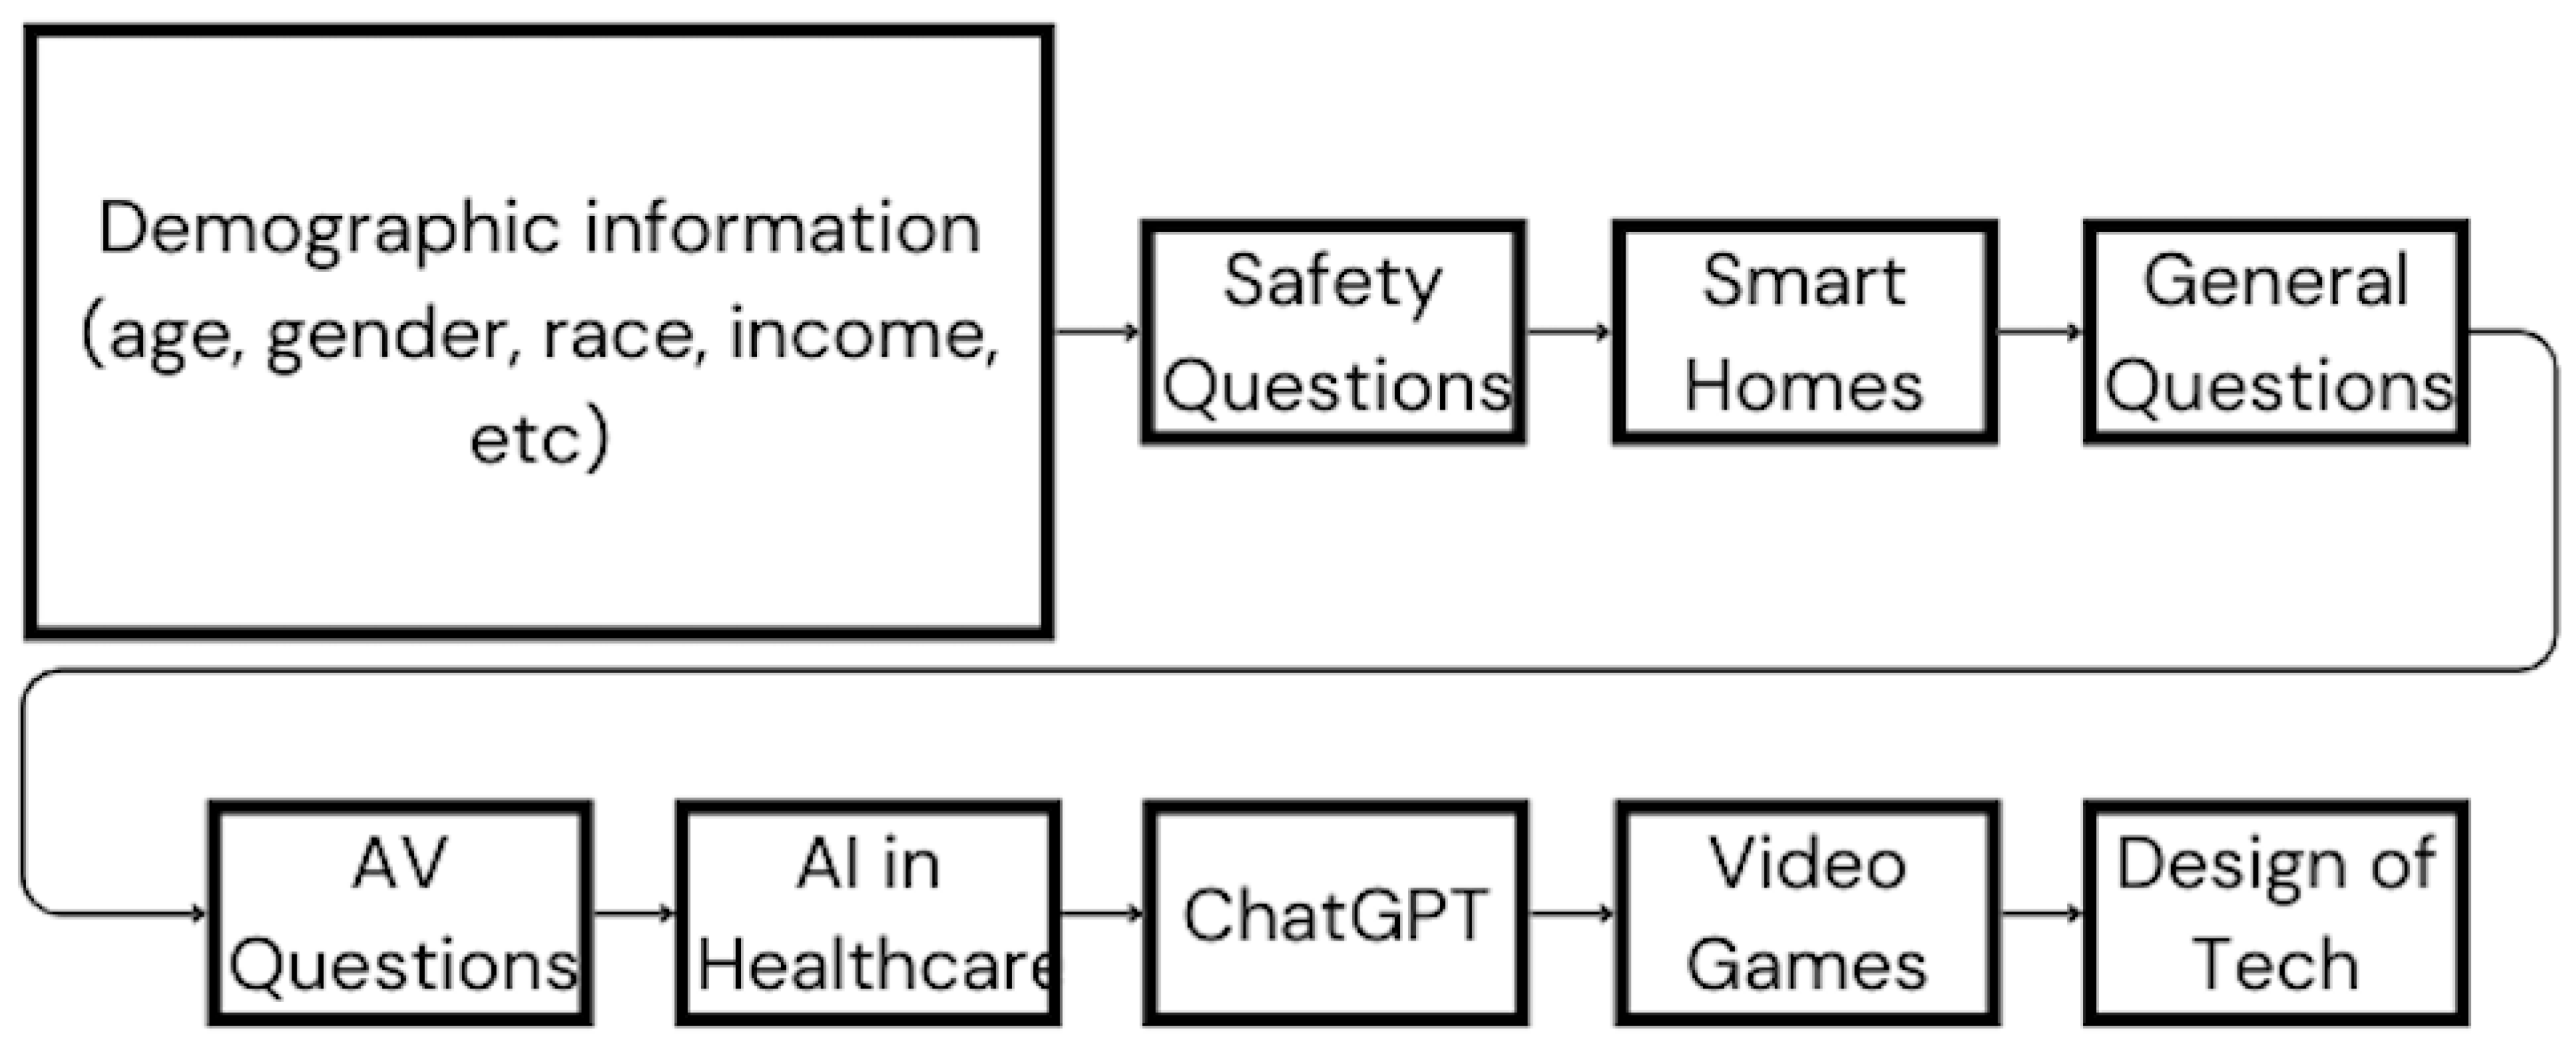
Using these personality domains as a foundation, the survey, comprised of 84 questions, was created; it presented participants with statements relating to 8 categories: safety, smart homes, general questions, autonomous vehicles, AI in healthcare, ChatGPT, video games, and design of technologies. Statements were on the topic of their respective categories, and general questions included general feelings toward technology and a mix of statements from other categories. Statements were presented in opposing pairs, one directed toward belief and the other toward action. Participants were then asked to rate their level of agreement with each statement using the 10-point Likert scale, with one meaning the participant strongly disagreed with the statement and ten meaning they strongly agreed with it. Because these statements were contradictory, responding similarly (i.e., 8 for both statements) would mean that the participant was experiencing high levels of cognitive dissonance since their beliefs contradicted their actions. Participant responses to the survey were scored by taking the absolute difference between participant ratings for paired statements since the order of the statements did not matter.
Below is an example of one of the paired statements on the survey:
More sample paired statements from the survey are below:
The
Table 1 contains two sets of paired statements from the survey in each of the eight categories (safety, smart homes, general questions, autonomous vehicles, AI in healthcare, ChatGPT, video games, and design of technology).
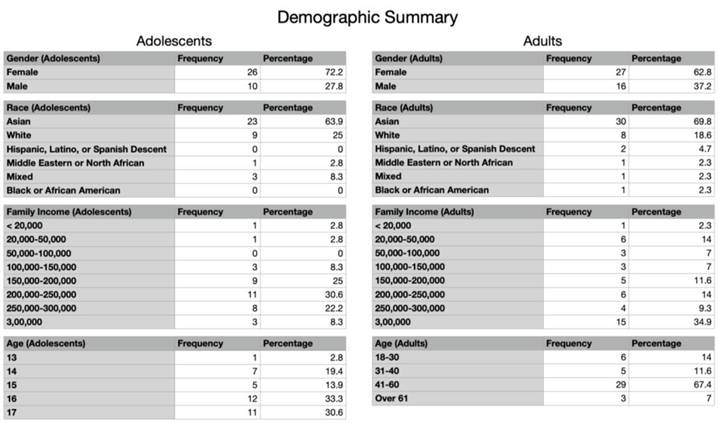
Data collection was initiated upon finalizing the survey design. All the participants consented, and an internal IRB (Institutional Review Board) reviewed the data collection. Participants accessed the survey using the HIPPA (Health Insurance Portability and Accountability Act) compliant platform Jotform. The data was stored in Jotform, where all the participants were de-identified using a unique identifier. Participants were recruited in the local community through word of mouth and online platforms such as Nextdoor and Facebook. Data collection lasted approximately six months and ended with 43 adult and 36 adolescent participants.
We conducted preliminary data analysis, which included correlation and statistical analysis. The output was a color-coded heatmap with the average dissonance scores for each age group and group category; it indicated which group has the higher dissonance through an associated darker color, and the higher dissonance score would have a lower score on the scale from 0-10.
Using RStudio version 4.3.2., multiple grouped variable datasets were plotted with ggplot, a data visualization package in R, and the library tidyverse, a library for better data transformation and presentation. The following variables were each plotted by average dissonance score per group: income, race, gender, and age. First, each variable was converted to a ‘character’ data type for simplified categories and eliminating issues during data binding for plotting. Data scrubbing was performed. After that, the adolescent and adult datasets were merged into one large dataset for use. Next, the data was reshaped to a long format so that the data was stored in two columns: one called “group” (storing the original names of group columns) and “value” for the corresponding dissonance value. Overall, this reshaping permits more straightforward plotting and statistical analysis. Then, the average dissonance score value by group and the corresponding variable was calculated. Lastly, graphs were plotted with the function ggplot(), ensuring the axes were labeled with appropriate titles and making a legend if necessary. See the results section to examine the figures.
Analysis of Variance (ANOVA) is a statistical test used to identify differences between the means of three or more independent groups. In this study, the groups represented topics such as AI, smart homes, video games, and healthcare. A one-way ANOVA could compare the mean levels across these groups to identify any statistically significant differences. Pearson correlation measures the strength and direction of the linear relationship between two continuous variables. Pearson correlation was utilized to examine the strength and direction of relationships between group scores and variables such as frequency of use or comfortability with the technology. Combining these statistical methods provided a comprehensive understanding of technology-based factors influencing these variables.
3. Results
Based on the analysis the following results showed several statistically significant differences in certain categories when compared to age or gender. Income and race were eliminated from data analysis as data was heavily skewed towards higher income and certain races such as Asian.
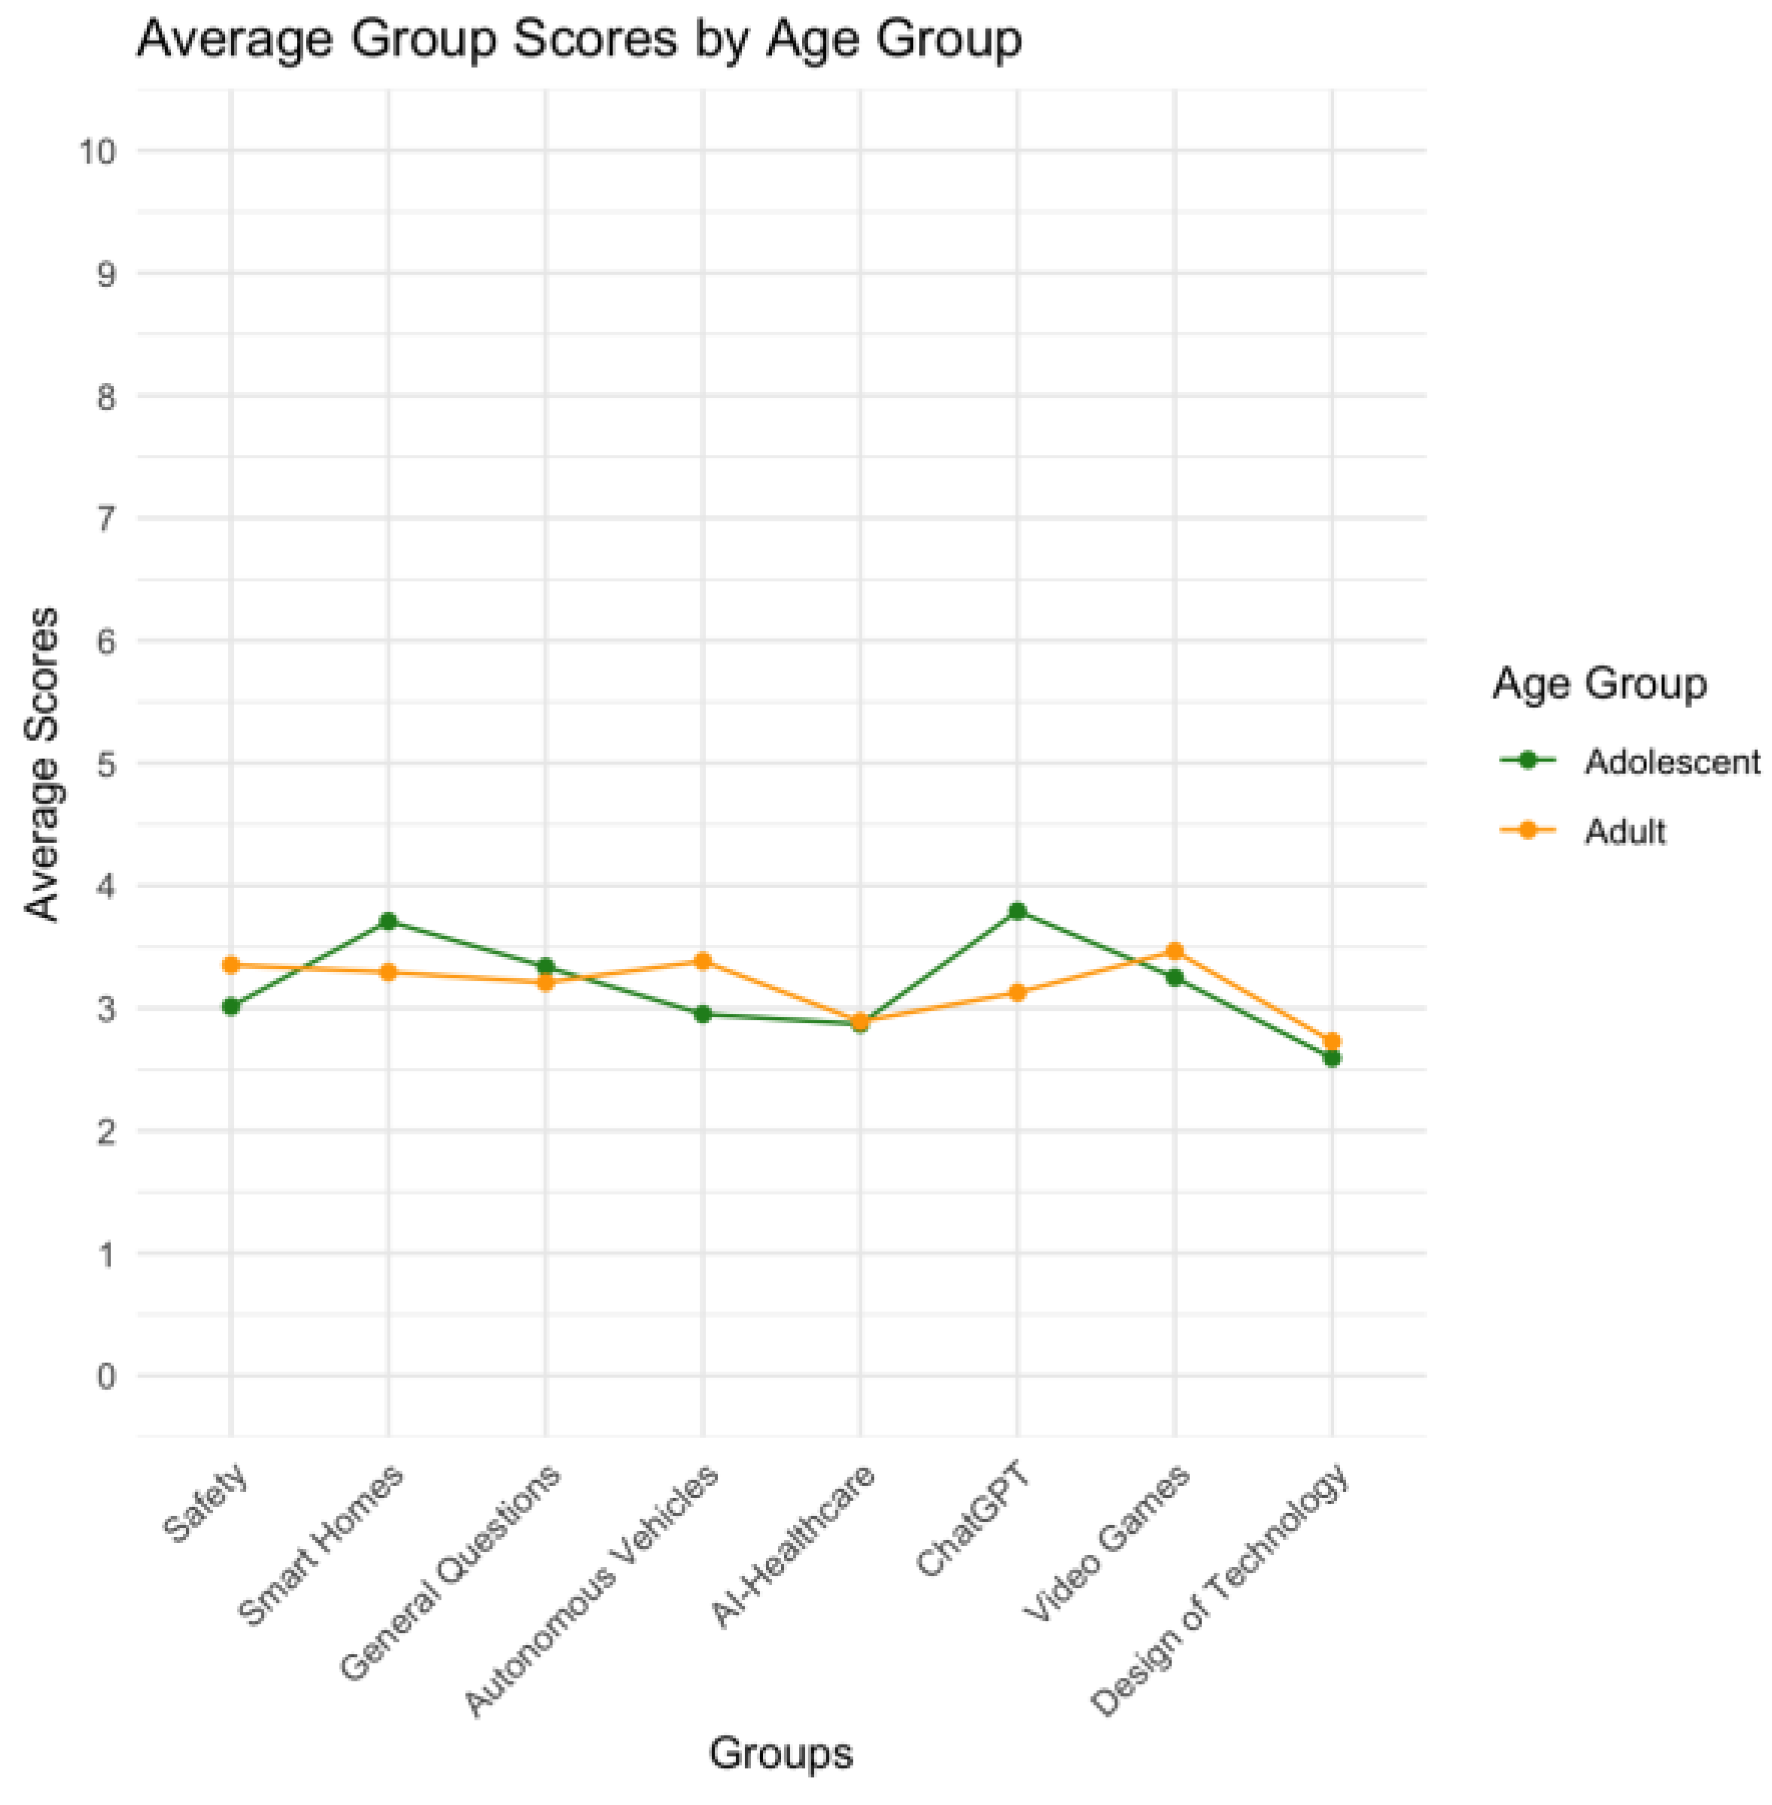
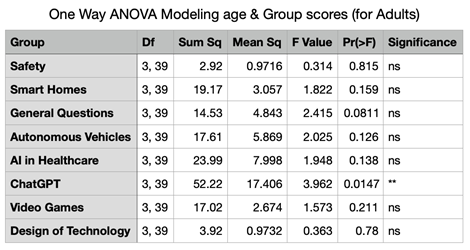
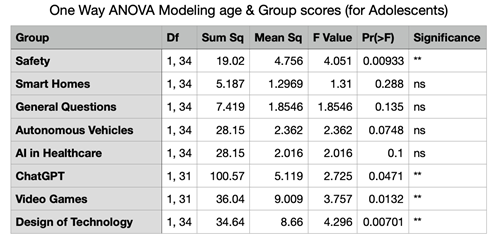
Figure 1 depicts the multi-grouped variable dataset plotting of average group dissonance score for adults and adolescents. The average dissonance group score varies the most between adults and adolescents in Group 6 (ChatGPT) by approximately 1 point (adults = 3.13, adolescents = 3.79). With correspondence to
Table 3a and
Table 3b, age has a statistically significant effect on safety (Group1SCORE) with adolescents (
F value = 4.051,
p-value = 0.0093**) as the p-value is below 0.01, but not adults (
F-value = 0.314,
p-value = 0.815).
Additionally, AI in Healthcare (GROUP5Score) has marginally significant findings with adolescents as the p-value is close to 0.05 but not quite below it (F value = 2.362, p-value = 0.0748) and insignificant findings for adults. ChatGPT (GROUP6Score) is statistically significant with respect to age (for adolescents (F value = 2.725, p-value = 0.0471**) and adults (F-value = 3.962, p-value = 0.0104**)) as well as Video Games for adolescents (GROUP7Score; F value = 3.757, p-value = 0.0132**) and Design of Technology for adolescents (GROUP8Score; F value = 4.296, p-value = 0.0070**) but both are insignificant findings for adults.
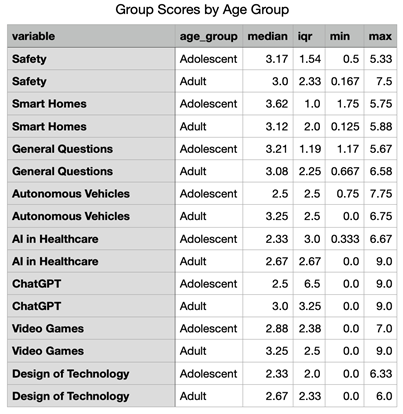
In
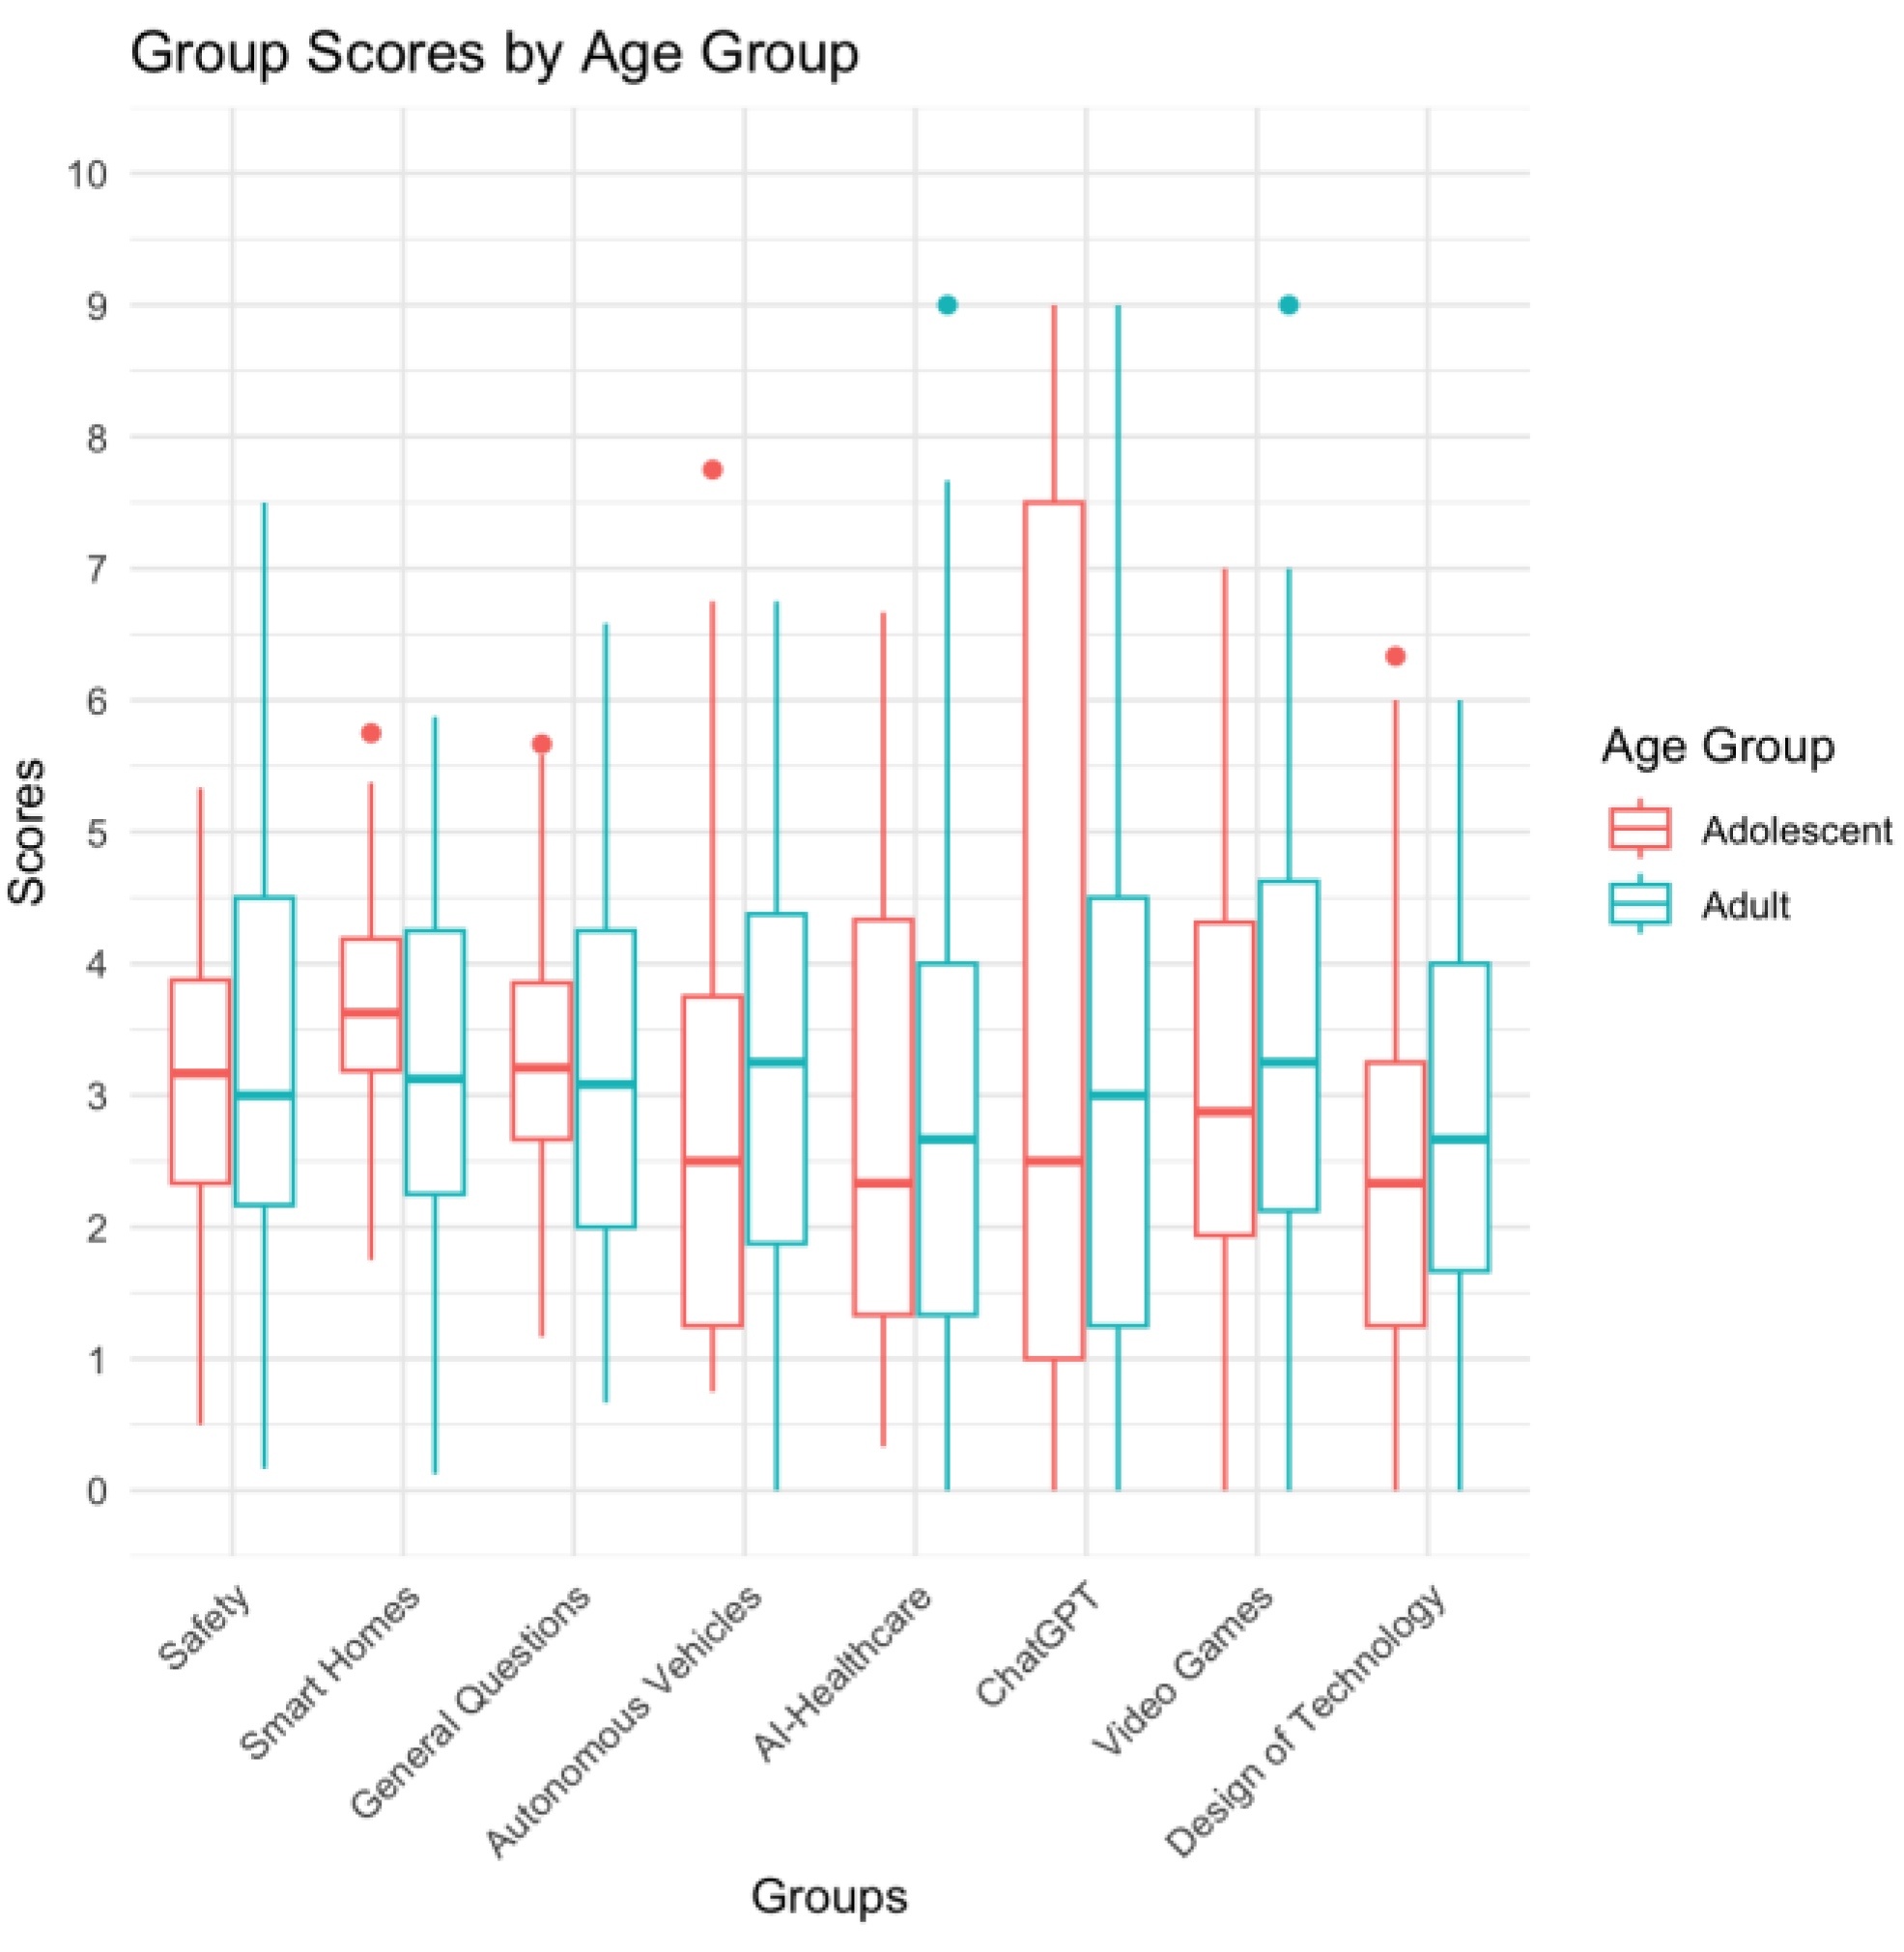
Figure 2, the bold horizontal line in the middle of each box represents the median, which is the middle value of the data. According to
Table 4, the medians of some groups are close between adults vs. adolescents like in Safety and General Questions at 3 vs. 3.17 and 3.08 and 3.21 respectively. In others, there are notable differences such as Autonomous Vehicles (3.25 vs. 2.5). The box, which is the interquartile range (iqr, from quartile 1(q1) to quartile 3 (q3), represents the range of 50% of the data; the wider the boxes the more variability in the dataset and similarly, the narrower the boxes, the more consistency they show in data. Adolescents in Smart Homes show the most consistency in their responses, but Adolescents in ChatGPT show the greatest variability in responses.
For group comparisons, in safety, the median scores for both Adolescents and Adults are close, but Adults have slightly more variability (2.33 vs 1.54). Smart Homes show Adolescents having more consistent responses (2.0 vs 1.0) with one outlier. The distributions are fairly similar for both age groups in general questions (4.25 vs 3.85), with median scores being very close. In Autonomous Vehicles, Adults tend to have more variability, but the overall distributions are similar (IQR = 2.5). AI in Healthcare shows that Adolescents and Adults have different medians, and Adults show less variability (2.67 vs. 3.0). Adolescents tend to score higher (meaning a lower dissonance) on the category ChatGPT (max = 9.0), with a higher median and greater spread (IQR=6.5), while Adults show less variability (IQR=3.25). With Video Games, Adolescents have lower median scores and fairly equal variability with adults showing slightly more (2.5 vs 2.38). Lastly, Design of Technology: Adolescents again show lower median scores, with adolescents exhibiting more consistency (2.33 vs. 2.0).
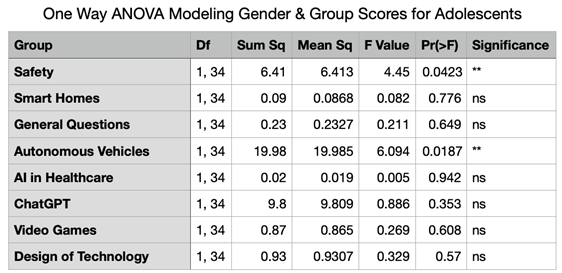
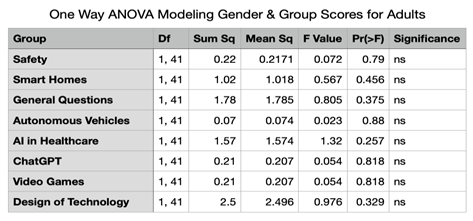
ChatGPT with women experience an average score of 3.71 and men experiencing an average score of 2.87. Surprisingly, this statistical significance is not reflected in the one way ANOVA test for this group as
Table 5a and 5b record the p-value is not significant (0.353), suggesting no gender differences in Group6SCORE (ChatGPT) (
F value = 0.886) for adolescents and the p-value is not significant (0.497), suggesting no gender differences in Group6SCORE (ChatGPT) (
F value = 0.47) for adults.
In
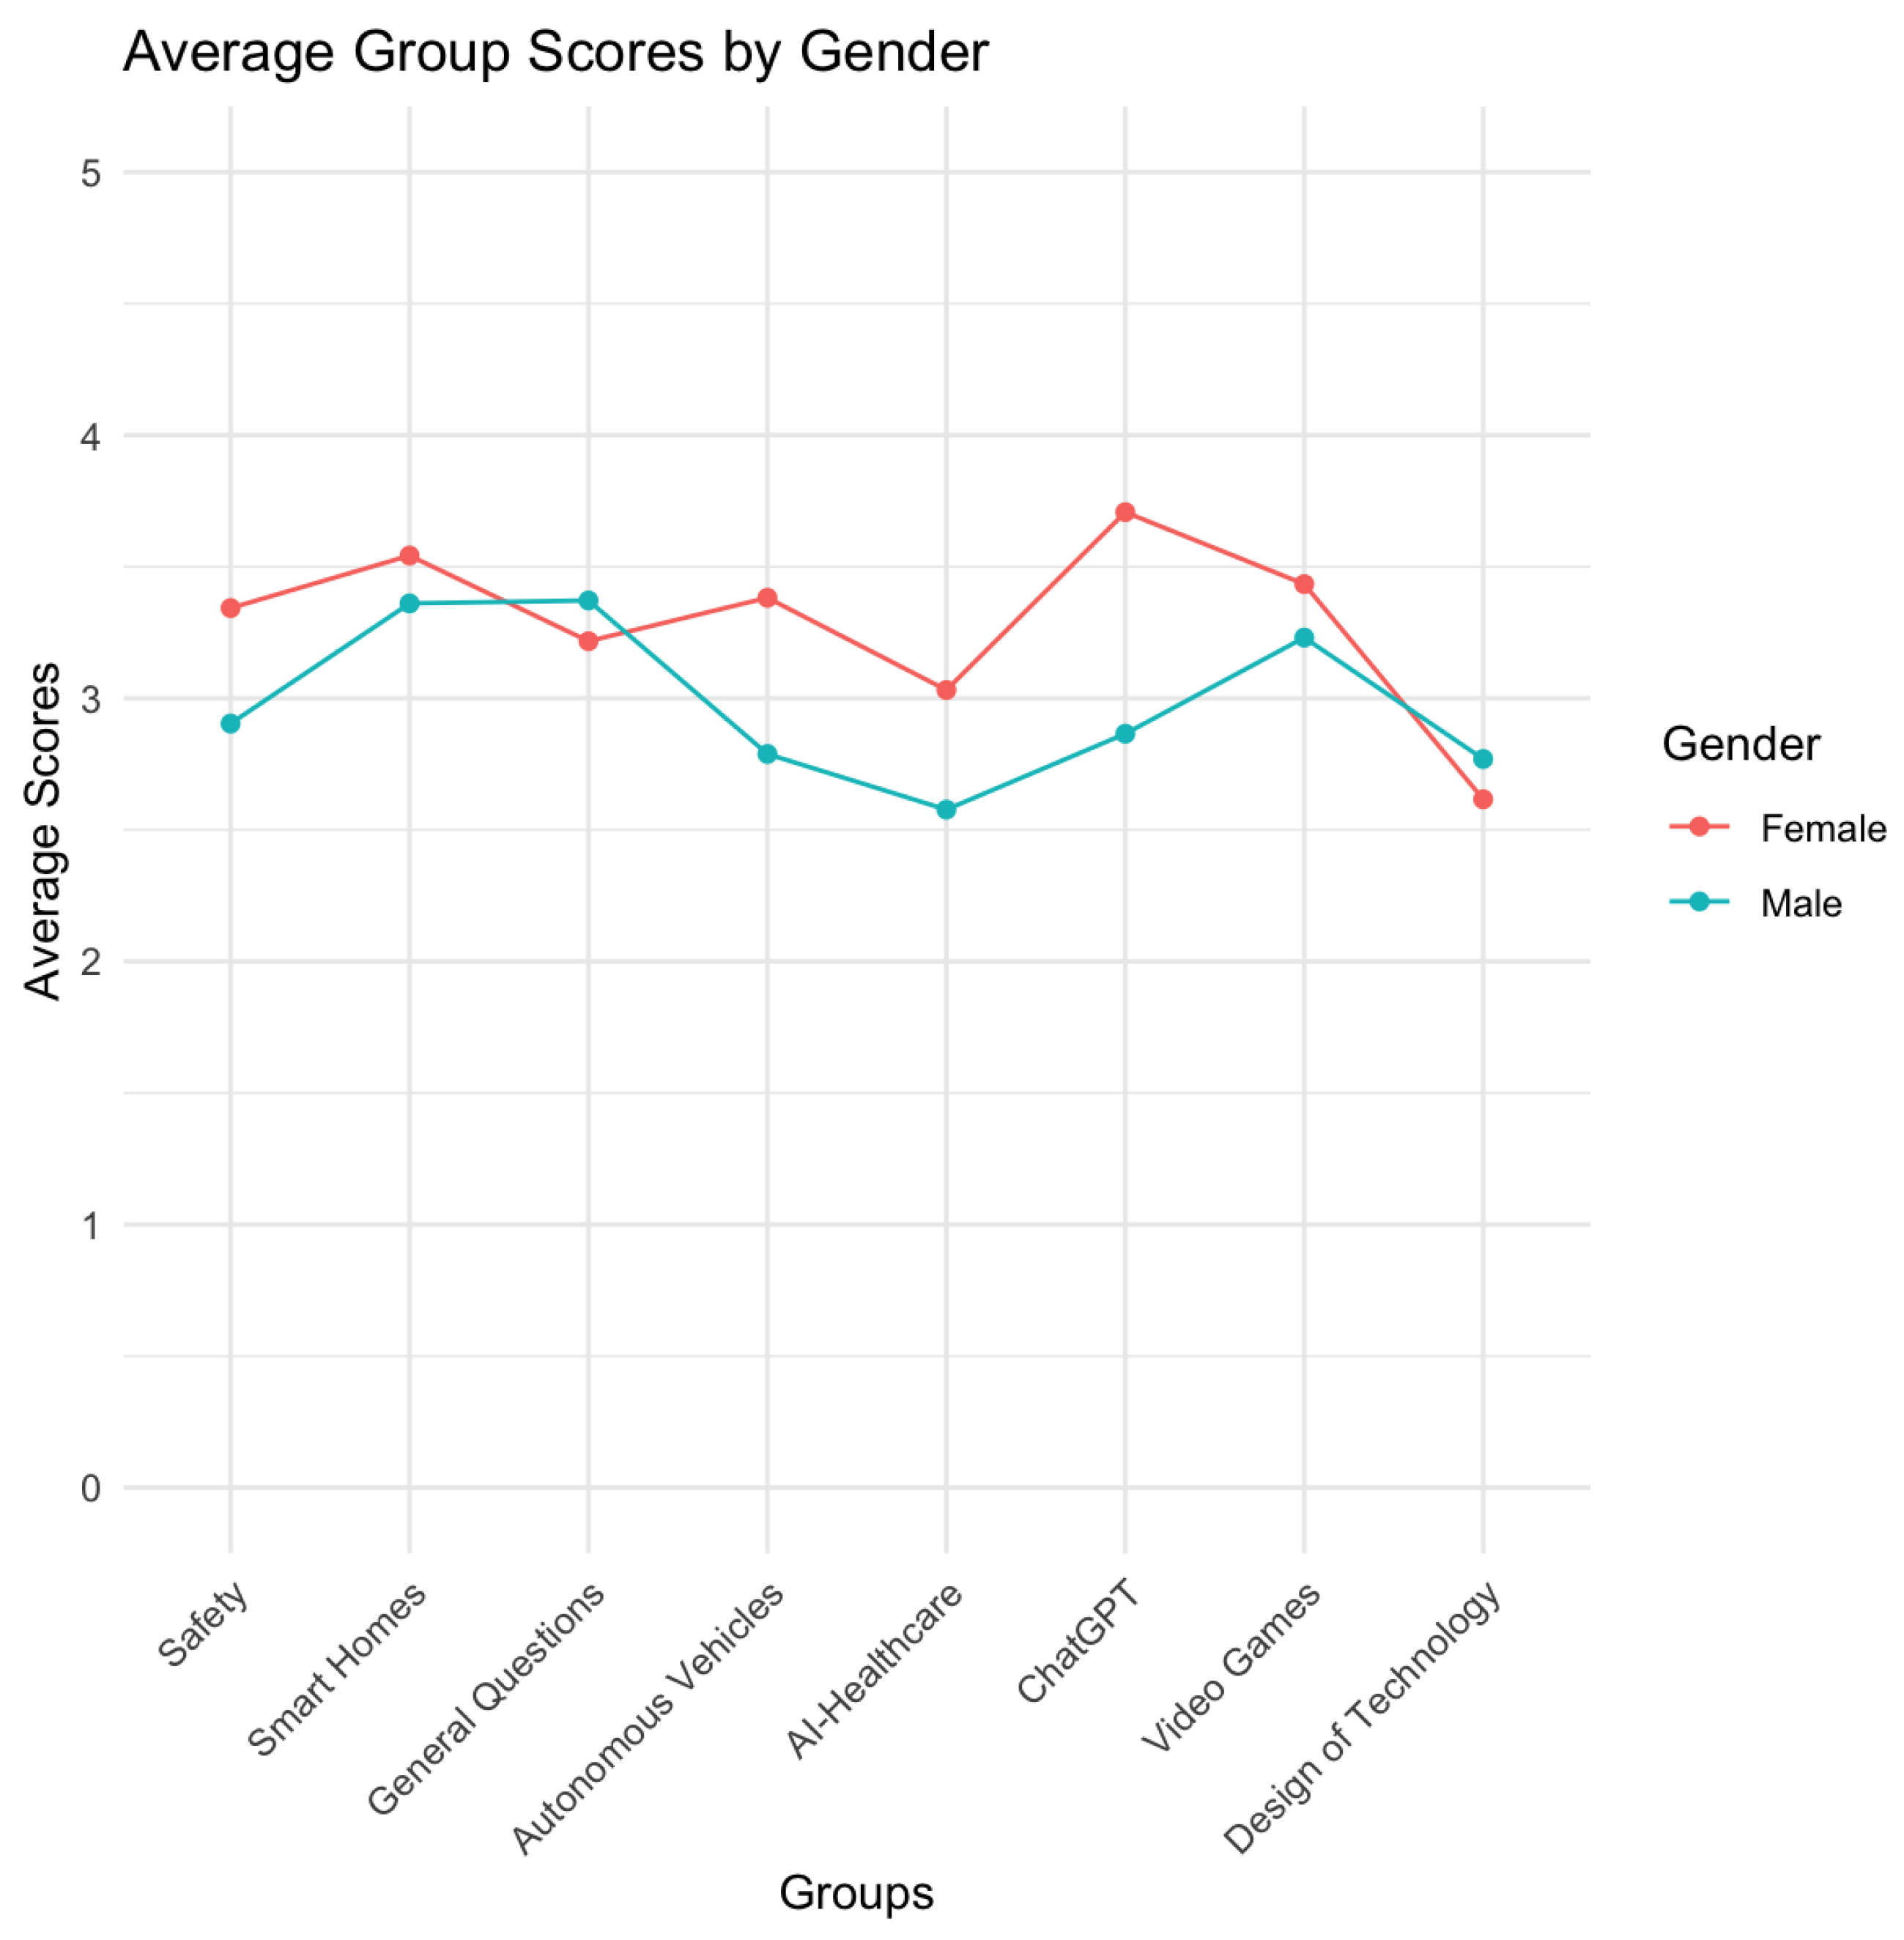
Figure 3, there is a general trend of average dissonance scores in the range of 2-4 points, with no greater than approximately 1 point of difference between males and females for a respective group’s dissonance score. However, there are stark differences in certain group scores, with one notably being.
Autonomous Vehicles, though, demonstrate a large difference in average dissonance scores as women experience an average dissonance score of 3.38 and men experience an average dissonance score of 2.71. Safety too reports an average score for women at 3.34 and for males it is 2.9. Furthermore, this is supported by results from the Analysis of Variance (ANOVA) statistical test. ANOVA testing has shown that there is a significant difference in dissonance scores between genders with respect to questions associated with autonomous vehicles (adolescents: F value = 6.094, p-value = 0.0187** ) and safety (F value = 4.45, p-value = 0.0423**) for adolescents. There were no significant differences in scores between genders for adults or adolescents associated with any other group.
In
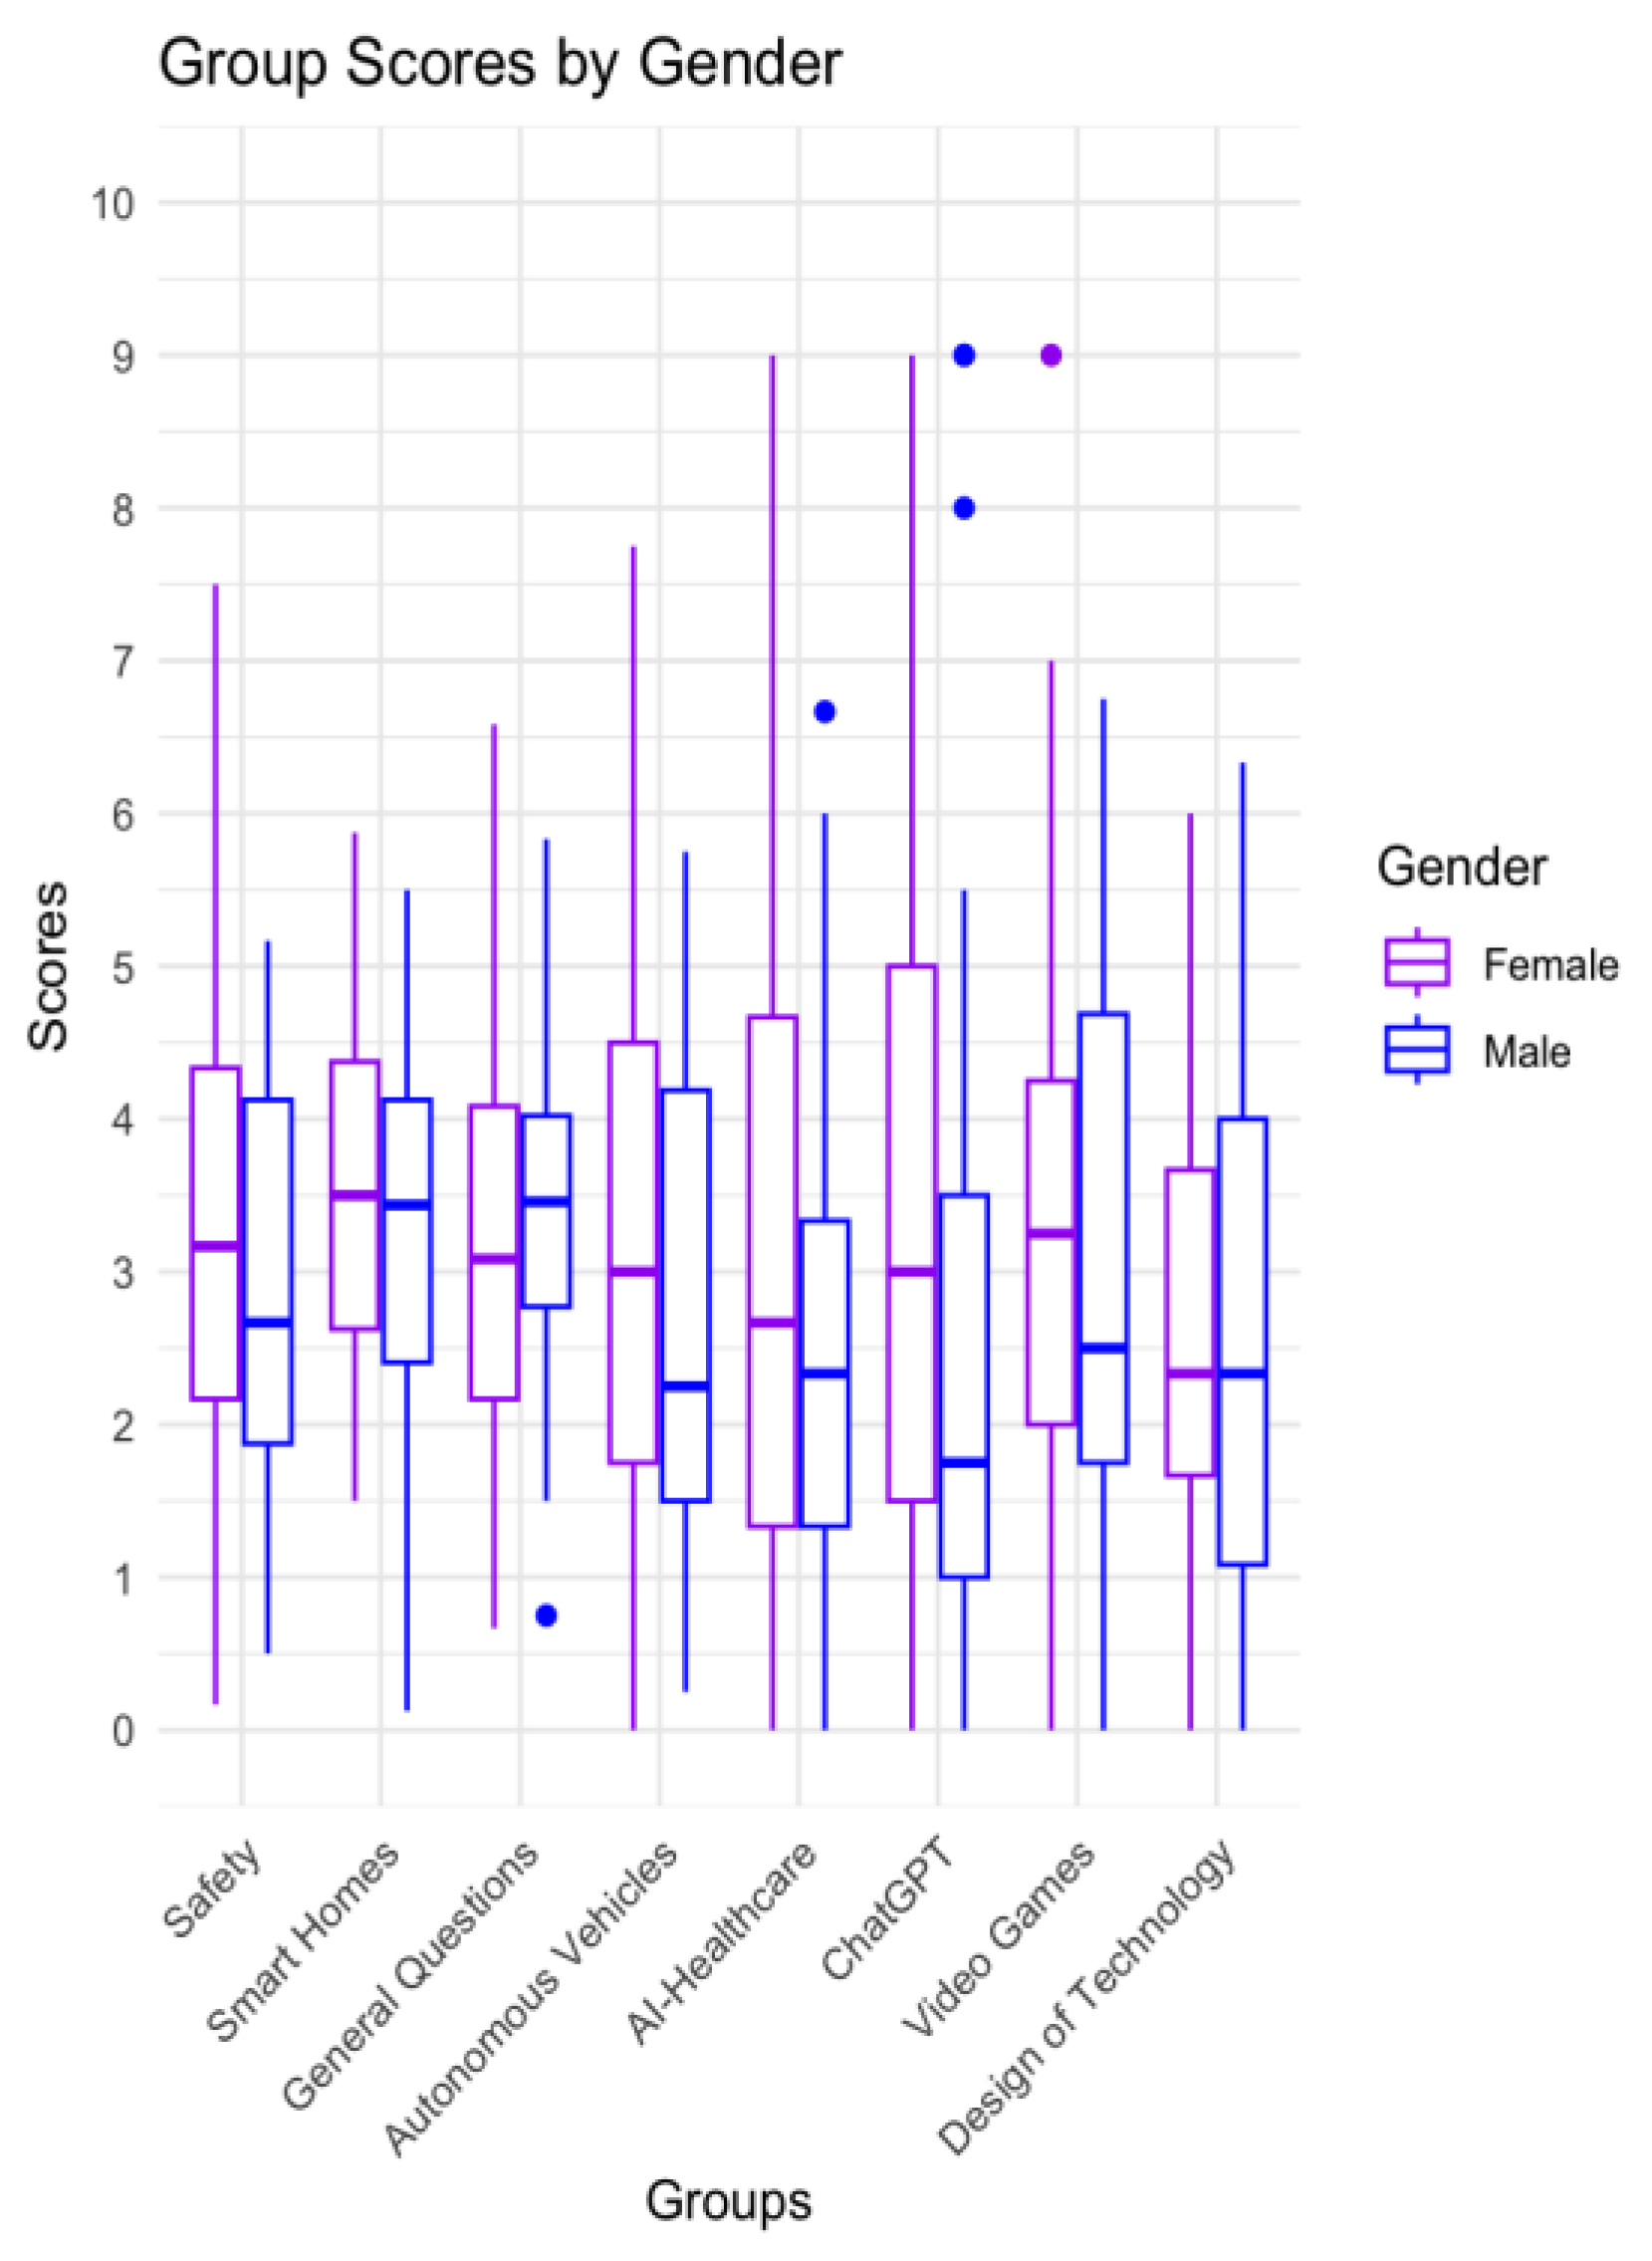
Figure 4, the boxplot shows that both genders, females and males, have varying dissonance score distributions across all groups. Although, the median scores for females tends to be higher than males, indicating that the middle value of the dataset shows lower dissonance for women. Outliers are present, especially for female responders in AI-Healthcare and Video Games, where the outliers reach as high as 9.
Figure 4.
Group Scores by Age Groups.
Figure 4.
Group Scores by Age Groups.
Figure 5.
Average Group Scores by Gender for Adults and Adolescents.
Figure 5.
Average Group Scores by Gender for Adults and Adolescents.
Figure 6.
Average Group Scores by Gender.
Figure 6.
Average Group Scores by Gender.
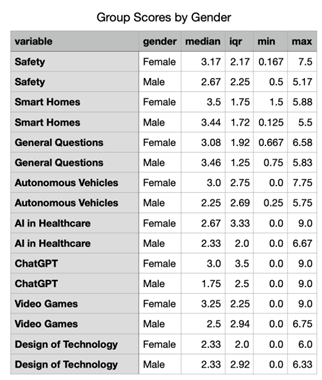
For group-specific insights according to
Table 6, in safety, females and males show relatively similar distributions (2.17 vs. 2.25), with the median score for females (3.17) being slightly higher than that for males (2.67). Interestingly, the maximum score response for females in this category was more than 2 points higher than males (7.5 vs. 5.17). In Smart Homes, the median score for females (3.5) is slightly higher than that for males (3.44) and has a slightly greater spread than men (4.38 vs. 4.12). General Questions show that females have a slightly lower median score (3.08) compared to males (3.46). In Autonomous Vehicles, females show 2 points more of variability than males (7.75 vs. 5.75). The most significant difference is observed in AI in Healthcare, with the outliers for females going up to 9, showing some very high scores, while male scores are more concentrated with their max at 6.67. For ChatGPT, the median for females is much higher (3) than for males (1.75), with a larger interquartile range (IQR) for females. In Design of Technology, the median scores are identical for both genders (2.33), though the range of scores is wider for males (6.0 vs 6.33).
Regression Model - Adolescents
A series of multiple linear regression analyses were conducted to examine the relationship between age, gender, and average scores across various groups of adolescents. The first regression model predicted scores across eight groups, with male as the reference level for the independent variables of gender and age. For Smart Homes, the intercept was highly significant (Estimate = 5.72, p < 0.001**), indicating that the baseline score differs from zero when controlling for age and gender. However, no individual age or gender variables were statistically significant. In General Questions, both the intercept (Estimate = 5.43, p < 0.001) and certain age groups were significant. Participants aged 15 (Estimate = -2.85, p = 0.014**) and 17 (Estimate = -2.31, p = 0.039**) showed significantly lower scores compared to the baseline age group (age 13), suggesting a decline in scores as they age. For AI in Healthcare, the intercept was significant (Estimate = 6.99, p < 0.001), with ages 15 (Estimate = -4.73, p = 0.019**), 16 (Estimate = -3.86, p = 0.043), and 17 (Estimate = -4.51, p = 0.022**) also showing significant negative effects on scores, indicating a decline from ages 15 to 17. In ChatGPT, the intercept was significant (Estimate = 8.36, p = 0.018**), indicating a higher baseline score. The effect for age 17 (Estimate = -6.61, p = 0.054) approached significance, suggesting a trend for lower scores in this age group.For Design of Technology, the intercept was significant (Estimate = 4.60, p = 0.006**), with age 14 (Estimate = -3.23, p = 0.044**) and age 15 (Estimate = -3.40, p = 0.038**) having significant negative effects on scores. Age 17 (Estimate = -2.66, p = 0.093) approached significance, indicating a potential decrease in scores.
The second regression model was run for adolescents with females as the reference level. In Safety, the intercept was significant (Estimate = 2.33, p = 0.0393**), showing that the baseline score differs from zero. No individual age or gender variables were significant in this group. In General Questions, both the intercept (Estimate = 5.43, p < 0.001) and certain age groups were significant. Participants aged 15 (Estimate = -2.85, p = 0.0144**) and 17 (Estimate = -2.31, p = 0.0392**) had significantly lower scores compared to the baseline age group. For Autonomous Vehicles, the intercept was significant (Estimate = 5.25, p = 0.00667**), and the gender variable comparing males to females approached significance (Estimate = -1.30, p = 0.0908), suggesting a trend toward lower scores for males. In AI in Healthcare, the intercept was significant (Estimate = 6.67, p < 0.001**), and ages 15 (Estimate = -4.73, p = 0.0194**), 16 (Estimate = -3.86, p = 0.0434**), and 17 (Estimate = -4.51, p = 0.0222**) demonstrated significant negative effects on scores. In ChatGPT, the intercept was significant (Estimate = 8.50, p = 0.00988**), indicating a higher baseline score. The effect for age 17 (Estimate = -6.61, p = 0.05419) approached significance, indicating a potential trend for lower scores. In Video Games, the intercept was significant (Estimate = 4.25, p = 0.0107**), but no individual age or gender effects were statistically significant. Finally, for Design of Technology, the intercept was significant (Estimate = 5.00, p = 0.00151**). Age 14 (Estimate = -3.23, p = 0.0438) and age 15 (Estimate = -3.40, p = 0.0383**) had significant negative effects on scores, while age 17 (Estimate = -2.66, p = 0.093) approached significance, suggesting a potential decrease in scores for this age group.
This regression model predicted scores across eight groups, with males as the reference category for gender and age was set as adults. For Smart Homes, the intercept was highly significant (p = 0.00015**), indicating a substantial baseline score. However, no individual age or gender effects were statistically significant, although the age group 41-60 approached significance (p = 0.07615), suggesting a potential increase in scores compared to younger individuals (18-30 years). For General Questions, Both the intercept (p = 0.000832) and the age group 41-60 (p = 0.007751**) were significant, indicating that individuals in this age range scored significantly higher than the younger reference group. For Autonomous Vehicles, The intercept was significant (p = 0.00577**), and the age group 41-60 also showed a significant positive effect (p = 0.02601**), reinforcing the trend of higher scores for this age group. For AI in Healthcare, The age group 41-60 was significant (p = 0.0361**), indicating that this age group had significantly higher scores than the reference group. For ChatGPT, The age group 41-60 remained significant (p = 0.0269**), supporting the trend of higher scores for this demographic. For Group 7, The intercept was significant (p = 0.00861**), while the age group 41-60 approached significance (p = 0.08400), suggesting a potential increase in scores for this age group. For Design of Technology, the intercept was highly significant (p = 0.00155**), indicating a strong baseline score. However, no significant age effects were observed, although the trend for higher scores in the age group 41-60 persisted.
Regression Model - Adults
This regression model predicted scores across eight groups, with females as the reference category for gender and age was set as adults. In Safety, nothing was found to be significant. In Smart Homes, the significant intercept (p = 0.000271**) suggests a difference from zero for the reference group of females under 31, while the age group of 41-60 approached significance (p = 0.076152), indicating potentially higher scores. General Questions exhibited a significant intercept (p = 0.02505**) alongside a strong age effect for the 41-60 age category (p = 0.00775), confirming higher scores compared to the reference group. Similarly, Autonomous Vehicles demonstrated a significant intercept (p = 0.0255**) and increased scores for the 41-60 age group (p = 0.0260), reinforcing previous observations. In AI in Healthcare, the 41-60 age category was significant (p = 0.0361**), indicating notable differences in scores. Group 6 presented a significant intercept (p = 0.0668**) and an effect for the age category of 41-60 (p = 0.0269), suggesting continued higher scores in this demographic. For Video Games, the significant intercept (p = 0.0121**) indicates a meaningful baseline, with the age group of 41-60 approaching significance (p = 0.0840), highlighting its relevance in score outcomes. Finally, Design of Technology revealed a significant intercept (p = 0.036), further supporting the notion of significant differences in baseline scores.
These analyses indicate that the age category of 41-60 years consistently correlates with higher scores across both male and female groups. The significant intercepts across several groups also demonstrate substantial baseline differences in scores. Gender, with "Male" or "Female" as the reference categories, did not exhibit significant effects, suggesting that the observed score differences are primarily driven by age rather than gender.
ANOVA Testing
Analysis of Variance (ANOVA) tests were conducted in order to investigate whether significant differences existed within factors such as participant age, gender, frequency of technology usage, and comfort with technology with respect to dissonance scores associated with questions from a certain category.
Among adolescent participants, there was no significant difference (p<0.05) between the frequency with which participants used technology with respect to dissonance scores associated with any group. However, there was a significant difference among adolescent participant ages with respect to dissonance scores associated with safety (p=0.00933), ChatGPT (p=0.0471), video games (p=0.0132), and design of technology (p=0.00701). There was also a significant difference among adolescent participant genders with respect to dissonance scores associated with safety (p=0.0423) and autonomous vehicles (p=0.0187). There was no significant difference between comfort levels with technology with respect to dissonance scores from any group.
For adult participants, there was no significant difference between participant frequency of technology usage, age, or gender with respect to dissonance scores associated with any group. However, there was a significant difference between adult participant comfort levels with technology with respect to dissonance scores associated with safety (p=0.00682).
Correlation - Adolescents
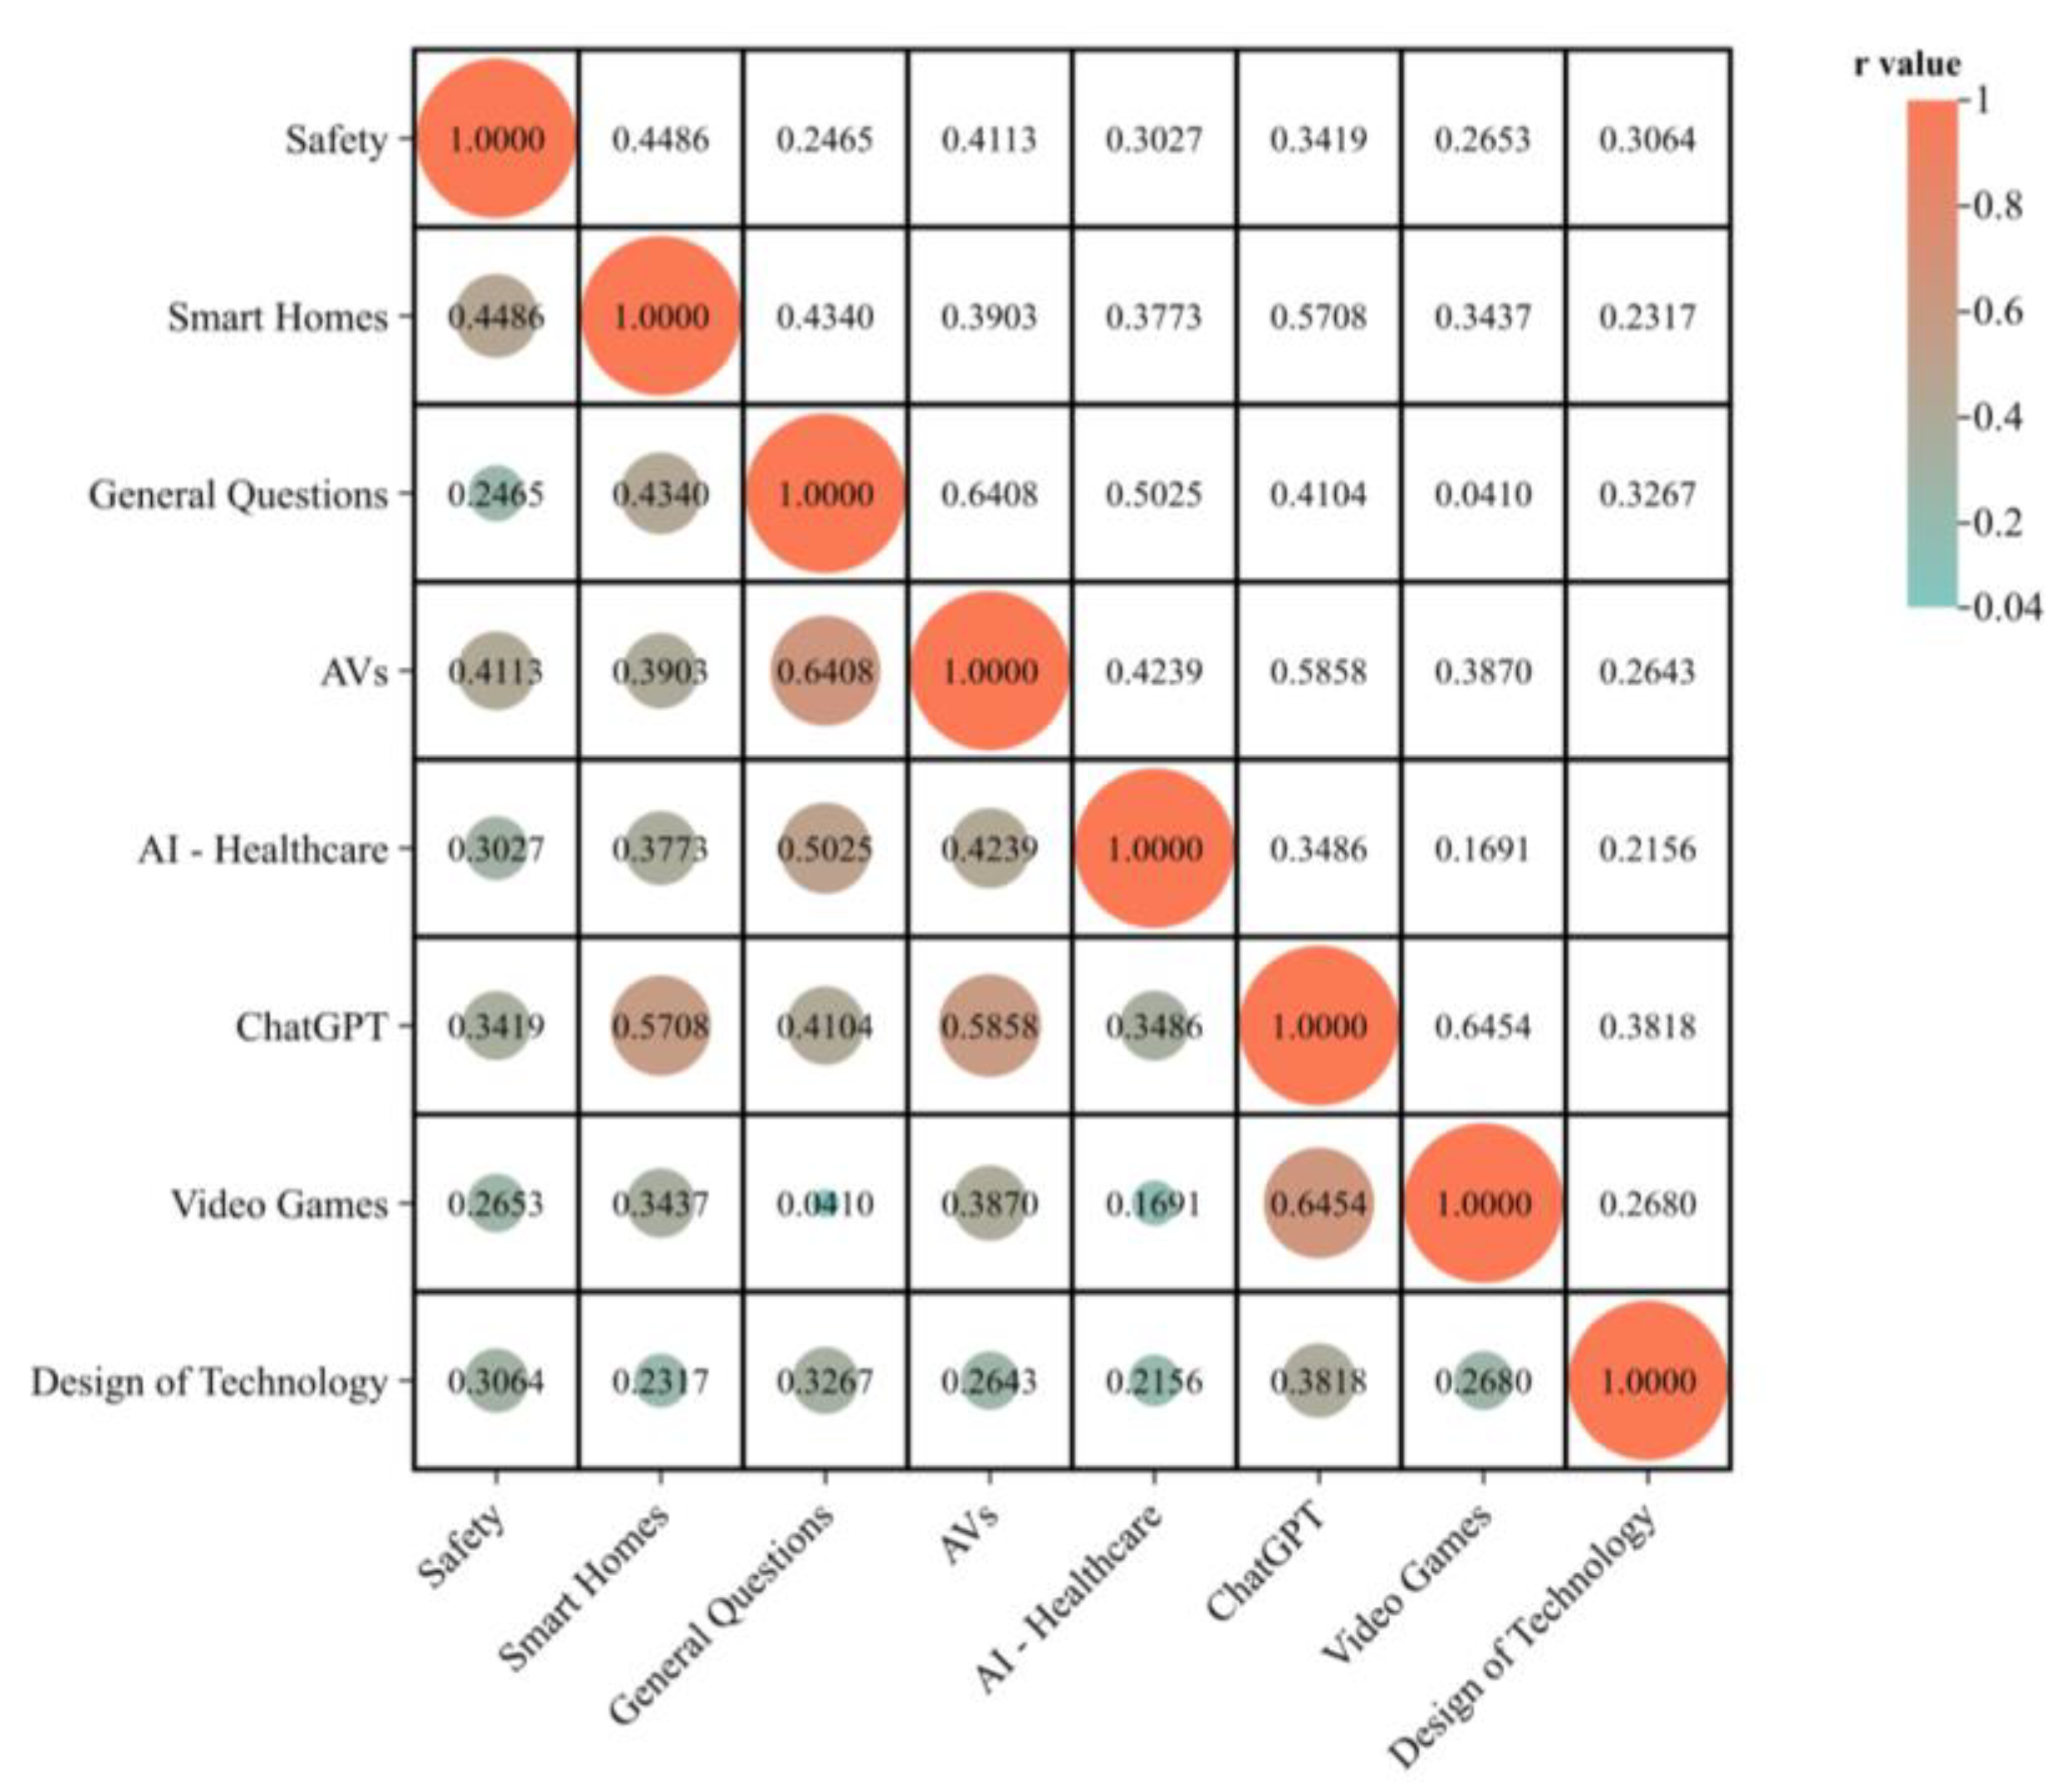
This set of visualizations reveals strong correlations between key technology categories, with notable associations between General Questions and AVs (r = 0.640), AI in Healthcare and AVs (r = 0.423), and ChatGPT and Video Games (r = 0.645). These relationships suggest significant intersections in public discourse, particularly around AI, autonomous vehicles, and gaming. The p-values further support the statistical significance of these correlations, such as for General Questions and AVs (p = 0.00025) and Smart Homes with ChatGPT (p = 0.00027). These findings underscore the interconnectedness of AI, healthcare, smart technologies, and autonomous systems, highlighting areas for further exploration as these fields continue to evolve.
Figure 7.
Adolescent Groups Pearson Correlation Heat Map.
Figure 7.
Adolescent Groups Pearson Correlation Heat Map.
Correlation - Adults
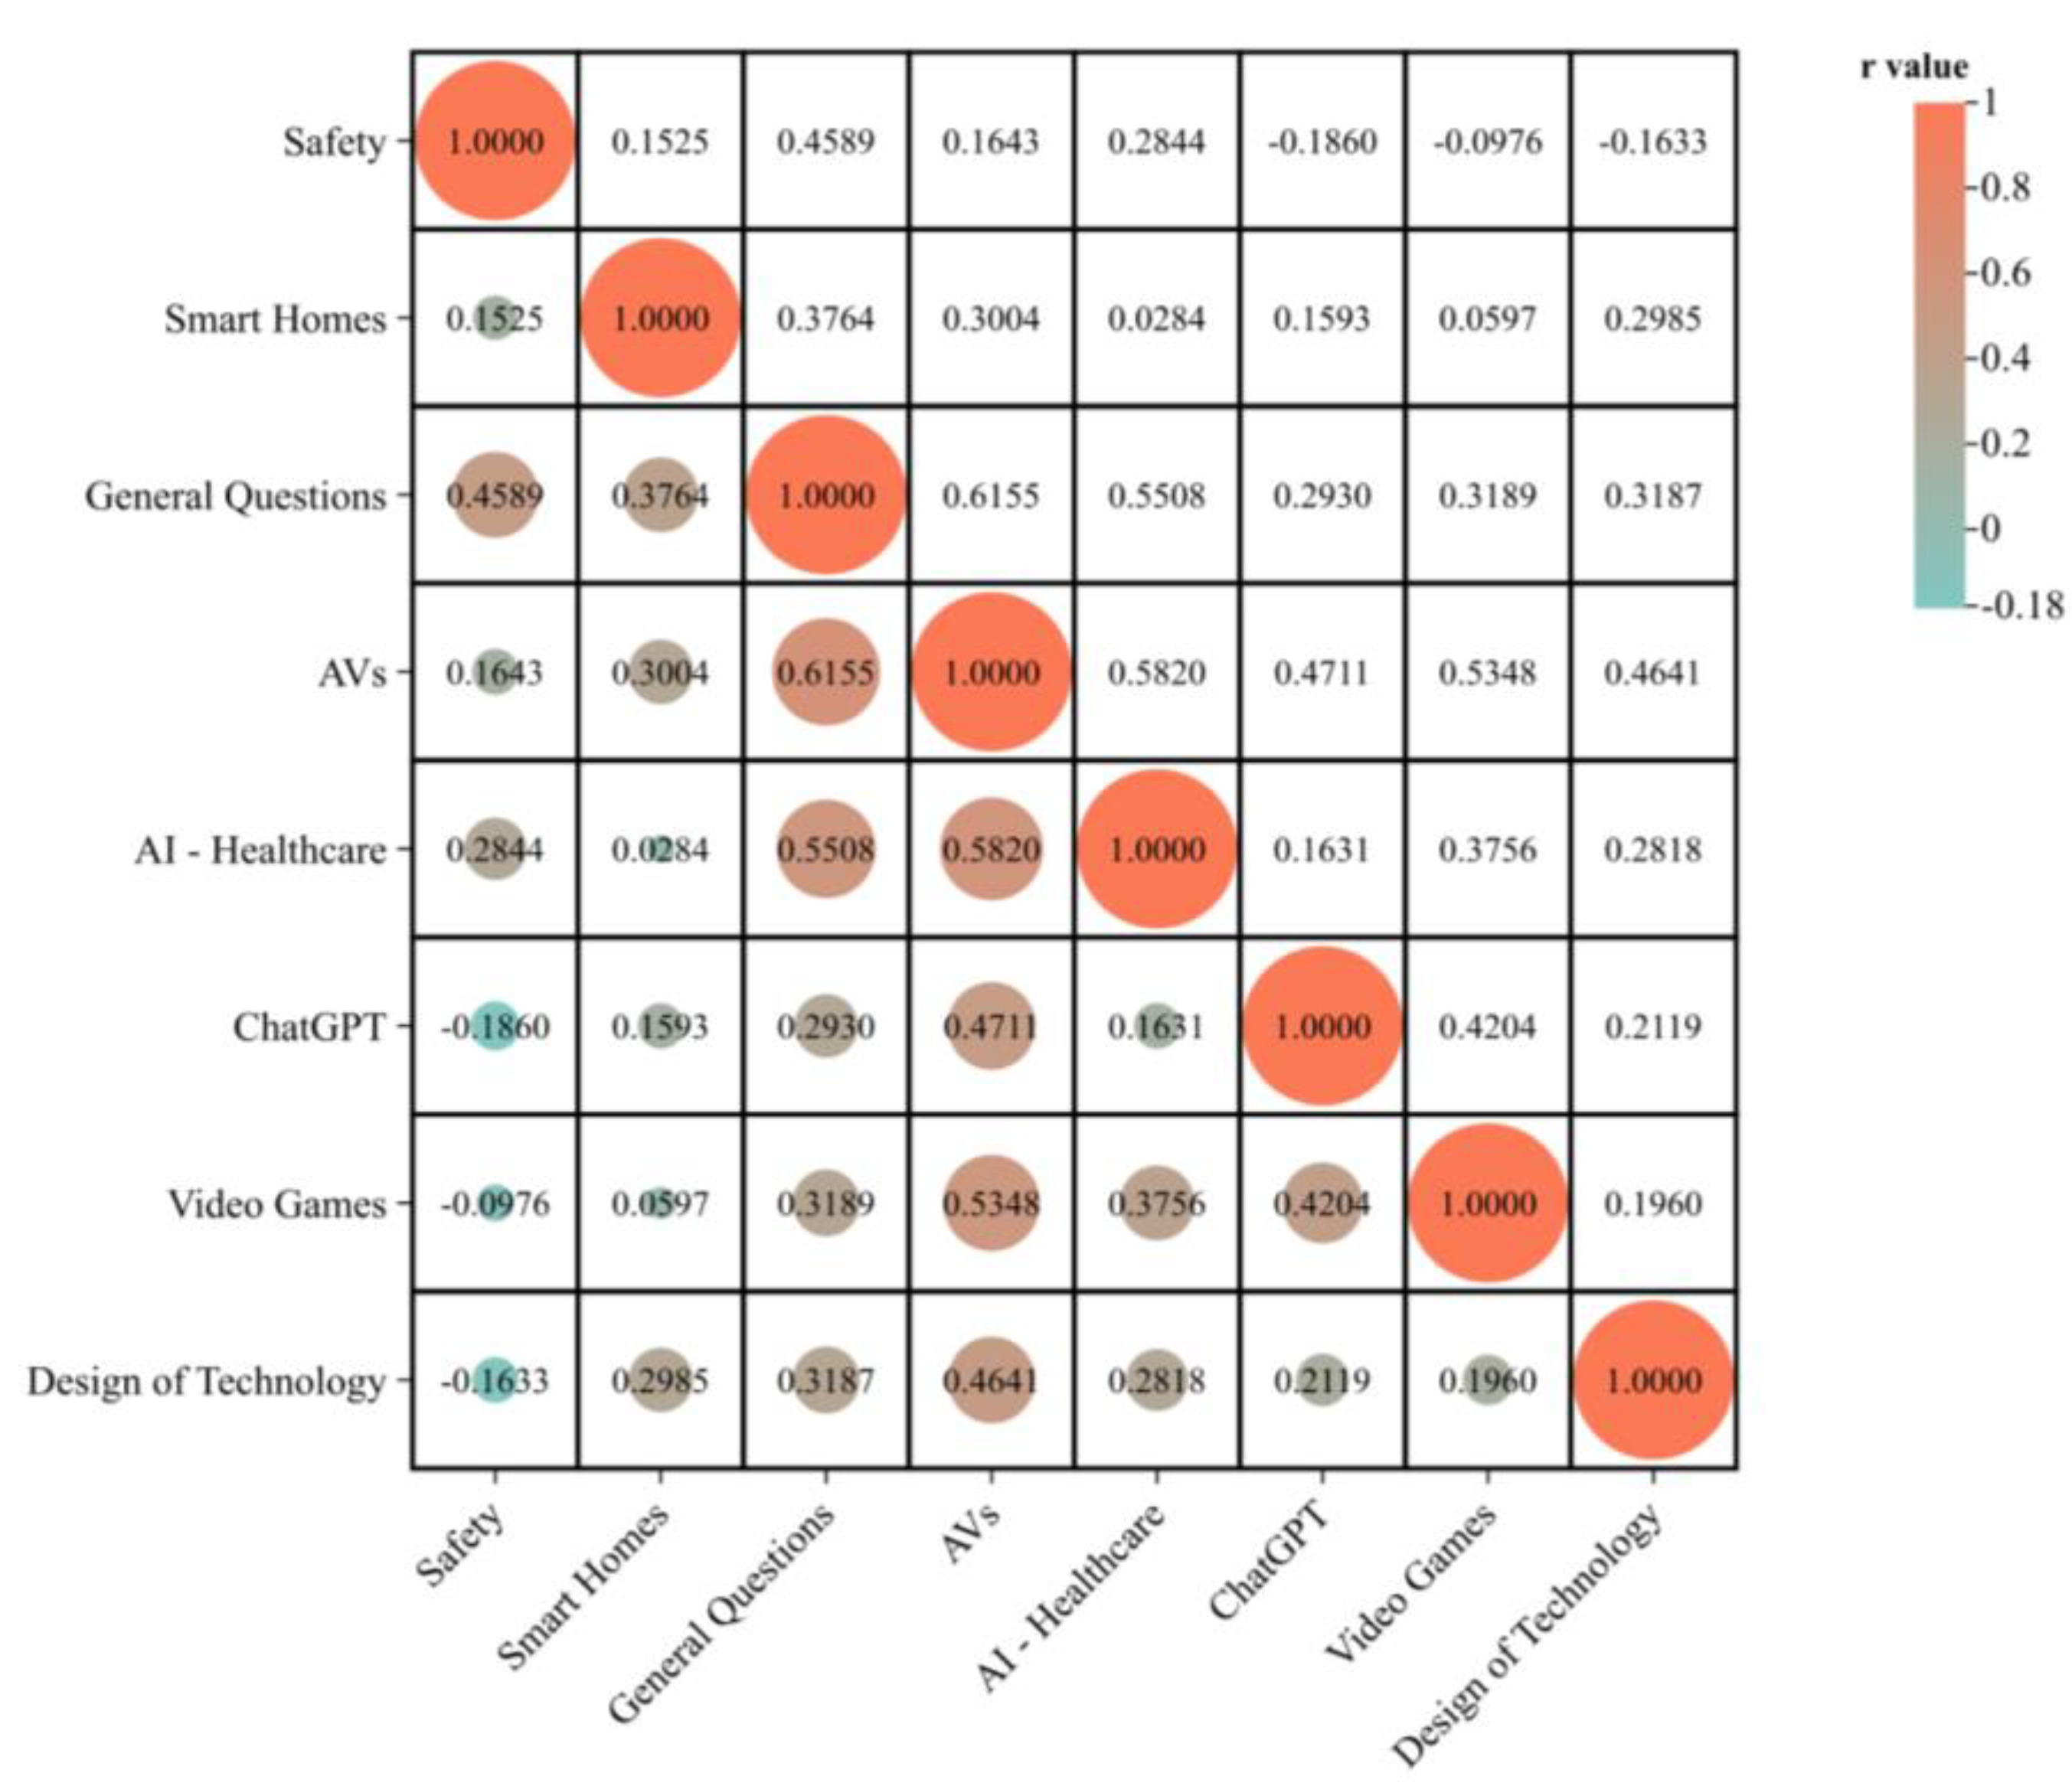
The provided visualizations (correlation heatmap and tables of r-values and p-values) explore the interrelationships among various research categories, such as Safety, Smart Homes, AVs, AI in Healthcare, and more. From the correlation matrix, notable positive correlations exist between categories like General Questions and AVs (r = 0.615), as well as AI in Healthcare and AVs (r = 0.582). These correlations suggest that topics in these areas tend to occur together in research discussions or public inquiries. Conversely, the negative correlation between ChatGPT and Safety (r = -0.186) implies a weak inverse relationship, potentially indicating that concerns about safety are less associated with discussions around conversational AI. The p-values in the table reinforce the statistical significance of these relationships, with lower values, such as for General Questions and AVs (p = 0.000011), indicating a highly significant correlation. Overall, this analysis reveals important intersections between technology topics that warrant further exploration to understand public perception and scholarly focus.
Figure 8.
Adult Groups Pearson Correlation Heat Map.
Figure 8.
Adult Groups Pearson Correlation Heat Map.
4. Discussion & Conclusion
This study investigates how humans respond to various advanced technological designs regarding cognitive dissonance, which describes a human’s conflicting behaviors and actions. Observations from this study conclude that humans respond with cognitive dissonance to various technologies, aligning with findings from previous studies and providing new insights and nuances in correspondence to specific technologies. In this study’s design, remember that a higher score indicates lower dissonance, and a lower score indicates higher dissonance.
The significant finding of this study can be found in the results for the differences in cognitive dissonance between adolescents and adults, notably regarding ChatGPT and video games, where adolescents scored 16.67% and 11.38 lower than adults. Among these categories, the dissonance was much more pronounced among adolescents, suggesting that the younger participants may face ethical questions about the use of technology versus practicality. For instance, from the responses about the category of ChatGPT, there was higher inner conflict among adolescents. This high variability in adolescent responses does show that this younger demographic may feel torn between societal expectations and their personal gains in using some of these technologies. Additionally, AI in the healthcare category showed some marginal significance for adolescents, suggesting they might have deeper concerns or uncertainties about how AI is used in essential areas like medicine. This finding indicates that younger participants may need help reconciling the idea of letting AI make sensitive decisions, such as those related to healthcare, even though they see the potential benefits, like lower costs and greater efficiency. Adults scored 23% higher than adolescents in Autonomous Vehicles, indicating that adolescents feel more significant dissonance in this category. This is likely due to how teens explore their newfound driving abilities, correlating them with a newfound sense of independence. AVs take away this independence and grab control from the driver, causing dissonance among teens as they debate about fulfilling their independence or relying on an external system. Adolescents typically score higher in ChatGPT, Video Games, and Design of Technology, and the medians of these groups, especially adolescents, are clearly higher than Adults. Adults generally show more variability in several groups, especially in AI-Healthcare, Autonomous Vehicles, and Smart Homes. Typically, most participants fall within a specific range of responses. Therefore, hypothesis 1 is supported as differences in perceived dissonances regarding various technologies have notably been noticed in adolescents and adults in ChatGPT, AI in healthcare, and Autonomous Vehicles.
Upon reviewing the data with the stricter correlation threshold (r > 0.75 or r < -0.75), the hypothesis “H2: There will be correlations between levels of dissonance for different subsets of technology” is not strongly supported by the presented graphs and tables. None of the R-values in the correlation matrix meet the threshold for a significant correlation, as all of the observed correlations fall between -0.75 and 0.75. For example, while notable, the highest observed correlation between ChatGPT and Video Games (r = 0.645) does not exceed the 0.75 threshold needed to indicate a strong correlation. Other relationships, such as General Questions and AVs (r = 0.640) and AI in Healthcare with AVs (r = 0.423), also fall short of the required threshold. Consequently, the data suggests that while there may be some level of association between the different technology subsets, there is no strong statistical evidence to support the hypothesis of significant dissonance correlations under the defined criteria. This is a positive result of the study, showing that user dissonance for a certain technology category is not affected by experiences in other categories and is, in fact, independent.
Gender also had a notable impact on the levels of dissonance experienced, especially among adolescents in the safety and autonomous vehicles categories. Male participants reported lower dissonance scores, which suggests they feel more conflicted about trusting autonomous technologies. Male respondents tend to have lower median scores than females across most categories, particularly in ChatGPT, Safety, and AI-Healthcare, indicating that females have less dissonance overall. It suggests that females are better at reconciling with their conflicting beliefs and actions or experience less internal conflict when doing so. Based on the group’s medians, females scored about 71% higher than males in ChatGPT, indicating that males experience higher dissonance in that category. In Autonomous Vehicles, comparing the medians, there’s an outlier where females score 33.33% higher and experience less dissonance.
On the other hand, the category of Smart Homes shows marginal differences, with females scoring only 1.74% higher than males, indicating that this group has similar levels of cognitive dissonance; this finding is particularly interesting as it is the only group without any substantial gender dissonance differences. The variability in female responses is often more considerable, as indicated by longer whiskers and outliers in several categories. This suggests that females might have more diverse opinions or experiences with these topics, whereas male responses are more clustered within narrower ranges. More consistently, females scored higher than males across all but General Questions, whereas, when comparing the medians, males scored about 10.98% higher. This indicates that females experience less dissonance than men in all categories but General Questions, most likely due to their ability to handle the internal burden and conflicting beliefs better. Therefore, hypothesis 3 is supported as differences in perceived dissonances regarding various technologies have been noticed in males and females in ChatGPT, AI in healthcare, Autonomous Vehicles, and General Questions, notably.
Again, the Cognitive Dissonance Theory (CDT) states that when an individual holds two or more contradictory beliefs, this internal burden will naturally cause them to attempt to resolve the burden by altering their behaviors or actions (Cooper et al., 2019). The participants’ behavior aligns with CDT as they wrestle with the contradictory paired statements in the survey, which causes them an internal burden and results in the participants leaning towards certain behaviors or actions to compensate. However, they answer in contradicting ways, agreeing and disagreeing with the same statement worded differently or agreeing to two contradictory statements (Dykema et al., 2021). For example, with the latter scenario, a teen experiencing cognitive dissonance may highly agree with how AVs are dangerous to rely on as they are not morally responsible while driving. Yet, they may also agree with the contradictory statement that they’d be comfortable using self-driving cars (Li et al., 2022).
Potential implications of this study are in regards to behavioral plasticity, which is defined as the change in an individual’s behavior due to exposure to stimuli (Oberman & Pascual-Leone et al., 2013; Marzola et al., 2023). Behavioral plasticity serves as a critical mechanism for navigating the cognitive dissonance caused by emerging technologies. As participants experienced stimuli such as internal burden or psychological tension (cognitive dissonance), they shifted their behaviors. They selected a response to relieve their burden–a response they may not have fully agreed with before answering. This action demonstrates alignment with behavioral plasticity as the participant changed their behavior in response to the changing stimuli (internal burden by the paired statements). For example, adolescents exhibit high variability (i.e., high cognitive dissonance) in their responses to ChatGPT due to their adaptive tendencies to reconcile ethical concerns regarding technology with practical beliefs. This highlights adolescents’ potential to embrace or reject new tools as they can reshape their attitudes while under the influence of peers and society.
Meanwhile, adults demonstrate less behavioral plasticity (i.e., less cognitive dissonance) in categories such as Autonomous Vehicles, primarily due to already-established sentiments and cognitive schemas related to safety or control. These findings highlight the importance of designing technologies that align with behavioral plasticity to ensure a smooth transition from cognitive dissonance to acceptance. Current technology introduces abrupt changes that contradict users’ expectations, which leads to dissonance and possible rejection. Thoughtful technology design can reduce this dilemma. Understanding behavioral patterns enables designers to create step-by-step transitions for the technology that aligns with how users naturally learn and accept new concepts. Therefore, future studies should focus on exploring how these adaptive mechanisms, namely cognitive dissonance in relation to behavioral plasticity, evolve to inform user-centered technology design and policy-making.
One significant limitation of this study is the relatively small sample size, which may affect the generalizability of the findings. Additionally, the demographic composition was predominantly Asian. This limits the diversity of the sample size (Shea et al., 2022). Future studies should include more diverse groups to extend the applicability of these findings across different regions and a larger sample size.
Acknowledgments
The authors of this study would like to thank the principal investigator, Sahar Jahanikia, and ASDRP (Aspiring Scholars Directed Research Program) for their invaluable support during this project.
References
- Aldrich, F. K. (2003). Smart homes: Past, present, and future. Inside the Smart Home, 17–39.
- Arunvivek, J., Srinath, S., & Balamurugan, M. S. (2015). Framework development in home automation to provide control and security for home automated devices. Indian Journal of Science and Technology, 8.
- Atske, S., & Atske, S. (2024, April 14). Teens, Social Media and Technology 2023. Pew Research Center. https://www.pewresearch.org/internet/2023/12/11/teens-social-media-and-technology-2023/.
- Bonnefon, J. F., Shariff, A. F., & Rahwan, I. (2016). The social dilemma of autonomous vehicles. Science, 352(6293), 1573–1576
. [CrossRef]
- Cancino-Montecinos, S., Björklund, F., & Lindholm, T. (2020). A general model of dissonance reduction: unifying past accounts via an emotion regulation perspective. Frontiers in Psychology, 11. [CrossRef]
- Cantor, P., Osher, D., Berg, J., Steyer, L., & Rose, T. (2018). Malleability, plasticity, and individuality: How children learn and develop in context1. Applied Developmental Science, 23(4), 307–337. [CrossRef]
- Cooper, J. (2019). Cognitive dissonance: where we’ve been and where we’re going. International Review of Social Psychology, 32(1). [CrossRef]
- Deng, M., & Guo, Y. (2022). A study of safety acceptance and behavioral interventions for autonomous driving technologies. Scientific Reports, 12(1). [CrossRef]
- Dhagarra, D., Goswami, M., & Kumar, G. (2020). Impact of trust and privacy concerns on technology acceptance in healthcare: An Indian perspective. International Journal of Medical Informatics, 141, 104164. [CrossRef]
- Dykema, J., Schaeffer, N. C., Garbarski, D., Assad, N., & Blixt, S. (2021). Towards a reconsideration of the use of agree-disagree questions in measuring subjective evaluations. Research in Social and Administrative Pharmacy, 18(2), 2335–2344. [CrossRef]
- Festinger, L. (1962). Cognitive dissonance. Scientific American, 207, 93–102.
- Fleetwood, J. (2017). Public health, ethics, and autonomous vehicles. American Journal of Public Health, 107(4), 532–537. [CrossRef]
- Kim, Y. (2011). Application of the cognitive dissonance Theory to the service industry. Services Marketing Quarterly, 32(2), 96–112.
- Li, L., Zhang, J., Wang, S., & Zhou, Q. (2022). A study of Common Principles for Decision-Making in Moral Dilemmas for Autonomous Vehicles. Behavioral Sciences, 12(9), 344. [CrossRef]
- Lv, J., & Liu, X. (2022). The impact of information overload of E-Commerce platform on consumer return intention: Considering the moderating role of perceived environmental effectiveness. International Journal of Environmental Research and Public Health, 19(13), 8060. [CrossRef]
- Marikyan, D., Papagiannidis, S., & Alamanos, E. (2019). A systematic review of the smart home literature: A user perspective. Technological Forecasting and Social Change, 138, 139–154.
- Marikyan, D., Papagiannidis, S., & Alamanos, E. (2020). When technology does not meet expectations: A cognitive dissonance perspective. UK Academy for Information Systems 2020 Conference Proceedings. https://research-information.bris.ac.uk/ws/portalfiles/portal/287878388/ID_287779185_1_.pdf.
- Marikyan, D., Papagiannidis, S., & Alamanos, E. (2021, September 3). The use of smart home technologies: Cognitive dissonance perspective. University of Bristol. https://research-information.bris.ac.uk/en/publications/the-use-of-smart-home-technologies-cognitive-dissonance-perspecti.
- Marzola, P., Melzer, T., Pavesi, E., Gil-Mohapel, J., & Brocardo, P. S. (2023). Exploring the role of neuroplasticity in development, aging, and neurodegeneration. Brain Sciences, 13(12), 1610. [CrossRef]
- McCarroll, C., & Cugurullo, F. (2022). Social implications of autonomous vehicles: A focus on time. AI & Society, 37(2), 791–800. [CrossRef]
- Nowakowski, C., Shladover, S. E., Chan, C., & Tan, H. (2015). Development of California regulations to govern testing and operation of automated driving systems. Transportation Research Record: Journal of the Transportation Research Board, 2489(1), 137–144. [CrossRef]
- Oberman, L., & Pascual-Leone, A. (2013). Changes in plasticity across the lifespan. Progress in Brain Research, 91–120. [CrossRef]
- Orwat, C., Graefe, A., & Faulwasser, T. (2008). Towards pervasive computing in health care – A literature review. BMC Medical Informatics and Decision Making, 8. [CrossRef]
- Rock, L. Y., Tajudeen, F. P., & Chung, Y. W. (2022). Usage and impact of the internet-of-things-based smart home technology: a quality-of-life perspective. Universal Access in the Information Society, 23(1), 345–364. [CrossRef]
- Salinas-Melgoza, A., Wright, T. F., & Salinas-Melgoza, V. (2013, January 23). Behavioral plasticity of a threatened parrot in human-modified landscapes. Biological Conservation. https://www.sciencedirect.com/science/article/abs/pii/S0006320712005113.
- Shea, L., Pesa, J., Geonnotti, G., Powell, V., Kahn, C., & Peters, W. (2022). Improving diversity in study participation: Patient perspectives on barriers, racial differences and the role of communities. Health Expectations, 25(4), 1979–1987. [CrossRef]
- Valencia-Arias, A., Cardona-Acevedo, S., Gómez-Molina, S., Gonzalez-Ruiz, J. D., & Valencia, J. (2023). Smart home adoption factors: A systematic literature review and research agenda. PLoS ONE, 18(10), e0292558. [CrossRef]
- Vaghefi, I., & Qahri-Saremi, H. (2017). From IT addiction to discontinued use: A cognitive dissonance perspective. Proceedings of the 50th Hawaii International Conference on System Sciences. [CrossRef]
- Zhang, Z., Singh, J., Gadiraju, U., & Anand, A. (2019). Dissonance between human and machine understanding. Proceedings of the ACM on Human-Computer Interaction, 3(CSCW), 1–23. [CrossRef]
- Zhang, B., Bi, G., Li, H., & Lowry, P. B. (2020, July 20). Corporate crisis management on social media: A morality violations perspective. Heliyon. https://www.sciencedirect.com/science/article/pii/S2405844020312792.
|
Disclaimer/Publisher’s Note: The statements, opinions and data contained in all publications are solely those of the individual author(s) and contributor(s) and not of MDPI and/or the editor(s). MDPI and/or the editor(s) disclaim responsibility for any injury to people or property resulting from any ideas, methods, instructions or products referred to in the content. |
© 2024 by the authors. Licensee MDPI, Basel, Switzerland. This article is an open access article distributed under the terms and conditions of the Creative Commons Attribution (CC BY) license (http://creativecommons.org/licenses/by/4.0/).
