1. Introduction
Wheat production is crucial for feeding the global population and represents one of the most important agricultural systems [
1]. The Mediterranean basin accounts for 60% of the world production of durum wheat (DW) [
2], which is traditionally grown under rainfed conditions using conventional tillage [
3]. With 16 million hectares and a yield of 38 million tons annually, durum wheat (DW) is one of the most cultivated cereals in the Mediterranean [
3,
4]. The demand for wheat is expected to increase by 60% by 2050 to meet the needs of a growing global population, projected to reach nine billion [
5]. However, climate change poses significant challenges to DW production, including variability in yield and quality due to the impacts of climate change [
6]. The main producers of DW in Europe are Italy, Greece and Spain, which together account for about 80% of total EU production. Italian wheat production in 2020 covered an area of 1,23 Mha and yield 3,849,384 tons of grain [
7].
However, DW production is strongly influenced by environmental and climatic factors, in particular water availability and high temperatures [
8,
9]. This is particularly critical in the Mediterranean region, which faces harsh climatic conditions and freshwater scarcity. This highlights the need for environmental awareness to achieve resource efficiency and increase ecosystem welfare and quality [
10]. Cereal production, while vital for human nutrition, often comes with environmental consequences that threaten biodiversity and ecosystem functions [
11]. Cereal crops contribute about 35% of human caloric intake (Ross-Ibarra et al., 2007), yet their cultivation is associated with practices that harm the environment by altering water resources and climatic conditions [
12,
13]. Furthermore, cereals are often grown in industrialized monocultures, which are known to require large amounts of pesticides, fertilizers and fossil fuel [
14,
15].
To mitigate these impacts, conventional farming practices must evolve to incorporate eco-design and circular economy principles, enhanced by renewable energy sources[
16,
17]. This is even more applicable to agricultural production, which is now widely considered to be the main cause of environmental and human health degradation [
18], due to the use of: a) large amounts of water for irrigation, contributing to the depletion of water resources; b) chemical fertilizers and pesticides, the production and use of which involves the consumption of primary energy resources and generates air, water and soil pollutants and health problems; c) fossil fuels, which are considered responsible for the extraction of primary energy resources and the emission of greenhouse gases (GHG) as a result of their production and combustion.
The Mediterranean climate is characterized by inter-annual and seasonal variability in precipitation, as well as frequent heat stress periods, which often lead to water deficit situations during the most sensitive stages of the wheat growth cycle, significantly reducing productivity [
19]. This circumstance tends to be aggravated by climate change [
20], contributing to the unpredictability of productive responses and the instability of a sector already weakened by income gaps and fluctuations. To address the constraints in Mediterranean wheat production, specific agronomic practices can stabilize and even increase yields, ensuring better water use efficiency and higher grain quality. Several studies [
21,
22,
23,
24,
25] highlight the potential of these practices, including the provision of additional irrigation, as discussed by [
26,
27]. Moreover, many studies have explored the application of efficiency and productivity indicators for water and nutrient use under varying water regimes [
22,
28,
29,
30,
31,
32].
Water productivity values, expressed as the ratio between the product obtained (grain yield) and the input used (crop evapotranspiration, for crop water productivity, and the volume of irrigation water, for irrigation water productivity), are indicators for assessing the impact of different options on resource productivity and farm outcomes [
33,
34]. Furthermore, the assessment of the impact of human consumption on freshwater resources used in industrial and/or agricultural processes, called ‘virtual water’, has been carried out using the Water Footprint (WFP) concept [
35] (Hoekstra, 2003). The WFP is a tool commonly used to analyze water management and the WF of a product is defined as the volume of freshwater used to produce that product and should be measured along the entire supply chain. This is more commonly expressed as the volume of water per unit of product (m
3 t
-1) [
36].
Hoekstra et al. [
36] describe the concept of blue, grey and green water. Blue WFP measures the amount of available water that is consumed in a given period and therefore not immediately returned to the catchment; Grey WFP of a process step is an indicator of the degree of freshwater pollution associated with it and is defined as the volume of freshwater required to assimilate the pollutant load; Green WFP is an indicator of human water use and refers to precipitation that does not run off or recharge the groundwater, but is stored in the soil or temporarily remains on the soil surface or vegetation. The sum of these three components gives the total WFP. In agriculture, many studies emphasize the importance of responsible use of water resources [
37]. The WFP indicator [
38] is a tool that provides interesting information for policy makers [
39] and economists and is useful for water management. Rodriguez et al. [
40] highlighted the importance of agricultural practices, such as irrigation and fertilization, on crop WFP. However, the WFP indicator should be considered as a partial tool that can be used together with other indicators to allow a deeper look at integrated policies [
41]. Global water and carbon-energy cycles are inextricably linked [
42]. Scientific evidence has shown that the climate is changing rapidly, mainly due to increasing greenhouse gas emissions [
43] resulting from various human activities, including agriculture [
44].The carbon footprint (CFP) of a product corresponds to the greenhouse gas emissions associated with the life cycle of that product, calculated from cradle to grave [
45,
46]. It is usually expressed as the amount of CO
2_eq for a previously defined unit of measurement. Thus, the CFP is part of the Life Cycle Assessment (LCA) methodology, which is already applied in many production sectors, including food analyses. It has been used in the cereals sector since the 2000s [
47] and has contributed significantly to improving information on the environmental impacts of cereal production systems. In contrast to LCA, which is more complex and linked to a broader range of environmental impact categories, these indicators are more easily understood by the media and the organized retail trade.
This study aimed to comprehensively evaluate the impact of the most common agricultural practices on conventional wheat production in the province of Foggia, southern Italy, under Mediterranean climatic conditions. The AquaCrop-GIS software (ver. 2.1) was used to simulate the yield response of DW to different sowing dates (15 October, 1 November and 15 November) and water management practices, including rainfed conditions and supplemental irrigation during the flowering stage. Moreover, the environmental impact of these agricultural practices was quantified by assessing their CFP and WFP using a free tool designed to estimate the environmental impact of durum wheat production (CWFP application) [
48]. Through this tool, the greenhouse gas emissions associated with the life cycle of durum wheat production were determined, from the extraction of raw materials necessary to produce agro-technological inputs to their application in the field and the harvesting of the grain. Water consumption was also assessed, considering both blue and green water and the associated footprints. Therefore, by using AquaCrop-GIS and CWFP, the trade-offs between the productive performance of durum wheat cultivation and environmental sustainability were analyzed. This included examining how different cropping options—such as sowing dates and irrigation—combined with climatic variables and soil types at specific cultivation sites, could balance performance and sustainability within traditional durum wheat production.
2. Materials and Methods
The research approach followed a hierarchical scale, where each numerical level played a critical role in guiding the subsequent analysis. Starting with an examination of the production context, customized simulation scenarios were developed to assess the performance of DW cultivation in relation to environmental impacts. The results of these simulations were then analyzed through appropriate numerical methods to extract meaningful insights.
2.1. Context of the Investigated Scenarios
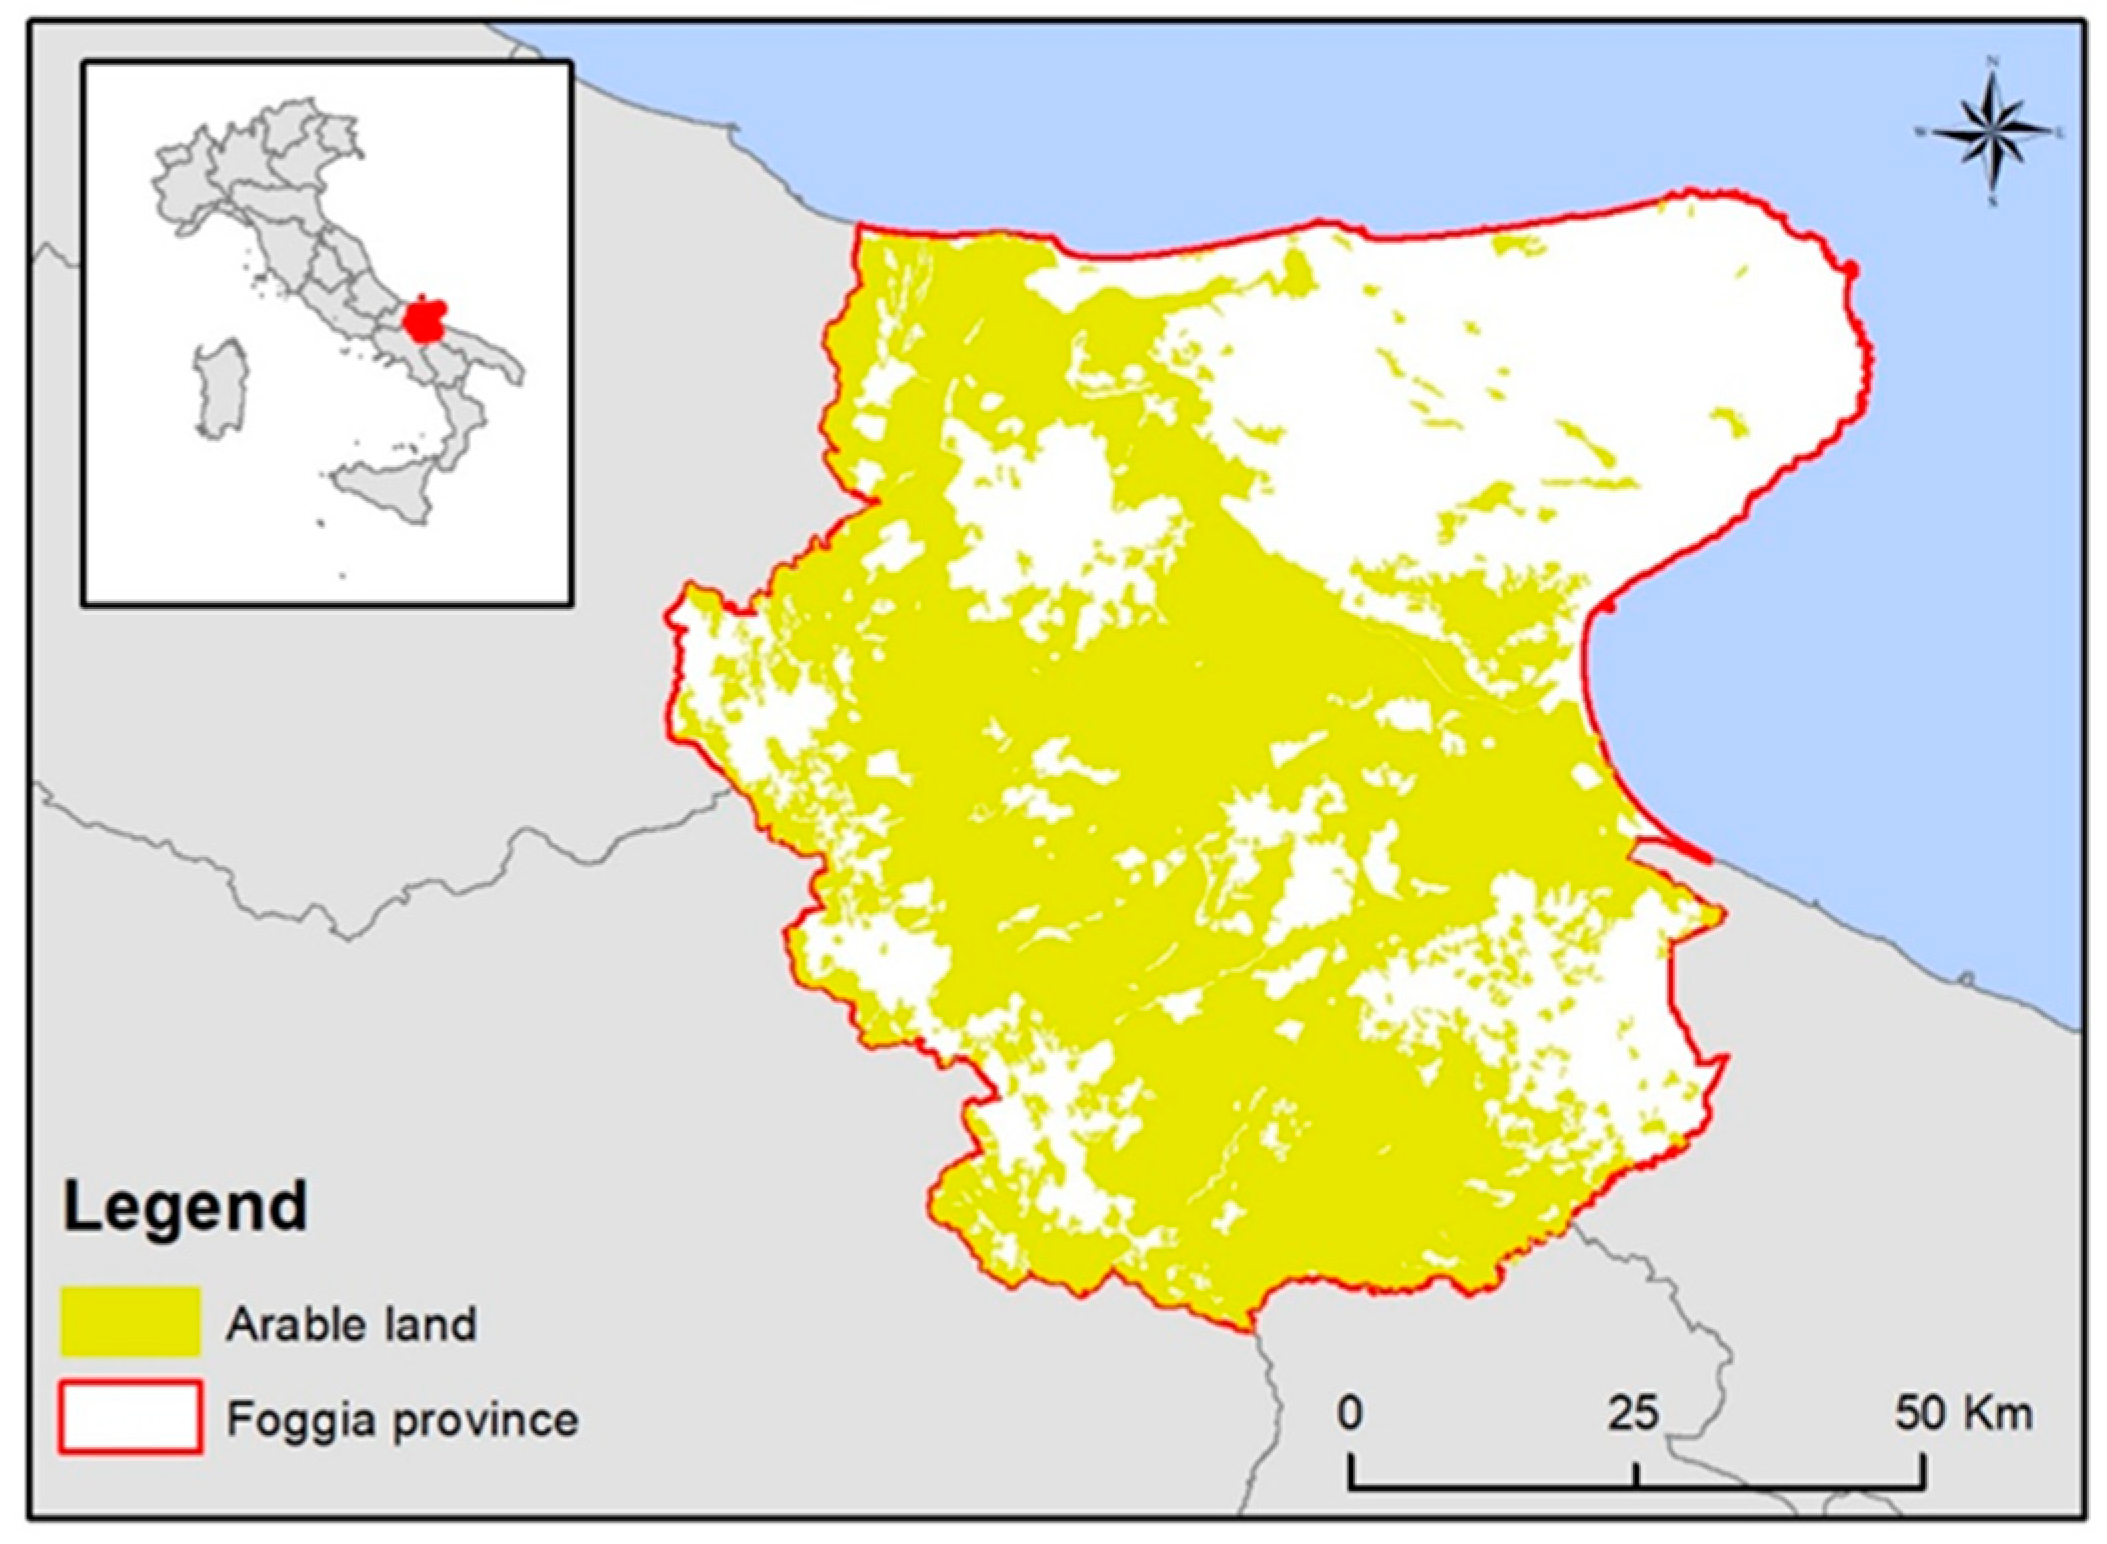
Simulation scenarios were based on actual practices followed by farmers in the province of Foggia, also known as Capitanata, in the Apulia region (41°27′ N, 15°33′ E, 76 m a.s.l.:
Figure 1). This area is Italy’s leading producer of DW, accounting for 38% of the total cultivated land dedicated to this crop [
49]. DW is grown in continuous cropping systems, with sowing typically occurring between mid-October and mid-November.
Land preparation for sowing involves summer ploughing followed by two harrowings. Just before sowing, the soil is finely tilled using a rotary tiller to prepare the seedbed, preceded by the application of nitrogen fertilizer. A second nitrogen application is provided during the vegetative phase (first half of March).
Grain is harvested using a combined harvester with straw either left on the ground or collected as bales. In Capitanata, DW is typically grown under rainfed conditions, though in particularly dry years, farmers may resort to irrigation until the flowering stage, with 1-2 irrigations aimed at stabilizing yields rather than increasing productivity. The conventional tillage system described above is used by most farms cultivating DW in continuous cropping systems, covering approximately 96% of the area dedicated to this crop.
2.2. Simulation Setup
To simulate DW production under continuous cropping in Capitanata, AquaCrop (version 2.1, GIS extension) was utilized This software allows for the simulation of multiple scenarios, including variations in crop type, irrigation management, soil characteristics, and climatic conditions, with outputs tailored to specific input combinations. Developed by the Food and Agriculture Organization (FAO) [
50,
51], AquaCrop predicts crop productivity, water demand, and water use efficiency under water-limited conditions [
52]. Its framework is based on the principles of crop yield response to water [
53].
AquaCrop has been applied to different scenarios such as rain-fed conditions, deficit irrigation, full water supply and on-farm water management strategies, all aimed at improving water efficiency in agriculture [
54]. The model balances accuracy, simplicity, and robustness, making its parameters intuitive and transparent for users [
51]. AquaCrop formalizes processes such as soil water dynamics, canopy development, phenology, plant growth, and yield formation, accounting for both potential growth and stress-modulated growth. Thermal and water stresses are modeled as functions of climatic factors, including temperature, rainfall, evapotranspiration, and atmospheric CO₂ concentrations [
55]. Irrigation management in AquaCrop affects soil water balance, crop management and yield [
52]. Water is added to the soil reservoir through rainfall and irrigation. In cases of high rainfall intensity, some of the precipitation may be lost to surface runoff, with only a fraction infiltrating into the soil. The infiltrated water is not always retained in the root zone. If the root zone becomes excessively wet, some soil water will percolate out of the root zone, leading to deep percolation losses. In addition, water can move upwards to the root zone by capillary upwelling. Processes such as soil evaporation and crop transpiration remove water from the reservoir. In terms of water use by the cropping system, the daily crop transpiration (Tr, mm day
-1) is distinguished from the daily reference evapotranspiration (ET0i; mm day
-1) and are influenced by the micro-adjusted canopy cover (CC*) as expressed below:
where k
S denotes the soil water stress coefficient and crop coefficient (k
c).
The daily aboveground biomass (TDM, t/ha) is computed using Tri and the water productivity normalized for ET0i (WP
*, g/m; [
56] as:
Finally, dry yield (Y, t/ha) is estimated at maturity from TDM and harvest index (HI, %) according to the equation:
Soil water stress affects canopy development, root zone expansion, induces stomatal closure, reduces crop transpiration rates, affects pollination success, alters yield index and can induce premature canopy senescence. These processes are affected by soil water stress when water stored in the root zone falls below certain thresholds. These thresholds are defined as root zone depletion, a fraction of the total available water. Simulations with AquaCrop covered scenarios produced in several combinations, using 3 sowing dates (15 October, 1 November and 15 November) coupled with 2 irrigation scenarios, namely rain-fed and water supply at the flowering stage, with a maximum of 2 irrigations and a total irrigation volume not exceeding 60 mm. The behaviour of the cropping system is strongly influenced by the pedoclimatic conditions of the cropping context. Therefore, to obtain the most reliable simulations, the soil characteristics were diversified in relation to the soil properties and typical climatic trends of the area under study. Specifically, using the Harmonised World Soil Database [
57], 25 different soils were identified based on Plant Available Water (PAW, mm), hydraulic conductivity (Ksat; mm/day) and Total Organic Carbon (TOC; %). The Harmonised World Soil Database version 2.0 is a unique global soil inventory that provides information on the morphological, chemical and physical properties of soils at a resolution of about 1 km. For the climatic characterization, the weather data used in the simulation procedure were obtained from the Agri4Cast database [
57]. This is part of the Crop Growth Monitoring System developed by the Joint Research Centre and contains meteorological data from weather stations interpolated on a 25 x 25 km grid, available on a daily basis since 1975. Maximum, average and minimum air temperature (T, °C), precipitation (P, mm/d), potential evaporation from a free water surface (E, mm/d), potential evaporation from a moist bare soil surface (ES, mm/d) and potential evapotranspiration from a reference crop canopy (ET0, mm/d) were derived from the weather data. The grid cells covering the reference area were fifteen and the data cover a 13-year period, from 1 January 2010 to 31 December 2023. Using ArcGIS v.10.2 software, the two databases were intersected, resulting in 74 different combinations of soil types and climatic conditions. The pedo-climatic characterization thus obtained was complemented by DW specifications modelled on the inputs required by the simulation model. For DW, the coefficients and parameters required to reproduce its phenotype in AquaCrop were derived from previous modelling carried out in the same growing area as this research [
58]. The simulations, in the different combinations (sowing date*irrigation management*weather*soil), covered a 10-year continuous cropping period, from 1 January 2013 to 31 December 2023.The output variables collected from the AquaCrop outputs concerned grain production, dry biomass at harvest, seasonal ET0, accumulated growing degree days (GDD; °C) and crop growing length averaged over the cropping years.
2.3. Environmental Performance Assessment
The environmental performance of the cropping system was formalized using the Carbon and Water Footprint tool [
59]. This tool quantifies greenhouse gas emissions (expressed as CO₂_eq) and water use (blue and green components) in DW cultivation within the Mediterranean environment. It employs the Life Cycle Assessment (LCA) methodology in compliance with UNI EN ISO 14040 guidelines. CWFP development follows core LCA steps, including defining scope, objectives, system boundaries, input material flows, impact allocation, functional unit, and environmental footprint. The tool’s design focuses on user accessibility, featuring an intuitive interface that integrates key soil and crop management practices. For each selected option, CWFP calculates environmental impacts using processes implemented in SimaPro (version 8). The tool uses a “cradle-to-gate” analysis, which confines the system within the farm boundaries and requires data from sowing to harvesting, accounting for the impacts from raw material extraction, agro-input production, and their application in the field. Material and energy flows include various machinery, equipment, fertilizers, and pesticides relevant to durum wheat cropping systems in the Mediterranean context.
Since the default soil and crop management options in CWFP may not cover all potential farmer practices, algorithms were developed to estimate fuel consumption based on tractor speed and load force [
60] for alternative soil and crop scenarios not included in the default software options. The functional unit of one hectare of cultivated soil simplifies the impact assessment, returning environmental impacts related to GHG emissions per hectare of soil (kg CO
2_eq/ha) and blue water usage (m
3/ha). Recognizing the importance of crop residues left on the soil as a by-product, as required by UNI EN ISO LCA standards, the user is prompted to input straw removal data (kg/ha). In the absence of such data, CWFP uses algorithms based on IPCC [
61] to estimate straw and root production based on grain yield. Straw serves as a source of carbon sequestration if left partially or completely on the soil, but its decomposition can lead to nitrous oxide (N
2O) emissions (kg/ha). Consequently, CWFP balances the carbon stock from straw incorporated into the soil (in the form of kg CO
2/ha) and the carbon released by the mineralization of organic matter (in the form of kg CO
2/ha), together with the N
2O emissions (kg/ha) from straw decomposition, using a simplified algorithm [
62].
The result is obtained through iterative calculations over a 50-year period, considering both the rapid organic carbon dynamics in the early years of the simulation and the steady state thereafter. The resulting balance (Δ kg CO2_eq/ha) is finally algebraically summed with the GHG emissions per hectare of cultivated durum wheat. By providing the grain yield (kg/ha) and moisture content (%), information on the CFP (kg CO2_eq/kg grain) is obtained. In addition, based on material and energy flows within the system, CWFP provides blue water consumption within the cradle-to-gate boundary and green water consumption (m3/ha) based on crop production, thus providing WFP (m3 water/kg grain). As reported in section 2.1, in the CFWF, typical tillage operations for the crop area were entered, namely one ploughing, two harrows and one rotary tillage for seedbed preparation. Seeding and harvesting with a combine harvester and straw removal by baling were then selected. In addition, two fertiliser applications were fixed: urea (50 kg/ha) at sowing and ammonium nitrate (100 kg/ha) a top-dressing in the first half of March. Grain yield was set to the average value obtained from 10 years of simulation with AquaCrop (at 0% humidity) and straw removal was calculated as the difference between the total biomass produced, reduced by 15% to simulate cutting at approximately 15 cm above the ground by the mower bar, and the yield.
The assessment of environmental impacts in terms of greenhouse gas emissions (kg CO2_eq/ha), blue water (BlueW; m3/ha), green water (GreeW; m3/ha) and total water use (TW; m3/ha), carbon footprint (kg CO2_eq/kg grain) and water footprint (m3 water/kg grain) was carried out for each combination of sowing date, irrigation management, soil and climate.
2.4. Data Analysis
The extensive dataset on the productive and environmental performance of DW cropping systems was analyzed using a hierarchical statistical approach (riformulato per brevità). This method identifies key data at each level, progressively refining the analysis to achieve the desired complexity and objectives. First, an analysis was carried out to determine whether the outcomes derived from AquaCrop, CWFP as they are (i.e. grain production, water use and GHG emissions from the cropping system) and integrated with each other (i.e. carbon footprint and water footprint) were conditioned by agronomic practices and pedo-climatic conditions. This was done using one-way analysis of variance (ANOVA) with climatic cells, soils, three sowing times and irrigation management as sources of variation. A sensitivity analysis was then carried out to determine which sources of variation had the greatest impact on the productive and environmental response of durum wheat cultivation. To do this, the impact index (I
w) for each source (i) was calculated as follows:
where MS is the mean square for each source and the i denotes the specific source.
Having identified the main sources of variation responsible for changes in the productive and environmental performance of the cropping system, the cumulative probability curves for each element within that source were determined, using the 25th percentile, 50th percentile and 75th percentile as reference thresholds to compare the different dynamics on the productive and environmental performance. The lowest and highest thresholds can have different implications depending on the variable considered. For example, the 25th percentile for cereal production is the risk threshold for low yields. Specifically, by comparing the yield values at the 25th percentile of the two irrigation regimes, one can quantify the advantage of flowering irrigation compared to rainfed management in unfavourable (i.e. dry) growing seasons for durum wheat production. Conversely, the 25th percentile threshold for CO2_eq emissions identifies the advantage of a specific element (e.g. 15 October, 1 November or 15 November) within a source of variation (sowing date) in reducing these emissions.
The 75th percentile can be used to identify scenarios where returns are higher than typical outcomes. This percentile indicates that there is a 25% probability of achieving returns above this threshold, highlighting the potential for above-average performance under certain conditions. Similarly, for environmental impacts such as CO2_eq emissions, the 75th percentile helps to understand the likelihood of higher than average emissions. This threshold indicates the (unfavourable) probability that emissions could be 25% higher than typical, providing insight into the worst-case environmental impact. At the end of this hierarchical analysis, information was obtained on both performance and environmental sustainability, not only in the pedo-climatic context of DW cultivation, but also within conventional tillage, identifying which management options could be implemented to optimise the trade-off between production and environmental sustainability.
3. Results
3.1. Pedoclimatic Characterization of the Area
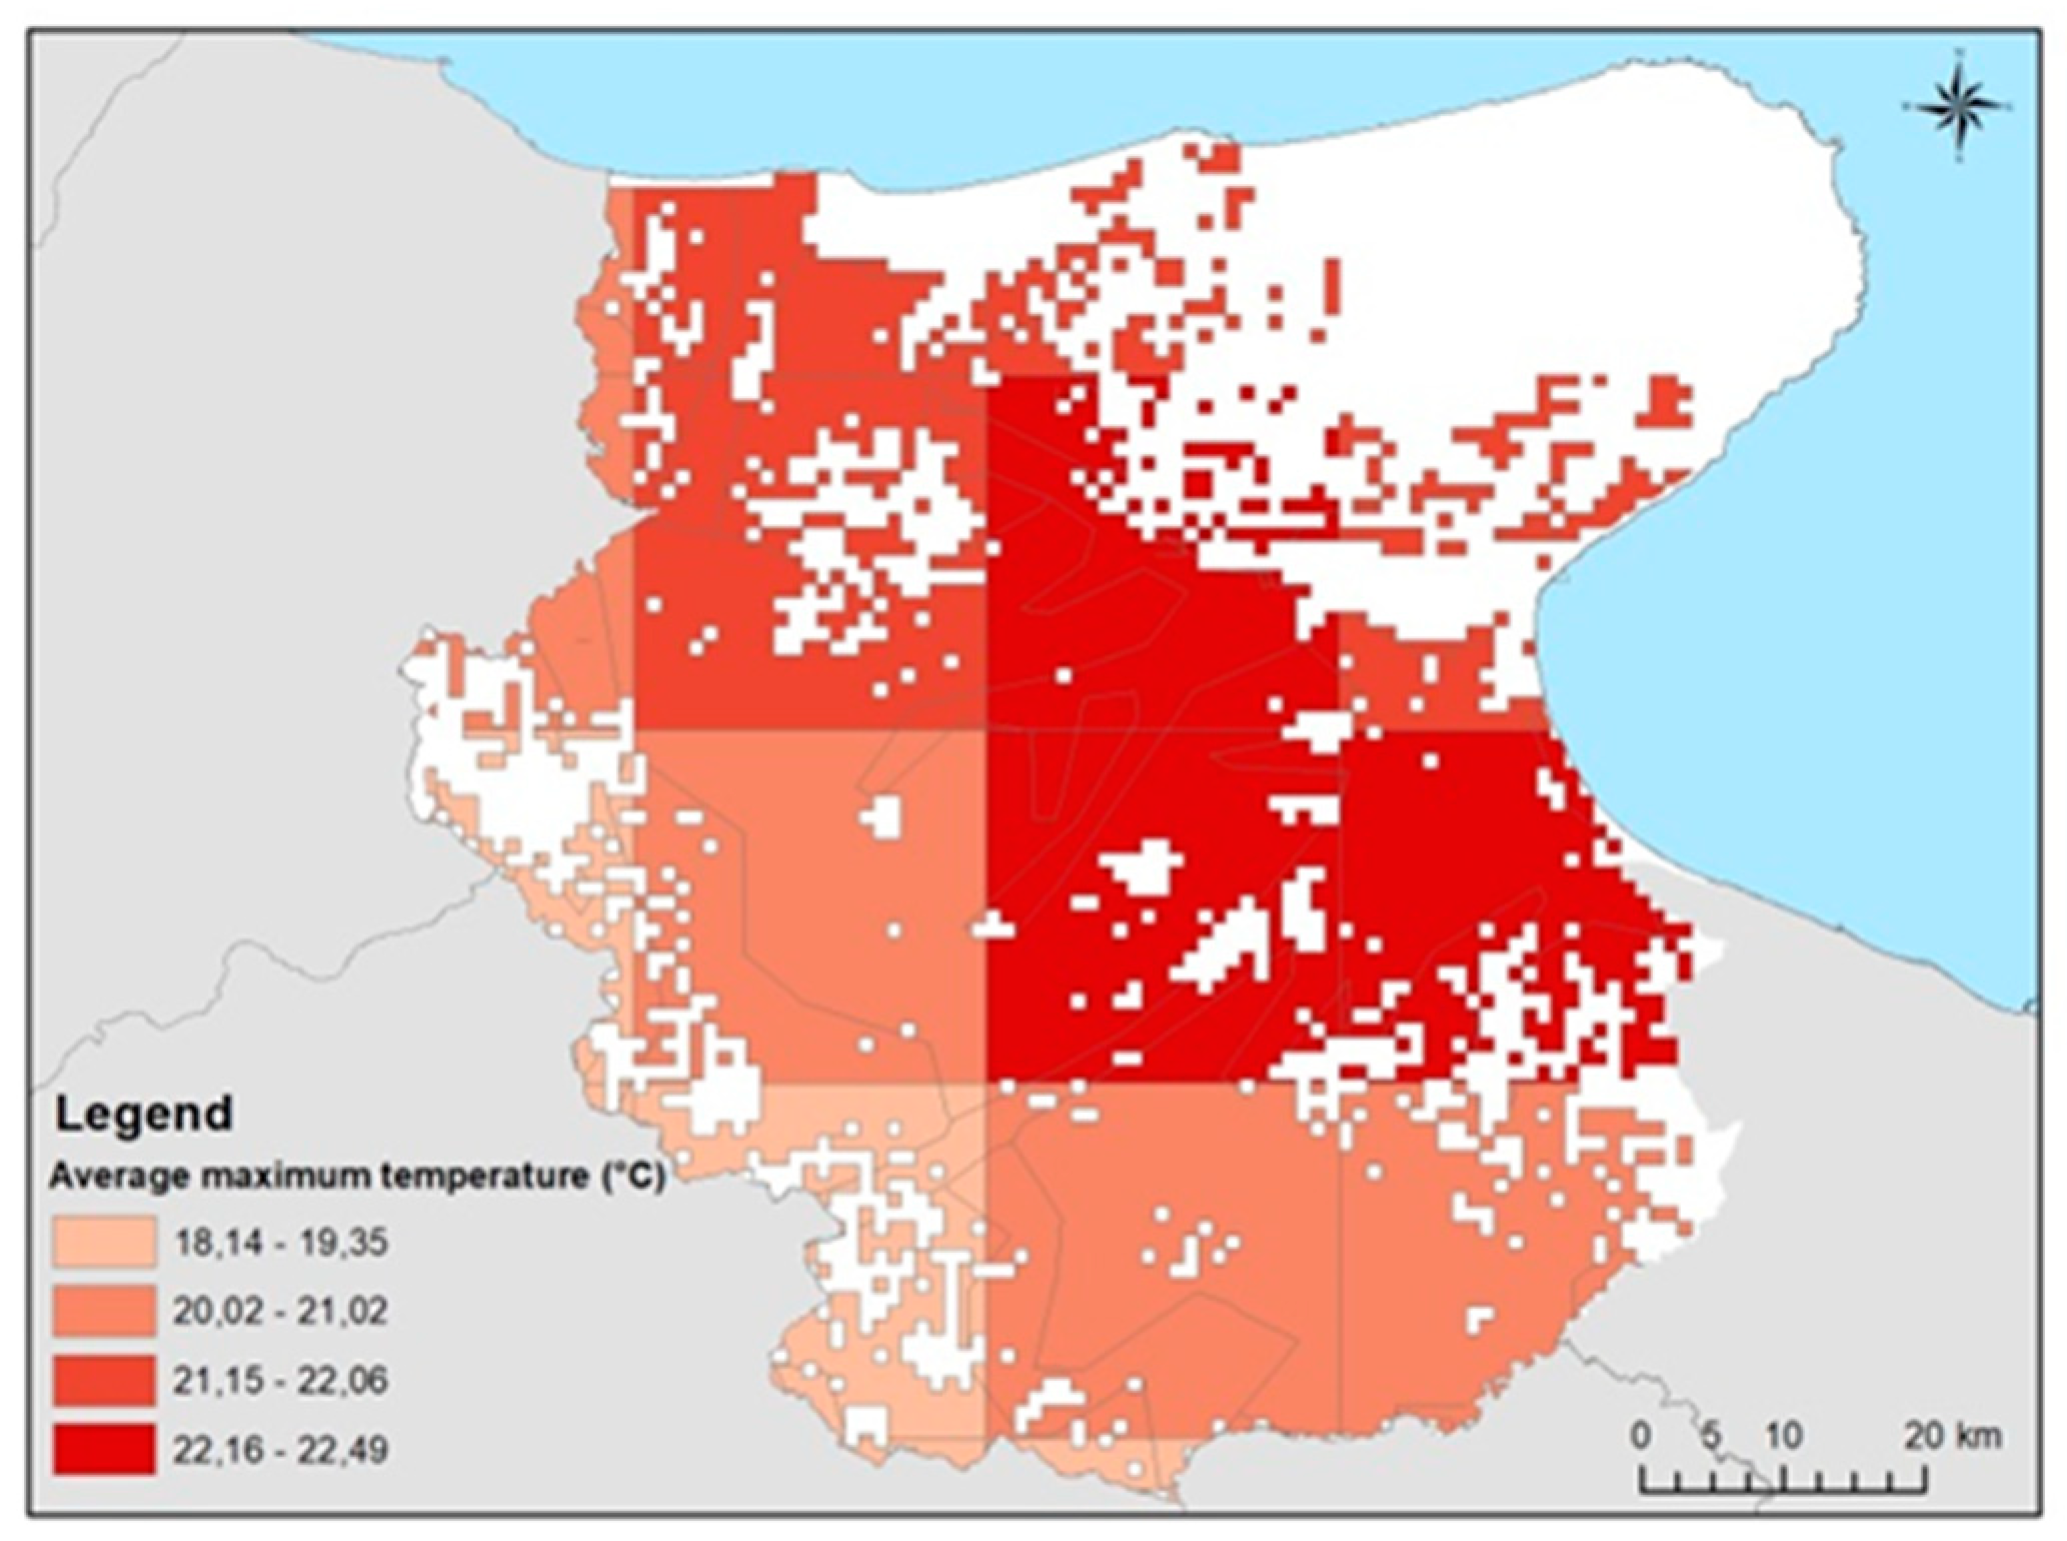
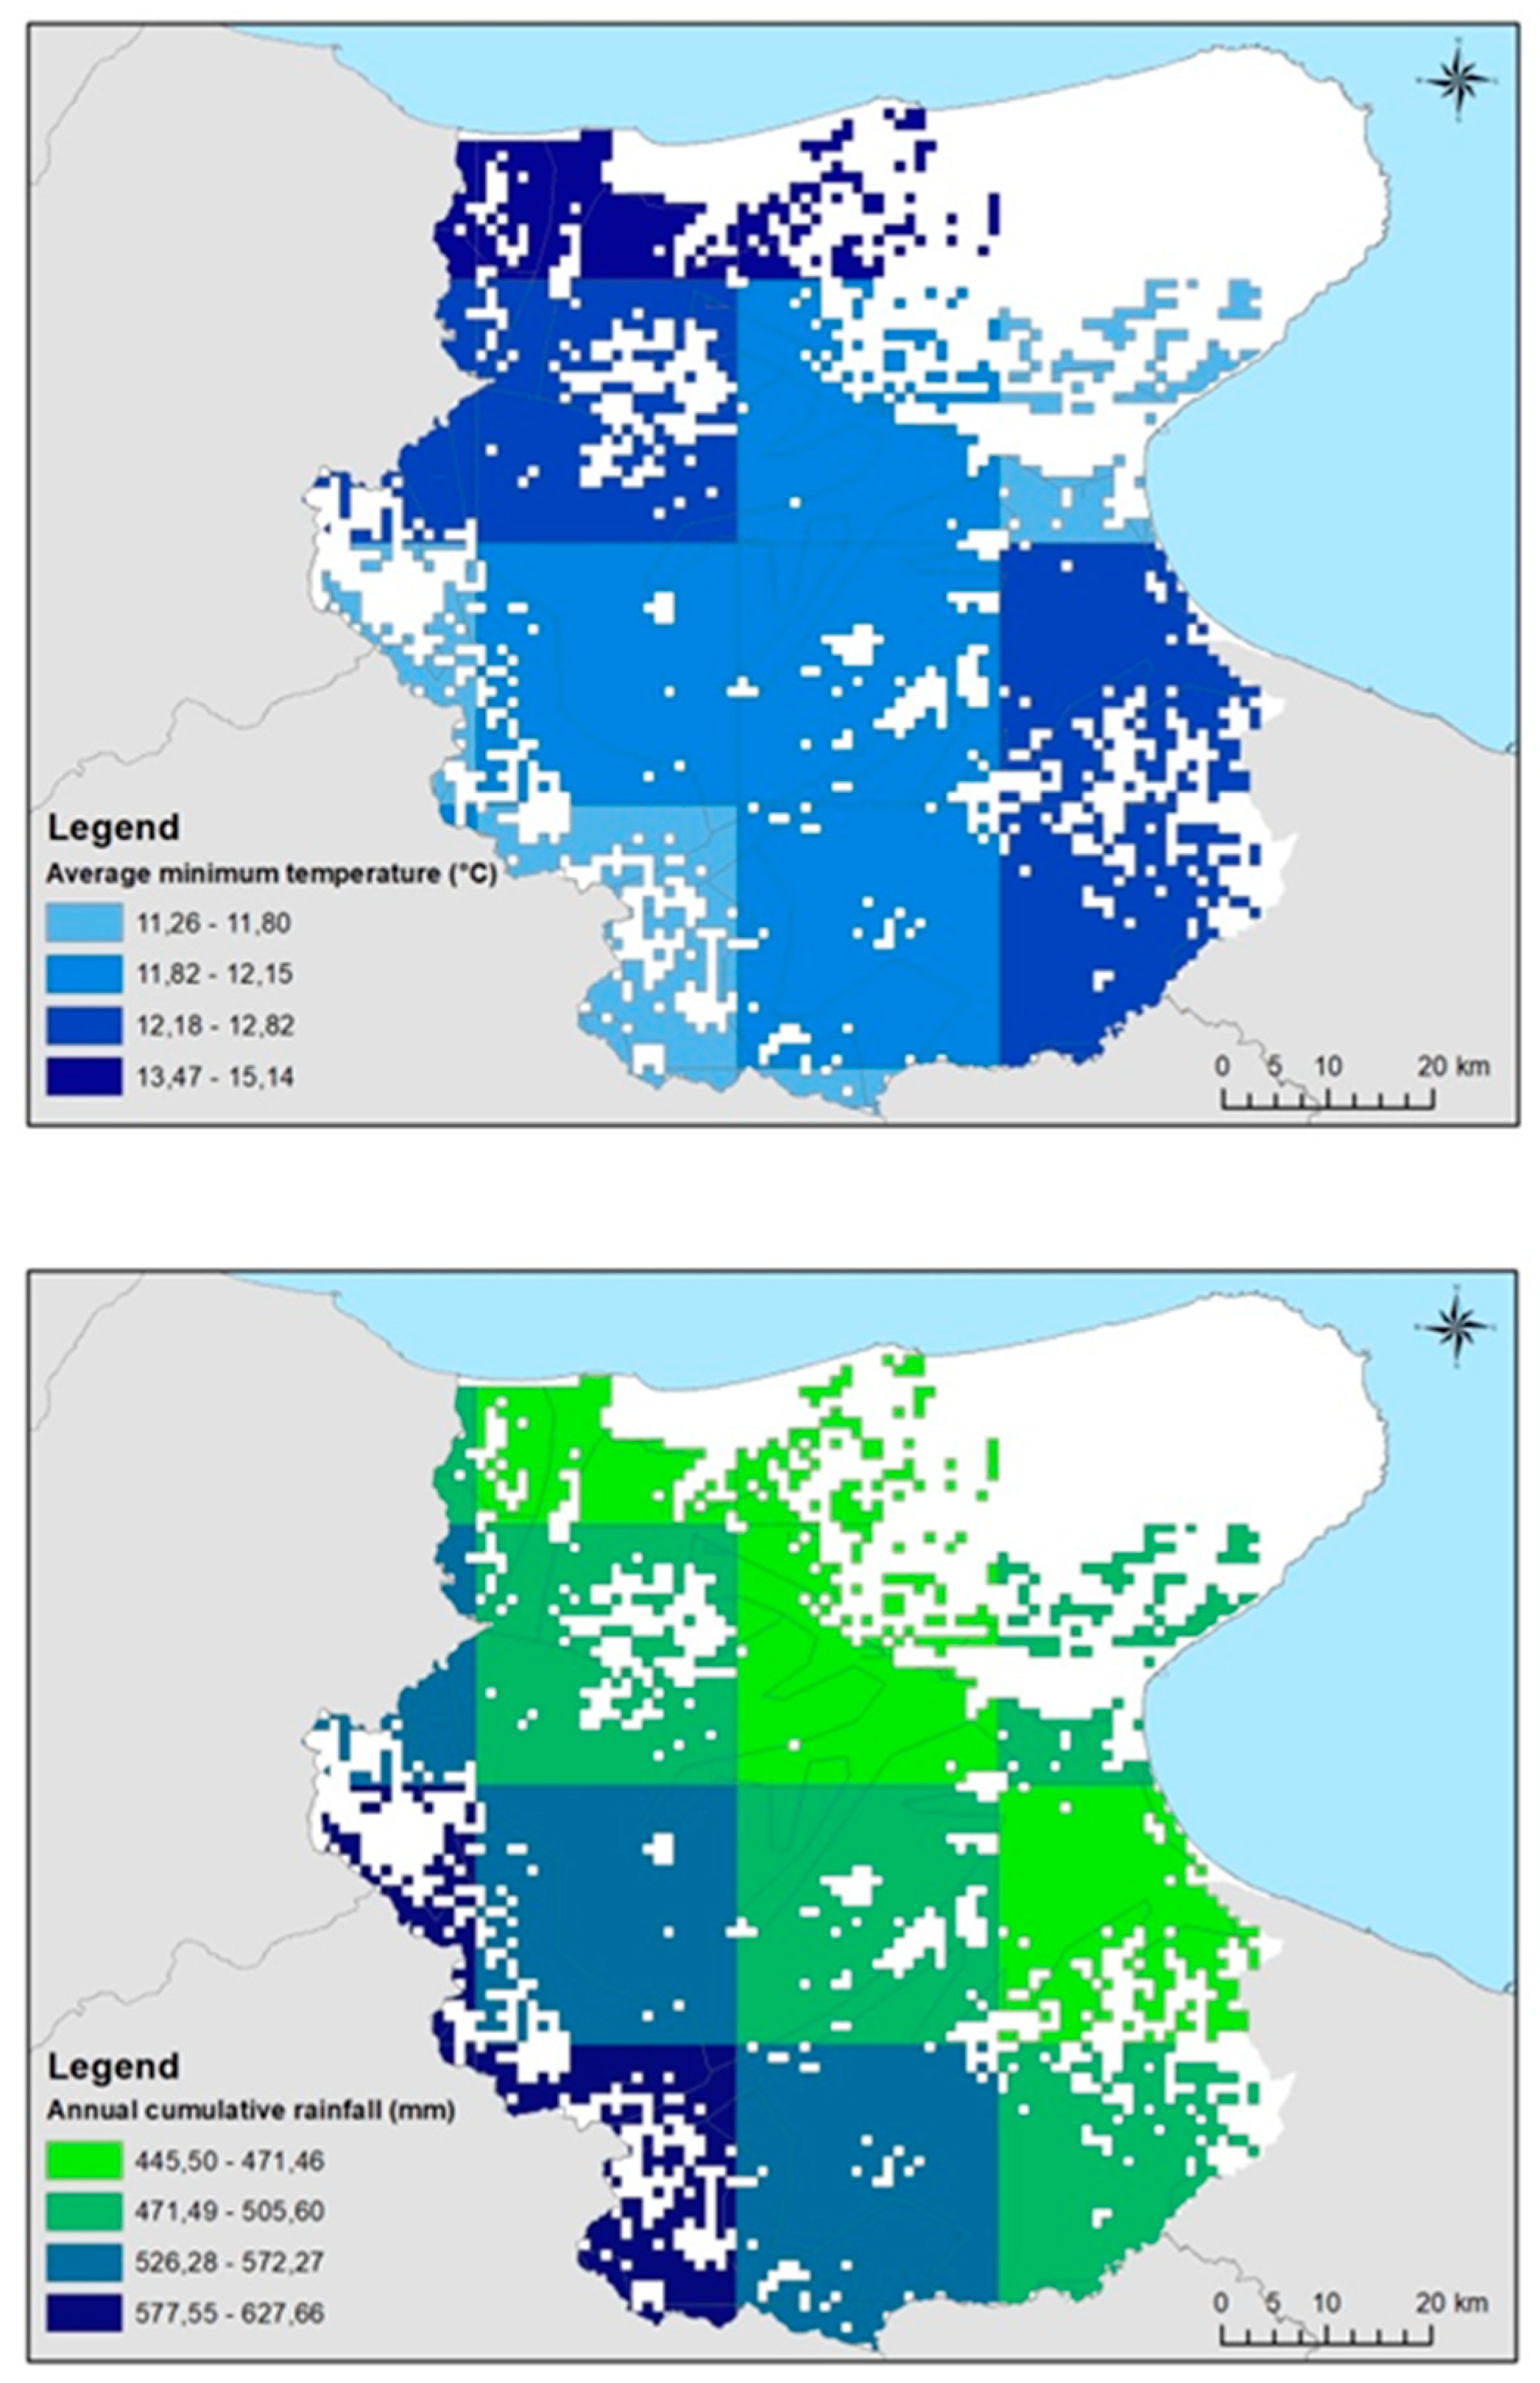
Regarding the annual thermal data (average annual temperatures for the period 2010-2023), the central (plain) area and part of the northern area experienced by the highest maximum temperatures (around 22°C) compared to the inland hilly areas, with differences ranging from +2°C to +4°C (
Figure 2). The northern part of the region exhibited the highest minimum temperatures compared to the rest of the analyzed climatic area, with annual averages up to 15 °C, i.e., up to 4 °C higher than the colder areas in the extreme western part (
Figure 2).
The annual cumulative rainfall showed clear differences between the different areas of
Capitanata. The western area, where durum wheat is cultivated, is characterized by annual rainfall ranging between 530 and 630 mm, which gradually decreases towards the eastern plain (reduction in cumulative rainfall of up to 180 mm per year). The trend in cumulative rainfall follows the topography of the
Capitanata plain, gradually increasing from the flat area in the east (around 460 mm per year) to the hilly area in the west (around 600 mm per year;
Figure 2).
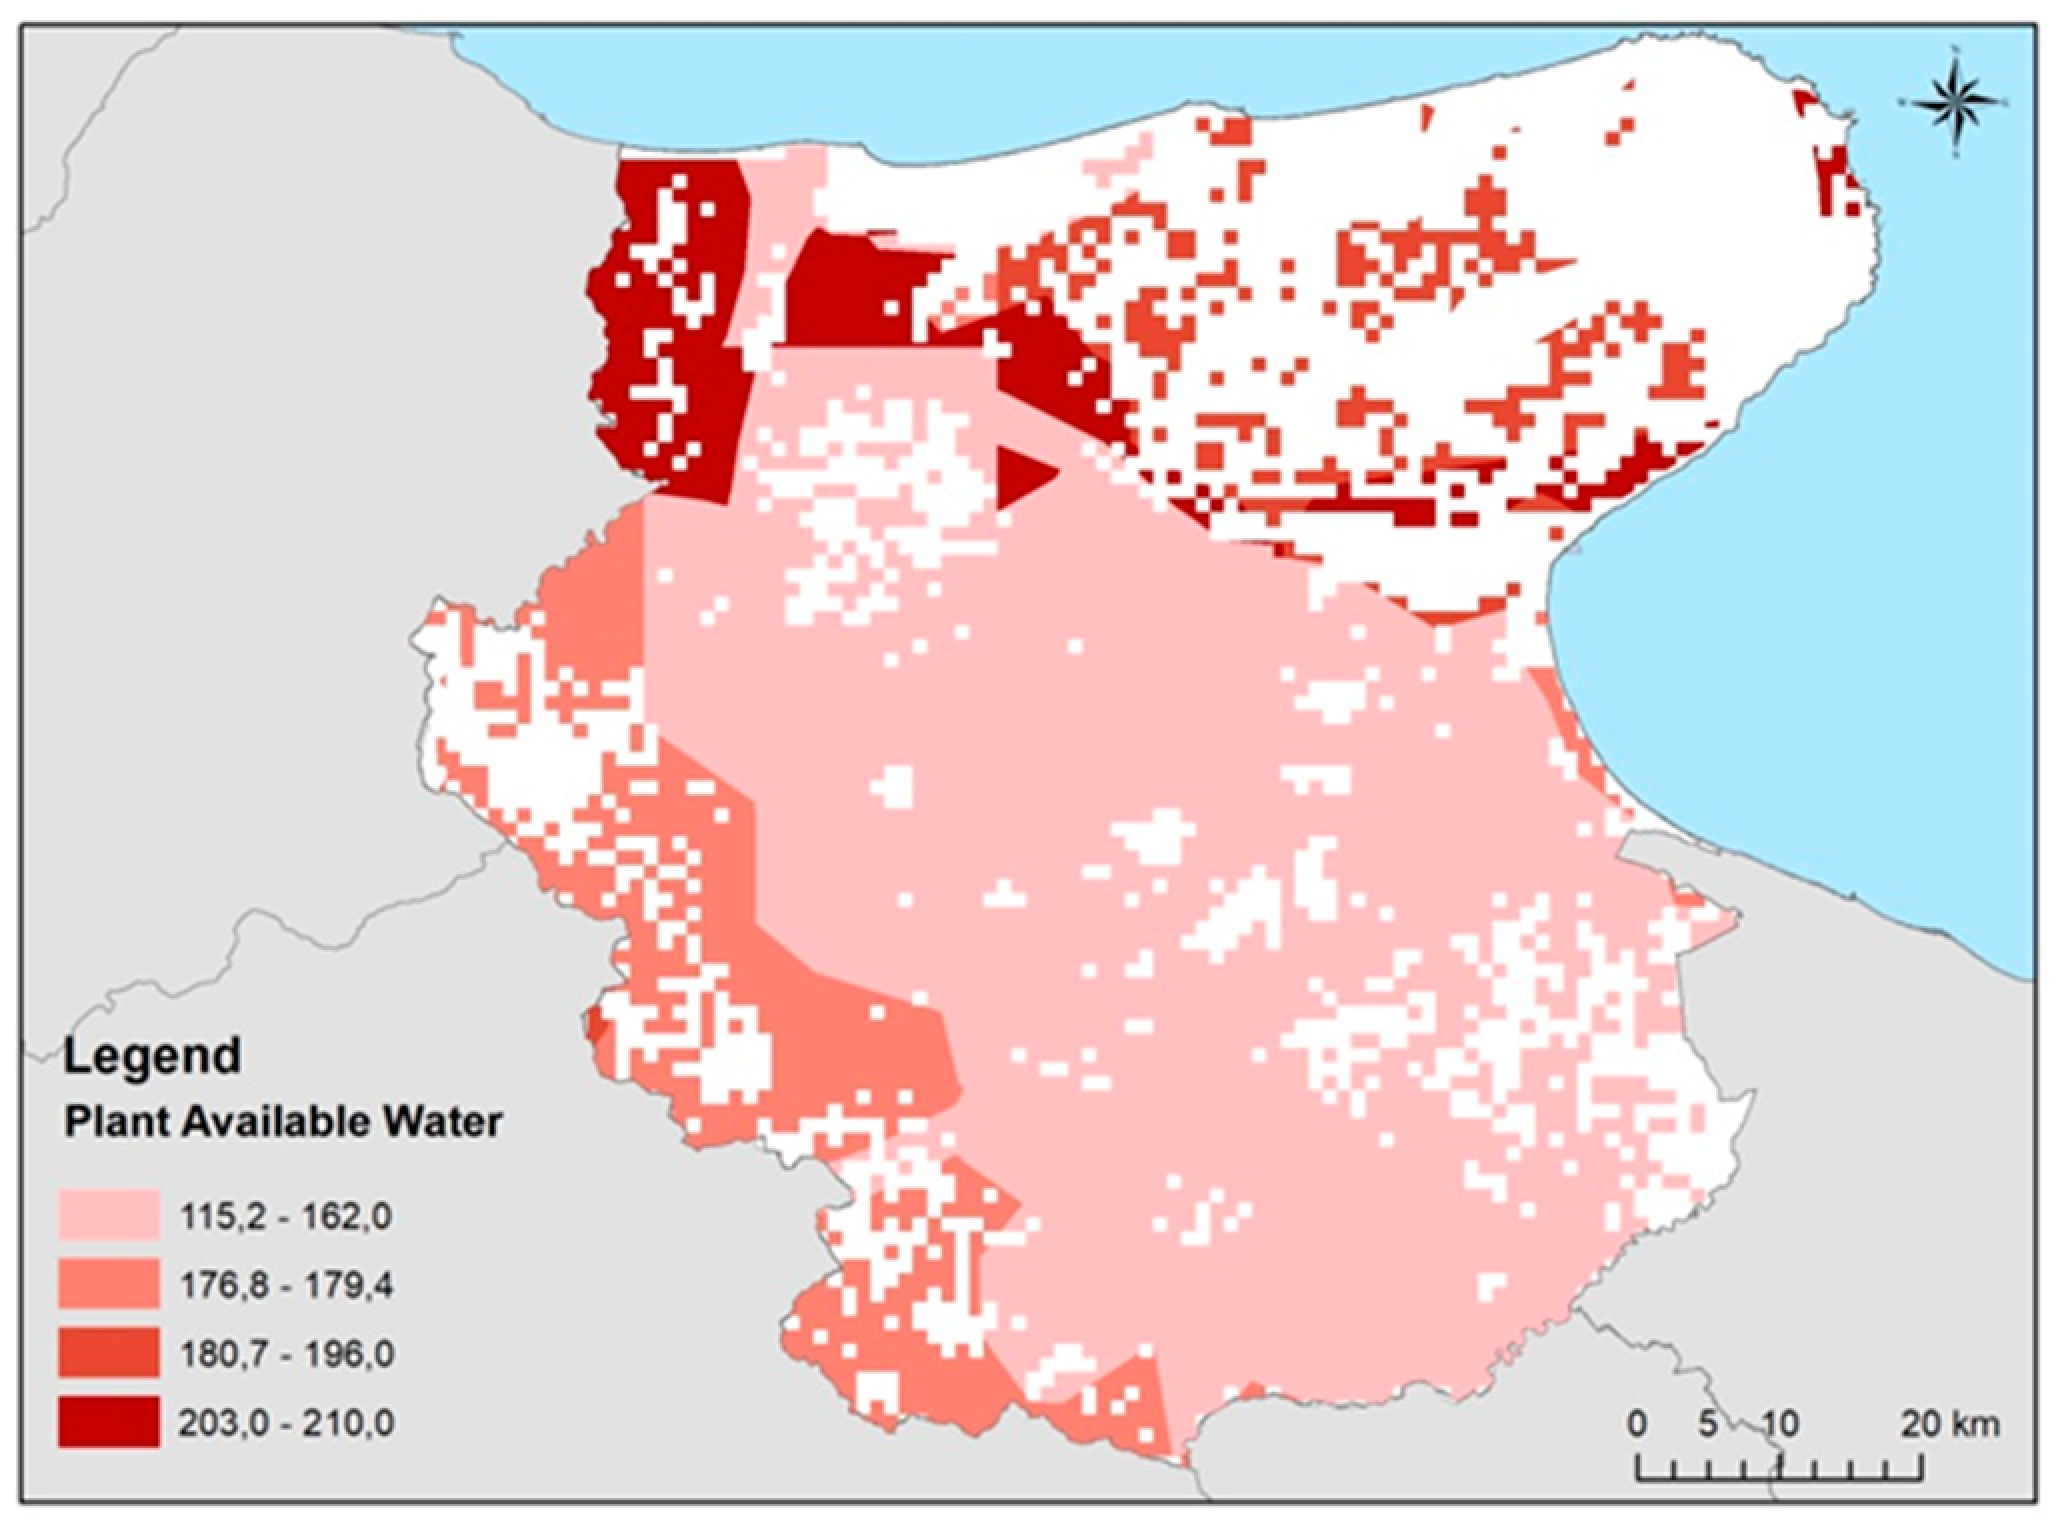
The differences recorded for this climatic variable reached peaks of about 180 mm, corresponding to an increase of 17% between the rainiest areas in the hilly zone compared to the central zone, up to 33% when the westernmost area is compared to the easternmost one. Plant Available Water (PAW;
Figure 3) ranges from a minimum of 15 mm to a maximum of 210 mm. Most of the territory has soils with a plant water availability of 115 to 163 mm, concentrated in the central area of the territory, with higher PAW values bordering the western area (up to 196 mm) and the north of the territory (up to 210 mm). It should be noted that AquaCrop-GIS uses this parameter, in addition to depth, to characterize soils, which is necessary to formalize soil water dynamics. The percentage of soil Organic Carbon (OC, %;
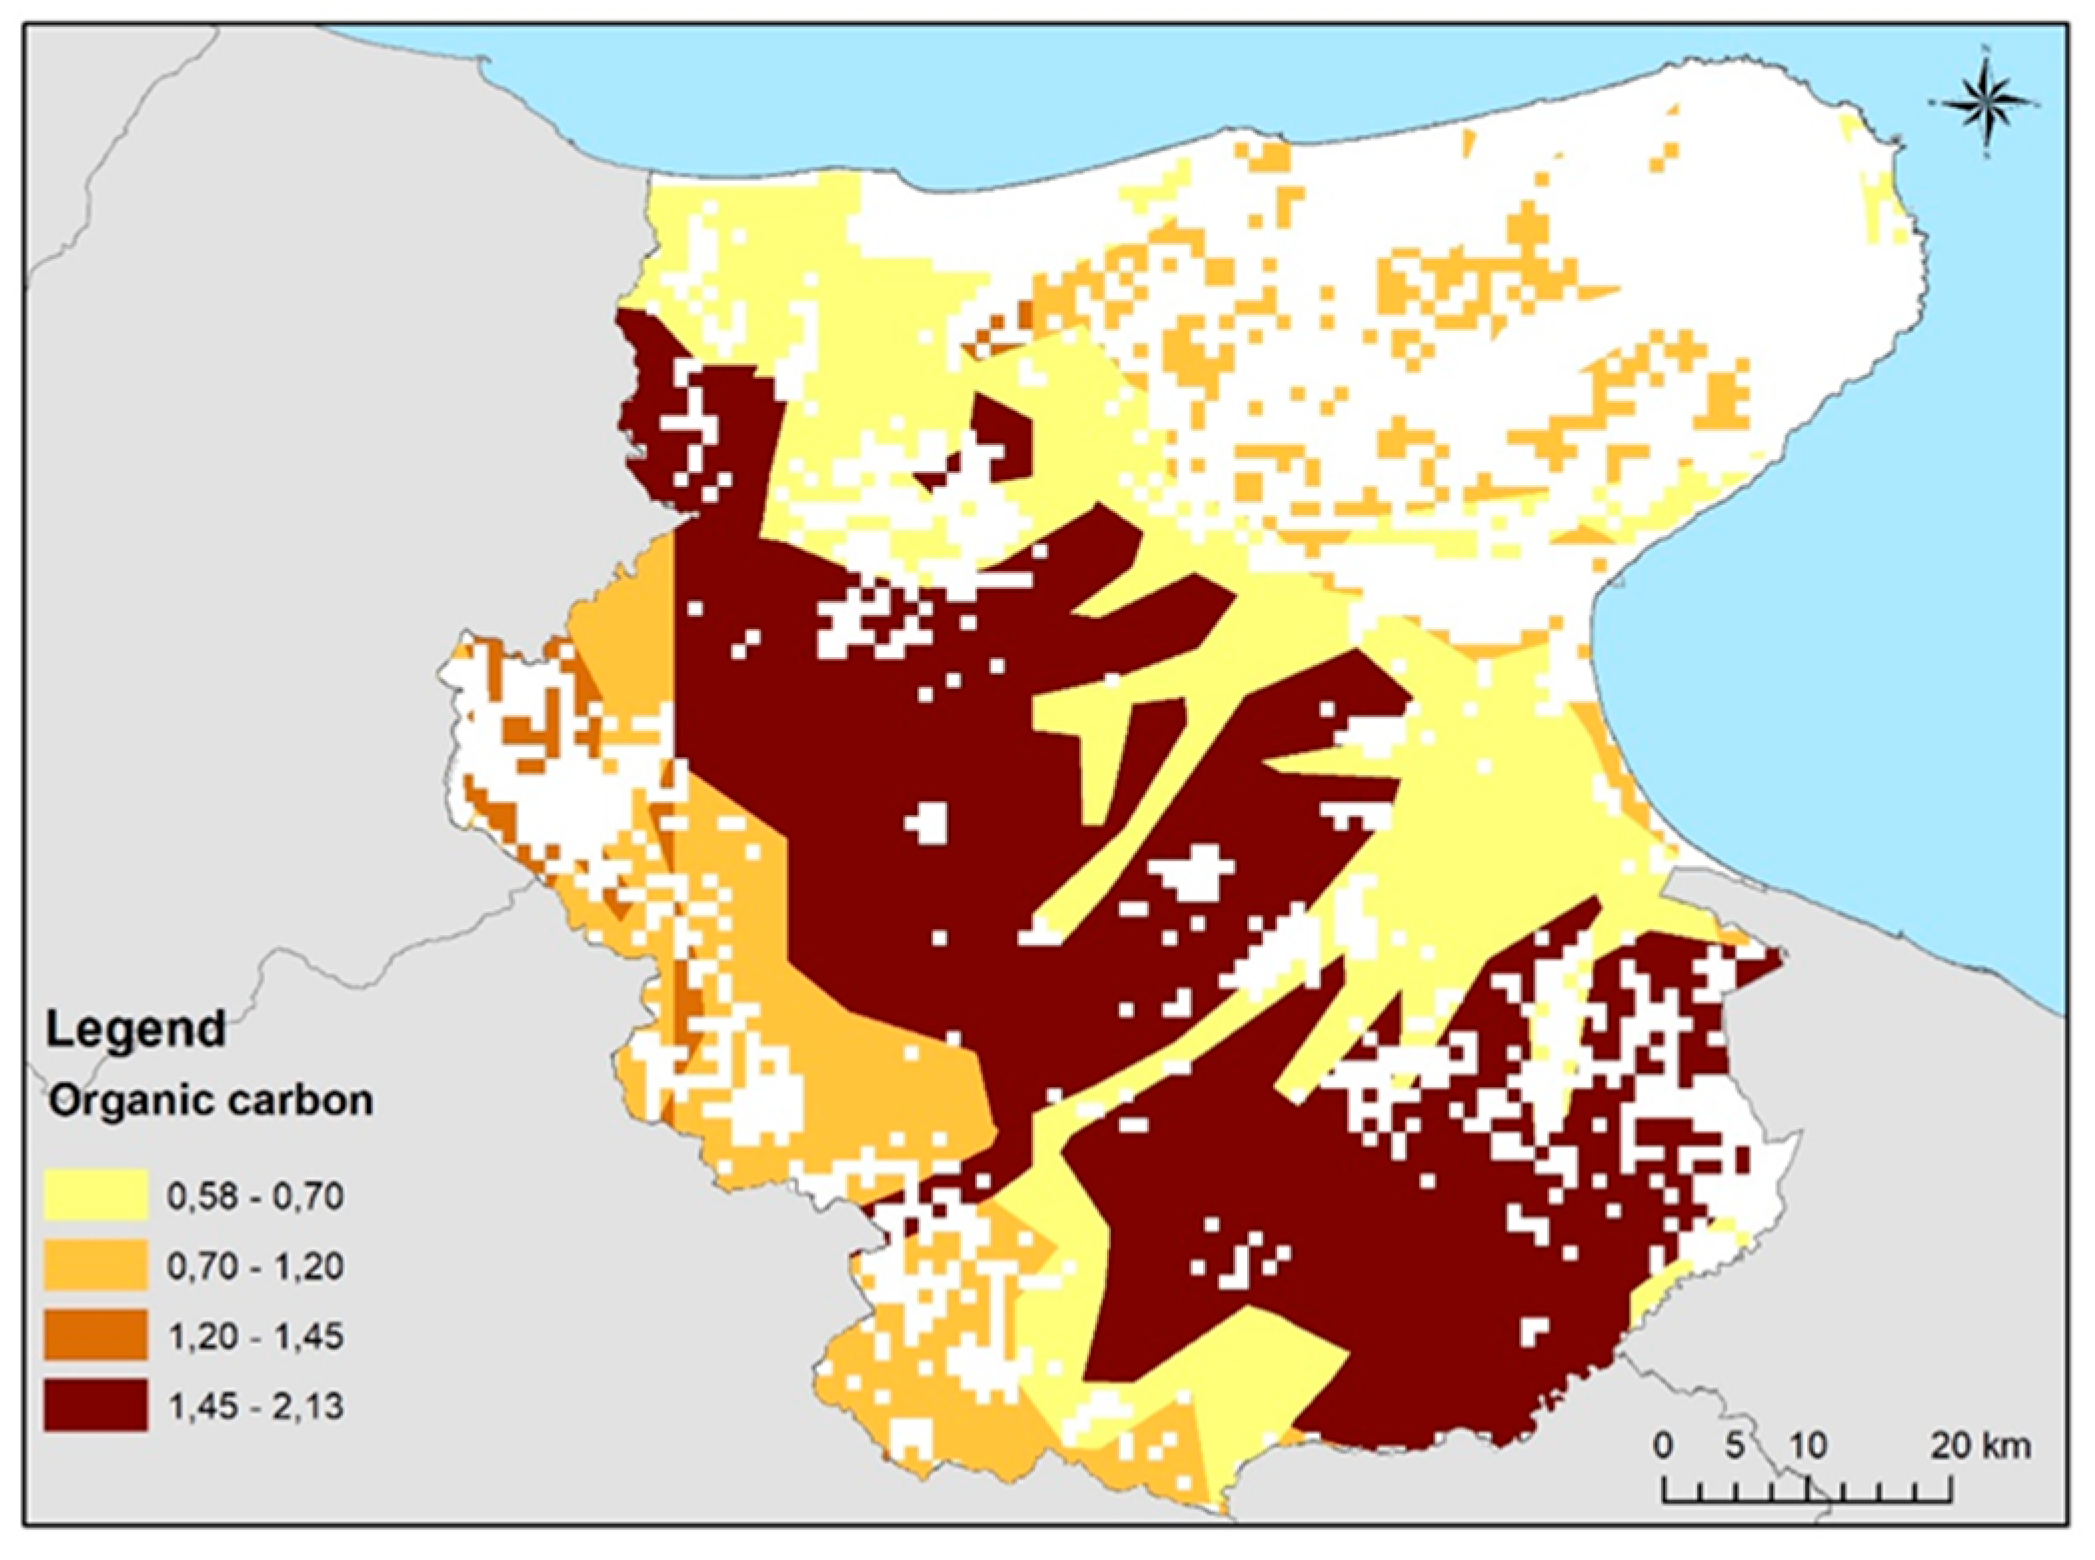
Figure 4) was higher in the central strip of the cultivation area (from north to south), with values ranging from 1.45% to 2.13%. The areas surrounding this central strip were characterized by lower levels of organic carbon, with percentages ranging from 0.70 to 1.45% in the hilly area to the west, and a minimum of 0.58-0.70% in the easternmost zone of the area.
The initial OC values were fed into the CWFP application to calculate the evolution of soil organic carbon and thus the emissions resulting from the evolution of this parameter.
3.2. Environmental Impact from Soil and Crop Management
The total CO
2_eq emissions associated with wheat cultivation were approximately 1201.3 kg/ha (
Table 1). It is important to note that the amount of straw baled and removed, as well as the amount of straw left on the soil, varied depending on the management (sowing date and irrigation) and pedo-climatic context (i.e., available plant water, bulk density and organic carbon). Therefore, unlike the impacts associated with other crop operations, which were fixed (and thus had a single value), the values for baling and decomposing residues were variable, and therefore mean values and standard deviations were provided. Among these activities, fertilizer application emerged as a major contributor, with ammonium nitrate application alone accounting for a significant proportion at 376.4 kg/ha and urea application resulting in emissions of 126.1 kg/ha. These nitrogen-based fertilizers not only contributed to direct emissions during application, but also facilitated the release of N
2O, a potent greenhouse gas, through processes such as nitrification and denitrification in the soil. Soil management practices had a significant impact on CO
2_eq emissions, with disc harrows, ploughing and rotary tillage together contributing a significant proportion of total emissions (362.9 kg/ha). Other operations such as seeding, baling and harvesting contributed 260.4 kg/ha of CO
2_eq emissions. The subsequent decomposition of straw residues left on the field also contributed to emissions.
However, the emission value associated with the removal of straw residues may not have contributed significantly to CO2_eq emissions compared to other activities. Looking at the breakdown of emissions as a percentage of total CO2_eq emissions, ammonium nitrate application accounted for approximately 31.4% of total emissions, while harvesting and disc harrowing each contributed approximately 13.5%. The lowest value in terms of CO2_eq emissions came from the decomposition of straw residues (6.3%). Finally, other activities, including ploughing, sowing and straw baling, together accounted for about 35.4% of total emissions.
3.3. System Performance
Clear patterns emerge regarding the productivity and environmental impacts associated with different sowing dates and irrigation practices in durum wheat production (
Table 2). Firstly, in terms of productivity, the early November sowing date consistently produced the highest average yield under all conditions, with approximately 5573 kg/ha without irrigation and 5722 kg/ha with irrigation. In contrast, the later sowing dates had lower yields, ranging from about 4983 kg/ha (rain-fed) to 5240 kg/ha (with 41 mm of water supply). This difference in yield between the early November and mid-November sowing dates represents an average increase of 11.8% without irrigation and 9.2% with irrigation, indicating a clear advantage for the early November sowing date in terms of grain productivity. The earlier sowing date (15 October) showed the lowest grain yield with an average value of 5452 kg/ha for both rainfed and irrigated management.
The analysis showed variations in CO2_eq emissions per kilogram of grain produced and total water use per kilogram of grain produced. The mid-November sowing date consistently showed higher CO2_eq emissions per kilogram of grain compared to other dates, with values ranging from approximately 0.220 kg CO2_eq kg/yield under irrigated management to 0.244 kg CO2_eq kg/yield under the rainfed option. In particular, CFP emissions associated with the late sowing date were on average 21% higher compared to early November and 17% higher compared to mid-October. Again, mid-October sowing resulted in CFP values intermediate between the other two sowing options, with emissions just over 3% higher than early November sowing, but 17% lower than late sowing. GreeW consumption was linked to the productivity of the cropping system and thus higher values were obtained for sowing in early November both under rainfed management (+3% compared to 15 October and +11.9% compared to 15 November) and under irrigation (+4.5% compared to 15 October and +9.2% compared to 15 November). There were no significant differences in BlueW between the different sowing dates, except for irrigation, which accounted for 6.4%, 14% and 21% in the calculation of this parameter when comparing rainfed and irrigated cropping systems for the first, intermediate and last sowing dates respectively. As a result, TW along the durum wheat production chain was higher on irrigated plots than on rainfed plots, albeit modestly (+6.5%), indicating that most of this consumption was mainly due to the green component (65%) and within the blue component, irrigation represented just under 16%. Despite the modest increase in blue water due to water supply, WFP remained comparable between rainfed (1.09 m3/kg) and irrigated (1.13 kg/ha) regimes, with an increase of 3.6% for the latter.
3.4. Weighting of Key Factors on Productivity and Environmental Performance
A one-way ANOVA was used to determine whether and to what extent the variability in productivity and environmental performance of the cropping system depended on the pedoclimatic context, irrigation management and sowing date. For this analysis, the sources of variation included the climatic zones, the soils, the three sowing dates and the use or not of irrigation water. The ANOVA showed that each source of variation, when considered individually, was highly significant in modulating durum wheat productivity, GHG emissions, water use and finally CFP and WFP (P < 0.001;
Table 3).
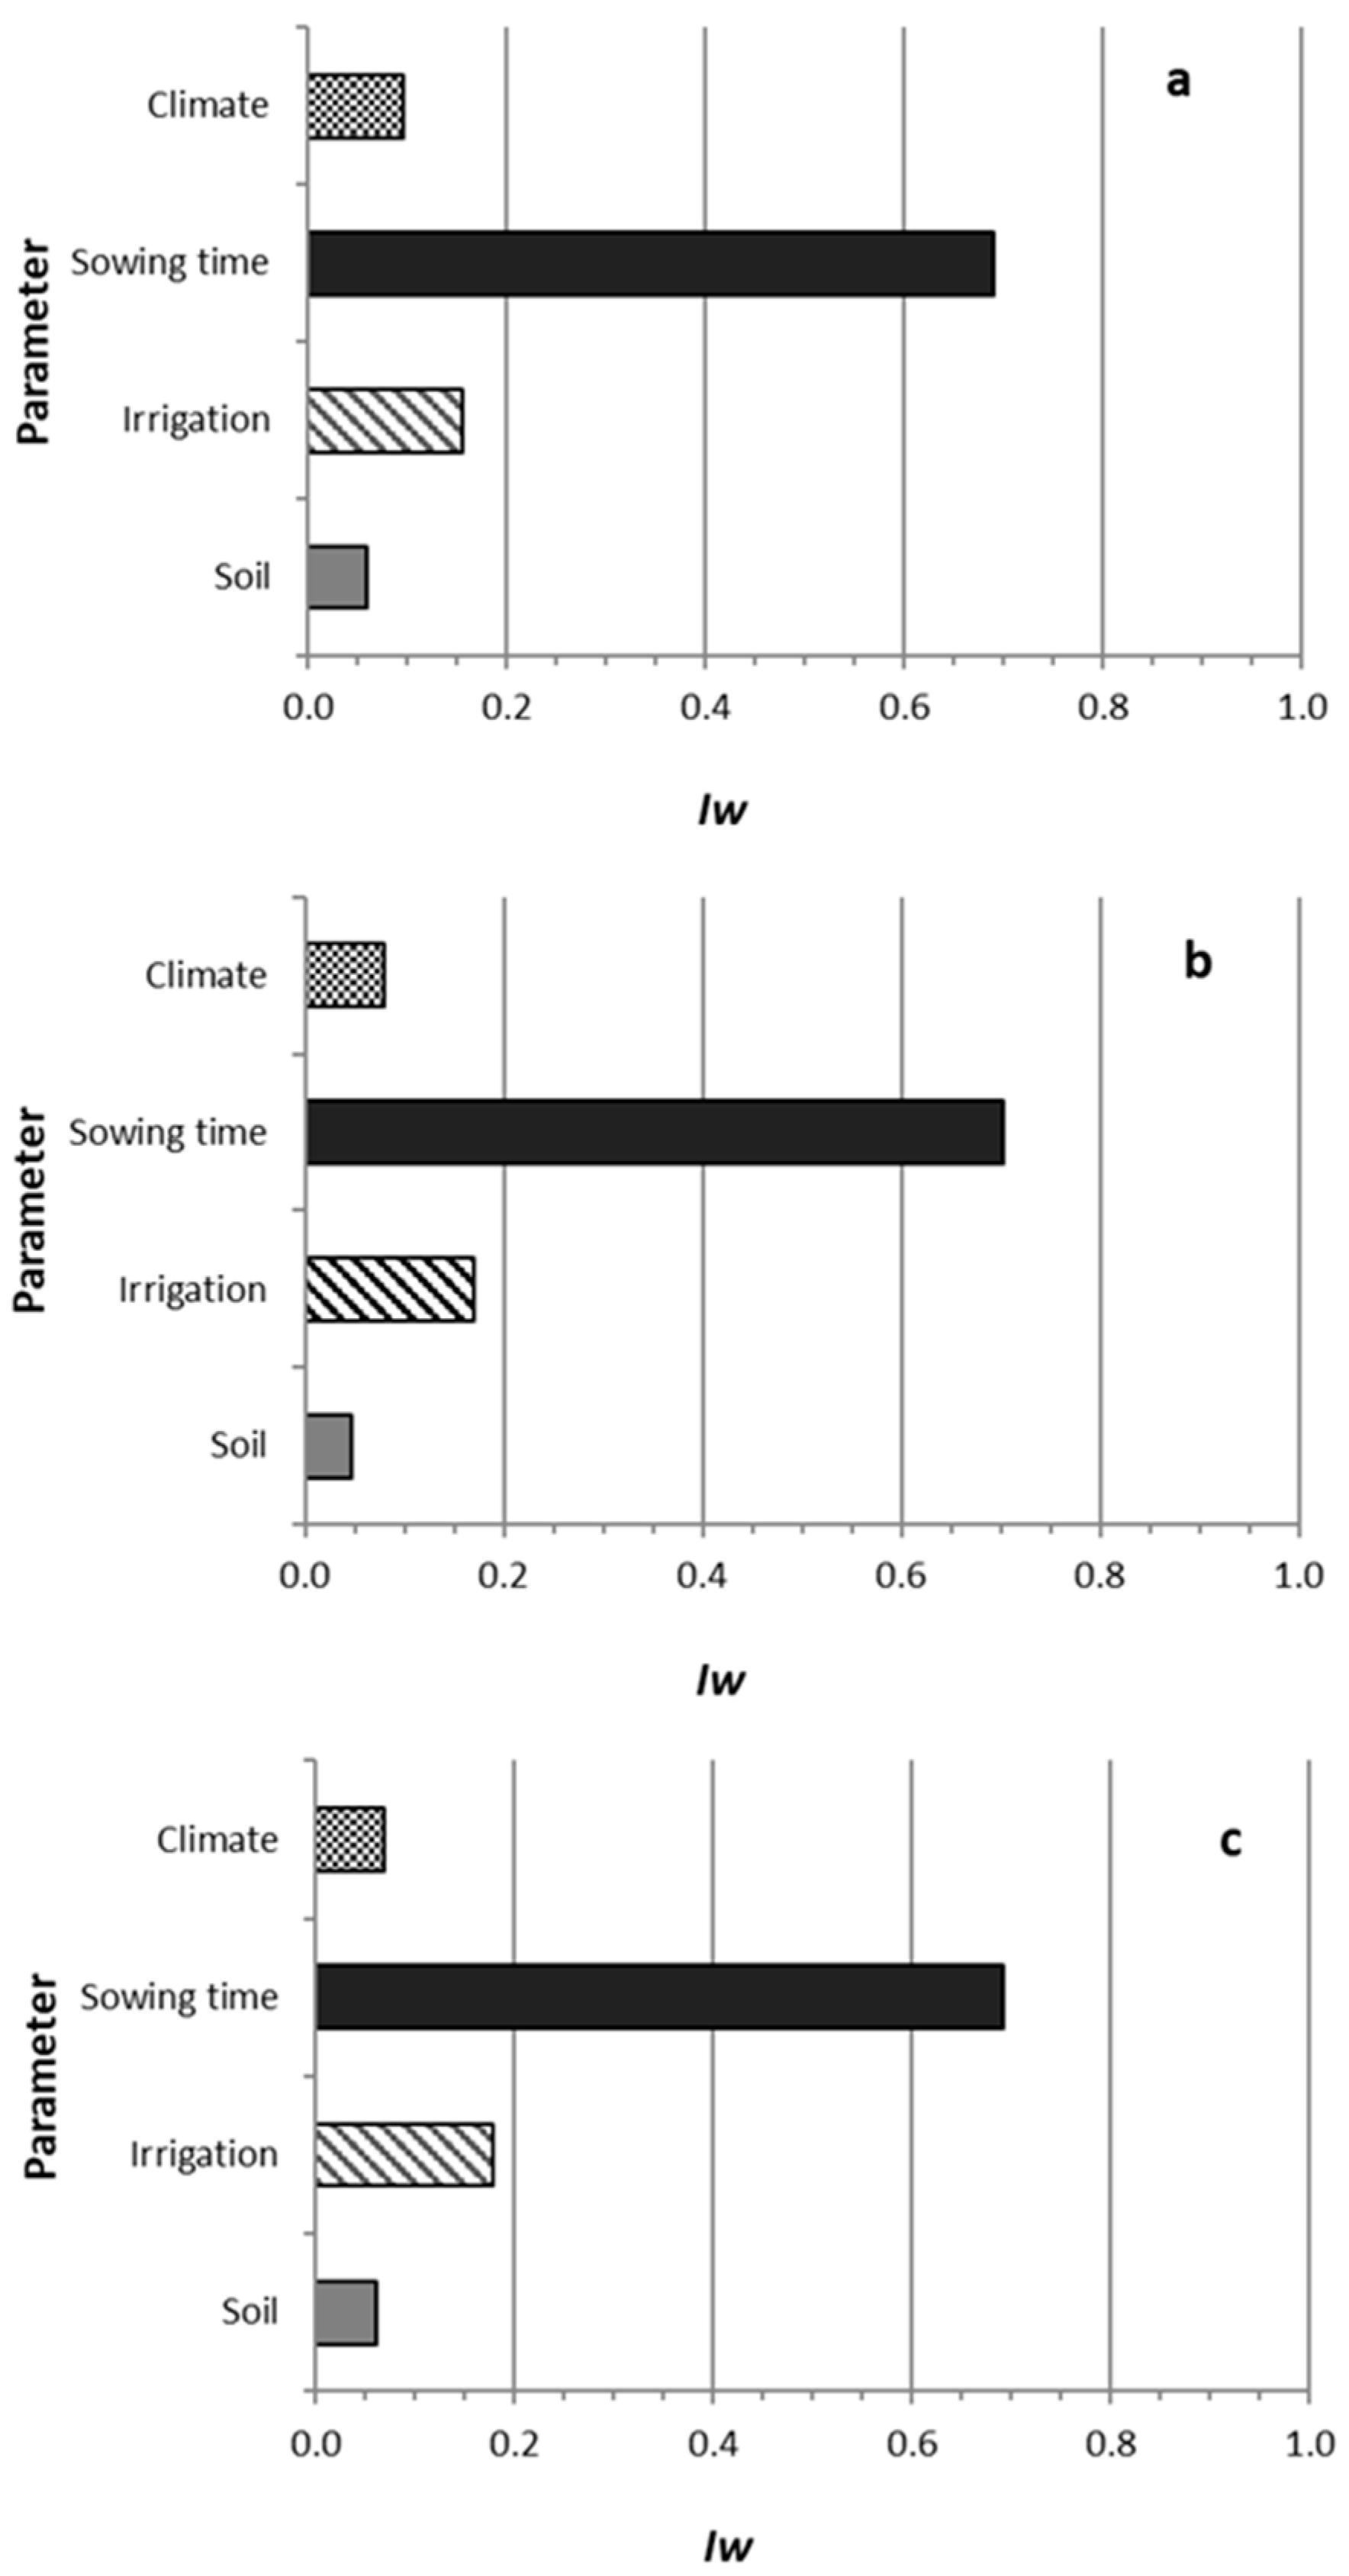
However, the results obtained did not allow for a comprehensive assessment of the influence of each source of variation relative to the others on the variables analyzed. To rank the influence of climate, soil, sowing date and irrigation water use globally, the sensitivity analysis (eq. 3) was carried out to map the effects (Iw) on a scale from 0 (no effect) to 1 (maximum effect). For crop productivity (
Figure 5a), sowing date emerged as the factor most responsible for the variability of this parameter (Iw = 0.69), followed by irrigation management (Iw = 0.16), and then by soil and climate. The same trend was observed for GHG emissions (
Figure 5b), where the CO
2_eq generated by the cropping system depended largely on the three sowing dates, followed by the use or not of irrigation water, and then the pedo-climatic context. As the CFP is closely linked to yield and CO
2_eq, it was found that for this parameter too, sowing on one date rather than another had the greatest impact on the environmental sustainability expressed by this index (
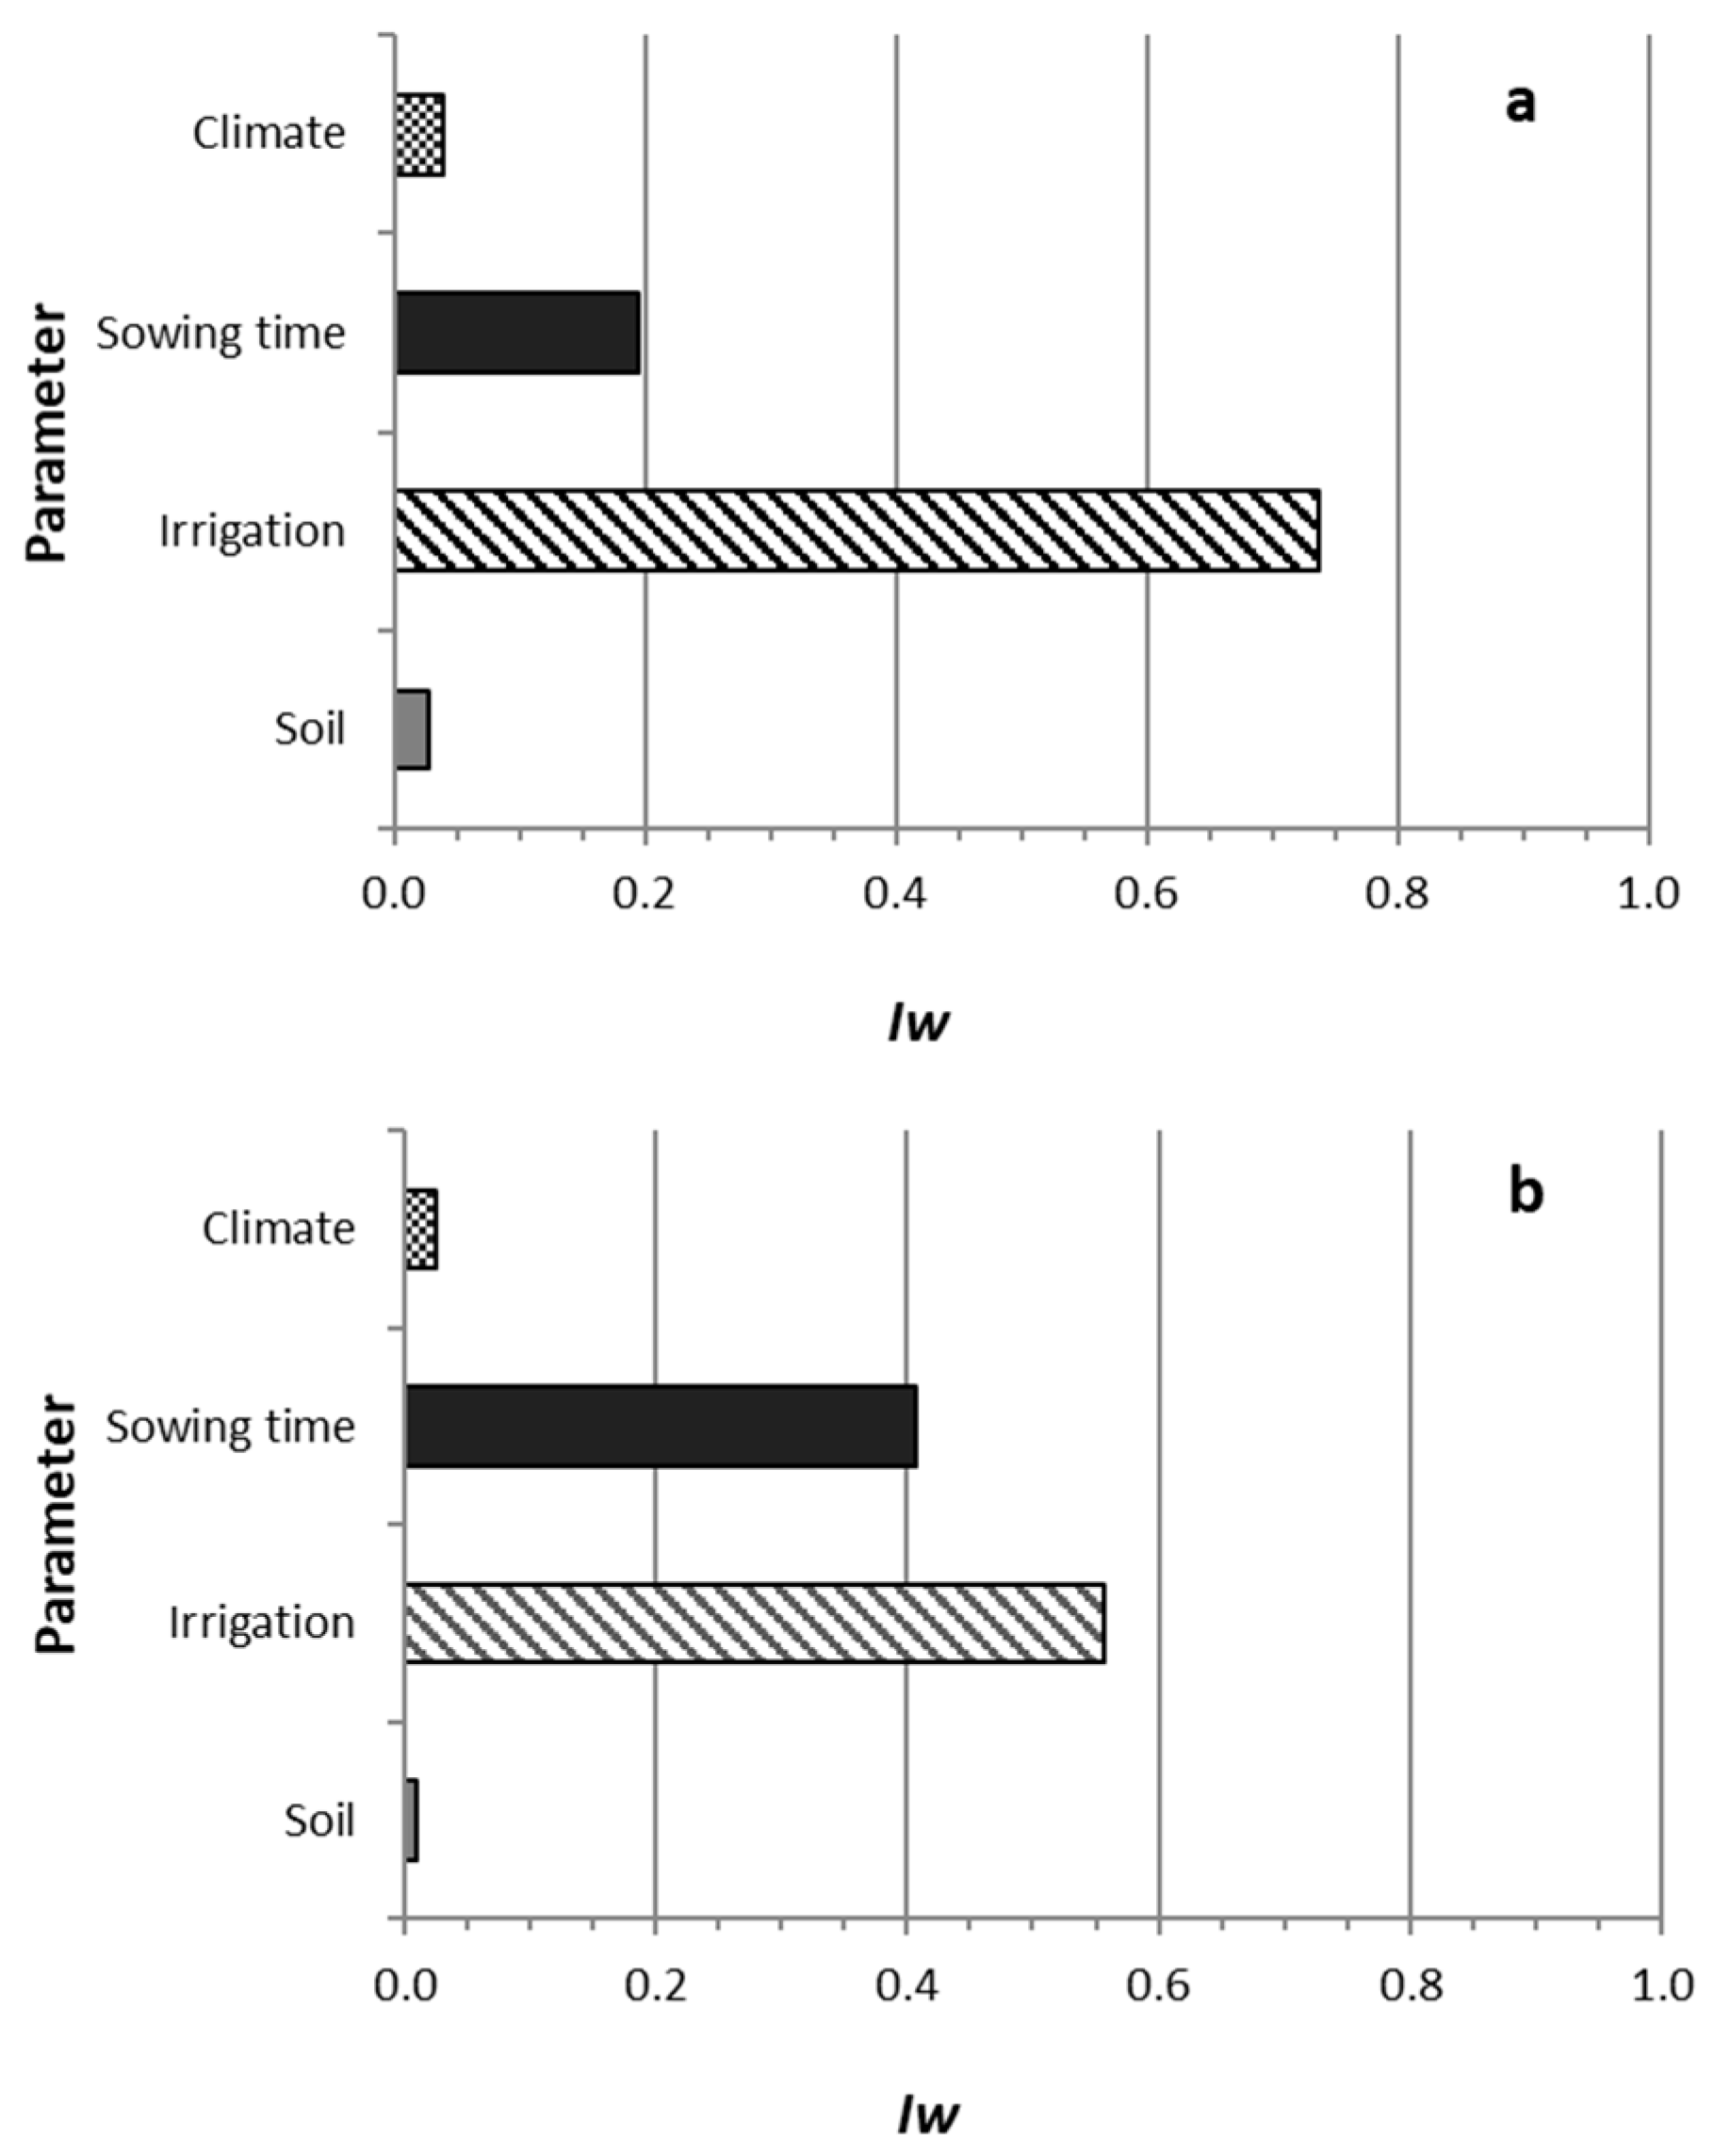
Figure 5c). In contrast to the previous observations, for TW, irrigation management had the greatest weight in modulating the water consumption of the cropping system (Iw = 0.74,
Figure 6a), followed by sowing date (Iw = 0.19) and, to a lesser extent, climate and soil. Relating TW to grain produced (
Figure 6b) confirmed that this parameter was the most sensitive to irrigation management (Iw = 0.56), with sowing date (Iw = 0.41) not far behind, while climate and soil remained lower in the ranking.
3.5. Comparative Variability Analysis of Cropping System Response to Primary Drivers
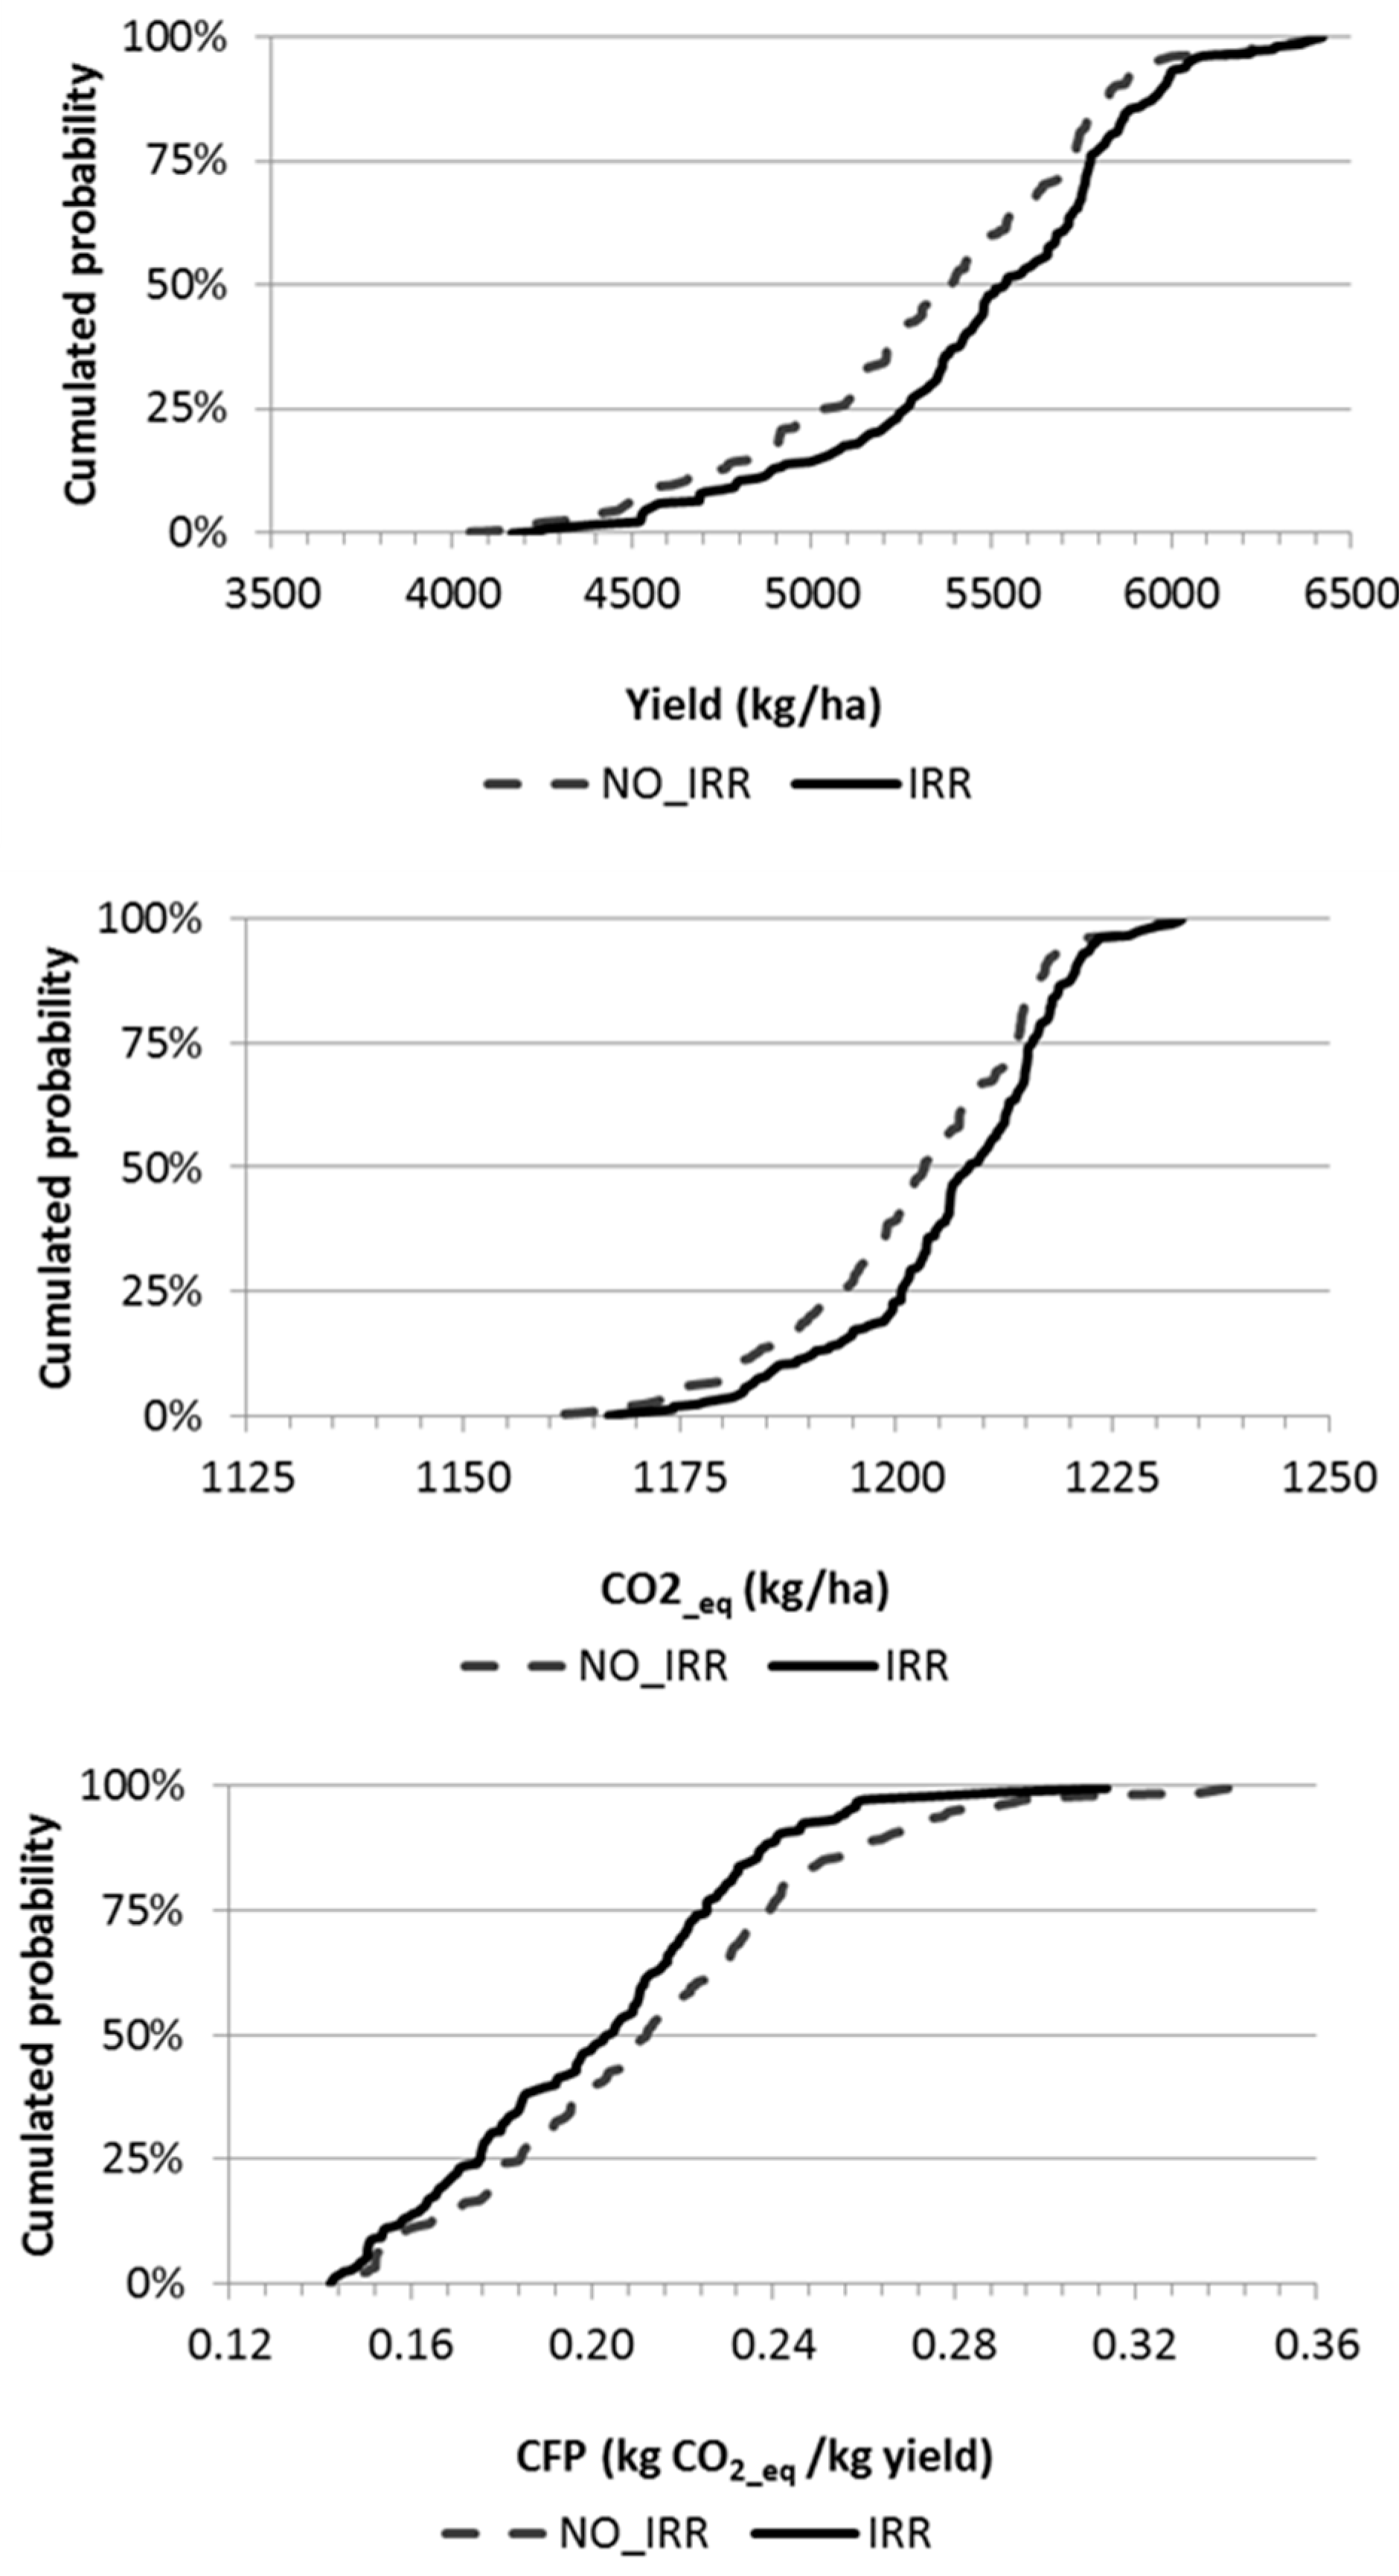
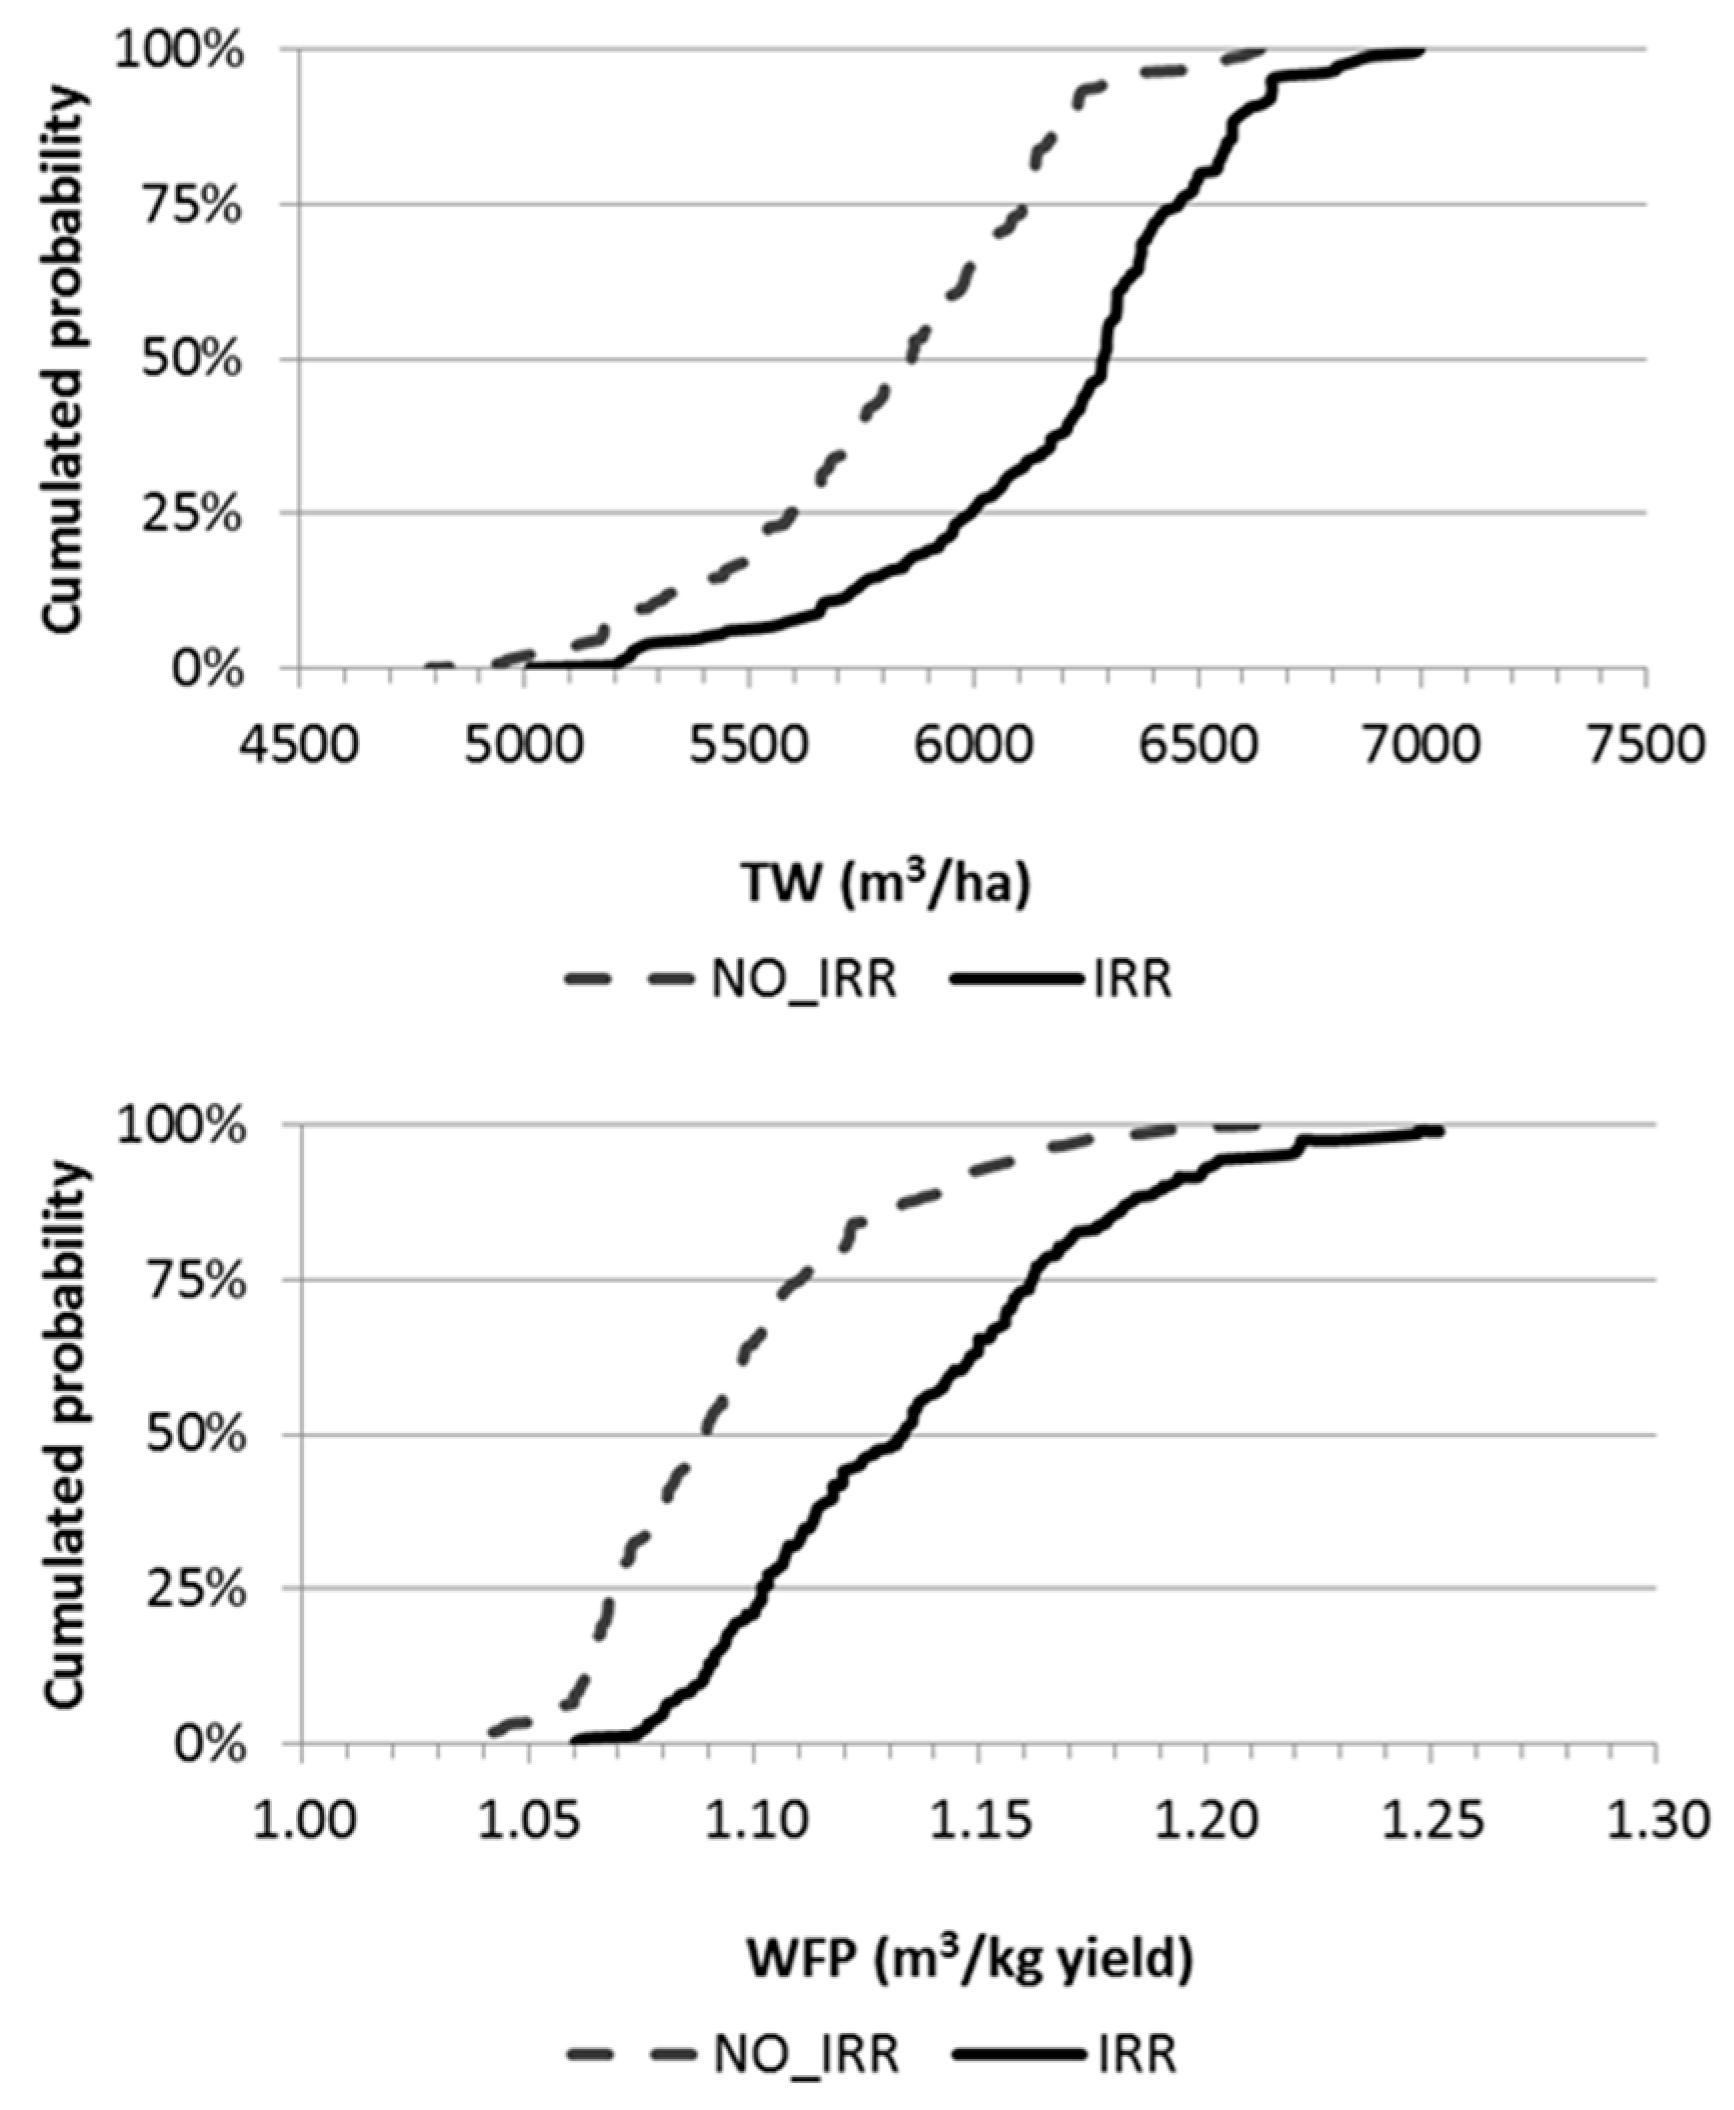
The cumulative probability function of the analysed variables, based on the sources of variation with the greatest impact (highest Iw values; specifically irrigation management and sowing date), was used to measure the magnitude of these sources across the different cropping options. For yield (
Figure 7), the median (50
th percentile) was 5389 kg/ha for the rainfed option (NO_IRR) and 5537 kg/ha for the irrigated option (IRR). Using the 25
th percentile as a critical threshold for significantly low yields, the value was 5071 kg/ha for NO_IRR, while it increased to 5277 kg/ha for IRR. A similar trend was observed for the 75
th percentile, used as a threshold for above-average yields. This was 5775 kg/ha for IRR and slightly decreased to 5718 kg/ha for rainfed. Overall, the main effect of irrigation at flowering was to reduce inter-annual variability compared to rainfed management. Specifically, comparing the differences in yield at the 25th and 75th percentiles relative to the mean, the difference at the lower threshold was -258 kg/ha for NO_IRR (-4.8%) and -211 kg/ha for IRR (-3.8%). For the upper threshold, the differences were +388 kg/ha for NO_IRR (+7.3%) and +297 kg/ha for IRR (+5.4%).
In terms of CO
2_eq, no significant differences were observed between the two irrigation management practices. The cumulative distribution data clustered around the median value of 1208 kg/ha. The percentage variations relative to the mean value of GHG emissions were around +1% for the 75
th percentile and -0.6% for the 25
th percentile (
Figure 7). In contrast, the analysis of the CFP showed that this sustainability index remained stable when considering both NO_IRR and IRR (
Figure 7). The median value for NO_IRR was slightly less than 4% higher than for IRR. The deviations of the cumulative probability function values at the 25
th and 75
th percentiles were also aligned between the two irrigation management practices. However, the deviation of the values calculated at the two thresholds of the cumulative probability function (relative to the mean CFP value), although similar for both irrigation practices, ranged from approximately +12% for the 75
th percentile to -13% for the 25
th percentile. These results showed that, on the one hand, CFP could generally be considered a sufficiently stable indicator of environmental sustainability, independent of irrigation management, but that its variability around the mean was closely linked to the variability of grain yield (considering that the numerator, CO
2_eq, remained within a narrow range of values, as previously reported). For TW (
Figure 8), the median value of IRR was higher compared to NO_IRR (6291 m³ ha-¹ vs. 5863 m³ ha-¹). The variability of the values, expressed by the deviation of the 25
th and 75
th percentiles from the mean, remained limited to a few percentage points, but shifted towards higher values for IRR compared to NO_IRR. The differences observed between the values of the two irrigation regimes were mainly due to the water evapotranspired by the crop (with blue water depending on the same crop management and reduced irrigation volumes), which, in turn , was linked to the biomass accumulation of the durum crop. This was reflected in the WFP, whose median value was slightly higher for IRR than for NO_IRR (
Figure 8), Ultimately, WFP proved to be sufficiently stable both between the two irrigation regimes and within each irrigation regime.
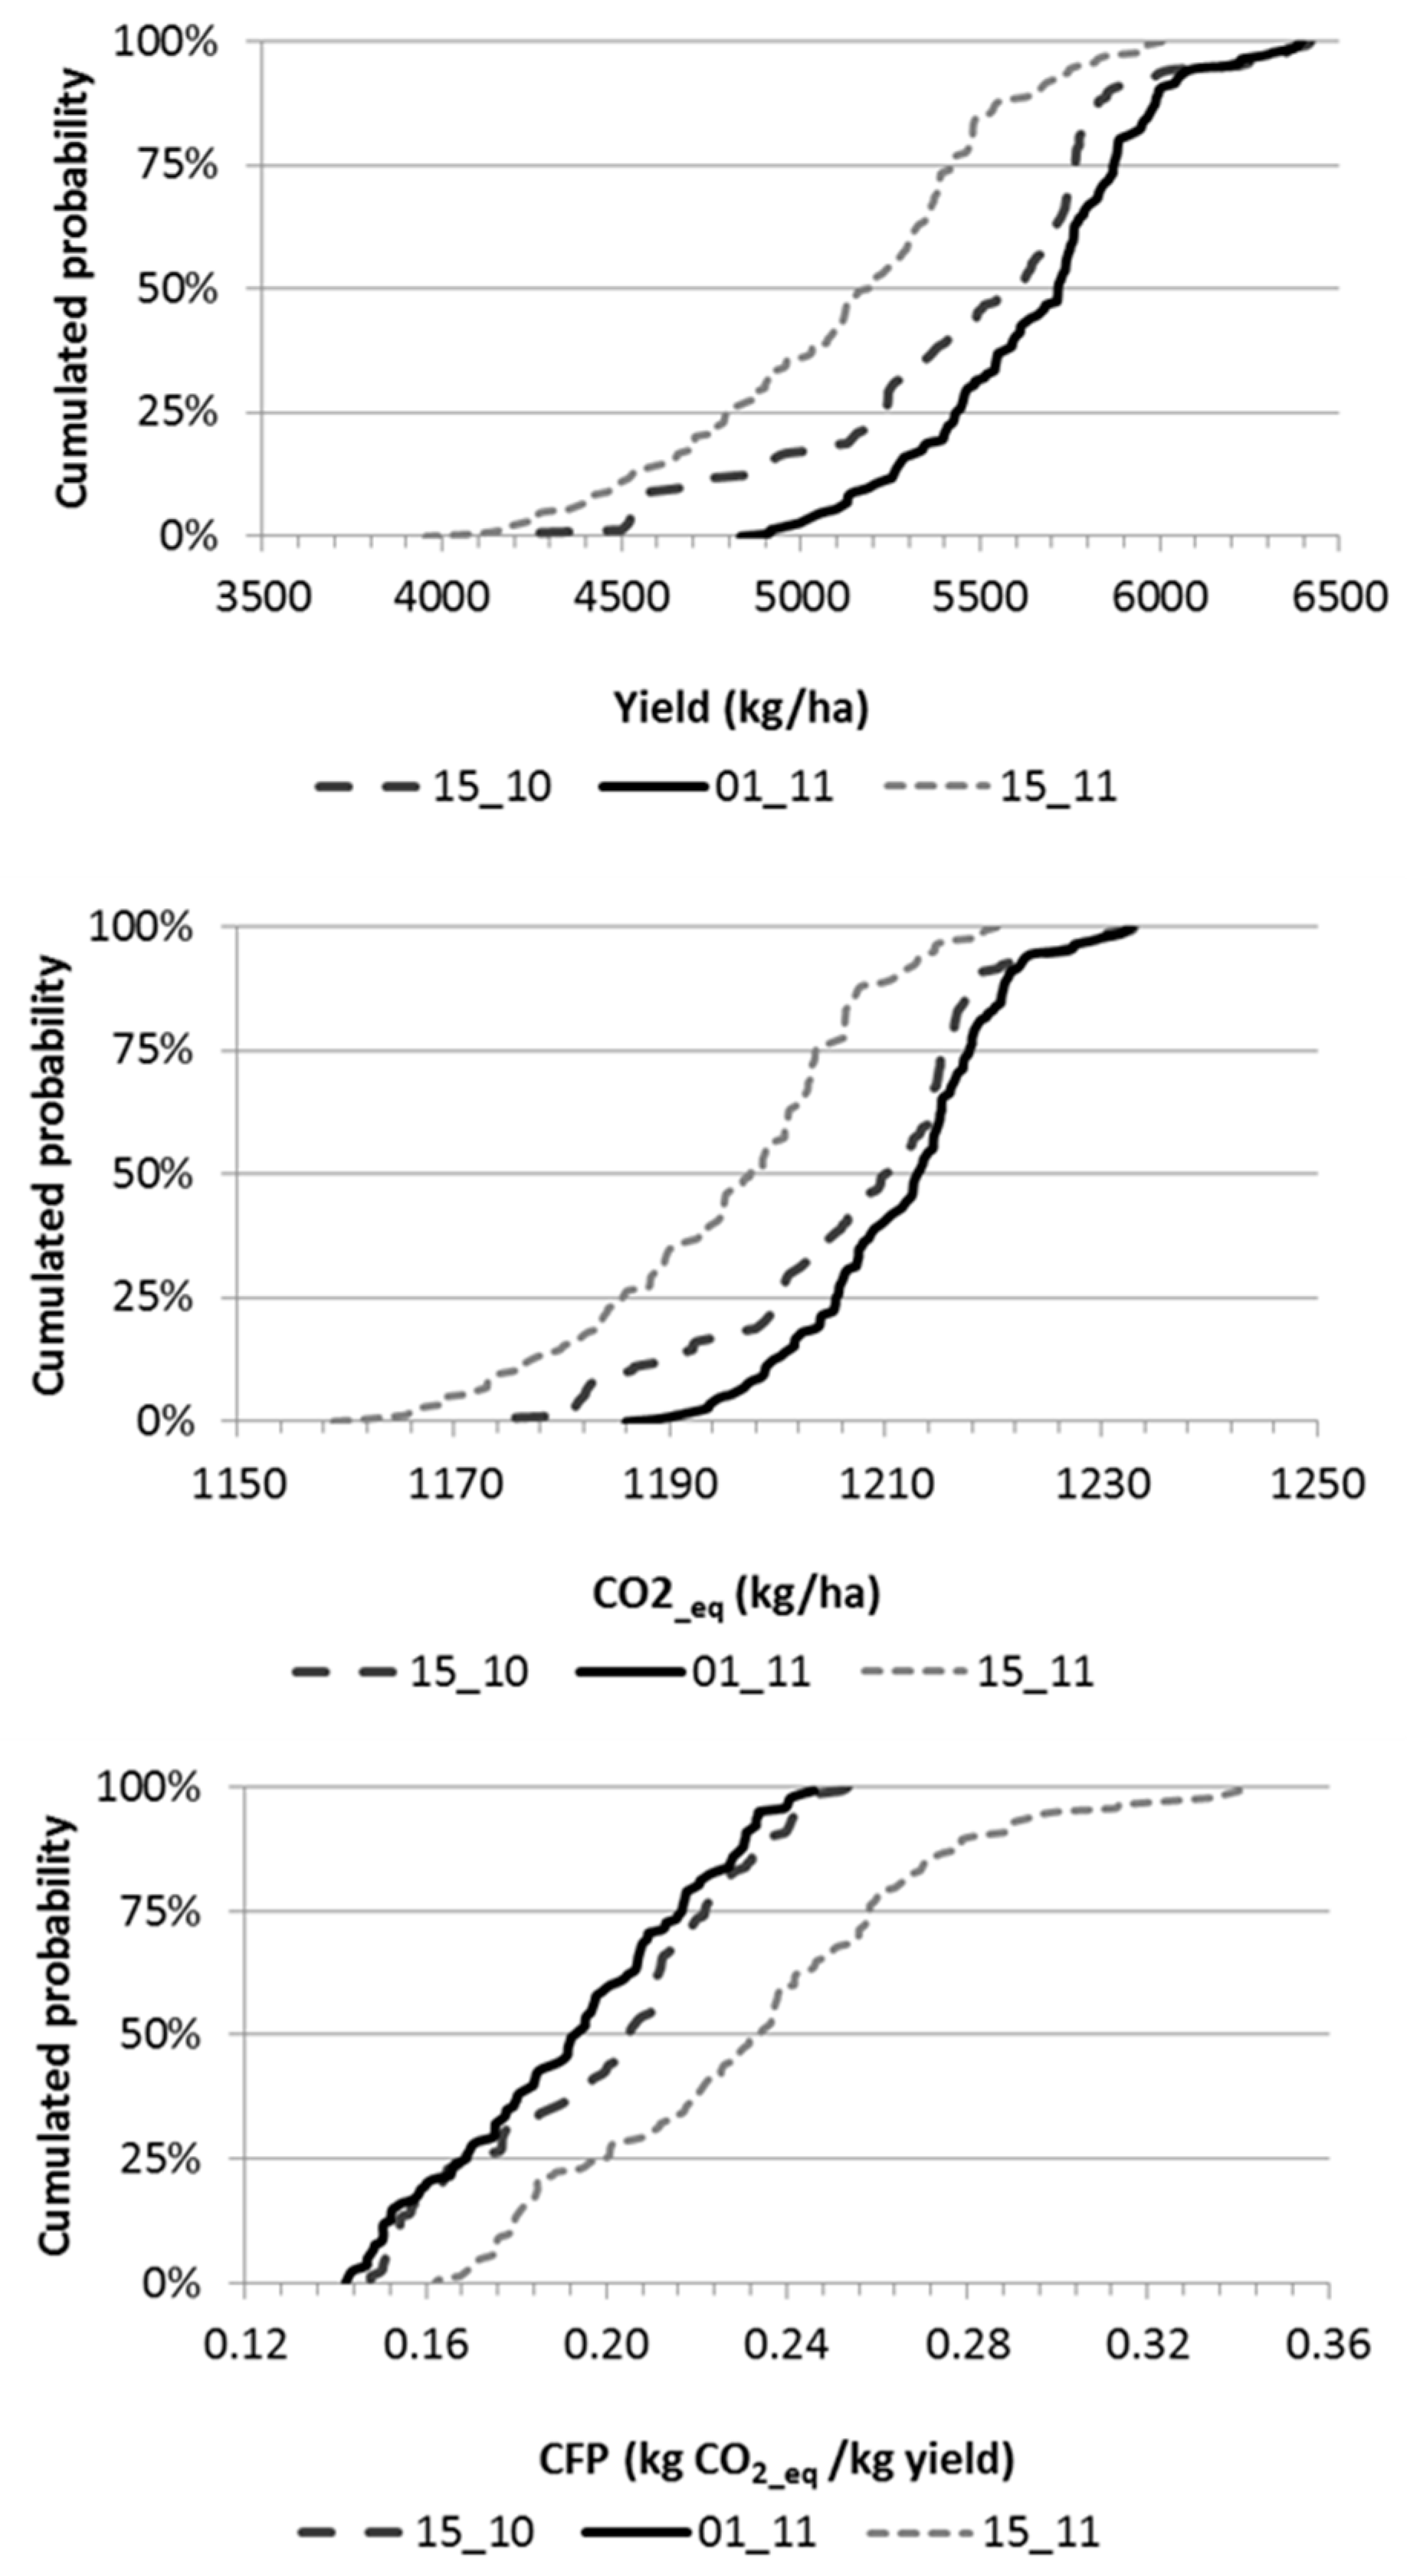
When analysing the cumulative probability functions of the production performance of the durum wheat cropping system as a function of the sowing date (averaging the irrigation management data;
Figure 9), it was observed that sowing in mid-November produced a mean yield (5195 kg/ha) lower than sowing on 15 October (5585 kg/ha) and especially early November (5718 kg/ha). In addition, not only were the yield data at the 25
th and 75
th percentiles lower at the latest sowing date than at the other two dates, but the deviations at these two critical thresholds (-6.25% at the 25
th percentile and +6.05% at the 75
th percentile) relative to the mean were greater than at the other two sowing dates (values ranging from -3.82% to +5.74%). In contrast to grain yield, CO
2_eq was similar for the three sowing dates, with median values ranging from 1197 kg/ha for mid-November sowing to 1213 kg/ha for early November sowing (
Figure 9). As GHG emissions are largely influenced by crop management practices (such as conventional tillage) the resulting values at the 25
th and 75
th percentiles were negligible, with increases (75
th percentile) and decreases (25
th percentile) of less than one percentage point. In any case, the estimation of the CFP, especially in relation to the crop yield, varied according to the sowing period, determining different sustainability indices for this parameter (
Figure 9).
Indeed, the median value was lowest for sowing on 1 November (0.193 kg/kg), followed by sowing in mid-October (0.205 kg/kg) and finally sowing in mid-November (0.258 kg/kg). However, in all three sowing periods, the variability of intra-annual CFP values increased compared to yield and CO2_eq. At the 25th percentile, CFP was 0.168 kg/kg for both the 15 October and 1 November sowings, although the percentage deviation was -15.5% for the former and -11.84% for the latter. Higher was the value recorded at the 25th percentile of the cumulative probability function for the mid-November sowing, where the CFP was 0.201 kg/kg (-13.37% relative to the mean). This period also showed worse (higher) values for this sustainability index at the 75th percentile (0.258 kg/kg) compared to sowing on 1 November (0.217 kg/kg) and mid-October (0.222 kg/kg), with percentage deviations ranging from +11.50% to +13% relative to the mean.
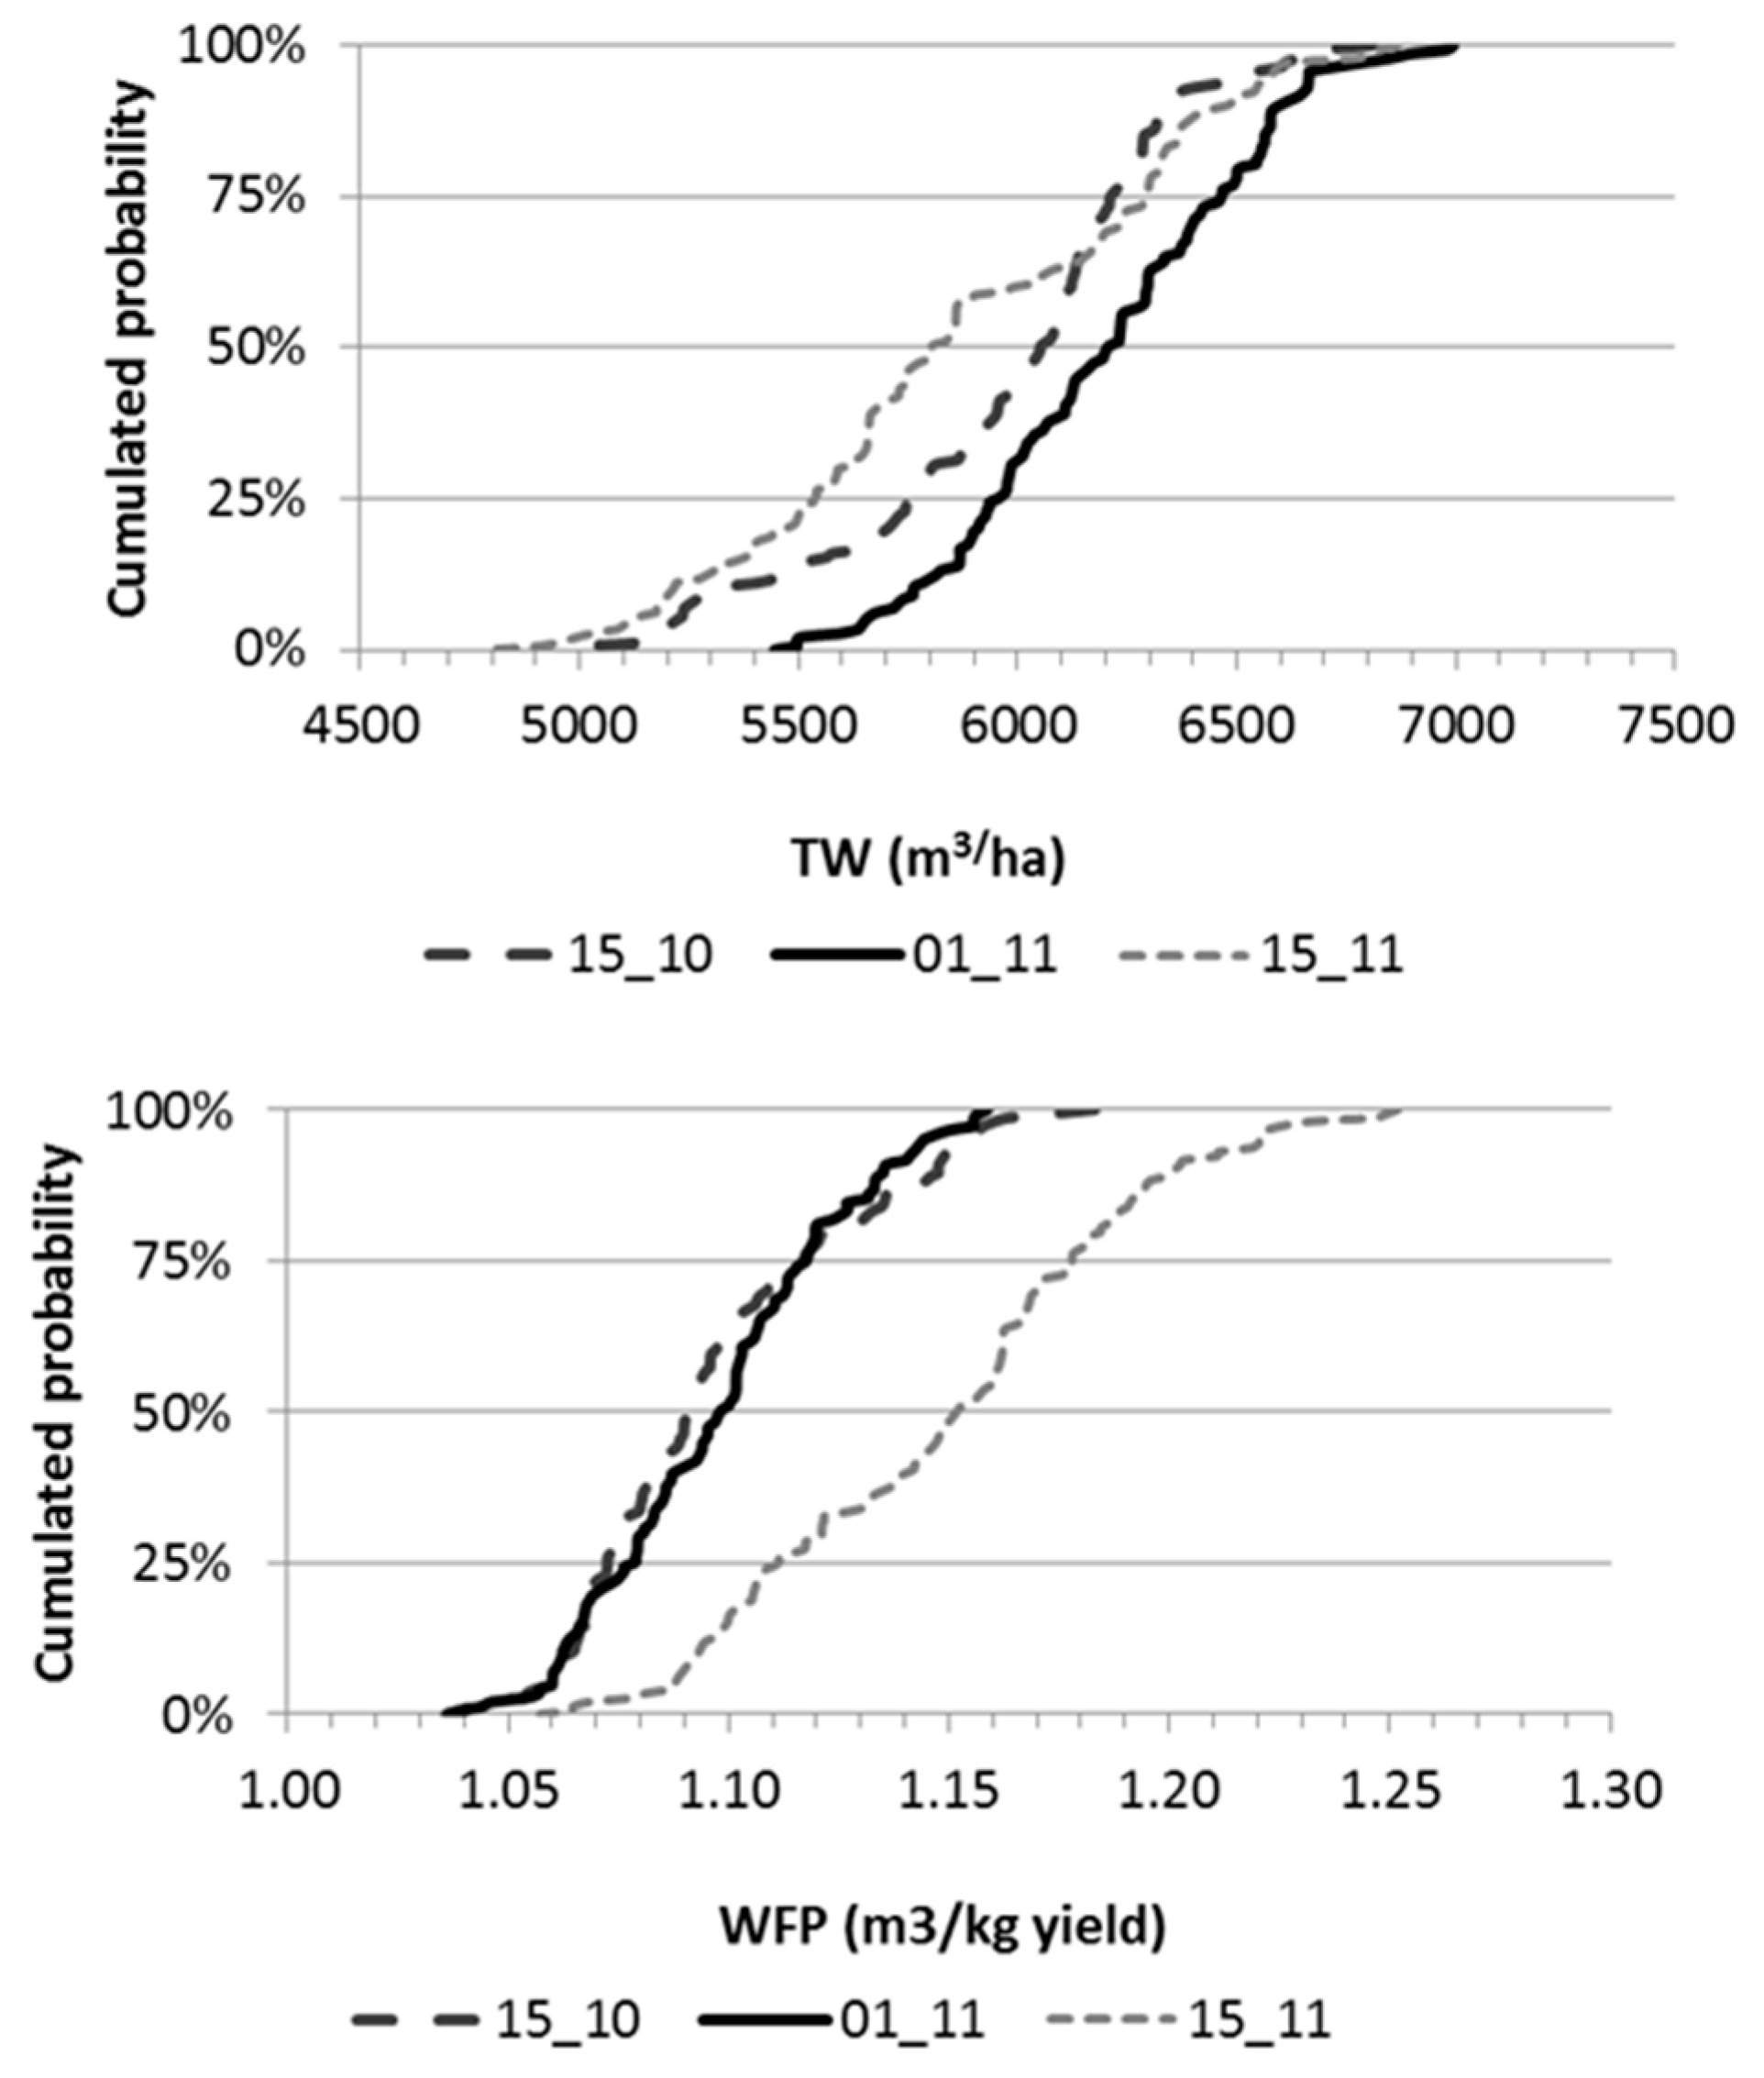
Sowing in mid-November proved to be the least environmentally friendly for WFP (
Figure 10), as this sowing date consistently maintained higher WFP values throughout the cumulative probability function curve from the 25
th to the 75
th percentile (albeit with variations limited to around 5%). As for the CFP, this index also remained within moderate variations considering the two thresholds (25
th and 75
th percentile) of the cumulative probability curve (
Figure 10), with the largest deviations from the mean occurring for the mid-November sowing (-3.21% to +2.58%) and the smallest for the early November sowing (-1.72% to +1.81%). For TW, the trends of the cumulative probability function curves followed their respective yields, with higher productivity correlating with increased water use. Specifically, the median values were 6208 m
3/ha, 6052 m
3/ha and 5804 m
3/ha for 1 November, 15 October and 15 November respectively. Sowing in the two November dates also ensured lower inter-annual variability for TW compared to the mean, with percentage differences ranging from +4.21% at the 75
th percentile to -3.69% at the 25
th percentile (mean for both dates), compared to +7.42% (75
th percentile) and -5.55% (25
th percentile) for October sowing.
4. Discussion
The simulation scenarios provided important insights into the effects of sowing dates and irrigation practices on durum wheat productivity. Three sowing dates (15 October, 1 November and 15 November) and two irrigation scenarios (rainfall and additional irrigation during flowering (up to 60 mm of total irrigation water) were investigated. The results highlighted the significant influence of sowing date on yield. Sowing in early November typically yielded better results than later sowing dates, due to better adaptation to favorable climatic conditions during the critical growth stages of the crop, as indicated by the longer growing cycle (177 days) compared to the other two sowing dates (with an average of 173 days). This confirms what has been reported by other authors [
63], who have shown how sowing durum wheat in Mediterranean environments within 30-day time windows resulted in yield variations ranging from 5% (in the Apulia region, southern Italy) to 56% (in the province of Settat, Morocco). The use of supplemental irrigation during flowering was found to be beneficial in stabilizing yields rather than improving crop performance, in line with the modest productivity gains found by other authors when durum wheat was irrigated during flowering [
64].
This practice mitigated the adverse effects of water stress during a critical developmental phase, thereby increasing yield stability, especially in less favorable growing years. This was evidenced by the higher yield when comparing grains obtained at the low threshold percentile of the cumulative probability density function. For example, at the 25
th percentile, the yield value for NO_IRR was 5034 kg/ha, while in the irrigated scenario this value was found at the 15
th percentile, indicating a lower probability (by 10 percentage points) of obtaining such a low yield. The fertilizers (type and amount) specified for this cropping system (ammonium nitrate and urea under conventional tillage) were the main source of GHG emissions (both direct and indirect), contributing about 48% of the total environmental impact. Therefore, this agro-input is confirmed as one of the main hotspots regarding the environmental sustainability of durum wheat cultivation under conventional tillage, as identified by other authors in studies on durum wheat grown in the Apulia region [
65].
Soil management, particularly seedbed preparation operations, was the second most emission-intensive process, followed by other operations related to sowing, harvesting and packing. The choice of tillage practice was reported to be a major option for significantly reducing greenhouse gas emissions, with reductions of up to 42% when switching from conventional tillage to no-tillage [
66]. In addition, leaving straw on the soil can result in a CO
2_eq saving of around 6% (due to reduced straw collection and baling). However, the transition from conventional tillage to reduced agro-technical input methods (such as minimum tillage and no-tillage) may, at least in the short to medium term, involve trade-offs that offset the reduction in GHG emissions and/or performance in terms of CFP.
Indeed, reduced or even no-tillage has been reported to reduce cereal productivity [
67,
68,
69], with reductions of up to -10% for minimum tillage and -20% for no-tillage. The other issue associated with soil management alternatives to conventional tillage is the increased use of pesticides for weed control. In fact, reducing tillage and/or leaving straw on the soil creates an optimal environment for weed development (seeds remain on the surface but are “protected” by crop residues). The residues also reduce the effectiveness of pesticides [
70].
This may result in the introduction of herbicides where they were not previously used, or increased rates where they were. The use of herbicides in herbaceous cropping systems contributes a significant share of GHG emissions, both for production and application (302 kg CO
2_eq/ha; [
71] and for indirect GHG emissions (up to 383 kg CO
2_eq/ha; [
72]. In any case, the analysis carried out in this modelling exercise showed that even with the same management practices (conventional tillage, which represents almost the entire agronomic practice of durum wheat cultivation in monoculture), it was possible to reduce the environmental impact of the cropping system (i.e., CFP). This reduction was achieved by modifying two practices: sowing date and irrigation. These adjustments do not require significant changes in agricultural practices, machinery or equipment. This was made possible by the increase in crop productivity, which is the denominator in the calculation of CFP. Indeed, this index was lower in the cropping system with higher yields (i.e., sowing in early November, with or without irrigation), while the highest values (indicating less environmentally friendly cropping systems) were observed with later sowing, with or without water supply. The high variability of this index value has also been reported in several other studies, confirming that productivity is the key factor in modulating CFP [
73,
74,
75], with the highest values observed in systems with the lowest productivity [
76].
An interesting observation was made when analyzing the cumulative distribution function. In late sowing, the risk of obtaining high CFP values (expressed as 0.258 kg CO₂_eq per kg yield at the 75
th percentile) compared to the average was only observed for sowing in mid-November, and not for sowing in mid-October or early November. These two sowing dates never produced CFP values equal to or greater than this magnitude, indicating that they are clearly preferable for reducing the environmental impact associated with this index. Irrigation management also proved to be important in reducing the CFP value. Indeed, when analyzing the cumulative probability density curves, IRR shifted the curve to the left compared to NO_IRR, highlighting how this practice, although based on small amounts of water supply concentrated during the flowering stage, could promote more stable yields, less susceptible to the climatic vagaries of the growing season, and ultimately reduce CFP. Although irrigation plays a key role in reducing CFP, in the cropping systems analyzed, its impact on the water consumption of the system was limited. In fact, the impact of the irrigation volumes formalized in this research was negligible, amounting to a maximum of 1.7% (in the system with the highest irrigation water use) in terms of BlueW. However, it promoted more stable yields and facilitated better use of water resources. This explains why, in the most productive management scenarios (with irrigation and sowing in early November), TW was higher, due to increased GreenW consumption rather than an increase in BlueW. This trend is also confirmed by other authors, where modest increases in irrigation water led to increases in GreenW consumption [
77]. However, the trend in WFP showed an inverse relationship with CFP.
While an increase in productivity justified a reduction in the latter index (under similar crop and soil management conditions), WFP noted a lack of proportionality between increased water use and grain yield. Instead, this sustainability index was negatively affected by increased productivity. In other words, under rainfed conditions, the crop used rainwater more effectively, so that lower (though not dramatic) yields corresponded to better sustainability in terms of WFP. This is consistent with findings from previous research, where better water use efficiency in cereals under conditions of reduced water supply has been widely observed compared to better water supply conditions [
78,
79,
80]. The results obtained and discussed here reveal a nuanced trade-off between reducing CFP and increasing WFP in durum wheat production. While minimizing CFP is crucial for mitigating environmental impacts, optimizing WFP is equally important for ensuring efficient water use, especially in view of its increasing scarcity. The reduction of GHG emissions is closely linked to the reduction of agro-technical inputs. Switching from conventional tillage to alternative soil management practices (such as minimum tillage and no-tillage) has a positive impact on the environmental sustainability of a cropping system (such as durum wheat). However, this would require the replacement of machinery, which is a major challenge for most DW farms in the study area and is unlikely to be achievable in the short term. Mineral nitrogen fertilization is another factor to be considered, and here to a reduction in dose and/or the use of alternative forms of fertilization (such as compost) could be beneficial.
Such changes need to be carefully evaluated in terms of potential productivity loss, as if the aim is to optimize CFP, this study has shown the importance of maintaining adequate yields to avoid reducing CFP values. In addition, leaving straw on the ground rather than removing it can improve the environmental sustainability of the cropping system by increasing soil organic carbon stocks. However, it’s important to consider the trade-offs associated with increased N
2O and methane emissions due to straw decomposition [
81]. Finally, the use of the WFP to assess the environmental sustainability of durum wheat production, at least under the pedoclimatic conditions and irrigation levels used here, can be tricky and requires careful evaluation. A reduction in this index inevitably involves a reduction in GreenW, which represents the majority of the water used, even taking into account the modest amounts of irrigation water used here (which have a minimal impact on BlueW). The results show that reducing GreenW is associated with lower yields (less evapotranspired water) but giving instructions in this direction (produce less to reduce water consumption and increase WFP) is not sustainable from other perspectives (such as economic returns). In this case, instead of trying to minimise this index separately from WFP, it is advisable to optimise both indices, including by choosing specific sowing dates (e.g., early November) combined with modest irrigation volumes during the flowering period (around 300 m
3/ha).
5. Conclusions
The results of the modelling analysis of durum wheat production highlighted the significant influence of sowing date and irrigation practices on both productivity and environmental sustainability. Three different sowing dates, as well as rainfed and irrigated scenarios, were examined to elucidate their effects on grain yield, greenhouse gas emissions and water use. In terms of productivity, early November sowing consistently outperformed later sowing dates, with higher average grain yields under all conditions. Supplemental irrigation during flowering proved beneficial in stabilizing yields, particularly in mitigating the adverse effects of water stress at critical growth stages. In terms of environmental impact, nitrogen-based fertilizers emerged as a major contributor to GHG emissions, with soil management practices also having a significant impact on emissions. The analysis showed that sowing date and irrigation management played a key role in modulating CFP and WFP. Sowing in early November, combined with supplemental irrigation, resulted in lower CFP values, indicating greater environmental sustainability compared to later sowing dates. However, increased productivity resulting from optimal management practices led to higher WFP values, highlighting the interplay between productivity and water savings (especially GreeW).
In terms of sustainability, the results suggest that although it may not be possible to achieve maximum scores for both environmental sustainability indices, optimisation of both indices can be achieved through management of sowing dates and deficit irrigation. This is particularly true where significant changes to the cropping system, such as reduced tillage, changes in fertilizer management and variations in straw management, not only require investment in time, technology and equipment, but also require consideration of how these changes may affect other variables such as productivity, increased chemical use and increased soil greenhouse gas emissions.
Figure 1.
Localization of the study area (Capitanata plain; Apulia region, Southern Italy).
Figure 1.
Localization of the study area (Capitanata plain; Apulia region, Southern Italy).
Figure 2.
Average annual values (from 2010 to 2023) for maximum temperature (°C, above), minimum temperature (°C, middle), and cumulative rainfall (mm, below) relative to the territory of the Capitanata plain.
Figure 2.
Average annual values (from 2010 to 2023) for maximum temperature (°C, above), minimum temperature (°C, middle), and cumulative rainfall (mm, below) relative to the territory of the Capitanata plain.
Figure 3.
The Plant Available Water (PAW, mm) for the soils of the Capitanata plain. These characterizations are derived from the texture and depth of soils in this durum wheat cultivation area.
Figure 3.
The Plant Available Water (PAW, mm) for the soils of the Capitanata plain. These characterizations are derived from the texture and depth of soils in this durum wheat cultivation area.
Figure 4.
Soil organic carbon content (%) in different areas cultivated with durum wheat in the Capitanata territory.
Figure 4.
Soil organic carbon content (%) in different areas cultivated with durum wheat in the Capitanata territory.
Figure 5.
Weights (Iw; see Eq. (4)) relative to the sources of variation with respect to the grain yield (a), GHG emissions (CO2_eq; b) and CFP (c).
Figure 5.
Weights (Iw; see Eq. (4)) relative to the sources of variation with respect to the grain yield (a), GHG emissions (CO2_eq; b) and CFP (c).
Figure 6.
Weights (Iw; see Eq. (4)) relative to the sources of variation with respect to total water consume (TW; a), and WFP (c).
Figure 6.
Weights (Iw; see Eq. (4)) relative to the sources of variation with respect to total water consume (TW; a), and WFP (c).
Figure 7.
Cumulative distribution function relative to grain yield, GHG emisions (CO2_eq) and carbon footprint (CFP) for durum wheat cropping system under rainfed and irrigated (at flowering) management.
Figure 7.
Cumulative distribution function relative to grain yield, GHG emisions (CO2_eq) and carbon footprint (CFP) for durum wheat cropping system under rainfed and irrigated (at flowering) management.
Figure 8.
Cumulative distribution function relative to total water consume (TW) and water footprint (WFP) for durum wheat cropping system under rainfed and irrigated (at flowering) management.
Figure 8.
Cumulative distribution function relative to total water consume (TW) and water footprint (WFP) for durum wheat cropping system under rainfed and irrigated (at flowering) management.
Figure 9.
Cumulative distribution function relative to grain yield, GHG emissions (CO2_eq) and carbon footprint (CFP) for durum wheat cropping system sowed at mid-October (15_10), the first of November (01_11) and mid-November (15_11).
Figure 9.
Cumulative distribution function relative to grain yield, GHG emissions (CO2_eq) and carbon footprint (CFP) for durum wheat cropping system sowed at mid-October (15_10), the first of November (01_11) and mid-November (15_11).
Figure 10.
Cumulative distribution function relative to total water consume (TW) and water footprint (WFP) for durum wheat cropping system sowed at mid-October (15_10), the first of November (01_115) and mid-November (15_1).
Figure 10.
Cumulative distribution function relative to total water consume (TW) and water footprint (WFP) for durum wheat cropping system sowed at mid-October (15_10), the first of November (01_115) and mid-November (15_1).
Table 1.
Soil and crop management of durum wheat by activity and associated environmental impacts (CO2_eq). For baling and residue decomposition, the average (and standard deviation) is reported due to the variable response of the crop under different management and pedoclimatic conditions.
Table 1.
Soil and crop management of durum wheat by activity and associated environmental impacts (CO2_eq). For baling and residue decomposition, the average (and standard deviation) is reported due to the variable response of the crop under different management and pedoclimatic conditions.
| Operation |
Passages |
Amount |
Fertilizer |
CO2_eq |
| |
n° |
kg/ha |
% N |
kg/ha |
| Soil management |
|
|
|
|
| Ploughing |
1 |
|
|
121 |
| Disk harrowing |
2 |
|
|
161.4 |
| Rotary tilling |
1 |
|
|
80.5 |
| Other |
|
|
|
|
| Sowing |
1 |
|
|
24 |
| Harvest |
1 |
|
|
162 |
| Bailng of straw |
1 |
7657.9 (±516.7) |
|
74.4 (±5.0) |
| Fertilizer |
|
|
|
|
| Ammonim nitrate |
1 |
100 |
34 |
376.4 |
| Urea |
1 |
50 |
46.6 |
126.1 |
| Residue decomposition |
|
1351(±91.2) |
|
75.9 (±9.2) |
Table 2.
Productivity and environmental impacts associated with different sowing dates and irrigation practices in durum wheat production.
Table 2.
Productivity and environmental impacts associated with different sowing dates and irrigation practices in durum wheat production.
| Sow. time |
Irr |
Yield |
Water supply |
CO2_eq |
CFP |
GreenW |
BlueW |
TW |
WFP |
| |
|
kg/ha |
mm |
kg/ha |
kg CO2_eq /kg yield |
mm |
mm |
mm |
mm water/ kg yield |
| 15_oct |
no |
5432 (471) b |
|
1206 (12.8) ab |
0.199 (0.030) c |
3901 (339) b |
1987 (24.5) de |
5887 (327) c |
1.086 (0.029) c |
| 01_nov |
no |
5573 (332) ab |
|
1209 (9.5) ab |
0.197 (0.030) c |
3999 (239) ab |
1999 (14.9) e |
5999 (254) c |
1.078 (0.019) c |
| 15_nov |
no |
4983 (429) d |
|
1190 (13.0) c |
0.244 (0.042) a |
3574 (308) c |
1981 (15.8) e |
5556 (324) d |
1.119 (0.033) b |
| 15_oct |
yes |
5473 (476) b |
13 (4.8) c |
1208 (12.9) b |
0.197 (0.030) c |
3931 (342) b |
2114 (60.6) c |
6045 (383) bc |
1.106 (0.029) b |
| 01_nov |
yes |
5722 (310) a |
28 (9.0) b |
1214 (8.6) a |
0.186 (0.028) d |
4107 (223) a |
2280 (95.0) b |
6387 (283) a |
1.117 (0.020) b |
| 15_nov |
yes |
5240 (426) c |
41 (10.4) a |
1199 (12.5) d |
0.220 (0.037) b |
3760 (306) d |
2400 (115.3) a |
6160 (397) b |
1.178 (0.028) a |
Table 3.
One-way analysis of variance (ANOVA) to assess the relationship between sources of variation (pedoclimatic and crop management variables) and cropping system performance and environmental sustainability.
Table 3.
One-way analysis of variance (ANOVA) to assess the relationship between sources of variation (pedoclimatic and crop management variables) and cropping system performance and environmental sustainability.
| Source |
Variable |
Sum square |
DF |
Mean Square |
F |
F crit |
P>F |
| Soil |
|
|
|
|
|
|
|
| |
Yield |
63984288 |
71 |
901187 |
9.85 |
1.33 |
< .001 |
| |
CO2_eq |
50632 |
71 |
713 |
7.95 |
1.33 |
< .001 |
| |
CFP |
0.4131 |
71 |
0.0058 |
9.79 |
1.33 |
< .001 |
| |
TW |
42839751 |
71 |
603377 |
6.45 |
1.33 |
< .001 |
| |
WFP |
0.233 |
71 |
0.0033 |
2.24 |
1.33 |
< .001 |
| Irrigation |
|
|
|
|
|
|
|
| |
Yield |
2395958 |
1 |
2395958 |
10.85 |
3.86 |
0.001 |
| |
CO2_eq |
2566 |
1 |
2566 |
13.73 |
3.86 |
< .001 |
| |
CFP |
0.017 |
1 |
0.017 |
11.75 |
3.86 |
< .001 |
| |
TW |
15892306 |
1 |
15892307 |
112.75 |
3.86 |
< .001 |
| |
WFP |
0.172 |
1 |
0.172 |
126.16 |
3.86 |
< .001 |
| Sowing time |
|
|
|
|
|
|
|
| |
Yield |
21206664 |
2 |
10603332 |
60.08 |
3.02 |
< .001 |
| |
CO2_eq |
21163 |
2 |
10581 |
73.50 |
3.02 |
< .001 |
| |
CFP |
0.132 |
2 |
0.066 |
57.38 |
3.02 |
< .001 |
| |
TW |
8401657 |
2 |
4200829 |
26.46 |
3.02 |
< .001 |
| |
WFP |
0.2521 |
2 |
0.1261 |
106.93 |
3.02 |
< .001 |
| Climate |
|
|
|
|
|
|
|
| |
Yield |
23607299 |
16 |
1475456 |
8.35 |
1.67 |
< .001 |
| |
CO2_eq |
19082 |
16 |
1193 |
7.75 |
1.67 |
< .001 |
| |
CFP |
0.1051 |
16 |
0.0066 |
5.22 |
1.67 |
< .001 |
| |
TW |
13605671 |
16 |
850354 |
5.61 |
1.67 |
< .001 |
| |
WFP |
0.1244 |
16 |
0.0078 |
5.09 |
1.67 |
< .001 |
