Preprint
Article

Identification of Interstitial Cystitis-Related Genes Through Bioinformatics Analysis and Mendelian Randomization

Altmetrics

Downloads

26

Views

30

Comments

0

Submitted:

29 November 2024

Posted:

29 November 2024

You are already at the latest version

Alerts
Abstract
Interstitial cystitis, also referred to as bladder pain syndrome (IC/BPS), is a chronic condition characterized by pain in the bladder and pelvis. The underlying pathogenesis and useful biomarkers still remain unclear. Bioinformatics and Mendelian randomization approaches were utilized to investigate genes associated with IC and identify potential signaling pathways involved. We identified expressed genes (DEGs) using two IC datasets from the Gene Expression Omnibus (GEO) database and used the expression quantitative trait loci (eQTL) and IC genome-wide association studies (GWAS) data for two-sample Mendelian randomization (MR) analysis to determine co-expressed genes. Subsequently, we performed immune cell infiltration and Gene Set Enrichment Analysis (GSEA) analysis to investigate the functional roles and pathways associated with these genes. Lastly, we validated the findings related to the identified co-expressed genes. We identified 447 high-expressed genes and 326 low-expressed genes in IC. Through MR analysis, three significantly co-expressed genes (CD38, FPR1, and SLA) were identified, which exhibited significant positive causal effect on IC. Additionally, elevated levels of activated CD4 memory T cells were observed in the IC patient group, correlating with the three co-expressed genes. Furthermore, these genes are involved in essential biological processes and pathways, including adaptive immune response, immune receptor activity chemokine signaling pathway, cytokine-cytokine receptor interaction, and JAK stat signaling pathway. Finally, we validated the high expression levels of these three genes in an independent cohort. CD38, FPR1, and SLA are promising target genes for the diagnosis and treatment of IC, warranting further research to explore their roles in IC. This strategy has the potential to promote the development of highly specific biomarkers and therapeutic targets, thereby enhancing both diagnostic accuracy and treatment options for IC.
Keywords: 
Subject: Medicine and Pharmacology  -   Urology and Nephrology

1. Introduction

Interstitial cystitis, also known as bladder pain syndrome (IC/BPS), is a chronic condition that leads to pain in the bladder and pelvic area. Over 1 million patients suffer from IC, presenting symptoms such as frequent urination, urgency, and nocturia [1]. Globally, the prevalence of IC is estimated at 300 cases per 100,000 women, with men affected at approximately 10–20% of the rate seen in women [2]. Clinically, IC is classified into two types: Hunner-type IC (HIC), characterized by Hunner’s lesions, and non-Hunner IC (NHIC), which occurs without these lesions.
The management of IC generally includes a combination of approaches aimed at alleviating symptoms and enhancing quality of life. Treatments such as glycosaminoglycan (GAG) replenishment and Intravesical treatments with heparin, hyaluronic acid, chondroitin sulfate, bacillus Calmette-Guerin, and botulinum toxin injections have demonstrated effectiveness in reducing symptoms for certain patient groups [3]. Additionally, newer therapies like low-energy shockwave treatment, platelet-rich plasma, and stem cells are being investigated as adjunctive options for patients with refractory symptoms [4]. Nonetheless, treatment outcomes for the disease often remain suboptimal [5].
The etiology of IC remains unknown and is thought to be multifactorial. Previous theories suggest that genetic predisposition, urothelial barrier defects, chronic inflammation, urine toxicity, and neural sensitization may play pivotal roles [6,7,8]. One potential cause of IC may be defective urothelial barrier permeability, which can result from local lesions or systemic inflammation. Another possible contributing factor is immune system dysfunction, which may also play a role in the development of IC [9]. The human bladder mucosa consists of a single layer of urothelial cells along with various types of immune cells. This urothelial barrier serves to block solutes and bacteria from penetrating the urothelium, thereby preventing immune cell activation. Alterations in several types of immune cells, such as plasma cells [10] and mast cells [11], have been noted and are thought to be linked to the development of IC. Proinflammatory cytokines have additionally been detected in the urine of patients with IC [12]. A prior study demonstrated that the experimental autoimmune cystitis model reproduces increased expression of mast cells and inflammatory cytokines, a process that depends on peptide-induced autoimmunity mediated by CD4+ T cells [13]. Additionally, the pathophysiological complexity of IC is further reflected in abnormal immune responses and urothelial dysfunction, as evidenced by findings of glycosaminoglycan layer deficiencies and increased urothelial permeability.
The common pathogenesis features of IC include inflammatory fibroblasts, activated CD4+ T cells, neutrophil migration, and activation of autoimmune-related B cells. Currently, research into the pathology and treatment of IC is ongoing, with a focus on identifying biomarkers that could streamline diagnosis and personalize treatment protocols. By characterizing the GEO database analysis and MR, we have access to better understand disease mechanisms and therapeutic targets.
The central objective of this study was to pinpoint DEGs related to IC through the examination of microarray datasets. It also seeks to evaluate the connections and causative functions of these genes in IC pathogenesis using eQTL and MR analyses. Furthermore, GSEA was utilized to investigate relevant functional pathways and mechanisms that underlie the involvement of these genes in IC development. This study seeks to elucidate the molecular basis of IC, identifying potential biomarkers for diagnosis and therapeutic targets.

2. Materials and Methods

2.1. Data acquirement

The datasets GSE11783, GSE57560, and GSE11839 were retrieved from the GEO database (https://www.ncbi.nlm.nih.gov/geo/). Data of interstitial cystitis (GCST90044234), which includes 240 cases and 456,108 controls of European ancestry, were sourced from the GWAS Catalog (https://www.ebi.ac.uk/gwas/).

2.2. Identification of DEGs

We used R software (version 4.4.1) to read and preprocess the GSE11783 and GSE57560 datasets, applying corrections to each dataset individually. The datasets were then merged, followed by batch correction and differential analysis on a cohort of 9 normal samples and 23 IC samples. DEGs were identified using the “limma” R package, with thresholds set at |log fold change (FC)| > 1 and a false discovery rate (FDR) < 0.05. Volcano plots and heatmaps of DEGs were generated with the “pheatmap” package. Gene expression matrices and annotation files obtained from the GEO database were used for data normalization and standardization. To eliminate batch effects and improve data visualization, PCA was conducted using the “prcomp” function, facilitating the evaluation and validation of key genes distinguishing IC samples from healthy controls.

2.3. GO/KEGG Enrichment Analysis

The “clusterProfiler” R package was employed for GO functional annotation and KEGG pathway enrichment analysis of DEGs to explore potential functional pathways and underlying mechanisms of pathogenesis. The “clusterProfiler” package is an ontology-based tool designed for categorizing biological terms and performing gene cluster enrichment analysis. In our study, a significance threshold of P < 0.05 was applied as the filtering criterion.

2.4. eQTL Data Preprocessing

The summary eQTL data utilized in this study were sourced from the GWAS Catalog (https://www.ebi.ac.uk/gwas/). The R package “Two-SampleMR” (version 0.6.8) was used to identify SNPs with strong associations (p < 5e-06) as instrumental variables. Linkage disequilibrium was managed by setting the r² threshold to less than 0.001 and specifying a clumping distance of 10,000 kb. SNPs that showed weak associations or did not adequately explain phenotypic variance (F-statistic > 10) were excluded from the analysis.

2.5. Mendelian Randomization Analysis

MR analysis was conducted using the Two-SampleMR software package, applying the inverse variance-weighted (IVW) method to assess the association between specific genes and IC. Additional sensitivity analyses were carried out using MR-Egger, simple mode, weighted median, and weighted mode approaches. Genes were identified as disease-related based on certain criteria. Genes with p < 0.05 in the IVW analysis were initially selected for further investigation. Subsequently, genes were retained based on a consistent direction of the odds ratio among the five methods. Finally, genes showing signs of pleiotropy with p < 0.05 were excluded. Overlapping genes between disease-related genes and the DEGs, co-expressed genes were identified. The analysis involved tests for heterogeneity, pleiotropy, and leave-one-out sensitivity to assess the robustness and reliability of the findings. To illustrate and support these results, scatter plots, forest plots, leave-one-out plots, and funnel plots were created and examined.

2.6. Immune Cell Analysis

The CIBERSORT approach was used to assess the infiltration levels of 22 types of immune cells in IC. This analysis explored the link between co-expressed genes in IC and immune cell infiltration, investigating possible pathways through which co-expressed genes might influence immune cells.

2.7. GSEA Enrichment Analysis

To determine whether functions or pathways linked to co-expressed genes showed enrichment at the top or bottom ranks, indicating trends in upregulation or downregulation, GSEA was performed. Additionally, GSEA was employed to assess the activity levels of relevant functions or pathways within the gene expression dataset. In this analysis, results were deemed statistically significant when the p < 0.05.

2.8. Validation Group Differential Analysis

The dataset GSE11839 was analyzed using R software (version 4.4.1), with preprocessing conducted through the same methods applied to previous datasets. This analysis aimed to validate whether co-expressed genes exhibited differential expression between control and experimental groups, allowing for a comparison of these findings with those observed in our study.

3. Results

3.1. Obtain Differentially Expressed Genes

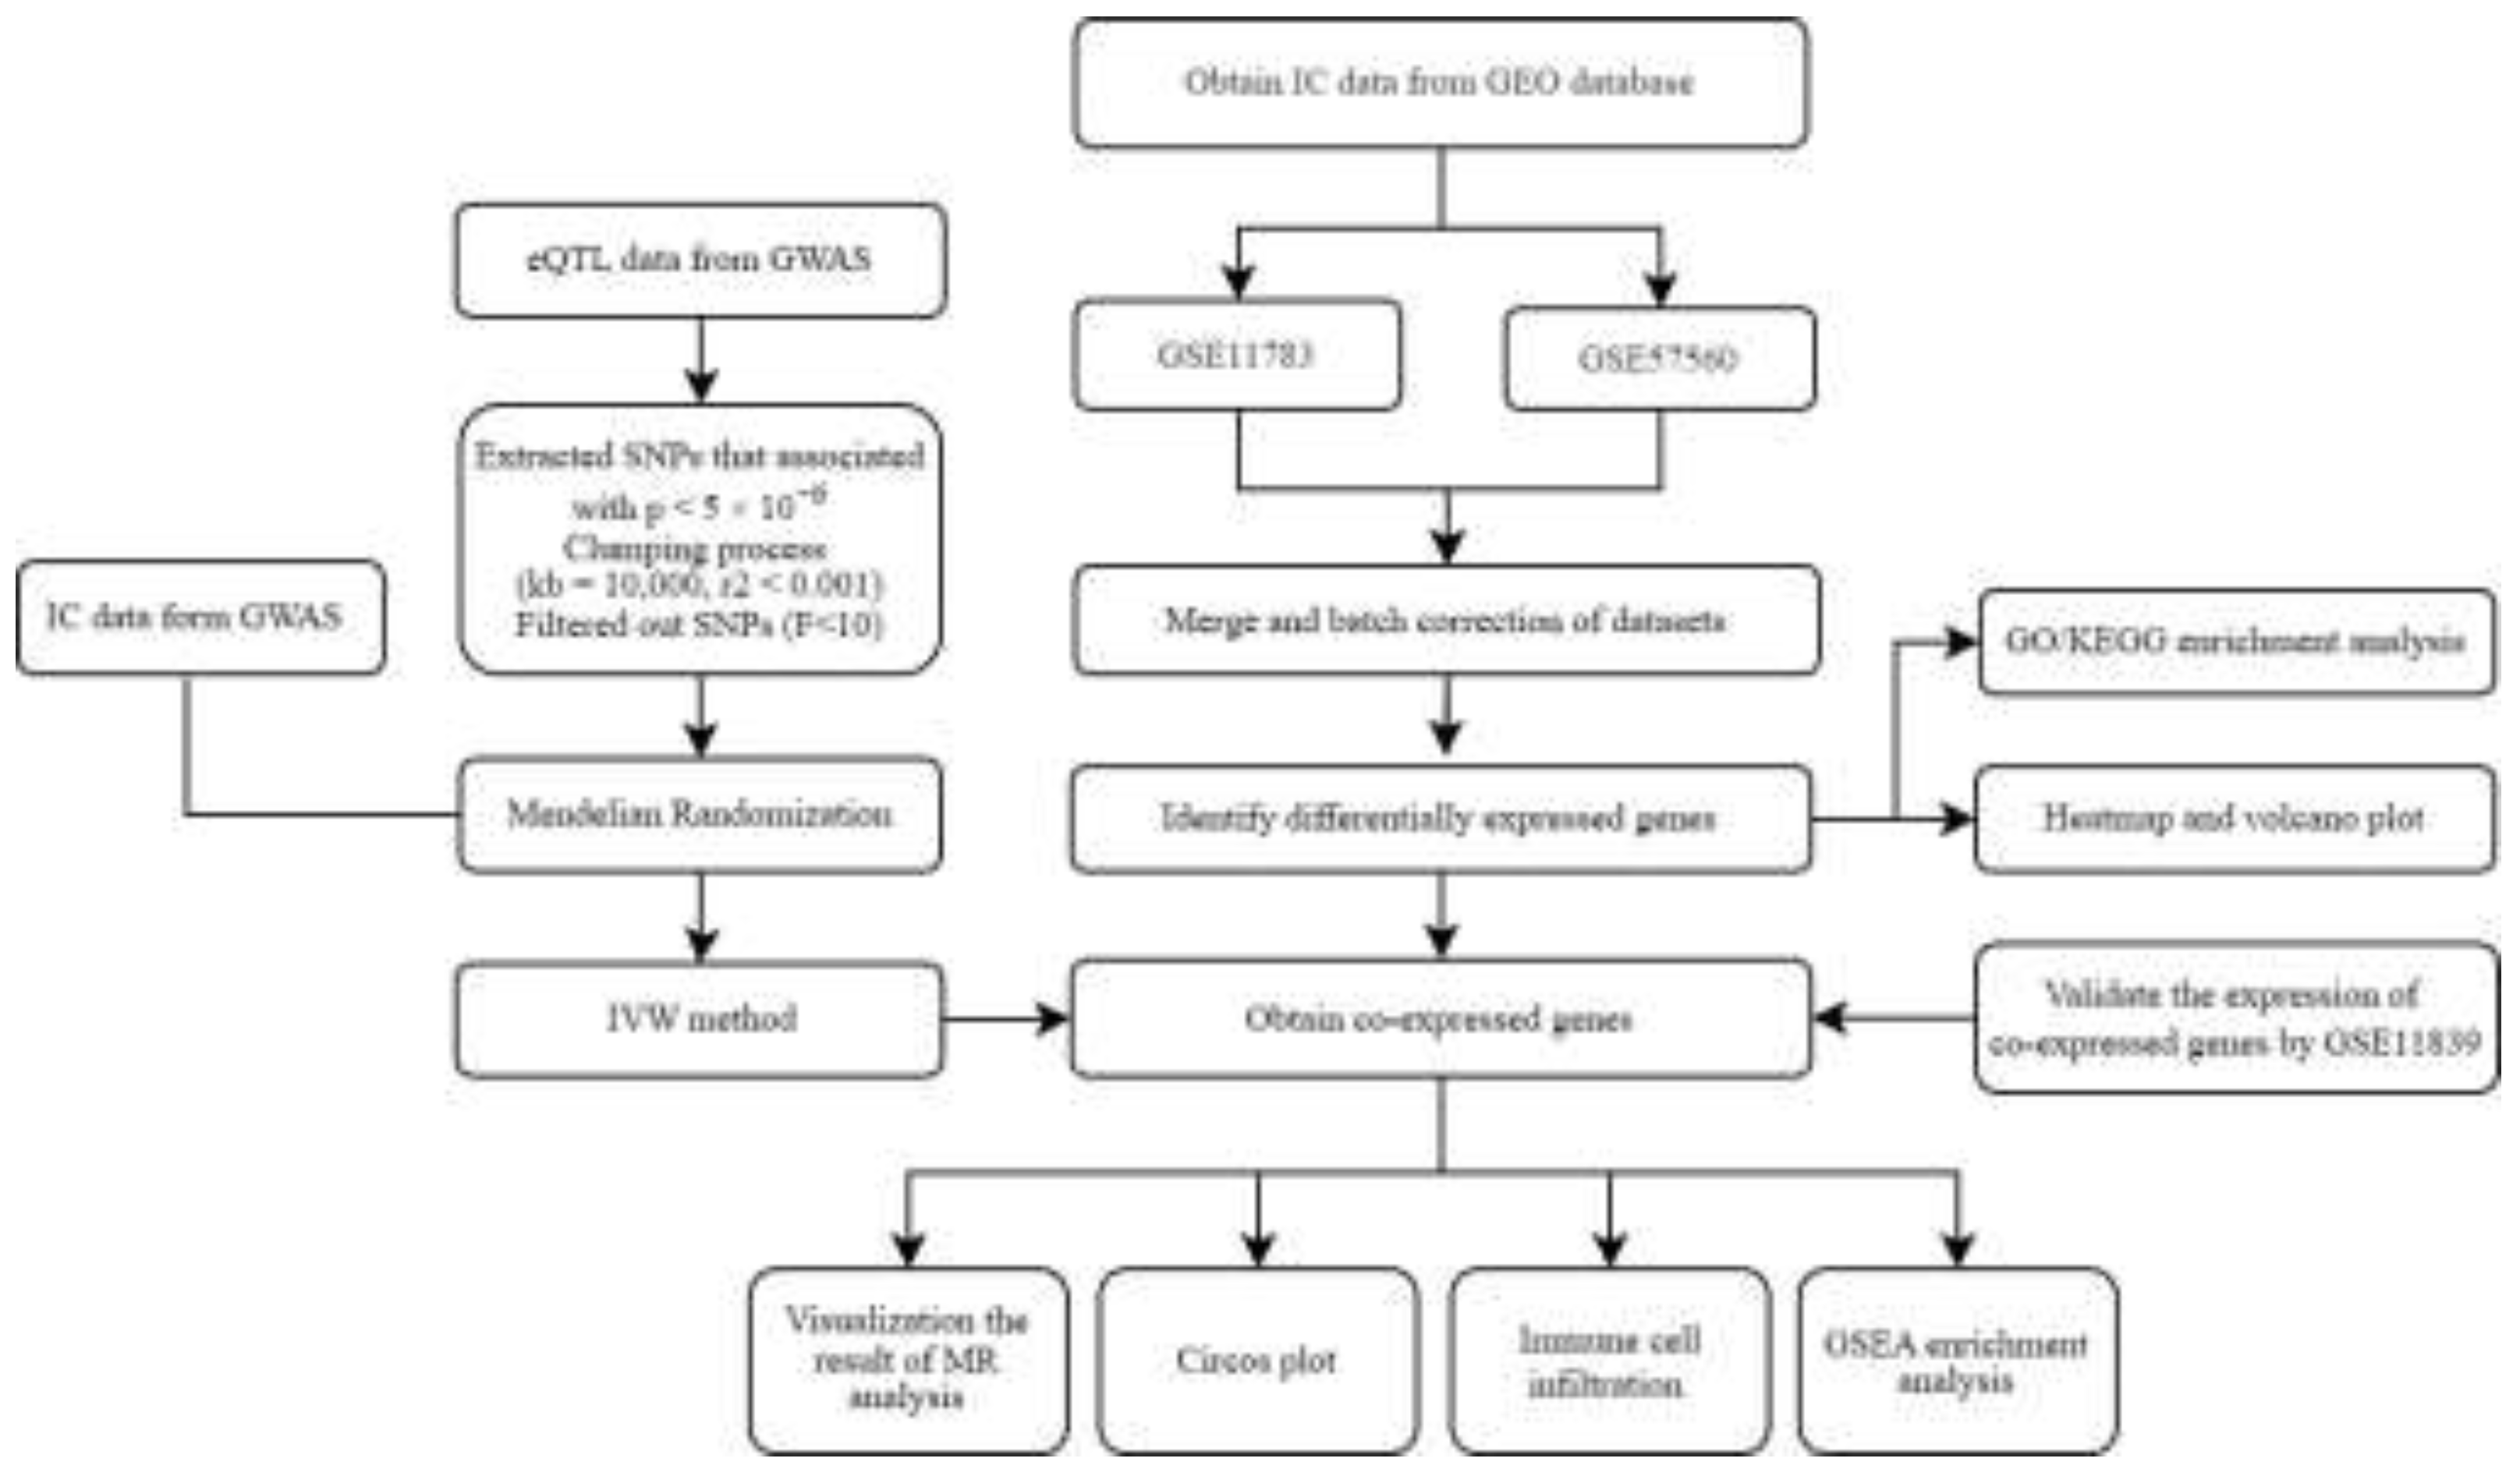
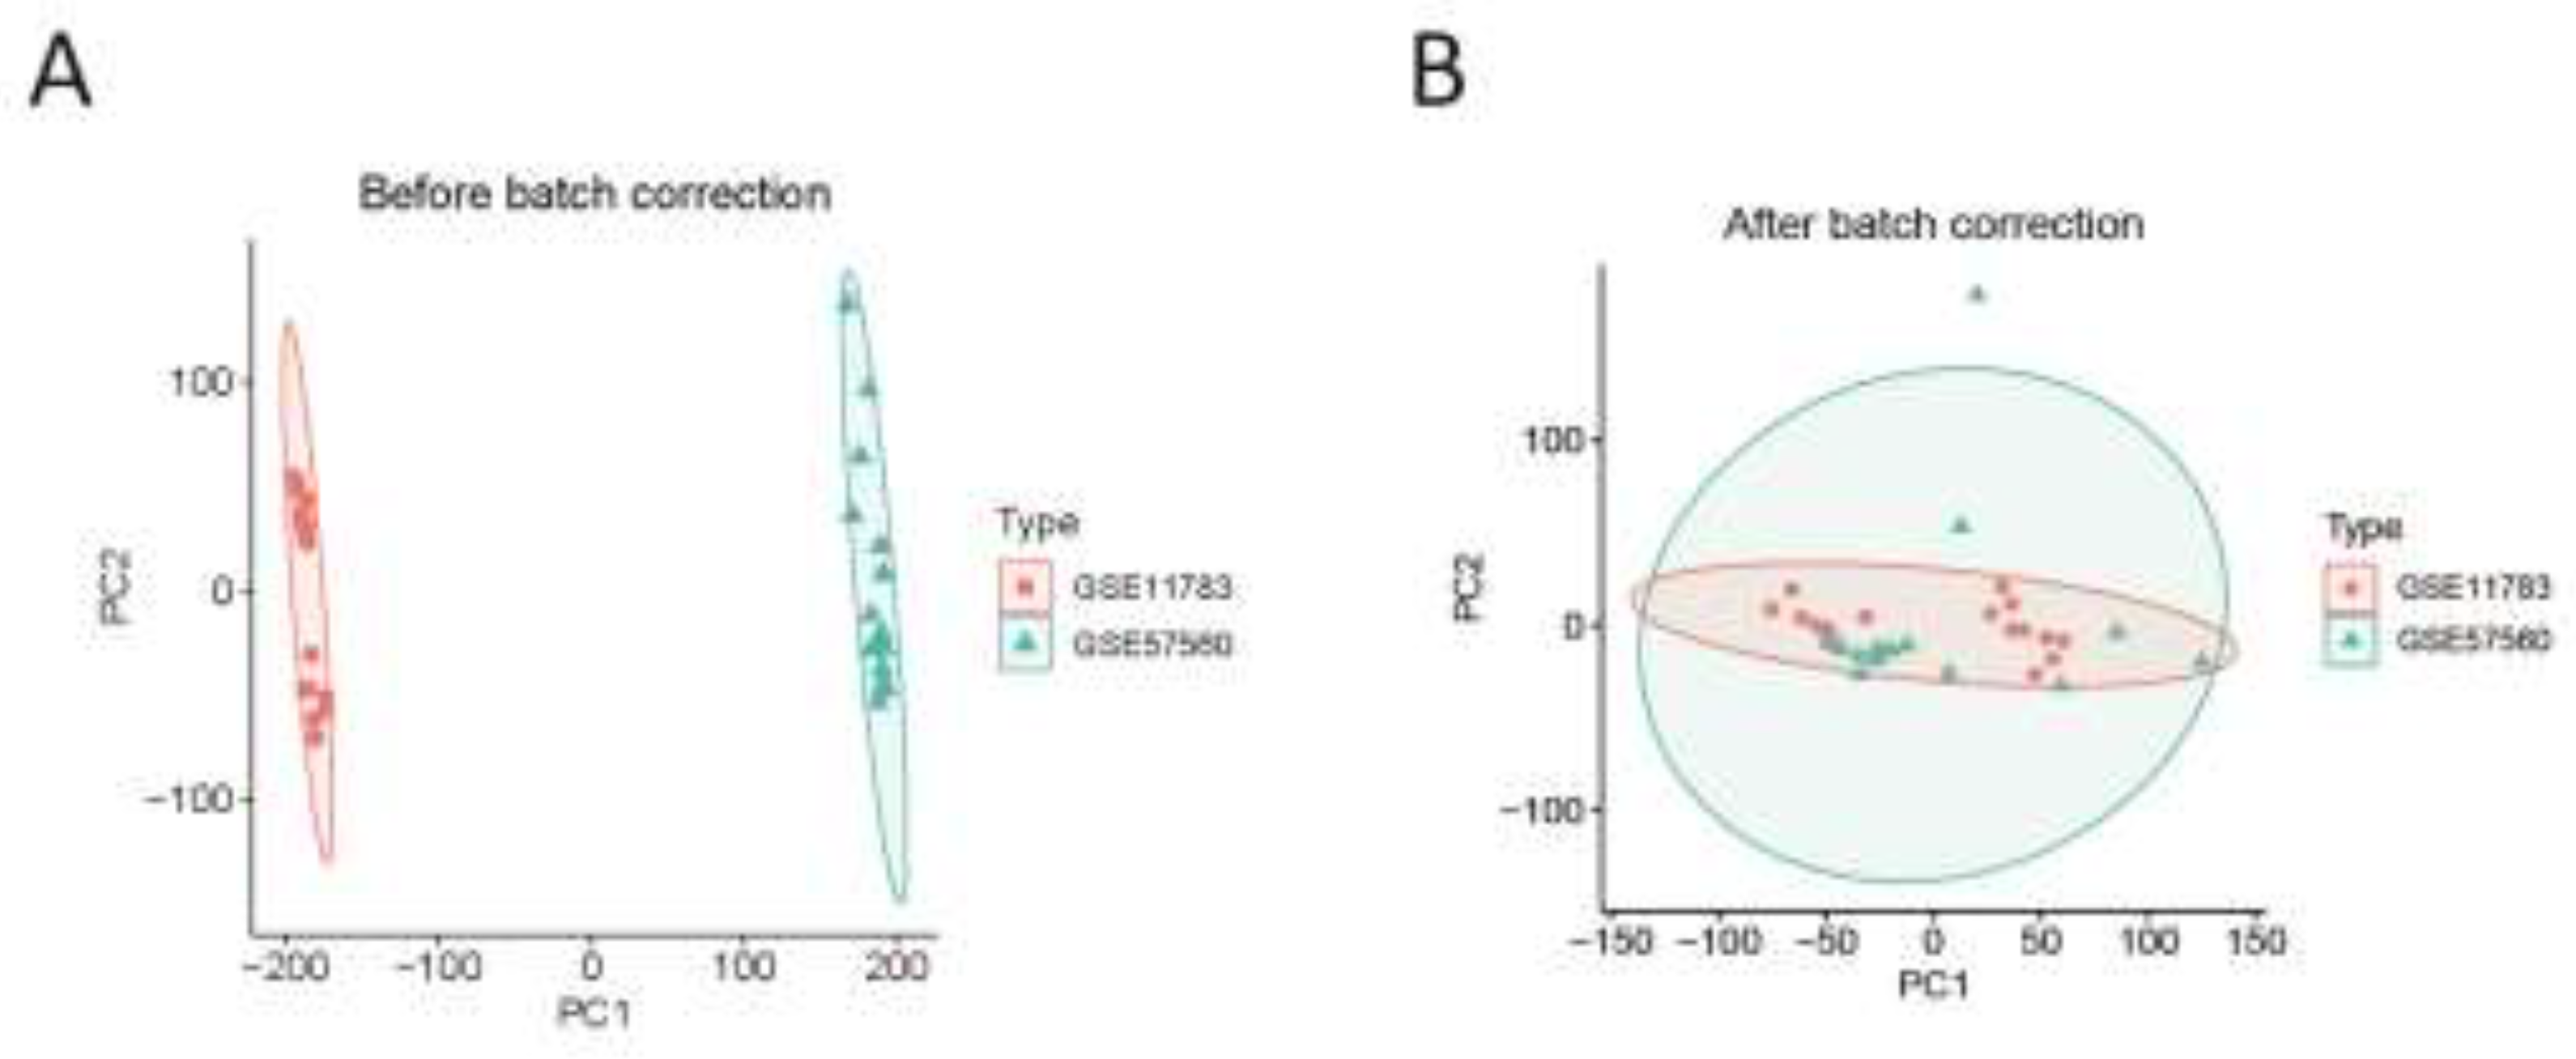
The flowchart of the study is presented in Figure 1. In this study, we utilized two IC datasets acquired from the GEO database, designating them as experimental groups. Expression values for each gene were calibrated and merged within the datasets, and batch effects were mitigated using principal component analysis (PCA). As displayed in Figure 2A, batch effects were initially noticeable in both IC gene datasets. Upon correction, PCA analysis confirmed that the samples achieved acceptable homogeneity, as illustrated in Figure 2B.
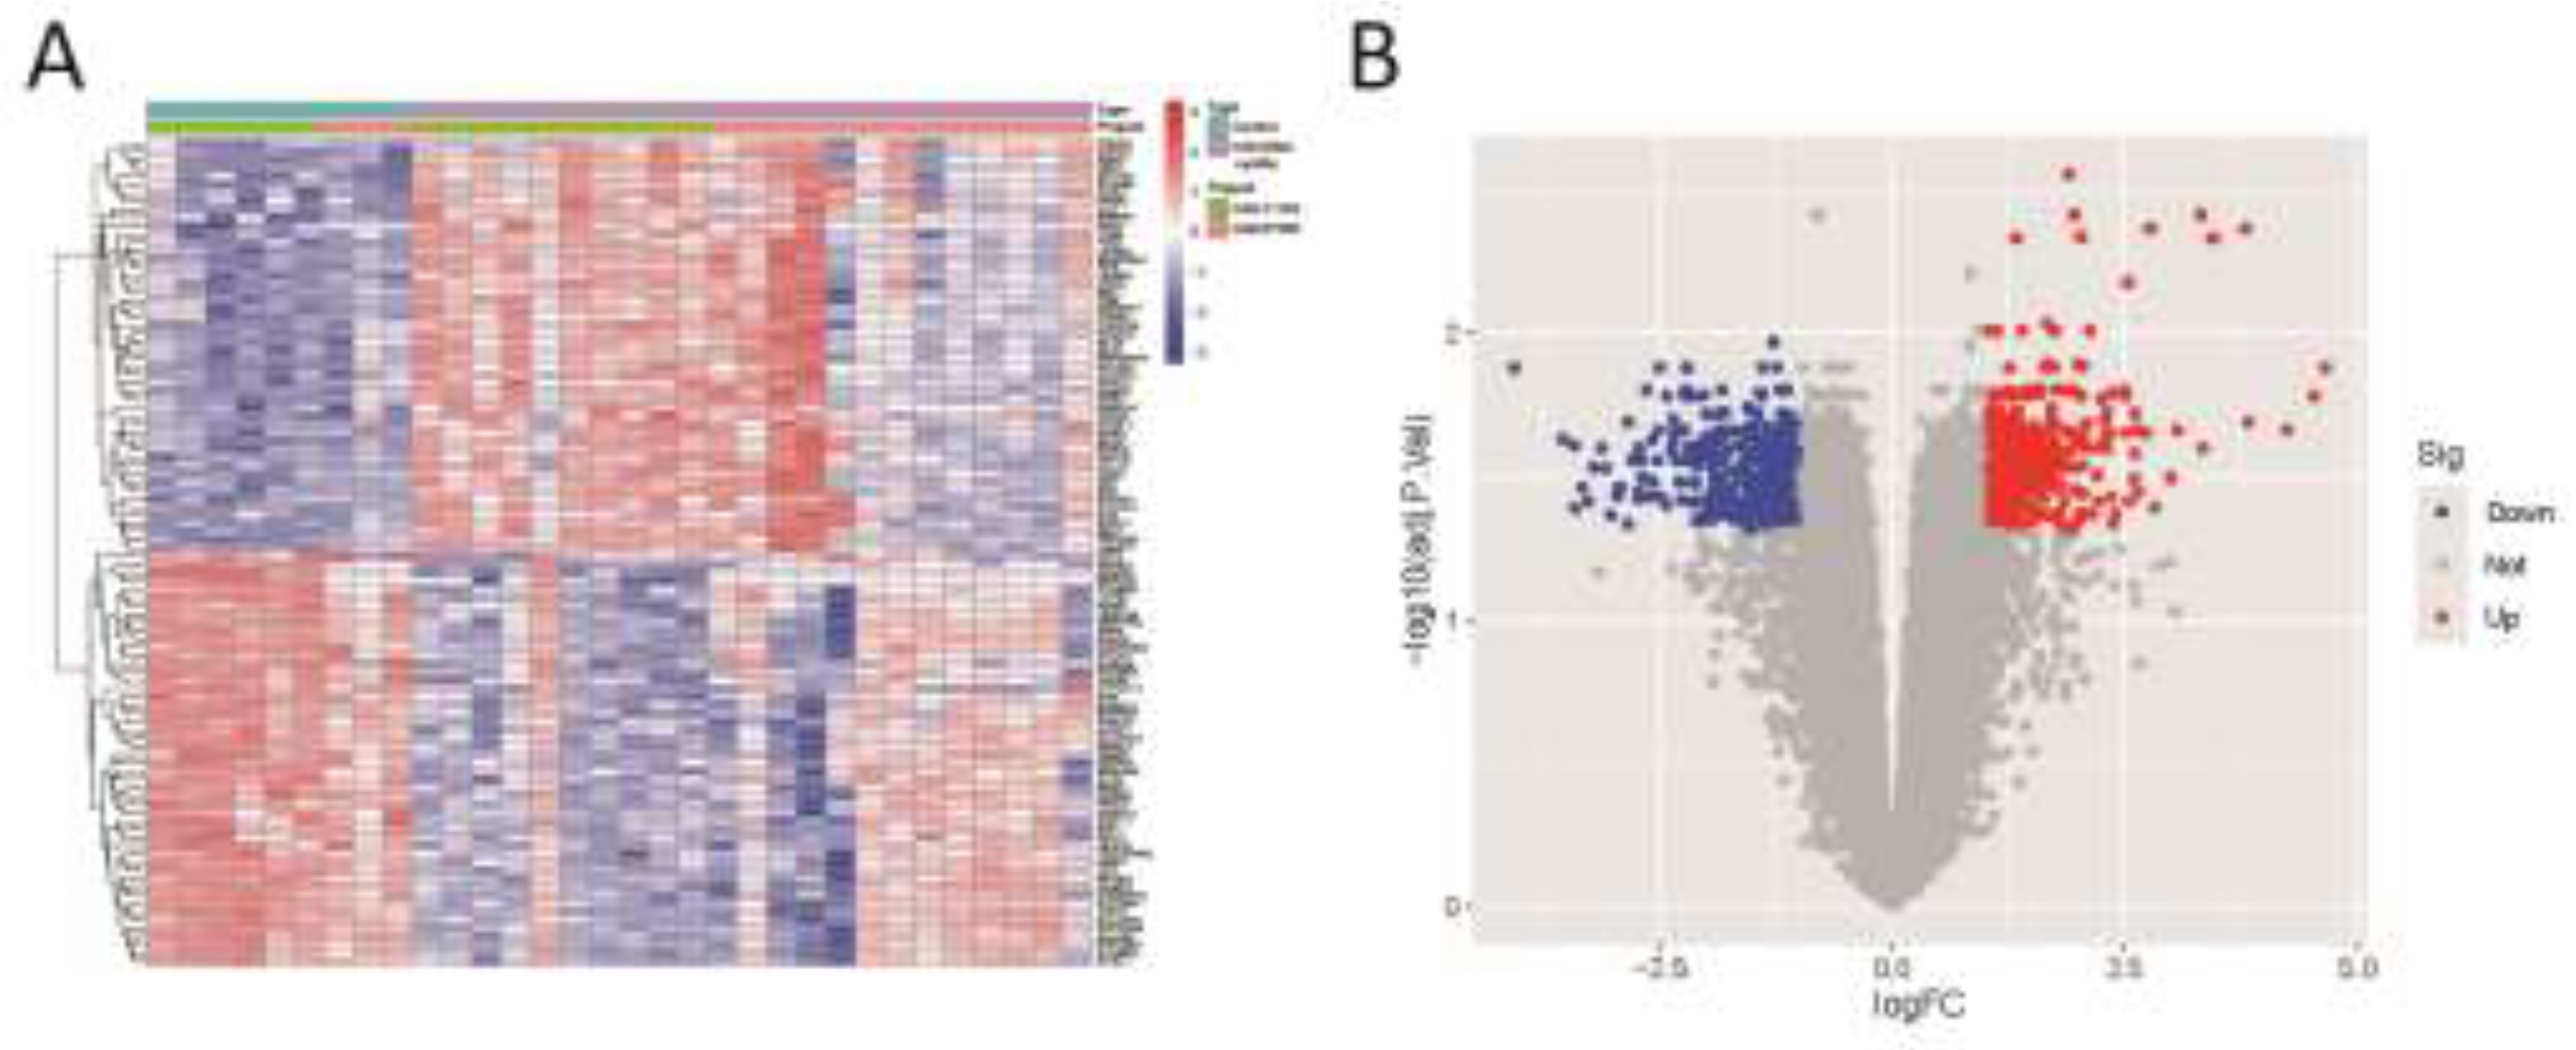
Differentially expressed genes (DEGs) were identified under specific criteria. A total of 447 DEGs were up-regulated, and 326 were down-regulated. Supplementary Table S1 provides comprehensive details on these significantly DEGs. The heatmap of DEGs expression in Figure 3A displays the top 50 up-regulated DEGs and the top 50 down-regulated DEGs. A volcano plot of the integrated GEO dataset is presented in Figure 3B.
We conducted further analyses on the potential functions of these DEGs using Gene Ontology (GO) and Kyoto Encyclopedia of Genes and Genomes (KEGG) pathways analyses. GO enrichment analysis suggested that the DEGs were mainly associated with biological processes involving immune response-activating signaling pathway and the external side of the plasma membrane (Supplementary Figure S1). Meanwhile, KEGG pathway analysis indicated that the DEGs were primarily involved in cytokine-cytokine receptor interactions (Supplementary Figure S1).

3.2. Mendelian Randomization Analysis

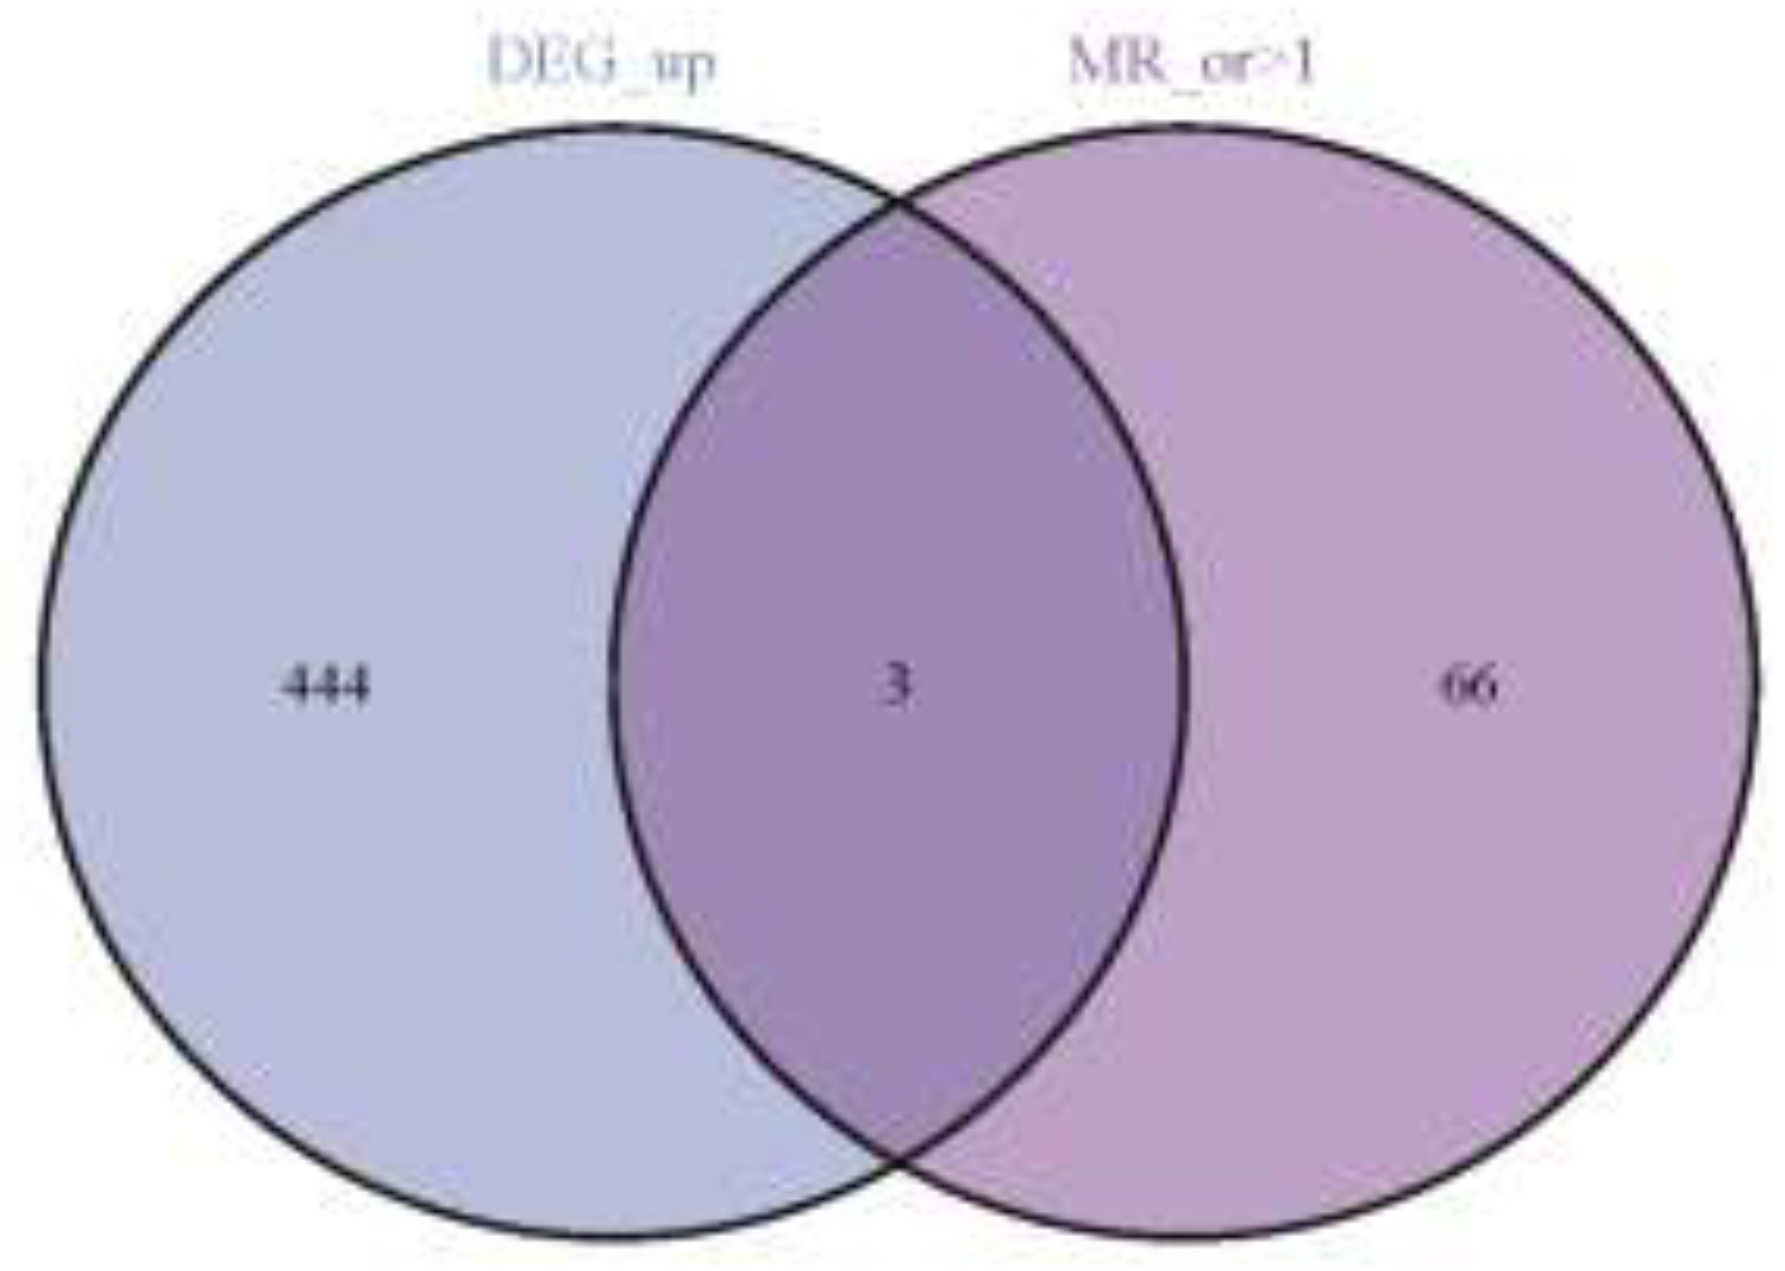
Following our screening process, we identified 26,152 SNPs to serve as instrumental variables, each meeting the three core assumptions of MR. Additionally, every selected SNP showed an F-statistic above 10 (Supplementary Table S2). Based on the MR analysis outcomes and three established filtering criteria, we identified 151 genes linked to IC (69 genes, odds ratio > 1 and 82 genes, odds ratio > 1; Supplementary Table S3). Furthermore, through crossover analysis, we identified three co-expressed genes: CD38, FPR1, and SLA (Figure 4).
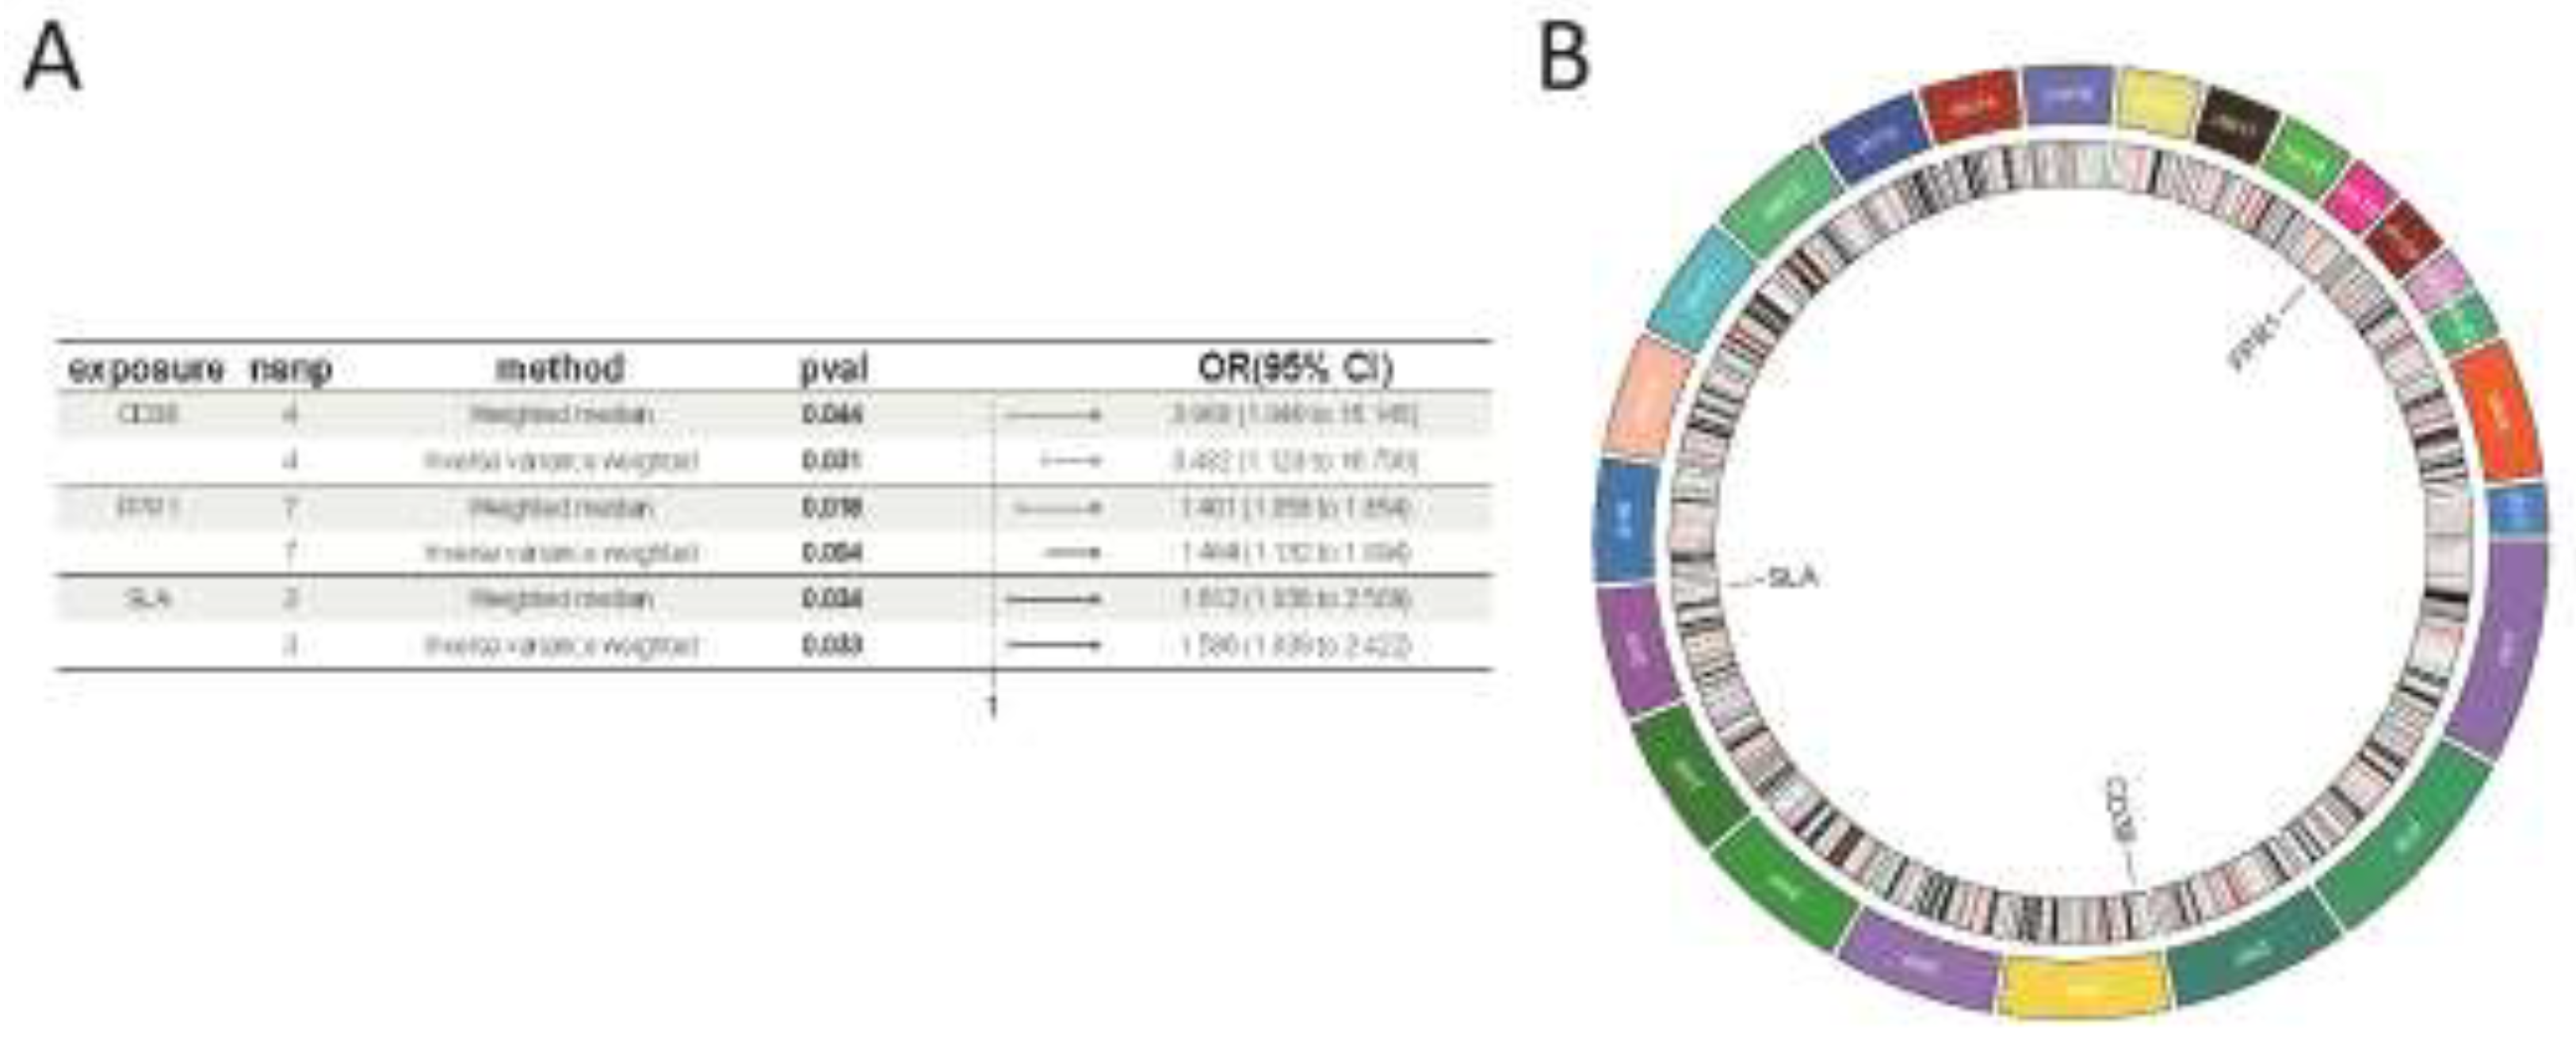
We then performed an in-depth analysis of the three co-expressed genes to assess each gene’s causal impact on IC. The findings revealed that all three up-regulated co-expressed genes demonstrated a significant positive causal effect with IC, as determined by the IVW method. Specifically, CD38 (OR = 3.482, 95% CI: [1.123 to 10.790], P = 0.031), FPR1 (OR = 1.464, 95% CI: [1.132 to 1.894], P = 0.004), and SLA (OR = 1.586, 95% CI: [1.039 to 2.422], P = 0.033) demonstrated this relationship (Figure 5A). Tests for heterogeneity among the co-expressed genes and for pleiotropy produced P-values greater than 0.05, indicating a lack of statistical significance and suggesting that the effects of heterogeneity and pleiotropy did not need to be considered (Supplementary Table S4). The leave-one-out sensitivity analysis confirmed that the effect sizes of the IVs aligned with the overall effect sizes, affirming the robustness of our analysis. Comprehensive information for each gene, including scatterplot, forest plot, funnel plot, and leave-one-out plot, is provided in Supplementary Figure S2. Additionally, to clarify the chromosomal positioning of these genes, we visualized the co-expressed genes (Figure 5B).

3.3. Immune Cell Infiltration

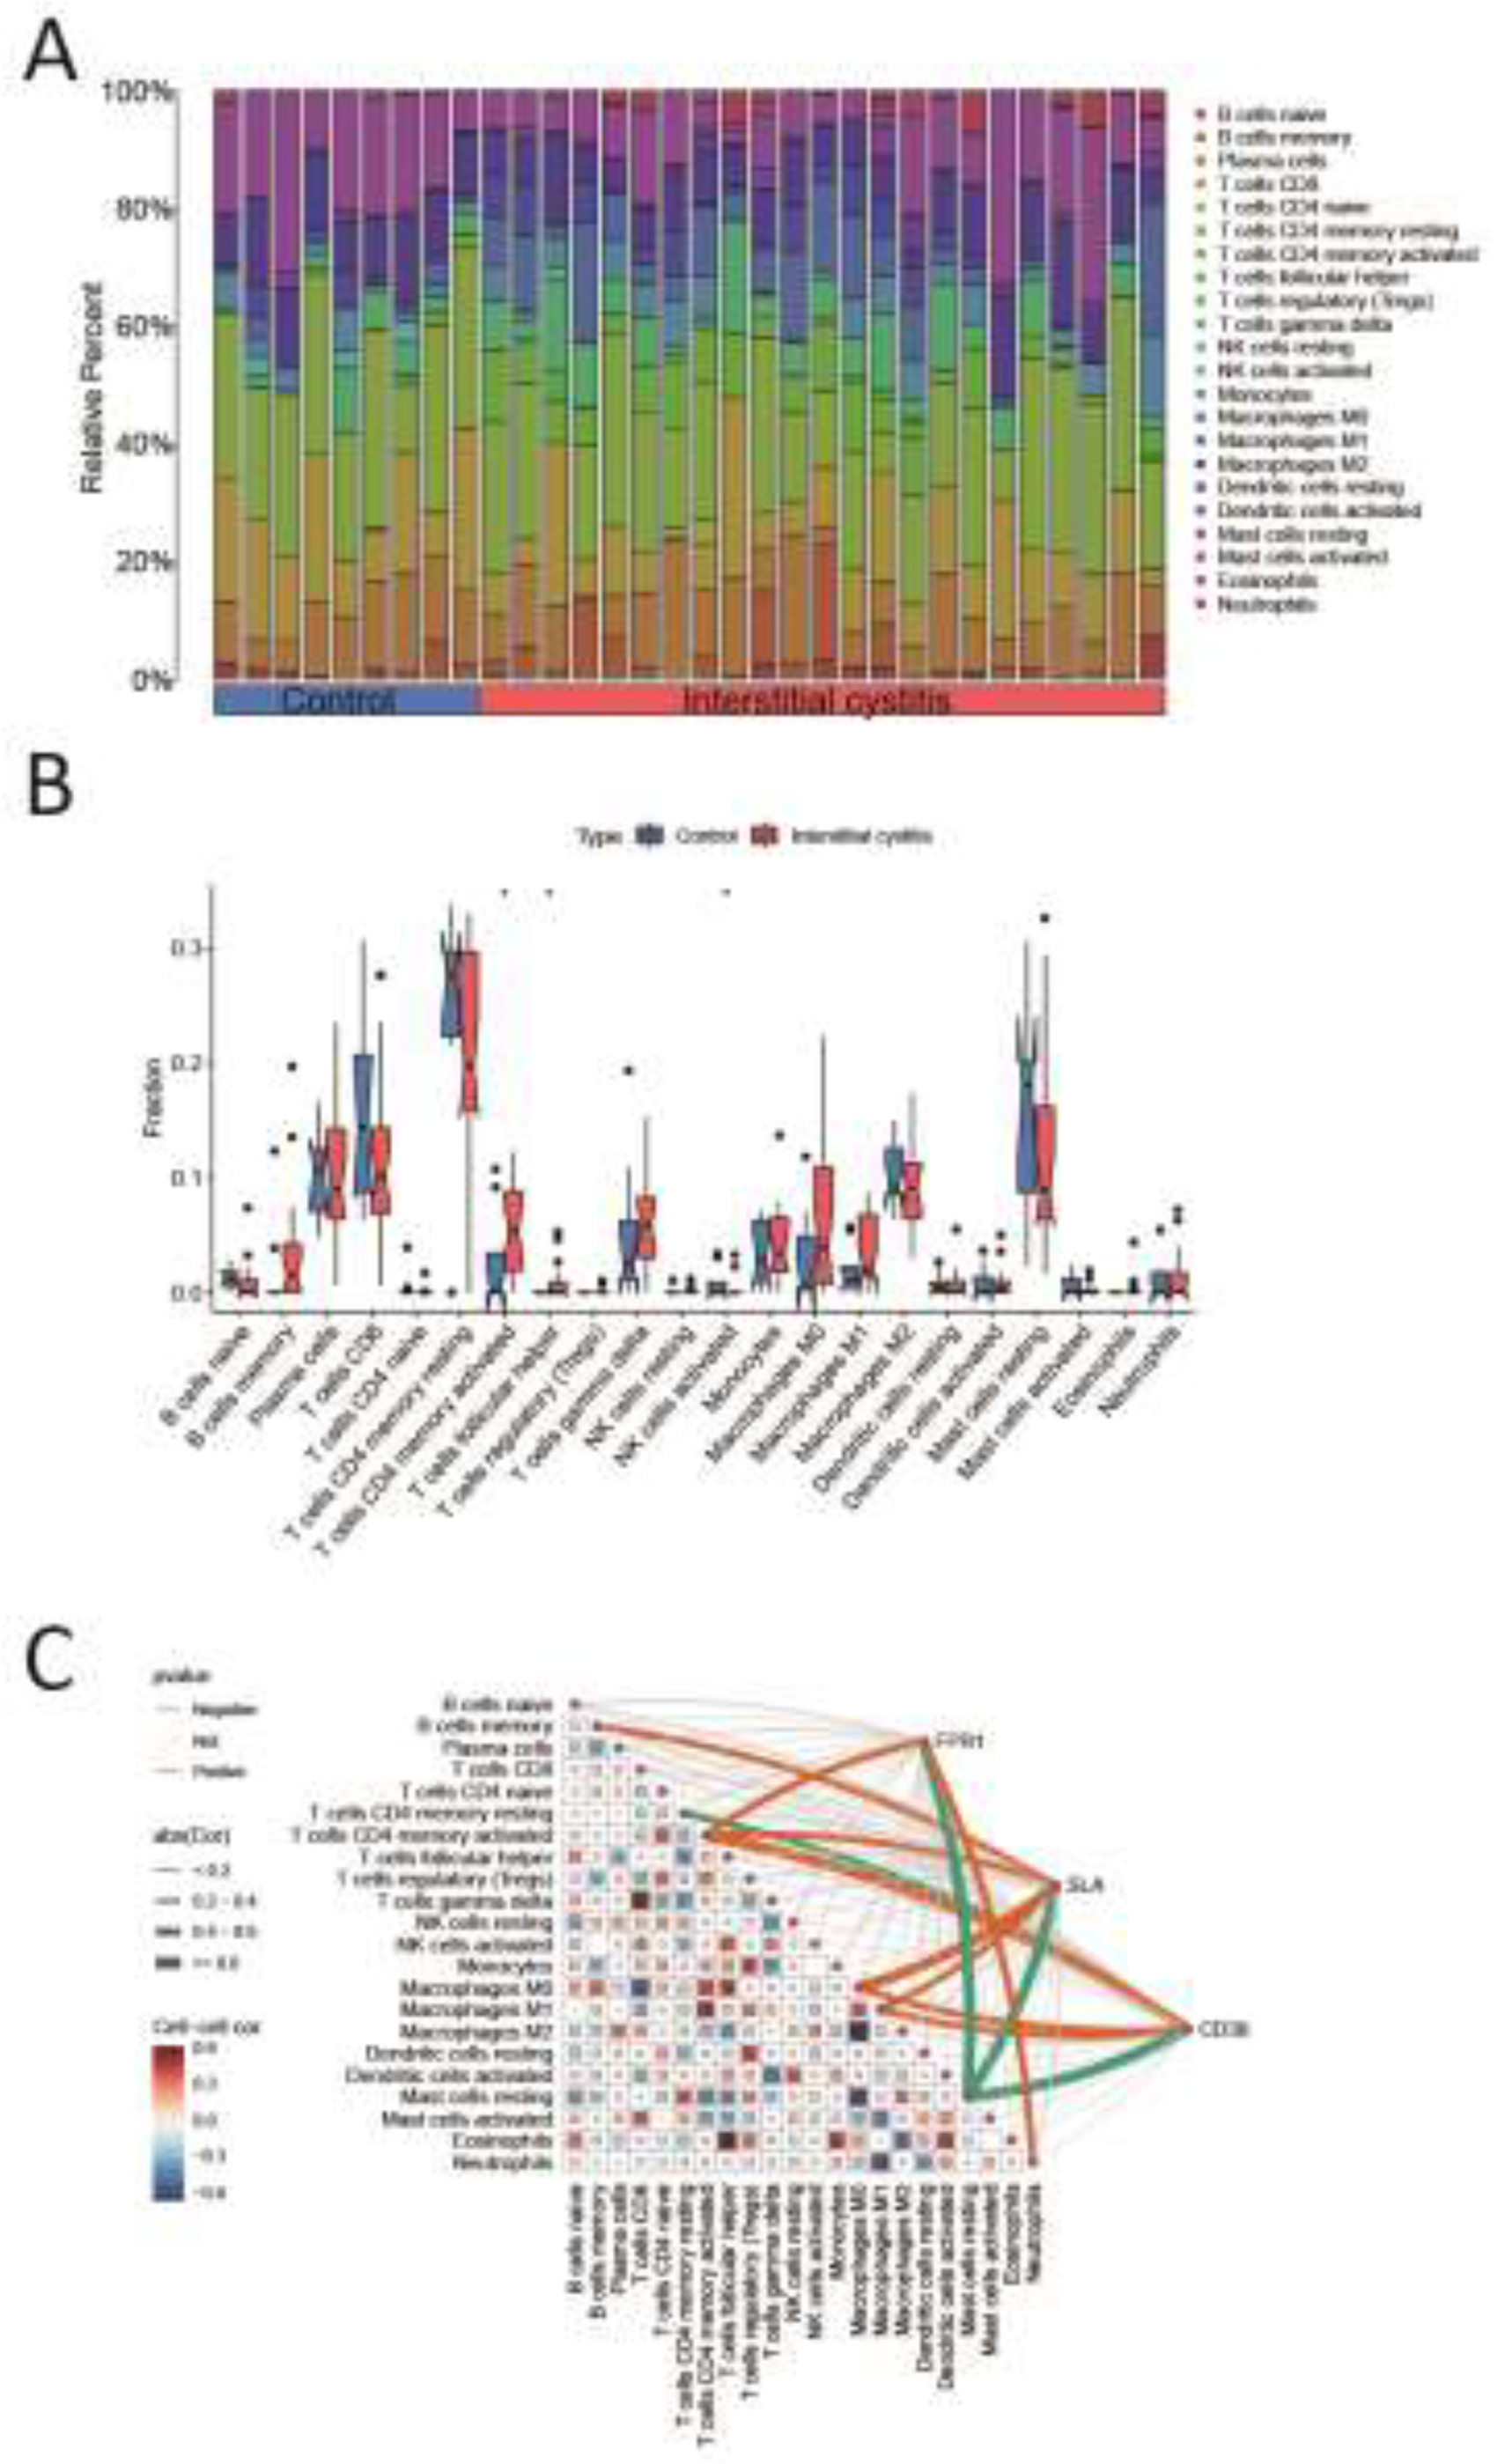
IC is recognized as an inflammatory disease. We applied the CIBERSORT algorithm to deduce immune cell characteristics and examine the relationship between co-expressed genes and immune cell infiltration in IC. Figure 6A displays the distribution of 22 immune cell types across each sample. The proportions of activated CD4 memory T cells and T follicular helper cells were notably higher in the IC patient group compared to the normal control group, while resting mast cells were elevated in the normal control group compared to the IC patient group (Figure 6B). Additionally, correlation analysis indicated that FPR1 was positively associated with activated CD4 memory T cells and neutrophils, while showing a negative association with resting mast cells (Figure 6C). SLA was positively correlated with memory B cells, activated CD4 memory T cells, M0 macrophages, and M1 macrophages, but negatively correlated with resting mast cells (Figure 6C). Similarly, CD38 demonstrated positive correlations with activated CD4 memory T cells, M0 macrophages, and M1 macrophages, while exhibiting negative correlations with resting mast cells and resting CD4 memory T cells (Figure 6C). To further explore the immune functions of these three co-expressed genes, we performed immune function analyses, which revealed that the immune activity of most cell types was elevated in the high-expressed group (Supplementary Figure S3).

3.4. GSEA Enrichment Analysis

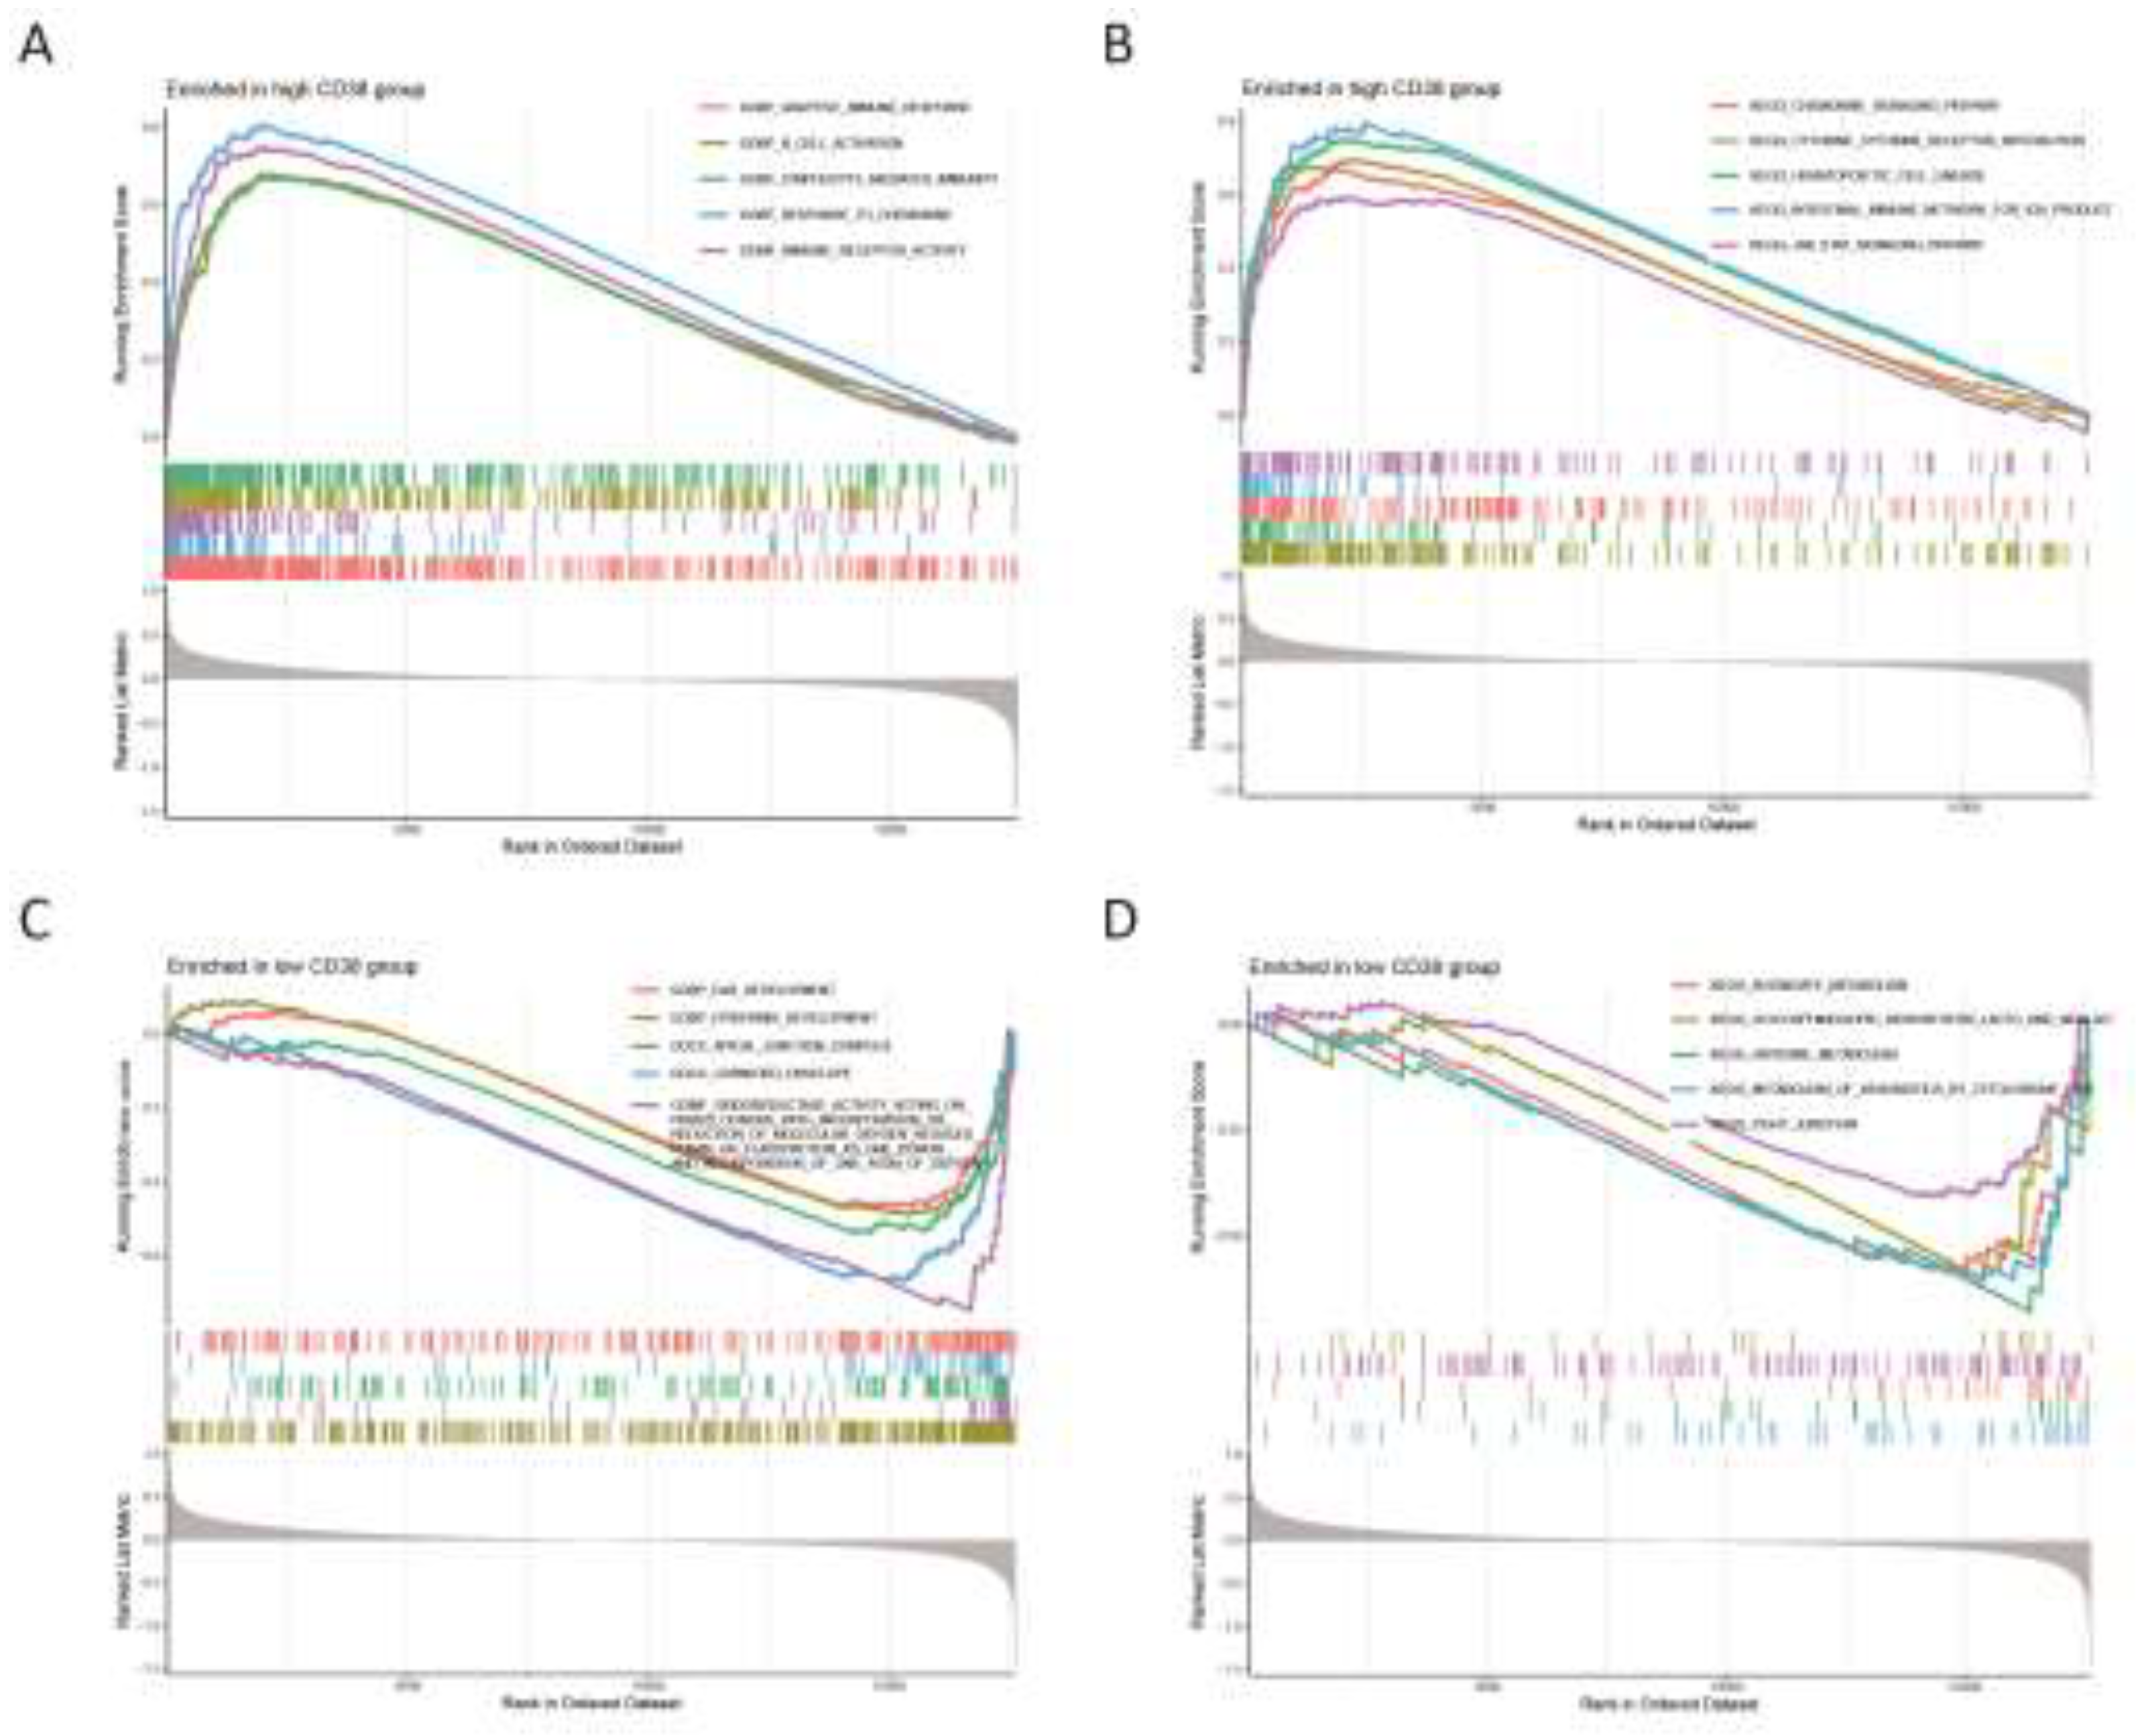
We investigated the activity levels of relevant functions and pathways in CD38 expression group using GSEA enrichment analysis. The results show that the top five active biological functions in the CD38 high expression group were adaptive immune response, B-cell activation, lymphocyte-mediated immunity, response to cytokine, and immune receptor activity (Figure 7A), while the top five active biological functions in the CD38 low expression group included ear development, epidermal development, apical junction complex, cornified envelope, and oxidoreductase activity (Figure 7C). The leading pathways in the CD38 high expression group were the chemokine signaling pathway, cytokine-cytokine receptor interaction, hematopoietic cell lineage, intestinal immune network for immunoglobulin production, and JAK stat signaling pathway (Figure 7B). The top five active pathways in the low expression group were butanoate metabolism, glycosphingolipid biosynthesis lacto and neolacto series, histidine metabolism, xenobiotic metabolism by cytochrome P450 and tight junction (Figure 7D).
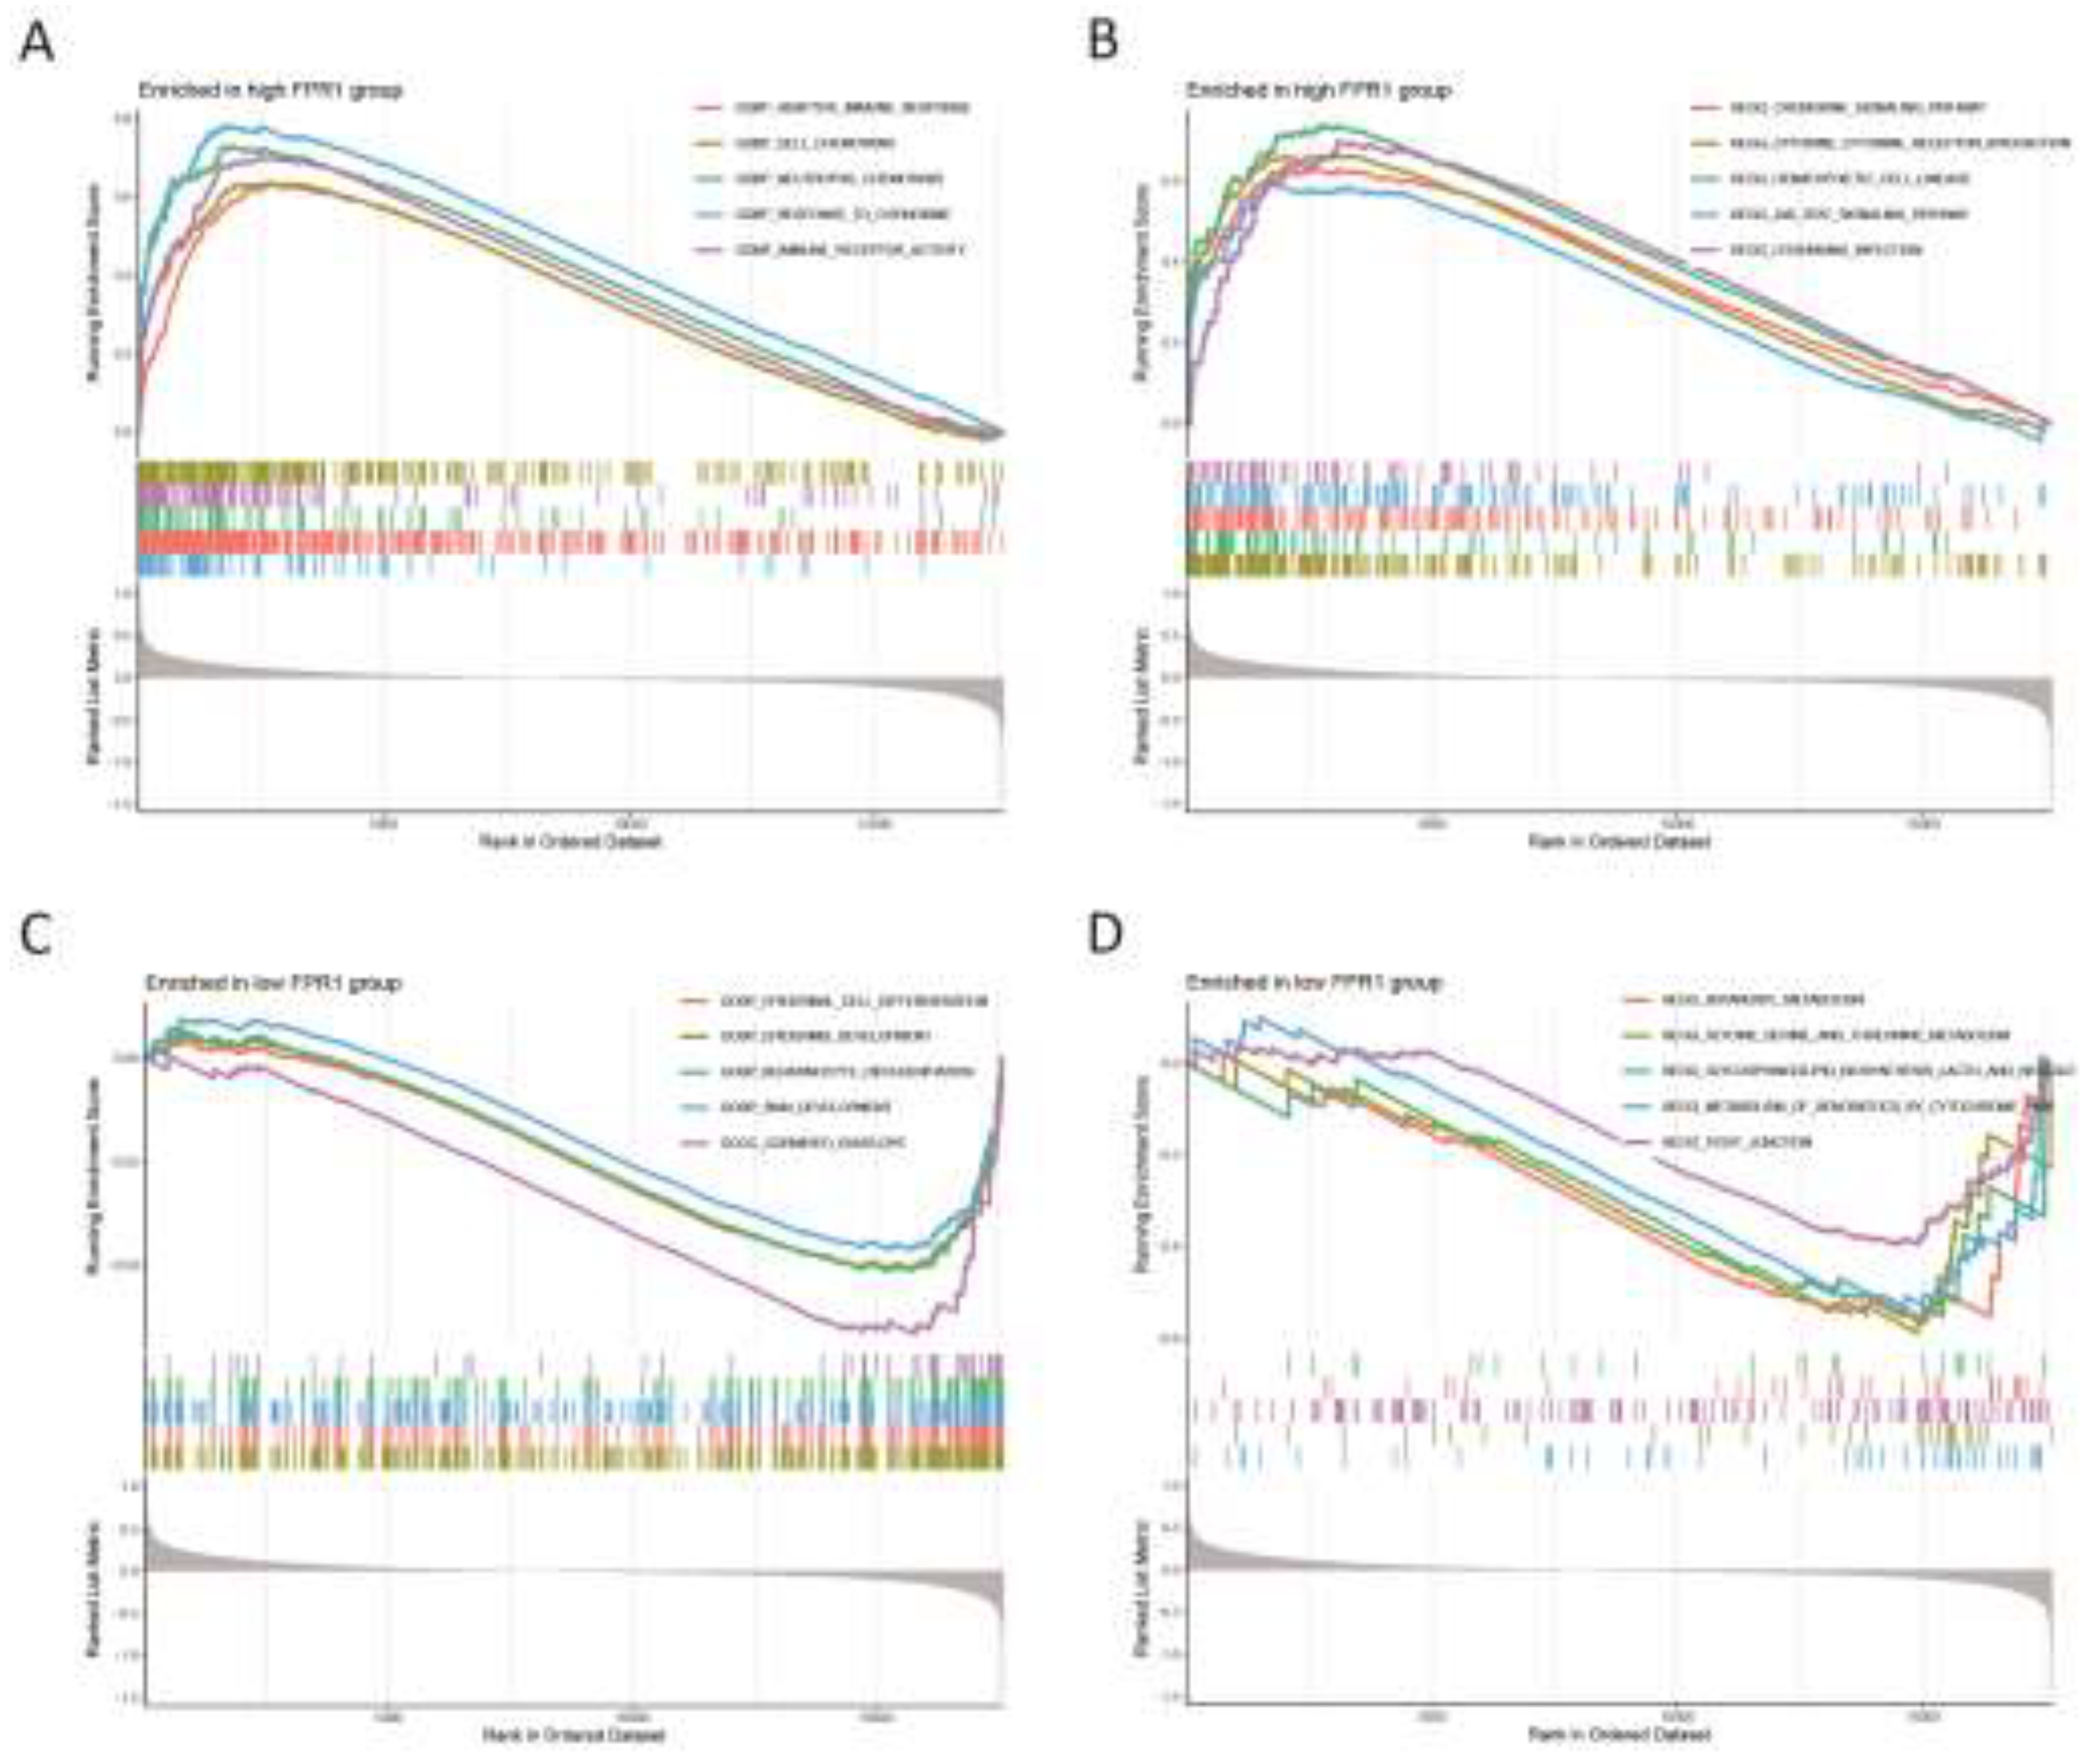
We further examined the activity levels of relevant biological functions and pathways in the FPR1 expression groups through GSEA enrichment analysis. The results indicated that the five most active biological functions in the high FPR1 expression group were adaptive immune response, cell chemotaxis, neutrolphil chemotaxis, response to chemokine and immune receptor activity (Figure 8A), while in the low FPR1 expression group, the predominant biological functions included epidermal cell differentiation, epidermis development, keratinocyte differentiation, skin development and cornified envelope (Figure 8C). The top five active pathways in the high FPR1 expression group included the chemokine signaling pathway, cytokine-cytokine receptor interaction, hematopoietic cell lineage, JAK stat signaling pathway and leishmania infection (Figure 8B). In contrast, the low expression group was most active in pathways related to butanoate metabolism, glycine serine and threonine metabolism, glycosphingolipid biosynthesis lacto and neolacto series, xenobiotic metabolism by cytochrome P450 and tight junction (Figure 8D).
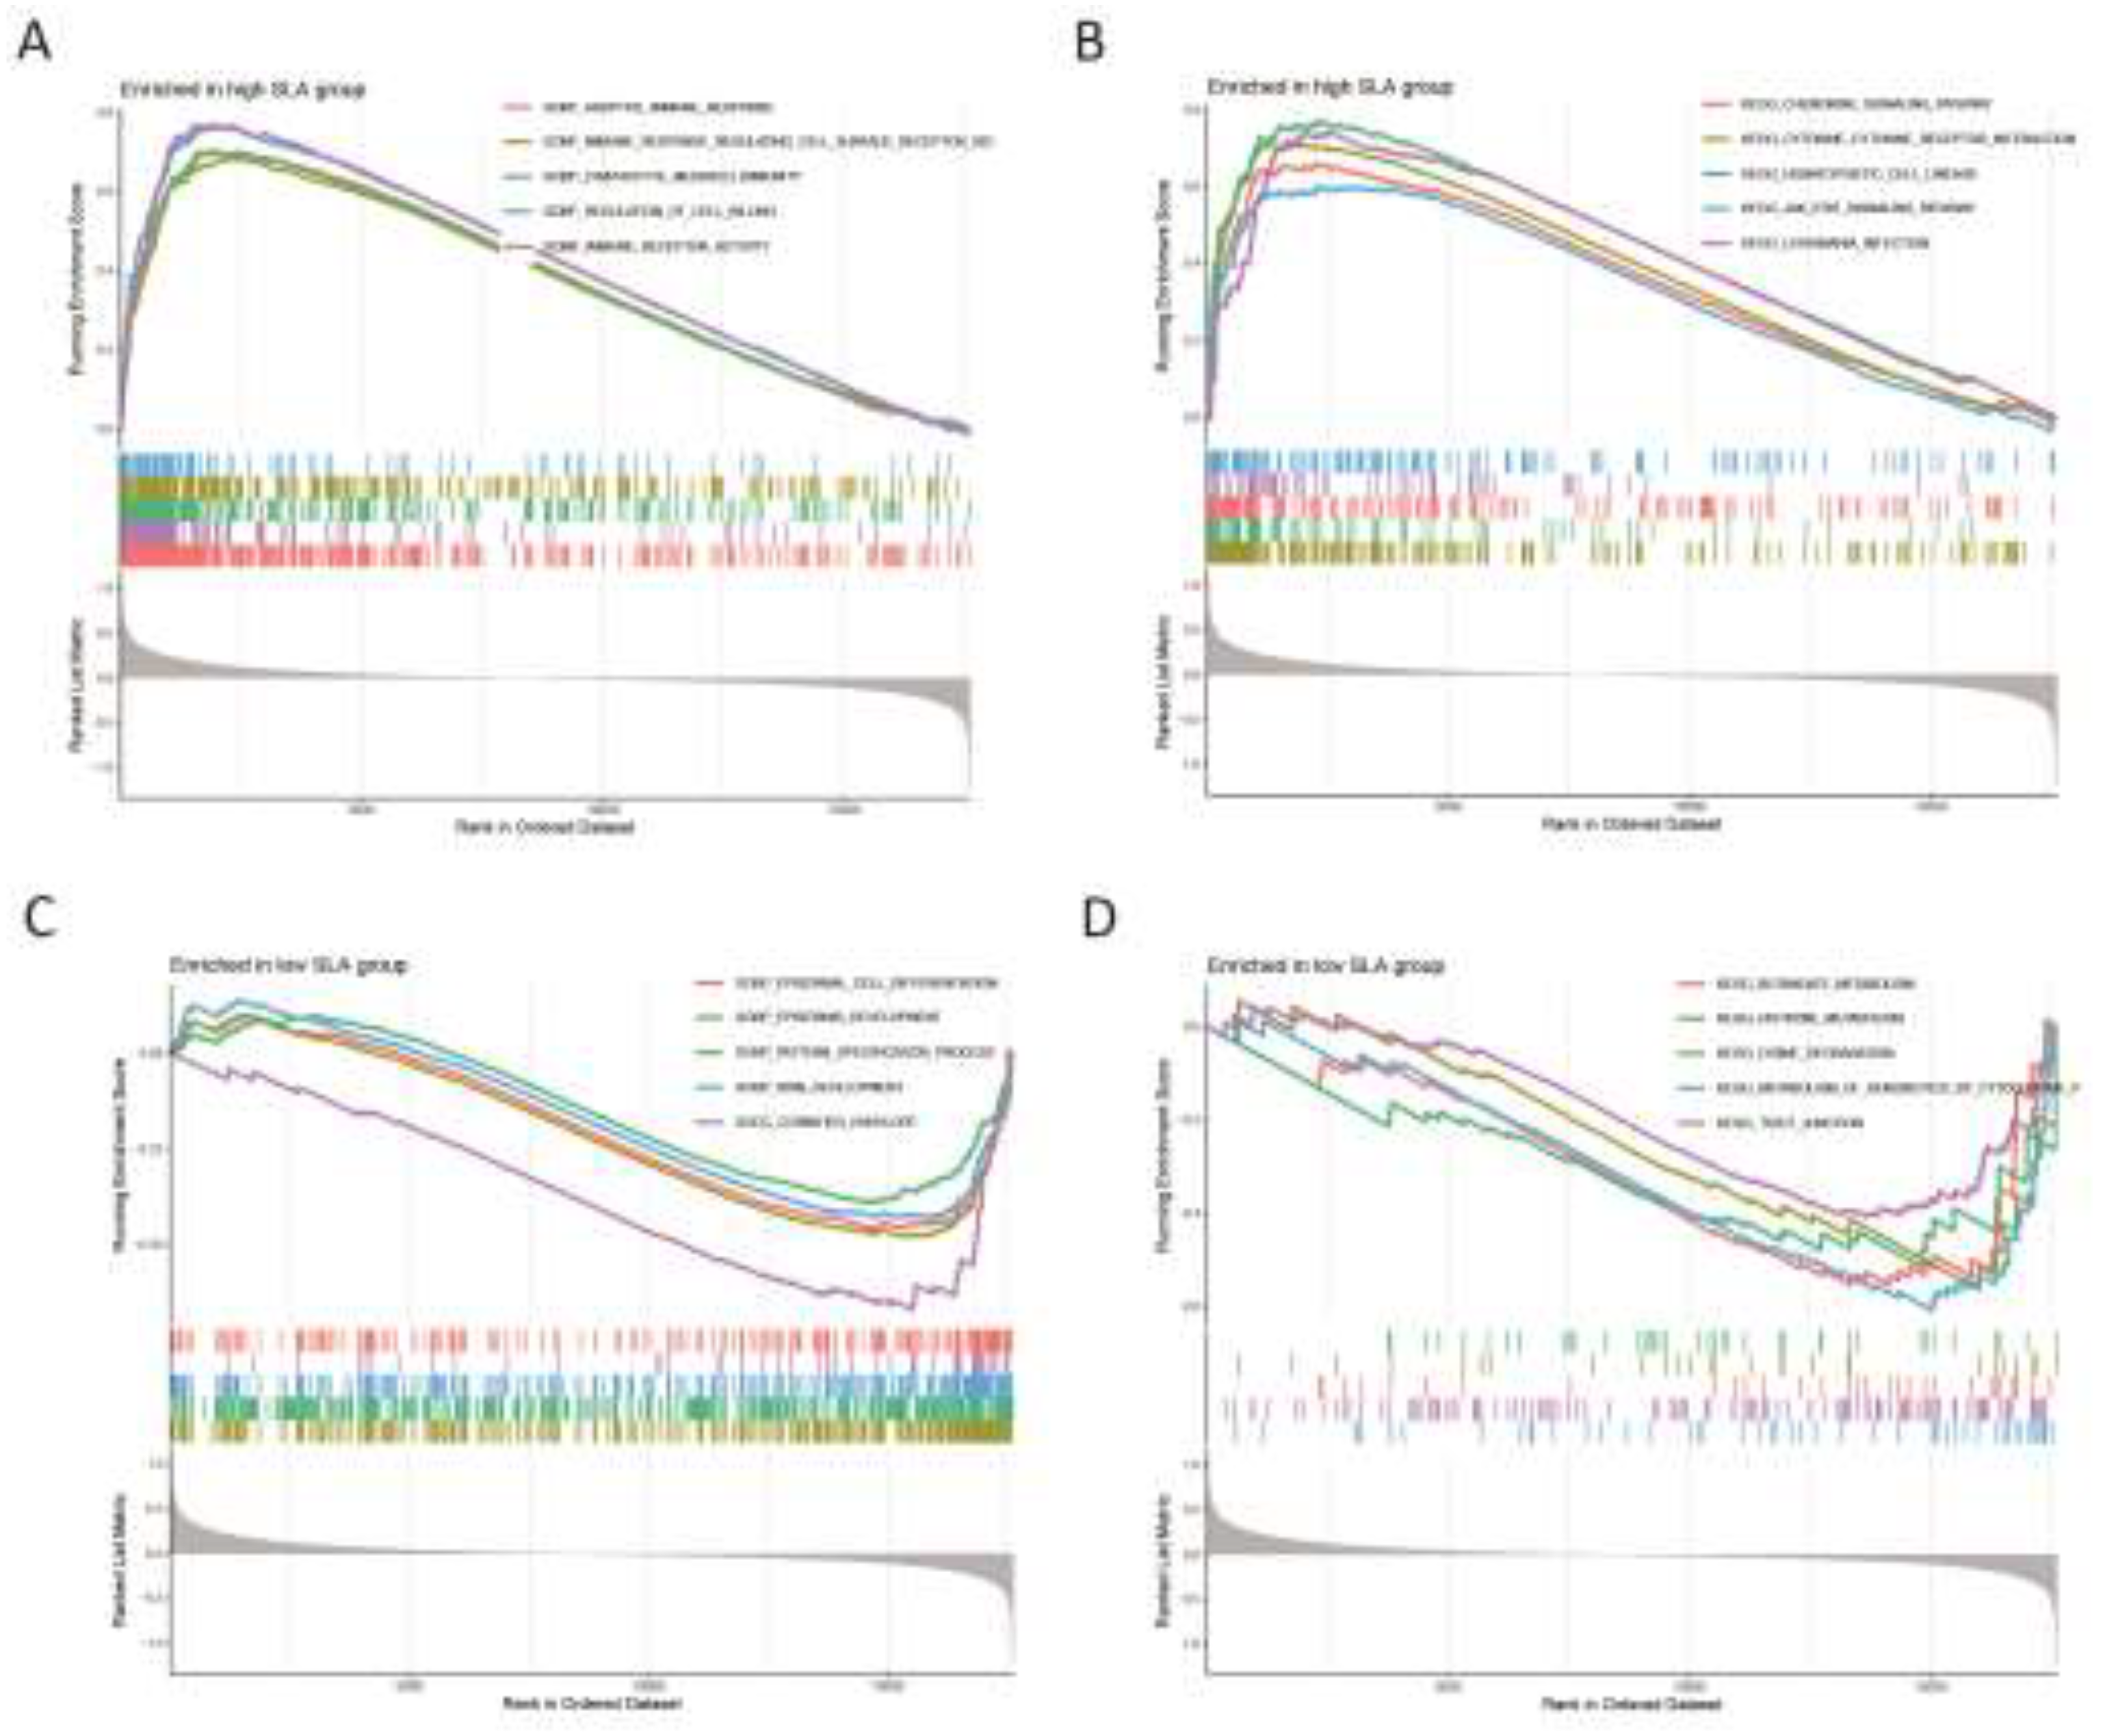
We conducted an analysis of the activity levels of relevant biological functions and pathways in the SLA expression groups via GSEA enrichment analysis. The results identified the top five active biological functions in the high SLA expression group as adaptive immune response, immune response regulating cell surface receptor signaling pathway, lymphocyte mediated immunity, regulation of cell killing and immune receptor activity (Figure 9A). The main biological functions in the low SLA expression group were associated with epidermal cell differentiation, epidermis development, pattern specification process, skin development and cornified envelope (Figure 9C). The predominant pathways active in the high SLA expression group included chemokine signaling pathway, cytokine-cytokine receptor interaction, hematopoietic cell lineage, JAK stat signaling pathway and leishmania infection (Figure 9B). On the other hand, the low expression group was mainly active in pathways related to butanoate metabolism, histidine metabolism, lysine degradation, xenobiotic metabolism by cytochrome P450 and tight junction (Figure 9D).

3.5. Validation the expression of co-expressed genes

To validate our findings, we evaluated the expression levels of co-expressed genes in the validation group (Figure 10). The results indicated that CD38, FPR1, and SLA were expressed at a significantly higher levels in the IC samples compared to healthy controls (P < 0.05). This consistency in the expression levels of the three co-expressed genes reinforces our confidence in our previous analysis.

4. Discussion

IC is a complex condition marked by lower urinary tract symptoms, pelvic pain, and considerable psychological distress, all of which contribute to a reduced quality of life. Despite existing diagnostic and therapeutic efforts, outcomes remain suboptimal, emphasizing the need for innovative approaches. This study aimed to deepen understanding of IC’s underlying mechanisms by analyzing datasets from the GEO database, employing MR analysis, and examining immune cell infiltration. Two IC microarray datasets were extracted from GEO for in-depth analysis, allowing the identification of critical DEGs that are likely central to IC’s pathophysiology. GO and KEGG enrichment analyses showed that these DEGs are primarily involved in immune response-activating signaling pathways and cytokine-cytokine receptor interactions, pointing to potential targets for future therapeutic development.
In this study, 447 up-regulated and 326 down-regulated DEGs were intersected with IC-associated genes identified by MR analysis, leading to the identification of three co-expressed target genes (CD38, FPR1, and SLA). The expression patterns of these genes provide new insights into the genetic basis of IC and may reflect key molecular changes in pathogenesis. Additionally, MR analysis indicated that CD38, FPR1, and SLA exhibited risk effects against IC.
CD38: CD38 serves as a multifunctional transmembrane glycoprotein present across various immune cells, such as T cells, B cells, lymphocytes, macrophages, monocytes, and others. CD38 is regarded as a key marker protein for T cell activation, capable of working in tandem with co-stimulatory molecules to drive complete T cell activation [14]. Upon T cell activation, cellular proliferation is enhanced through the regulation of intracellular proteins or metabolism, accompanied by the secretion of significant quantities of inflammatory cytokines, including IFN-γ and TNF-α. The CD38-NAD (+) axis is instrumental in modulating the chromatin remodeling and reattachment in T cell responses [15]. Additionally, CD38-catalyzed metabolites, like cADPR, can indirectly elevate Ca2+ concentrations in T cells by inhibiting the sarcoplasmic endoplasmic reticulum Ca2+ ATPase, whereas Ca2+, as essential second messengers, are involved in numerous signaling pathways during T cell activation, thereby further modulating the activation process [16]. Furthermore, studies have investigated CD38’s role in macrophages, revealing that suppressing CD38 activity in primary inflammatory macrophages disrupts the full production of inflammatory cytokines IL-12 and IL-1β, as well as glycolytic activity. These findings highlight significant role of CD38 in mediating immune responses and inflammation.
CD38 has been observed to be upregulated in specific diseases, indicating its potential to serve as a diagnostic biomarker or therapy target. In systemic lupus erythematosus (SLE), a chronic inflammatory disease, CD38 expression is notably higher in nonclassical monocytes from patients with active SLE compared to those with inactive disease or healthy individuals [17]. The presence and elevated proportion of CD38+ CD8 T cells serve as a biomarker to monitor the progression of HIV infection toward AIDS [18]. Gil et al. showed that inhibiting CD38 prevented the decrease in intracellular NAD+/NADH levels and reduced the catabolic activity of chondrocytes under IL-1β stimulation, suggesting that targeting CD38 inhibition may represent a promising therapeutic strategy for treating osteoarthritis [19]. In our study, we observed upregulation of CD38 in IC patients, which is consistent with the findings of Saha et al [20].
FPR1: Formyl peptide receptors (FPRs), functioning as pattern recognition receptors (PRRs), are crucial in numerous pathological processes. These receptors, expressed by immune cells, transduce chemotactic signals through coupled receptors, thereby initiating processes such as cell adhesion, migration, tissue repair, angiogenesis, and reactive oxygen species production [21]. Research findings reveal that neutrophils can undergo FPR1-mediated cell recruitment in a mouse model of bacterial infection [22]. In a mouse skin wound healing model, FPR1 resulted in rapid neutrophil infiltration, indicating that FPR1 is crucial for the normal healing process of skin wounds [23]. FPR is also significant in inflammation-associated tumorigenesis. Numerous tumor cells express FPR to stimulate tumor cell proliferation, metastasis, and angiogenesis, possibly through interaction with endogenous ligands released into the microenvironment [24].
SLA: The SLA gene encodes the SLAP-1 protein, which is expressed in various immune cells, especially at elevated levels in T cells. SLAP-1 functions as an adaptor protein that attenuates T-cell receptor signaling, inhibits activation of the nuclear factor of activated T cells triggered by the T-cell antigen receptor, and contributes to both positive T-cell selection and inhibition of cell division [25]. Research has demonstrated that SLAP-deficient bone marrow-derived dendritic cells produce lower levels of TNF-α and IL12 in response to LPS stimulation, are unable to effectively stimulate T cells in a mixed lymphocyte response, and show reduced capacity to induce IFN-γ secretion by T cells. [26]. Therefore, a deficiency in SLAP-1 may weaken immune response, diminishing the production of essential cytokines like IL12, IFN-γ, and TNF-α, which are critical in driving the host’s immune defense [27].
Applying the CIBERSORT algorithm, we analyzed the distribution of immune cell subpopulations in IC to better understand the role of immune cells in disease pathogenesis. From these results, we examined the relationship between co-expressed genes and immune cell infiltration and explored how these genes uniquely influence immune cell activity. We found that these CD38, FPR1, and SLA were associated with activated CD4 memory T cells, which were elevated in IC, indicating that three co-expressed genes playing a key role in the pathogenesis of IC. Moreover, the biological processes and signaling pathways associated with these three genes we identified, including adaptive immune response, immune receptor activity chemokine signaling pathway, cytokine-cytokine receptor interaction, and JAK stat signaling pathway, suggesting that these three genes participating in the development of IC mainly through immunoregulation. In line with our finding, activated CD4 memory T cells (CD3+ CD4+ HLA-DR+ cells) were found an elevated expression in HIC [28]. Additionally, previous studies have shown that activated CD4 memory T cells play a key role in inflammatory cells in rheumatoid arthritis, and that the expression of activated CD4 memory T cells are also significantly increased in patients with polymyositis [29,30]. These research also consistent with our result.
In summary, this research applied bioinformatics approaches alongside MR to analysis genes connected with IC. We identified three genes with causal roles in the pathogenesis and progression of IC. Furthermore, GSEA indicated that these genes are significantly involved in pathways related to immune signaling. Out finding suggests that the identified genes may represent novel biomarkers and potential treatment targets for IC.

5. Conclusions

This study offers an in-depth analysis of IC, highlighting essential genes and pathways through advanced bioinformatics and statistical techniques. It underscores the role of immune cells and genetic factors, particularly focusing on the genes CD38, FPR1, and SLA. Additionally, three co-expressed genes were found to correlate with elevated levels of activated CD4 memory T cells in IC patients, suggesting a potential role in IC development via regulating activated CD4 memory T cells. These findings enhance our understanding of IC’s complex molecular mechanisms and suggest new possibilities for therapeutic interventions. However, further validation is needed, considering the limitations of data selection and analytical methods. Overall, this research holds promise for advancing the development of targeted biomarkers and therapeutic interventions, thereby enhancing the precision of diagnosis and expanding treatment strategies for IC.

6. Patents

Supplementary Materials

The following supporting information can be downloaded at the website of this paper posted on Preprints.org. The following supporting information can be downloaded at: (xxx).

Author Contributions

Conceptualization, Fuguang Zhao and Xing Ai; Formal analysis, Yawei Guan, Jingfei Teng and Zhihui Li; Methodology, Fuguang Zhao and Chong Ma; Visualization, Xiang Ji, Feng Gao, Xiao Luo and Yajie Zheng; Writing—original draft, Fuguang Zhao and Yibin Wang; Writing—review & editing, Fuguang Zhao, Xing Ai and Yibin Wang.

Funding

This research received no external funding.

Ethics approval

Ethics committee approval was not required for this study involving human subjects, in accordance with applicable local regulations and institutional requirements.

Informed Consent Statement

Written consent for participation was not necessary from participants or their legal representatives, as allowed by national legislation and institutional policies.

Data Availability Statement

The datasets employed in this study can be accessed via online repositories. Information on the repositories and accession numbers is listed below: the datasets GSE11783, GSE57560, and GSE11839 were obtained from the Gene Expression Omnibus (GEO) database (https://www.ncbi.nlm.nih.gov/geo/); the interstitial cystitis and summary eQTL data were obtained from the GWAS Catalog (https://www.ebi.ac.uk/gwas/)

Conflicts of Interest

The authors declare no conflicts of interest.

References

  1. Homma, Y.; et al. Clinical guidelines for interstitial cystitis/bladder pain syndrome. Int J Urol 2020, 27, 578–589. [Google Scholar] [CrossRef] [PubMed]
  2. Hanno, P.; et al. Summary of the 2023 report of the international consultation on incont inence interstitial cystitis/bladder pain syndrome (IC/BPS) committee. Continence 2023, 8, 101056. [Google Scholar] [CrossRef]
  3. Jhang, J.F.; Jiang, Y.H.; Kuo, H.C. Current Understanding of the Pathophysiology and Novel Treatments of Interstitial Cystitis/Bladder Pain Syndrome. Biomedicines 2022, 10, 2380. [Google Scholar] [CrossRef]
  4. Lin, C.C.; et al. New Frontiers or the Treatment of Interstitial Cystitis/Bladder Pain Syndrome - Focused on Stem Cells, Platelet-Rich Plasma, and Low-Energy Shock Wave. Int Neurourol J 2020, 24, 211–221. [Google Scholar] [CrossRef]
  5. Mohammad, A.; et al. Mechanisms of oxidative stress in interstitial cystitis/bladder pain s yndrome. Nature Reviews Urology 2024, 21, 433–449. [Google Scholar] [CrossRef]
  6. Duh, K.; et al. Crosstalk between the immune system and neural pathways in interstitial cystitis/bladder pain syndrome. Discov Med 2018, 25, 243–250. [Google Scholar]
  7. Patnaik, S.S.; et al. Etiology, pathophysiology and biomarkers of interstitial cystitis/painful bladder syndrome. Arch Gynecol Obstet 2017, 295, 1341–1359. [Google Scholar] [CrossRef] [PubMed]
  8. Hauser, P.J.; et al. Abnormal expression of differentiation related proteins and proteoglycan core proteins in the urothelium of patients with interstitial cystitis. J Urol 2008, 179, 764–769. [Google Scholar] [CrossRef]
  9. Yamada, T.; Murayama, T.; Andoh, M. Adjuvant hydrodistension under epidural anesthesia for interstitial cystitis. Int J Urol 2003, 10, 463–468. [Google Scholar] [CrossRef]
  10. Gamper, M.; et al. Local immune response in bladder pain syndrome/interstitial cystitis ESSIC type 3C. Int Urogynecol J 2013, 24, 2049–2057. [Google Scholar] [CrossRef]
  11. Martin Jensen, M.; et al. IL-33 mast cell axis is central in LL-37 induced bladder inflammation and pain in a murine interstitial cystitis model. Cytokine 2018, 110, 420–427. [Google Scholar] [CrossRef] [PubMed]
  12. Jiang, Y.H.; et al. Urine biomarkers in ESSIC type 2 interstitial cystitis/bladder pain syndrome and overactive bladder with developing a novel diagnostic algorithm. Sci Rep 2021, 11, 914. [Google Scholar] [CrossRef] [PubMed]
  13. Bicer, F.; et al. Chronic pelvic allodynia is mediated by CCL2 through mast cells in an experimental autoimmune cystitis model. Am J Physiol Renal Physiol 2015, 308, F103–F113. [Google Scholar] [CrossRef] [PubMed]
  14. Yang, W.; et al. Dynamic regulation of CD28 conformation and signaling by charged lipids and ions. Nature Structural & Molecular Biology 2017, 24, 1081–1092. [Google Scholar]
  15. Kar, A.; Mehrotra, S.; Chatterjee, S. CD38: T Cell Immuno-Metabolic Modulator. Cells, 2020, 9, 1716. [Google Scholar] [CrossRef]
  16. Yu, P.; et al. Direct Gating of the TRPM2 Channel by cADPR via Specific Interactions with the ADPR Binding Pocket. Cell Rep 2019, 27, 3684–3695.e4. [Google Scholar] [CrossRef]
  17. Piedra-Quintero, Z.L.; et al. CD38: An Immunomodulatory Molecule in Inflammation and Autoimmunity. Front Immunol 2020, 11, 597959. [Google Scholar] [CrossRef]
  18. Paul, M.E.; et al. Comparison of CD8(+) T-cell subsets in HIV-infected rapid progressor children versus non--rapid progressor children. J Allergy Clin Immunol 2001, 108, 258–264. [Google Scholar] [CrossRef]
  19. Gil Alabarse, P.; et al. Targeting CD38 to Suppress Osteoarthritis Development and Associated Pain After Joint Injury in Mice. Arthritis Rheumatol 2023, 75, 364–374. [Google Scholar] [CrossRef]
  20. Saha, S.K.; et al. Bioinformatics Approach for Identifying Novel Biomarkers and Their Signaling Pathways Involved in Interstitial Cystitis/Bladder Pain Syndrome with Hunner Lesion. J Clin Med 2020, 9, 1935. [Google Scholar] [CrossRef]
  21. Dorward, D.A.; et al. The role of formylated peptides and formyl peptide receptor 1 in governing neutrophil function during acute inflammation. Am J Pathol 2015, 185, 1172–1184. [Google Scholar] [CrossRef] [PubMed]
  22. Chen, K.; et al. Regulation of inflammation by members of the formyl-peptide receptor family. J Autoimmun 2017, 85, 64–77. [Google Scholar] [CrossRef] [PubMed]
  23. Liu, M.; et al. Formylpeptide receptors mediate rapid neutrophil mobilization to accelerate wound healing. PLoS ONE 2014, 9, e90613. [Google Scholar] [CrossRef]
  24. Yang, Y.; et al. Annexin 1 released by necrotic human glioblastoma cells stimulates tumor cell growth through the formyl peptide receptor 1. Am J Pathol 2011, 179, 1504–1512. [Google Scholar] [CrossRef] [PubMed]
  25. Stelzer, G.; et al. The GeneCards Suite: From Gene Data Mining to Disease Genome Sequence Analyses. Curr Protoc Bioinformatics 2016, 54, 1.30–1. [Google Scholar] [CrossRef]
  26. Liontos, L.M.; et al. The Src-like adaptor protein regulates GM-CSFR signaling and monocytic dendritic cell maturation. J Immunol 2011, 186, 1923–1933. [Google Scholar] [CrossRef]
  27. Nunes-Alves, C.; et al. In search of a new paradigm for protective immunity to TB. Nat Rev Microbiol 2014, 12, 289–299. [Google Scholar] [CrossRef]
  28. Lu, K.; et al. Identification of novel biomarkers in Hunner’s interstitial cystitis using the CIBERSORT, an algorithm based on machine learning. BMC Urol 2021, 21, 109. [Google Scholar] [CrossRef] [PubMed]
  29. Chemin, K.; Gerstner, C.; Malmstrom, V. Effector Functions of CD4+ T Cells at the Site of Local Autoimmune Inflammation-Lessons From Rheumatoid Arthritis. Front Immunol 2019, 10, 353. [Google Scholar] [CrossRef]
  30. Ishii, W.; et al. Flow cytometric analysis of lymphocyte subpopulations and TH1/TH2 balance in patients with polymyositis and dermatomyositis. Intern Med 2008, 47, 1593–1599. [Google Scholar] [CrossRef]
Figure 1. A flowchart of our research. IC, Interstitial cystitis; GEO, Gene Expression Omnibus; GO, Gene Ontology; KEGG, Kyoto Encyclopedia of Genes and Genomes; eQTL, expression quantitative trait loci; MR, Mendelian randomization; IVW, Inverse Variance-Weighted; GWAS, Genome-Wide Association Studies.
Preprints 141288 g001
Figure 2. (A) Two IC gene datasets were obtained from the GEO database. (B) Two samples in the dataset achieved acceptable homogeneity following PCA analysis after batch correction.
Preprints 141288 g002
Figure 3. (A) Heatmap of differential gene expression. (B) Volcano plot.
Preprints 141288 g003
Figure 4. Three up-regulated co-expressed genes.
Preprints 141288 g004
Figure 5. (A) MR forest plot of co-expressed genes. (B) Circos plot of co-expressed genes.
Preprints 141288 g005
Figure 6. Analysis of immune cell infiltration on IC. (A) Stacked histogram of the proportions of immune cells between the IC group and the control group. (B) Box plot showing the comparison of 22 types of immune cells between the IC group and the control group. (C) Heatmap showing the correlation between 22 types of immune cells and co-expressed genes. *p<0.05.
Preprints 141288 g006
Figure 7. Gene Set Enrichment Analysis. (A) The top 5 active biological functions in the CD38 high expression group. (B) The top 5 active pathways in the high CD38 expression group. (C) The top 5 active biological functions in the CD38 low expression group. (D) The top 5 active pathways in the low CD38 expression group.
Preprints 141288 g007
Figure 8. Gene Set Enrichment Analysis. (A) The top 5 active biological functions in the FPR1 high expression group. (B) The top 5 active pathways in the high FPR1 expression group. (C) The top 5 active biological functions in the FPR1 low expression group. (D) The top 5 active pathways in the low FPR1 expression group.
Preprints 141288 g008
Figure 9. Gene Set Enrichment Analysis. (A) The top 5 active biological functions in the SLA high expression group. (B) The top 5 active pathways in the high SLA expression group. (C) The top 5 active biological functions in the SLA low expression group. (D) The top 5 active pathways in the low SLA expression group.
Preprints 141288 g009
Figure 10. The expression of CD38 (A), FPR1 (B), and SLA (C) in the validation group. Y-axis shows the relative expression level.
Preprints 141288 g010
Disclaimer/Publisher’s Note: The statements, opinions and data contained in all publications are solely those of the individual author(s) and contributor(s) and not of MDPI and/or the editor(s). MDPI and/or the editor(s) disclaim responsibility for any injury to people or property resulting from any ideas, methods, instructions or products referred to in the content.
Copyright: This open access article is published under a Creative Commons CC BY 4.0 license, which permit the free download, distribution, and reuse, provided that the author and preprint are cited in any reuse.
Prerpints.org logo

Preprints.org is a free preprint server supported by MDPI in Basel, Switzerland.

Subscribe

© 2024 MDPI (Basel, Switzerland) unless otherwise stated