
Submitted:
02 December 2024
Posted:
03 December 2024
You are already at the latest version
Abstract
(1) Background: Nanoplastics (NPs) are emerging environmental pollutants with potential toxic effects on aquatic organisms. This study investigates the toxicity of NPs in Biomphalaria glabrata, a freshwater snail species widely used as a bioindicator species in ecotoxicology studies.; (2) Methods: We exposed three generations (F0-F2) of B. glabrata snail embryos to different sizes of polystyrene NPs and assessed responses.; (3) Results: summarize the article’s main findings; (4) Conclusions: We observed severe effects on F0 to F2 B. glabrata embryos, including size-dependent (30 to 500 nm) increases in mortality rates, size and dosage-dependent (1 to 100 ppm) effects on hatching rates, and concentration-dependent toxicity in the 30 nm NP treatment group. The F2 generation embryos appear to be most responsive to detoxification (CYP450) and pollutant me-tabolism (HSP70) at 48-hours-post-treatment (HPT), while our developmental marker (MATN1) was highly upregulated at 96-HPT. We also report a particle-size-dependent correlation in HSP70 and CYP450 mRNA expression, as well as enhanced upregulation in the offspring of NP treated snails. These findings indicate that F2 generation embryos appear to exhibit increased stress from toxic substances inherited from F1 and F0. This study provides valuable insights into the impact of plastic particulate pollution on multiple generations and highlights the importance of monitoring and mitigating plastic waste.
Keywords:
Biomphalaria glabrata
; nanoplastics
; transgenerational effect
; embryos
1. Introduction
Nanoplastics (NPs) have become a global environmental concern, with an ever-increasing body of evidence attesting to their negative impacts on organisms, including humans [1]. The freshwater snail Biomphalaria glabrata is a benthic macroinvertebrate and an important indicator species. Recent studies have underscored the concerning possibility of nanoplastic accumulation in the eggs of B. glabrata, and the potential for transgenerational developmental effects [1,2,3]. Nanoplastics are recognized as emerging environmental pollutants that can have detrimental effects on various species [1,3,4,5]. These particles have been found to accumulate in the tissues and organs of aquatic species, including freshwater snails like B. glabrata [1,3]. Concerning findings suggest that exposure to nanoplastics can lead to bioaccumulation and trophic transfer, potentially impacting the health and development of both individual organisms and entire ecosystems [3,5].
Studies have shown that microplastics and nanoplastics can induce a range of adverse effects, such as altered feeding behavior, reduced growth and reproduction, and even transgenerational impacts [3]. For example, Malafaia et al. reported that nanoplastics can lead to developmental abnormalities and reduced hatching success in amphibians [1]. Similarly, Azevedo-Santos et al. found that nanoplastics can negatively impact the physiology and behavior of fishes [1]. Further, Silva et al. demonstrated that exposure to small-sized nanoplastics can cause significant toxicity and developmental disruption in the chironomid, Chironomus riparius [4].
The toxic effects of plastic particulates on a range of snail species, specifically, have been investigated with various toxic effects being observed [6]. Some common findings include bioaccumulation in the gut, gills, head, liver [7], intestines, upregulation of apoptosis marker CASP-3, total inhibition of shell formation [8], effects on feeding, foraging and the gut microbiome [9]. Overall, the toxic effects on NPs including oxidative stress, inflammation, immune dysfunction, dysbiosis, and general systemic toxicity are well characterized in many species [10]. However, transgenerational toxicity is an important emerging field. The goal of this study was to assess the ecotoxicity, end fates, and transgenerational effects of NPs in freshwater environments using B. glabrata.
The transgenerational effects of nanoplastics and microplastics are a particular area of concern, as these particles may have the ability to disrupt the normal development and functioning of organisms, with consequences that may be passed down through multiple generations. It is already known that NPs bioaccumulate within organisms and parental exposure can facilitate exposure to unexposed subsequent filial generations [11]. NPs with environmental contaminants adsorbed onto their surfaces can be transported in gametes and may build up in the lipids of the embryos [12,13]. Anomalous developmental effects can manifest in indirectly exposed subsequent generations [14,15].
Previous transgenerational studies have revealed effects in other freshwater species, affecting the hatching and mortality rates in Danio rerio [16] as well as localization within the yolk sac [12]. Water fleas and copepods in general appear notably sensitive to the transgenerational effects of plastic fragments. Daphinia magna, exhibited reductions in reproduction and growth over the F1-F3 generations [17], increased mortality rates in F1 and F3 (Schur 2020), and transfer of NPs from F0 to F1 and F2 [19]. In Daphinia pulex, inhibitory effects on antioxidant responses and altered growth rate and reproduction in F2 were observed [20]. Increased oxidative stress and altered antioxidant responses in F1 and F2 generations of Moina macrocopa have also been reported [21]. A transgenerational study in a snail species is lacking in the scientific literature, at present.
2. Materials and Methods
2.1. Snail Husbandry
B. glabrata snails (BB02 strain) were received as a gift from Dr. Daniel Wagner at Rice University in Houston, Texas, USA. Snails were reared at the laboratory in two-quart, 7 in. x 11 in. Pyrex® pans filled with 1.0 L of filtered snail aquarium water (n=15 per pan). The tanks were stored in an incubator set to 25 °C with alternating 12-hour light and dark cycles. Snail aquarium water was prepared by mixing 0.5 g of Instant Ocean® Reef Crystals® reef salt 1.0 g sodium bicarbonate, and 500 mg amoxicillin in 5.0 L of reverse osmosis (RO) water stirred for a minimum of three hours to overnight to allow for complete dissolution. Before use, the snail water was filtered using a 1 L, 0.2 µm polyether sulfone (PES) membrane attached to vacuum filter. Snails were fed a diet of spinach and green leaf lettuce which was changed every other day. Fecal matter was removed every two days using an electric pipettor and fresh snail water was added to maintain water levels at 1.0 L per tank. Four-month-old, pigmented individuals between 8.0 and 12.0 mm in shell diameter, weighing between 0.24 g and 0.32 g were used for egg production. Three generations of snails were studied in these experiments, with full gene expression, mortality and hatching experimentation performed on generations F0 and F2.
2.2. Latex Bead Preparation
Three sizes of polystyrene nanoplastics (PS-NPs) used were 30 nm, 500 nm, and 1.0 µm. All testing was done with PS-NPs at concentrations of 1.0 ppm, however, some additional hatching and mortality testing in the F2 generation were done with increased concentrations (10 ppm and 100 ppm) to look for dose-dependent effects. The PS-NPs were carboxylate-modified, fluorescently-tagged, spherical latex beads composed of polystyrene in aqueous suspension (purchased from Sigma Aldrich, St. Louis, MO; Product Number: 30 nm -L5155, 500 nm – L2380, 1.0 µm – L4655). The stock was diluted with filtered snail aquarium water for treatments. Controls were treated with filtered snail water only. All treatments began at ~15 hours post fertilization (HPF) and lasted six days or 144 hours post treatment (HPT). Snails were observed for a total of 15 days.
2.3. Transgenerational Preparations
In the wild, egg masses are laid on a hard substrate or submerged vegetation, while in the laboratory, they may lay eggs on Styrofoam, glass walls, lettuce, or the shells of others. Styrofoam floats were placed in the control tank after 7:00 pm for snails to lay their eggs on and were collected approximately 15 hours later, while still in the blastula stage of development. Each embryo was randomly assigned to either a treatment group or control and placed in a petri dish. Egg masses were rinsed with fresh, filtered, snail water three times before the excess water was removed. Next, for the treatments, the petri dish was filled to 20 mL with aqueous PS-NP maximizing the air interface to allow for gas exchange. Controls were treated similarly; however, they were filled with snail aquarium water only. Eggs were then incubated at 25 °C with 12-hour light and dark cycles. The egg masses were monitored and underwent daily observations. At the six-day mark, the aqueous PS-NP solution was removed, and the egg masses were rinsed with clean, filtered snail water three times before filling approximately halfway with clean snail water. The juveniles were then monitored and kept in the petri dishes until their first egg mass was laid. At this point, the juveniles were placed in clean two-quart Pyrex® pans filled with 1.0 L of filtered snail water. These tanks are then labeled. For subsequent generations, egg masses were taken from their respective groups. For example, the second generation previously treated with 30 nm particles at 1 ppm was taken and treated with 30 nm PS-NPs at 1 ppm, as before. All three test groups of each generation were treated in the same manner with no deviations. All exposure experiments lasted six days, with observations spanning 15 days.
2.4. Quantification via Fluorescence Assay
To estimate the total amount of PS-NP accumulation in the egg masses, PS-NPs remaining in water samples after incubation with snail embryos were quantified using a Cytation5 spectrophotometry plate reader (BioTek Instruments, Winooski, VT). A standard curve was created with three known NP concentrations (0.1, 1, and 10 ppm). The concentrations of PS-NPs in each collected water sample were calculated using the equation generated from the standard curve. It follows that the PS-NPs no longer remaining in the water have adhered to or entered the snail eggs. The fluorescently labeled PS-NPs were added to B. glabrata embryos culturing water at a concentration of 1 ppm (n = 3). Water samples were collected every 24 hours for six days, encompassing the major embryonic development period. Water samples were moved to 96-well plates and the intensity of the fluorescent signal was quantified using the plate reader.
2.4. Visualization of Fluorescent NPs
To visualize the accumulation and uptake of PS-NPs over the treatment period, an egg mass from each treatment group and control group was collected every 24 hours. A standard, inverted microscope (Olympus Co., Tokyo, Japan) equipped with a mercury lamp and a CCD camera was used to monitor the accumulation of the fluorescent PS-NPs on an/or in the egg mass. An AX/AX R with NSPARC confocal fluorescent microscopy system (Nikon, Japan) was to obtain more detailed images of surface accumulation and z-scans were performed to monitor the vertical migration of PS-NPs into the snail egg chorion. 1 ppm fluorescent yellow-green latex beads of carboxylate-modified polystyrene with an excitation wavelength of 470 nm and an emission wavelength of 505 nm was used to monitor the penetration of NPs under confocal microscope.
2.4. Gene Expression
At the 48 -HPT mark, six egg masses were collected per test group; control, 30 nm, 500 nm, and 1.0 µm; in 500 µL of TRIzol® (acid-guanidium-phenol) reagent with 1.0 mm glass beads, wrapped in parafilm, and stored at -80 °C for use in gene expression analysis. Each 24 hours after 48-HPT, six egg masses per test group were collected until 144-HPT. The 24 HPT mark was proven to show no relevant data and was thus discarded in all subsequent experiment runs. RNA extractions were be performed following standard extraction and purification procedures. After RNA extraction, the purity and quality (λ260/280 values) of each sample were evaluated, and RNA was quantified in ng/μL using an Eppendorf BioSpectrometer (Eppendorf Biotech, Hamburg, Germany). RNA samples of over 500 ng/µL were diluted in molecular water for cDNA synthesis, which was performed using the Invitrogen SuperScript III reverse transcription system with a random hexamer primer (Invitrogen Co., Carlsbad, CA). Samples were processed in the Thermocycler (Thermo Fisher Scientific, Waltham, MA) according to the predetermined timeline for the SuperScript III transcription kit, and product cDNA was stored at -20 °C for downstream processing.
The relative gene expression of two known xenobiotic stress responses and developmental genes were quantified using the Thermo Fisher QuantStudio 3 (Thermo Fisher Scientific, Waltham, MA) qPCR instrument. To test the relative gene expression changes between NP treatment groups and control groups, Glyceraldehyde 3-phosphate dehydrogenase (GAPDH was used as a reference gene to test the relative gene expression changes of the following genes: cytochrome P450 (CYP32A1), heat shock protein 70 B2-like (HSP70), and matrillin-1 (MATN1). The primers for this study were designed through Integrated DNA Technologies’ custom primers website (IDT, USA), using the available sequences from the NCI gene bank.
2.5. Toxicity Bioassay
Every 24 hours post-treatment, egg masses (n=6) from each treatment were monitored under a stereomicroscope to determine embryo mortality rate (EM) and hatching rate (HR) [22]. This was continued until the final egg either hatched or died. The EM (%) was calculated by dividing the number of deceased embryos by the total number of embryos per clutch and then multiplying by 100 [22]. Deceased embryos were identified by negative movement and heartbeat, or disintegration of the body [23]. HR (%) was calculated by dividing the number of hatched snails by the total number of embryos per clutch and then multiplying by 100 [22]. The hatched snail must have completely exited the egg mass and not just the egg capsule to be counted as hatched.
2.5. Graphical and Statistical Analyses
Statistical analyses of gene expression were performed using RStudio, Team (2020). RStudio: Integrated Development for R. RStudio, PBC, Boston, MA, USA. Fluorescent quantification, hatching rate, mortality rate, and qPCR data were nonparametric thus a one-way ANOVA was performed for significance followed by Shapiro–Wilk test to test for normality. The difference in treatment groups over each time point will be evaluated using pairwise one-way ANOVAs. Mortality and hatching rates were graphed using Prism GraphPad version 4.2.3 for Windows, Boston, MA, USA.
3. Results
3.1. Quantification via Fluorescence Assay
We sought to quantify the particles that adhered to or entered the snail embryos by subtracting the amount remaining in the water by their fluorescence. This method worked well and revealed a clear downward slope in concentration for the larger particles (500 nm and 1 µm), but only a 21% of 1 ppm reduction in the 30 nm particle group over time, see Supplementary Information (S.I.) Figure S1. This is likely due to the inherent limitations of the equipment since particles were clearly observed in and on the embryos.
3.2. Nanoplastic Bioaccumulation and Migration
Fluorescent imaging of egg masses exposed to fluorescently tagged PS-NPs showed bioaccumulation of PS-NPs on the surface of the egg masses across all three treatments (Figure 1). Though these images could not serve as a clear indicator for NP migration through the outer membrane and uptake by the embryo, however, increased PS-NP density on the surface could be verified by observing the increased diameter of fluorescent signals. Figure 1 shows a visual comparison of the treatments over each 24-hour time point and how bioaccumulation of NP on the outer surface of the egg mass increases with exposure time. The 30 nm treatment had a single florescent signal at 24 HP, but by 96 HPT many more PS-NPs can be visualized as well as clusters of NPs which can be observed as an increased luminescent diameter of the fluorescent signals. The 30 nm NPs appeared to agglomerate in the water, with fewer signals observed between the larger agglomerates. Fluorescent images of different particle size treatments (at 1 ppm) vs time are summarized in Figure 1. The 500 nm treatment at 24-HPT was sparsely covered in NPs with a few clusters. By 96- HPT there were many more clusters with many small signals in-between. At 24-HPT treatment of 1.0 µm, the egg mass had only an area with clusters of NPs. At 96-HPT the surface is widely covered in NPs and has larger clusters than seen in the previous treatments. During a preliminary experiment, we did observe a juvenile treated with 10 ppm of 30 nm NPs emerge with fluorescent NP signals (Figure 2) which suggests that NPs can be taken up by the embryos during development. We did not observe any brightly fluorescent embryos in the 1 ppm treatment groups.
Although we were able to determine that the particles were adhering to the snail eggs, we were unable to verify whether they were penetrating the eggs using fluorescence microscopy alone. However, confocal images revealed accumulation of the NPs within the snail embryos throughout, including the center and bottom of the snail embryo (Figure 3). Figure background was adjusted slightly to correct for artifacts from snail movement (snail was not anesthetized). From the confocal images, we could conclusively verify that the NPs are able to penetrate the snail eggs and exert effects within the developing snail.
3.3. Hatching Rates
Although we observed a clear, concentration dependent reduction in the overall hatch rates for the F2 snails treated with 30 nm PS (Figure 4), we did not observe this trend in any of the other particle sizes. Rather, we observed a non-linear effect. When comparing the hatching rates for the F0 and F2, it is immediately apparent that the reductions in hatching rates, evident in the 1 µm group are not as drastic in the F2 generation. It is likely that we have selected out the most susceptible individuals from our population by F2. We observed a consistent reduction in hatching rate when comparing the F0 and F2 generation groups for the 500 nm PS at 1 ppm on days 6 and 8, as well as reductions in hatching on days 10-14 in the 1 ppm 1 µm groups (Figure 5. A. & B.). However, we do observe a clear reduction in the hatching rates for the 500 nm group in the F2 generation that was not apparent in F0. With for the 500 nm PS, we found that both the 1 ppm and 10 ppm concentrations resulted in a hatch rate of ~72%, and although the 100-ppm concentration resulted in a 96% hatch rate, we observed a spike in the hatching on day 7 that was not observed in the other treatment groups or the control (S.I. Figures S2-S4). This apparent manifestation of toxicity must cause early, as opposed to late, or absent hatching. In the 1 µm treatment groups, the hatching rate and overall hatching did not appear significantly different from controls. The only obvious difference was the hatching rate early in the experiment. We do observe a higher hatching rate on the first day of hatching for the 1 ppm and 10 ppm groups, 28% and 23%, respectively, and a lower hatching rate of 3% for the 100 ppm groups compared to 12% for controls (S.I. Figures S2-S4). The hatching rate remains depressed in the 1 ppm and 100 ppm groups through day 14, however, in the 10-ppm group the hatch rates are on par with controls throughout the experiment. This could be a critical concentration for agglomeration to affect the toxicity, but more work is needed to understand this observation.
3.4. Mortality Rates
As with the hatching rates, the only dosage dependence we observed for mortalities was with the 30 nm particles (Figure 6). The 500 nm particles demonstrated maximum mortality at 10 ppm peaking on days 6-7 and plateauing after that while the mortality rates started higher than average in the 10-ppm treatment group but did not increase with increased dose (S.I. Figure S6). We also noticed a similar death rate for 1 µm treated snails at concentrations of 1 ppm and 100 ppm (S.I. Figure S7). At the investigational dose of 1 ppm, we observed sharp increases in mortalities in all the treated snail embryos on day seven, that was suspiciously absent from the control groups (Figure 7). We have noticed in other studies that as the embryos get closer to their hatching time, the seem to become more sensitive to environmental toxicants (unpublished data). However, the F2 generation does not express this increased slope around day seven, likely because we have selected out the most susceptible individuals from our population. Historical averages for mortalities during this time tends to be 5 – 10% (unpublished data). Therefore, only the 1.0 µm particles in the F0 generation, and the 500 nm particles in the F2 generation exceeded the historical average mortality rates for the laboratory.
3.5. Relative Gene Expression
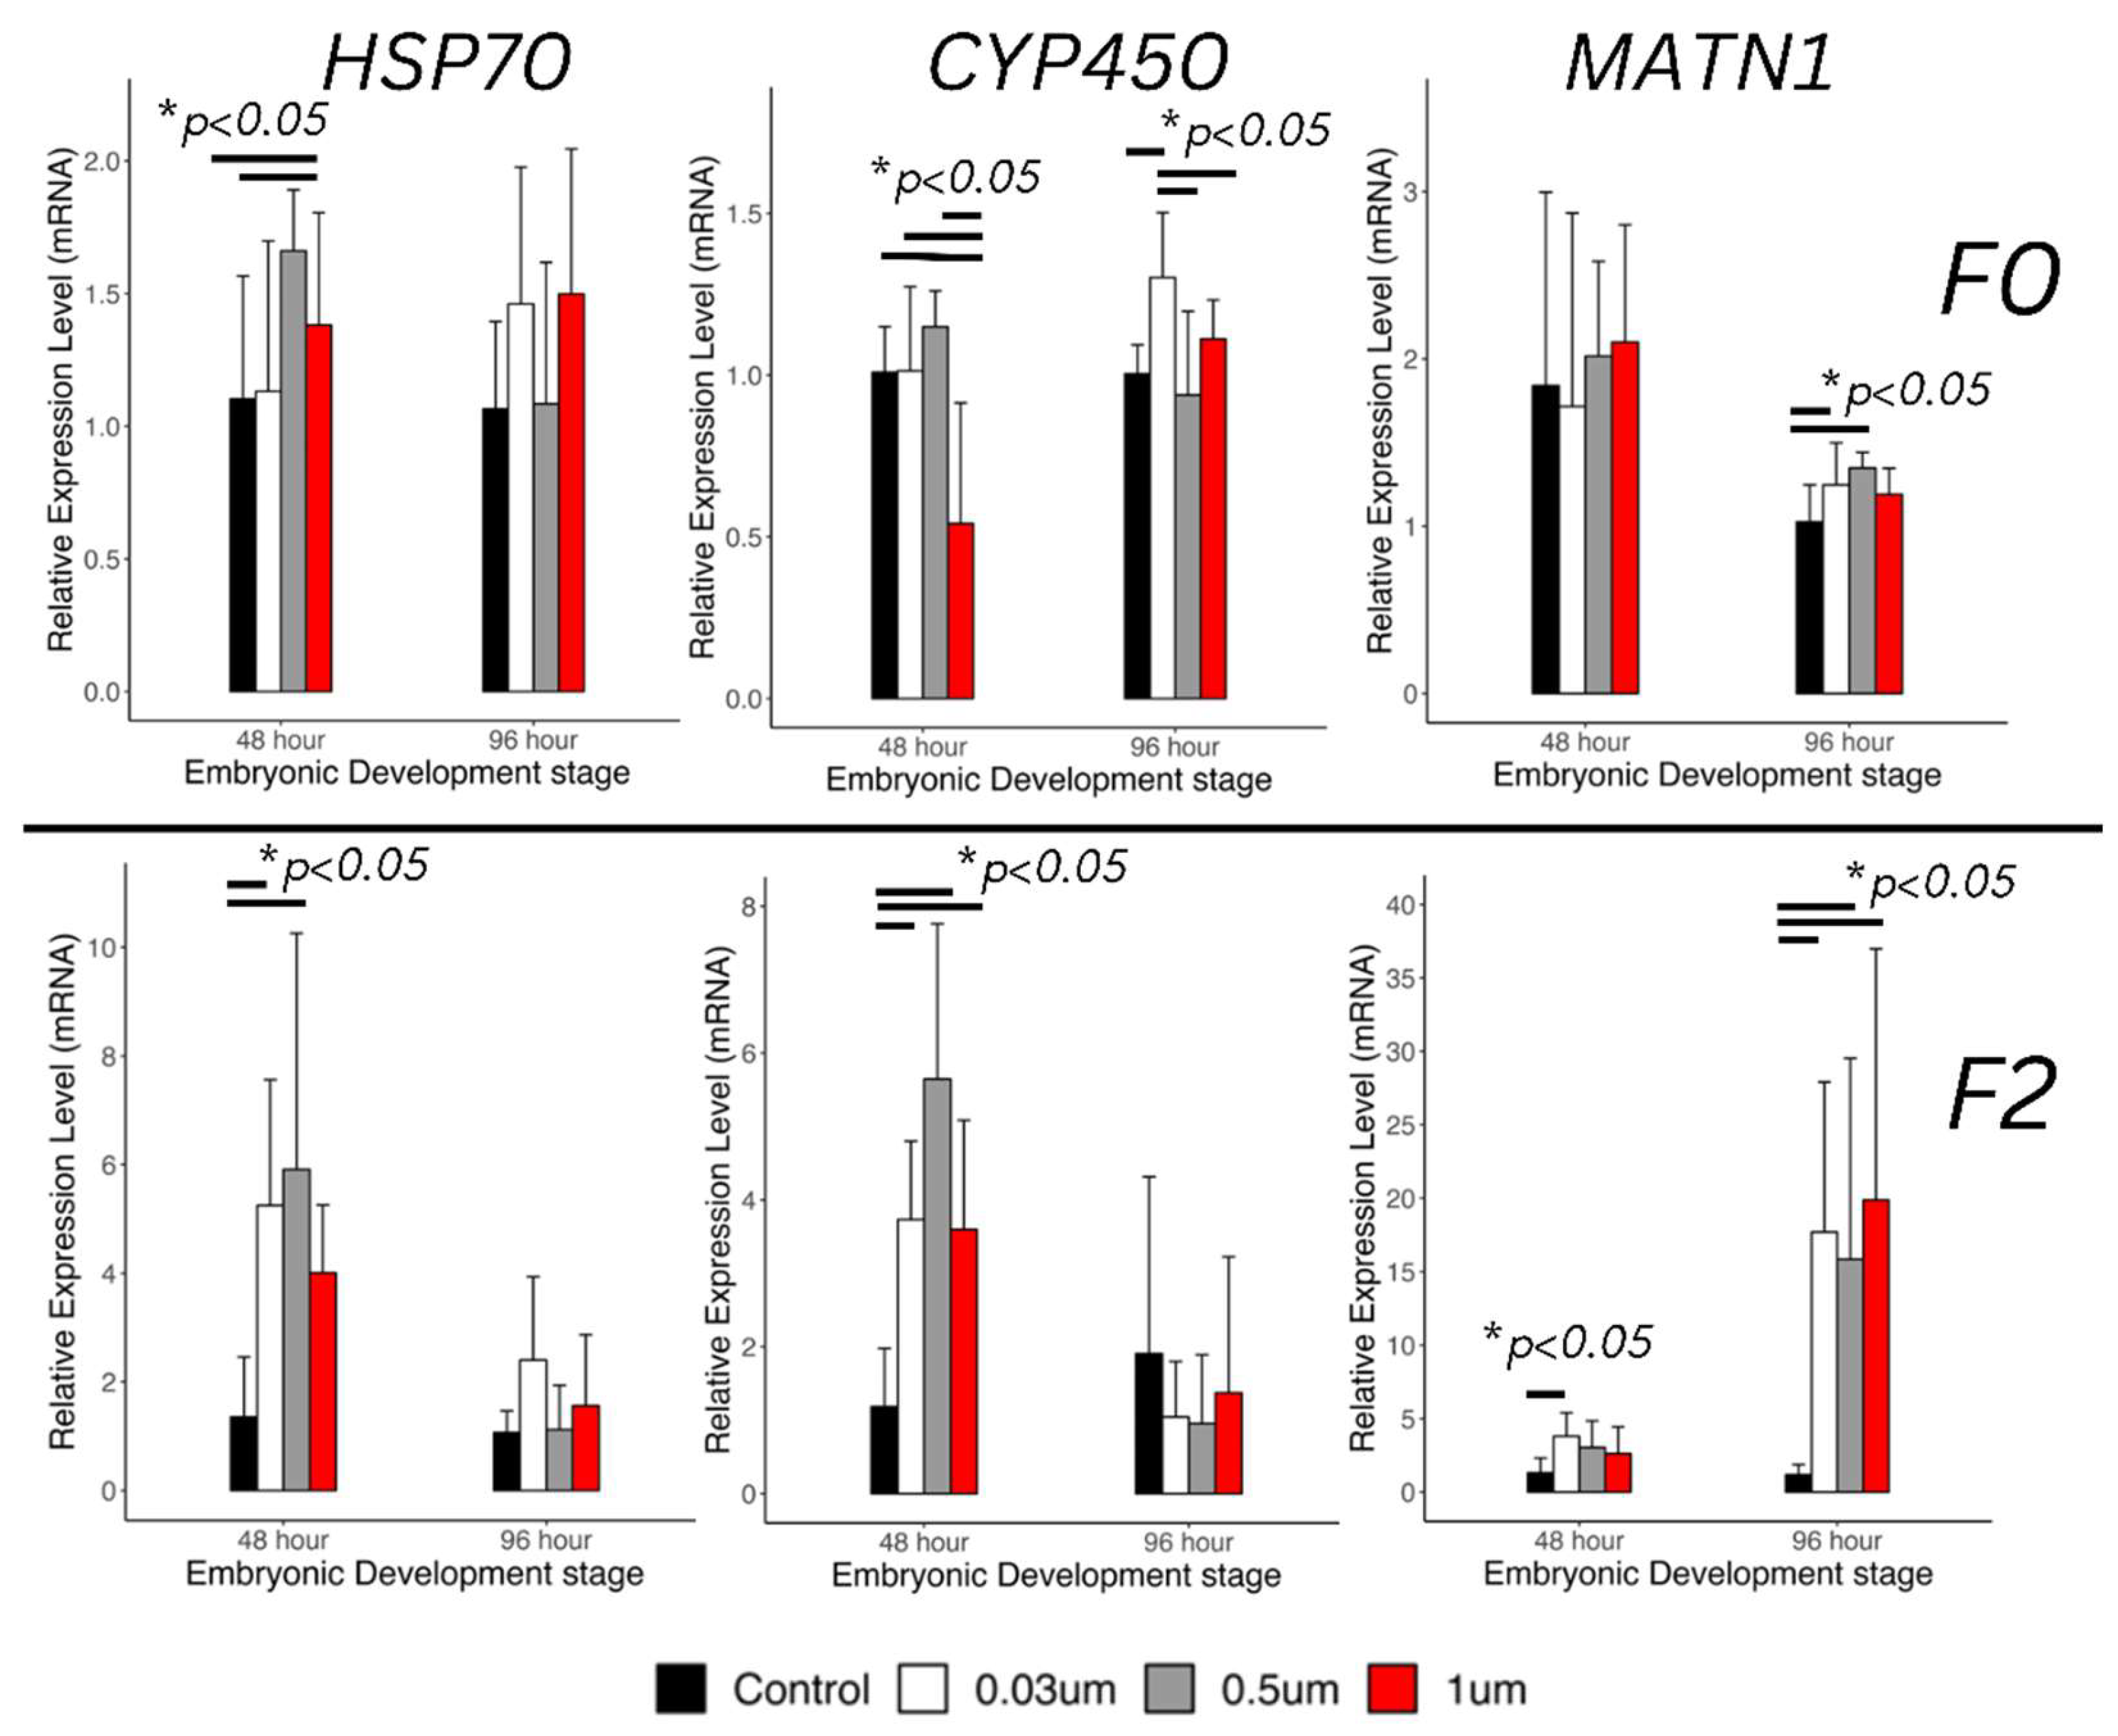
Any alterations in gene expression were most likely to be apparent at 48-hours post-treatment. In fact, we observed upregulation in HSP70 and CYP450 at 48-hours post-treatment. Additionally, we observed upregulation of CYP450 in the F0 generation at 96-hpt, but upregulation of CYP450 (Figure 8) at 48-hpt only for snail embryos treated with the 30 nm particles. The expression levels of genes related to pollutant metabolism (HSP70) and detoxification (CYP450) was detected separately. In the F0 generation, the 48-hour old embryos only exhibited significant upregulation pattern of HSP70 in the 500 nm treatment group compared to the control group (1.66 ± 0.23-fold increase), and there was no significant change in HSP70 expression level after 24 hours development among different size of nano plastics treatment. The expression pattern of CYP450 was significantly downregulated in the 1 µm nano plastics treatment group (0.541± 0.373-fold of control group) during 48-hours development stage, but its expression recovered after 24 hours development. On the contrary, the smaller size nano plastic treatment group (30 nm) resulted in significant upregulation of CYP450 at the 96-hour developmental stage (1.3 ± 0.2-fold of control group). As the major protein resisting parasite infections during snail embryonic development, the encoded gene MATN only showed significant upregulation in the 30, and 500 nm-NPs treated 96 hour-old snail embryos (1.25 ± 0.25, 1.35 ± 0.09-fold of control with 30 and 500 nm NPs treatment, respectively), but there was no significant changes in the MATN expression level in any other NP treatment group during 48 hours embryonic development stage in F0.
Among the genes evaluated, the overall upregulation of CYP450 and HSP70 in the F2 generation were clearly observed on the transcript analyses (Figure 8). The transaction analysis result revealed a size-dependent increase in HSP70 mRNA expression in 48-hour-old embryos (Figure 8). Upregulation patterns of HSP70 were only detected in the offspring of 30 and 500 nm-NPs treated snails (5.25 ± 2.31, 5.91 ± 4.35-fold of control with 30 nm and 500 nm NPs treatment, respectively). HSP70 is a multifunctional protein that protects cells from stress by preventing protein misfolding and repairing or degrading damaged proteins. Therefore, the upregulation of HSP70 in the F2 generation embryos indicated that the early embryo development of F2 generation might still experience stress from toxic substances inherited from their parents through maternal nutrient supply in the eggs. In a previous study, the NPs with diameter around 30 nm were detected in maternally exposed F1 embryos of zebrafish and affected their antioxidant system [12]. Similarly, the expression levels of CYP450 were significantly upregulated in all treatment groups during 48-hours embryonic developmental stage (3.73 ± 1.07, 5.65 ± 2.11, and 3.60 ± 1.49-fold of control with 30 nm, 500 nm, and 1 um NPs treatment, respectively). It is suggested that the F2 embryos might still detoxify the foreign NPs from their parents to adapt to a NP-rich chorion environment compared with the control group. After the adaptation or further bioactivating with the NPs, the expression level of CYP450 recovered in 96-HPT embryos. The expression pattern of MATN1 during 48-hours embryonic developmental stage only upregulated in the 30 nm group. However, significant upregulations of MATN1 were detected in 96-hours old embryos among all three treatment groups (17.7 ± 10.21, 15.8 ± 12.68, 19.9 ± 17.11-fold of control) with 30 nm, 500 nm, and 1 µm NPs treatment, respectively. Therefore, the snails appear most susceptible to alterations in this specific marker of embryonic development by this toxicant at 96-HPT.
4. Discussion
The accumulation of microplastics in Biomphalaria glabrata eggs and their potential transgenerational effects is a concerning environmental issue that warrants further investigation. Our results demonstrate the ability of nanoplastics to accumulate in B. glabrata eggs, with potential impacts on development and hatching success. These findings are consistent with previous studies that have reported adverse effects of nanoplastics and microplastics on various aquatic organisms, including reduced growth, altered behavior, and reproductive impairment [2,3,4,5].
The observed transgenerational effects of nanoplastics on B. glabrata development are particularly alarming, as they suggest the potential for these pollutants to have long-lasting impacts on the health and fitness of freshwater ecosystems. Additionally, we also noted reduced adverse effect levels in later generations suggesting selective breeding of the more resistant animals. Interestingly, we appear to have selected for those with a higher fold-change in gene modification of HSP70 and CYP450 in F2, with a six-fold increase in gene expression for F2 vs a less than 0.2–2-fold change for F0. The mechanism behind these transgenerational effects remains to be fully elucidated but may involve epigenetic modifications and alterations in key developmental pathways.
Matrilin genes, or cartilage matrix proteins (CMP), are a protein family associated with the formation of extracellular matrices of different tissues. Specifically, the MATN-1 gene used in this study is mainly expressed in cartilage [24]. A matrilin-like protein sequence was identified from B. glabrata and is like MANT from Mus musculus [25], therefore, it is likely relatively conserved. Furthermore, other researchers observed this gene expression during the early development stages of B. glabrata [26]. We selected this gene coding for MANT1 as a means of determining whether PS-NPs affect embryonic development. qPCR results yielded slight upregulation for the treatments in the F0 generation, however, we observed statistically significant upregulation (fold change ~20) of MANT1 in the F2 generation when treated at 1 ppm. Again, these findings suggest generational toxicant transfer leading to clear, enhanced effects on subsequent generations of snails in NPs of all sizes tested.
Heat shock proteins (HSPs), or stress response proteins, are a family of proteins that are over-expressed in response to both abiotic and biotic stimuli. HSP70 is an important protein within the HSP family that aid in an organism’s ability to mitigate stress responses and cellular damage from the environment [27]. This gene was chosen to see how NPs in an aquatic environment might affect an organism’s stress and cellular damage due to stressful environments. The only significant upregulation of gene HSP was at 48 HPT in both F0 and F2, while at 120 HPT the treatment groups were downregulated compared to the controls (unpublished data). HSP70 results in other species showed up-regulation of the stress response when exposed to NP at 1.0 ppm concentrations [28,29].
CYP450 is an ancient superfamily of enzymes that plays a significant role in metabolizing endogenous substances including vitamins, steroids, fatty acids, as well as xenobiotics/toxicants. Because the CYP450s can carry out a diverse range of monooxygenase activities, they allow for comprehensive protection from a large array of xenobiotics that organisms interact with. In fact, it can be transcriptionally activated by a range of different xenobiotics [30]. In research, the gene expression is used as a bioindicator for PAH contamination in various species including fish and aquatic invertebrates [31,32,33]. This gene was used to determine whether PS-NPs would induce a xenobiotic response. In the F0 generation, 48-hpt only the 500 nm group was statistically significantly elevated at 48-hpt, and the 1.0 µm and exhibited a trend of upregulation compared to the control, but not again during the treatment period. At 96-HPT, the 30 nm treatment group was upregulated vs control in the F0 generation. We also observed increased CYP expression in the F2 generation closer to 6-fold higher than control, vs. ~1.5-fold higher in F0, with no upregulation observed at 96-hours. CYP expression in other studies showed upregulation of this gene at doses below 1.0 ppm [34]. This could be due to agglomeration of the particles at higher concentrations, leading to increased hydrodynamic size and subsequent reduced penetration.
5. Conclusions
In conclusion, our study provides evidence of the accumulation of NPs in Biomphalaria glabrata embryos and the potential for these particles to have transgenerational effects on the development and fitness of this important freshwater snail. Although the NPs do not seem to have a concentration, or size dependent effect on mortality at sizes > 30 nm, they do alter gene expression with regards to detoxification pathways, stress, and embryonic development. With 500 nm exerting the most significant effects on gene expression overall. These findings underscore the need for continued research and the implementation of effective strategies to mitigate the growing issue of nanoplastic pollution in aquatic environments.
Supplementary Materials
The following supporting information can be downloaded at the website of this paper posted on Preprints.org, Figure S1: Concentration of NPs remaining in water with snail egg masses; Figures S2-S4: Hatching rates for snail embryos exposed to increasing doses of 30 nm, 500 nm and 1 µm particles, respectively; Figures S5-S7: Mortality rates of F2 generation snails treated with increasing doses of 30 nm, 500 nm, and 1 µm particles, respectively.
Author Contributions
For research articles with several authors, a short paragraph specifying their individual contributions must be provided. The following statements should be used “Conceptualization, W.X.; methodology, L.M., C.A., M.M., C.H., ; software, L.M. and C.H.; validation, L.M., M.M., C.A., C.H. and W.X.; formal analysis, L.M., M.M., C.H.; investigation, C.A., M.M., C.H.; resources, W.X.; data curation, L.M. and C.H.; writing—original draft preparation, L.M.; writing—review and editing, C.A., C.H., W.X; visualization, L.M., M.M., C.H.; supervision, W.X.; project administration, W.X.; funding acquisition, W.X. All authors have read and agreed to the published version of the manuscript.
Funding
This research was funded by the National Science Foundation, grant numbers 2046049 and 1903719.
Data Availability Statement
Data is available upon request from the corresponding author.
Acknowledgments
We thank Dr. Daniel Wagner at Rice University for generously giving us Biomphalaria glabrata for the project, and Dr. Kara Harmatys and Dr. Anil Shukla from Nikon Instruments Inc. for helping us with the confocal imaging. We also thank student researchers Nin Gan, Kaitlin Garcia, and Isadora Hyun-Ae Pak for assistance with snail husbandry.
Conflicts of Interest
Leisha Martin declares corporate affiliation with MNT SmartSolutions, Inc. and LEI NanoTech.
References
- Ali, N.; Katsouli, J.; Marczylo, E.L.; Gant, T W.; Wright, S.; Serna, J.B. The potential impacts of micro-and-nano plastics on various organ systems in humans. EBioMedicine. 2023, 99, 104901–104901. [Google Scholar] [CrossRef] [PubMed]
- Rivers-Auty, J.; Bond, A.L.; Grant, M.L.; Lavers, J.L. The one-two punch of plastic exposure: macro-and micro-plastics induce multi-organ damage in seabirds. J. of Hazard. Mater. 2023, 442, 130117–130117. [Google Scholar] [CrossRef] [PubMed]
- Geng, Y.; Liu, Z.; Hu, R.; Huang, Y.; Li, F.; Ma, W.; Wu, X.; Dong, H.; Song, K.; Xu, X.; Zhang, Z.; Song, Y. Toxicity of microplastics and nanoplastics: invisible killers of female fertility and offspring health. Front Physiol. 2023, 14, 1254886. [Google Scholar] [CrossRef] [PubMed]
- Silva, S.A.; Rodrigues, A.C.M.; Rocha-Santos, T.; Silva, A.L.P.; Gravato, C. Effects of Polyurethane Small-Sized Microplastics in the Chironomid, Chironomus riparius: Responses at Organismal and Sub-Organismal Levels. Int J Environ Res and Public Health. 2022, 19, 15610–15610. [Google Scholar] [CrossRef]
- Yu, S.; Zhang, M.; Li, Z.; Cao, S.; Lou, Y.; Cong, Y.; Jin, F.; Wang, Y. Long-Term Toxicity of 50-nm and 1-μm surface-charged polystyrene microbeads in the brine shrimp Artemia parthenogenetica and Role of Food Availability. Toxics. 2023, 11, 356–356. [Google Scholar] [CrossRef]
- Rodrigues, C.C.; Salla, R.F.; Rocha, T.L. Bioaccumulation and ecotoxicological impact of micro (nano) plastics in aquatic and land snails: historical review, current research and emerging trends. J Hazard Mater. 2023, 444, 130382. [Google Scholar] [CrossRef]
- Zhao, X.; Liu, Z.; Ren, X.; Duan, X. Parental transfer of nanopolystyrene-enhanced tris(1,3-dichloro-2-propyl) phosphate induces transgenerational thyroid disruption in zebrafish. Aquat Toxicol. 2021, 236, 105871. [Google Scholar] [CrossRef]
- Imhof, H.K.; Laforsch, C. Hazardous or not–Are adult and juvenile individuals of Potamopyrgus antipodarum affected by non-buoyant microplastic particles? Environ Pollut. 2016, 218, 383–91. [Google Scholar] [CrossRef]
- Chae, Y.; An, Y.J. Nanoplastic ingestion induces behavioral disorders in terrestrial snails: trophic transfer effects via vascular plants. Environ Sci Nano. 2020, 7, 975–83. [Google Scholar] [CrossRef]
- Martin, L.M.; Gan, N.; Wang, E.; Merrill, M.; Xu, W. Materials, surfaces, and interfacial phenomena in nanoplastics toxicology research. Environ Pollut. 2022, 292, 118442. [Google Scholar] [CrossRef]
- Zhou, R.; Lu, G.; Yan, Z.; Jiang, R.; Bao, X.; Lu, P. A review of the influences of microplastics on toxicity and transgenerational effects of pharmaceutical and personal care products in aquatic environment. Sci Total Environ. 2020, 732, 139222. [Google Scholar] [CrossRef] [PubMed]
- Pitt, J. A.; Kozal, J. S.; Jayasundara, N.; Massarsky, A.; Trevisan, R.; Geitner, N.; Wiesner, M.; Levin, E. D.; Di Giulio, R. T. Uptake, tissue distribution, and toxicity of polystyrene nanoparticles in developing zebrafish (Danio rerio). Aquat Toxicol. 2018, 194, 185–194. [Google Scholar] [CrossRef] [PubMed]
- Wu, Q.; Li, G.; Huo, T.; Du, X.; Yang, Q.; Hung, T.C.; Yan, W. Mechanisms of parental co-exposure to polystyrene nanoplastics and microcystin-LR aggravated hatching inhibition of zebrafish offspring. Sci Total Environ. 2021, 774, 145766. [Google Scholar] [CrossRef] [PubMed]
- Sussarellu, R.; Suquet, M.; Thomas, Y.; Lambert, C.; Fabioux, C.; Pernet, M.E.; Le Goïc, N.; Quillien, V.; Mingant, C.; Epelboin, Y.; Corporeau, C. Oyster reproduction is affected by exposure to polystyrene microplastics. PNAS. 2016, 113, 2430–5. [Google Scholar] [CrossRef]
- Zhao, T.; Tan, L.; Huang, W.; Wang, J. The interactions between micro polyvinyl chloride (mPVC) and marine dinoflagellate Karenia mikimotoi: The inhibition of growth, chlorophyll and photosynthetic efficiency. Environ Pollut. 2019, 247, 883–9. [Google Scholar] [CrossRef]
- Qiang, L.; Lo, L.S.; Gao, Y.; Cheng, J. Parental exposure to polystyrene microplastics at environmentally relevant concentrations has negligible transgenerational effects on zebrafish (Danio rerio). Ecotoxicol Environ Saf. 2020, 206, 111382. [Google Scholar] [CrossRef]
- Martins, A.; Guilhermino, L. Transgenerational effects and recovery of microplastics exposure in model populations of the freshwater cladoceran Daphnia magna Straus. Sci Total Environ. 2018, 631, 421–428. [Google Scholar] [CrossRef]
- Schür, C.; Zipp, S.; Thalau, T.; Wagner, M. Microplastics but not natural particles induce multigenerational effects in Daphnia magna. Environ Pollut. 2020, 260, 113904. [Google Scholar] [CrossRef]
- Xu, E.G.; Cheong, R.S.; Liu, L.; Hernandez, L.M.; Azimzada, A.; Bayen, S.; Tufenkji, N. Primary and secondary plastic particles exhibit limited acute toxicity but chronic effects on Daphnia magna. Environ Sci Technol. 2020, 54, 6859–68. [Google Scholar] [CrossRef]
- Liu, Z.; Cai, M.; Wu, D.; Yu, P.; Jiao, Y.; Jiang, Q.; Zhao, Y. Effects of nanoplastics at predicted environmental concentration on Daphnia pulex after exposure through multiple generations. Environ Pollut. 2020, 256, 113506. [Google Scholar] [CrossRef]
- Kim, J.; Rhee, J.-S. Biochemical and physiological responses of the water flea Moina macrocopa to microplastics: a multigenerational study. Mol Cell Toxicol. 2021, 17, 523–32. [Google Scholar] [CrossRef]
- Caixeta, M. B.; Araújo, P. S.; Rodrigues, C. C.; Gonçalves, B. B.; Araújo, O. A.; Bevilaqua, G. B.; Malafaia, G.; Silva, L. D.; Rocha, T. L. Risk assessment of iron oxide nanoparticles in an aquatic ecosystem: A case study on Biomphalaria glabrata. J Hazard Mater. 2021, 401, 123398. [Google Scholar] [CrossRef] [PubMed]
- Oliveira-Filho, E.C.; Geraldino, B.R.; Coelho, D.R.; De-Carvalho, R.R.; Paumgartten, F.J.R. Comparative toxicity of Euphorbia milii latex and synthetic molluscicides to Biomphalaria glabrata embryos. Chemosphere. 2010, 81, 218–227. [Google Scholar] [CrossRef] [PubMed]
- Deák, F.; Wagener, R.; Kiss, I.; Paulsson, M. The matrilins: a novel family of oligomeric extracellular matrix proteins. Matrix Biol. 1999, 18, 55–64. [Google Scholar] [CrossRef]
- Bouchut, A.; Roger, E.; Coustau, C.; Gourbal, B.; Mitta, G. Compatibility in the Biomphalaria glabrata/Echinostoma caproni model: Potential involvement of adhesion genes. Int J Parasitol. 2006, 36, 175–184. [Google Scholar] [CrossRef]
- Wu, D.; Liu, Z.; Cai, M.; Jiao, Y.; Li, Y.; Chen, Q.; Zhao, Y. Molecular characterisation of cytochrome P450 enzymes in waterflea (Daphnia pulex) and their expression regulation by polystyrene nanoplastics. Aquat Toxicol. 2019, 217, 105350. [Google Scholar] [CrossRef]
- Song, H.-M.; Mu, X.-D.; Gu, D.-E.; Luo, D.; Yang, Y.-X.; Xu, M.; Luo, J.-R.; Zhang, J.-E.; Hu, Y.-C. Molecular characteristics of the HSP70 gene and its differential expression in female and male golden apple snails (Pomacea canaliculata) under temperature stimulation. Cell Stress and Chaperones. 2014, 19, 579–589. [Google Scholar] [CrossRef]
- Liu, Z.; Yu, P.; Cai, M.; Wu, D.; Zhang, M.; Huang, Y.; Zhao, Y. Polystyrene nanoplastic exposure induces immobilization, reproduction, and stress defense in the freshwater cladoceran Daphnia pulex. Chemosphere. 2019, 215, 74–81. [Google Scholar] [CrossRef]
- Abarghouei, S.; Hedayati, A.; Raeisi, M.; Hadavand, B. S.; Rezaei, H.; Abed-Elmdoust, A. Size-dependent effects of microplastic on uptake, immune system, related gene expression and histopathology of goldfish (Carassius auratus). Chemosphere. 2021, 276, 129977. [Google Scholar] [CrossRef]
- Manikandan, P.; Nagini, S. Cytochrome P450 structure, function and clinical significance: a review. Curr Drug Targets. 2018, 19, 38–54. [Google Scholar] [CrossRef]
- Li, L.; Ping, X.; Li, Z.; Xv, G.; Wang, C.; Jiang, M. Effects of oxidation defense system exposure to Benzo(a)pyrene on CYP450 gene expression and EROD activity in Crassostrea gigas and Mytilus coruscus. Enviro. 2021, 33, 206–13. [Google Scholar] [CrossRef]
- Whalen, K.E.; Starczak, V.R.; Nelson, D.R.; Goldstone, J.V; Hahn, M.E. Cytochrome P450 diversity and induction by gorgonian allelochemicals in the marine gastropod Cyphoma gibbosum. BMC Ecol. 2010, 10, 1–15. [Google Scholar] [CrossRef] [PubMed]
- Chaty, S.; Rodius, F.; Vasseur, P.A. Comparative study of the expression of CYP1A and CYP4 genes in aquatic invertebrate (freshwater mussel, Unio tumidus) and vertebrate (rainbow trout, Oncorhynchus mykiss). Aquat Toxicol. 2004, 69, 81–94. [Google Scholar] [CrossRef] [PubMed]
- Wu, D.; Liu, Z.; Cai, M.; Jiao, Y.; Li, Y.; Chen, Q.; Zhao, Y. Molecular characterisation of cytochrome P450 enzymes in waterflea (Daphnia pulex) and their expression regulation by polystyrene nanoplastics. Aquat Toxicol. 2019, 217, 105350. [Google Scholar] [CrossRef] [PubMed]
Figure 1.
Fluorescent images comparing treatments particle size increases with row vs exposure time increasing with columns right to left. All treatment concentrations are 1 ppm. Fluorescent signals appear beginning at 24-HPT and bioaccumulation continues through 96-HPT.
Figure 1.
Fluorescent images comparing treatments particle size increases with row vs exposure time increasing with columns right to left. All treatment concentrations are 1 ppm. Fluorescent signals appear beginning at 24-HPT and bioaccumulation continues through 96-HPT.
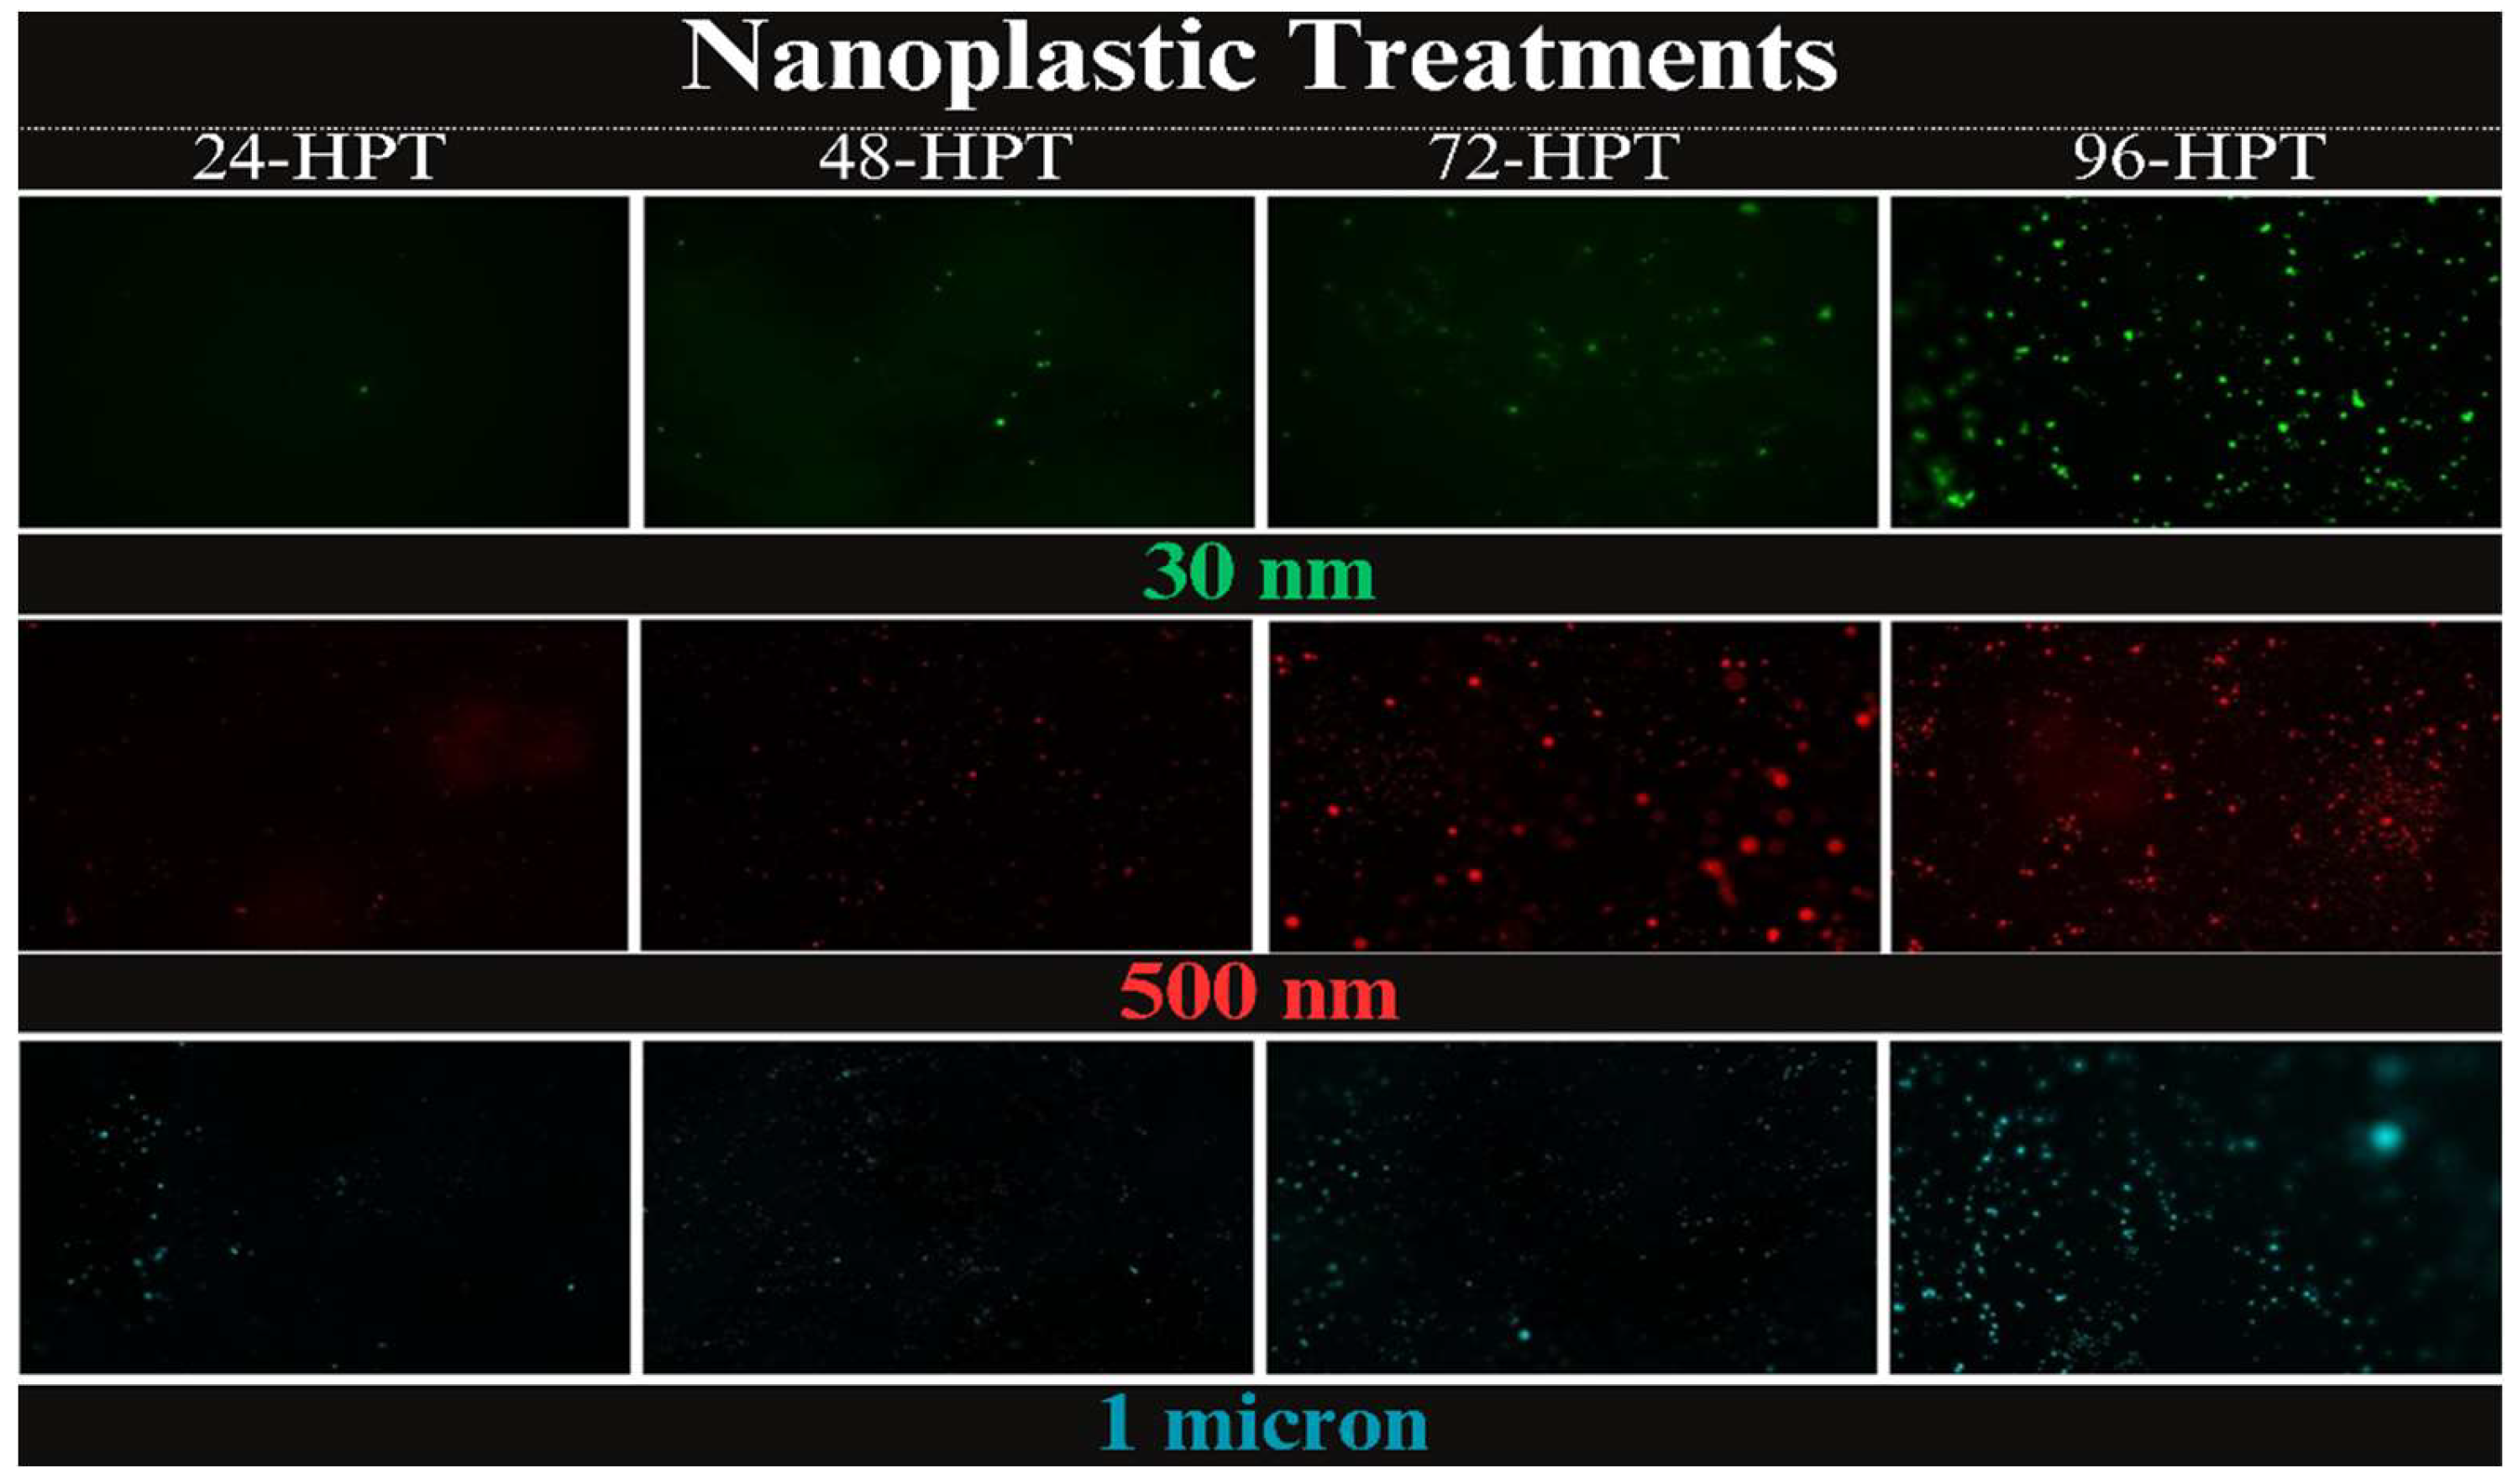
Figure 2.
Fluorescence microscopy image of juvenile snail treated with 10 ppm of 30 nm NPs during first 6-days of embryonic development, emerged from egg with fluorescent emission (left image) and brightfield image of the same snail (right image).
Figure 2.
Fluorescence microscopy image of juvenile snail treated with 10 ppm of 30 nm NPs during first 6-days of embryonic development, emerged from egg with fluorescent emission (left image) and brightfield image of the same snail (right image).
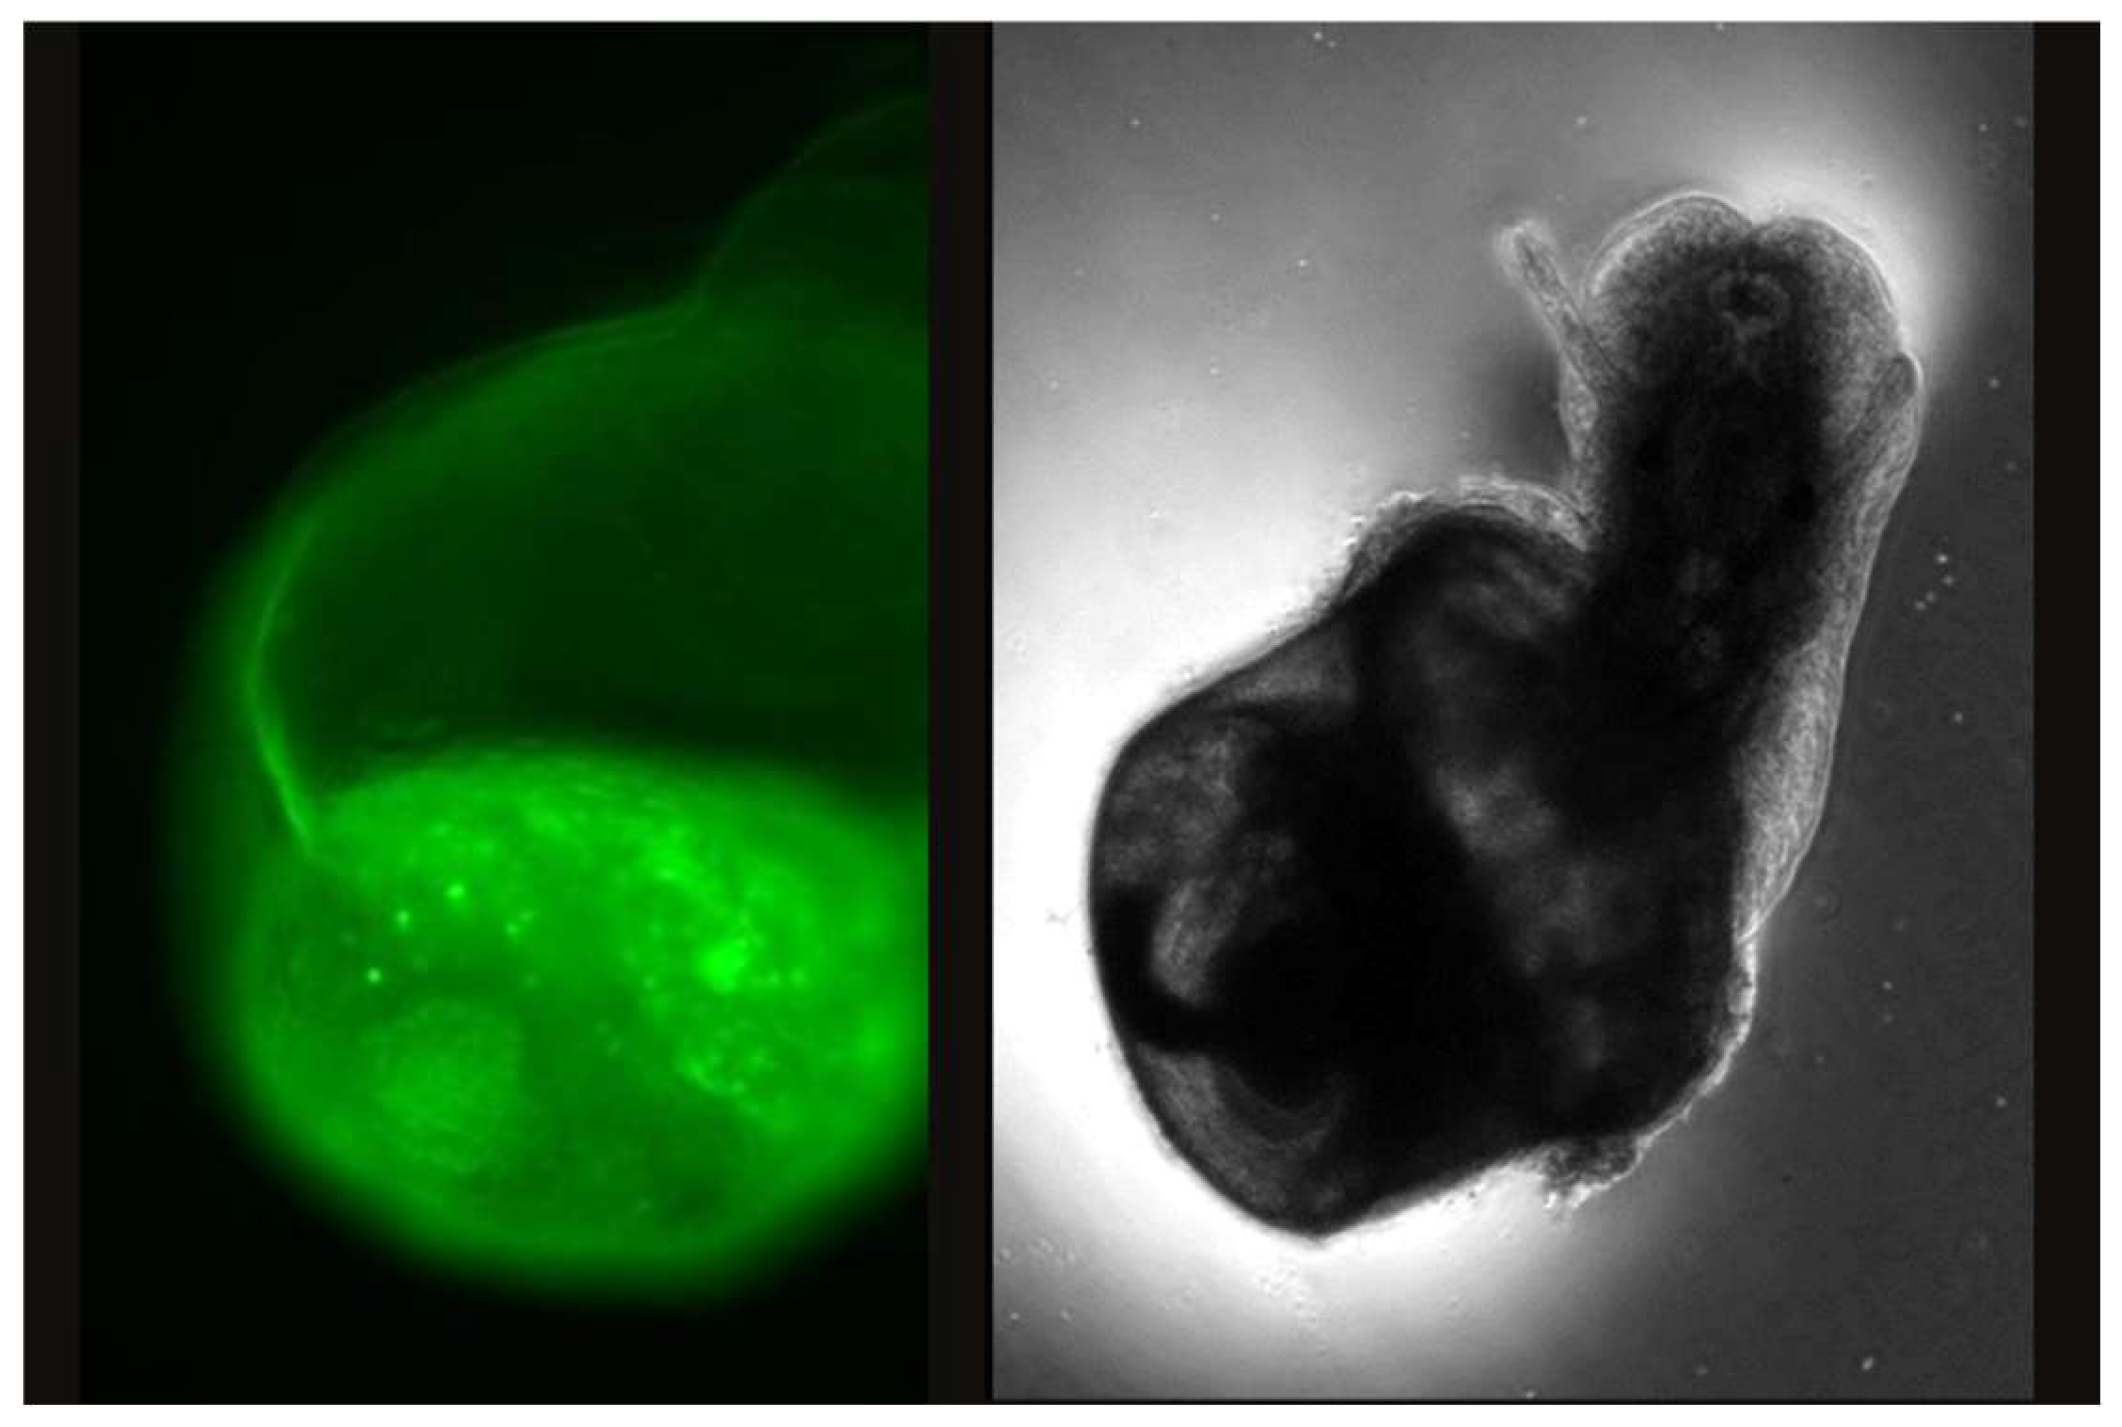
Figure 3.
Confocal microscopy images of snail embryos showing full scan still image of the center of the embryo (top row) and bottom view scans of the embryo (lower row) both locations have still images of the fluorescence (left column) brightfield image of the embryo (center column) and merge (right column). Fluorescent particles are clearly accumulating within the embryo, not just on the outside of the egg.
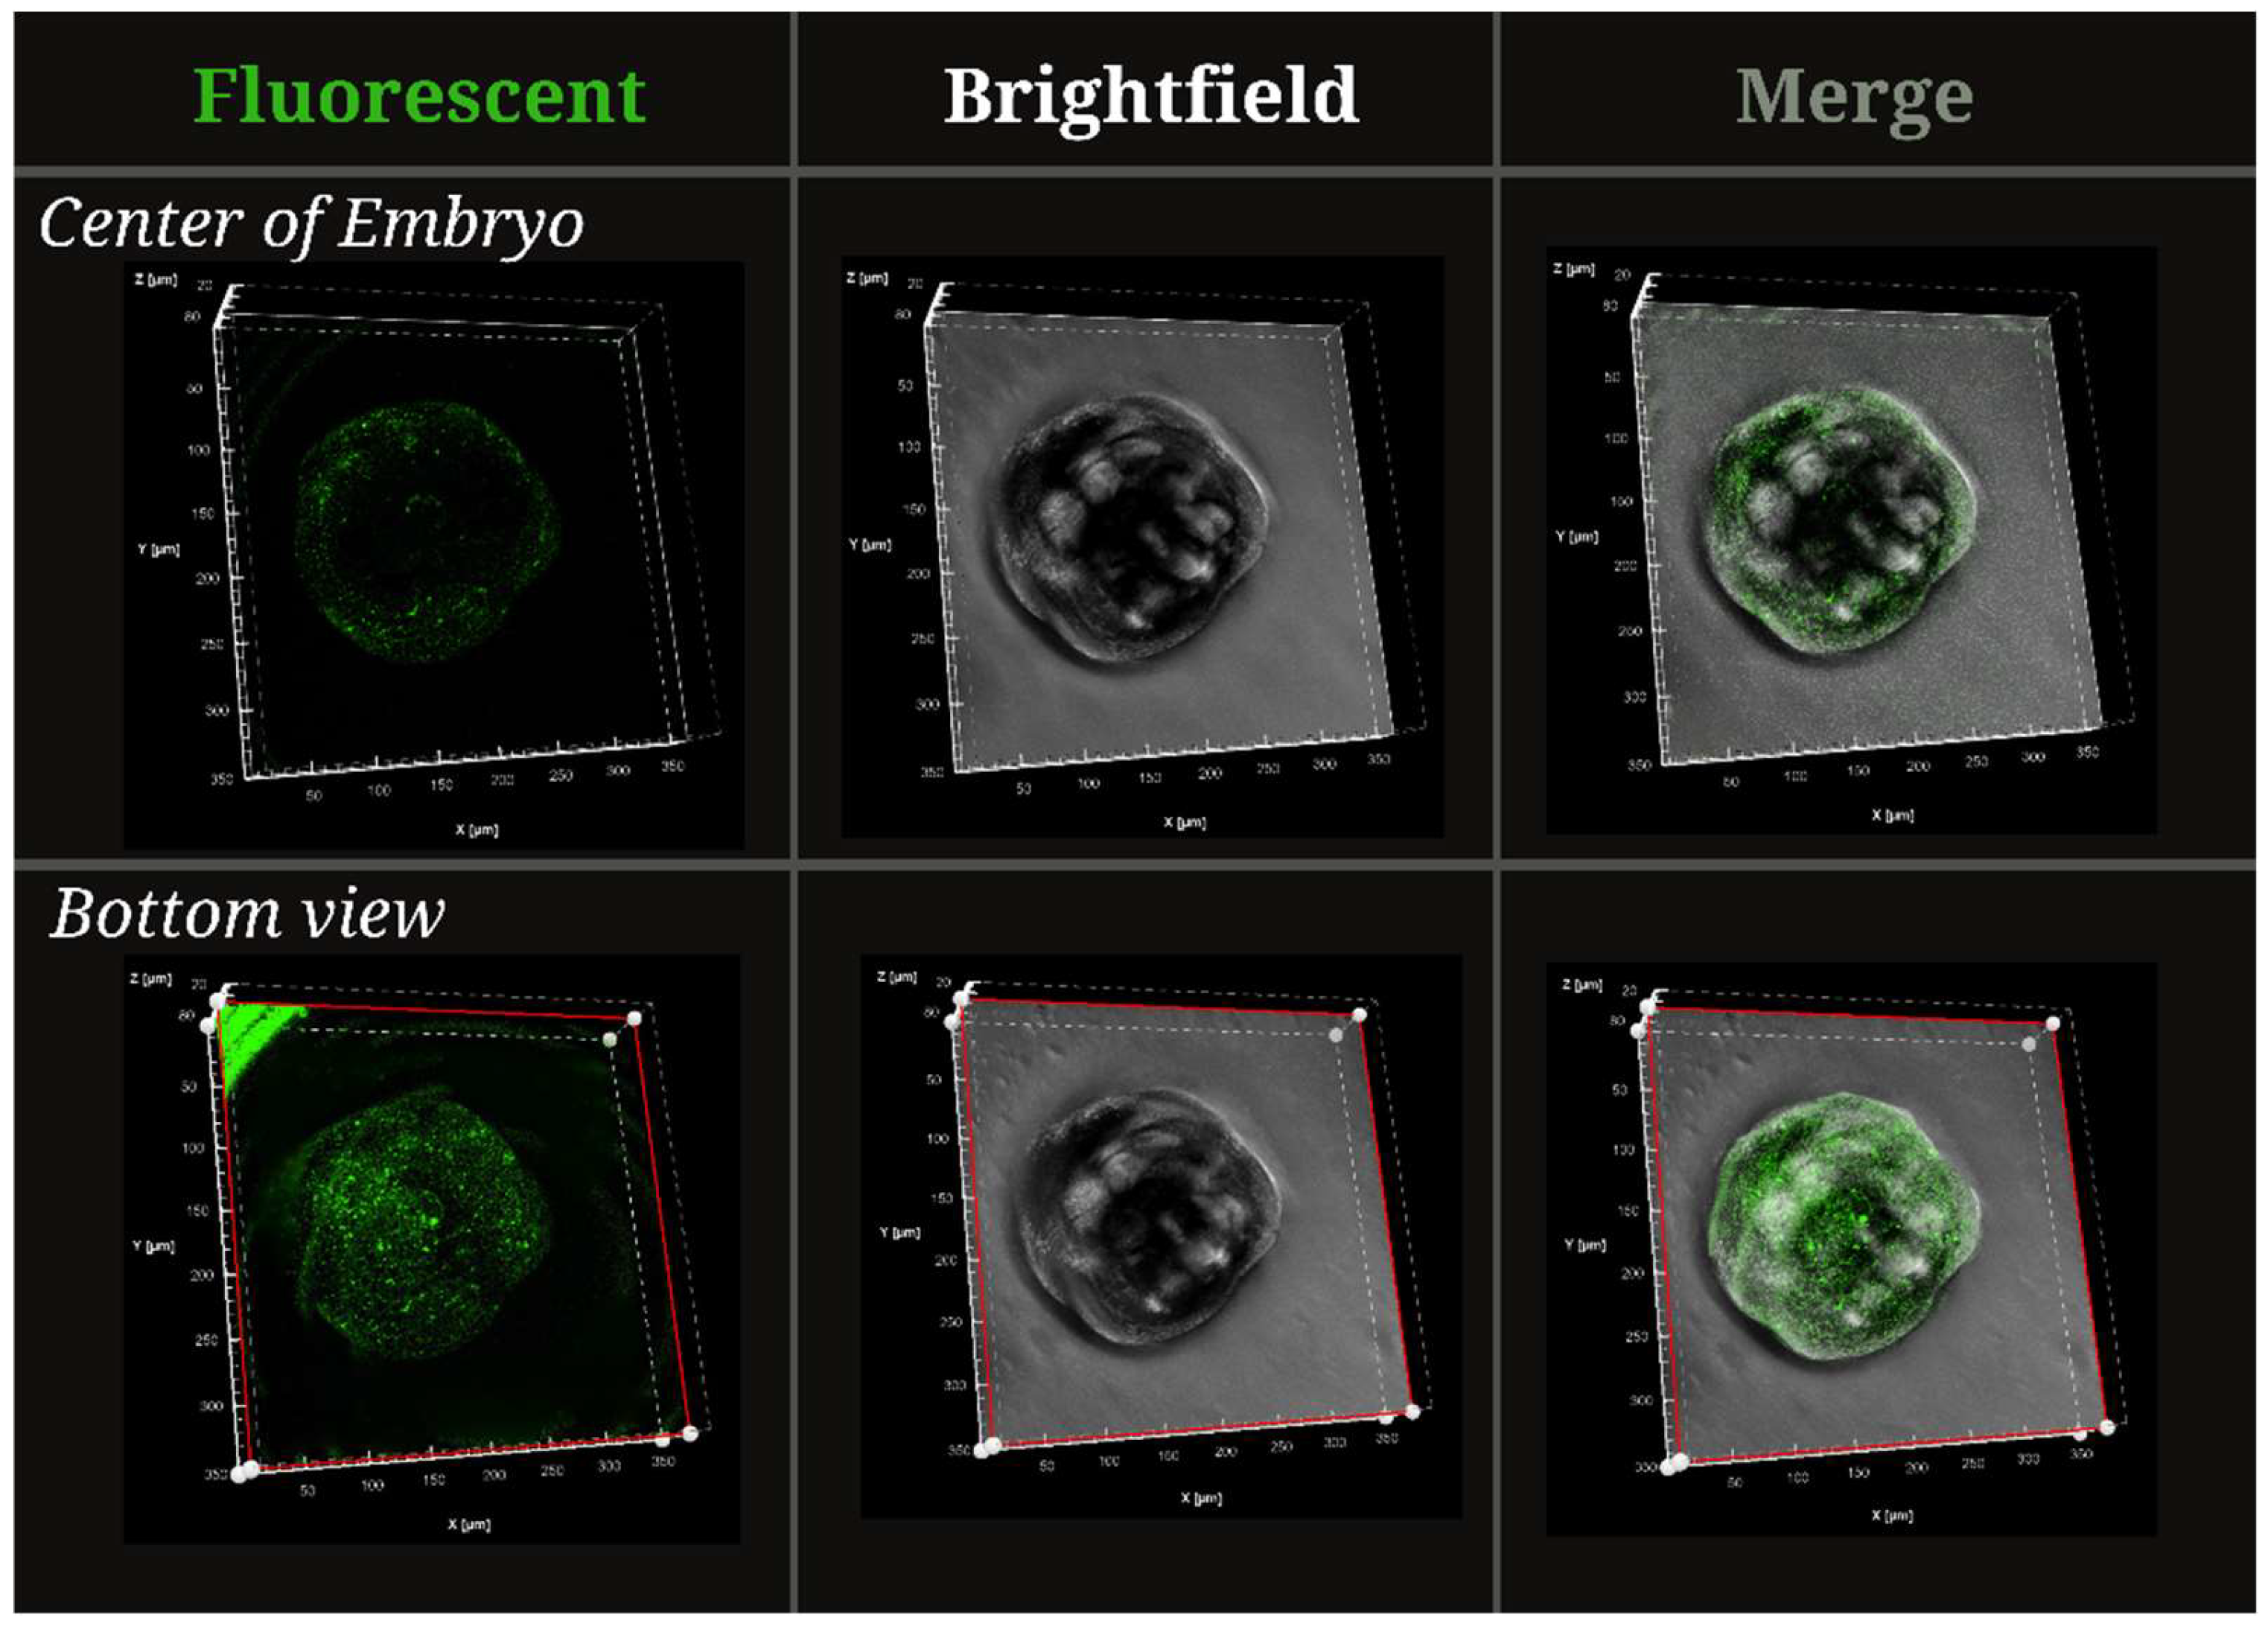
Figure 4.
Dose-dependent reduction in hatching rates for 30 nm NP exposures.
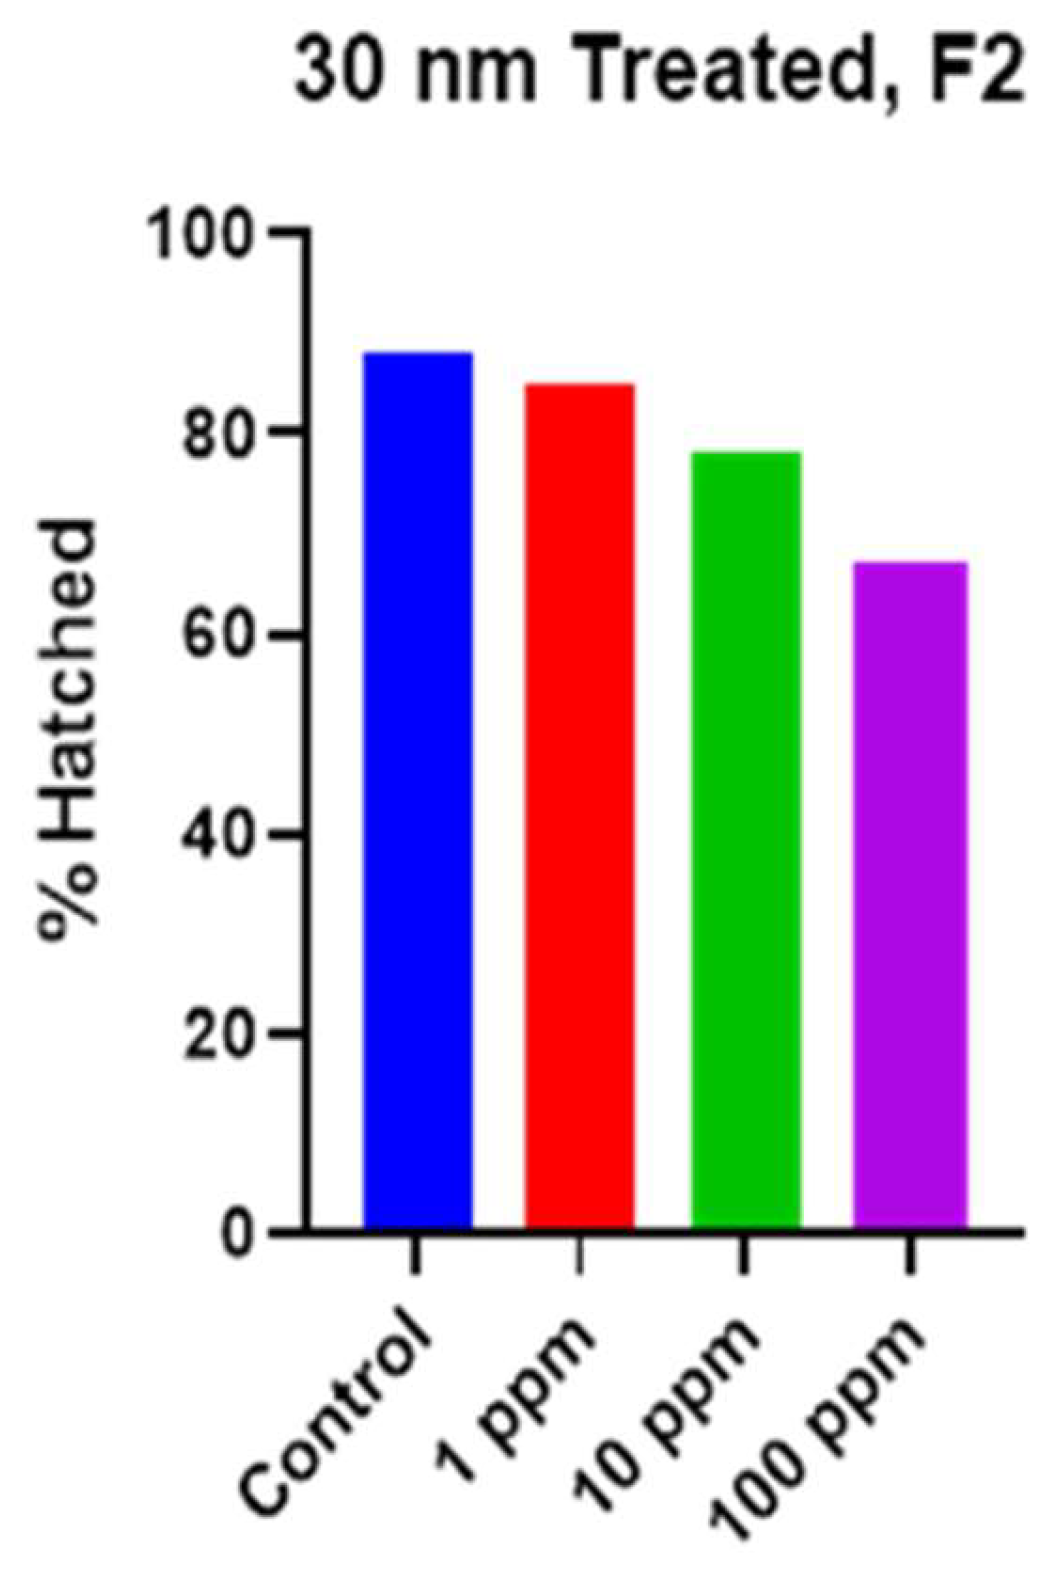
Figure 5.
A) Hatching rate of F0 generation snails, shows significantly reduced hatching in the 1 µm group on days 6-10, and continued slight reductions through day 15. We also see slight reductions in the hatching rates for the 500 nm treatment groups. B) Hatching rate of F2 generation snails shows reduced hatching rate at all timepoints for snails treated with 500 nm particles and slight reduction in hatching rate for snails treated with 1 µm particles. All treatments were 1 ppm.
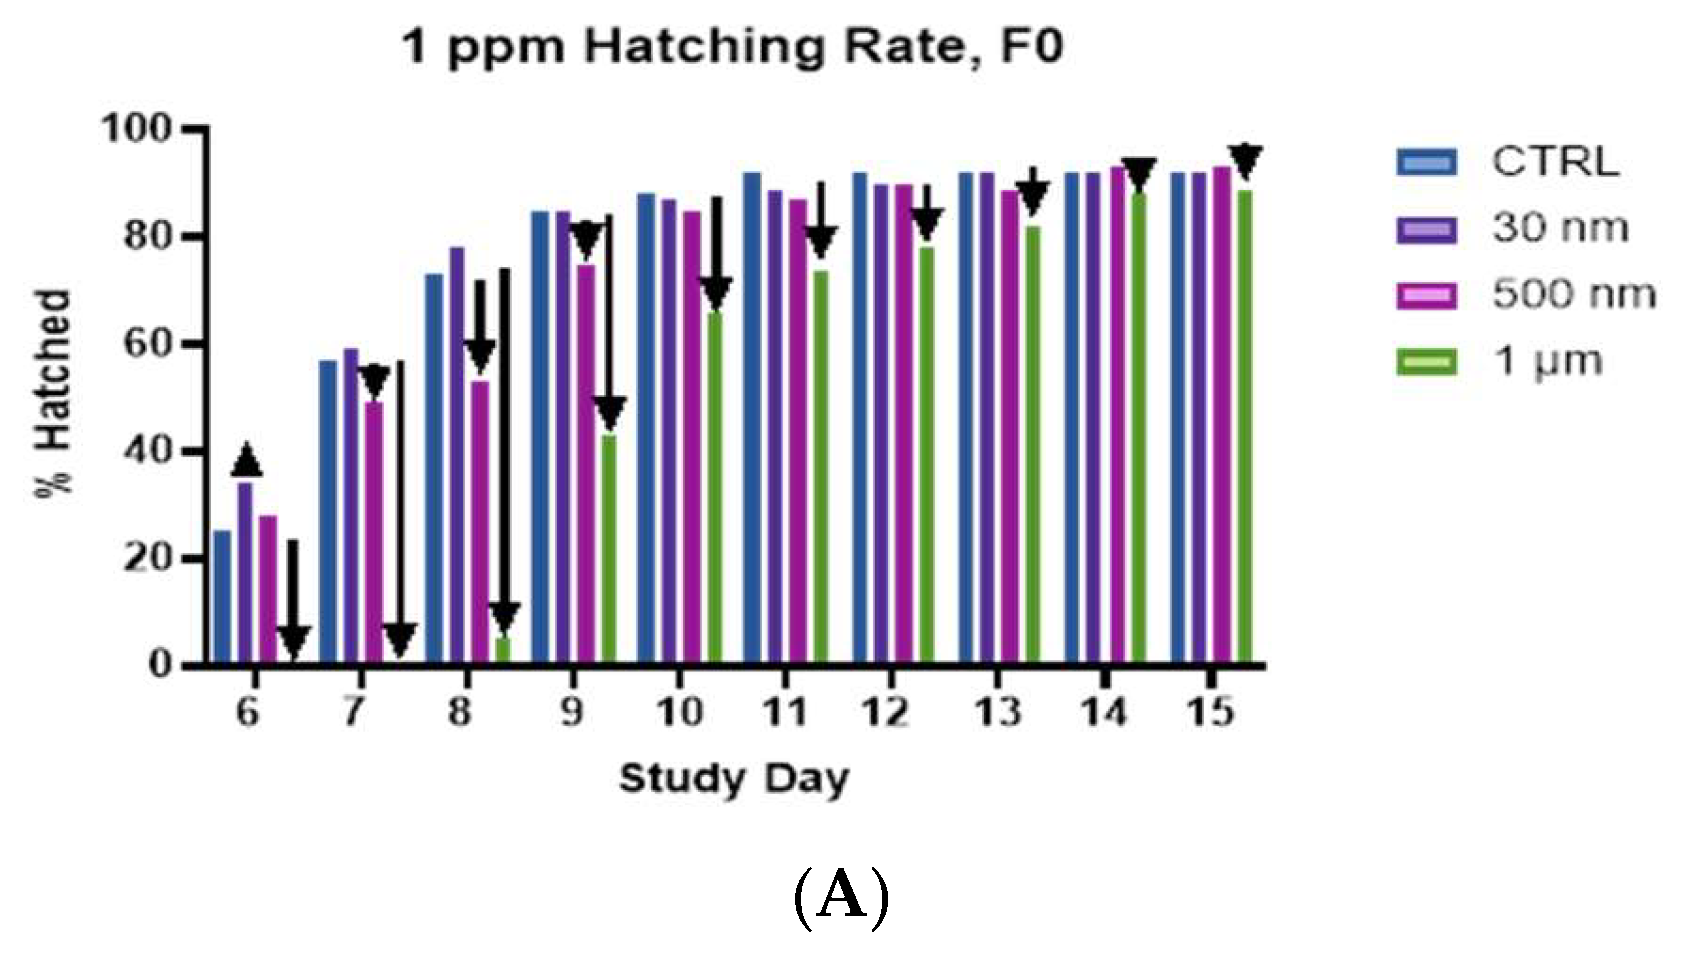
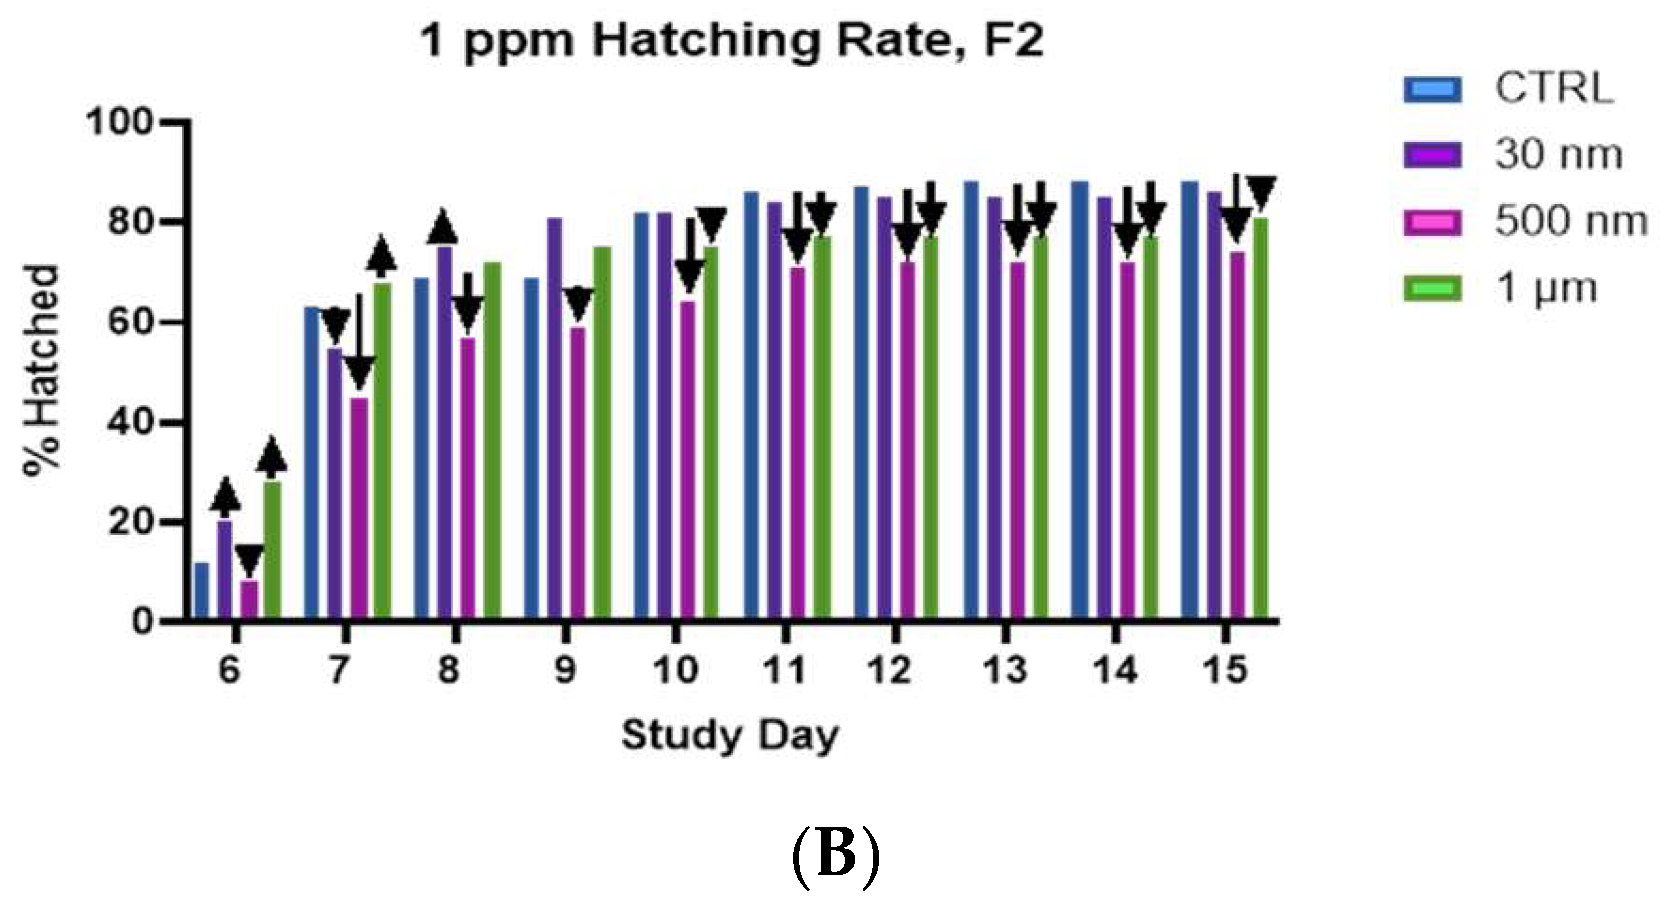
Figure 6.
Mortality rates show dose-dependence for the 30 nm group in the F2 generation.
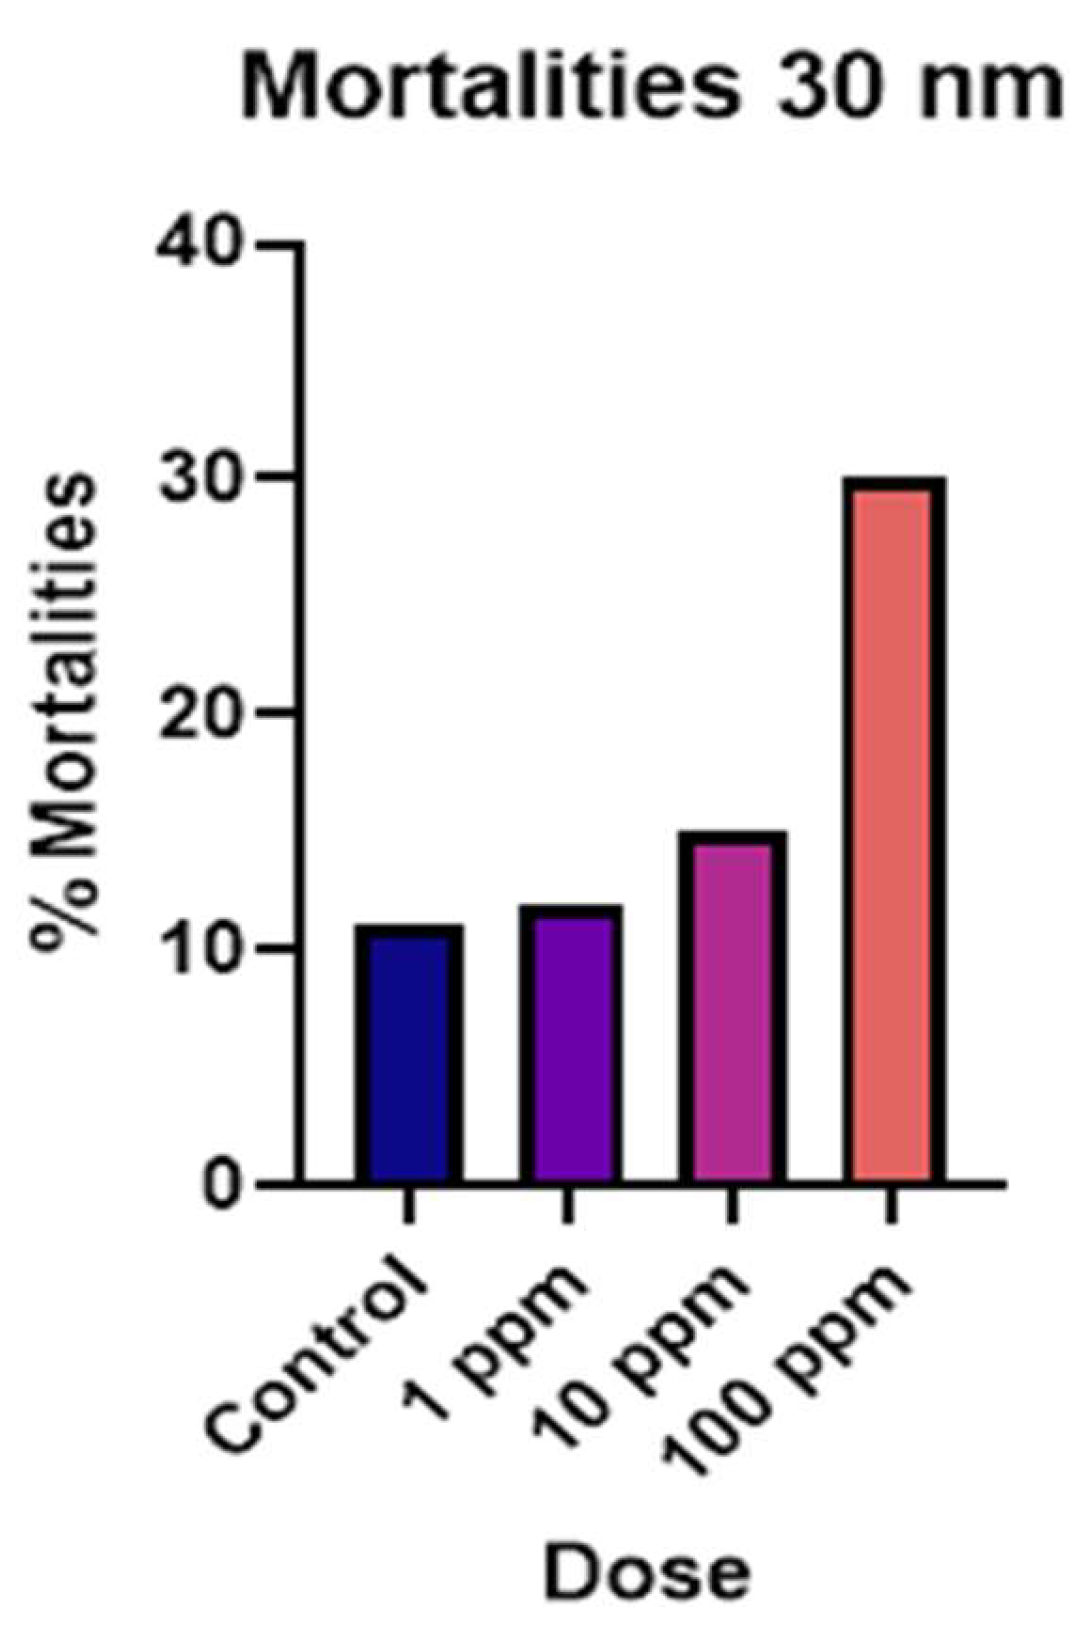
Figure 7.
Hatching rates for F (left) and F2 (right), shows a spike in mortalities in the F0 generation on between days 7-8 that is absent from the F2. We also see that most mortalities are in the 1.0 µm group in the F0, and the 500 nm group in F2. Historical averages are ~5-10% mortalities for controls.
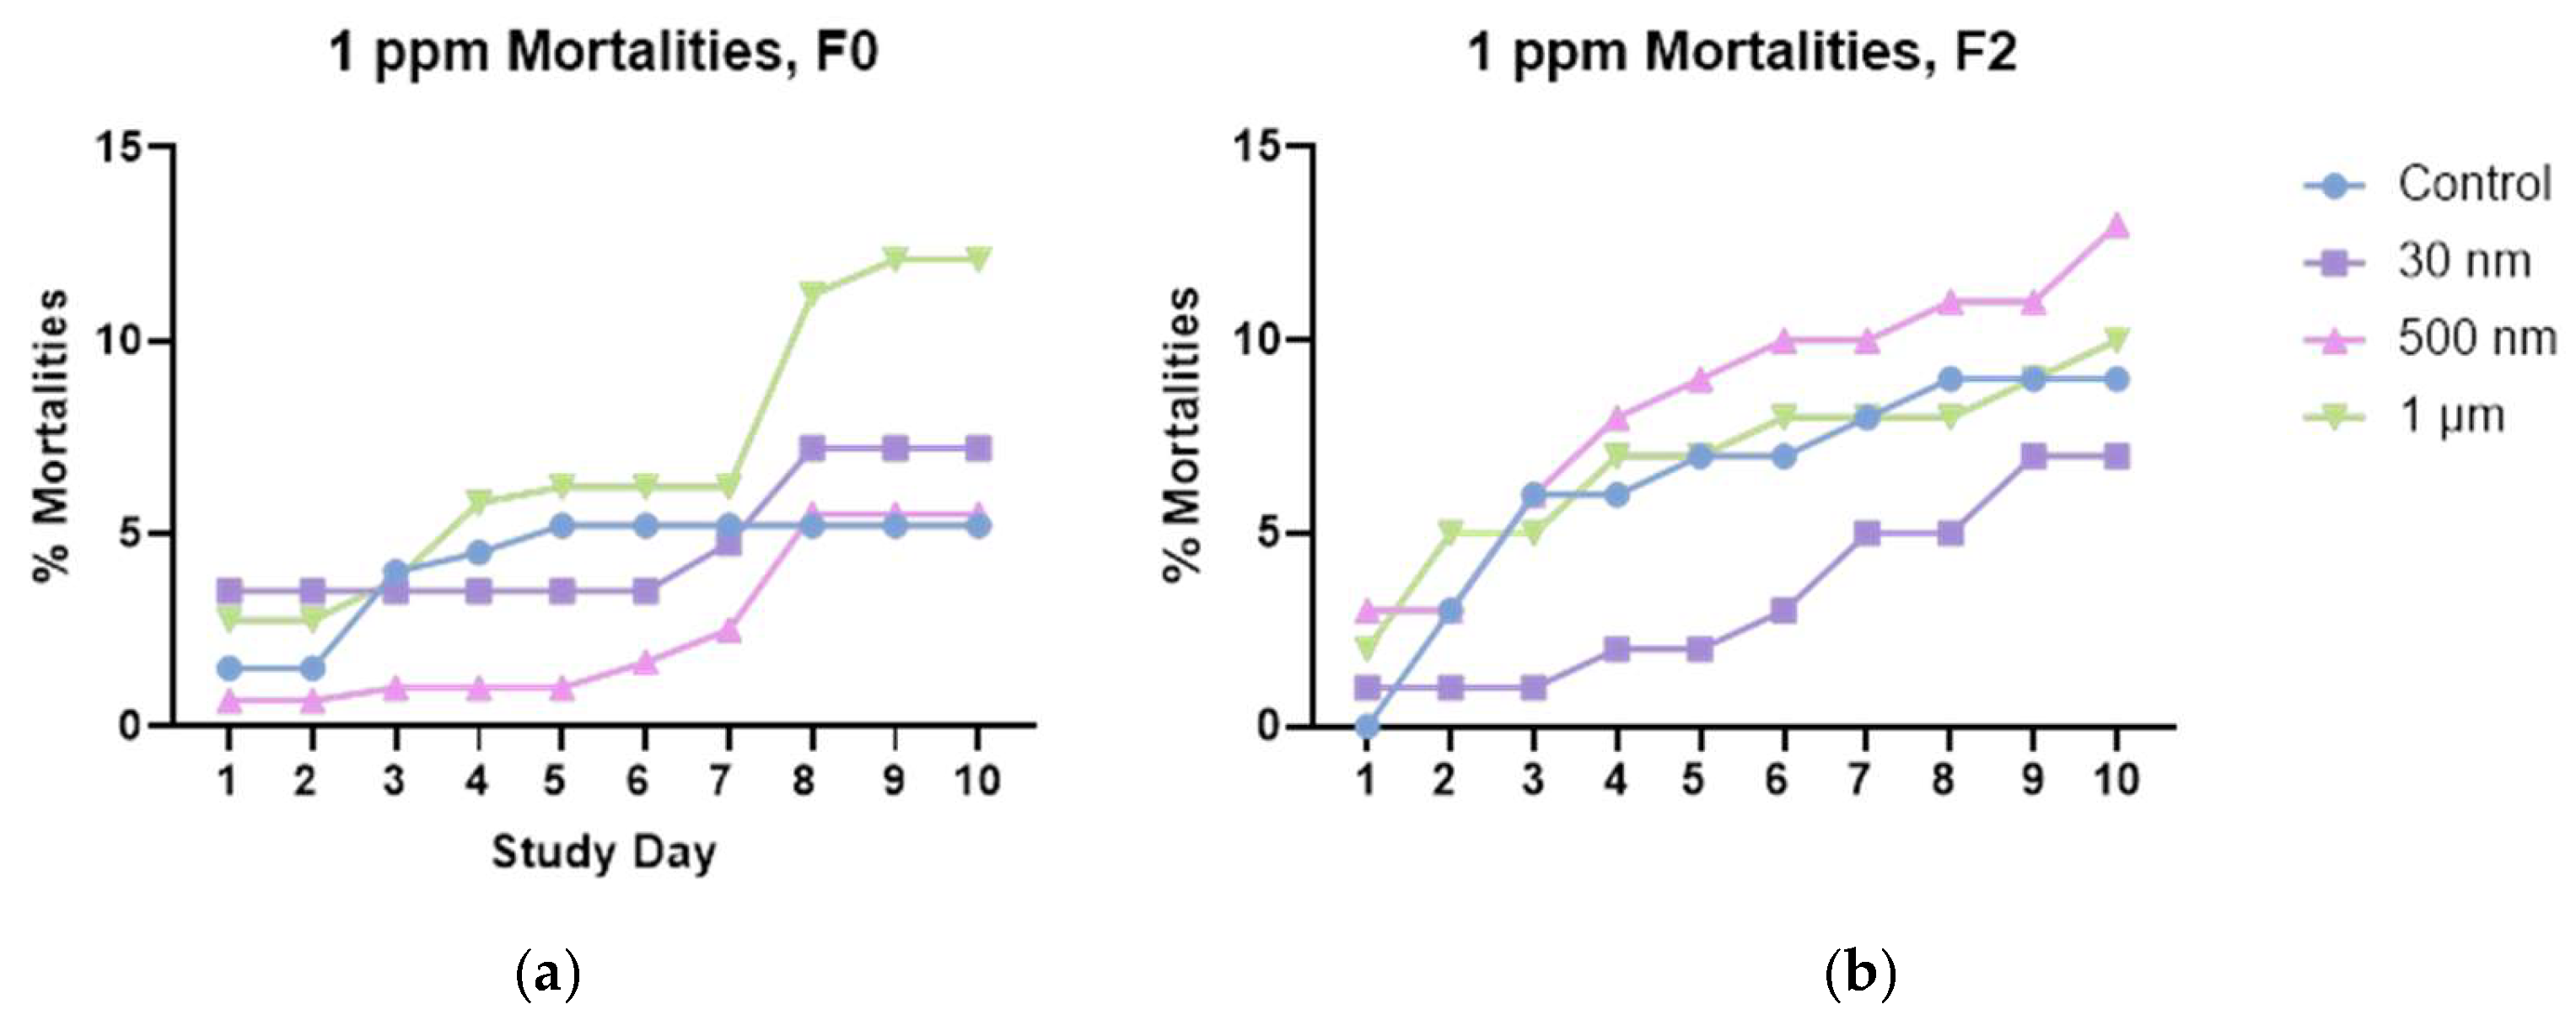
Figure 8.
Relative Gene Expression 2ΔΔCt for HSP70 (heat shock protein) leftmost column, CYP450 (cytochrome oxidase enzyme) center column, and MATN1 matrilin protein, rightmost column for F0 generation (top row) and F2 generation (bottom row). We see upregulation of HSP70 in both F0 and F2 and 48-hrs. This is more pronounced in the F2 generation. We also see significant upregulation of CYP450 in F0 at both 48 and 96-hrs, and in F2 at 96 hours, once again this upregulation is higher in the F2 generation. We also observe significant upregulation of MATN1 in F0 at 96-hrs and in F2 both at 48-hrs as well as 96-hrs (n = 6, * P < 0.05).
Disclaimer/Publisher’s Note: The statements, opinions and data contained in all publications are solely those of the individual author(s) and contributor(s) and not of MDPI and/or the editor(s). MDPI and/or the editor(s) disclaim responsibility for any injury to people or property resulting from any ideas, methods, instructions or products referred to in the content. |
© 2024 by the authors. Licensee MDPI, Basel, Switzerland. This article is an open access article distributed under the terms and conditions of the Creative Commons Attribution (CC BY) license (http://creativecommons.org/licenses/by/4.0/).
Copyright: This open access article is published under a Creative Commons CC BY 4.0 license, which permit the free download, distribution, and reuse, provided that the author and preprint are cited in any reuse.


