
Submitted:
03 December 2024
Posted:
03 December 2024
You are already at the latest version
Abstract
The aim of this study was to clarify the impact of thickness of Pd/Cu membrane on the characteristics of biogas dry reforming (BDR) using Ni/Cr/Ru catalyst. In addition, this study also clarified the impact of reaction temperature, the molar ratio of CH4:CO2, the differential pressure between the reaction chamber and the sweep chamber, and the introduction of a sweep gas on the characteristics of BDR reactor using Pd/Cu membrane and Ni/Cr/Ru catalyst. As a result, this study revealed that the concentration of H2 in the reaction chamber and that in the sweep chamber increased with the increase in the reaction temperature. In addition, this study revealed that the highest concentration of H2 in the reaction chamber and that in the sweep chamber were obtained for the molar ratio of CH4:CO2 = 1.5:1. This study also clarified that the highest concentration of H2 was obtained for the thickness of 40 m, the molar ratio of CH4:CO2 = 1.5:1 and the differential pressure between the reaction chamber and the sweep chamber of 0 MPa without a sweep gas, which was 4890 ppmV in the reaction chamber and 38 ppmV in the sweep chamber, respectively. Under this condition, CH4 conversion, H2 yield and thermal efficiency were 75.0 %, 0.214 % and 2.92 %, respectively.
Keywords:
biogas dry reforming
; membrane reactor
; thickness of membrane
; Ni/Cr/Ru catalyst
; operation condition
1. Introduction
Global warming is a serious problem in the world. There is a lot of promising procedures to solve this problem. One of the procedures is green H2, e.g. H2 production from a renewable energy. This study focuses on a biogas dry reforming (BDR) as a procedure to produce green H2. A biogas is a fuel consisting of CH4 (55-75 vol%) and CO2 (25-45 vol% [1], generally. A biogas is produced from fermentation by the action of anaerobic microorganisms on raw materials, e.g., garbage, livestock excretion, and sewage sludge. In 2020, 1.46 EJ of biogas was produced in the world [2], which was five times as large as that in 2000 [2]. Therefore, this study excepts that the amount of produced biogas increases more and more in the near future.
Generally speaking, a biogas is utilized as a gases fuel for gas engines and micro gas turbines [3]. However, the power generation efficiency becomes low compared to a natural gas due to lower heating value caused by including CO2. Considering to solve this problem, this study proposes the combination system consisting of a BDR reactor with a solid oxide fuel cell (SOFC) [4,5,6]. CO which is a by-product from BDR can be utilized as a fuel for SOFC. Since SOFC can be a co-generation system, the total energy conversion efficiency is higher compared to existing power generation systems, i.e., gas engines and micro gas turbines.
There are many reported researches on BDR [7,8,9,10,11]. This study focuses on the selection of catalyst since it influences the performance of a BDR reactor. According to the literature survey, Ni-based catalysts have been investigated for BDR [7,8,9,10,11]. Ni/Al2O3 catalyst which was synthesized by a conventional wet impregnation performed the CH4 conversion of approximately 100 % and the CO2 conversion of approximately 95 % at 850 °C [7]. The CH4 conversion and the CO2 conversion increased with the increase in the reaction temperature from 700 °C to 850 °C. The CO2 rich condition (CO2/CH4 = 1.2) was slightly better in terms of conversion and it induced a significant reverse water gas shift reaction (RWGS), which provided a low H2/CO ratio and H2 selectivity. Ni3Co supported on Al2O3 performed CH4 conversion of 59.8 % and 96.2 % at 600 °C and 750 °C, respectively [8]. In addition, this catalyst also performed CO2 conversions of 24.4 % and 45.4 % at 600 °C and 750 °C, respectively. Though the significant carbon formation caused the catalyst deactivation, the carbon formation was less at higher reaction temperature. NiCeZrO2 which was prepared by sol-gel method performed the CH4 conversion of 50 % and the CO2 conversion of 50 % at 800 °C [9]. The increase in the molar ratio of CH4:CO2 to 1.5 caused the formation of coke, which was suppressed by the addition of water. Ni/MgO which was prepared by a wet impregnation method performed the CH4 conversion of approximately 70 % and the CO2 conversion of approximately 85 % at 800 °C [10]. According to the investigation on the impact of reaction temperature from 300 °C to 800 °C, the highest CH4 conversion as well as the highest CO2 conversion were obtained at 800 °C. Ni-La/SBA-16 catalyst which was prepared by a hydrothermal process performed the CH4 conversion of approximately 95 % and the CO2 conversion of approximately 93 % at 750 °C [11]. The CH4 conversion and the CO2 conversion increased with the increase in the reaction temperature from 600 °C to 750 °C where the CH4 conversion as well as the CO2 conversion were approximately 70 % at 600 °C.
On the other hand, Ru-based catalysts have been also investigated [12,13,14]. Ru/Ni catalyst which was prepared by a wet impregnation performed the CH4 conversion of approximately 78 % and the CO2 conversion of approximately 72 % at 750 °C [12]. When changing the ratio of Ru to Ni from 0 to 2, the ratio of 0.8 showed the best performance. Ru supported on a binary La2O3-SiO2 catalyst which was prepared by incipient wetness impregnation performed the CH4 conversion of 5.3 % and the CO2 conversion of 5.5 % at 550 °C [13]. Ru-Ni/MgAl2O4 which was prepared by a wet impregnation method performed the CH4 conversion of 93 % and the CO2 conversion of 96 % at 750 °C [14]. When decreasing in the reaction temperature from 750 °C to 600 °C, the CH4 conversion and the CO2 conversion decreased to 65 % and 73 %, respectively.
Although several Ni-based catalysts have been investigated, the Ni/Cr catalyst has not been examined well without the authors’ previous study [5]. In addition, the Ni/Cr/Ru catalyst has not been investigated well without the authors’ previous study [15].
Additionally, it is important to operate at a lower temperature to improve the thermal energy efficiency of BDR since BDR is an endothermic reaction. This study thinks a membrane reactor is an effective procedure to meet this purpose since the H2 production is promoted by means of providing the non-equilibrium state with H2 separation from the reaction site [5]. Though several Pd alloy membranes such as Pd/Ag and Pd/Au are commercialized as well as used for the research, the cost of Pd/Cu is relatively smaller than that of Pd/Ag, Pd/Au and pure Pd. This study thinks the cost is important to apply the system proposed by this study to the industry in the near future. Consequently, this study selected Pd/Cu as H2 separation membrane. The authors’ previous study using Ni/Cr/Ru catalyst [15] used the Pd/Cu membrane whose thickness was 20 μm only. However, there is no study to investigate the impact of thickness of Pd/Cu membrane on the characteristics of BDR using Ni/Cr/Ru catalyst. This study thinks there would be the optimum thickness of Pd/Cu membrane to obtain the higher performance of membrane reactor using Ni/Cr/Ru catalyst proposed by this study, resulting from that the H2 separation rate of H2 separation membrane and the H2 production rate of catalyst are thought to be important to realize the non-equilibrium state of BDR.
Consequently, the aim of this study is to clarify the impact of thickness of Pd/Cu membrane on the characteristics of BDR using Ni/Cr/Ru catalyst. The impact of reaction temperature, the molar ratio of CH4:CO2, the differential pressure between the reaction chamber and the sweep chamber, and the introduction of a sweep gas on the characteristics of BDR reactor using Pd/Cu membrane as well as Ni/Cr/Ru catalyst is investigated. The molar ratio of CH4:CO2 = 1.5:1 simulates a biogas in this study.
The reaction scheme of CH4 dry reforming (DR) is described as follows:
CH4 + CO2 ↔ 2CO + 2H2 + 247 kJ/mol
Additionally, the following reaction schemes can be considered in this study:
where Equation (2) indicates a reverse water gas shift reaction (RWGS), Equation (3) indicates a methanation reaction (MR), and Equation (4) indicates a steam reforming of CH4 (SR). As to a carbon deposition, the following reaction schemes are considered in this study:
CO2 + H2 ↔ CO + H2O + 41 kJ/mol
CO2 + 4H2 ↔ CH4 + 2H2O – 164 kJ/mol
CH4 + H2O ↔ CO + 3H2 + 206 kJ/mol
CH4 ↔ C + 2H2 + 75 kJ/mol
2CO ↔ C + CO2 – 173 kJ/mol
CO2 + 2H2 ↔ C + 2H2O – 90 kJ/mol
CO + H2 ↔ C + H2O – 131 kJ/mol
2. Experiment
2.1. Experimental Set-Up
Figure 1 shows the schematic drawing of the experimental apparatus of this study. The experimental apparatus consists of a gas cylinder, mass flow controllers (S48-32; HORIBA METRON INC. Beijing, China), pressure sensors (KM31), valves, a vacuum pump, a reactor composed of a reaction chamber and a sweep chamber, and gas sampling taps. The reactor is placed in an electric furnace. This study controls the temperature in the electric furnace by far-infrared heaters (MCHNS1; MISUMI, Tokyo, Japan). CH4 gas whose purity is over 99.4 vol% and CO2 gas whose purity is over 99.9 vol% are controlled by the mass flow controllers and mixed before flowing into the reaction chamber. We measure the pressure of the mixed gas at the inlet of the reaction chamber by means of pressure sensors. We control Ar gas whose purity is over 99.99 vol% by a mass flow controller as a sweep gas and measure the pressure of Ar gas by a pressure sensor. We suction the exhausted gases at the outlet of the reaction chamber and sweep chamber by means of gas syringe via gas sampling taps. We measure the concentration of sampled gas by a TCD gas chromatograph (GL Science, Tokyo, Japan). The minimum resolution of the TCD gas chromatograph and the methanizer is 1 ppmV. We measure the gas pressure at the outlet of the reactor by means of a pressure sensor. We measure the gas concentration and pressure at the outlet of the reaction chamber and the sweep chamber, respectively. We install the valves at the outlet of the reaction chamber and close them when we flow the reaction gas consisting of CH4 and CO2 into the reaction chamber. As a result, H2 in the reaction chamber after contacting the Ni/Cr/Ru catalyst penetrates through the H2 separation membrane, i.e. Pd/Cu membrane, and flows into the sweep chamber. In other words, no H2 flows out of the reaction chamber unless it penetrates through the H2 separation membrane.
Figure 2 shows the details of the reactor in this study. The reactor is composed of a reaction chamber, a sweep chamber, and a H2 separation membrane, i.e. Pd/Cu membrane. The reaction chamber and the sweep chamber are made of stainless steel with the size of 40 mm×100 mm×40 mm. The volume of reaction space is 16×10-5 m3. We charge a porous Ni/Cr/Ru (Ni: 69.2 wt%, Cr: 29.6 wt%, Ru: 1.2 wt%) in the reaction chamber. The mean hole size of the Ni/Cr/Ru catalyst used in this study is 1.95 mm. According to the manufacture’s brochure, the porosity of the Ni/Cr/Ru catalyst used in this study is 0.93. The weight of Ni/Cr/Ru catalyst is 66.3 g.
Figure 3 shows a photograph charged in the reaction chamber in this study [15]. We selected a Pd/Cu membrane (Cu: 40 wt%; Tanaka Kikinzoku, Tokyo, Japan) as a H2 separation membrane. The thickness of the Pd/Cu membrane was changed by 20 μm, 40 μm and 60 μm. We measured the temperatures at the inlet, the middle, and the outlet of the reaction chamber and the sweep chamber by means of K-type thermocouples. We controlled the initial operation temperature and set by a far-infrared heater and thermocouples. We saved the data of measured temperature and pressure by means of a data logger (GL240; Graphic Corporation, Tokyo, Japan).
Table 1 lists the experimental parameters applied in this study. The molar ratio of provided CH4:CO2 was changed by 1.5:1, 1:1 and 1:1.5. The molar ratio of CH4:CO2 simulated biogas in this study. According to the authors’ previous study [16], the feed ratio of sweep gas to supply gas, which is defined as the flow rate of sweep gas divided by the flow rate of supply gas composed of CH4 and CO2, was set at 1.0. This is the optimum feed ratio of sweep gas to supply gas according to the authors’ previous study [16]. We investigate the impact of the installation of sweep gas. We think it is necessary to separate H2 from the membrane reactor with a sweep gas and extract the H2 from the sweep gas for the purpose of applying the system proposed by the authors. We have to consider that the additional energy and equipment are necessary to install the system proposed by this study in the actual industry. On the other hand, the additional energy and equipment are not necessary if we can separate H2 without a sweep gas from the membrane reactor. Consequently, this study has conducted a comparison of the presence vs. absence of sweep gas. We changed the differential pressure between the reaction chamber and the sweep chamber by 0 MPa, 0.010 MPa and 0.020 MPa. This study measures and confirms the differential pressure by the pressure sensors installed at the outlet of the reaction chamber and the sweep chamber. As to the differential pressure between the reaction chamber and the sweep chamber, we had tried to carry out the experiment at the differential pressure of 0.030 MPa and the temperature of 600 °C. As a result, the hole was made within the Pd/Cu membrane. Consequently, this study reports the results below 0.020 MPa. We changed the initial reaction temperature by 400 °C, 500 °C and 600 °C. We measure the initial reaction temperature by thermocouples before flowing the mixed gas of CH4 and CO2 as well as the sweep gas into the reactor. The temperature of the reaction chamber decreased by approximately 3 °C during the experiment due to the endothermic reactions, which is shown above. The gas concentrations at the outlet of the reaction chamber and the sweep chamber were detected by the FID gas chromatograph (GC320; GL Science) and methanizer (MT221; GL Science). We show the average data of five trials for each experimental conditions investigated in this study in the following figures. The distribution of each gas concentration is below 10 %.
2.2. Assessment Factor to Evaluate the Performance of BDR Mmbrane Ractor in This Study
This study conducts the evaluation on the performance of the proposed BDR membrane reactor by examining gas concentration at the outlet of the reaction chamber and the sweep chamber. This study evaluates CH4 conversion (XCH4), CO2 conversion (XCO2), H2 yield (YH2), H2 selectivity (SH2), and CO selectivity (SCO) by using these data. This study defines these assessment factors as follows:
where CCH4, in indicates the concentration of CH4 at the inlet of the reaction chamber [mol],
XCH4 = (CCH4, in – CCH4, out)/(CCH4, in)×100
XCO2 = (CCO2, in – CCO2, out)/(CCO2, in)×100
YH2 = (1/2)(CH2, out)/(CH4, in)×100
SH2 = (CH2, out)/(CH2, out + CCO, out)×100
SCO = (CCO, out)/(CH2, out + CCO, out)×100
CCH4, out indicates the concentration of CH4 at the outlet of the reaction chamber [mol],
CCO2, in indicates the concentration of CO2 at the inlet of the reaction chamber [mol],
CCO2, out indicates the concentration of CO2 at the outlet of the reaction chamber [mol],
CH2, out indicates the concentration of H2 at the outlet of the reaction chamber and the sweep
chamber [mol], and CCO, out indicates the concentration of CO at the outlet of the reaction
chamber [mol].
Additionally, this study evaluates H2 recovery (H) and permeation flux (F) as follows:
where CH2, out, sweep indicates the concentration of H2 at the outlet of the sweep chamber [mol],
H = (CH2, out, sweep)/(CH2, out, sweep + CH2, out, react)×100
CH2, out, react indicates the concentration of H2 at the outlet of the reaction chamber [mol], P
indicates the permeation factor [mol/(m∙s∙Pa0.5)], Preact, ave indicates the average pressure of
the reaction chamber [MPa], Psweep, ave indicates the average pressure of the sweep chamber
[MPa], and indicates the thickness of the Pd/Cu membrane [m].
Furthermore, this study also evaluates the thermal efficiency of the membrane reactor (), which is defined as follows:
where QH2 indicates the heating value of produced H2 based on the lower heating value
[W], WR.C. indicates the amount of pre-heat of supply gas for the reaction chamber [W],
WS.C. indicates the amount of pre-heat of the sweep gas for the sweep chamber [W], and
Wp indicates the pump power to provide the differential pressure between the reaction
chamber and the sweep chamber [W].
3. Results and Discussion
3.1. Impact of Thickness of Pd/Cu Membrane on Each Gas Concentration in the Reaction Chamber and the Concentration of H2 in the Sweep Chamber When Changing the Initial Reaction Temperature and the Differential Pressure Between the Reaction Chamber and the Sweep Chamber with and Without a Sweep Gas
Figure 4 and Figure 5 show the impact of thickness of Pd/Cu membrane on each gas concentration in the reaction chamber and the concentration of H2 in the sweep chamber changing the initial reaction temperature (it is described as reaction temperature later) and the differential pressure between the reaction chamber and the sweep chamber without a sweep gas, respectively. In addition, Figure 6 and Figure 7 show the impact of thickness of Pd/Cu membrane on each gas concentration in the reaction chamber and the concentration of H2 in the sweep chamber changing the reaction temperature and the differential pressure between the reaction chamber and the sweep chamber with a sweep gas, respectively. In these figures, the reaction temperature was changed by 400 °C, 500 °C and 600 °C and the differential pressure between the reaction chamber and the sweep chamber was changed by 0 MPa, 0.010 MPa and 0.020 MPa. Moreover, the molar ratio of CH4:CO2 is 1.5:1 in these figures. This study shows the results with the gas concentration in the unit of ppmV in these figures. However, it can be converted into the unit of mol. Regarding the gas concentration, 10,000 ppmV is 1 vol%. The gas volume can be calculated by multiplying the gas concentration by the volume of the reaction chamber, i.e. 40 mm×100 mm×40 mm or the volume of the sweep chamber, i.e., 40 mm×100 mm×40 mm. After that, the unit of gas volume, e.g., m3 can be converted into mol by multiplying 22.4 kmol/m3. Since the volume of reaction chamber and sweep chamber as well as the conversion factor of 22.4 kmol/m3 are constant, this study thinks that the gas concentration in the unit of ppmV can be used as an evaluation value for the performance of the reaction.
According to Figure 4 and Figure 6, we can see that the concentration of H2 in the reaction chamber increases with the increase in the reaction temperature irrespective of the thickness of Pd/Cu membrane, the differential pressure between the reaction chamber and the sweep chamber and existing a sweep gas or not. Since DR, RWGS and SR are endothermic reactions as shown in Equations (1), (2) and (4), the reaction progresses well with the increase in the reaction temperature according to the theoretical kinetic study [17].
On the other hand, we can see from Figure 5 and Figure 7 that the concentration in the sweep chamber increases with the increase in the reaction temperature irrespective of the thickness of Pd/Cu membrane, the differential pressure between the reaction chamber and the sweep chamber and existing a sweep gas or not. Since the concentration of H2 in the reaction chamber is higher at higher reaction temperature, the driving force to penetrate through the Pd/Cu membrane becomes higher because of the high H2 partial differential pressure between the reaction chamber and the sweep chamber, i.e., a high concentration difference of H2 between the reaction chamber and the sweep chamber. Consequently, a higher concentration of H2 in the sweep chamber is obtained.
Considering the impact of thickness of Pd/Cu membrane on the concentrations of H2 in the reaction chamber and the sweep chamber, the highest concentrations of H2 in the reaction chamber and the sweep chamber are obtained for the thickness of 40 μm mainly among the investigated conditions, i.e. the reaction temperature, the differential pressure between the reaction chamber and the sweep chamber, and existing a sweep gas or not. It can be thought that H2 might be penetrated through H2 separation membrane when the thickness of H2 separation membrane is thinner. However, the optimum thickness of Pd/Cu membrane is 40 μm in this study. If the H2 separation rate of the Pd/Cu membrane is higher than the reaction rate of Ni/Cr/Ru catalyst used in this study, the effect of H2 separation, which provides a non-equilibrium state in DR, is not effective sufficiently [15]. This study thinks that it is necessary to match the H2 production rate of the Ni/Cr/Ru catalyst and the H2 separation rate of the Pd/Cu separation membrane in order to obtain the non-equilibrium state of DR [15]. When using the thicker membrane, i.e., the thickness of 60 μm, the H2 separation rate is too low due to big resistance to separate H2. On the other hand, the H2 separation rate is too fast when using the thinner membrane, i.e., the thickness of 20 μm due to small resistance to separate H2. Consequently, this study thinks that the optimum thickness of Pd/Cu membrane is 40 μm in this study.
3.2. Impact of Thickness of Pd/Cu Membrane on Each Gas Concentration in the Reaction Chamber and the Concentration of H2 in the Sweep Chamber When Changing the Molar Ratio and the Differential Pressure Between the Reaction Chamber and the Sweep Chamber with and Without a Sweep Gas
Figure 8 and Figure 9 show the impact of thickness of Pd/Cu membrane on each gas concentration in the reaction chamber and the concentration of H2 in the sweep chamber changing the molar ratio and the differential pressure between the reaction chamber and the sweep chamber without a sweep gas, respectively. In addition, Figure 10 and Figure 11 show the impact of thickness of Pd/Cu membrane on each gas concentration in the reaction chamber and the concentration of H2 in the sweep chamber changing the molar ratio and the differential pressure between the reaction chamber and the sweep chamber with a sweep gas, respectively. In these figures, the molar ratio of CH4:CO2 was changed by 1.5:1, 1:1 and 1:1.5 and the differential pressure between the reaction chamber and the sweep chamber was changed by 0 MPa, 0.010 MPa and 0.020 MPa. Moreover, the reaction temperature is 600 °C in these figures.
We can see from Figure 8 and Figure 10 that the highest concentration of H2 in the reaction chamber is obtained for the molar ratio of CH4:CO2 = 1.5:1 among the investigated molar ratios irrespective of the thickness of Pd/Cu membrane, the differential pressure between the reaction chamber and the sweep chamber as well as existing a sweep gas or not. We can claim that this tendency matches with the authors’ previous studies investigating Ni, Ni/Cr and Ni/Cr/Ru catalysts [5,15]. The reaction mechanism to explain why the highest concentration of H2 is obtained in the case of the molar ratio of CH4:CO2 = 1.5:1 can be explained as follows [5]: since the amount of CH4 in this case, (i) H2 is produced by the reactions shown in Equations (1) and (5), (ii) the produced H2 is consumed by the reaction shown in Equation (2), resulting that CO is produced, (iii) a part of CO produced by the reactions shown in Equations (1) and (2) is consumed by Equation (6), and (iv) H2O produced by the reactions shown in Equations (2) and (3) is consumed during Equation (4).
In addition, it is seen from Figure 9 and Figure 11 that the concentration of H2 in the sweep chamber is the highest for the molar ratio of CH4:CO2 = 1.5:1 among the investigated molar ratios irrespective of the thickness of Pd/Cu membrane, the differential pressure between the reaction chamber and the sweep chamber as well as existing a sweep gas or not. Since the concentration of H2 is the reaction chamber in the case of the molar ratio of CH4:CO2 = 1.5:1 is higher compared to the other molar ratios, the driving force to penetrate H2 through the Pd/Cu membrane becomes larger because of the high H2 partial pressure between the reaction chamber and the sweep chamber, i.e., a large concentration difference of H2 between the reaction chamber and the sweep chamber. Consequently, a higher concentration of H2 in the sweep chamber is obtained in the case of the molar ratio of CH4:CO2 = 1.5:1.
Moreover, it can be seen from Figure 8, Figure 9 and Figure 10 that the concentrations of CO, CH4 and CO2 are higher than those of H2 in the reaction chamber and the sweep chamber. This study considers the reactions shown by Equations (1) – (8). The following steps of reactions might have occurred [15]:
- (i)
- H2 is produced by Equations (1) and (5).
- (ii)
- The produced H2 is consumed by Equations (2) and (3), resulting that CO, CH4 and H2O are produced.
- (iii)
- The produced CO is consumed by Equations (6) and (8), resulting that C, CO2 and H2O are produced.
Consequently, this study thinks that the concentrations of CO, CH4 and CO2 are higher than those of H2 in the reaction chamber and the sweep chamber. After all experiments including 54 experimental conditions were conducted for each thickness of Pd/Cu membrane, the weights of the Ni/Cr/Ru catalyst for the thickness of 20 μm, 40 μm and 60 μm have increased by 0.108 g, 0.017 g and 0.315 g, respectively, indicating that a carbon is produced. Though the amount of produced carbon was small, a carbon deposition was confirmed in this study. Additionally, regarding H2O production which is explained by Equations (2) and (3), it was confirmed by naked eye observation using a gas bag as shown in Figure 12. The methanizer and TCD gas chromatograph used in this study cannot detect H2O since they are destroyed by absorbing H2O on the surface of the column. Consequently, this study adopted a gas bag to capture H2O exhausted from the reactor installed at the outlet of the reactor. We can observe that the existence of H2O by the naked eye since the phase of H2O is changed from a gas into a liquid [15]. In Figure 12, the left figure shows the gas bag used to capture H2O, remaining in the red circle shown in Figure 12. The charged color parts on the white bar to capture H2O shown in the right figure in Figure 12 indicates the production of liquid H2O. In Figure 12, the white bar is used to show the existence of liquid H2O. Though H2O exists as a vapor during the experiment due to the reaction temperature over 400 °C, the phase of H2O changes into a liquid due to a temperature drop after capturing H2O by the gas bag.Considering the impact of thickness of Pd/Cu membrane, the highest concentration of H2 is obtained for the thickness of 40 μm mainly among the investigated conditions, i.e. the molar ratio of CH4:CO2, the differential pressure between the reaction chamber and the sweep chamber, and existing a sweep gas or not. Since the concentration of H2 is higher in the case of 40 μm, the above described reaction steps (ii) and (iii) might not occur strongly. As discussed above, it can be thought that H2 might be penetrated through H2 separation membrane when the thickness of H2 separation membrane is thinner. However, the optimum thickness of Pd/Cu membrane is 40 μm in this study. If the H2 separation rate of the Pd/Cu membrane is higher than the reaction rate of Ni/Cr/Ru catalyst used in this study, the effect of H2 separation, which provides a non-equilibrium state in DR, is not effective sufficiently [15]. This study thinks that it is necessary to match the H2 production rate of the Ni/Cr/Ru catalyst and the H2 separation rate of the Pd/Cu separation membrane in order to obtain the non-equilibrium state of DR [15]. Therefore, this study claims that the optimum thickness of Pd/Cu membrane is 40 μm.
3.3. Comparison of Assessment Factors Among the Investigated Experimental Conditions
To investigate the performance of the proposed membrane reactor using the Ni/Cr/Ru catalyst and Pd/Cu membrane, Table 2, Table 3 and Table 4 show the comparison of CH4 conversion, CO2 conversion, H2 yield, H2 selectivity, CO2 selectivity, H2 recovery, permeation flux and thermal efficiency for the different thicknesses of Pd/Cu membrane, the molar ratios of CH4:CO2, and the differential pressures between the reaction chamber and the sweep chamber. The reaction temperature is 600 °C in this study.
According to Table 2, Table 3 and Table 4, we can see that the CO2 conversion indicates a negative value from -46.0 % to -113 % irrespective of investigated conditions. It can be thought that a reaction consuming CH4 and a producing CO2 occur [5,15]. Additionally, we can see from Table 2, Table 3 and Table 4 that the CO selectivity is much higher than the H2 selectivity irrespective of investigated conditions, which is similar to the authors’ previous studies [5,15]. On the other hand, we can see from Table 2, Table 3 and Table 4 that the CH4 conversion indicates a positive value from 67.1 % to 88.2 %. It can be thought that CH4 is consumed by DR and Equation (5). It is seen from Figure 5, Figure 7, Figure 9 and Figure 11 that H2 is moved to the sweep chamber. However, it is also seen from Figure 6, 8, Figure 10 and Figure 12 that some H2 produced remains in the reaction chamber, indicating that all H2 does not move to the sweep chamber by penetrating through Pd/Cu membrane. Consequently, this study claims that the following reaction mechanism can be explained [5,15]: (i) H2 is produced by the reactions shown by Equations (1) and (5); (ii) the produced H2 is consumed by the reaction shown by Equation (2), resulting that CO is produced; (iii) a part of CO produced by the reactions shown by Equations (1) and (2) is consumed during the reaction shown by Equation (6); and (vi) H2O produced during the reactions shown by Equations (2) and (3) is consumed by Equation (4). As discussed before, the production of carbon as well as H2O was confirmed.
According to the investigation in this study, the highest concentration of H2 was obtained for the thickness of 40 μm, the molar ratio of CH4:CO2 = 1.5:1 and the differential pressure between the reaction chamber and the sweep chamber of 0 MPa without a sweep gas, which is 4890 ppmV in the reaction chamber and 38 ppmV in the sweep chamber, respectively. It is revealed from Table 2, Table 3 and Table 4 that CH4 conversion, H2 yield and thermal efficiency are 75.0 %, 0.214 % and 2.92 %, respectively under this condition. Though the CH4 conversions obtained in this study are competitive to the previous studies [7,8,9,10,11], the H2 yield and the thermal efficiency are still low. Therefore, this study suggests the following approaches to improve the performance of proposed membrane reactor using Ni/Cr/Ru catalyst and Pd/Cu membrane: (i) to optimize the catalyst shape and composition (the pore size and the weight ratio of Ni, Cr and Ru, (ii) to optimize the thickness and the composition of Pd/Cu membrane, (iii) to match the H2 separation rate of Pd/Cu membrane and the H2 production rate of Ni/Cr/Ru catalyst, which can decide the optimum operation condition. This study would like to investigate these subjects in the near future.
4. Conclusions
This study has conducted the investigation to reveal the impact of thickness of Pd/Cu membrane on the characteristics of BDR using Ni/Cr/Ru catalyst. This study has also investigated the impact of reaction temperature, the molar ratio of CH4:CO2, the differential pressure between the reaction chamber and the sweep chamber, and the introduction of a sweep gas on the characteristics of BDR reactor using Pd/Cu membrane as well as Ni/Cr/Ru catalyst. As a result, this study can draw the following conclusions:
- (i)
- It is revealed that the concentration of H2 in the reaction chamber increases with the increase in the reaction temperature irrespective of the thickness of Pd/Cu membrane, the differential pressure between the reaction chamber and the sweep chamber and existing a sweep gas or not. The reaction progresses well with the increase in the reaction temperature since DR, RWGS and SR are endothermic reactions.
- (ii)
- It is revealed that the concentration in the sweep chamber increases with the increase in the reaction temperature irrespective of the thickness of Pd/Cu membrane, the differential pressure between the reaction chamber and the sweep chamber and existing a sweep gas or not. When the concentration of H2 in the reaction chamber is higher at higher reaction temperature, the driving force to penetrate through the Pd/Cu membrane is higher due to the high H2 partial differential pressure between the reaction chamber and the sweep chamber.
- (iii)
- It is revealed that the highest concentration of H2 in the reaction chamber as well as that in the sweep chamber are obtained for the molar ratio of CH4:CO2 = 1.5:1 among the investigated molar ratios irrespective of the thickness of Pd/Cu membrane, the differential pressure between the reaction chamber and the sweep chamber as well as existing a sweep gas or not.
- (iv)
- The highest concentration of H2 is obtained for the thickness of 40 μm mainly among the investigated conditions, i.e. the reaction temperature, the molar ratio of CH4:CO2, the differential pressure between the reaction chamber and the sweep chamber, and existing a sweep gas or not. This study claims that the optimum thickness is 40 μm.
- (v)
- It is clarified that the highest concentration of H2 is obtained for the thickness of 40 μm, the molar ratio of CH4:CO2 = 1.5:1 and the differential pressure between the reaction chamber and the sweep chamber of 0 MPa without a sweep gas, which is 4890 ppmV in the reaction chamber and 38 ppmV in the sweep chamber, respectively. Under this condition, CH4 conversion, H2 yield and thermal efficiency are 75.0 %, 0.214 % and 2.92 %, respectively.
- (vi)
- In the near future, the following subjects can be considered: to optimize the catalyst shape and composition (the pore size and the weight ratio of Ni, Cr and Ru); to optimize the thickness and the composition of Pd/Cu membrane; to match the H2 separation rate of Pd/Cu membrane and the H2 production rate of Ni/Cr/Ru catalyst, deciding the optimum operation condition.
Author Contributions
Conceptualization and writing—original draft preparation, A.N.; methodology and data curation, M.I. and T.H.; software and validation, S.Y. and R.I.; writing—review and editing, M.L.K..
Funding
This research was funded by KRI as the 19th bud flush research.
Data Availability Statement
The authors agree to share the data of the article published in this journal.
Conflicts of Interest
The authors declare no conflicts of interest.
References
- Kalai, D.Y.; Stangeland, K.; Jin, R.; Tucho, W.M.; Yu, Z. Biogas dry reforming for syngas production on La promoted hydrotalcitederived Ni Catalyst. Int. J. Hydrogen Energy 2018, 43, 19438–19450. [Google Scholar] [CrossRef]
- World Bioenergy Association. Available online: https://worldbioenergy.org/global-bioenergy-statistics (accessed on 7 November 2024).
- The Japan Gas Association. Available online: https://www.gas.or.jp/gas-life/biogas/ (accessed on 7 November 2024).
- Nishimura, A.; Takada, T.; Ohata, S.; Kolhe, M.L. Biogas dry reforming for hydrogen through membrane reactor utilizing negative pressure. Fuels 2021, 2, 194–209. [Google Scholar] [CrossRef]
- Nishimura, A.; Hayashi, Y.; Ito, S.; Kolhe, M.L. Performance analysis of hydrogen production for a solid oxide fuel cell system using a biogas dry reforming membrane reactor with Ni and Ni/Cr catalysts. Fuels 2023, 4, 295–313. [Google Scholar] [CrossRef]
- Nishimura, A.; Sato, R.; Hu, E. An energy production system powered by solar heat with biogas dry reforming reactor and solar heat with biogas dry reforming reactor and solid oxide fuel cell. Smart Grid and Renew. Energy 2023, 14, 85–106. [Google Scholar] [CrossRef]
- Yoo, E.; Choi, D.S.; Kim, J.; Kim, Y.H.; Kim, N.Y.; Joo, B. Effects of operating parameters and feed gas compositions on the dry reforming of methane over the Ni/Al2O3 catalyst. catalysts 2023, 13. [Google Scholar] [CrossRef]
- Chaudhary, P.K.; Deo, G. Process and catalyst improvements for the dry reforming of methane. Chemical Engineering and Science 2023, 276. [Google Scholar] [CrossRef]
- Marinho, A.L.A.; Rabelo-Neto, R.C.; Bion, N.; Toniolo, F.S.; Noronha, B. Dry reforming of methane over embedded Ni nanoparticles in CeZrO2: effect of Ce/Zr ratio and H2O addition. International Journal of Hydrogen Energy 2024, 71, 1151–1163. [Google Scholar] [CrossRef]
- Gao, Y.; Jiang, J.; Meng, Y.; Ju, T.; Hao, S. Influence of H2S and NH3 on biogas dry reforming using Ni catalyst: a study on single and synergetic effect. Front. Environ. Sci. Eng. 2023, 17. [Google Scholar] [CrossRef]
- Kiani, P.; Meshksar, M.; Rahimpour, M.R. Biogas reforming over La-promoted Ni/SBA-16 catalyst for syngas production: catalytic structure and process activity investigation. International Journal of Hydrogen Energy. 2023, 48, 6262–6274. [Google Scholar] [CrossRef]
- Miao, C.; Chen, S.; Shang, K.; Liang, L.; Ouyang, J. Highly active Ni-Ru bimetallic catalyst integrated with MFI zeolite loaded cerium zirconium oxide for dry reforming of methane. ACS Applied Materials & Interfaces. 2022, 14, 47616–47632. [Google Scholar]
- Fontana, A.D.; Faroldi, B.; Cornaglia, L.M.; Tarditi, A.M. Development of catalytic membranes over PdAu selective films for hydrogen production through the dry reforming of methane. Molecular Catalysis. 2020, 481. [Google Scholar] [CrossRef]
- Andraos, S.; Abbas-Ghaleb, R.; Chlala, D.; Vita, A.; Italiano, C.; Lagana, M.; Pino, L.; Nakhl, M.; Specchia, S. Production of hydrogen by methane dry reforming over ruthenium-nickel based catalysts deposited on Al2O3, MgAl2O4, and YSZ. International Journal of Hydrogen Energy. 2019, 44, 25706–25716. [Google Scholar] [CrossRef]
- Nishimura, A.; Ichikawa, M.; Yamada, S.; Ichii, R. The characteristics of a Ni/Cr/Ru catalyst for a biogas dry reforming membrane reactor using a Pd/Cu membrane and a comparison of it with a Ni/Cr catalyst. hydrogen. 2024, 5, 414–435. [Google Scholar] [CrossRef]
- Nishimura, A.; Ohata, S.; Okukura, K.; Hu, E. The impact of operating conditions on the performance of CH4 dry reforming membrane reactor for H2 production. Journal of Energy and Power Technology. 2020, 2. [Google Scholar] [CrossRef]
- Cherbanski, R.; Kotkowski, T.; Molga, E. Thermogravimetiric analysis of coking during dry reforming methane. International Journal of Hydrogen Energy. 2023, 48, 7346–7360. [Google Scholar] [CrossRef]
Figure 1.
Schematic drawing of experimental set-up [5].
Figure 1.
Schematic drawing of experimental set-up [5].
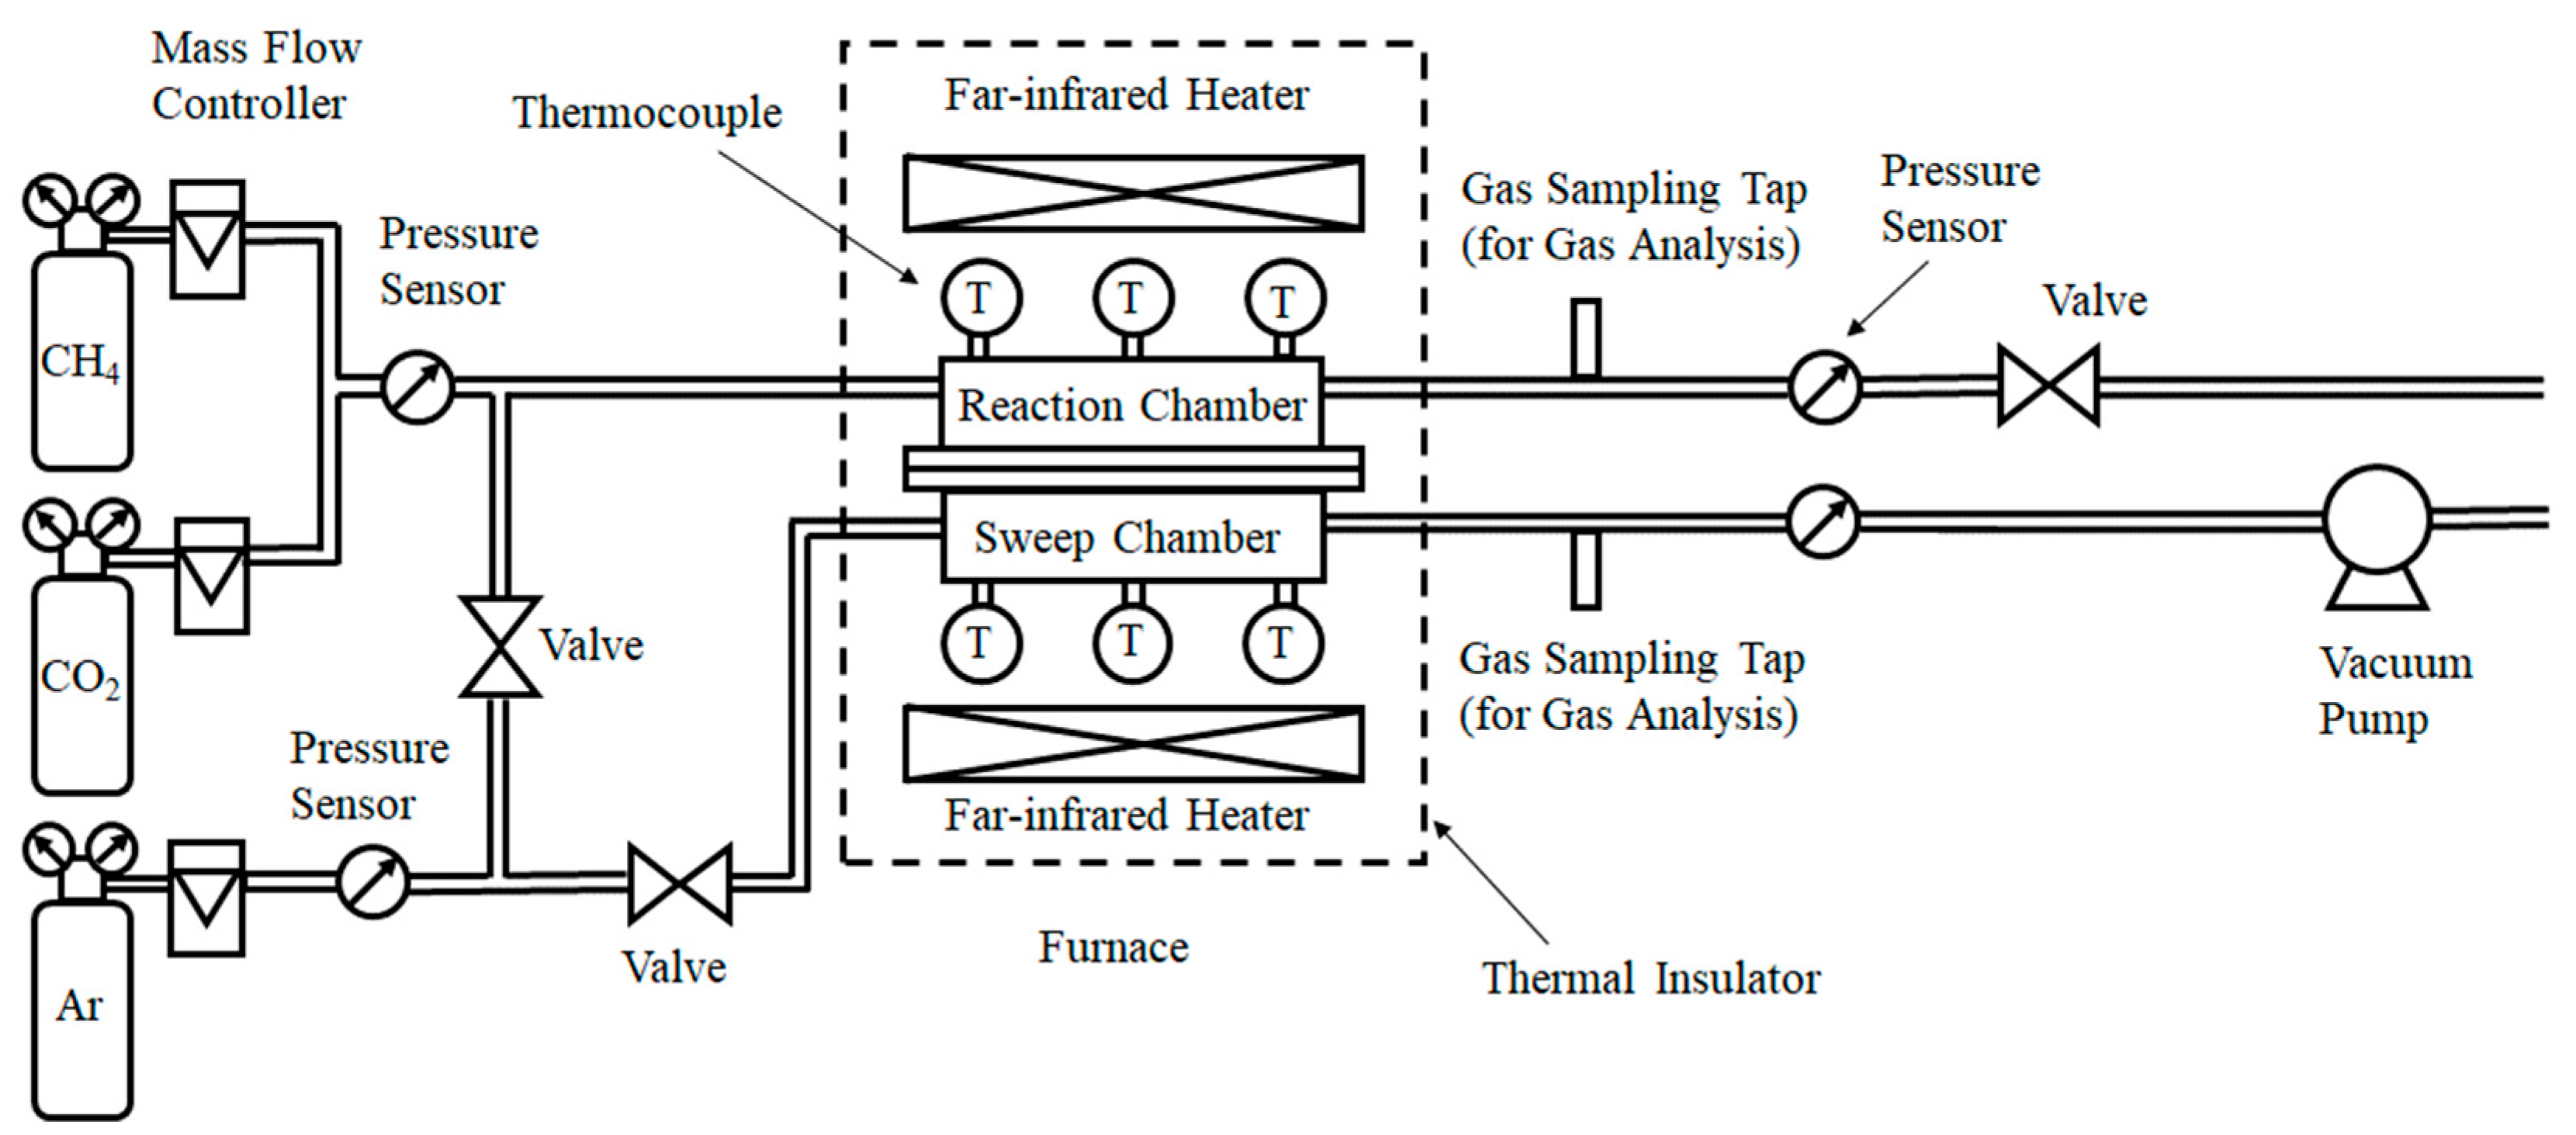
Figure 2.
Schematic drawing of detail of the reactor [5].
Figure 2.
Schematic drawing of detail of the reactor [5].
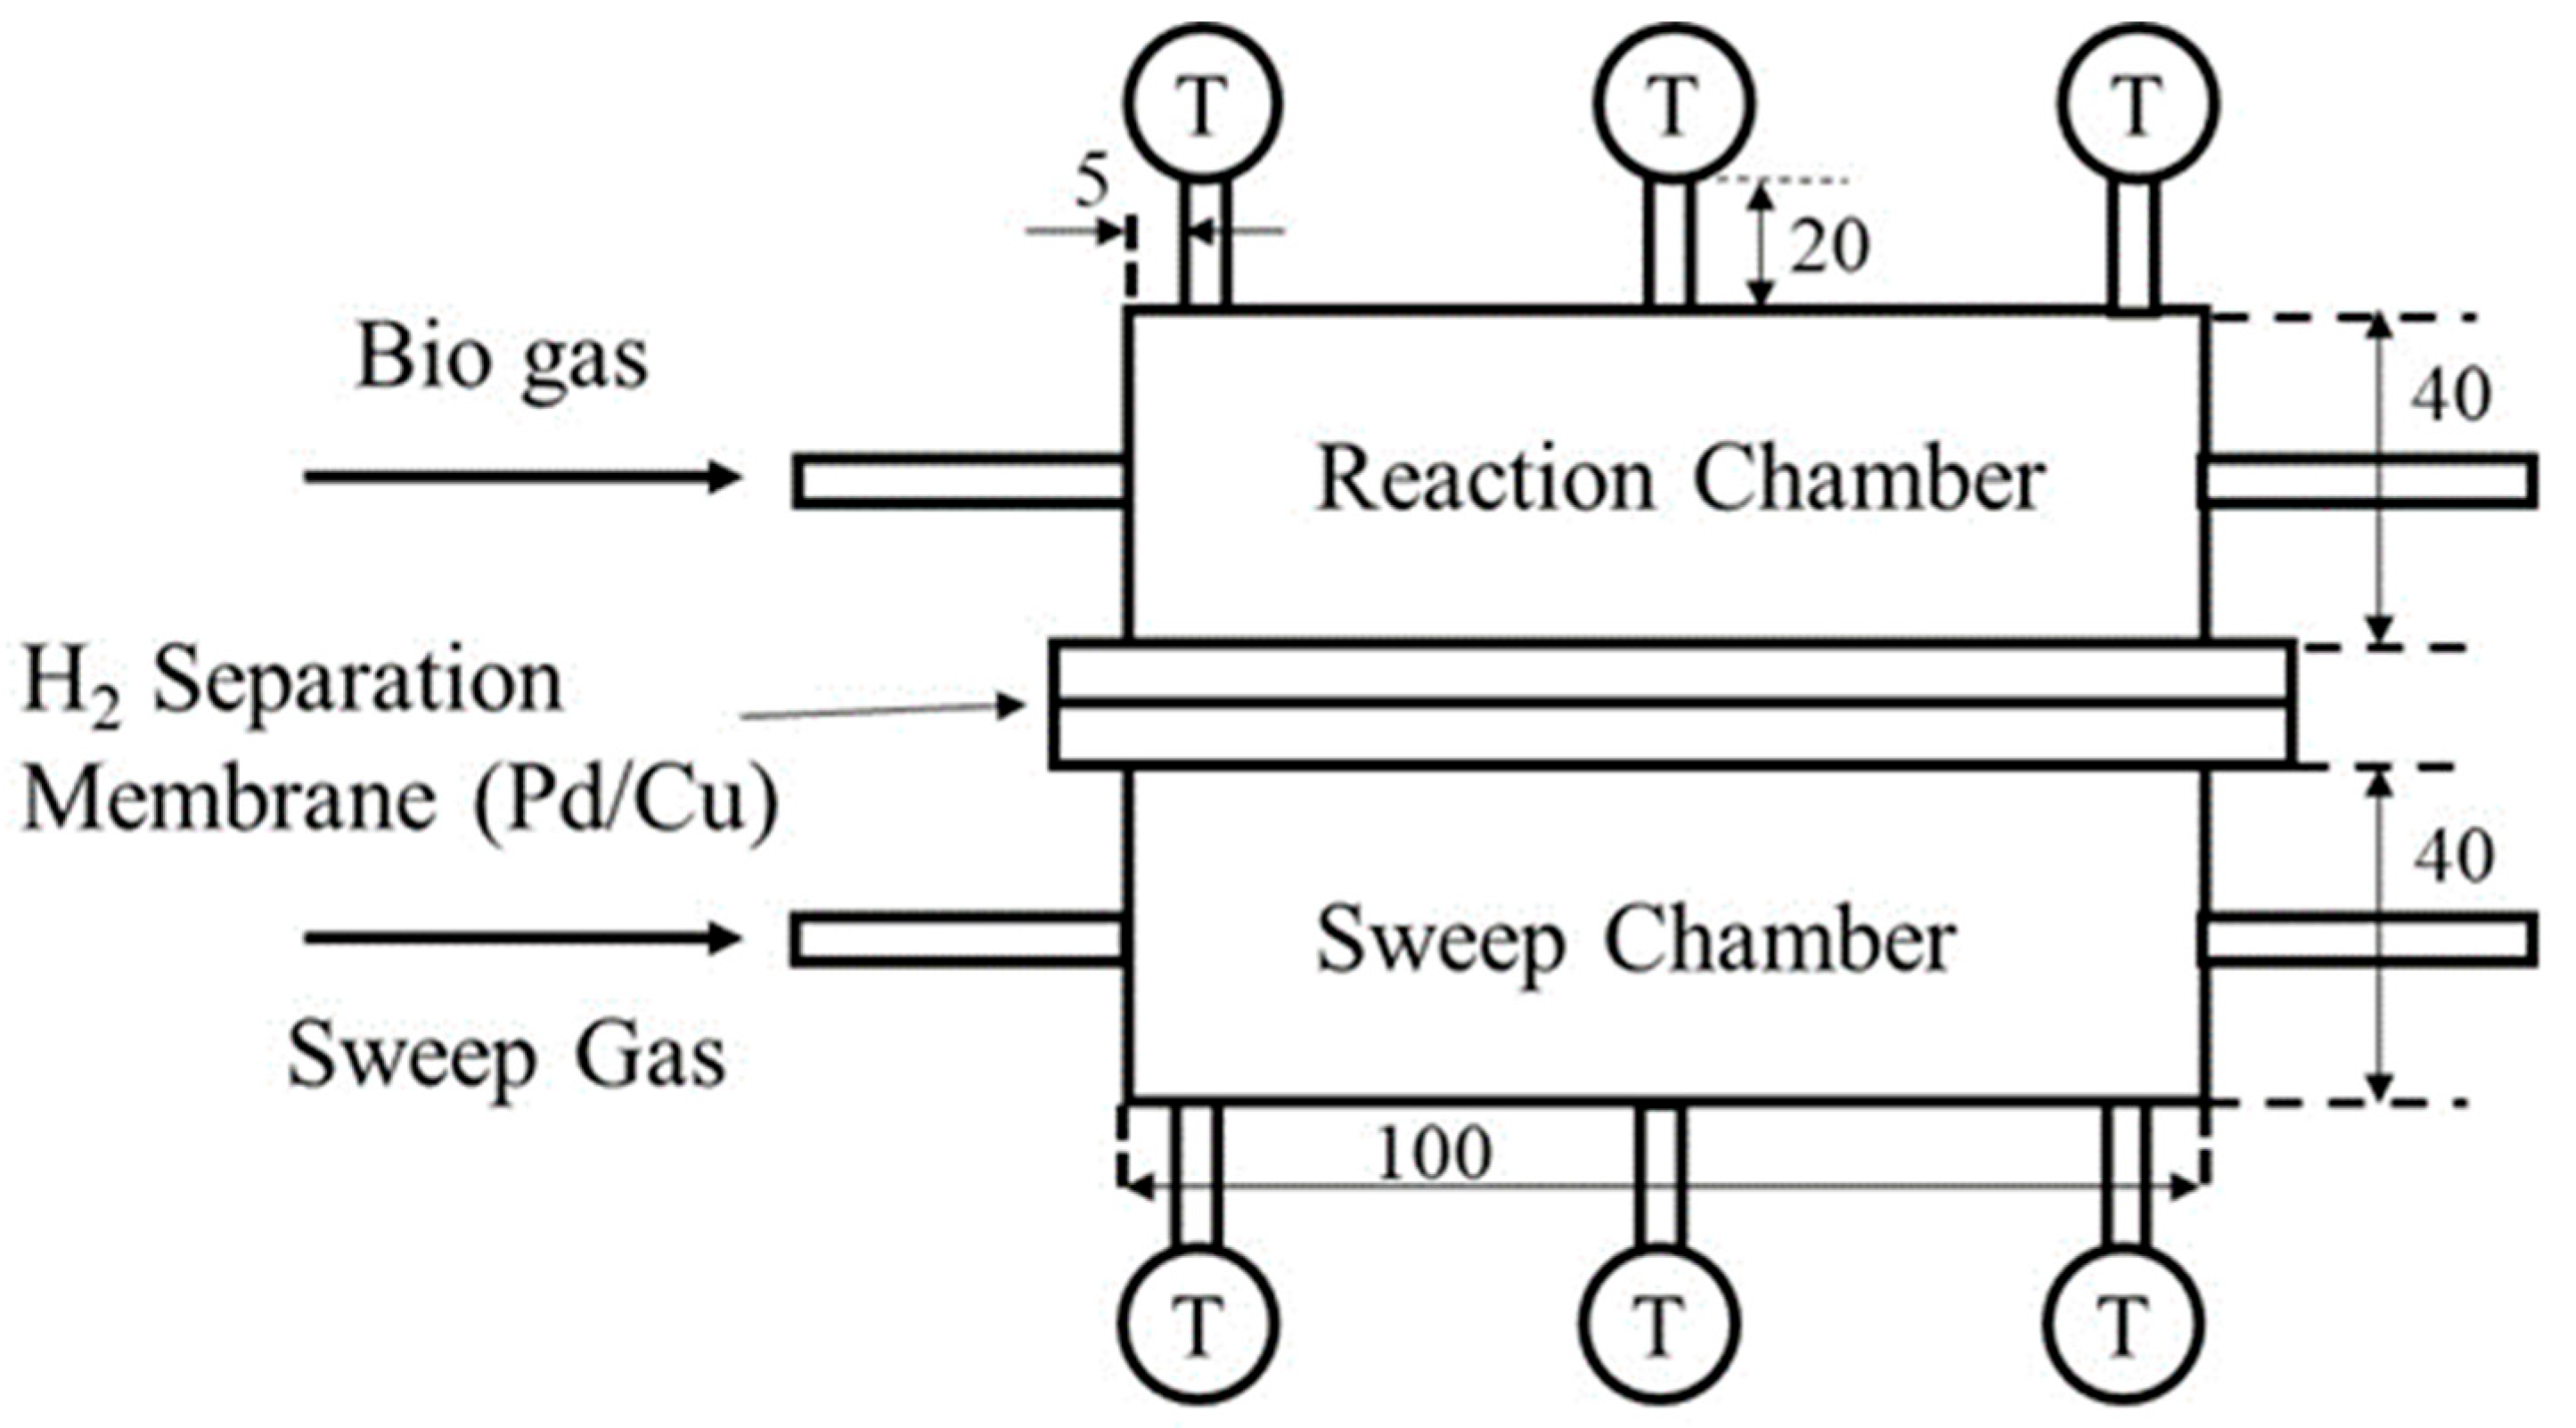
Figure 3.
Photo of charged Ni/Cr/Ru catalyst in the reaction chamber.
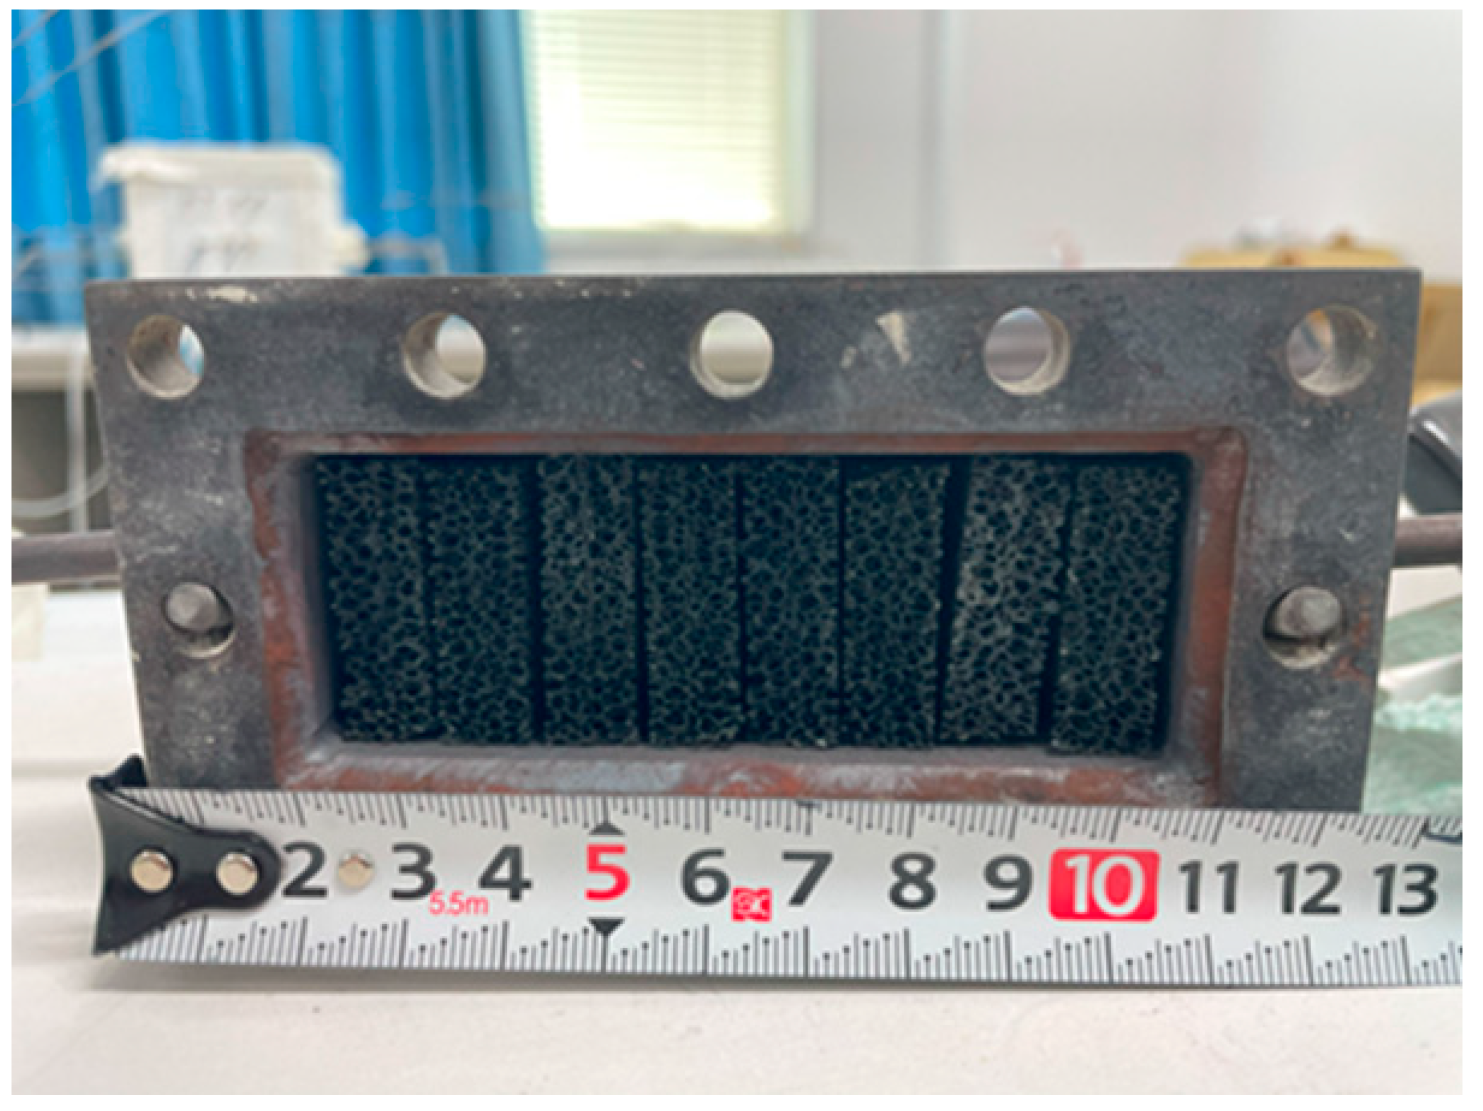
Figure 4.
Impact of thickness of Pd/Cu membrane on each gas concentration in the reaction chamber changing the reaction temperature without a sweep gas (CH4:CO2 = 1.5:1, differential pressure (a): 0 MPa, (b): 0.010 MPa, (c): 0.020 MPa).
Figure 4.
Impact of thickness of Pd/Cu membrane on each gas concentration in the reaction chamber changing the reaction temperature without a sweep gas (CH4:CO2 = 1.5:1, differential pressure (a): 0 MPa, (b): 0.010 MPa, (c): 0.020 MPa).
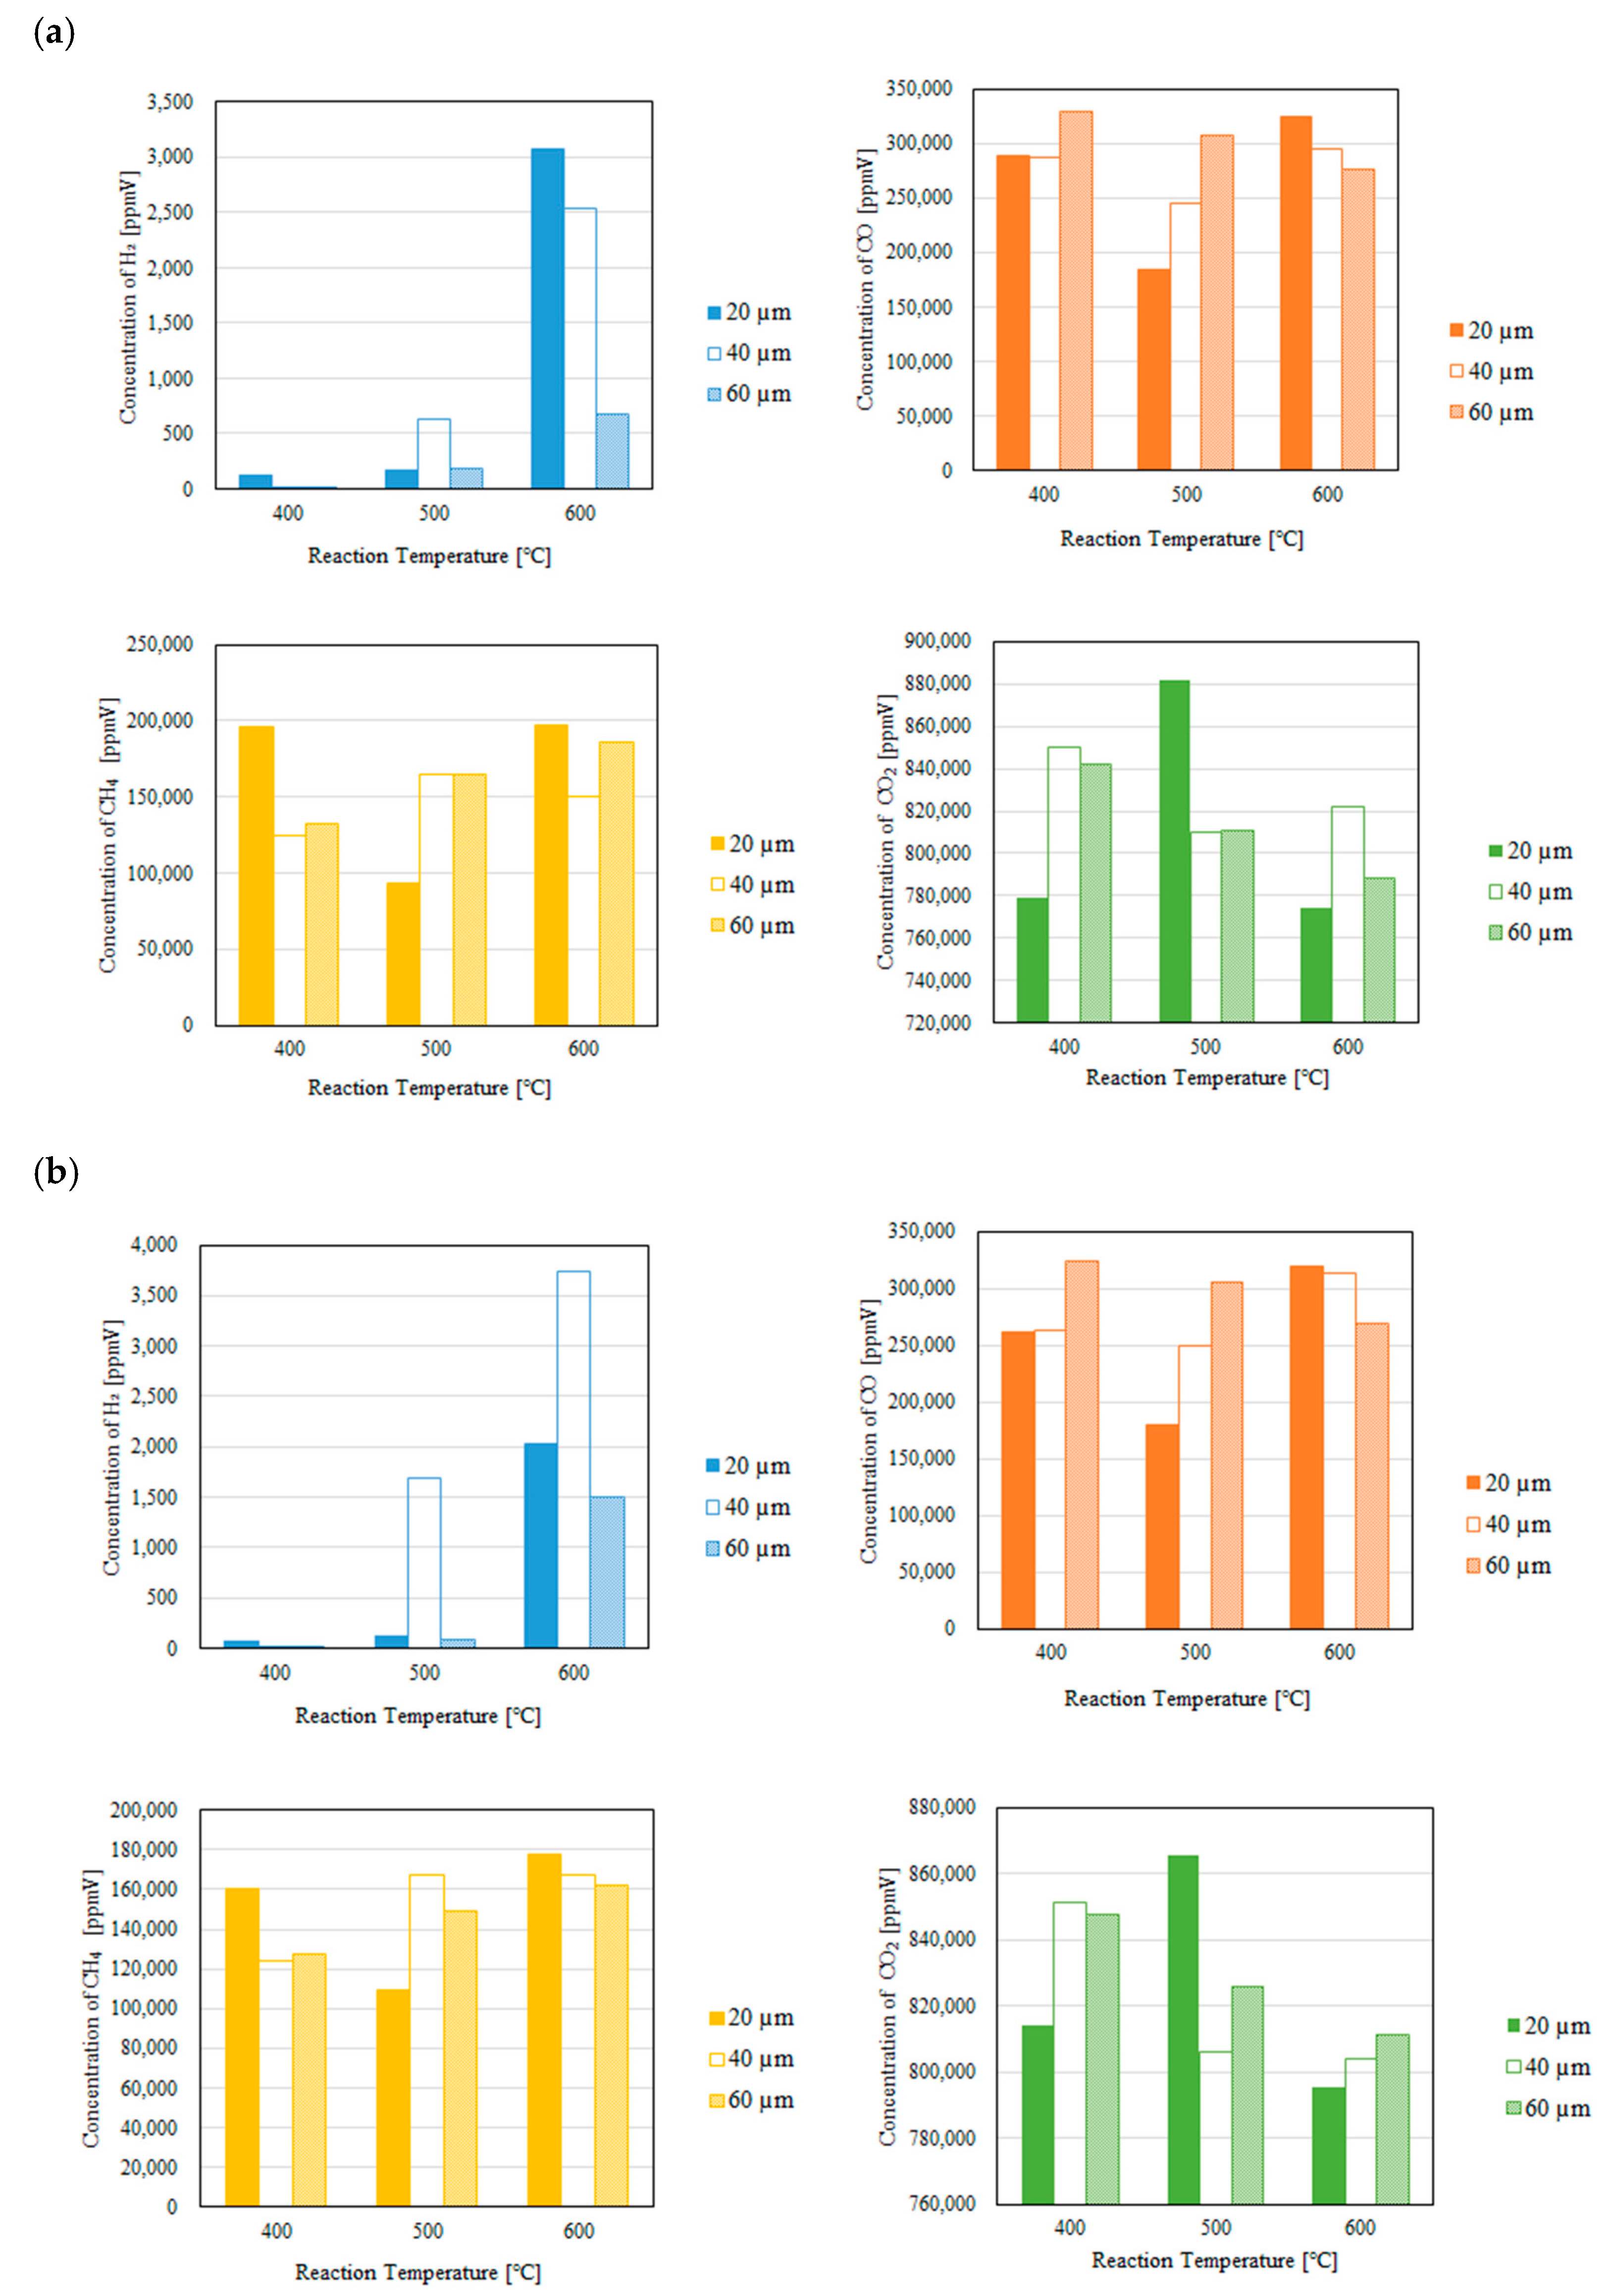
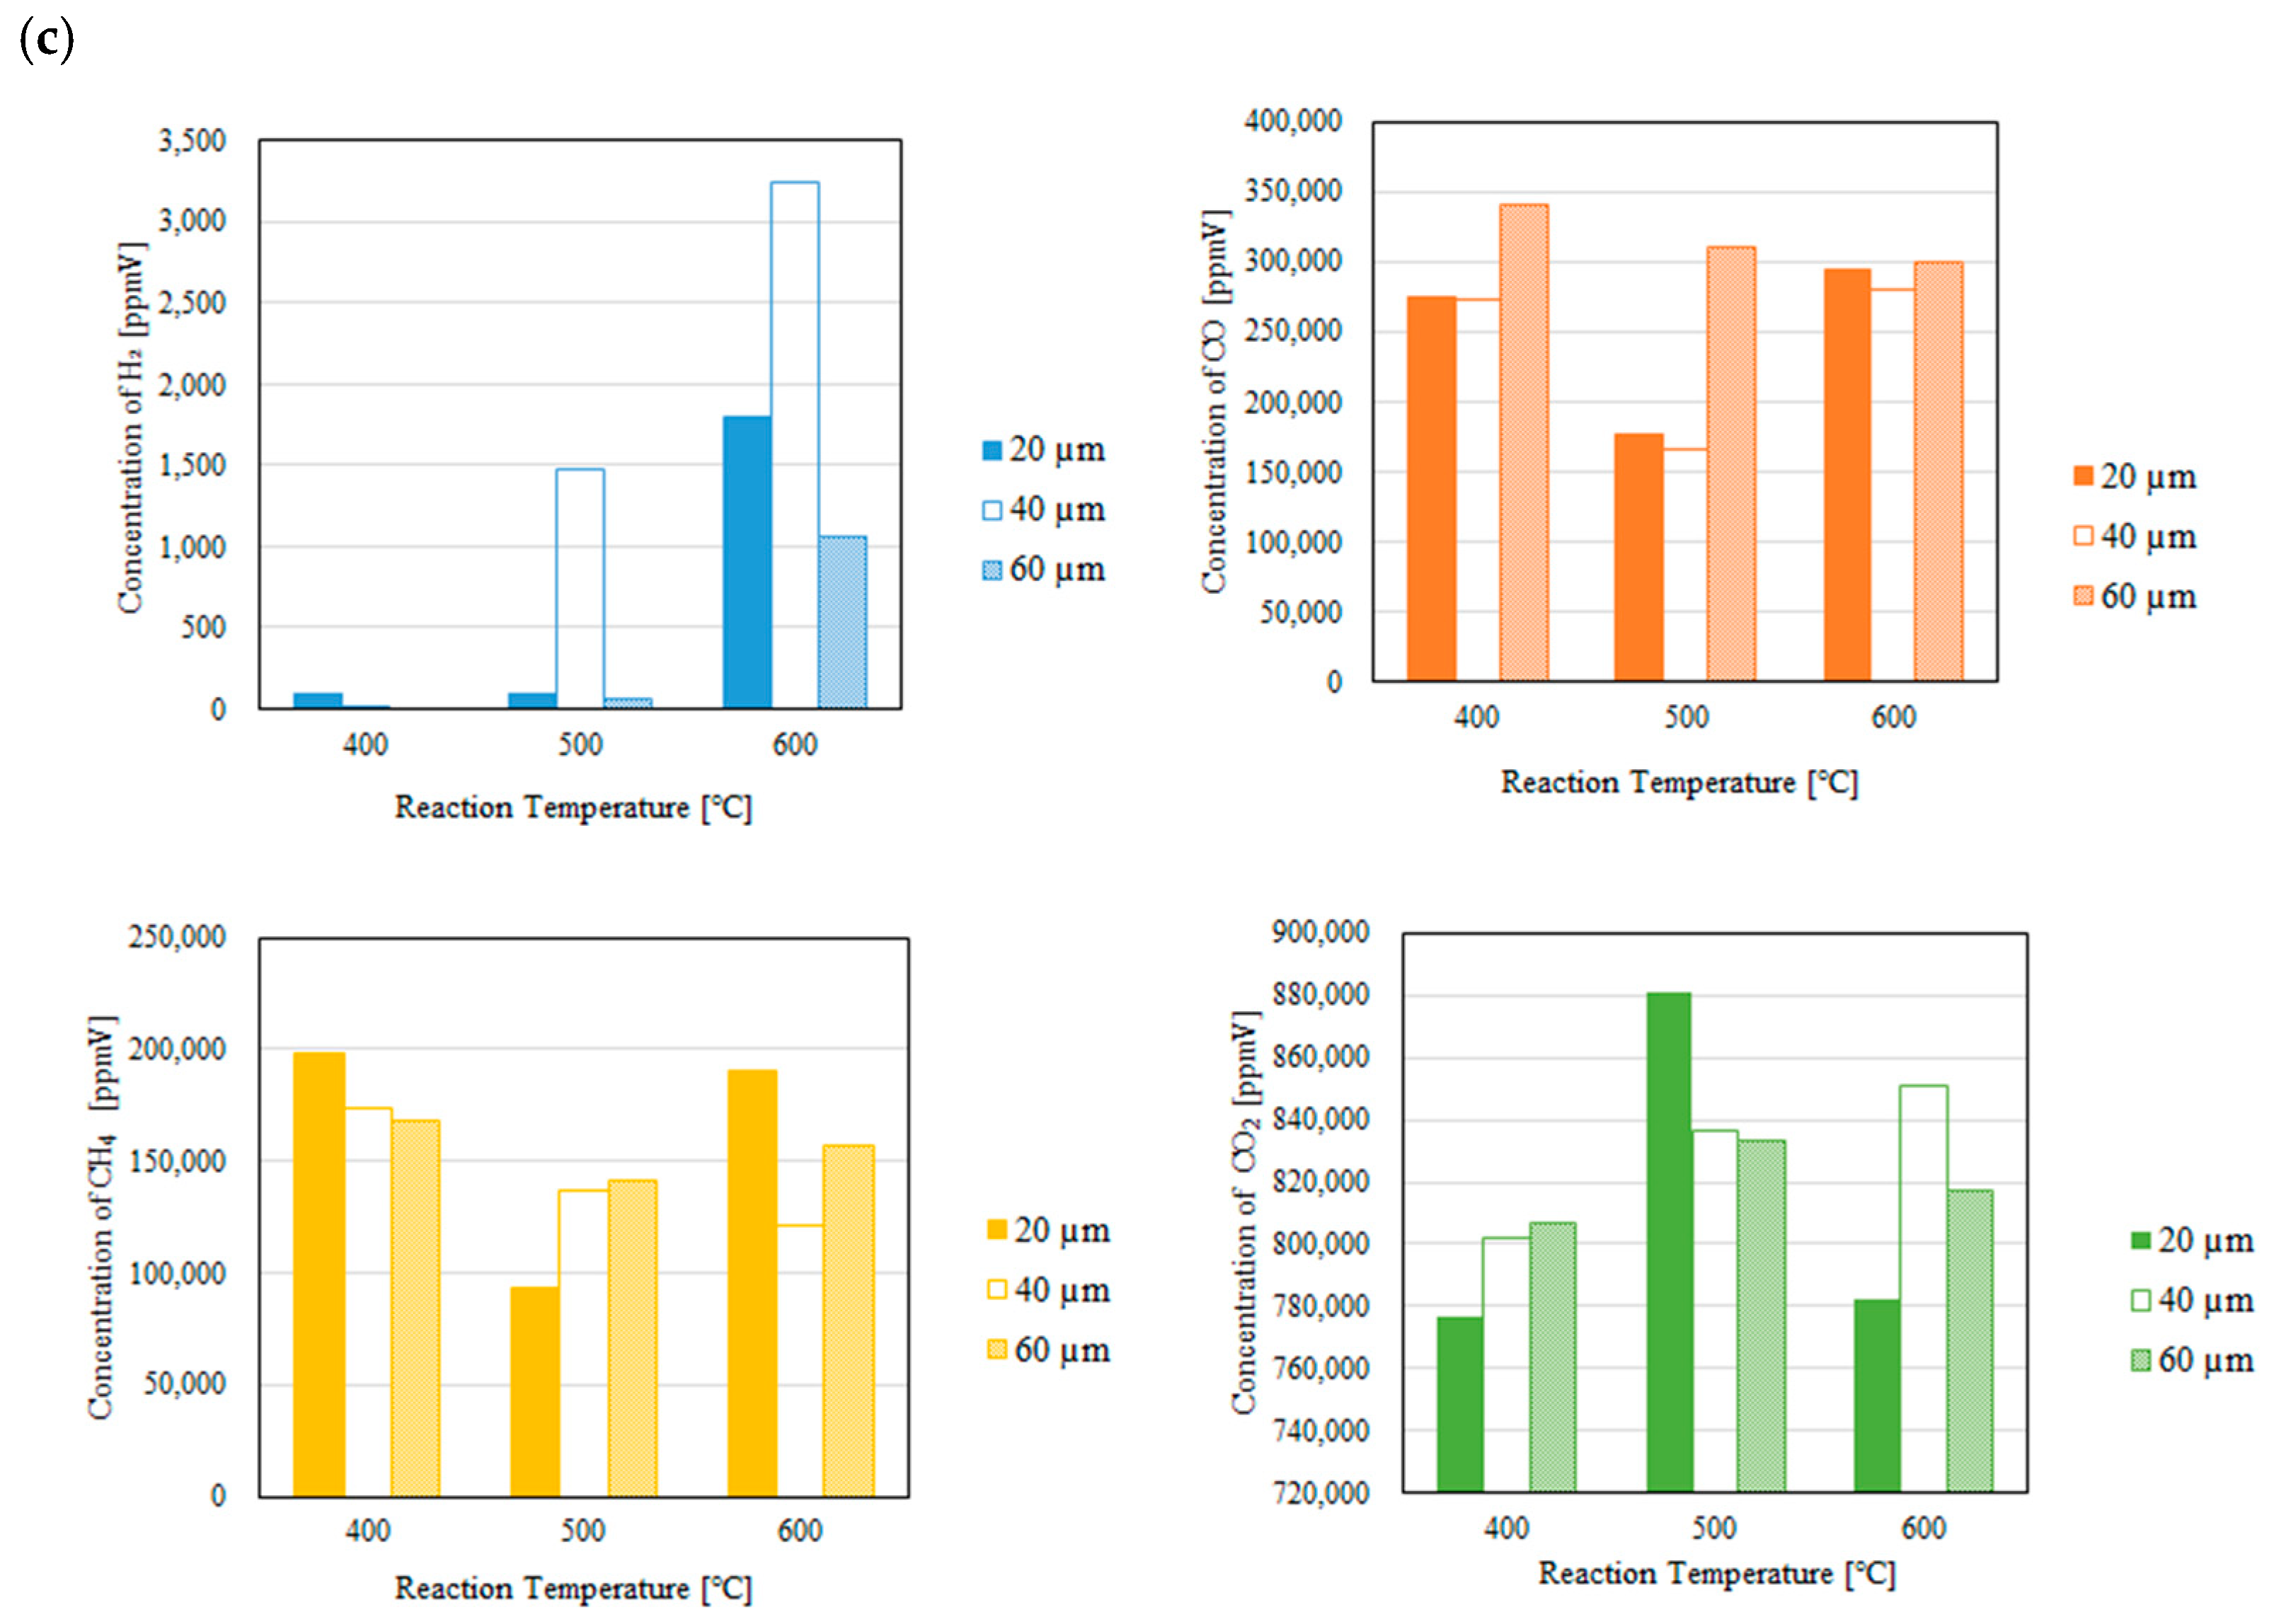
Figure 5.
Impact of thickness of Pd/Cu membrane on the concentration of H2 in the sweep chamber changing the reaction temperature without a sweep gas (CH4:CO2 = 1.5:1, differential pressure (a): 0 MPa, (b): 0.010 MPa, (c): 0.020 MPa).
Figure 5.
Impact of thickness of Pd/Cu membrane on the concentration of H2 in the sweep chamber changing the reaction temperature without a sweep gas (CH4:CO2 = 1.5:1, differential pressure (a): 0 MPa, (b): 0.010 MPa, (c): 0.020 MPa).
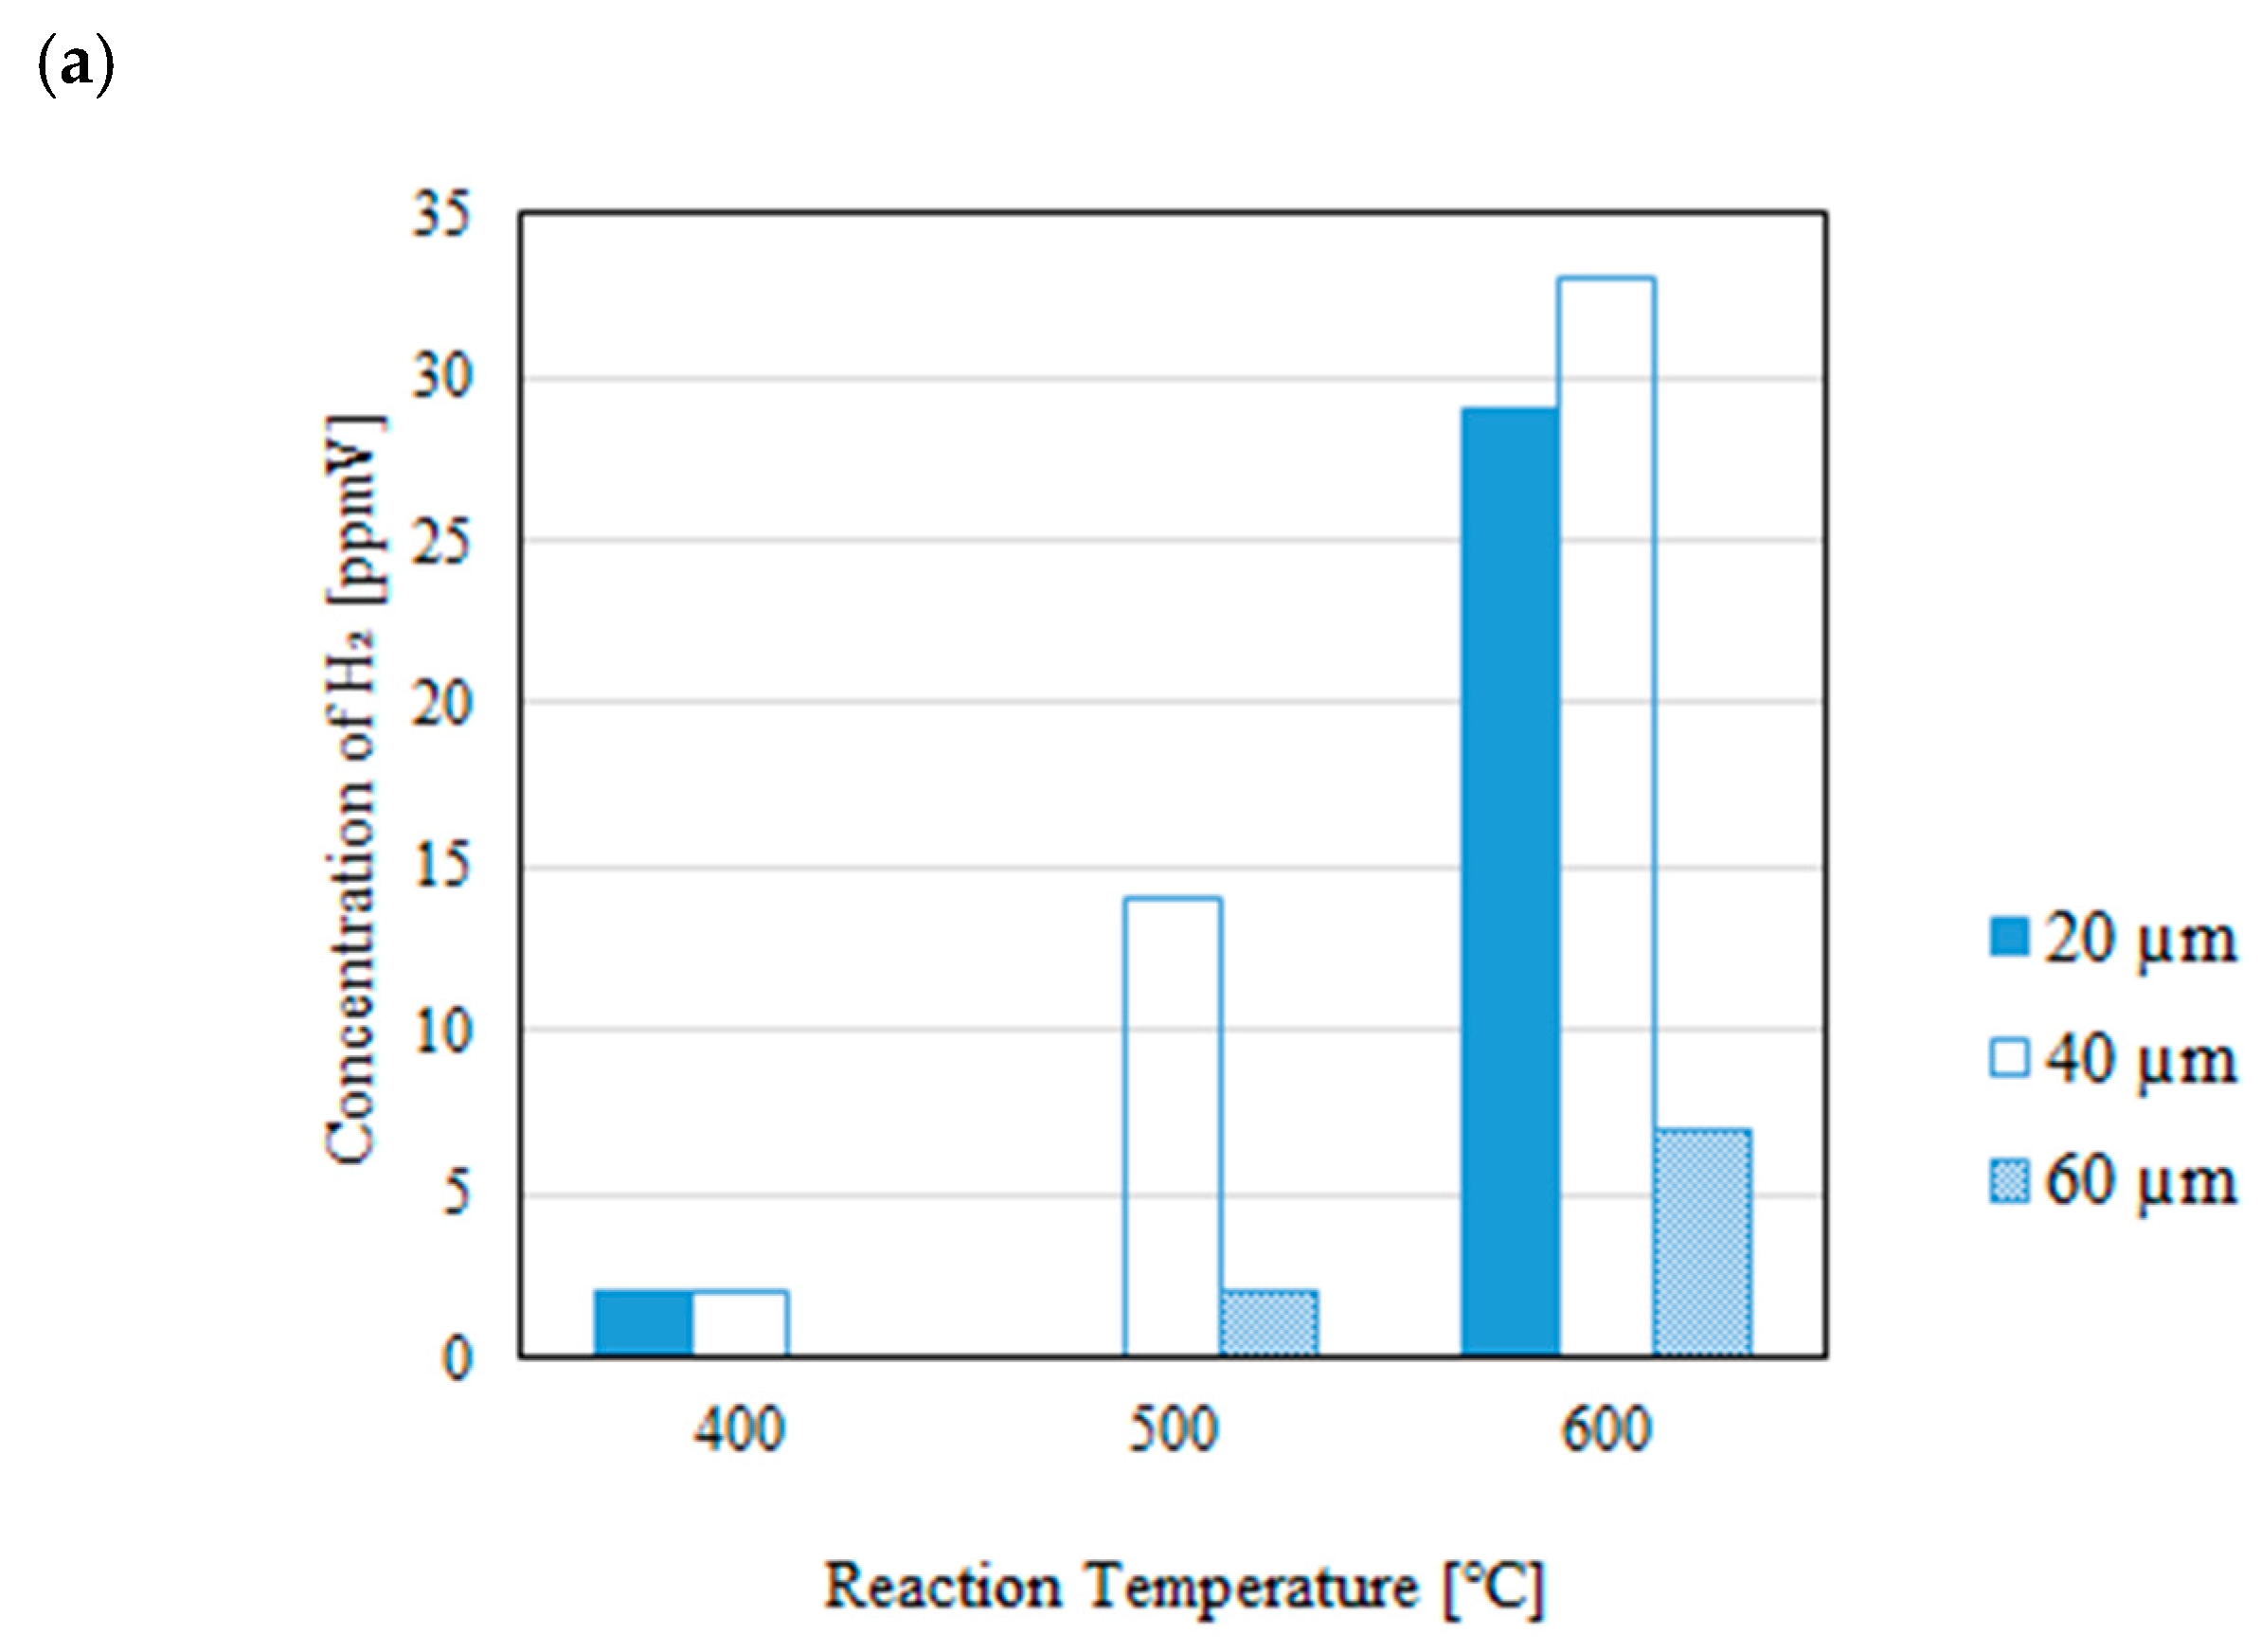
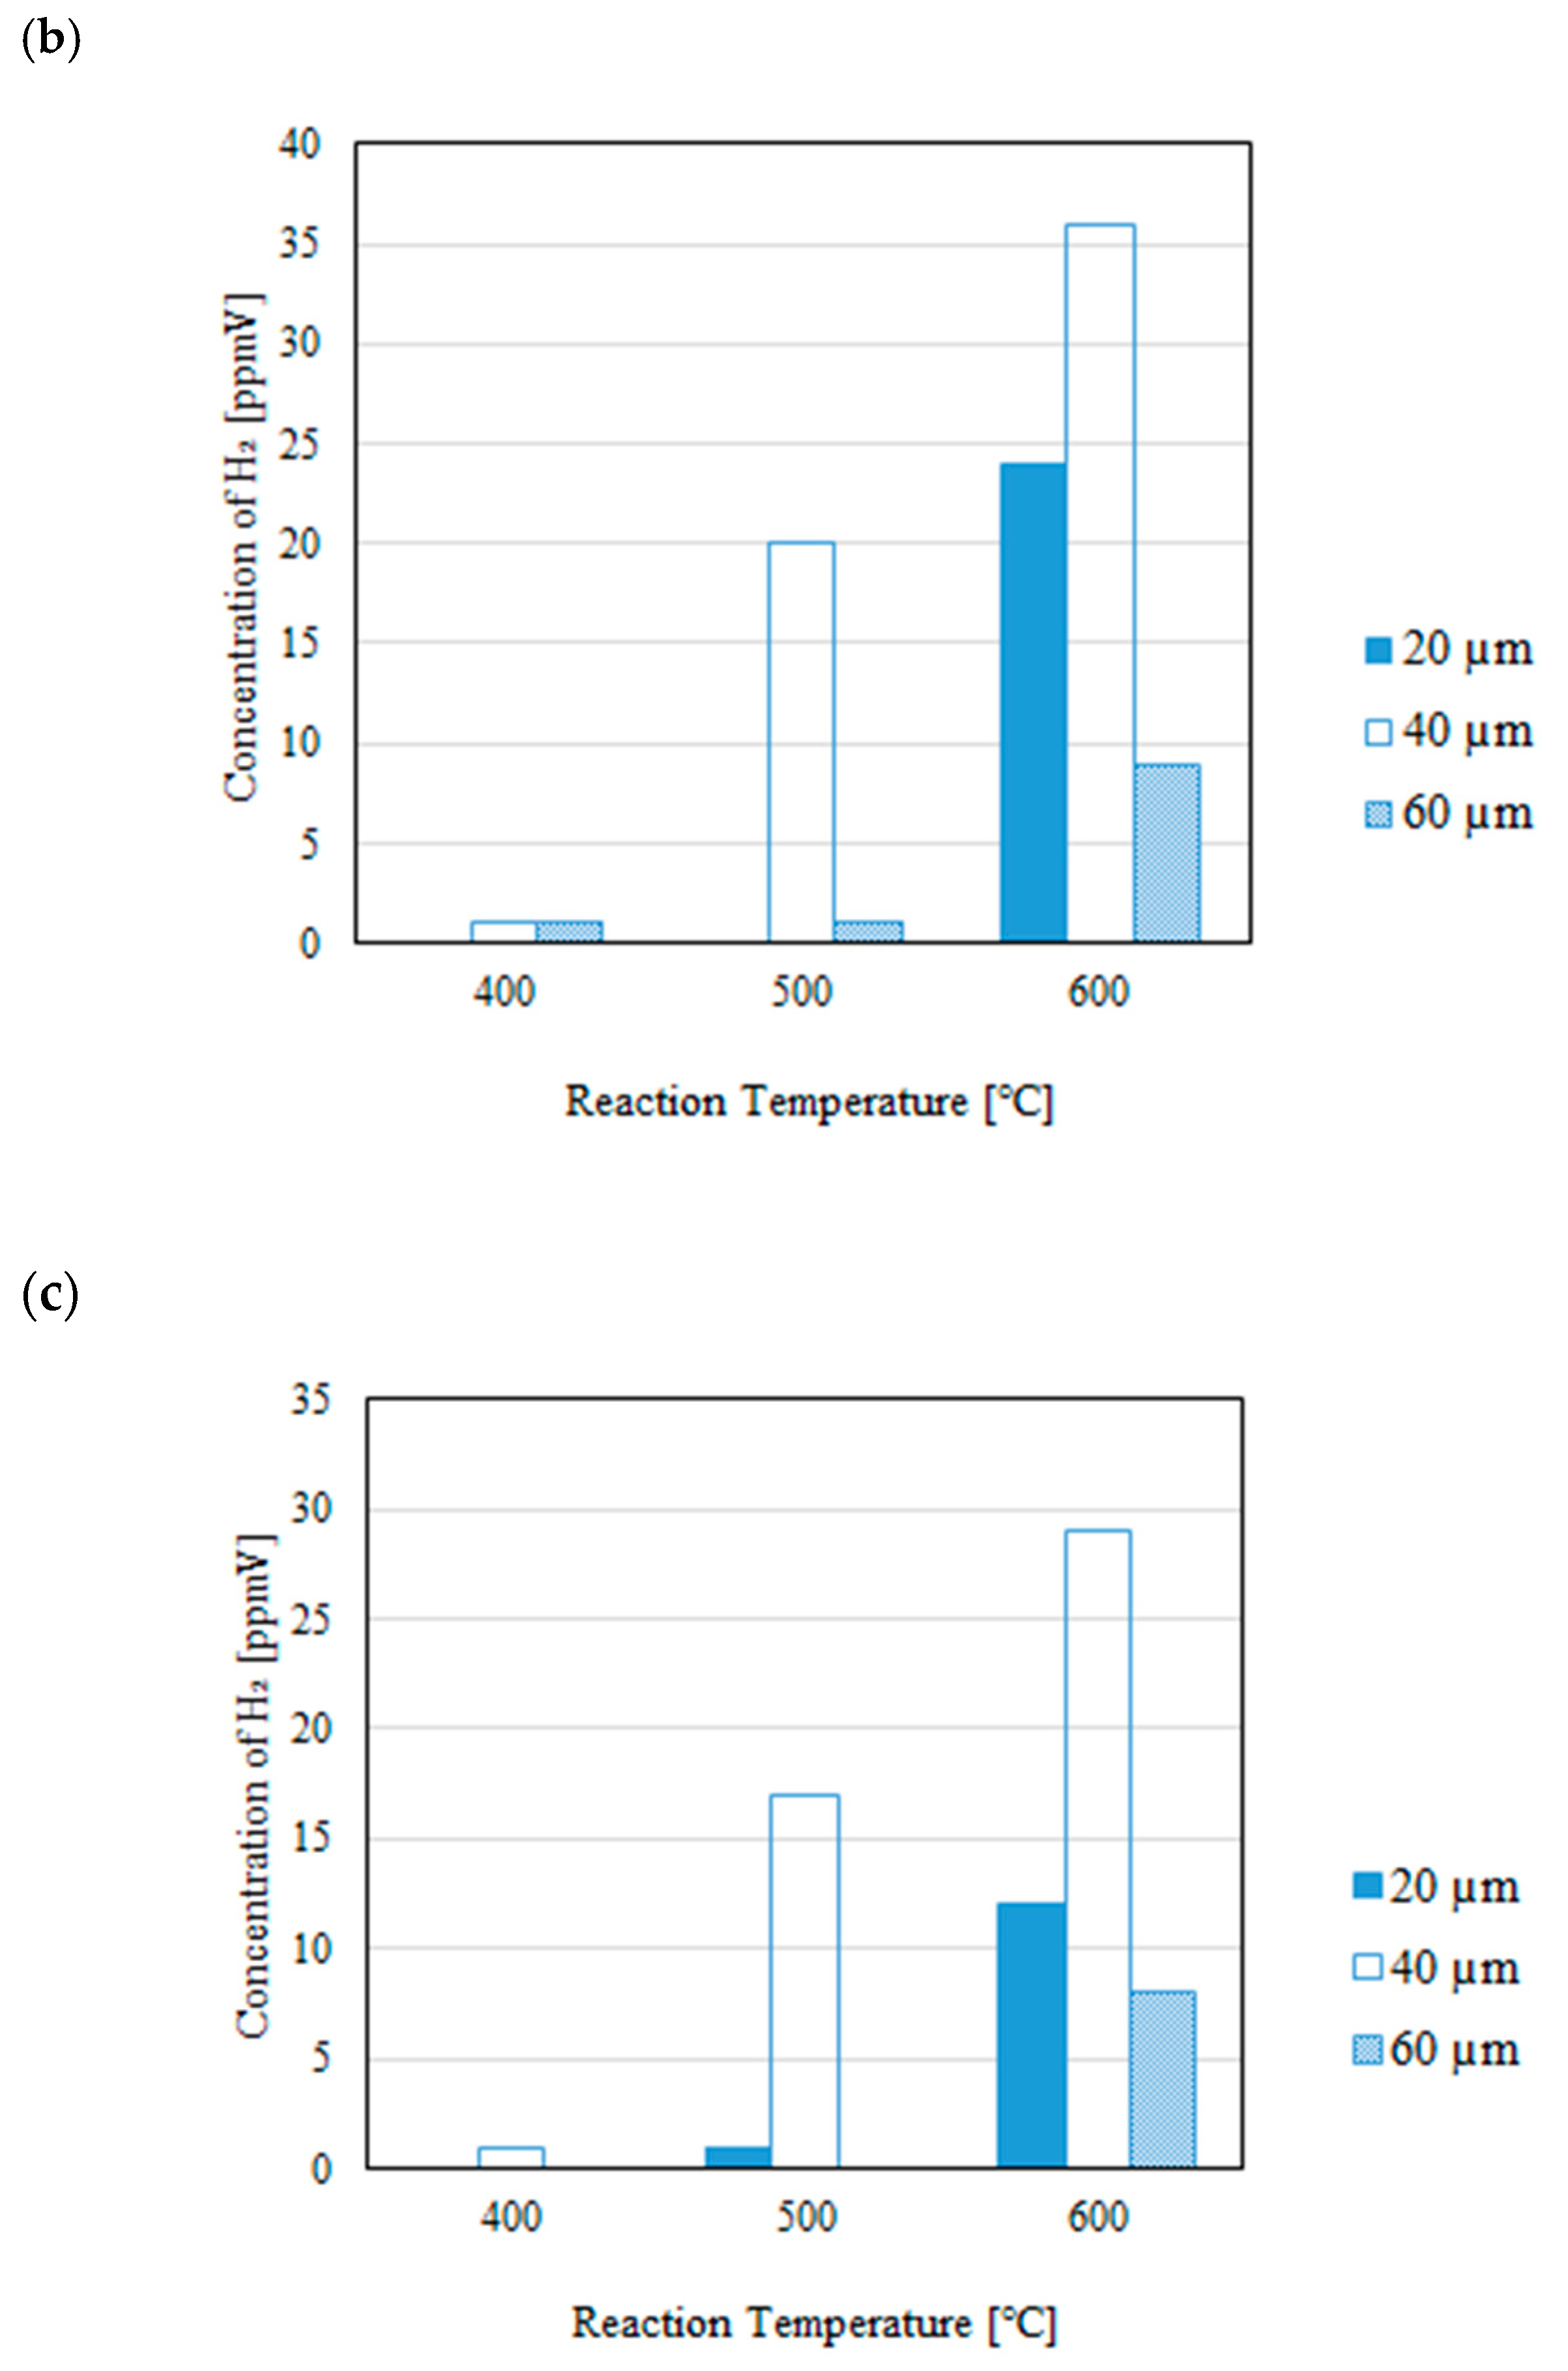
Figure 6.
Impact of thickness of Pd/Cu membrane on each gas concentration in the reaction chamber and the sweep chamber changing the reaction temperature with a sweep gas (CH4:CO2 = 1.5:1, differential pressure (a): 0 MPa, (b): 0.010 MPa, (c): 0.020 MPa).
Figure 6.
Impact of thickness of Pd/Cu membrane on each gas concentration in the reaction chamber and the sweep chamber changing the reaction temperature with a sweep gas (CH4:CO2 = 1.5:1, differential pressure (a): 0 MPa, (b): 0.010 MPa, (c): 0.020 MPa).
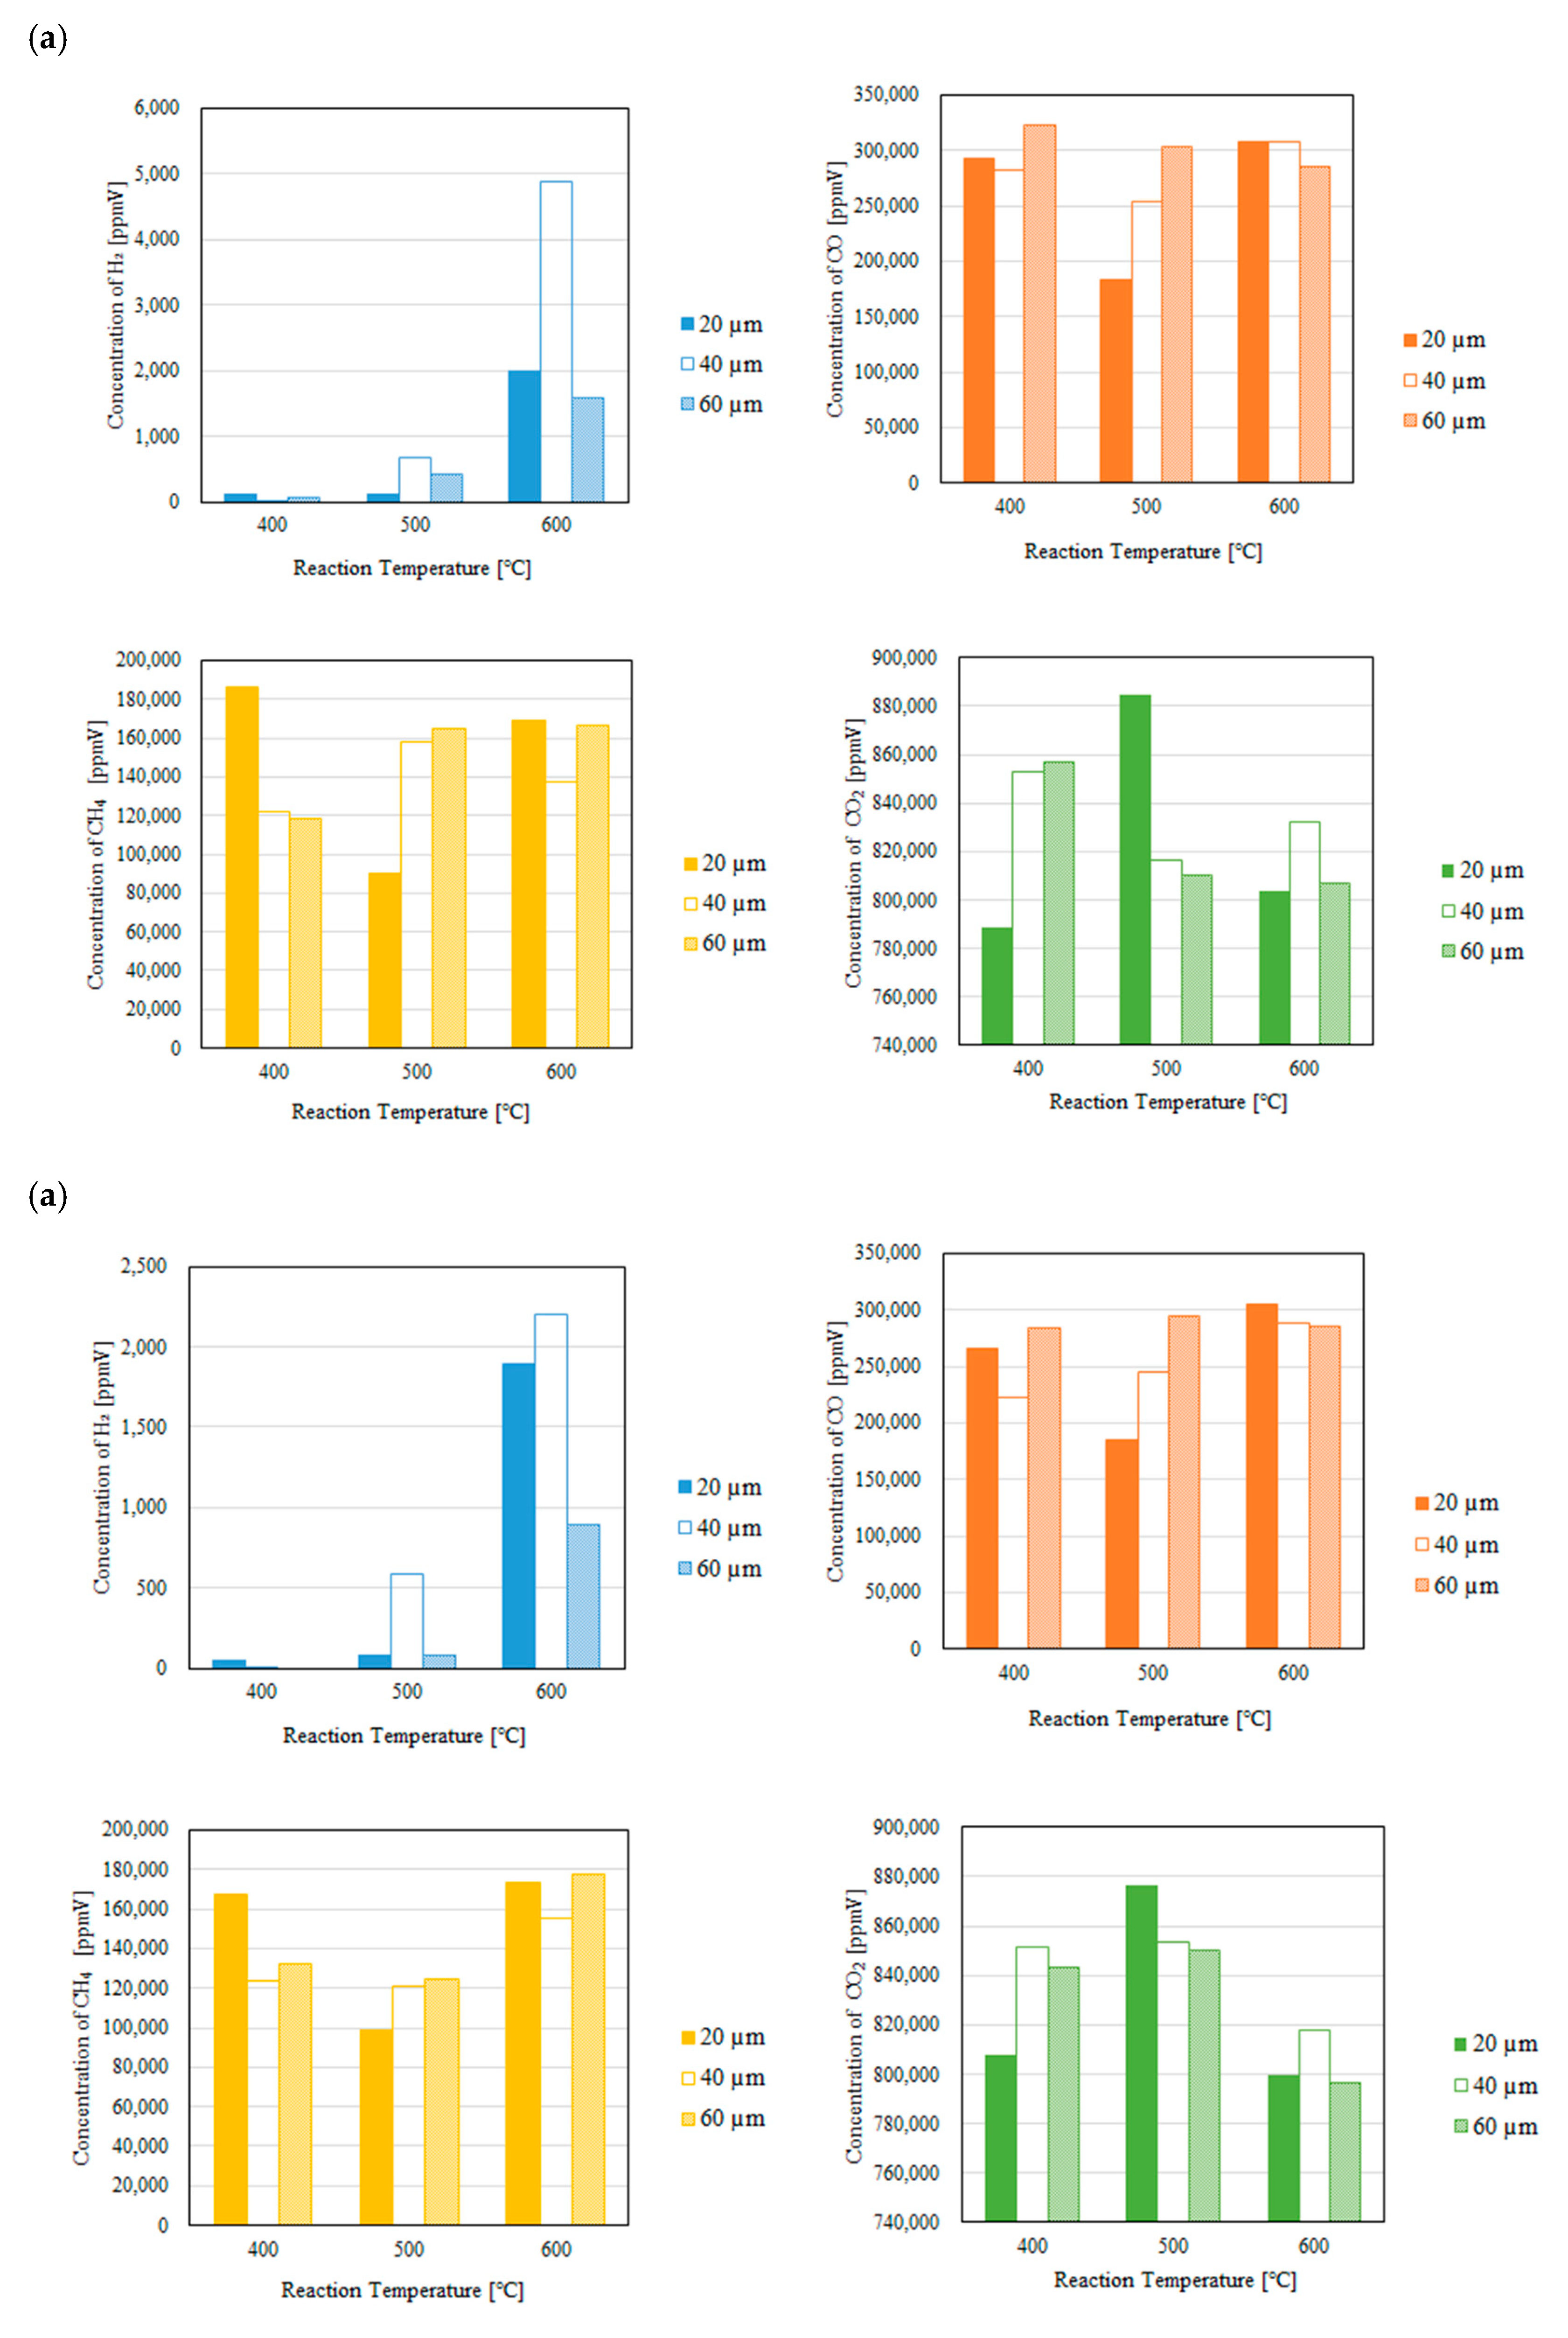
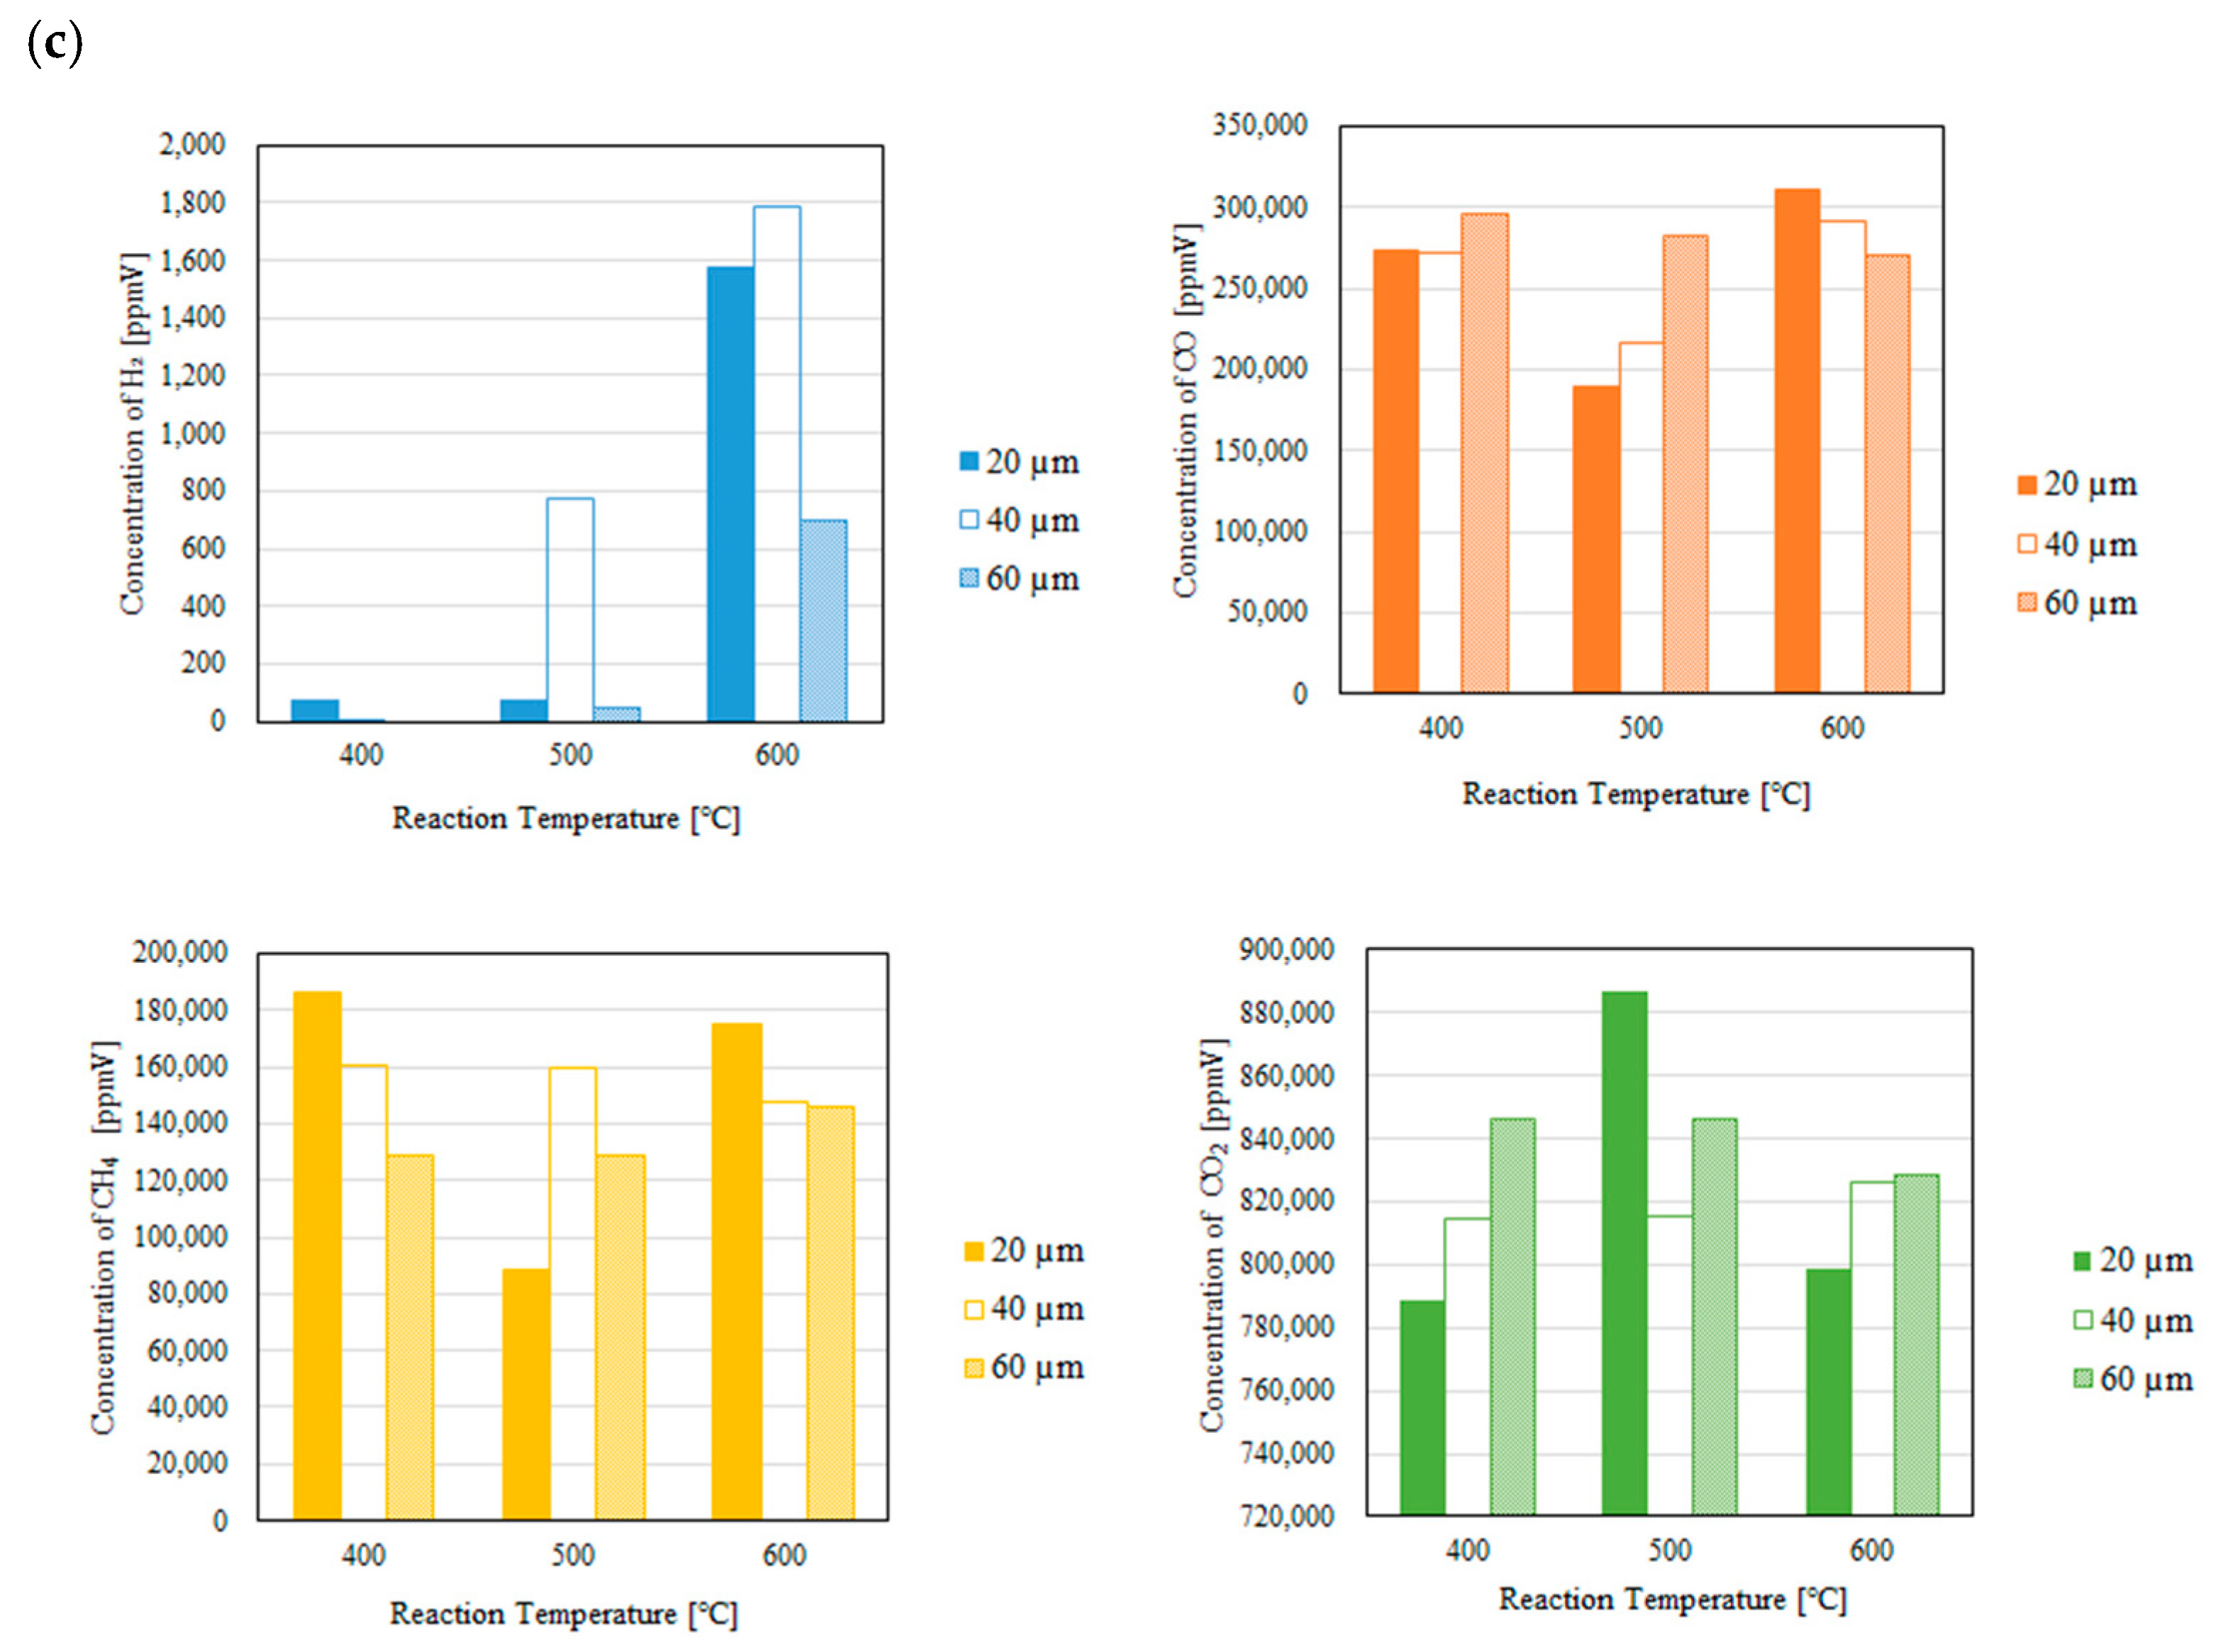
Figure 7.
Impact of thickness of Pd/Cu membrane on the concentration of H2 in the sweep chamber changing the reaction temperature with a sweep gas (CH4:CO2 = 1.5:1, differential pressure (a): 0 MPa, (b): 0.010 MPa, (c): 0.020 MPa).
Figure 7.
Impact of thickness of Pd/Cu membrane on the concentration of H2 in the sweep chamber changing the reaction temperature with a sweep gas (CH4:CO2 = 1.5:1, differential pressure (a): 0 MPa, (b): 0.010 MPa, (c): 0.020 MPa).
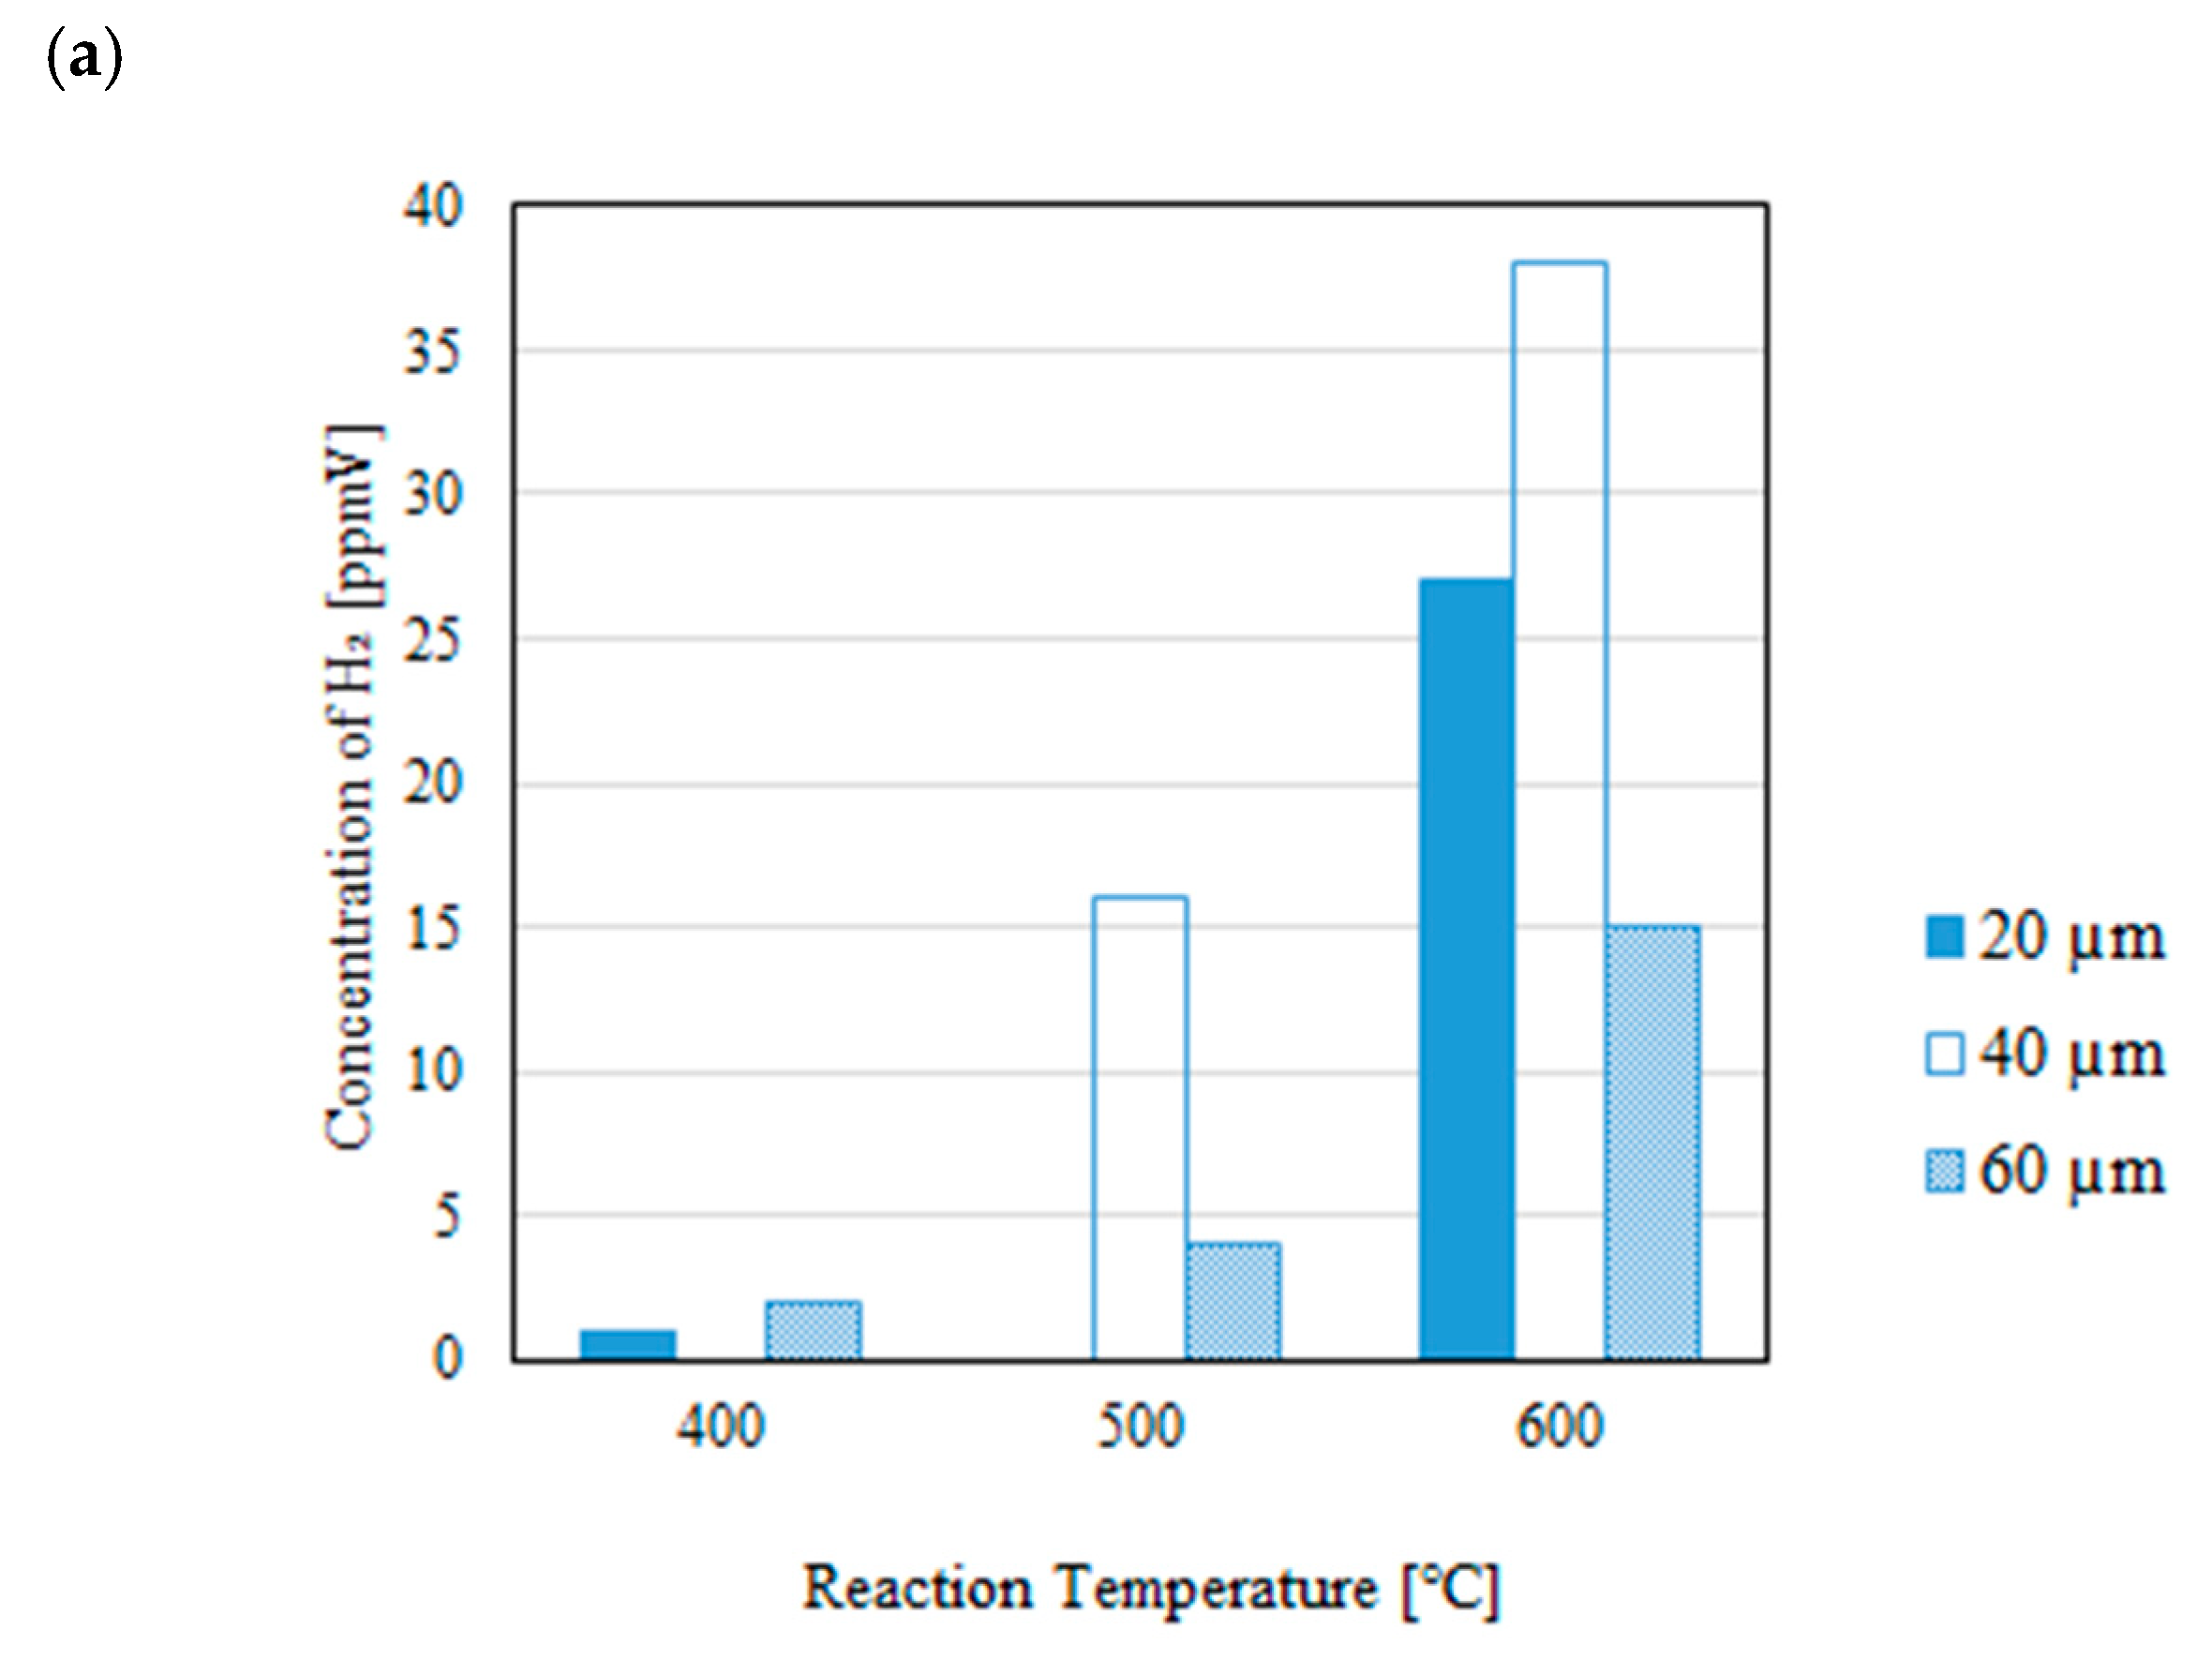
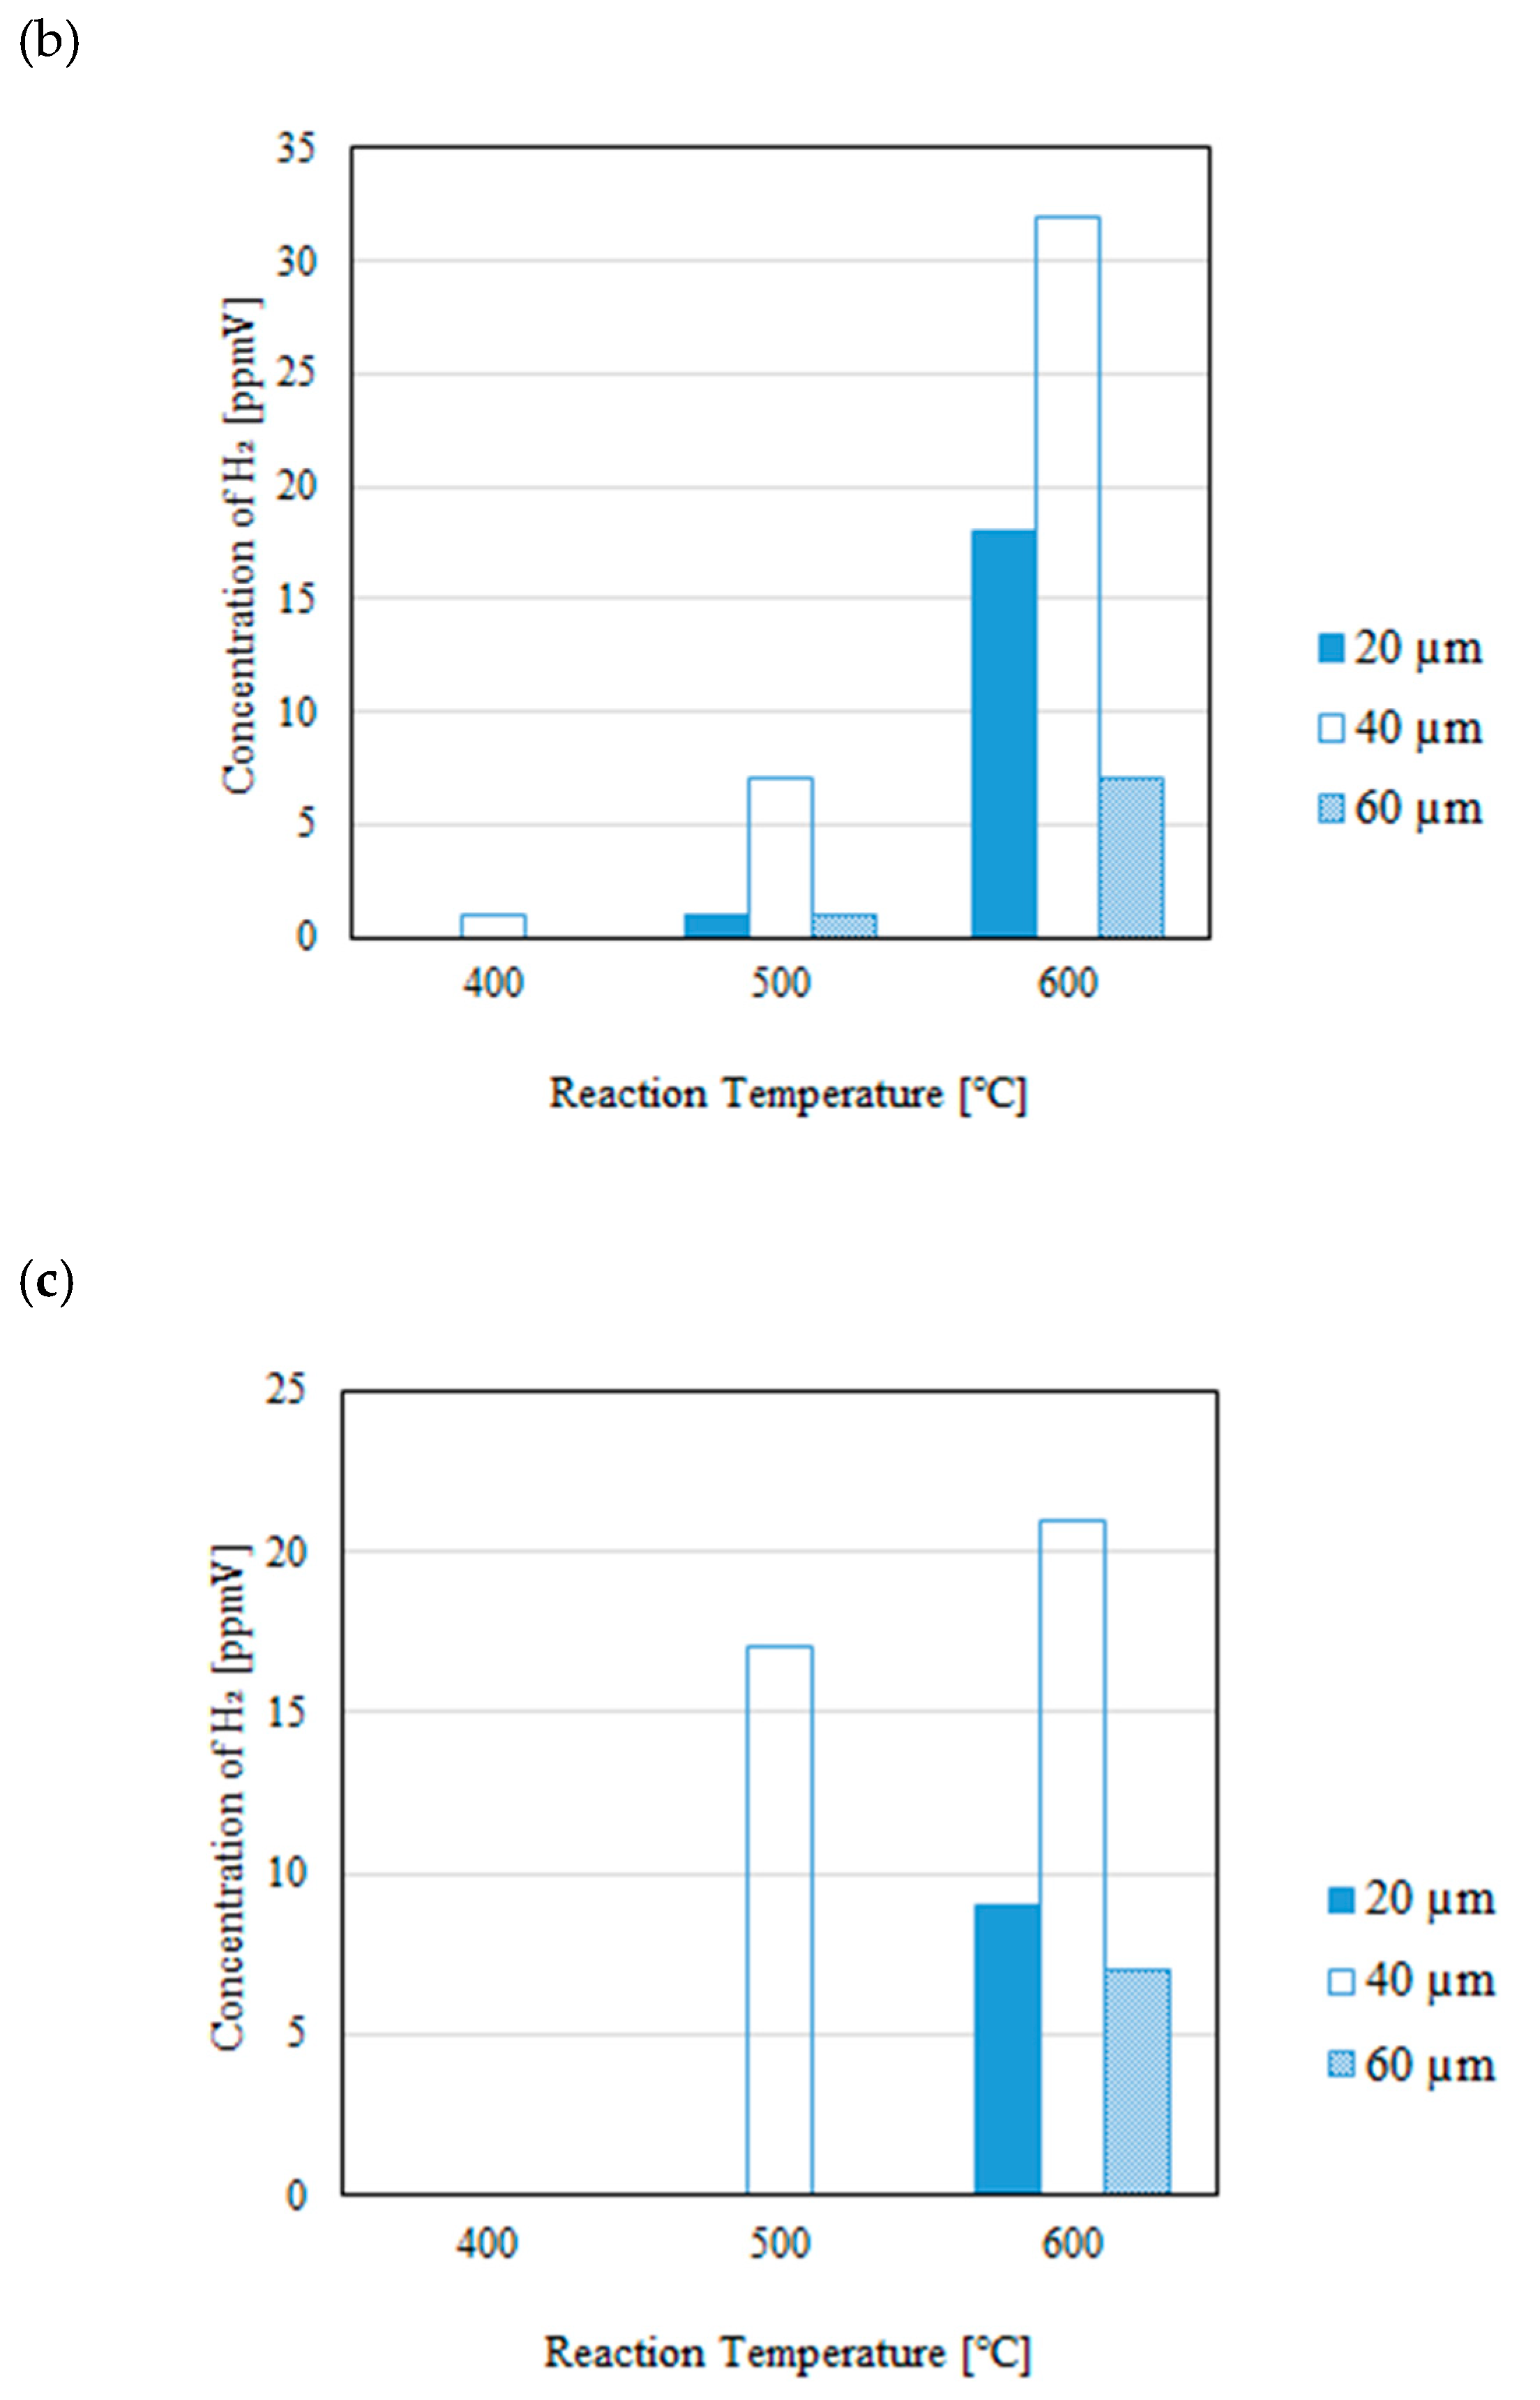
Figure 8.
Impact of thickness of Pd/Cu membrane on each gas concentration in the reaction chamber changing the molar ratio without a sweep gas (CH4:CO2 = 1.5:1, differential pressure (a): 0 MPa, (b): 0.010 MPa, (c): 0.020 MPa).
Figure 8.
Impact of thickness of Pd/Cu membrane on each gas concentration in the reaction chamber changing the molar ratio without a sweep gas (CH4:CO2 = 1.5:1, differential pressure (a): 0 MPa, (b): 0.010 MPa, (c): 0.020 MPa).
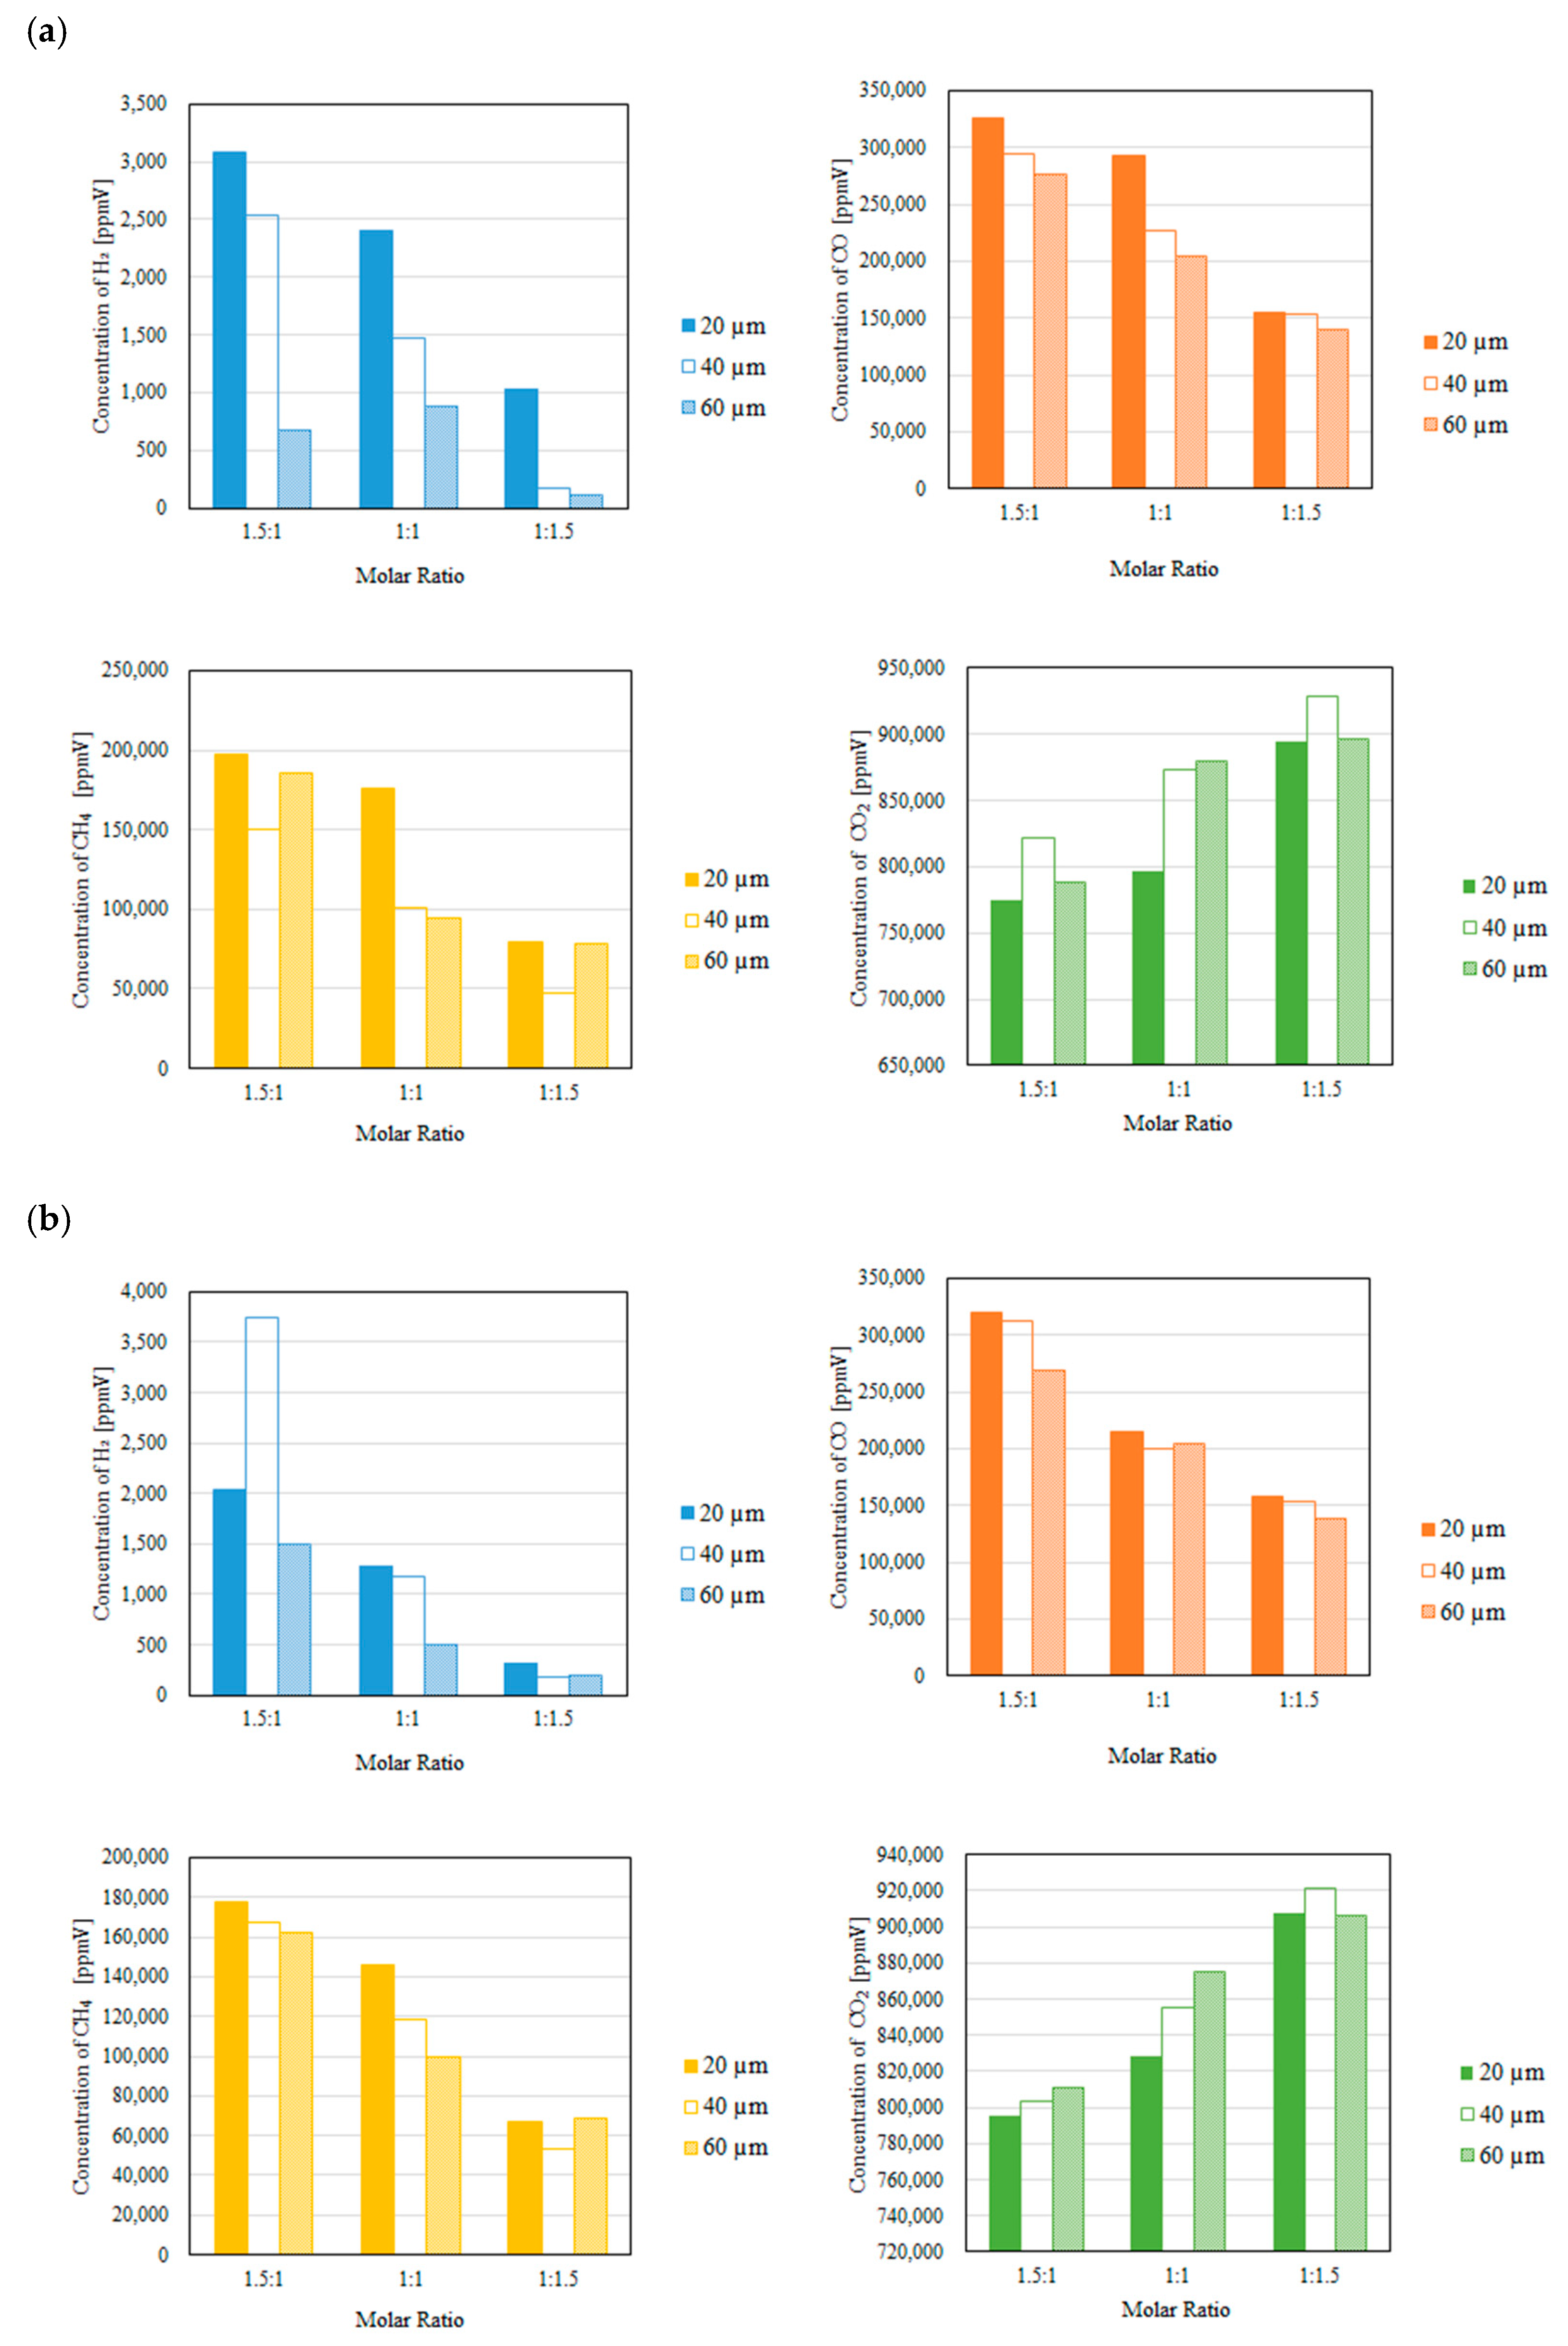
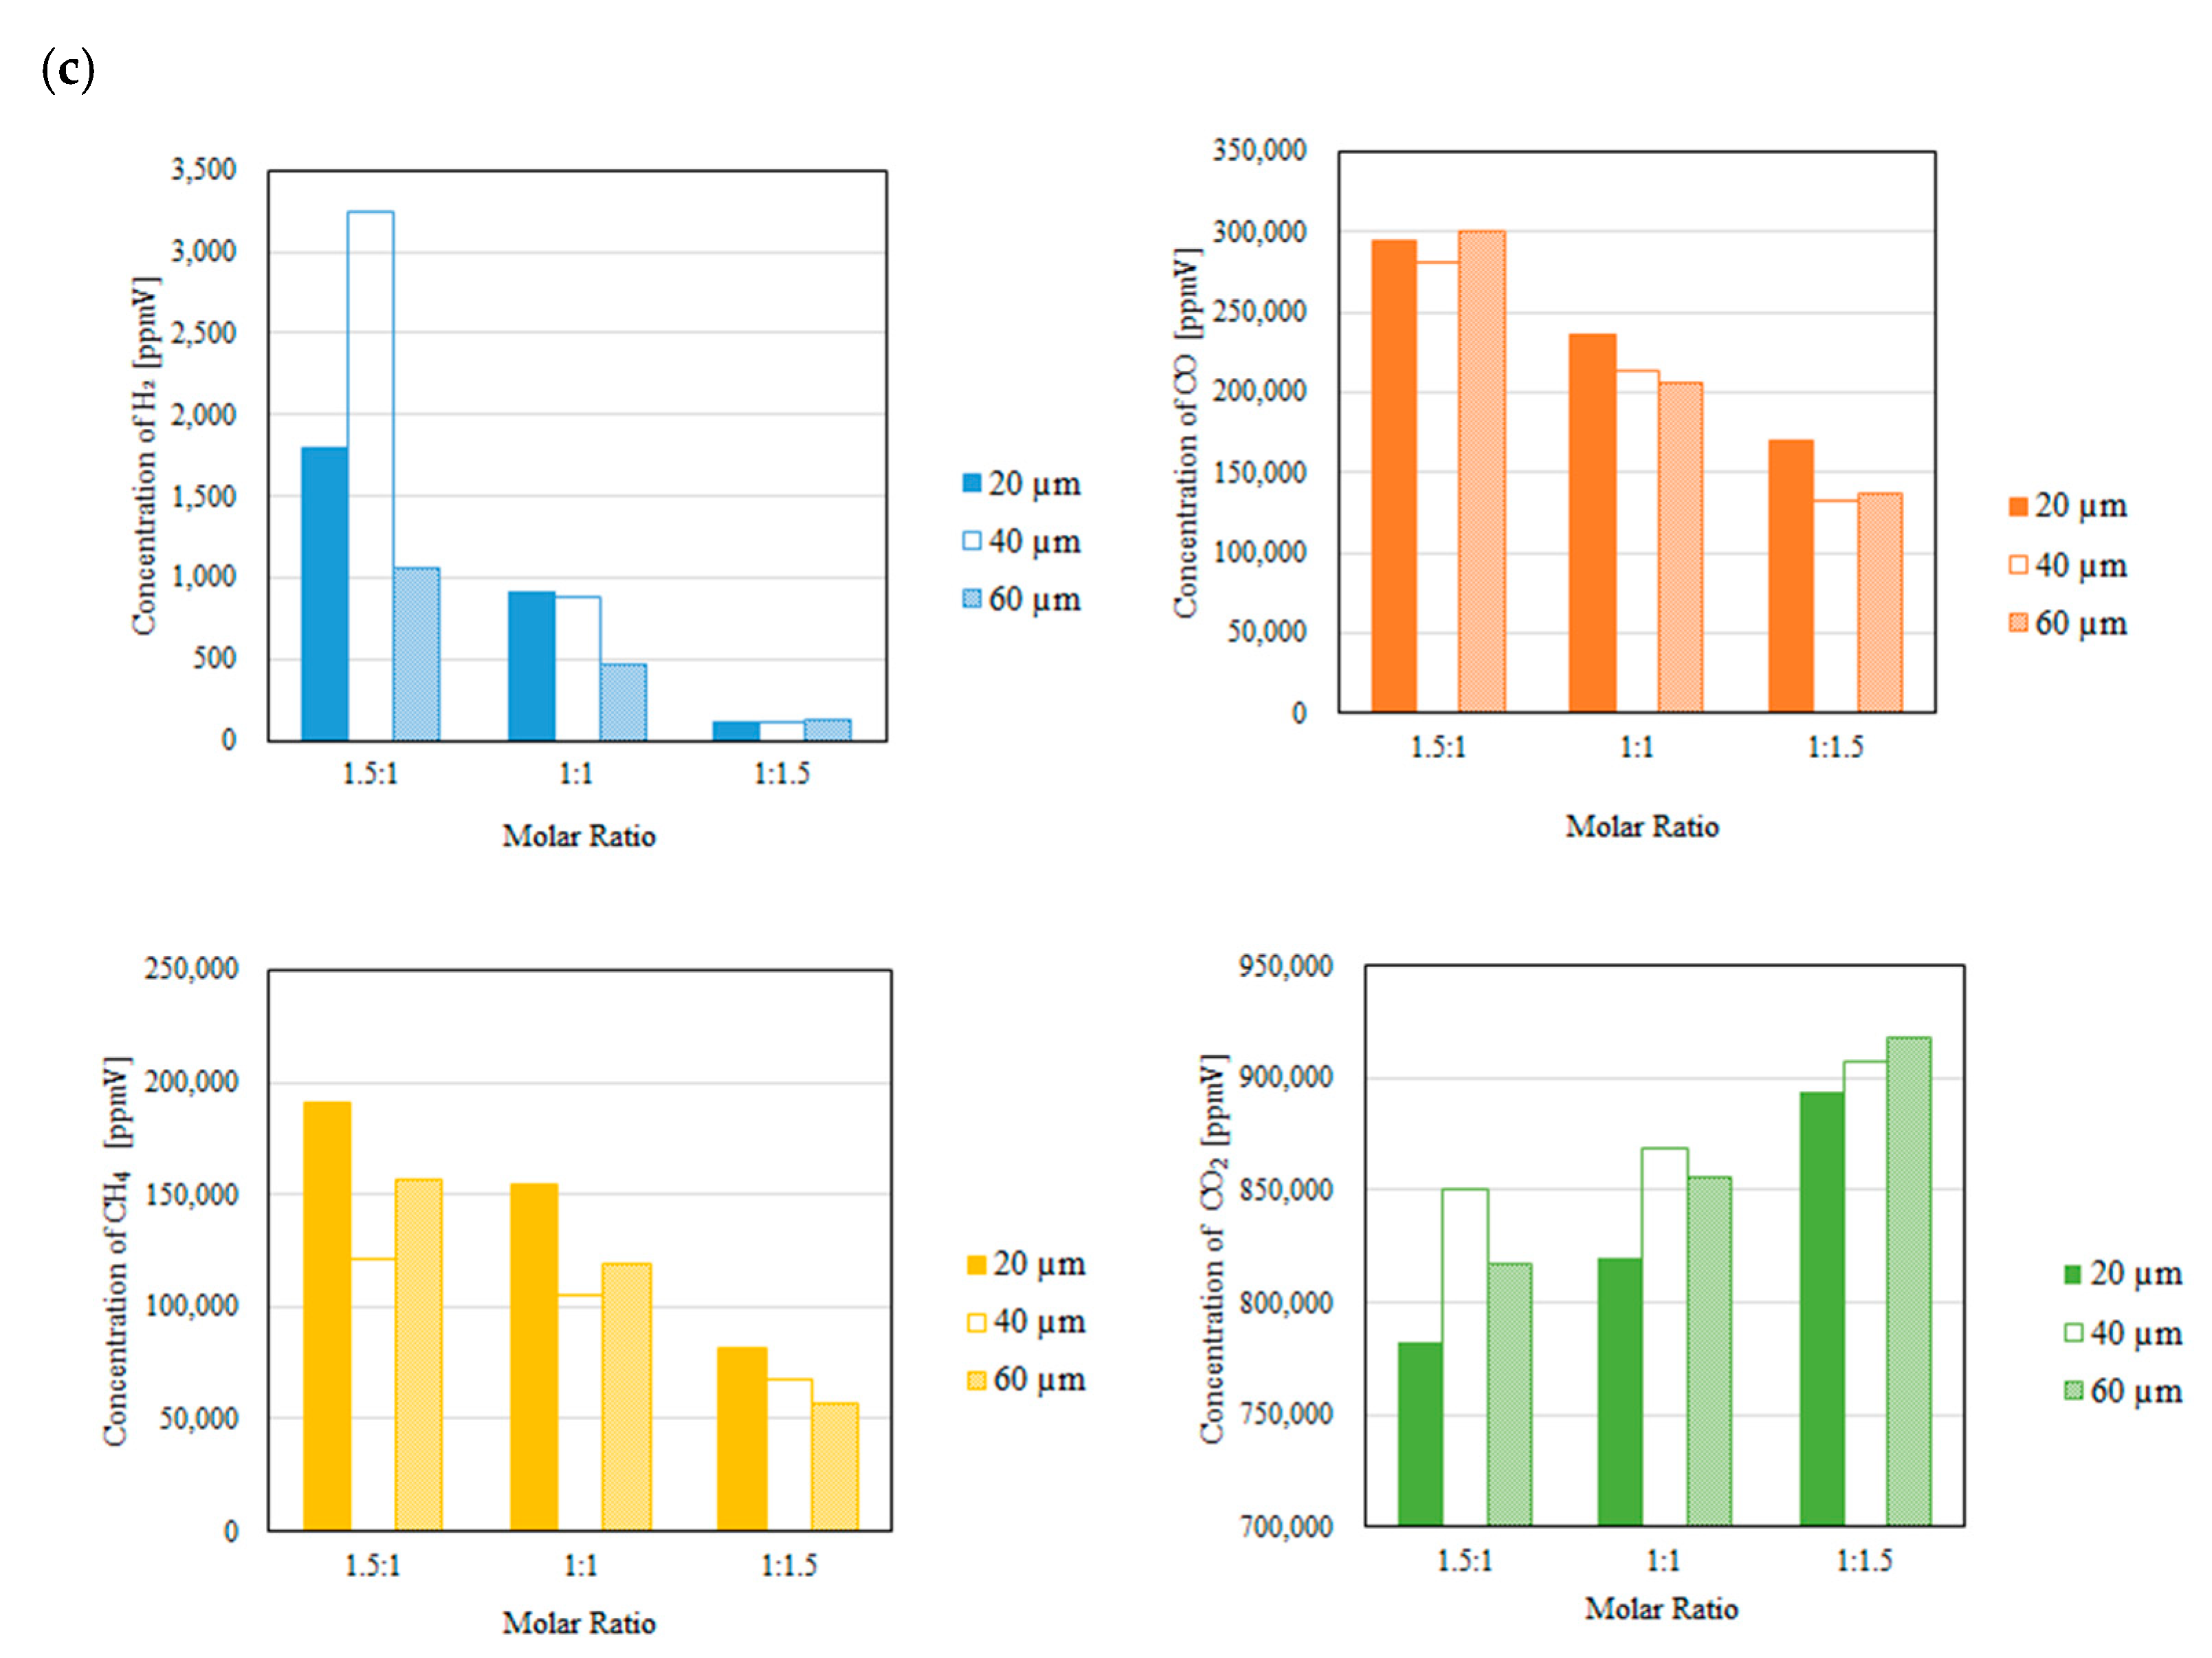
Figure 9.
Impact of thickness of Pd/Cu membrane on the concentration of H2 in the sweep changing the molar ratio without a sweep gas (CH4:CO2 = 1.5:1, differential pressure (a): 0 MPa, (b): 0.010 MPa, (c): 0.020 MPa).
Figure 9.
Impact of thickness of Pd/Cu membrane on the concentration of H2 in the sweep changing the molar ratio without a sweep gas (CH4:CO2 = 1.5:1, differential pressure (a): 0 MPa, (b): 0.010 MPa, (c): 0.020 MPa).
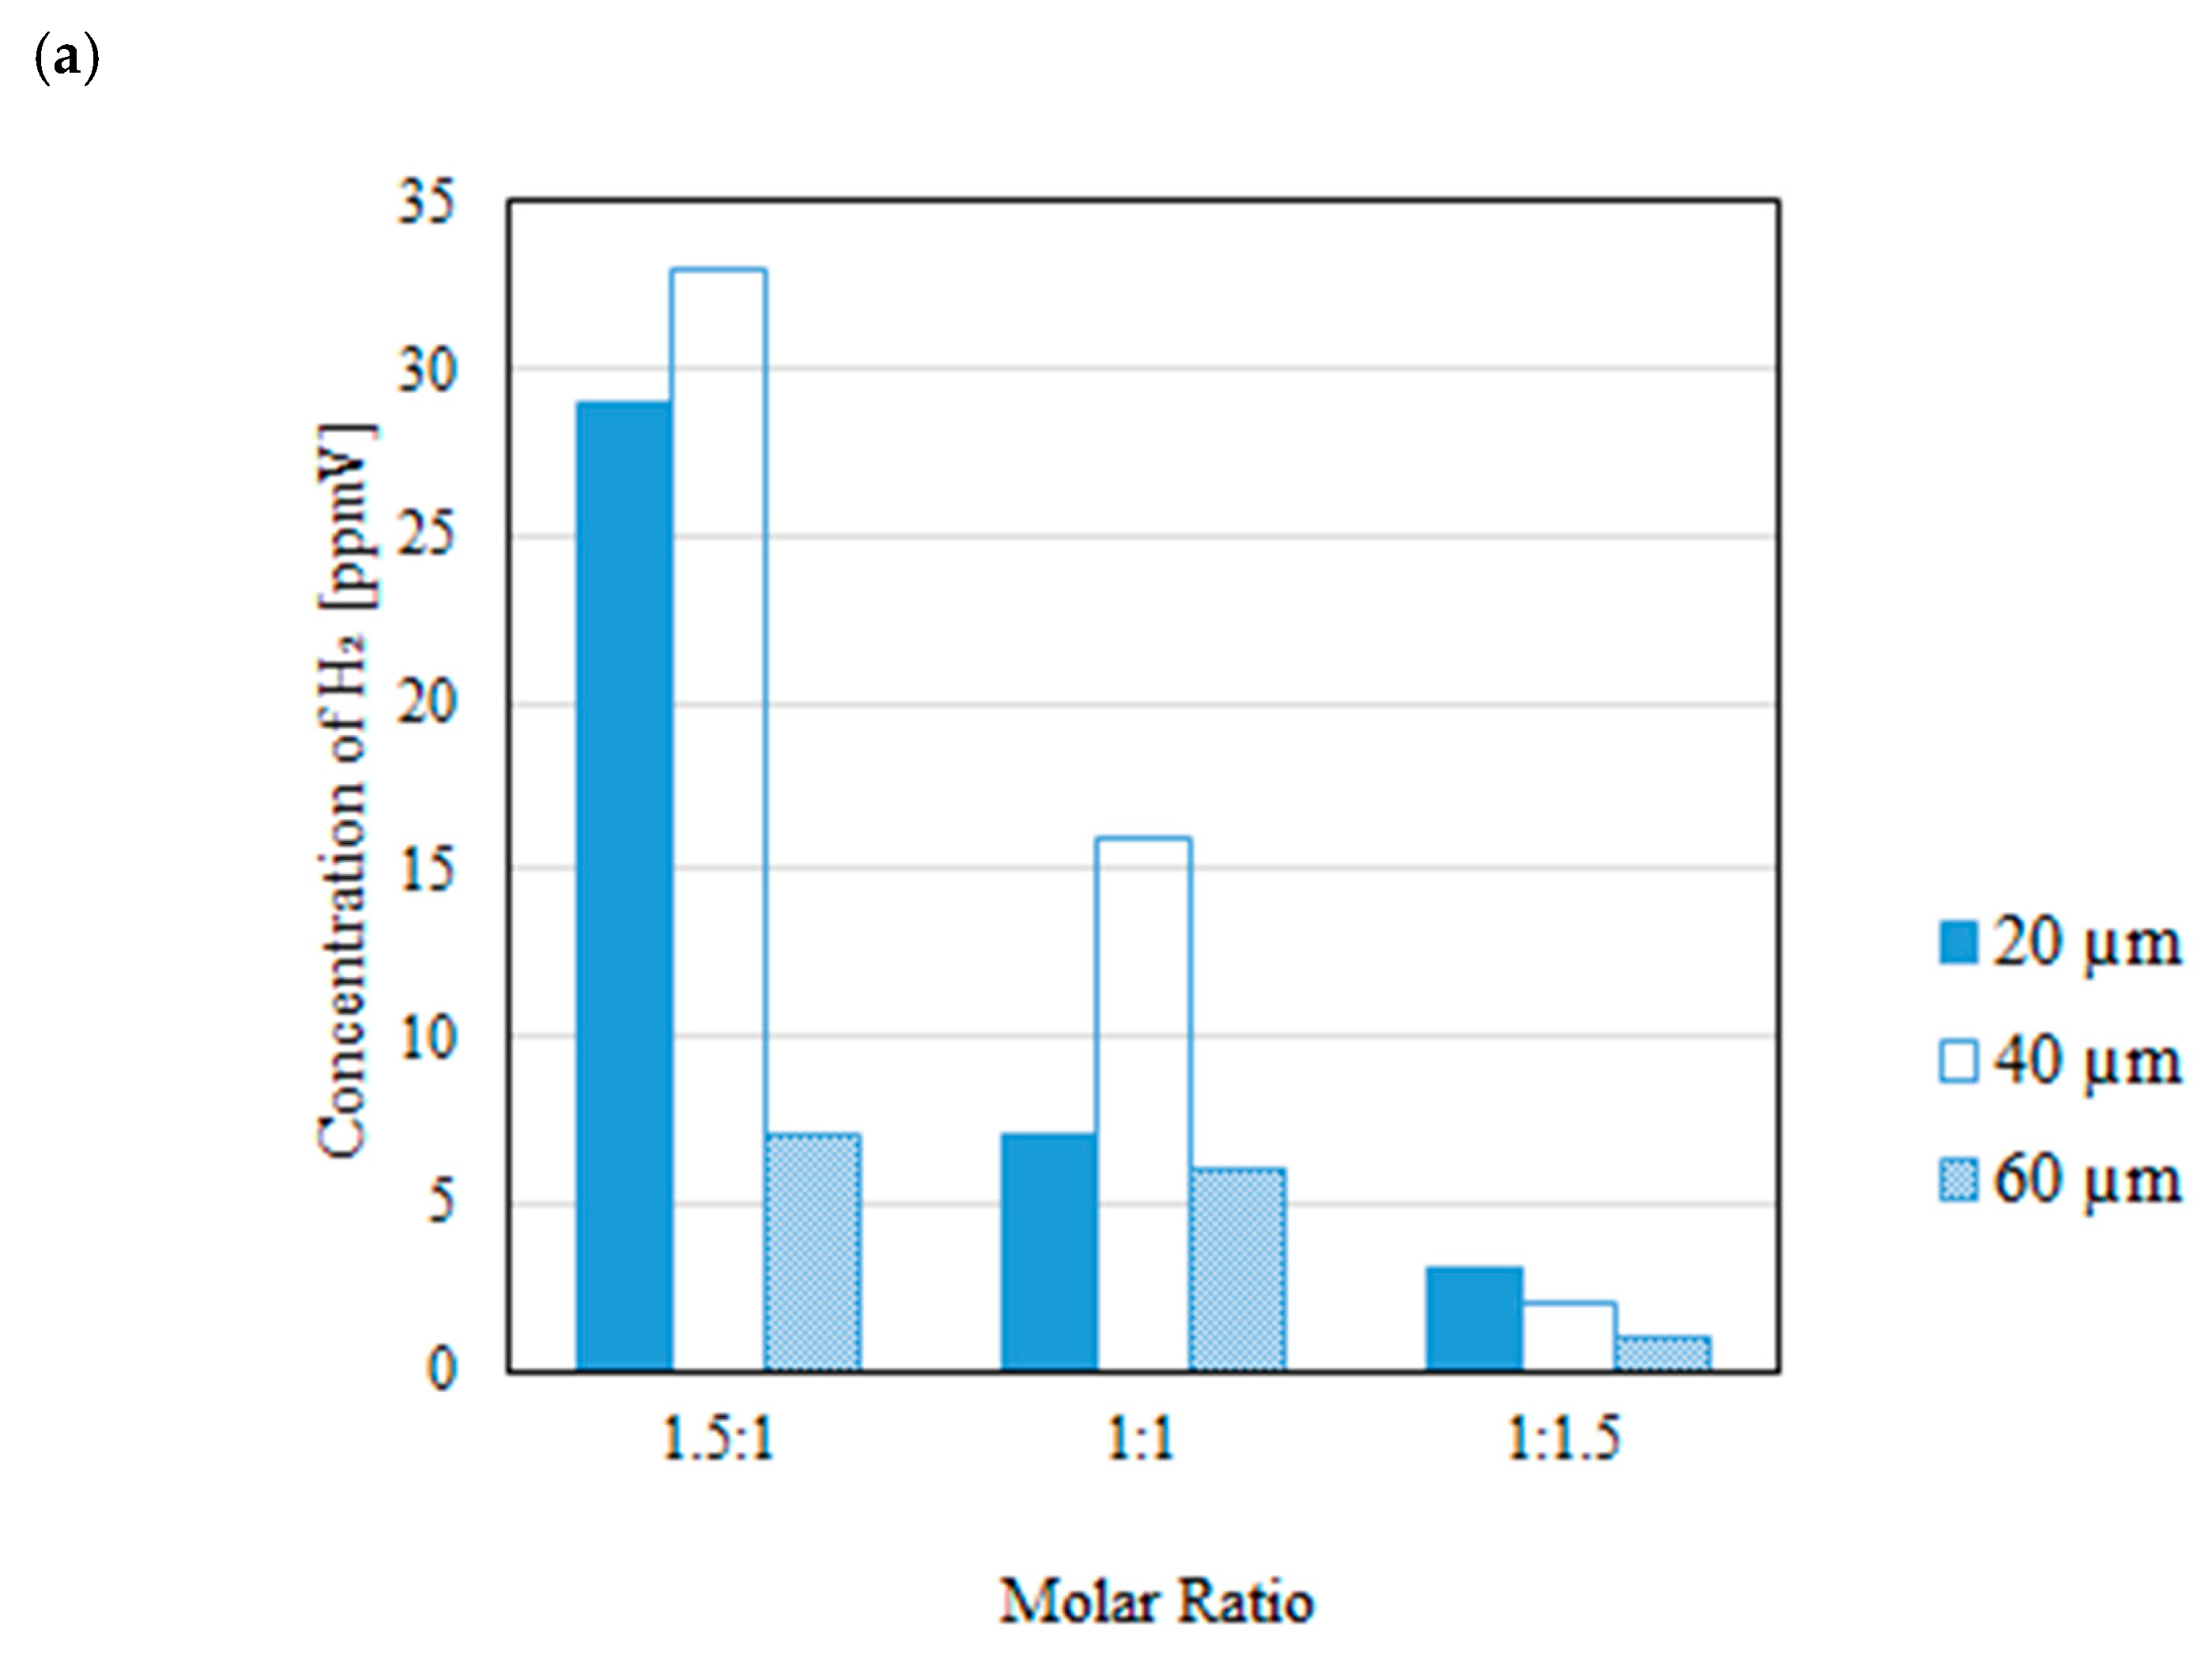
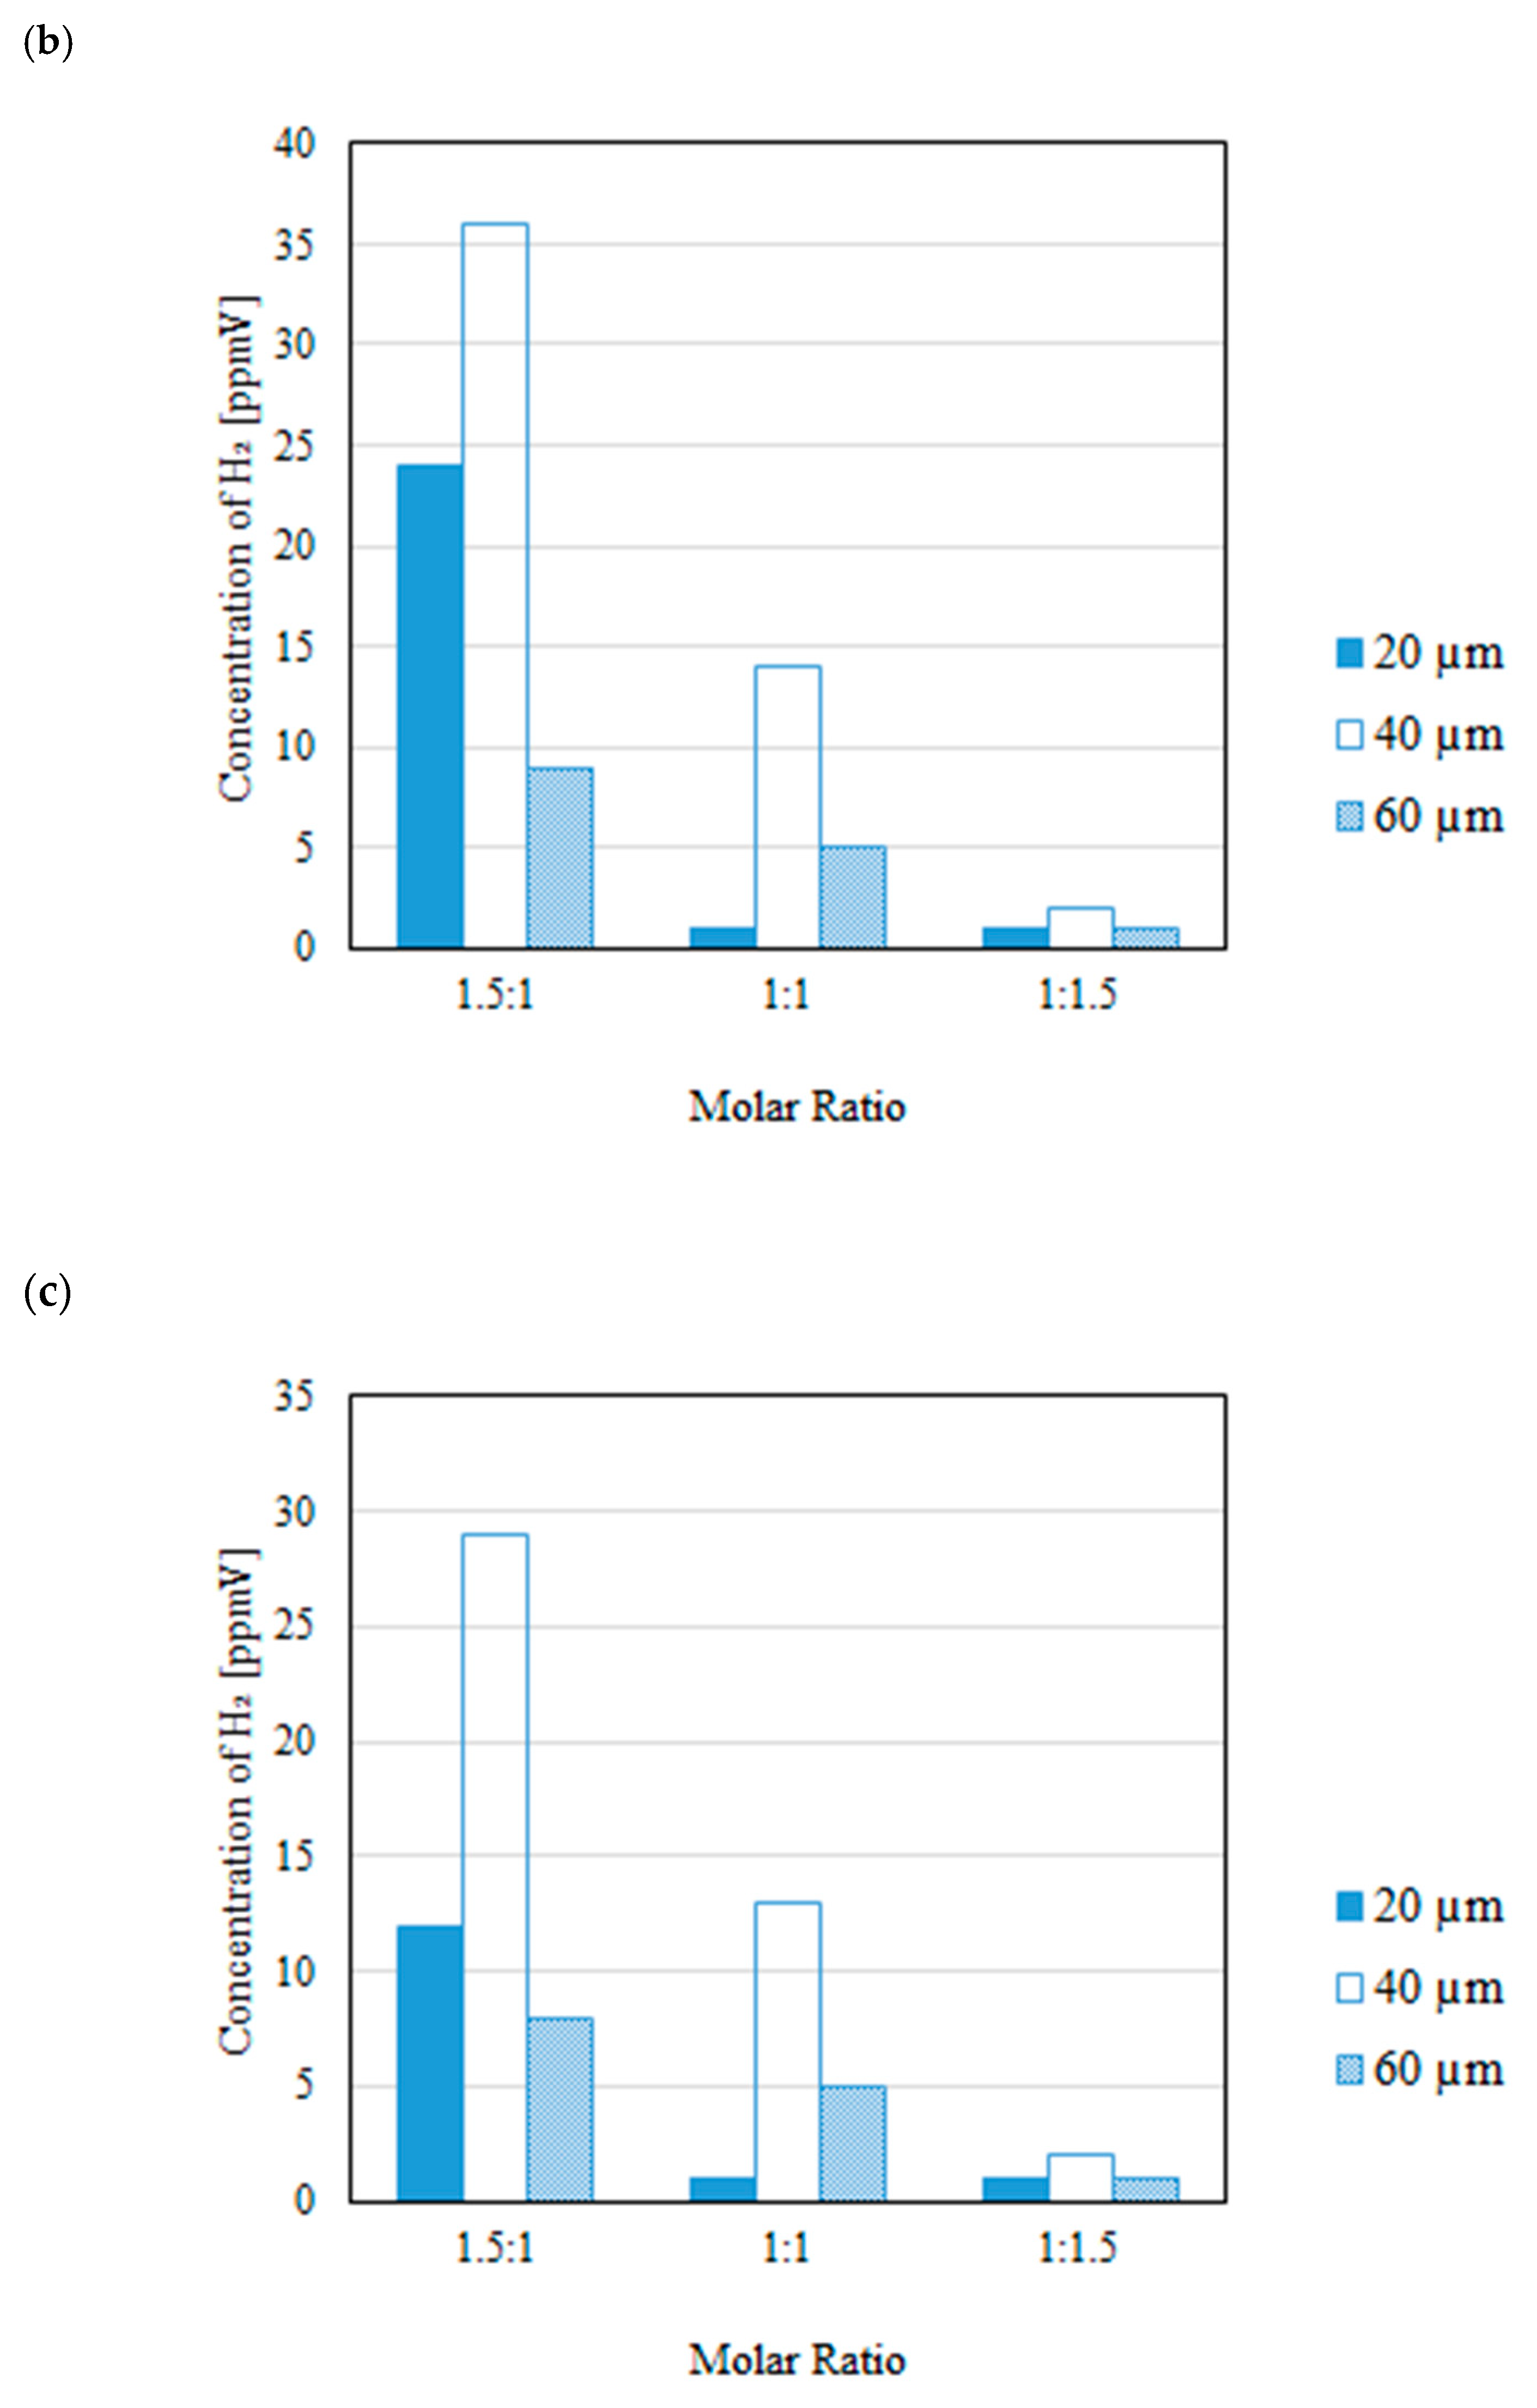
Figure 10.
Impact of thickness of Pd/Cu membrane on each gas concentration in the reaction chamber changing the molar ratio with a sweep gas (CH4:CO2 = 1.5:1, differential pressure (a): 0 MPa, (b): 0.010 MPa, (c): 0.020 MPa).
Figure 10.
Impact of thickness of Pd/Cu membrane on each gas concentration in the reaction chamber changing the molar ratio with a sweep gas (CH4:CO2 = 1.5:1, differential pressure (a): 0 MPa, (b): 0.010 MPa, (c): 0.020 MPa).
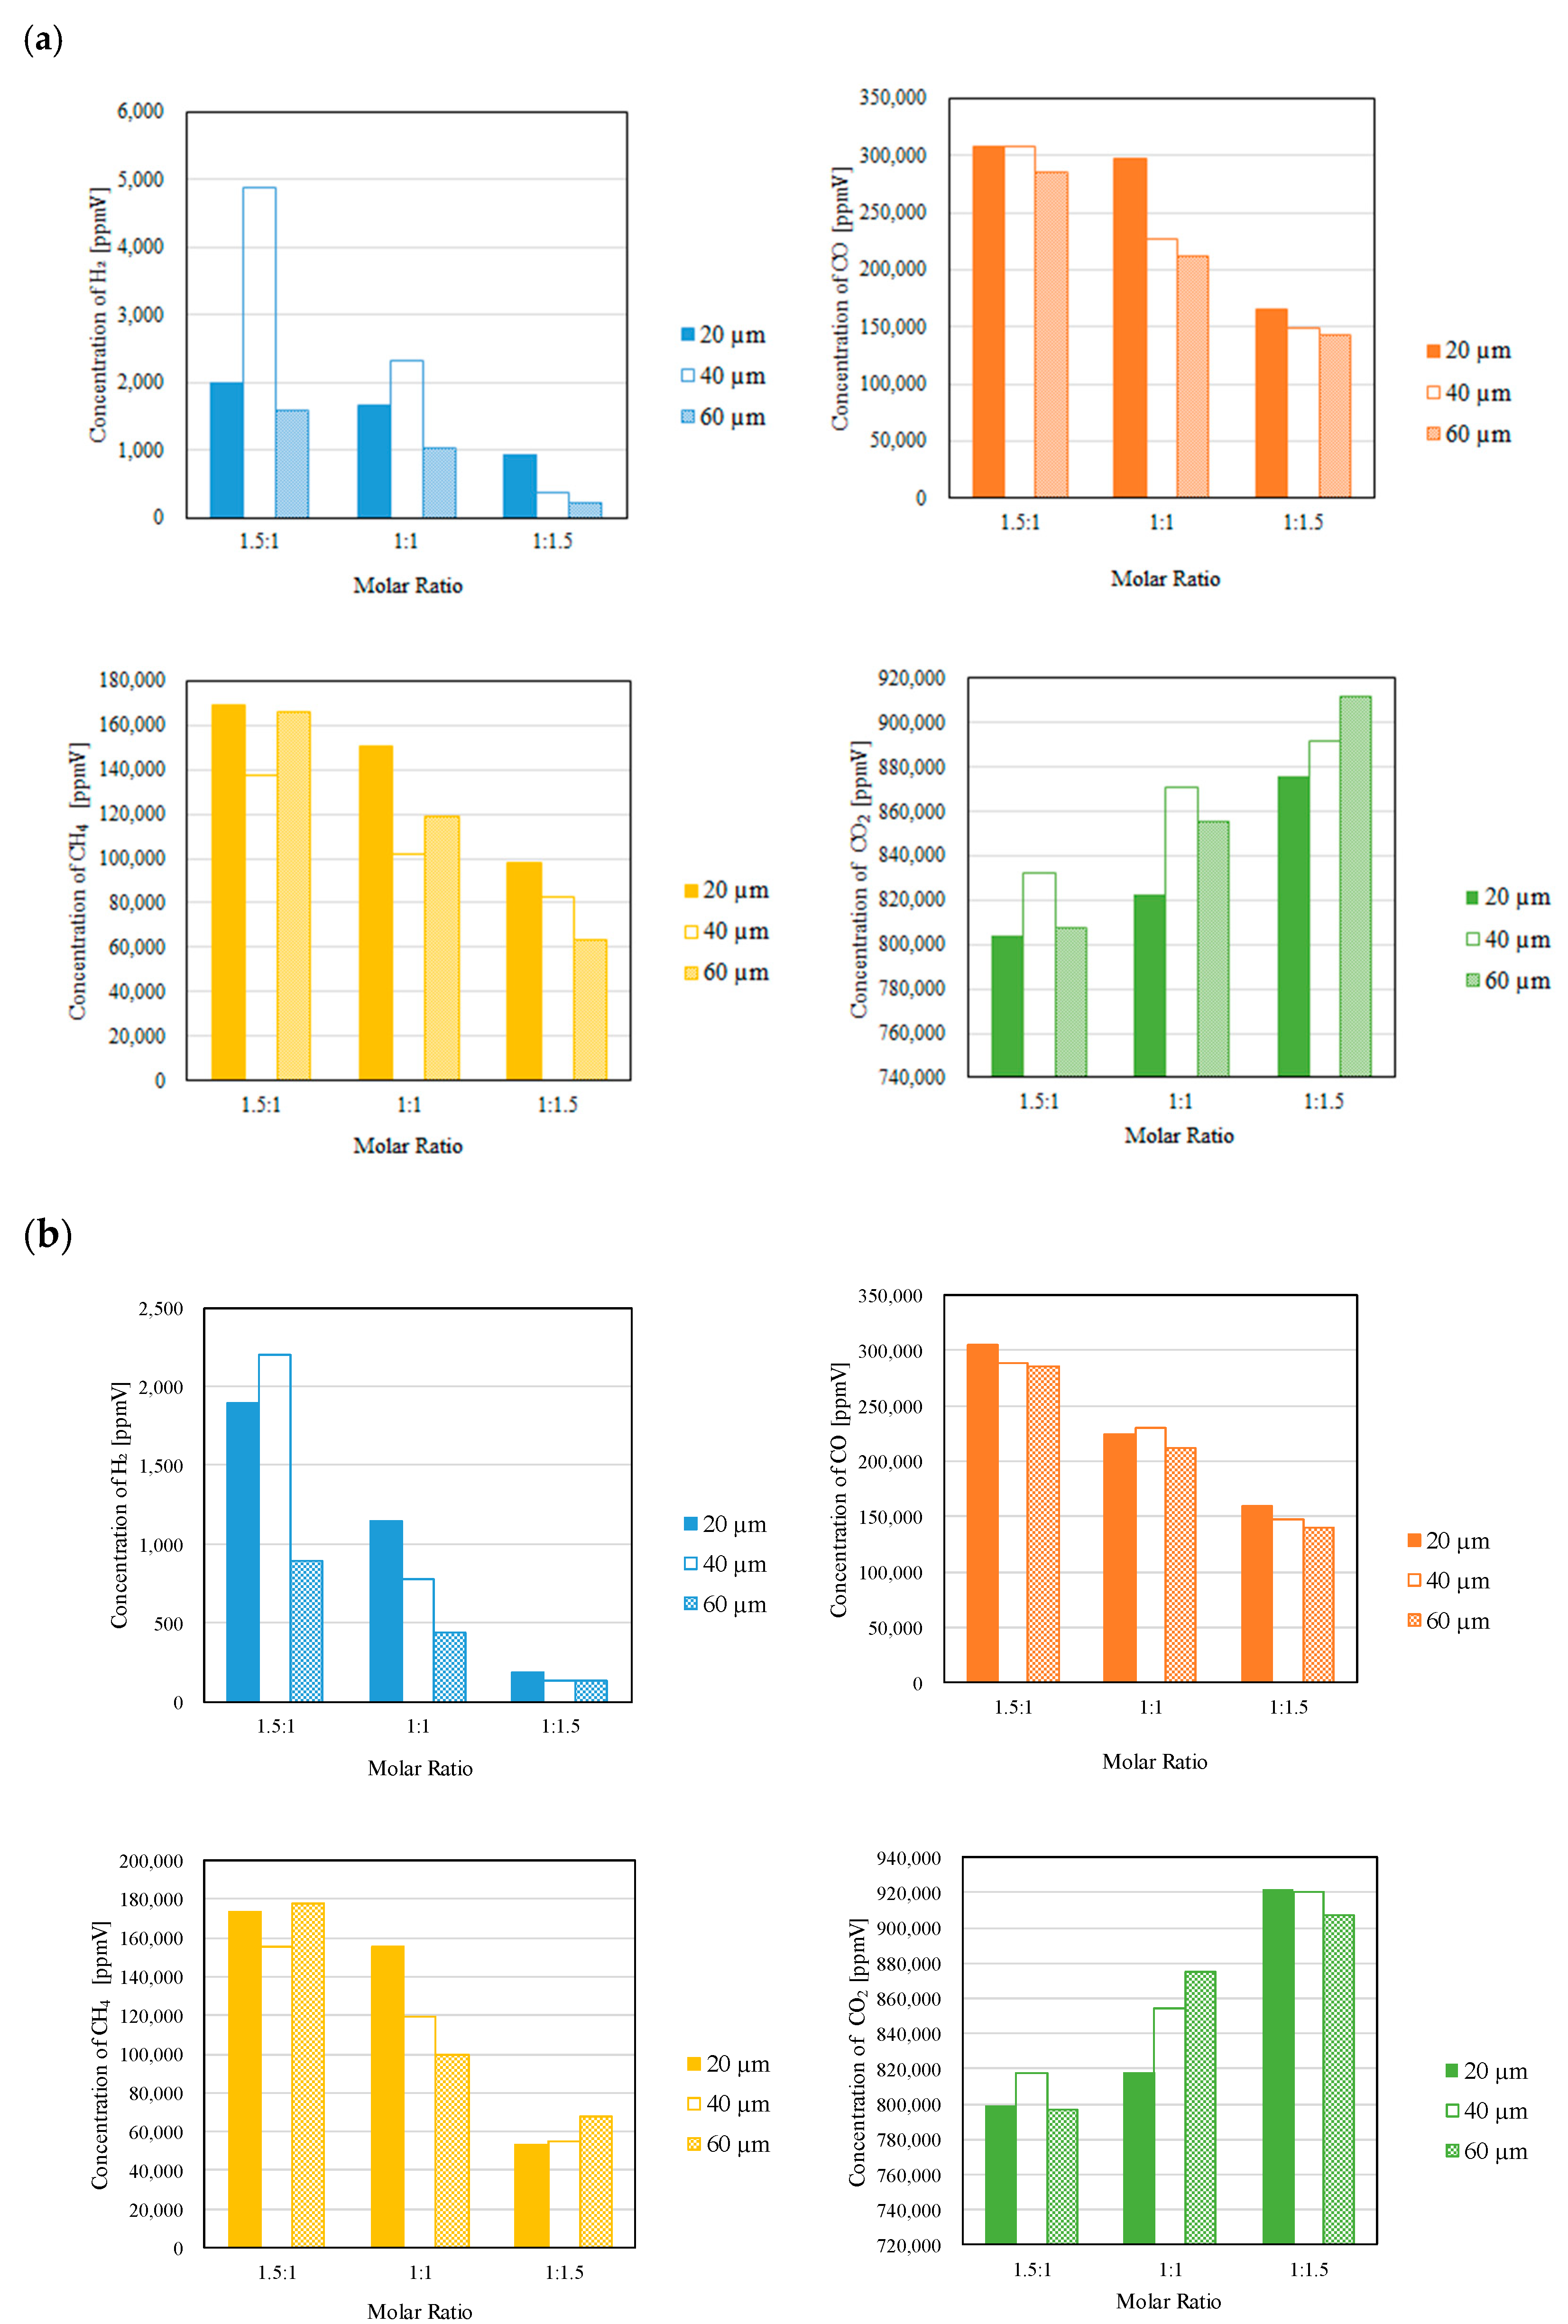
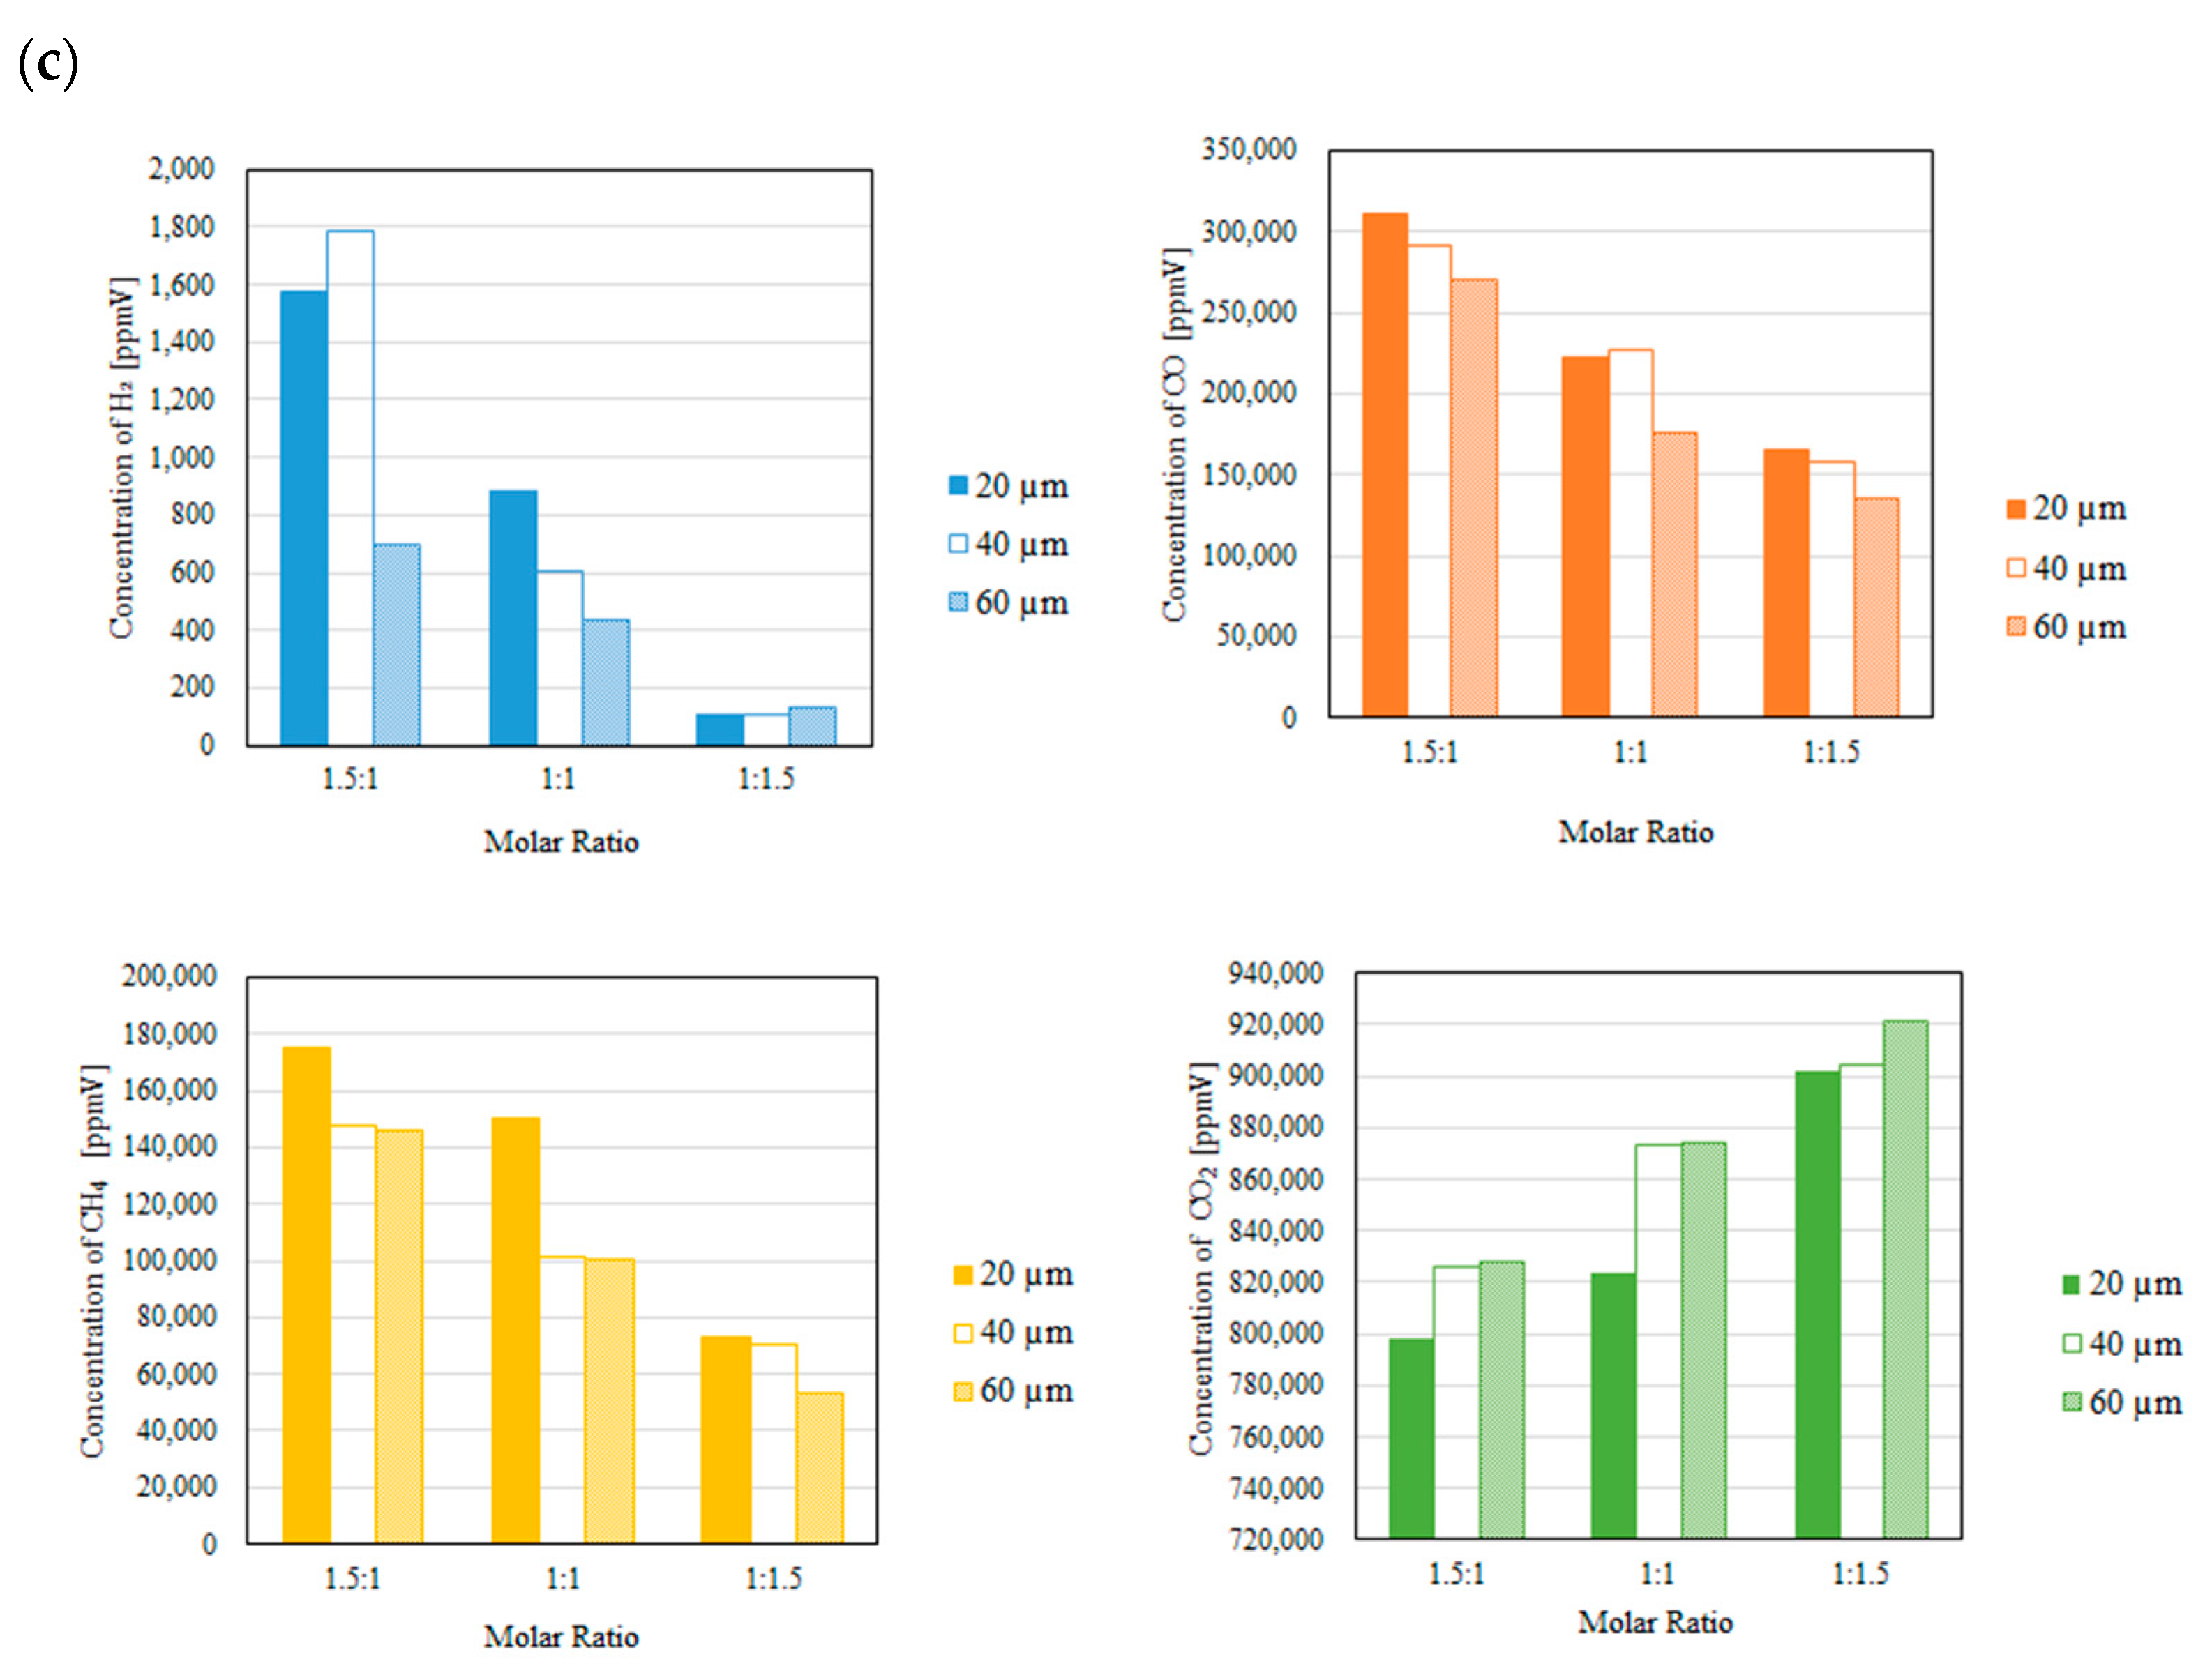
Figure 11.
Impact of thickness of Pd/Cu membrane on the concentration of H2 in the sweep changing the molar ratio with a sweep gas (CH4:CO2 = 1.5:1, differential pressure (a): 0 MPa, (b): 0.010 MPa, (c): 0.020 MPa).
Figure 11.
Impact of thickness of Pd/Cu membrane on the concentration of H2 in the sweep changing the molar ratio with a sweep gas (CH4:CO2 = 1.5:1, differential pressure (a): 0 MPa, (b): 0.010 MPa, (c): 0.020 MPa).
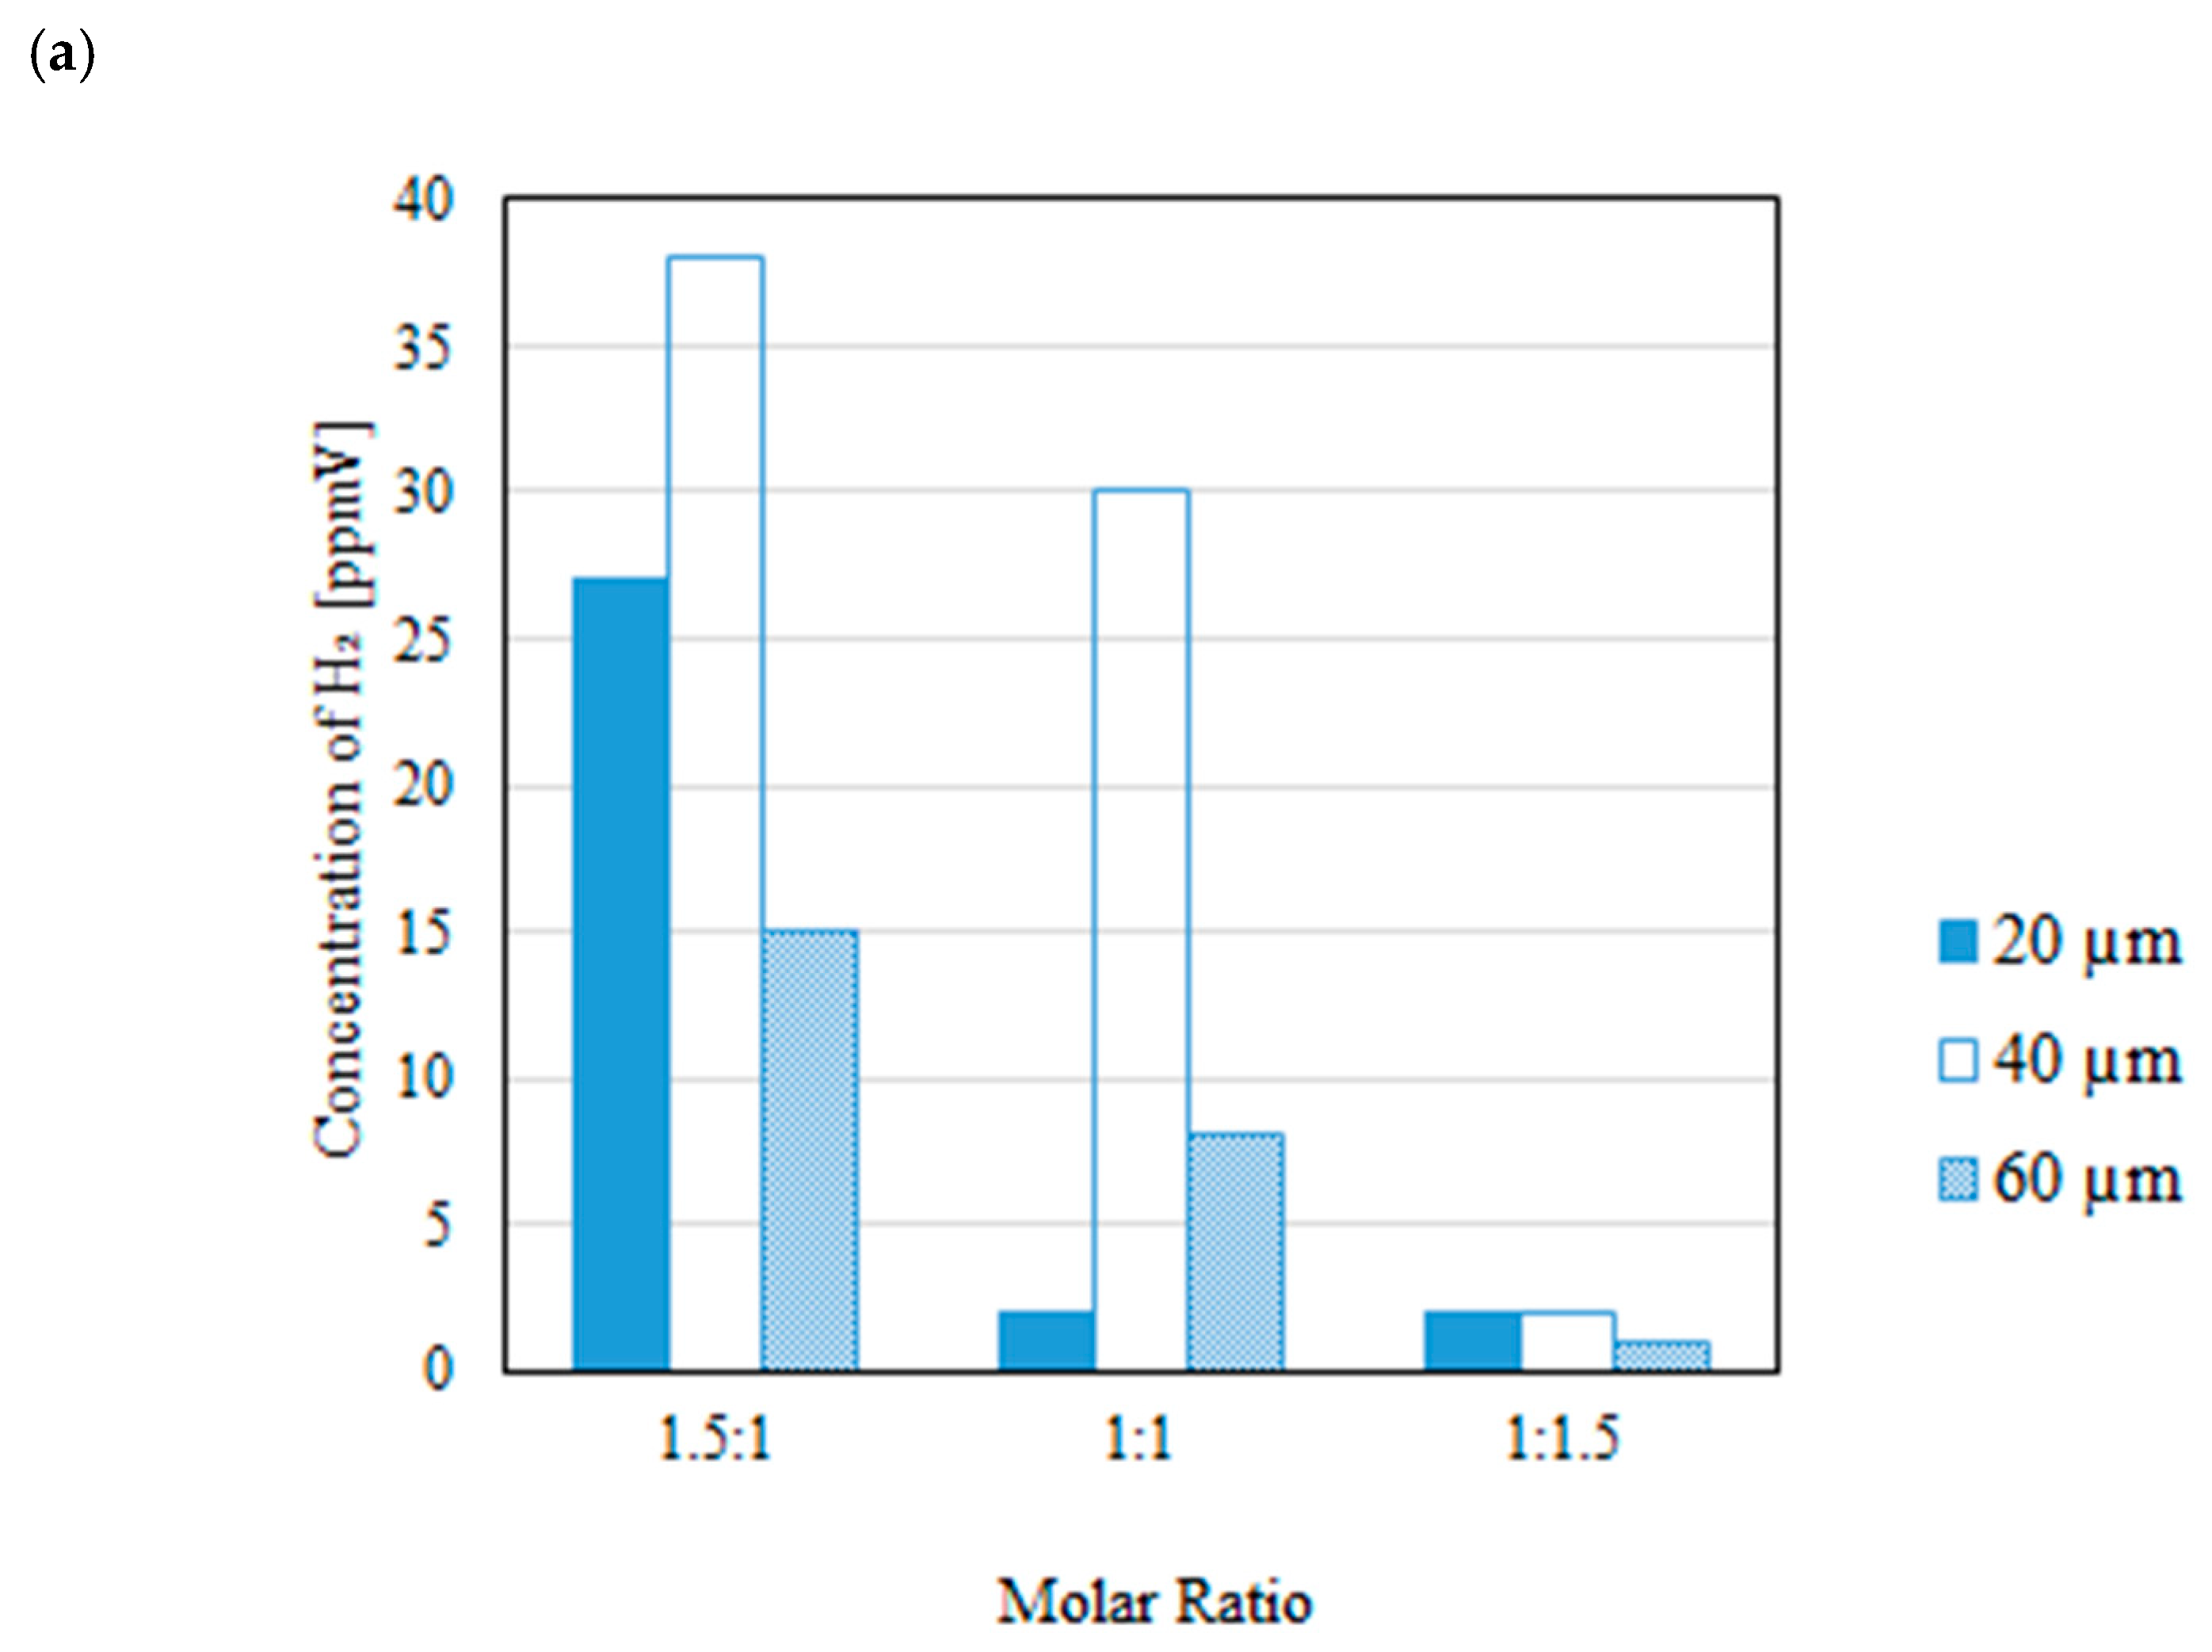
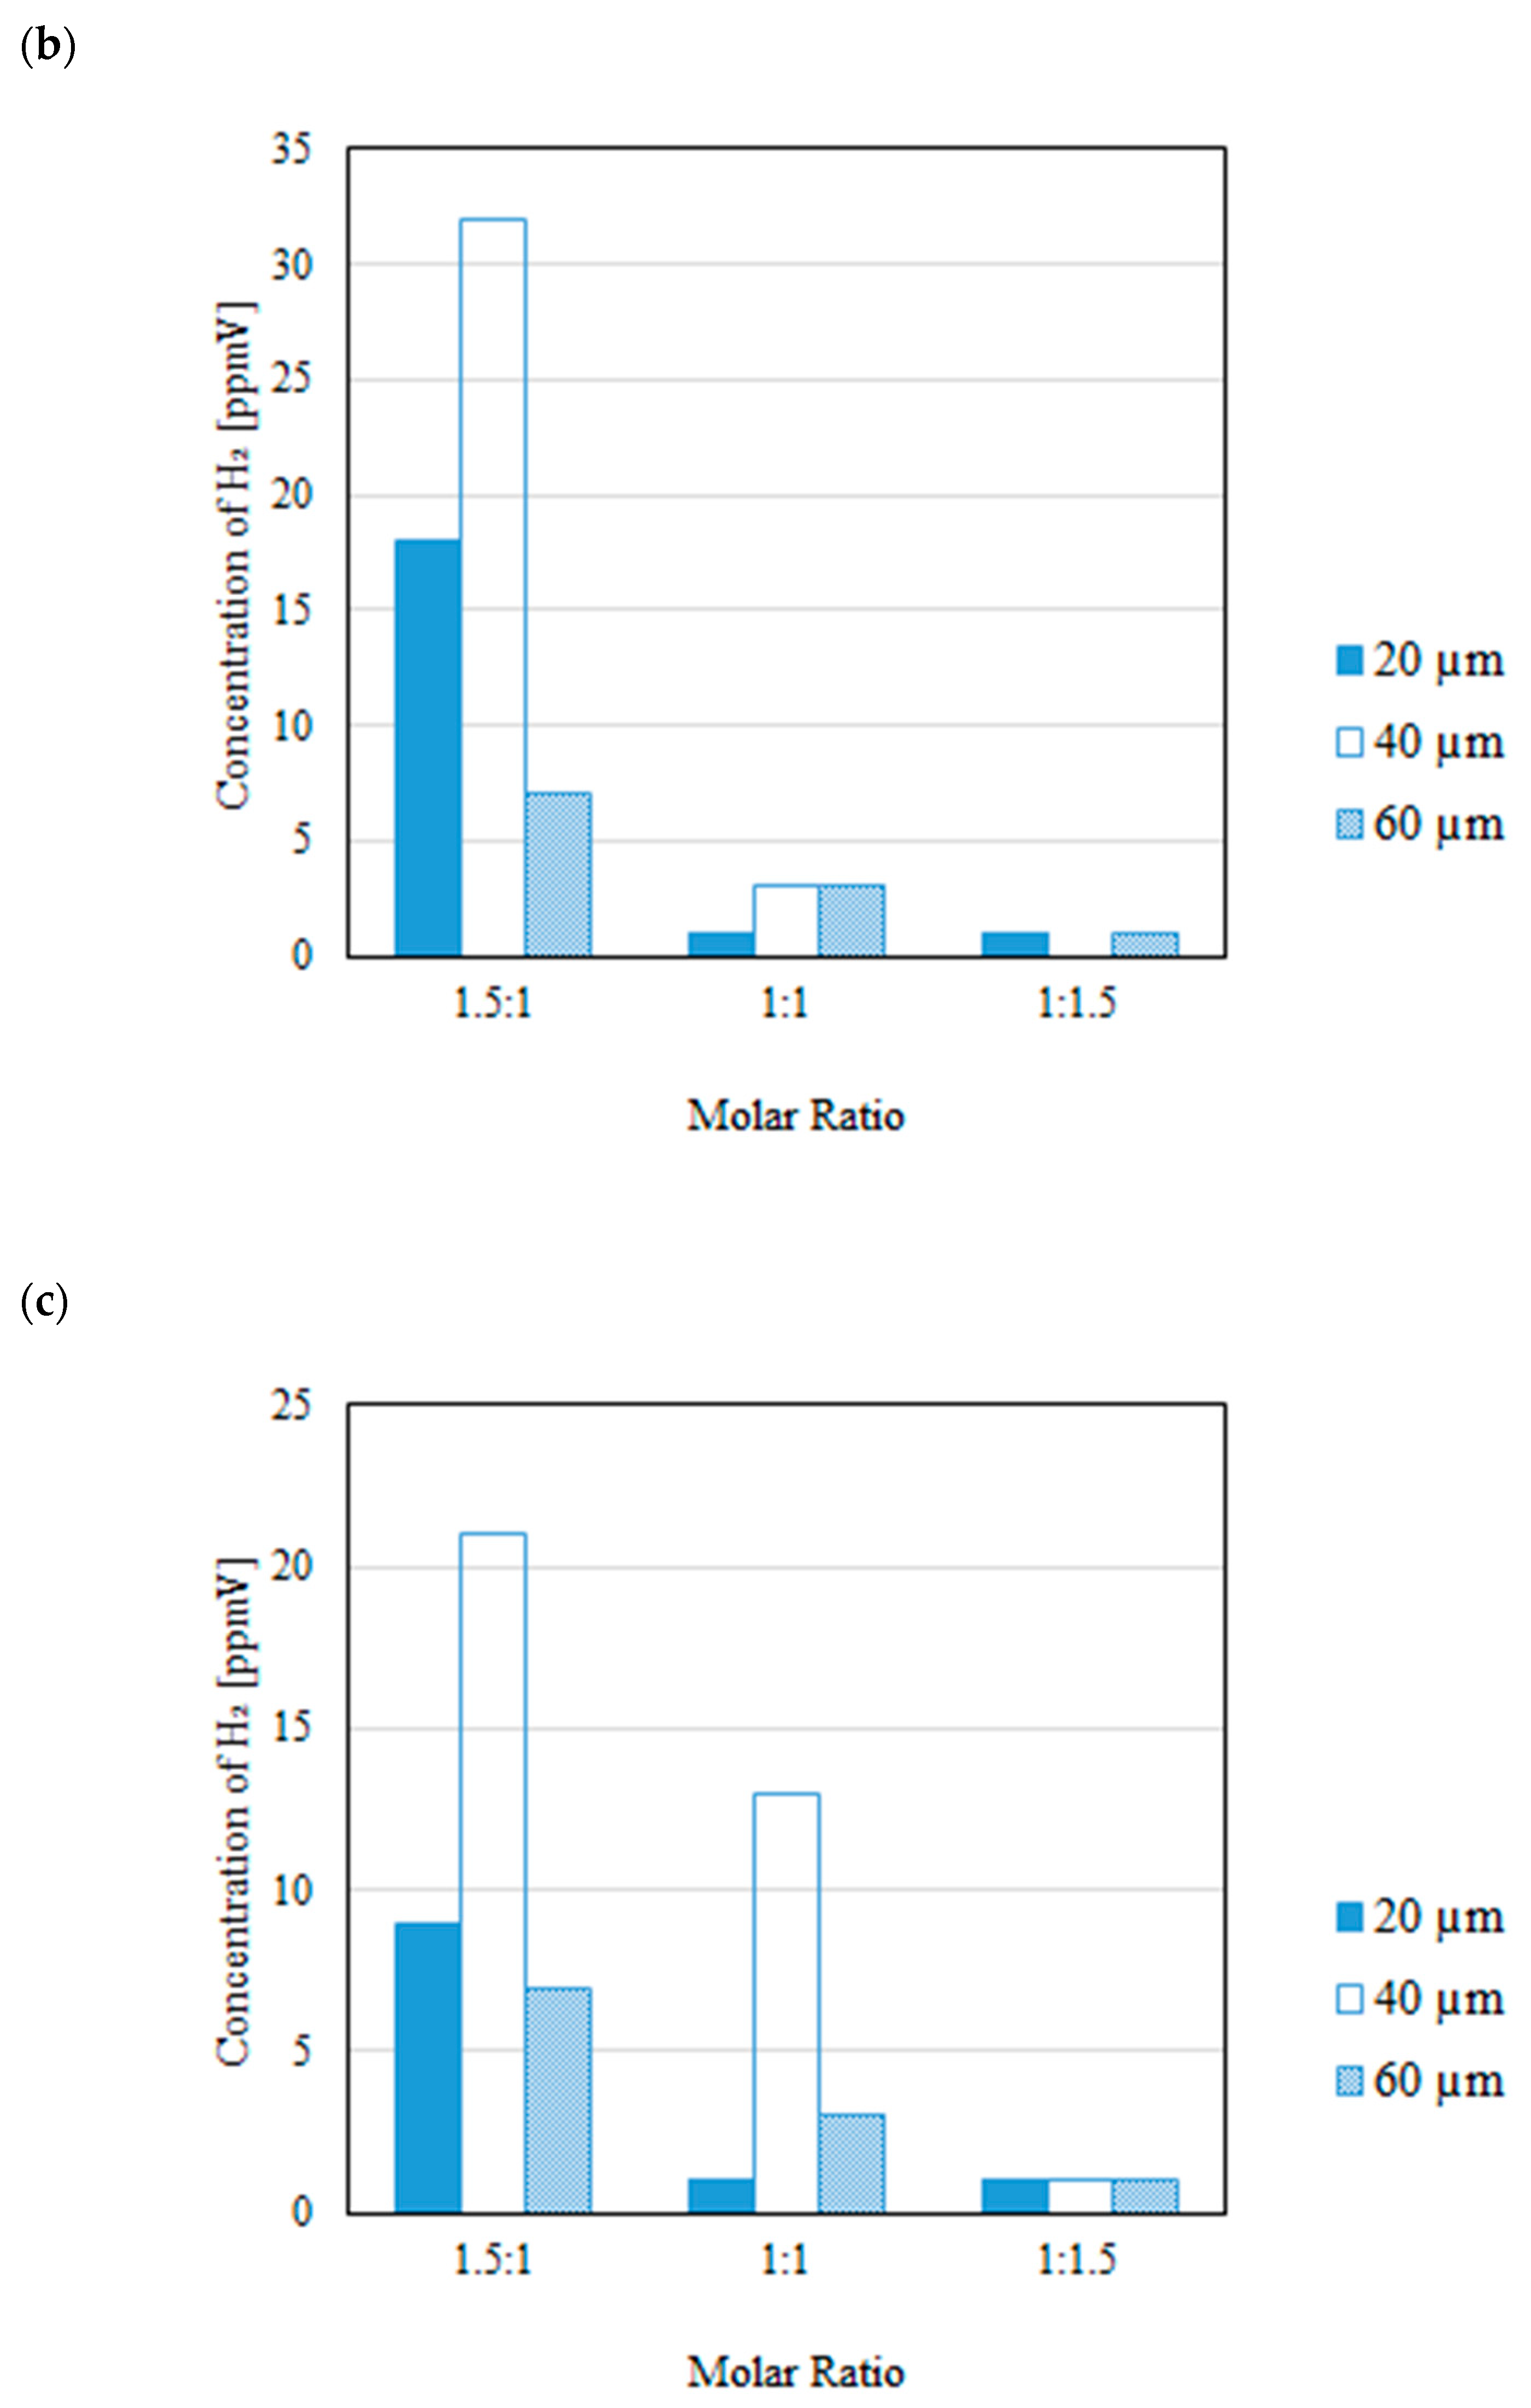
Figure 12.
Photo of the captured H2O using the gas bag.
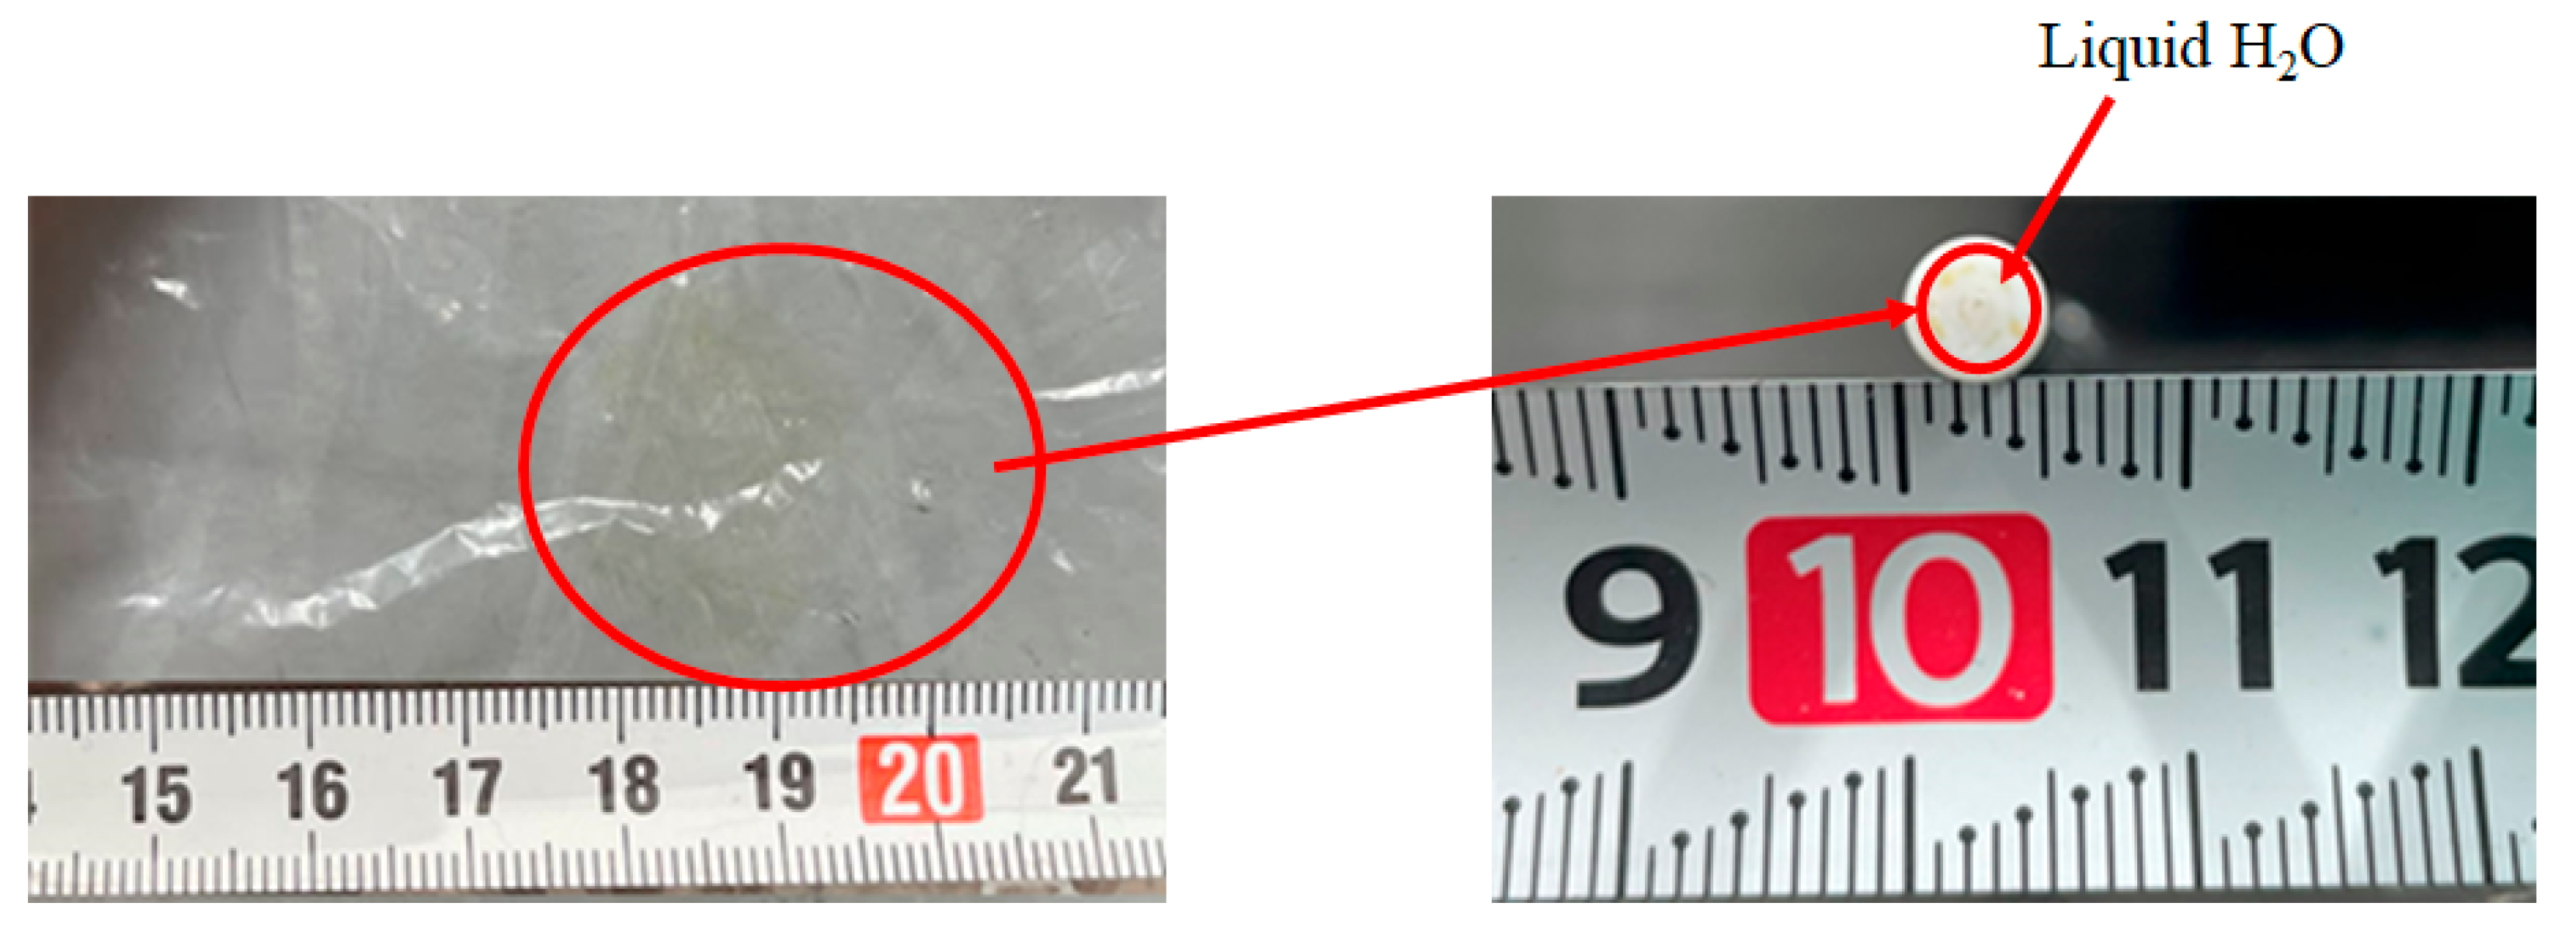

Table 1.
Parameters of the experimental conditions.
| Parameters | Values |
| Initial reaction temperature [°C] | 400, 500, 600 |
| Pressure of supply gas [MPa] | 0.10 |
| Differential pressure between the reaction chamber and the sweep chamber [MPa] |
0, 0.010 and 0.020 |
| Molar ratio of provided CH4:CO2 (flow rate of provided CH4:CO2 [NL/min]) |
1.5:1, 1:1 and 1:1.5 (1.088:0.725, 0.725:0.725, 0.725:1.088) |
| Feed ratio of sweep gas to supply gas [-] | 0 (W/O), 1.0 (W) |
Table 2.
Comparison of CH4 conversion, CO2 conversion, H2 yield, H2 selectivity, CO selectivity, H2 recovery, permeation flux, and thermal efficiency (reaction temperature: 600 °C, pressure difference: 0 MPa, molar ratio of CH4:CO2 (a) 1.5:1, (b) 1:1, (c) 1:1.5).
Table 2.
Comparison of CH4 conversion, CO2 conversion, H2 yield, H2 selectivity, CO selectivity, H2 recovery, permeation flux, and thermal efficiency (reaction temperature: 600 °C, pressure difference: 0 MPa, molar ratio of CH4:CO2 (a) 1.5:1, (b) 1:1, (c) 1:1.5).
| Thickness of Pd/Cu membrane [μm] |
Sweep gas | CH4 conversion [%] |
CO2 conversion [%] |
H2 yield [%] |
H2 selectivity [%] |
CO selectivity [%] |
H2 recovery [%] |
Permeation flux [mol/(m2 ⋅ s)] | Thermal efficiency [%] |
| (a) | |||||||||
| 20 | W/O | 67.1 | -93.6 | 0.259 | 0.933 | 99.1 | 0.933 | 0 | 3.55 |
| W | 71.8 | -101 | 0.167 | 0.649 | 99.4 | 1.34 | 0 | 1.46 | |
| 40 | W/O | 75.0 | -106 | 0.214 | 0.766 | 99.2 | 1.29 | 0 | 2.92 |
| W | 77.1 | -108 | 0.411 | 1.57 | 98.4 | 0.771 | 0 | 3.59 | |
| 60 | W/O | 69.1 | -97.2 | 5.72×10⁻² | 0.238 | 99.8 | 1.02 | 0 | 0.783 |
| W | 72.3 | -102 | 0.132 | 0.552 | 99.4 | 0.944 | 0 | 1.16 | |
| (b) | |||||||||
| 20 | W/O | 64.9 | -59.4 | 0.241 | 0.812 | 99.2 | 0.290 | 0 | 2.76 |
| W | 69.8 | -64.5 | 0.167 | 0.557 | 99.4 | 0.120 | 0 | 1.22 | |
| 40 | W/O | 79.9 | -74.6 | 0.148 | 0.585 | 99.4 | 1.08 | 0 | 1.69 |
| W | 79.7 | -74.2 | 0.236 | 1.030 | 99.0 | 1.27 | 0 | 1.71 | |
| 60 | W/O | 81.2 | -76.0 | 8.80×10⁻² | 0.425 | 99.6 | 0.682 | 0 | 1.00 |
| W | 76.2 | -71.0 | 0.103 | 0.483 | 99.5 | 0.776 | 0 | 0.750 | |
| (c) | |||||||||
| 20 | W/O | 80.0 | -49.0 | 0.129 | 0.660 | 99.3 | 0.291 | 0 | 1.18 |
| W | 75.5 | -46.0 | 0.116 | 0.561 | 99.4 | 0.216 | 0 | 0.677 | |
| 40 | W/O | 88.2 | -54.6 | 2.21×10⁻² | 0.102 | 99.9 | 1.13 | 0 | 0.200 |
| W | 79.3 | -48.6 | 4.49×10⁻² | 0.239 | 99.8 | 0.557 | 0 | 0.261 | |
| 60 | W/O | 80.4 | -49.4 | 1.39×10⁻² | 7.41×10⁻² | 99.9 | 0.900 | 0 | 0.126 |
| W | 84.2 | -51.9 | 2.71×10⁻² | 0.151 | 99.8 | 0.462 | 0 | 0.158 | |
Table 3.
Comparison of CH4 conversion, CO2 conversion, H2 yield, H2 selectivity, CO selectivity, H2 recovery, permeation flux, and thermal efficiency (reaction temperature: 600 °C, pressure difference: 0.010 MPa, molar ratio of CH4:CO2 (a) 1.5:1, (b) 1:1, (c) 1:1.5).
Table 3.
Comparison of CH4 conversion, CO2 conversion, H2 yield, H2 selectivity, CO selectivity, H2 recovery, permeation flux, and thermal efficiency (reaction temperature: 600 °C, pressure difference: 0.010 MPa, molar ratio of CH4:CO2 (a) 1.5:1, (b) 1:1, (c) 1:1.5).
| Thickness of Pd/Cu membrane [μm] |
Sweep gas | CH4 conversion [%] |
CO2 conversion [%] |
H2 yield [%] |
H2 selectivity [%] |
CO selectivity [%] |
H2 recovery [%] |
Permeation flux [mol/(m2 ⋅ s)] | Thermal efficiency [%] |
| (a) | |||||||||
| 20 | W/O | 70.4 | -98.9 | 0.171 | 0.638 | 99.4 | 1.17 | 5.00×10⁻⁴ | 2.34 |
| W | 71.0 | -99.8 | 0.160 | 0.624 | 99.4 | 0.938 | 5.00×10⁻⁴ | 1.40 | |
| 40 | W/O | 72.1 | -101 | 0.315 | 1.16 | 98.8 | 0.953 | 2.50×10⁻⁴ | 4.31 |
| W | 74.2 | -104 | 0.186 | 0.751 | 99.2 | 1.43 | 2.50×10⁻⁴ | 1.62 | |
| 60 | W/O | 72.9 | -103 | 0.126 | 0.549 | 99.5 | 0.595 | 1.67×10⁻⁴ | 1.73 |
| W | 70.5 | -99.2 | 7.47×10⁻² | 0.311 | 99.7 | 0.781 | 1.67×10⁻⁴ | 0.653 | |
| (b) | |||||||||
| 20 | W/O | 70.8 | -65.6 | 0.128 | 0.595 | 99.4 | 7.80×10⁻² | 5.00×10⁻⁴ | 1.47 |
| W | 68.9 | -63.7 | 0.115 | 0.509 | 99.5 | 8.70×10⁻² | 5.00×10⁻⁴ | 0.841 | |
| 40 | W/O | 76.3 | -71.1 | 0.118 | 0.570 | 99.4 | 1.19 | 2.50×10⁻⁴ | 1.34 |
| W | 76.1 | -70.9 | 7.82×10⁻² | 0.330 | 99.7 | 0.384 | 2.50×10⁻⁴ | 0.571 | |
| 60 | W/O | 80.1 | -75.0 | 4.97×10⁻² | 0.240 | 99.8 | 1.01 | 1.67×10⁻⁴ | 0.565 |
| W | 80.1 | -75.0 | 4.40×10⁻² | 0.200 | 99.8 | 0.682 | 1.67×10⁻⁴ | 0.320 | |
| (c) | |||||||||
| 20 | W/O | 83.2 | -51.2 | 4.01×10⁻² | 0.202 | 99.8 | 0.312 | 5.00×10⁻⁴ | 0.366 |
| W | 86.7 | -53.6 | 2.34×10⁻² | 0.117 | 99.9 | 0.535 | 5.00×10⁻⁴ | 0.136 | |
| 40 | W/O | 86.6 | -53.5 | 2.32×10⁻² | 0.115 | 99.9 | 1.08 | 2.50×10⁻⁴ | 0.210 |
| W | 86.3 | -53.4 | 1.59×10⁻² | 8.36×10⁻² | 99.9 | 0 | 2.50×10⁻⁴ | 9.32×10⁻² | |
| 60 | W/O | 82.9 | -51.1 | 2.47×10⁻² | 0.140 | 99.9 | 0.506 | 1.67×10⁻⁴ | 0.225 |
| W | 83.0 | -51.2 | 1.68×10⁻² | 9.51×10⁻² | 99.9 | 0.743 | 1.67×10⁻⁴ | 9.77×10⁻² | |
Table 4.
Comparison of CH4 conversion, CO2 conversion, H2 yield, H2 selectivity, CO selectivity, H2 recovery, permeation flux, and thermal efficiency (reaction temperature: 600 °C, pressure difference: 0.020 MPa, molar ratio of CH4:CO2 (a) 1.5:1, (b) 1:1, (c) 1:1.5).
Table 4.
Comparison of CH4 conversion, CO2 conversion, H2 yield, H2 selectivity, CO selectivity, H2 recovery, permeation flux, and thermal efficiency (reaction temperature: 600 °C, pressure difference: 0.020 MPa, molar ratio of CH4:CO2 (a) 1.5:1, (b) 1:1, (c) 1:1.5).
| Thickness of Pd/Cu membrane [μm] |
Sweep gas | CH4 conversion [%] |
CO2 conversion [%] |
H2 yield [%] |
H2 selectivity [%] |
CO selectivity [%] |
H2 recovery [%] |
Permeation flux [mol/(m2 ⋅ s)] | Thermal efficiency [%] |
| (a) | |||||||||
| 20 | W/O | 68.2 | -95.6 | 0.151 | 0.611 | 99.4 | 0.661 | 7.07×10⁻⁴ | 2.08 |
| W | 70.8 | -99.6 | 0.132 | 0.508 | 99.5 | 0.567 | 7.07×10⁻⁴ | 1.16 | |
| 40 | W/O | 79.8 | -113 | 0.273 | 1.12 | 98.9 | 0.885 | 3.54×10⁻⁴ | 3.74 |
| W | 75.4 | -106 | 0.151 | 0.601 | 99.4 | 1.16 | 3.54×10⁻⁴ | 1.31 | |
| 60 | W/O | 73.9 | -104 | 8.90×10⁻² | 0.349 | 99.7 | 0.749 | 2.36×10⁻⁴ | 1.22 |
| W | 75.6 | -107 | 5.85×10⁻² | 0.257 | 99.7 | 0.997 | 2.36×10⁻⁴ | 0.510 | |
| (b) | |||||||||
| 20 | W/O | 69.1 | -63.9 | 9.12×10⁻² | 0.384 | 99.6 | 0.110 | 7.07×10⁻⁴ | 1.05 |
| W | 69.9 | -64.7 | 8.87×10⁻² | 0.396 | 99.6 | 0.113 | 7.07×10⁻⁴ | 0.649 | |
| 40 | W/O | 78.9 | -73.8 | 8.91×10⁻² | 0.405 | 99.6 | 1.46 | 3.54×10⁻⁴ | 1.01 |
| W | 79.8 | -74.6 | 6.17×10⁻² | 0.265 | 99.7 | 2.11 | 3.54×10⁻⁴ | 0.442 | |
| 60 | W/O | 76.2 | -71.1 | 4.75×10⁻² | 0.228 | 99.8 | 1.05 | 2.36×10⁻⁴ | 0.539 |
| W | 80.0 | -74.9 | 4.40×10⁻² | 0.248 | 99.8 | 0.682 | 2.36×10⁻⁴ | 0.320 | |
| (c) | |||||||||
| 20 | W/O | 79.7 | -48.9 | 1.41×10⁻² | 6.62×10⁻² | 99.9 | 0.885 | 7.07×10⁻⁴ | 0.128 |
| W | 81.8 | -50.4 | 1.35×10⁻² | 6.51×10⁻² | 99.9 | 0.926 | 7.07×10⁻⁴ | 7.82×10⁻² | |
| 40 | W/O | 83.0 | -51.2 | 1.50×10⁻² | 8.68×10⁻² | 99.9 | 1.67 | 3.54×10⁻⁴ | 0.135 |
| W | 82.5 | -50.8 | 1.35×10⁻² | 6.64×10⁻² | 99.9 | 0.923 | 3.54×10⁻⁴ | 7.85×10⁻² | |
| 60 | W/O | 85.8 | -53.0 | 1.67×10⁻² | 9.63×10⁻² | 99.9 | 0.748 | 2.36×10⁻⁴ | 0.152 |
| W | 86.6 | -53.6 | 1.64×10⁻² | 9.60×10⁻² | 99.9 | 0.762 | 2.36×10⁻⁴ | 9.52×10⁻² | |
Disclaimer/Publisher’s Note: The statements, opinions and data contained in all publications are solely those of the individual author(s) and contributor(s) and not of MDPI and/or the editor(s). MDPI and/or the editor(s) disclaim responsibility for any injury to people or property resulting from any ideas, methods, instructions or products referred to in the content. |
© 2024 by the authors. Licensee MDPI, Basel, Switzerland. This article is an open access article distributed under the terms and conditions of the Creative Commons Attribution (CC BY) license (http://creativecommons.org/licenses/by/4.0/).
Copyright: This open access article is published under a Creative Commons CC BY 4.0 license, which permit the free download, distribution, and reuse, provided that the author and preprint are cited in any reuse.


