1. Introduction
Since 1950, the mass production of plastics began, and 8.3 billion metric tons of this material have been produced [
1]. Nowadays, it is undeniable that pollution caused by humans has damaged different ecosystems and its consequences on the health of animals and humans; one of these pollutions of which we can hardly see its repercussions is plastics, specifically microplastics (MPs). In 2004, the term “microplastics” was used to describe the smaller plastic particles recorded (less than 5 millimeters); nevertheless, there is not yet a definition that covers all the parameters (size, origin, shape, composition, and physicochemical properties) that could help us describe the MPs [
2].
It is essential to mention that these tiny fragments find their way into oceans, soil, the air we breathe, and even human/animal tissues and organs. The MPs carry hazardous chemicals, such as heavy metals, pesticides, dyes, and additives, which adhere to the surface or are released into the environment; MPs also disrupt the ecological balance of aquatic ecosystems, the crustaceans, mollusks, and other marine wildlife consume microplastics, which can damage their digestive, reproductive, and immune systems and reduce their ability to feed and grow [
3]. As a consequence of the above, the food chain is also affected, as the accumulation of MPs have been described in some important food sources (seafood and food from land-based sources), such as marine wildlife, milk, soft drinks, and honey. Moving from one trophic level to another, the ingestion of PMs can generate toxic, allergenic, and inflammatory effects in both tissues and organs, intestinal blockage, reduce intestinal mucus secretion, damage the intestinal barrier function, trigger an imbalance of gut microbiota, and alter metabolism [
4].
Detecting and quantifying microplastics are essential to mitigate their impact; collecting and processing samples is best. The most used sampling methodologies are screening, volumetric capacity reduction, and batch sampling, while the sample processing steps are density separation, filtration, sieving, and visual sorting. However, these procedures are time-consuming, and rapid methods for sample processing still need to be developed. Thus, it should be noted that standardized microplastic sampling and processing procedures still need to be created, which may impede comparisons between studies conducted. Microplastics, which differ in size, shape, and composition, are primarily identified by their chemical makeup. The two leading techniques for this are Fourier Transform Infrared Spectroscopy (FTIR) and Raman Spectroscopy, which are extensively utilized to determine the polymeric composition of microplastics in water-based environments. These methods are essential for understanding the prevalence and impact of microplastics in aquatic ecosystems [
5]. Spectroscopy is a technique that uses the interaction of light and matter to analyze the chemical composition and structure of substances. Raman spectroscopy is a powerful technique for detecting microscopic particles, including microplastics as small as 1 µm. It is particularly effective for compounds with aliphatic, aromatic, or carbon-carbon double bonds. Sample purification is necessary to ensure accurate Raman spectra to prevent fluorescence interference.
Additionally, membrane filters that support the samples should not introduce background interference during spectrum acquisition. [
5,
6]
A mechanism has been proposed that illuminates and scans a sample containing microplastics. Based on the measured reflectance, a color spectrum is generated, which allows for the identification of microplastics. This paper presents the design and calibration of such a device, detailing the methodology and technological approach employed to enhance the detection and analysis of microplastic contaminants.
2. Materials and Methods
The prototype's development and design commence with the sample selection to be analyzed, which in this instance would be PET, PLA, or ABS. These materials were chosen based on their reflectance characteristics, which informed the selection of light sources to illuminate the microplastics within the sample. The illumination of microplastics is achieved through the collimation of light using two lenses, which serve to more precisely focus the light beam onto various objects that may be present on the Whatman filter. Subsequently, the dimensions of the sample were proposed, with a minimum size of 10 cm square. Based on the proposed sample size, a sweeping mechanism was designed, drawing inspiration from the movement of a 2-axis Cartesian CNC (X, Y). A Raspberry Pi 4 was employed to manage this mechanism, while the movement control was delegated to two stepper motors operated via an A4988 driver. A graphical user interface was developed to display the reflectance results, presented on a 7-inch screen connected to the Raspberry Pi 4. For enhanced device calibration, the mechanism was shrouded with a black cloth to mitigate external noise caused by ambient light sources.
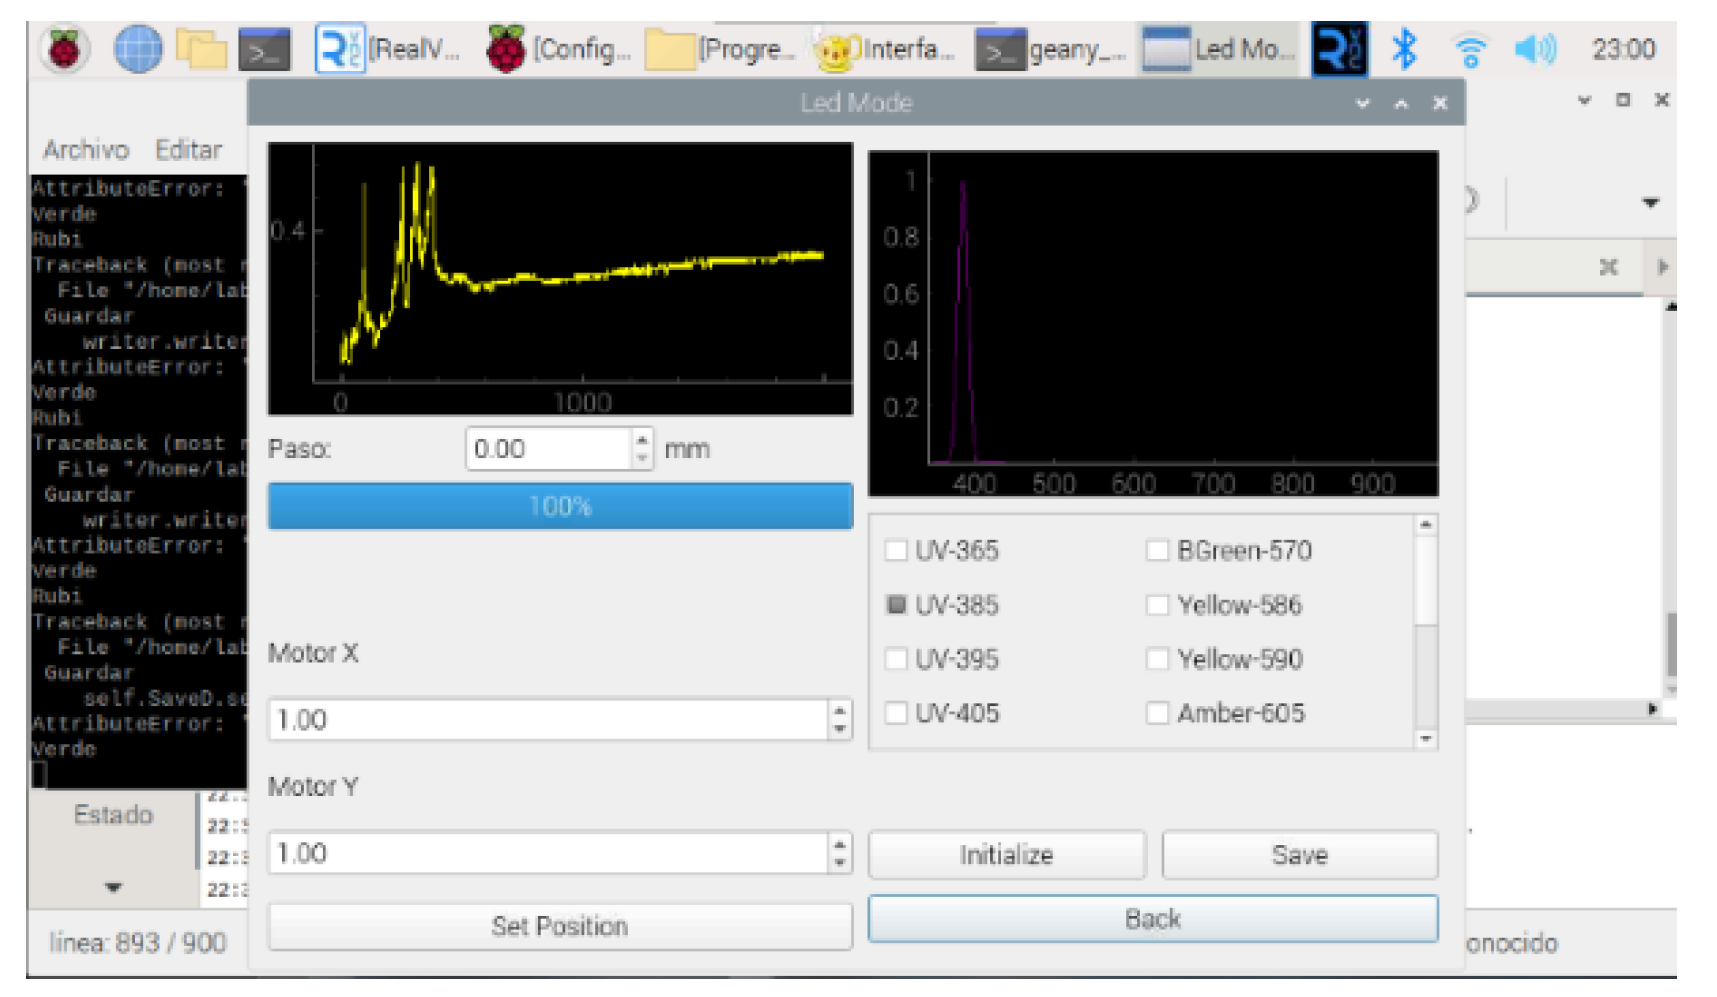
A Printed Circuit Board (PCB) was designed to integrate the necessary circuits for sample detection and is subsequently simulated to identify any potential issues preemptively.
The sensor was calibrated for precise measurements, and a user-friendly GUI was developed. Finally, the prototype was assembled.
The sensor system includes several essential components:
2.1. Sampling and selection
In this phase, calibration and detection of Polyethylene Terephthalate (PET) were prioritized due to its prevalence as a microplastic in rivers and lakes, commonly originating from water and soft drink bottles. Microplastics exhibit significant absorption of visible wavelength light with minimal reflection, unlike organic waste, which reflects most of this spectrum while absorbing minimal amounts. This differential behavior is evident in microplastic absorption spectrophotometry (Transmittance), their reflective properties, and the reflectance of other components[
7,
8,
9,
10]. Consequently, the selected light sources span a wavelength range from 360nm to 960nm to accommodate these characteristics.
Following the identification of the spectrum of the material to be detected, a methodology was proposed for the sampling of specimens that can be analyzed using our calibrated system. This system is specifically designed to detect and differentiate between plastic and organic matter. The initial step involves the identification of the research site, which would be areas with significant accumulation of microplastics—employing various sampling methods tailored to the needs of the study, such as net sampling for water column analysis, bulk sampling for volumetric concentration, continuous plankton recorder for plankton-associated microplastics, and direct in situ filtration for immediate sample processing. Contaminated containers and gloves must be used during collection to avoid sample contamination. The filter is then taken to the laboratory for detailed examination. After calibration of the sensor, the sample would be inspected under the microscope, discarding any non-plastic debris. Finally, the microplastics are sorted and identified using morphological characteristics and spectroscopic analysis to determine their composition. This systematic approach ensures the integrity and relevance of the samples, providing reliable data for assessing microplastic contamination [
11,
12].
2.2. Wavelength Selection
To perform the visible light mapping, the LEDs we proposed the next criteria:
Identify the type and size of the microplastics to be detected and the medium in which they are found (water, air, soil, etc.).
Select a light source that emits in a range of wavelengths suitable for the interaction with the microplastics to be detected (for interaction with microplastics, consider factors such as power, stability, divergence, and cost.)
Design an optical system that allows focusing and directing the light beam to the area of interest, collecting and analyzing the optical signal reflected or transmitted by the microplastics.
Our prototype employs LEDs with varying wavelengths, spanning from ultraviolet to infrared. To achieve high precision, the LEDs were sourced with specific wave characteristics; all the LEDs were purchased from Würth Elektronik [
13], from the family WL-SMTW SMT Mono-color TOP LED Waterclear.
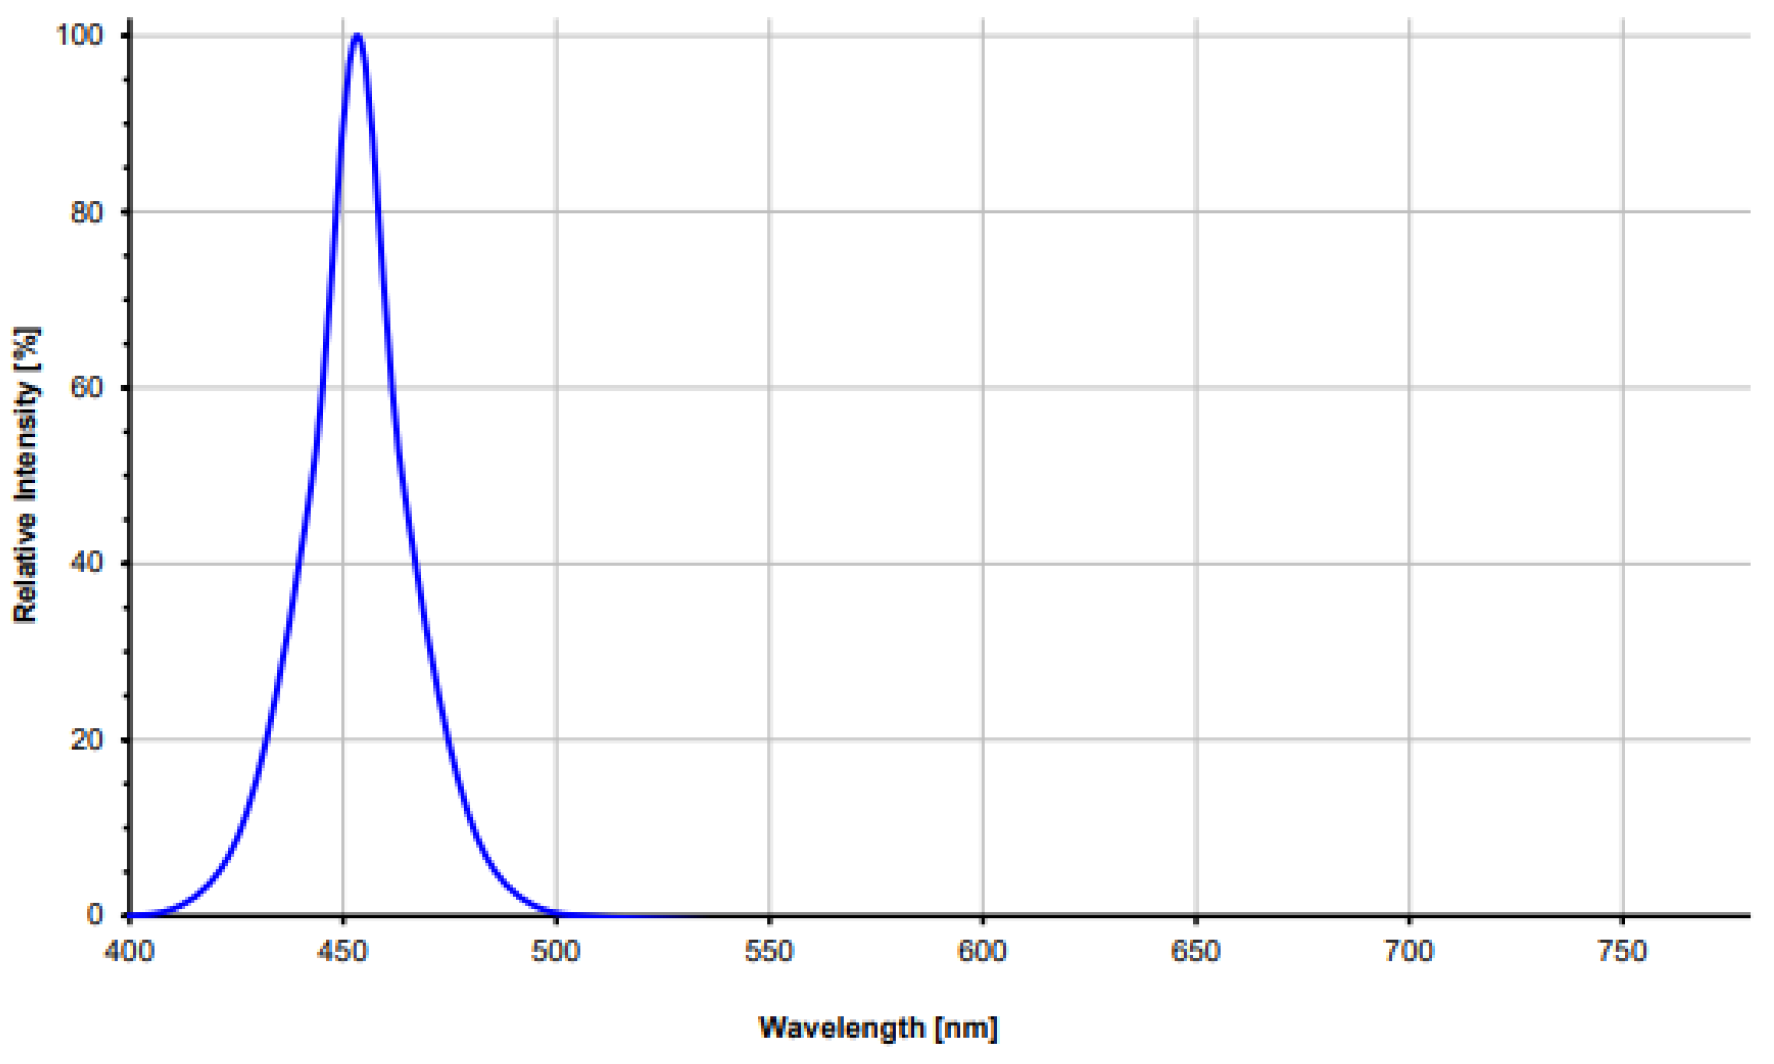
Figure 1 depicts the wavelength spectrum for the Blue 456 color. The LEDs were selected for surface-mount soldering on a manufactured PCB, which allows for precise control over the emitted light spectrum.
A lens was employed to focus the light emitted by LEDs, resulting in the calculation of the lens's focal point. By utilizing a photodiode, the reflectance of the material under investigation was detected, allowing for acquiring the material's spectral data. This methodology is pivotal for analyzing the optical properties of materials and contributes significantly to the field of spectroscopy.[
14]
2.3. Four-Bar Structure
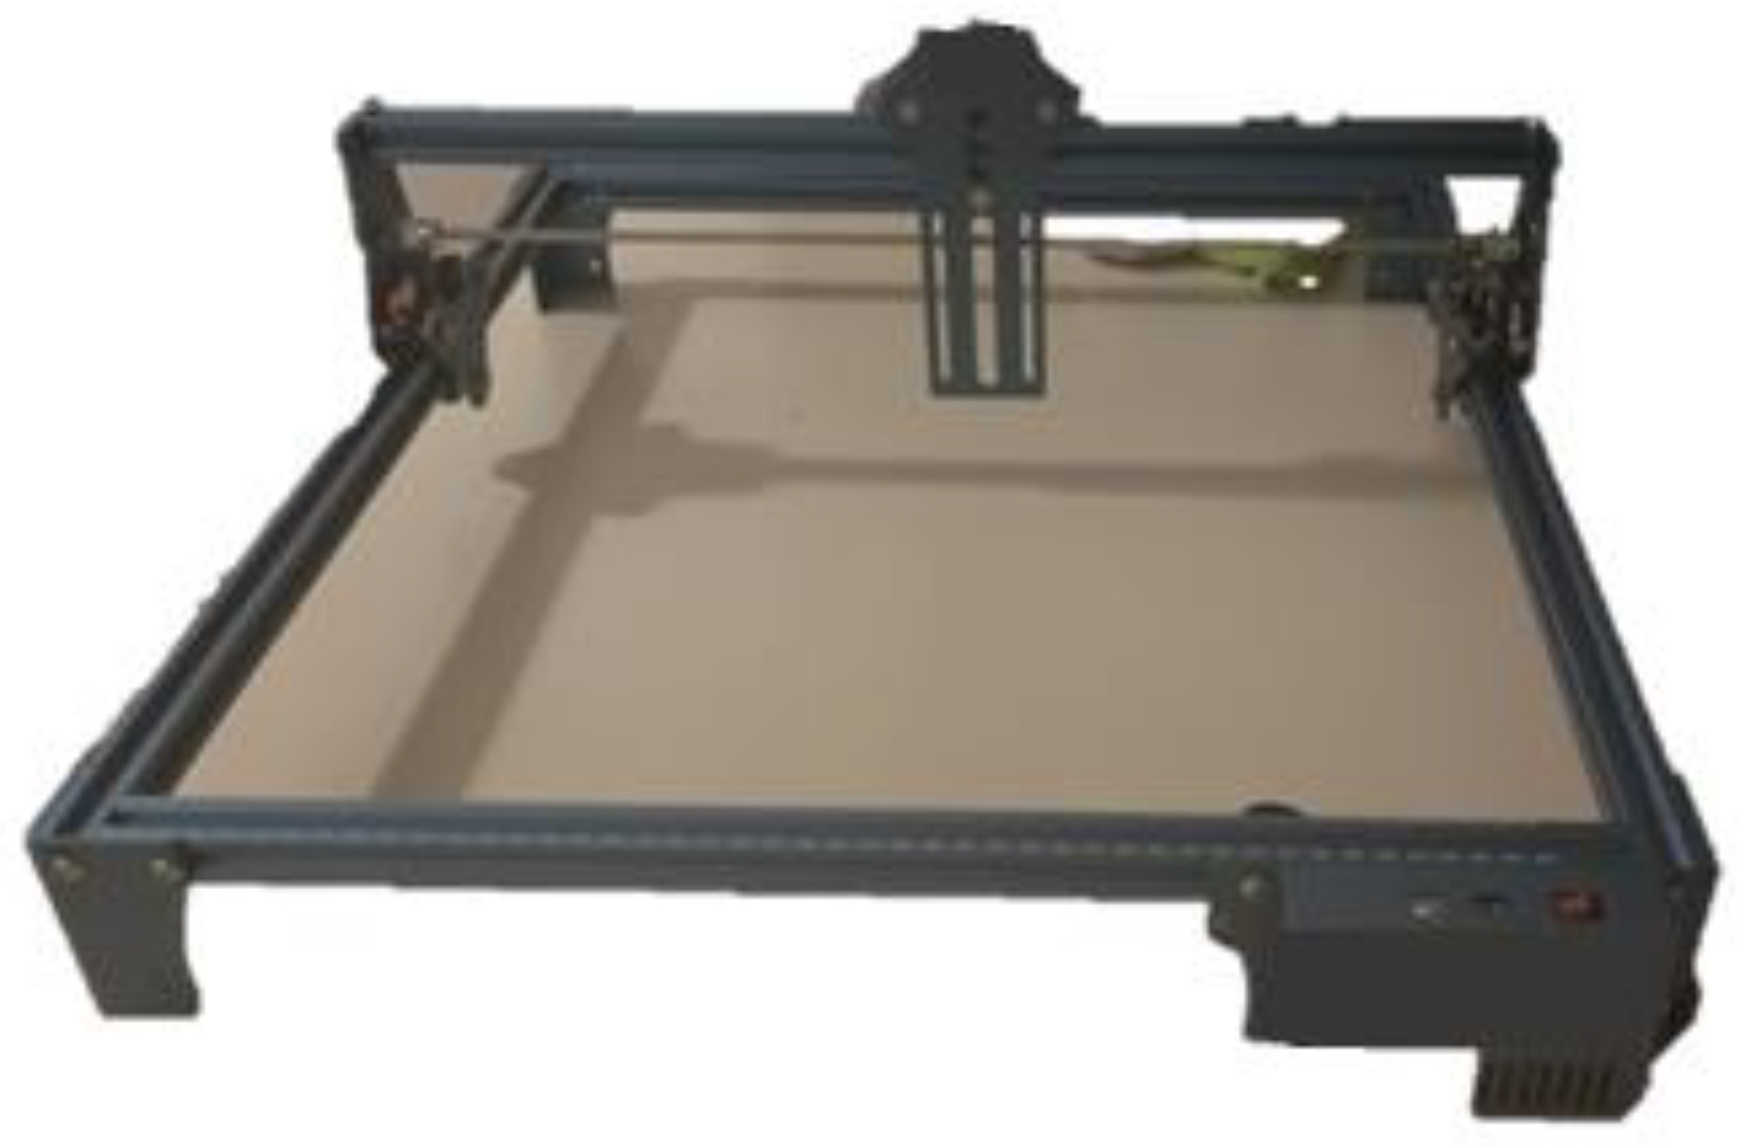
To manufacture the prototype, workspace optimization is determined as sample collection is contingent upon using a Whatman filter (WHA 1825-047) Grade GF/F circles, 447mm, 100/pk. The prototype's dimensions are 45 cm x 45 cm, leveraging Cartesian movement across two axes of a CNC (X,Y) with a four-bar structure facilitates controlled movement in both the X and Y axes to facilitate surface mapping and sensor measurement acquisition; the structure is shown in
Figure 2 The mechanism's structure was simulated using SolidWorks[
15] and incorporating the foundational design of a Sculpfun laser cutter. Two stepper motors interfaced with an A4988 driver achieve control over this structure.
2.4. Raspberry Pi 4 (8GB RAM) and A4988 driver
A Raspberry Pi is a series of single-board computers developed by the Raspberry Pi Foundation [
16]. Its primary goal is to provide an affordable and versatile platform for learning, experimentation, and practical projects.
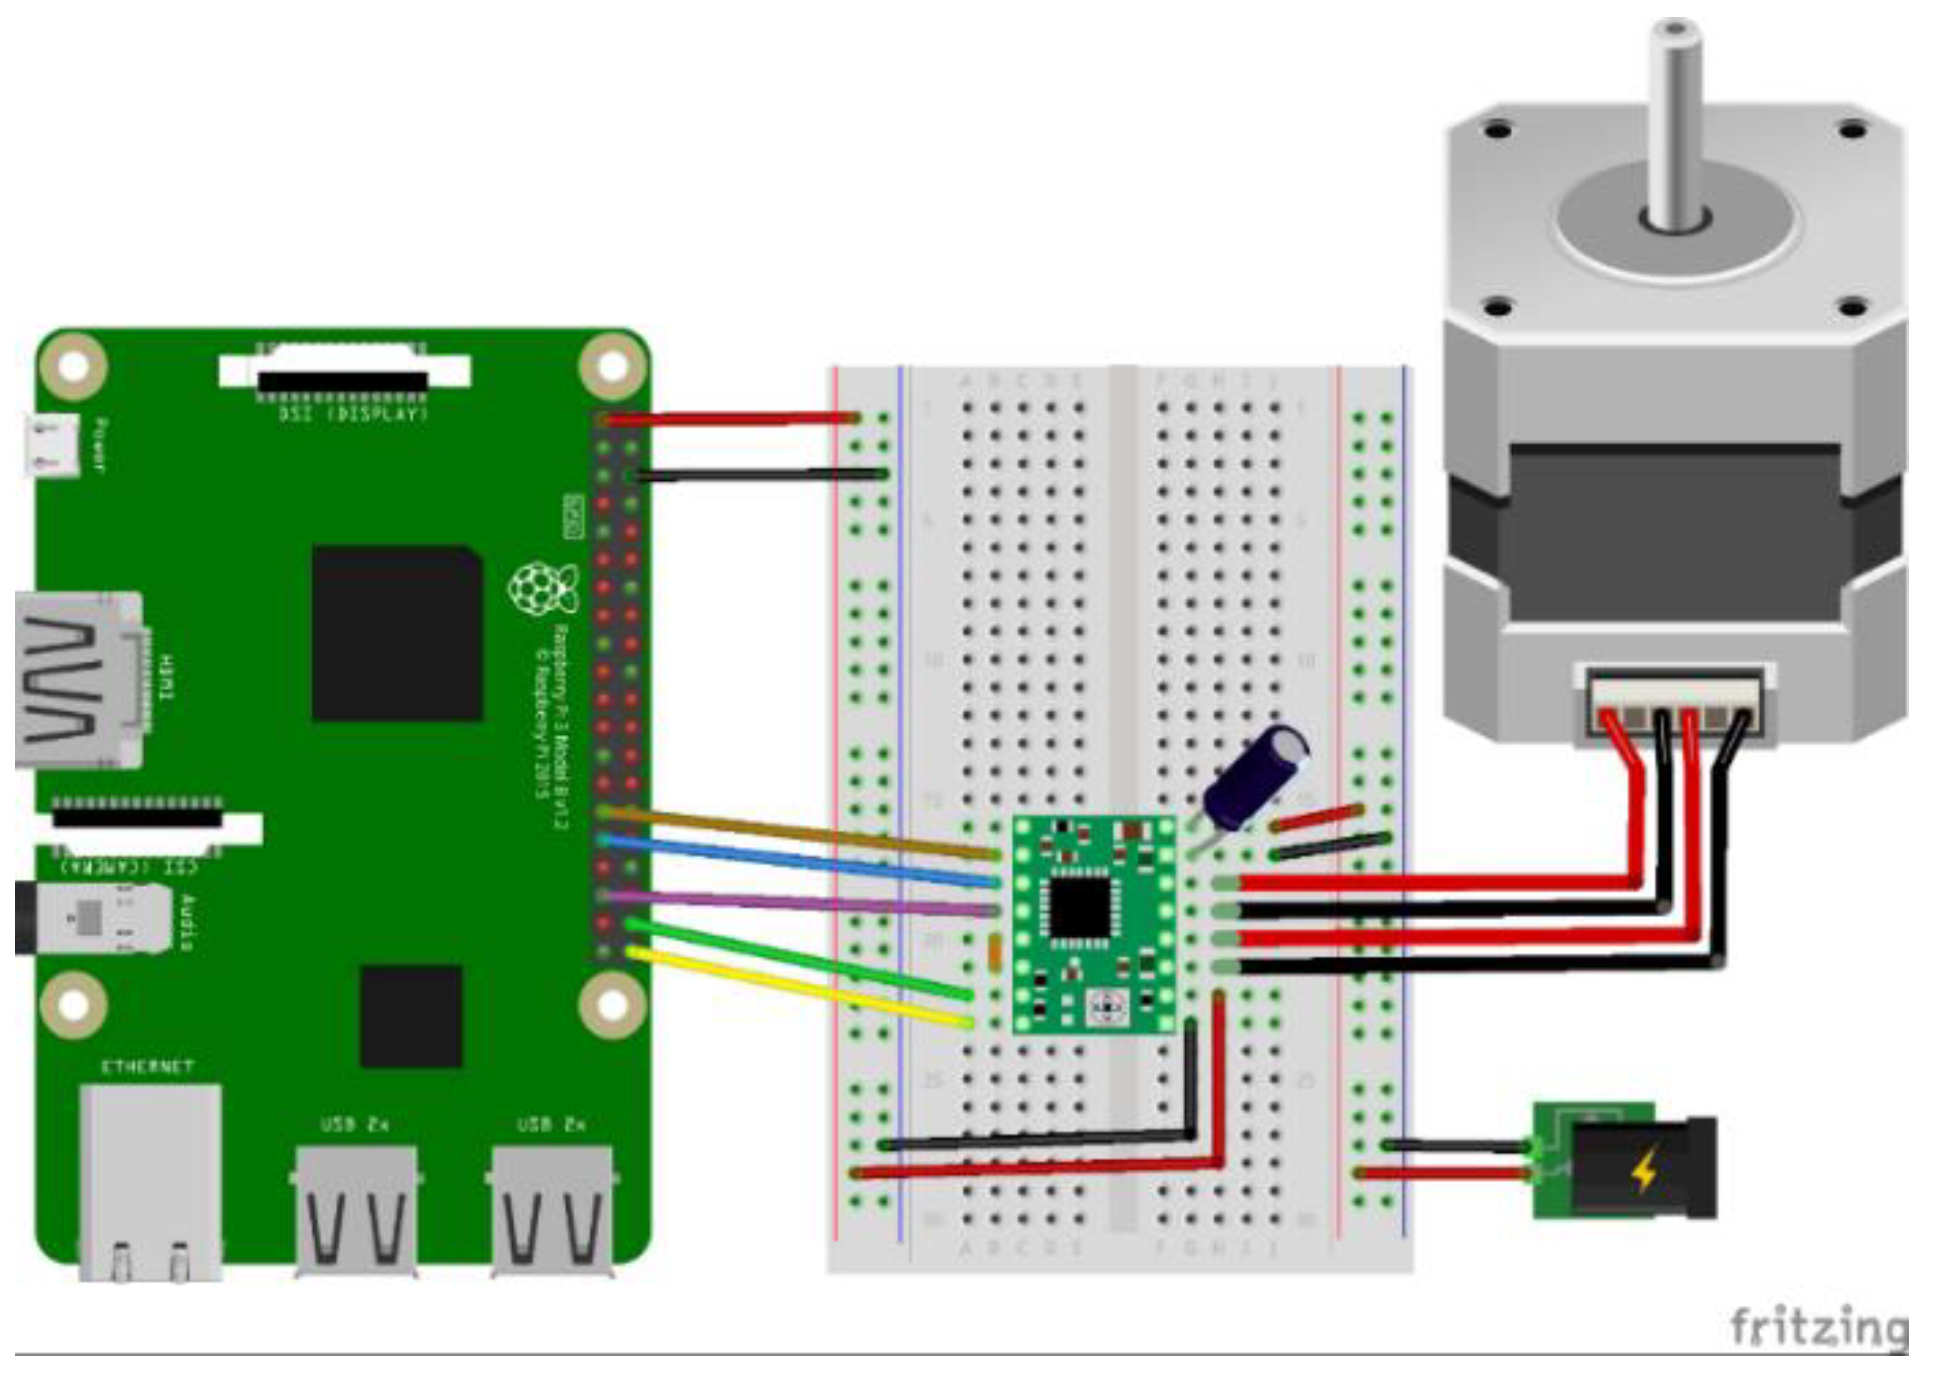
In this study, we employed the Raspberry Pi 4 with 8GB of RAM to manage the prototype. The movement was facilitated using NEMA 17 stepper motors in conjunction with the A4988 driver, which allows for precise control over the (X,Y) axes. This setup is key for mapping the surface to be sensed and ensuring the accuracy of the step motors. A schematic diagram of the connections and the A4988 control library reference can be seen in
Figure 3 and
Table 1, respectively.
This configuration demonstrates the feasibility of using compact and cost-effective computing solutions.
Wiring Connections
The A4988 driver was connected to the GPIO pins of the Raspberry Pi as follows:
The A4988's Step pin was connected to a Raspberry Pi's GPIO pin to control the stepping.
The A4988's Direction pin was connected to a Raspberry Pi's GPIO pin to manage the rotation direction.
The A4988's MS1, MS2, and MS3 pins were attached to the Raspberry Pi's GPIO pins to select the micro-stepping mode, if necessary.
The A4988's VMOT pin was connected to an external power supply, which should be between 8V and 35V, to power the motor.
The Ground pin of the A4988 was connected to the ground on the Raspberry Pi.
The A4988's 1A, 1B, 2A, and 2B pins were connected to the motor's corresponding coils (NEMA17 motor wires).
Setting Current Limit:
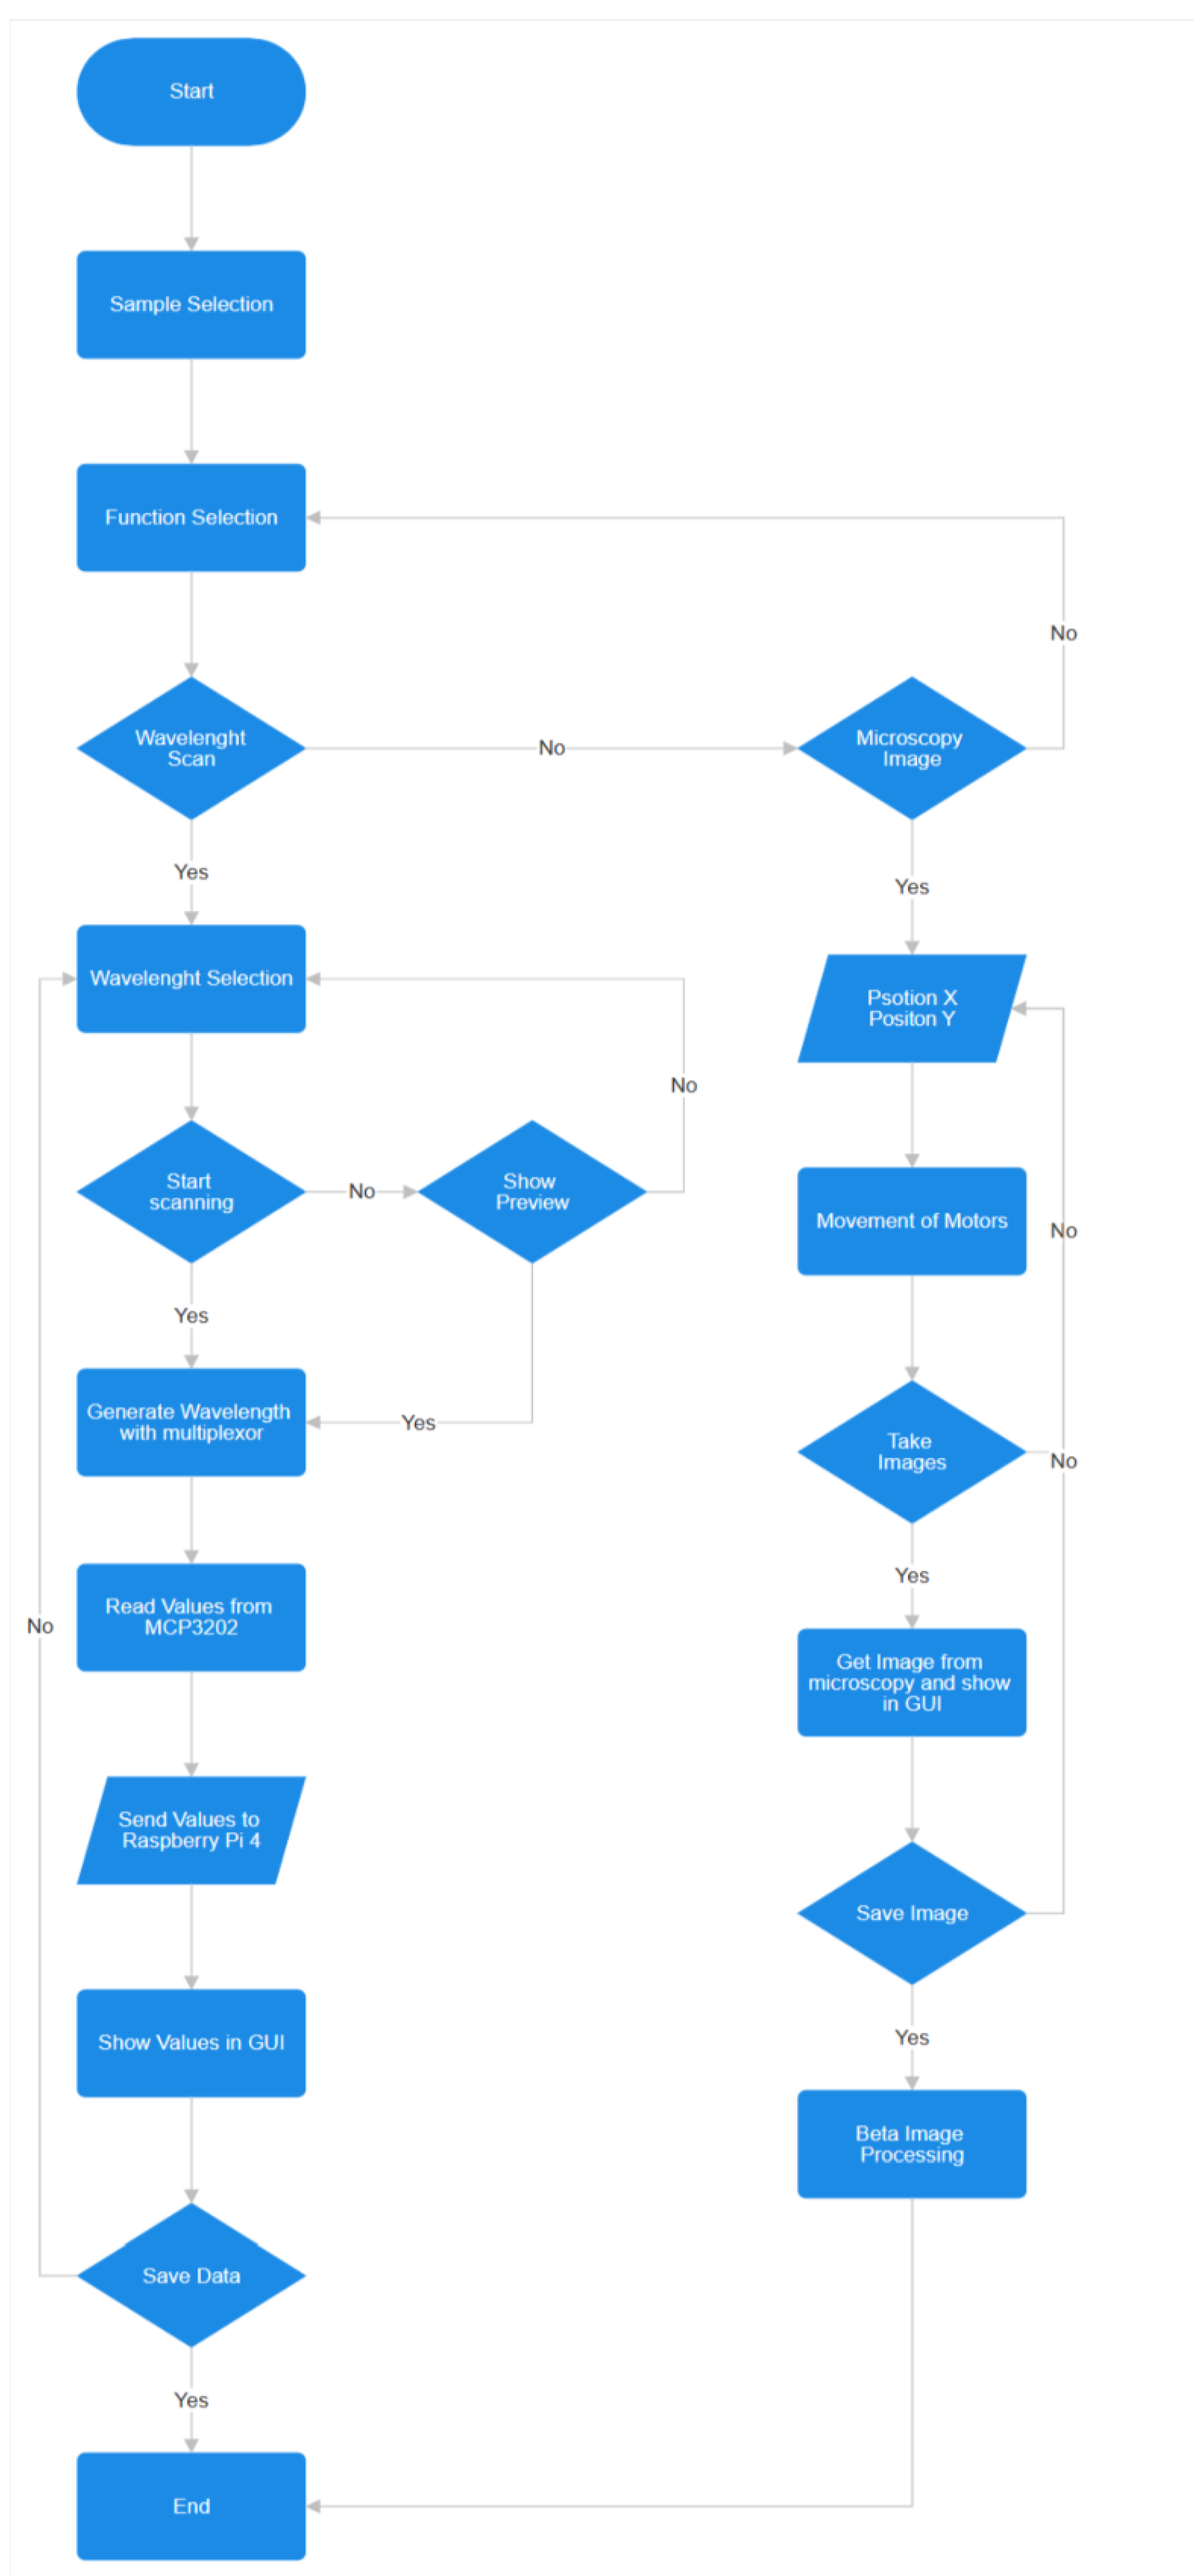
The RaspberryPi platform offers several prototype development options due to its low cost and energy efficiency. It is ideal for building IoT devices and prototypes, taking advantage of its General-purpose input/output (GPIO). The idea is to use the Raspberry Pi as a central data processor, which, using a demultiplexer and the adaptation of a digital-analog reader, allows us to read external signals produced by the LED when the light is reflected and captured by the photodiode. A flow chart of the code is shown in
Figure 4.
2.5. Printed Circuit Board (PCB) for Wavelength Control
The Y-axis movement of our structure houses a custom-designed PCB responsible for managing different wavelengths. The PCB includes the following circuits:
Multiplexer: The CD4114D multiplexer was used to switch between wavelengths.
Analog-to-Digital Converter (ADC) Circuit we used the MCP3202 ensures high-resolution signal transduction with its bandwidth of 12-bits rate, for accurate measurements.
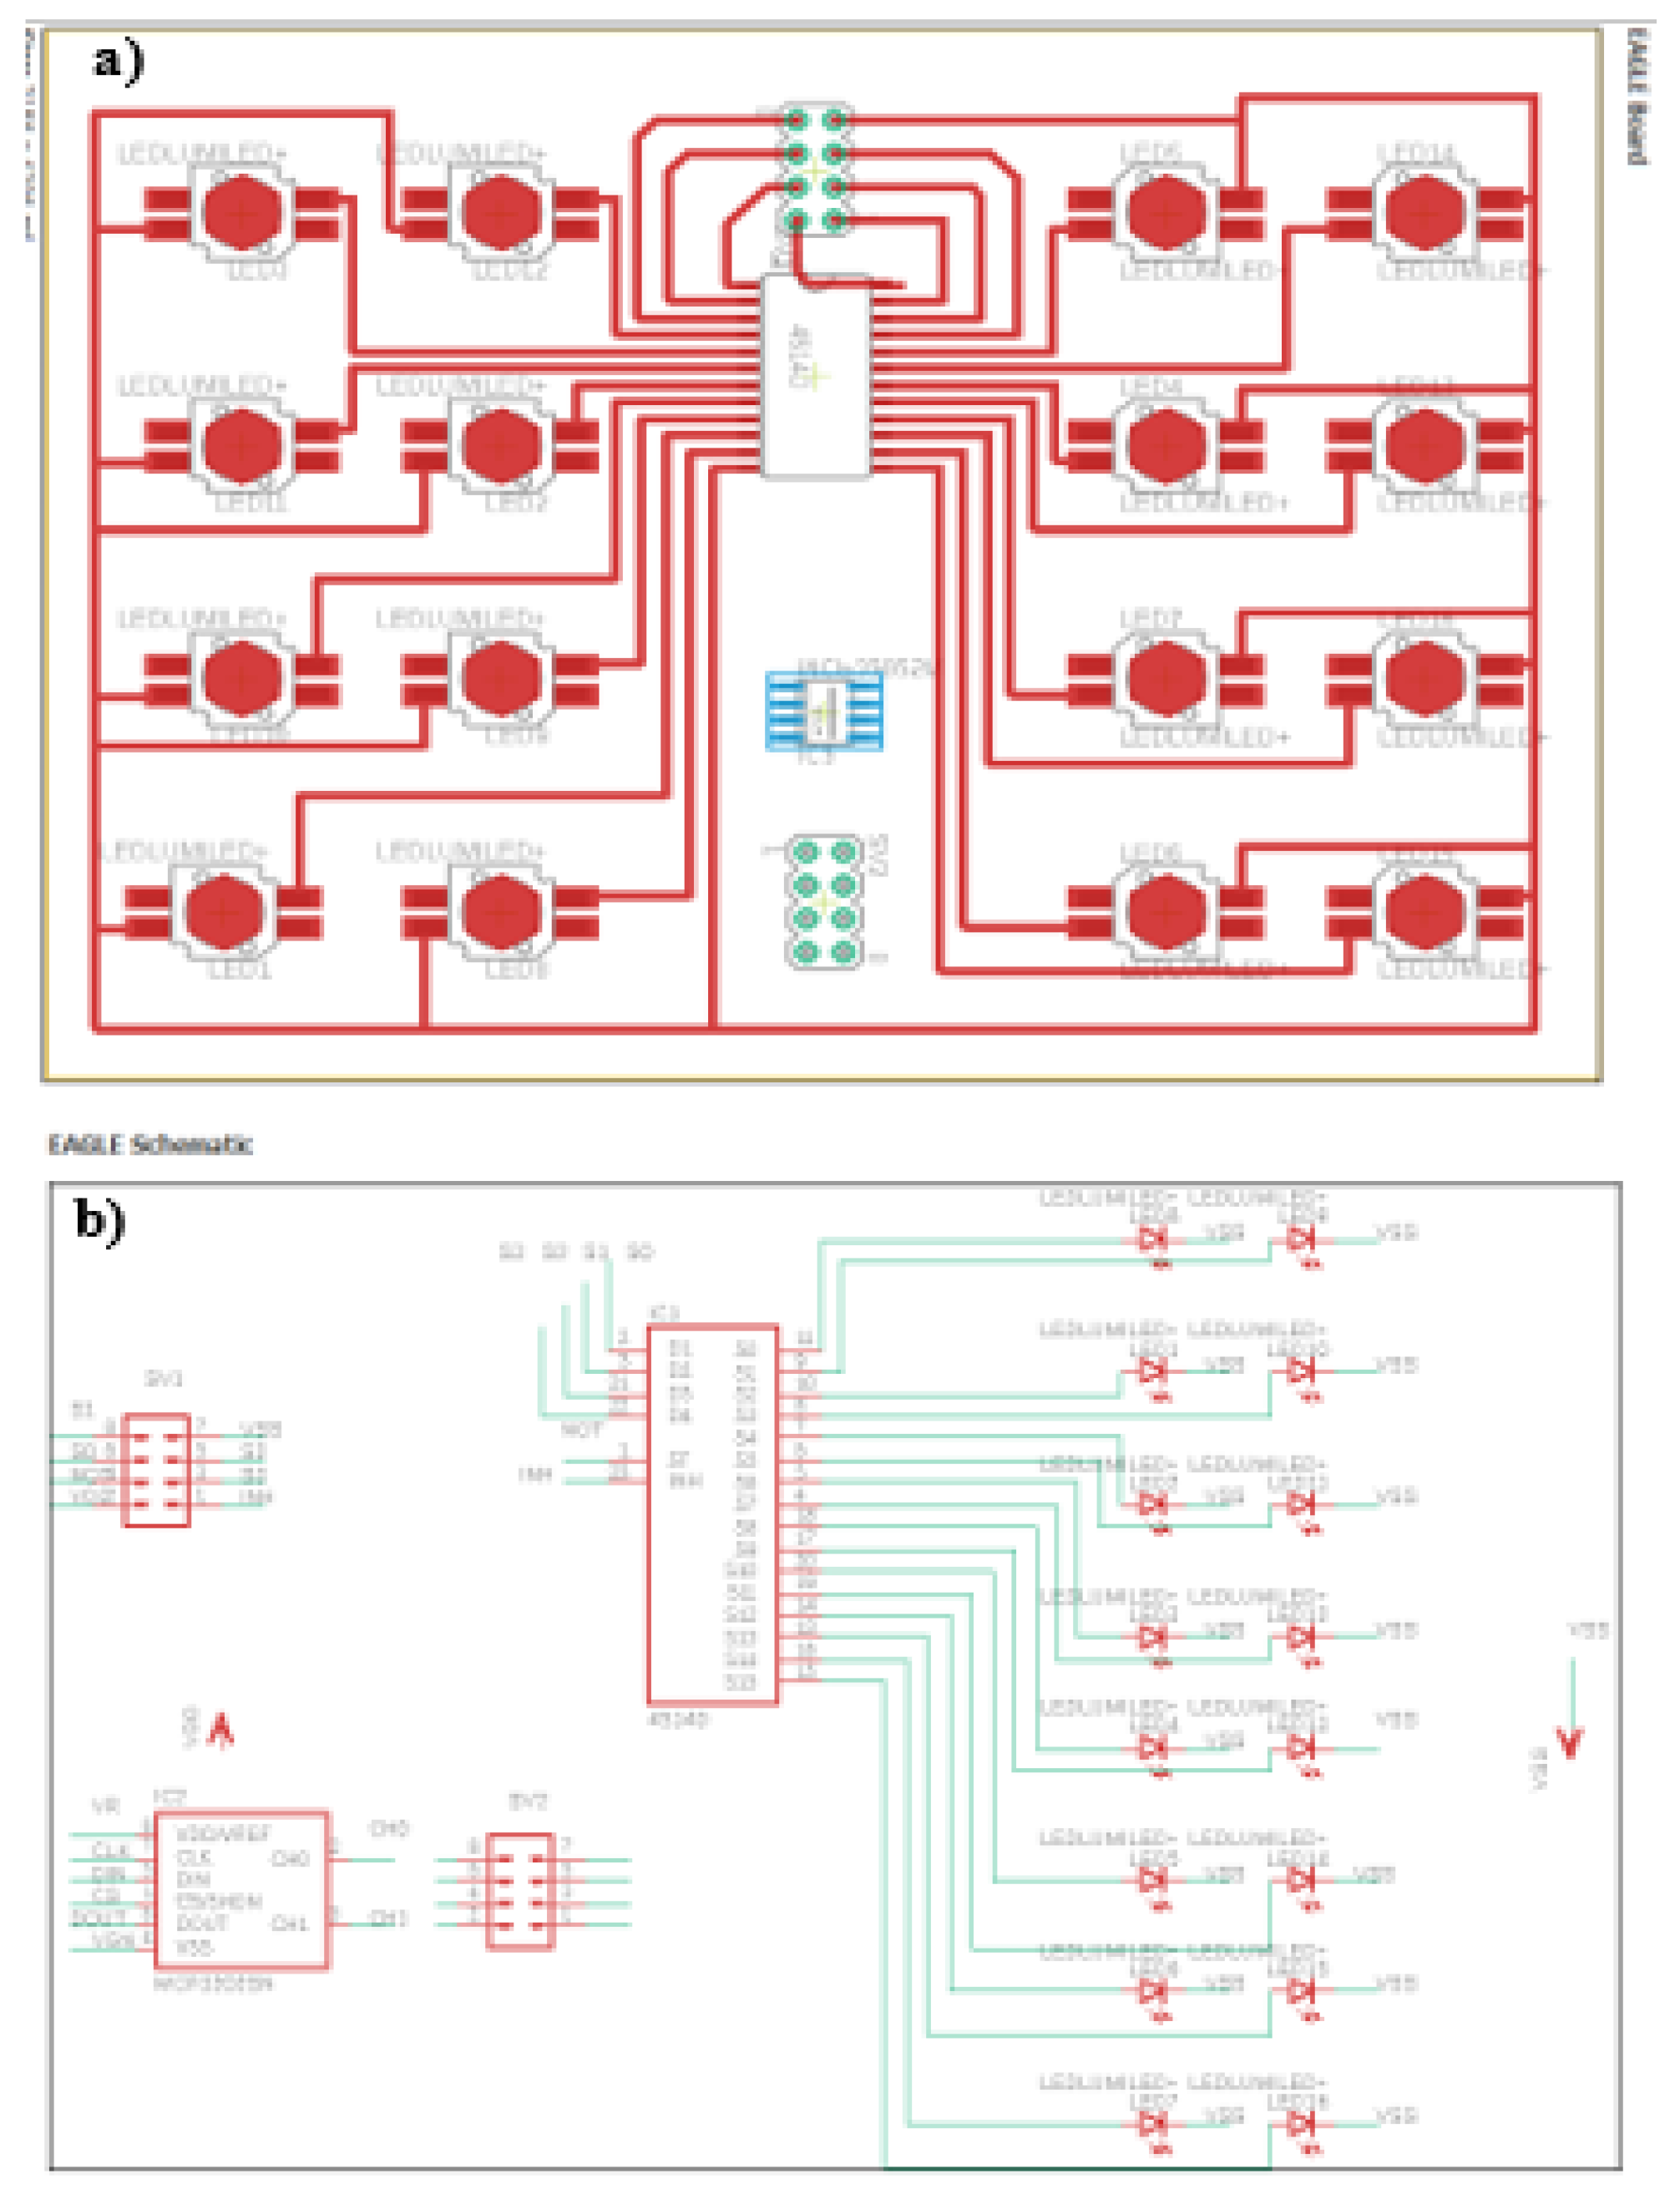
We designed a double-sided Printed Circuit Board (PCB). Considering the time required for its manufacture, we decided to have it manufactured at a company specializing in rapid PCB prototyping.
The manufactured PCB was designed using the software EAGLE [
17], as shown in
Figure 5. All the elements are mounted, i.e., the ADC, the DEMUX, and the 16 different wavelengths. The design was a 66mm
62.7mm double-sided to avoid very thin and extraordinarily long tracks that could generate parasite resistance. The board was manufactured by JLCPCB (Shenzhen JIALICHUANG Electronic Technology Development Co., Ltd.) [
18].
2.6. Collimation and Optics Calibration
Because the microplastics are less than 5mm in size, precision in measurement is decisive. Collating a light beam to a focal point allows for a concentrated and precise scan of these tiny particles. By adjusting the wavelength of the light to match the optical properties of the microplastics and their surrounding medium, we can enhance the resolution of the mapping process. This technique is necessary for accurately identifying and quantifying microplastic contamination.
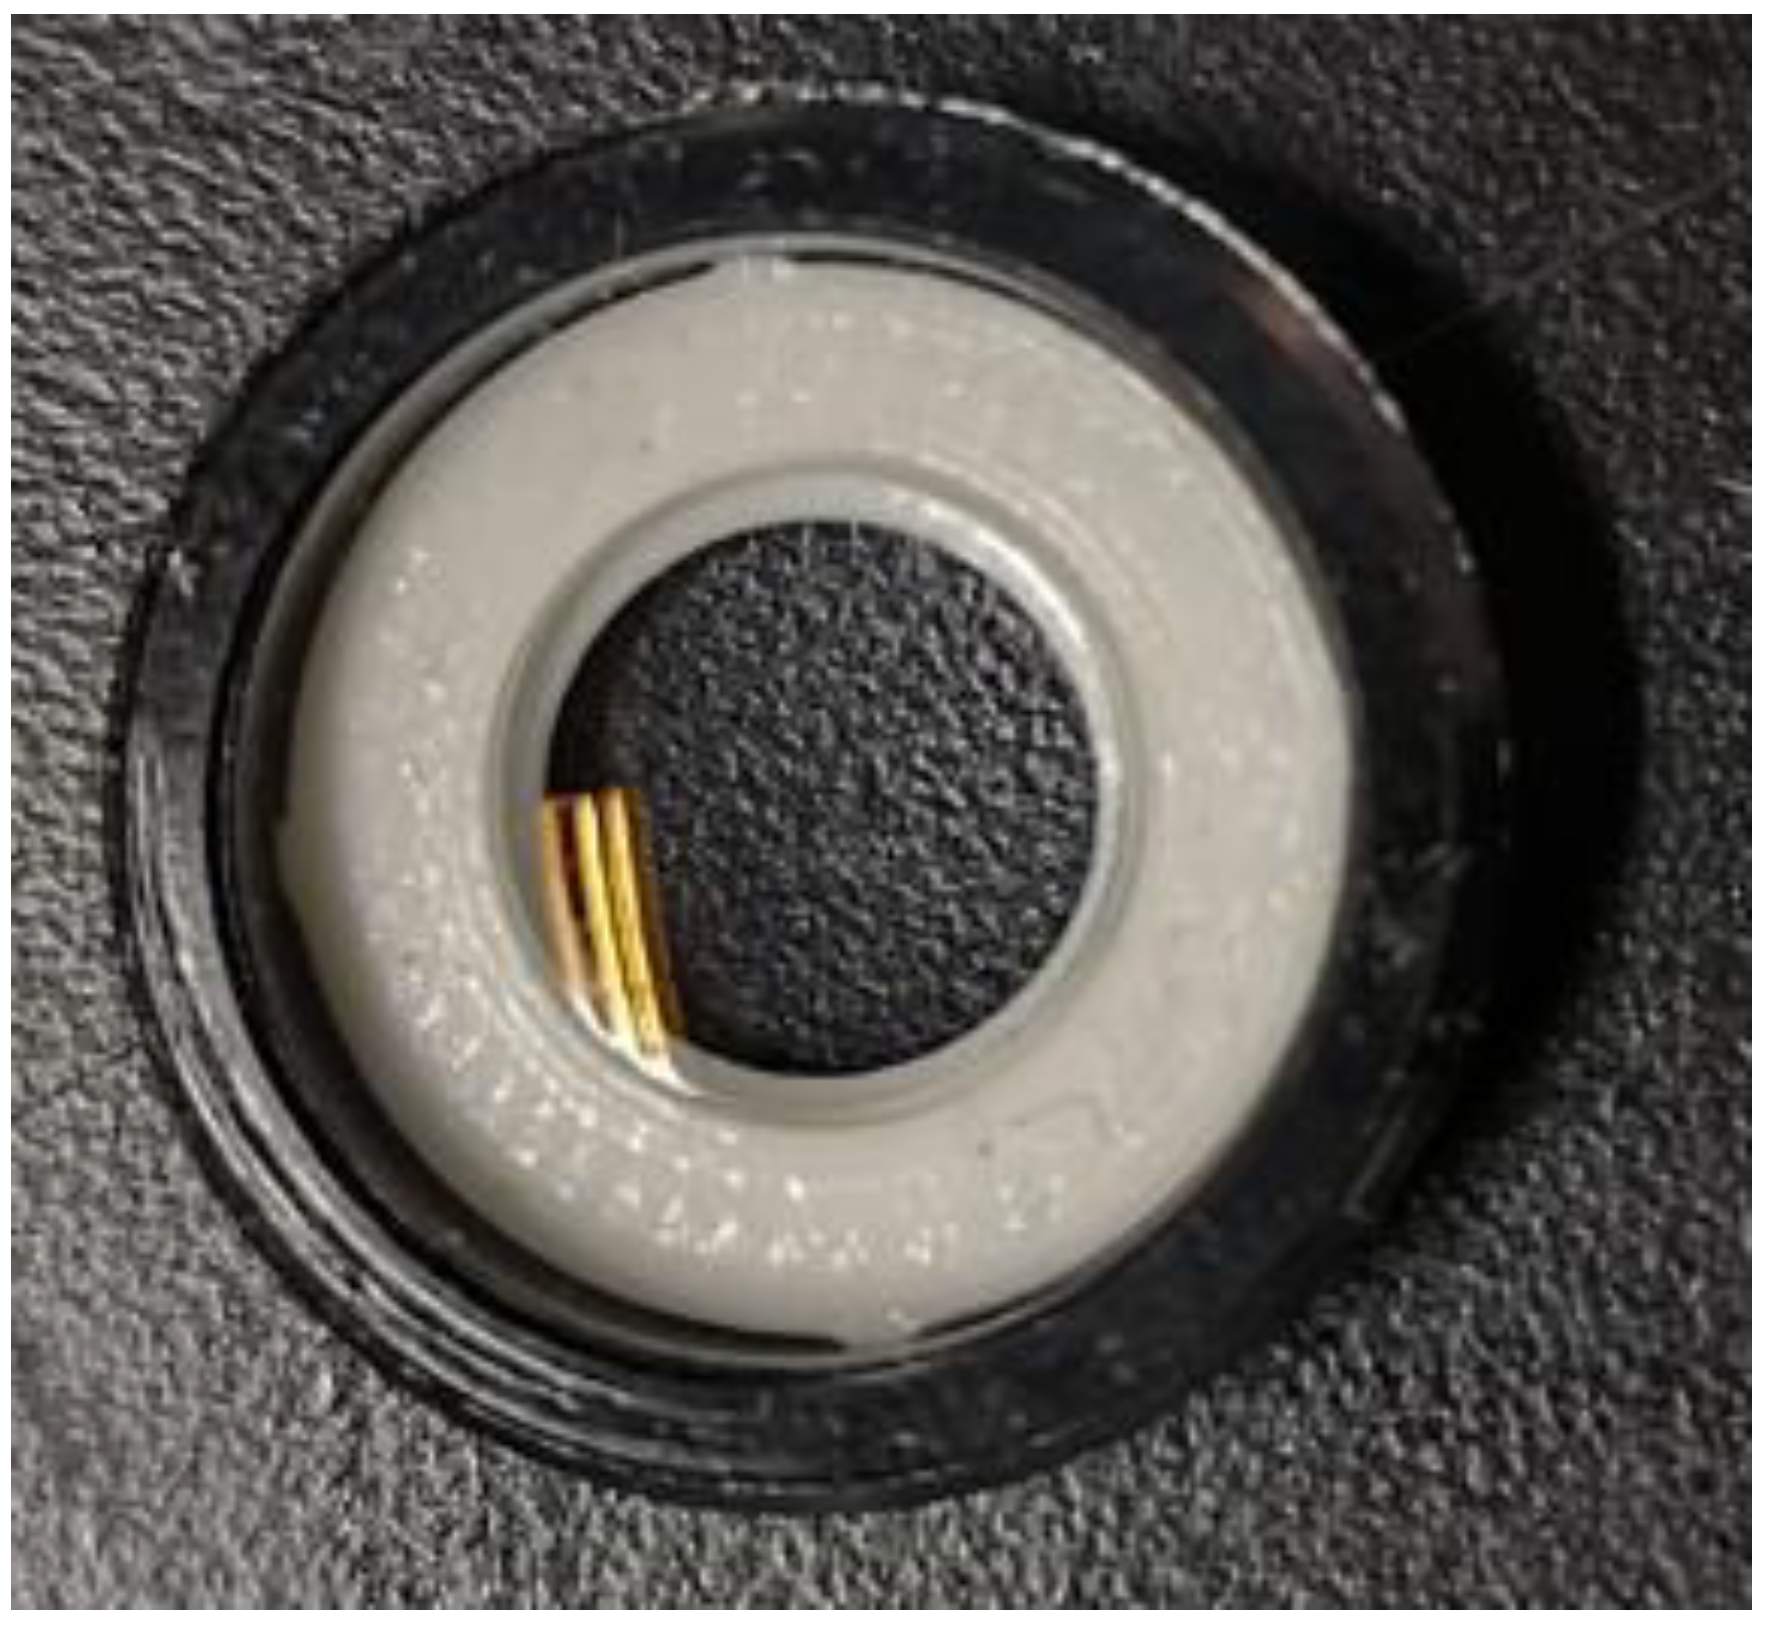
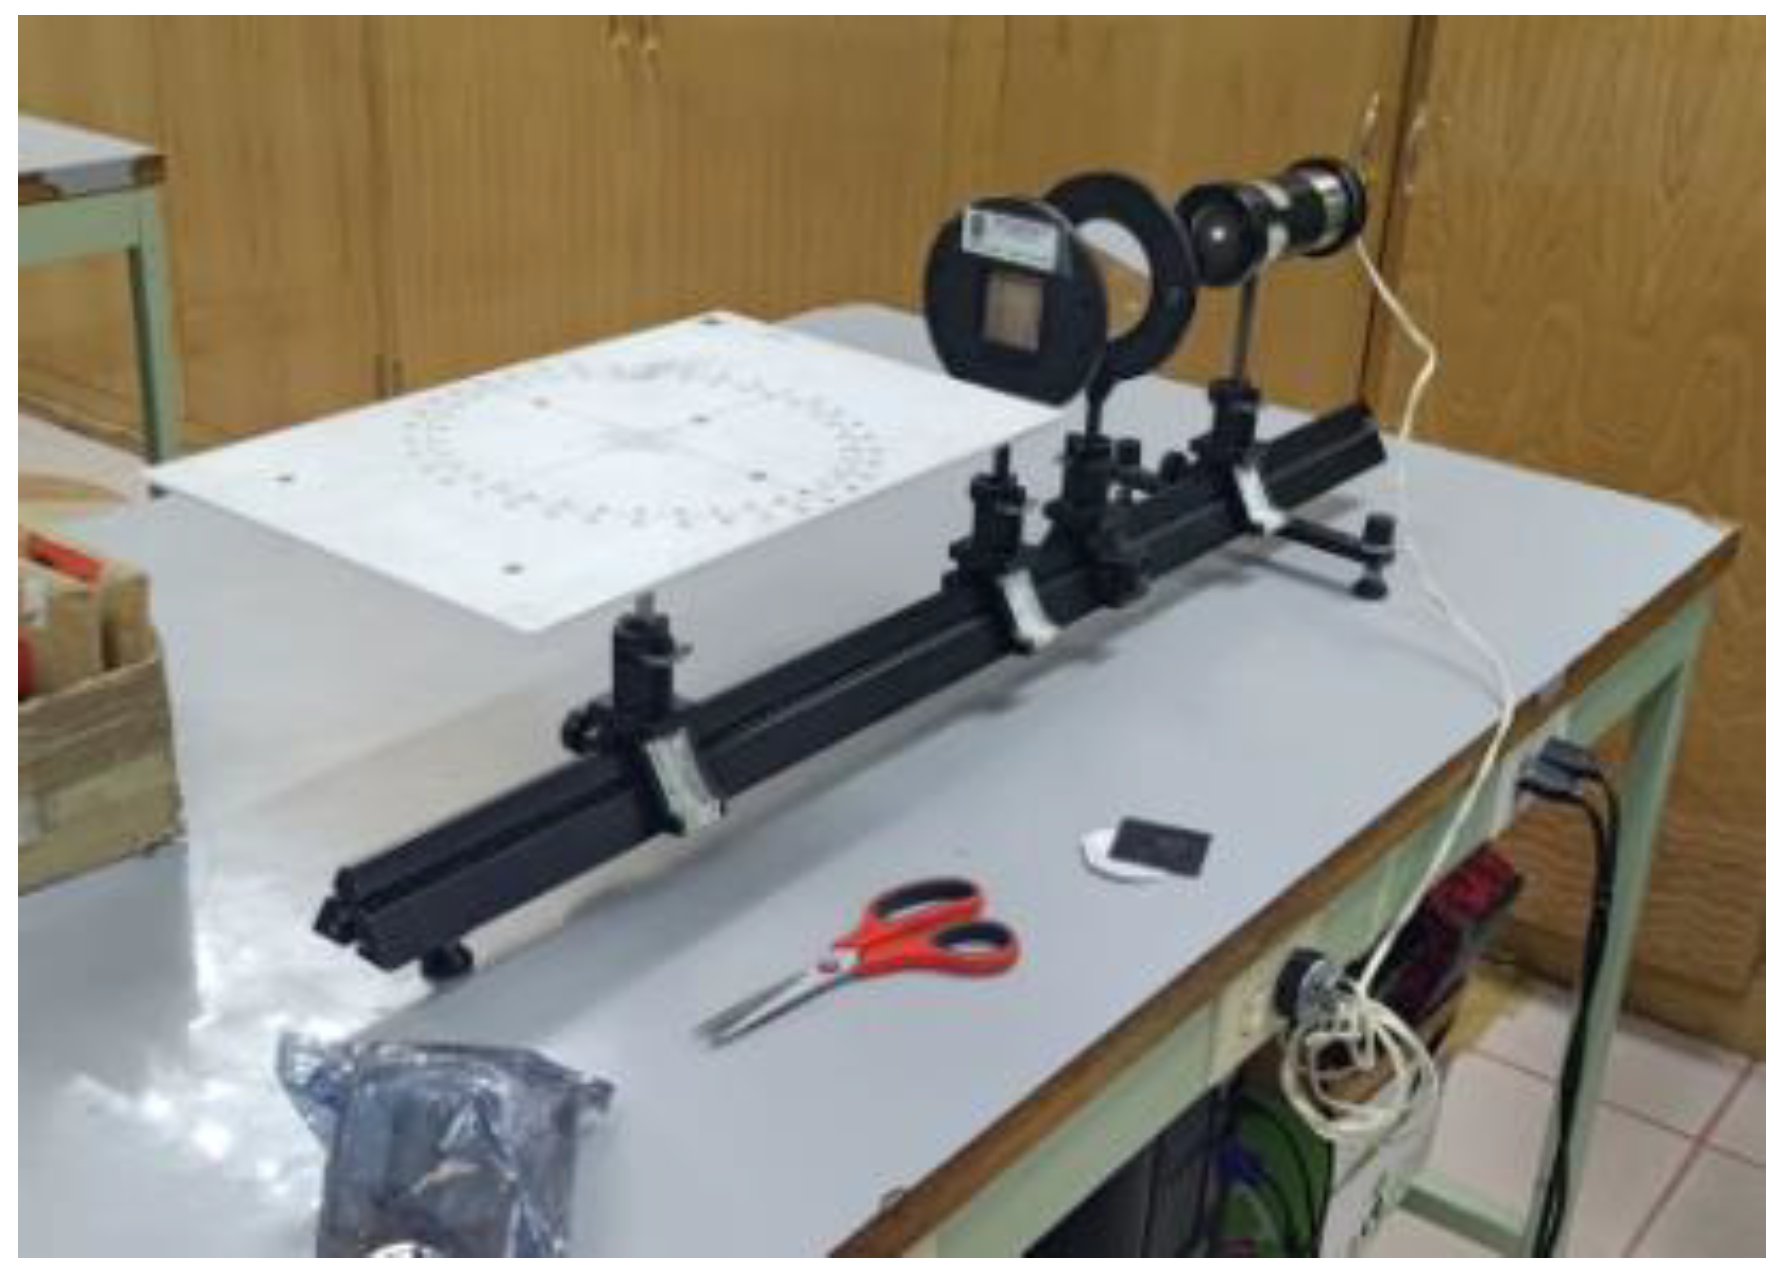
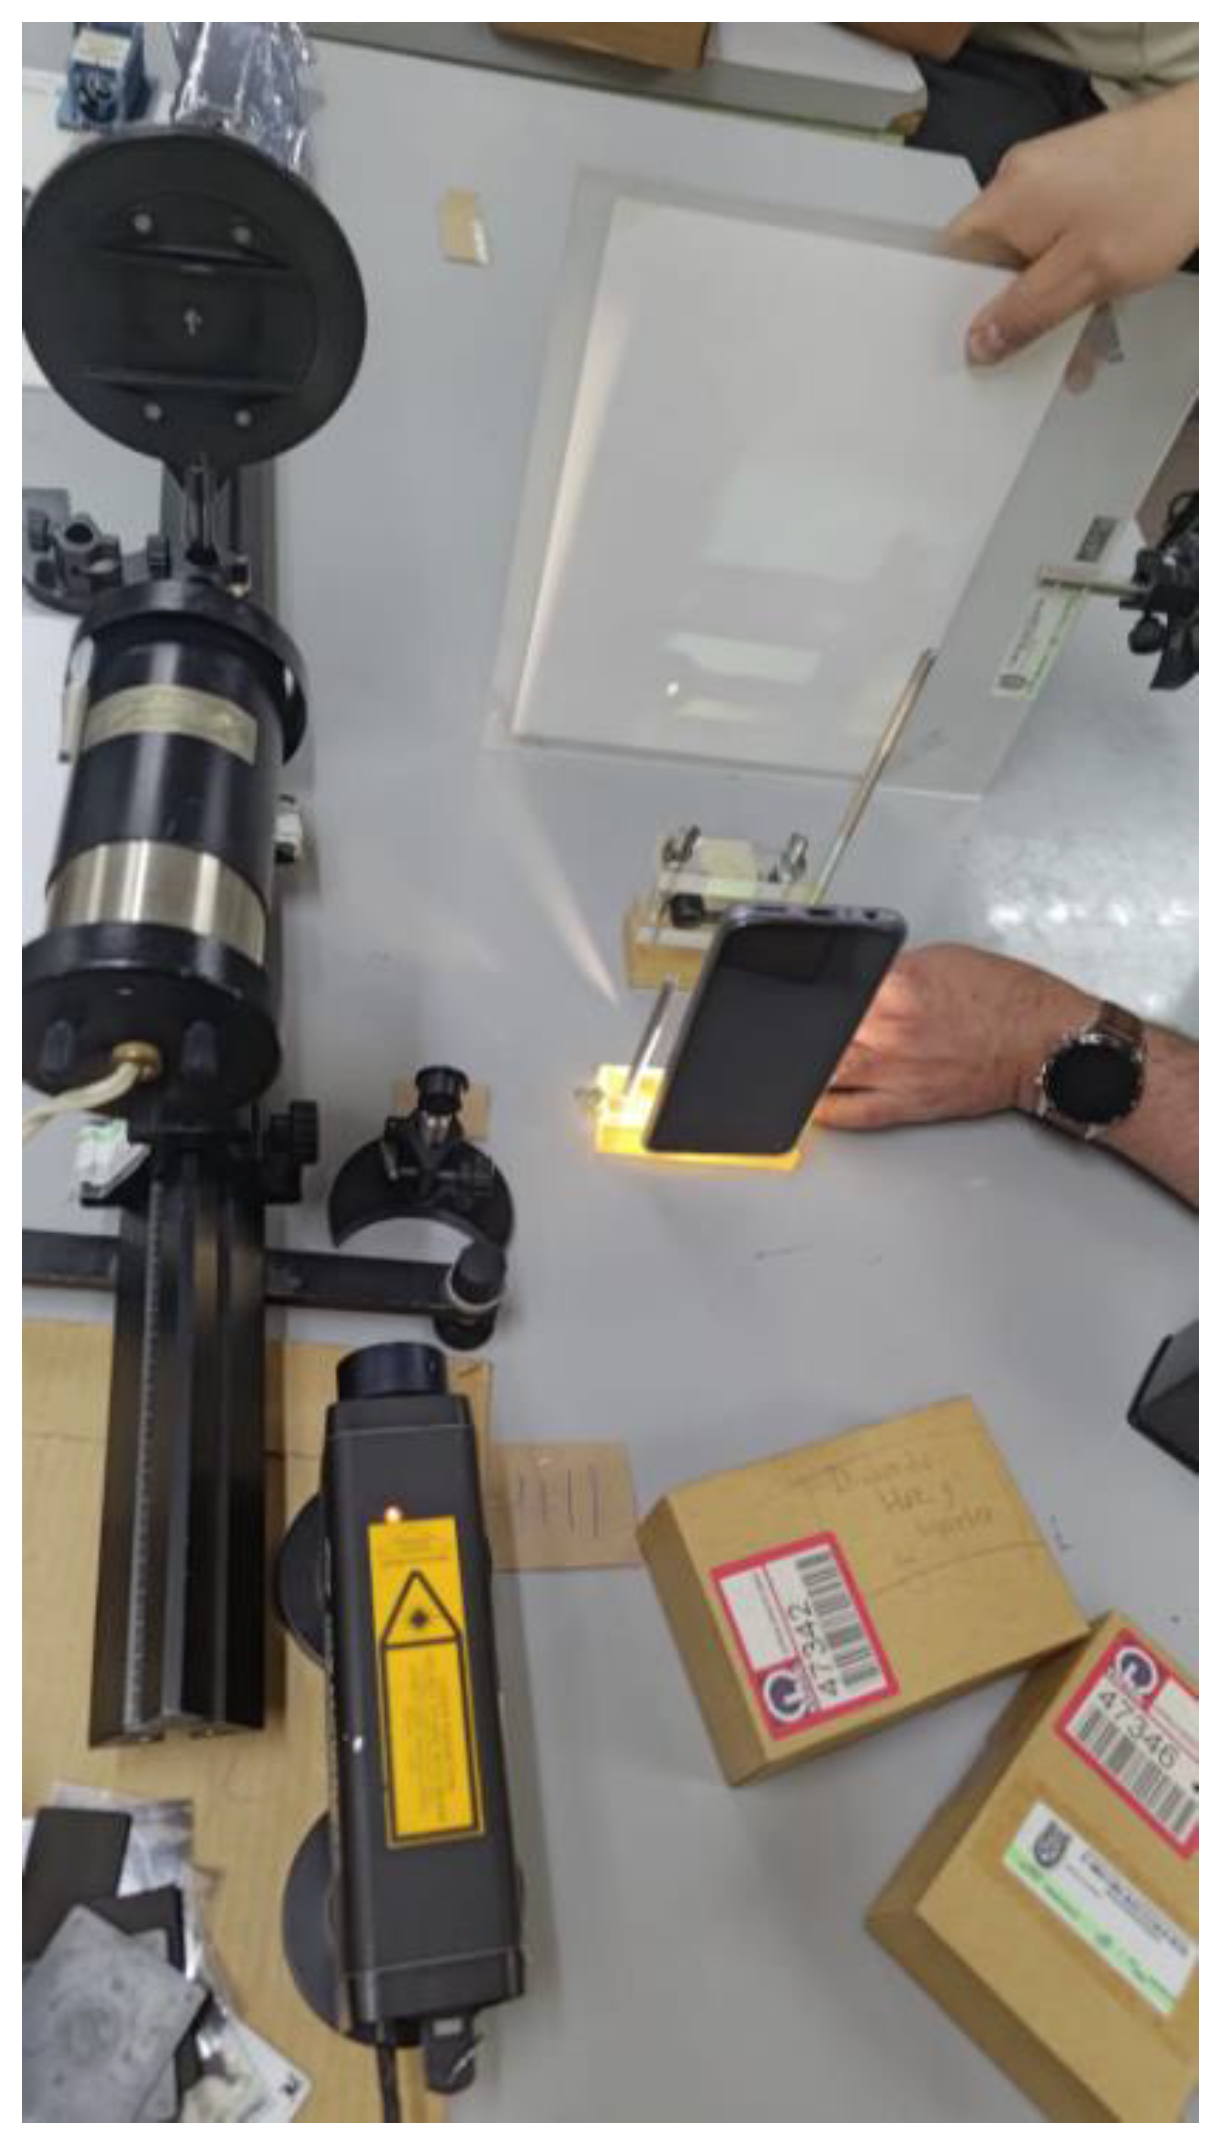
In the experimental setup, light wavelengths were channeled through a collimator tube to reduce losses caused by light dispersion. The tube, measuring five inches in length, terminates in a 1mm pinhole. This configuration was tested to ensure sufficient light emission from the pinhole, enabling the sensor to effectively detect signals from the diode. Following the successful application of the collimator tube, a lens, repurposed from a defunct laser, was introduced to enhance the collimation of the light beam, considering that the lens already meets the thermal and mechanical properties to function as a collimator. Subsequent tests confirmed the lens's operational integrity and facilitated the determination of its focal length using the lens maker's equation Equation 1. The lens specifications were 2mm thick and 10mm in diameter.
Lens manufacturers' equation to find the focus f of a thin lens in terms of its focal length.
Equation 1 Focal length
To mitigate the thermal accumulation associated with wavelength emission, the design incorporates a strategically placed aperture on the lateral aspect of the collimator tube. This feature serves as a potential heat extraction point, facilitating thermal regulation.
2.7. Photodiode (BP34W)
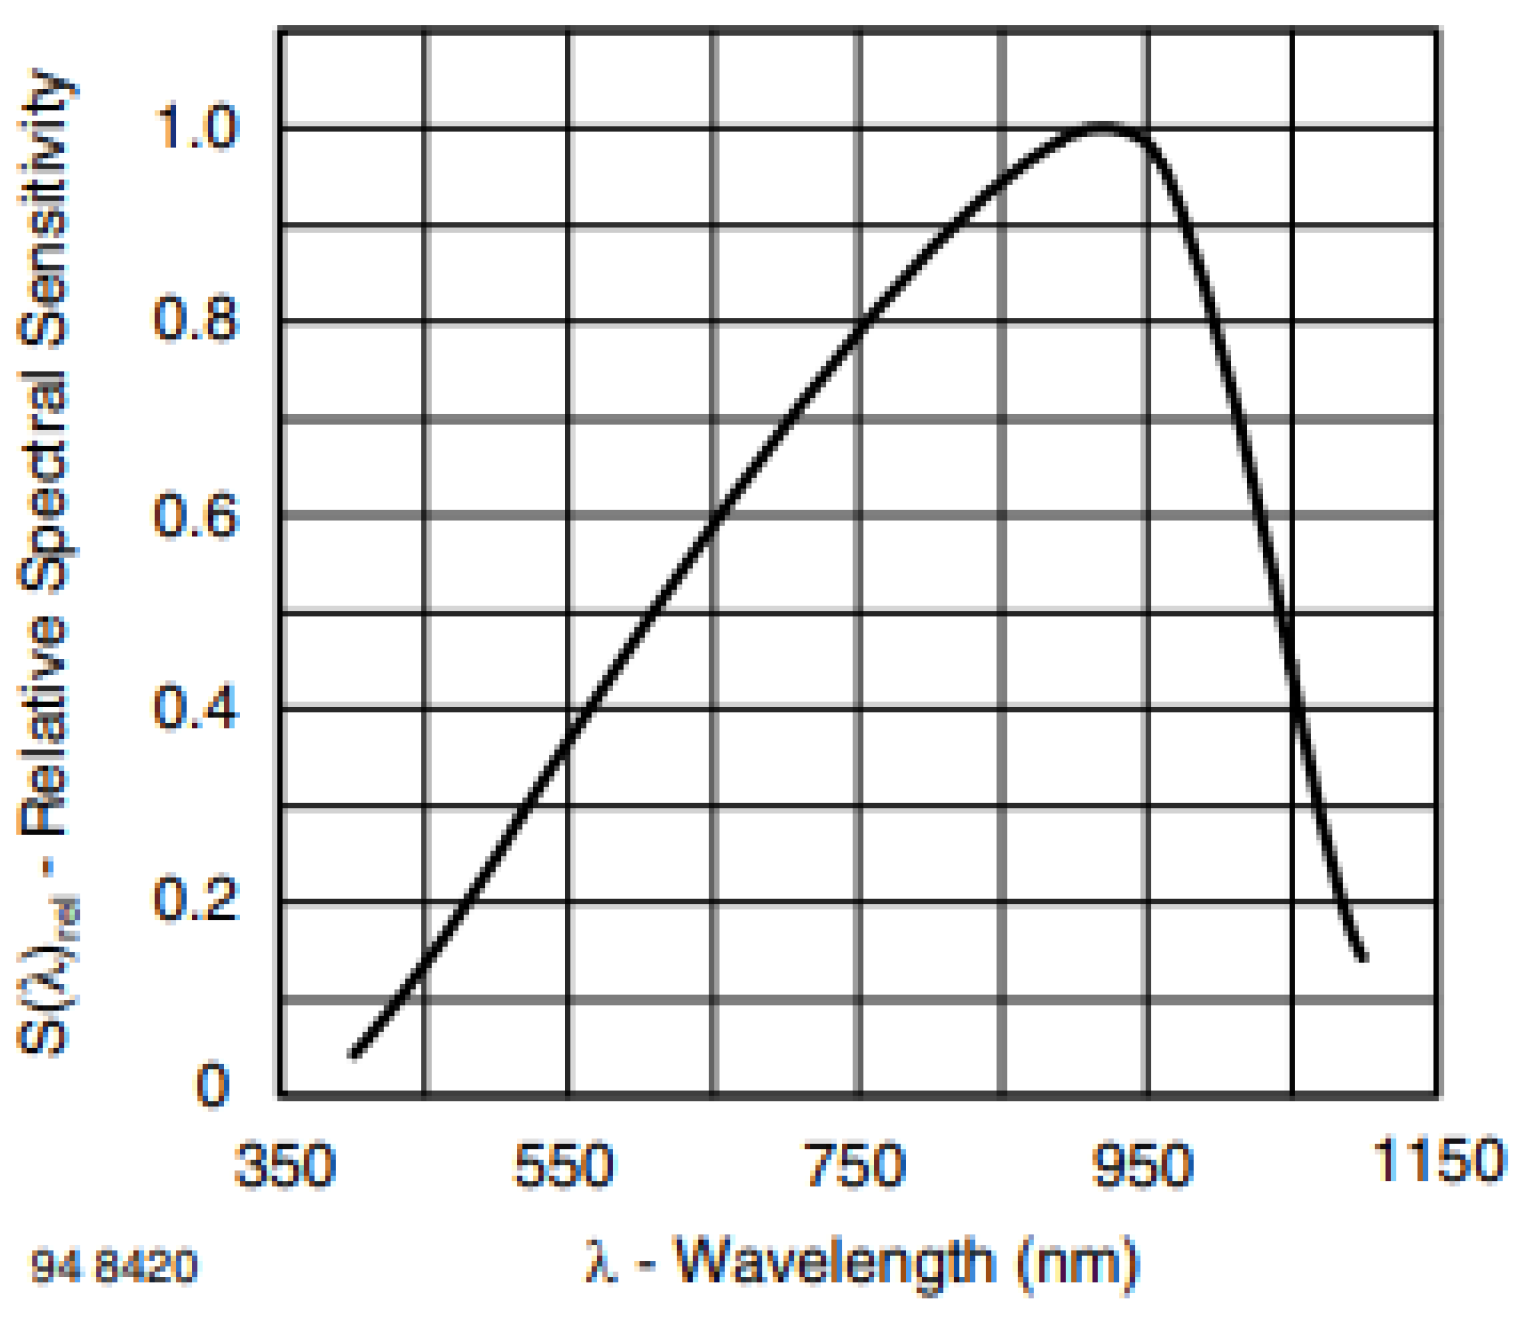
When selecting a photodiode, the most significant point was the detection range, considering that implementing different LEDs is to get measurements from the Ultraviolet to the Near Infrared. Therefore, it was decided to use the BP34W, our chosen photodiode, which has a detection range spanning from 300 nm to 1100 nm. When exposed to light reflected from microplastics, the photodiode generates an electrical signal proportional to the intensity of the detected light. This is shown in
Figure 9.
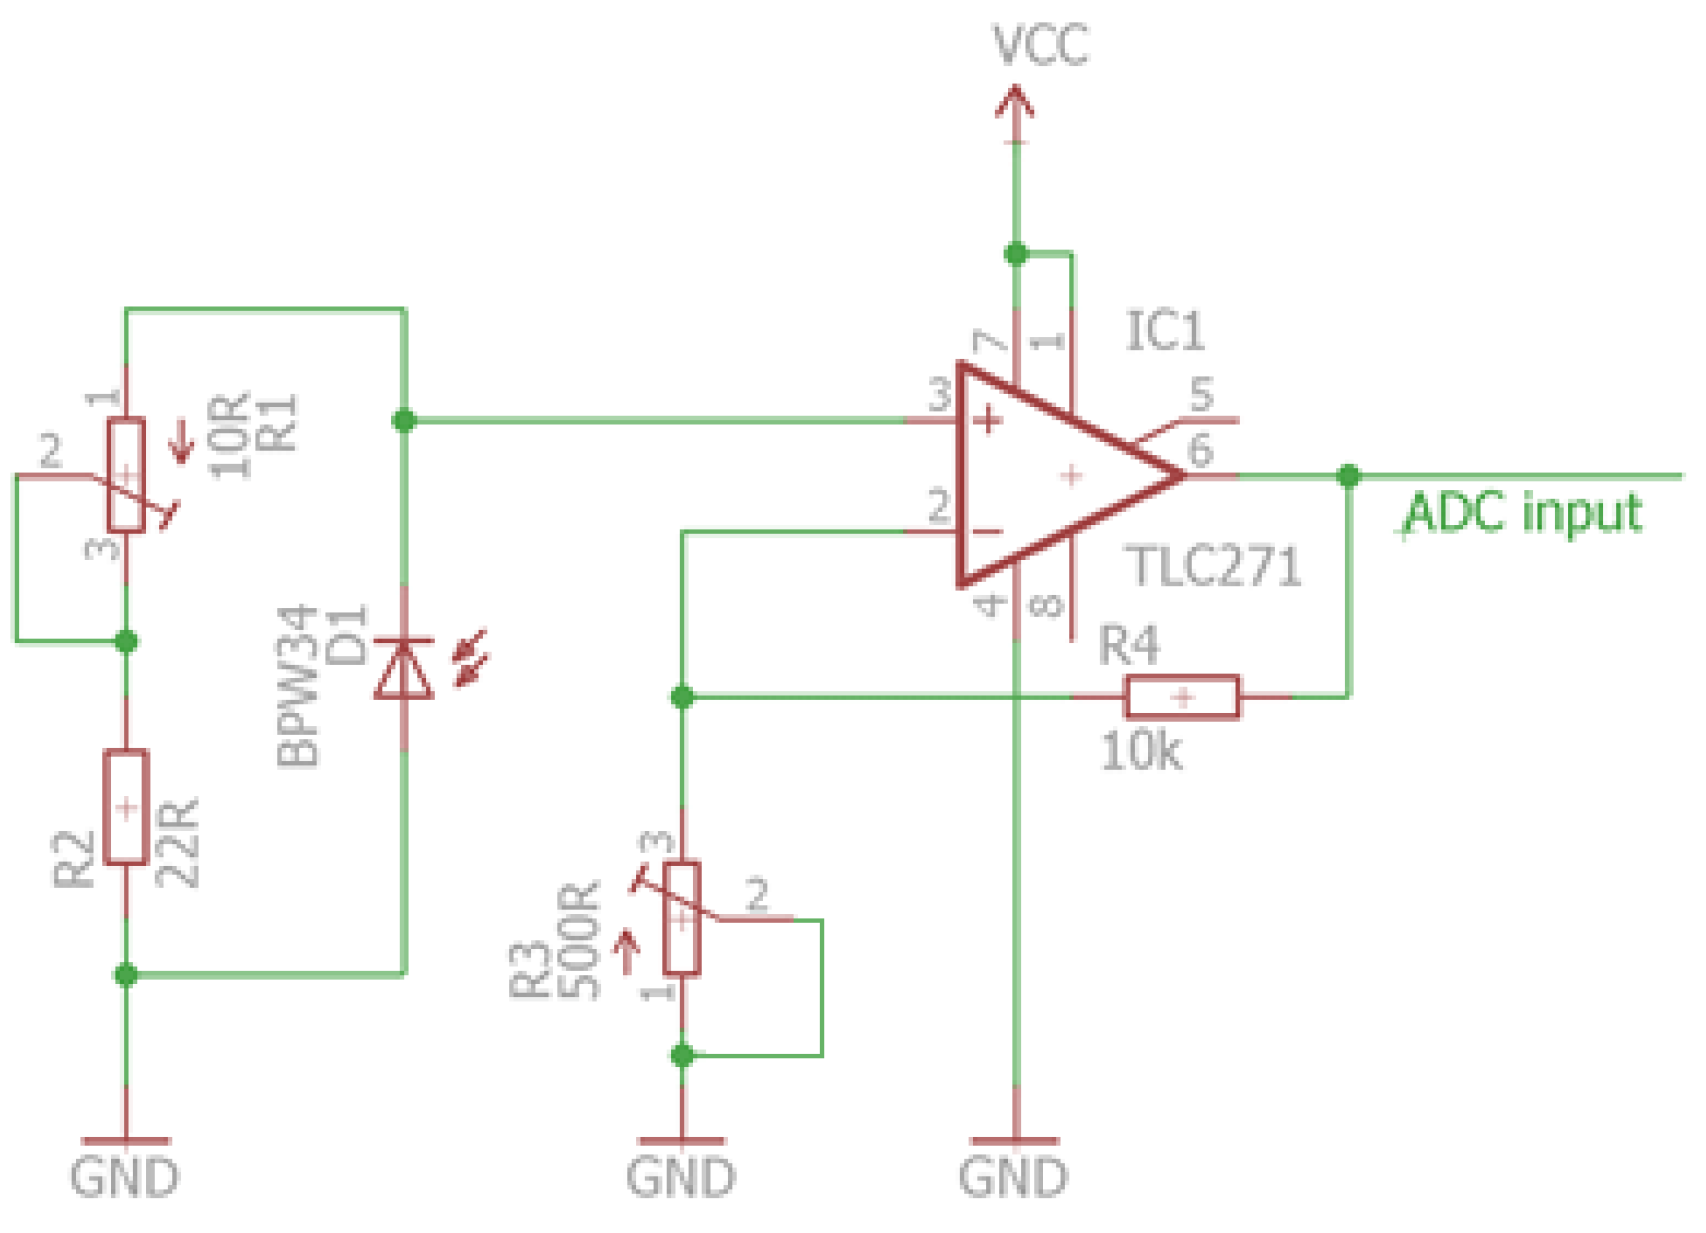
To enhance the performance of the BPW34 photodiode, we integrated an amplifier circuit that will boost the signal output, using an (op-amp) which has a positive gain, using the basic configuration of the non-inverting amplifier, and using a gain of 1,000,000, based on the article of the authors Richard Slávik, Miroslav Čekon [
21] we used the amplifier circuit illustrated in
Figure 10.
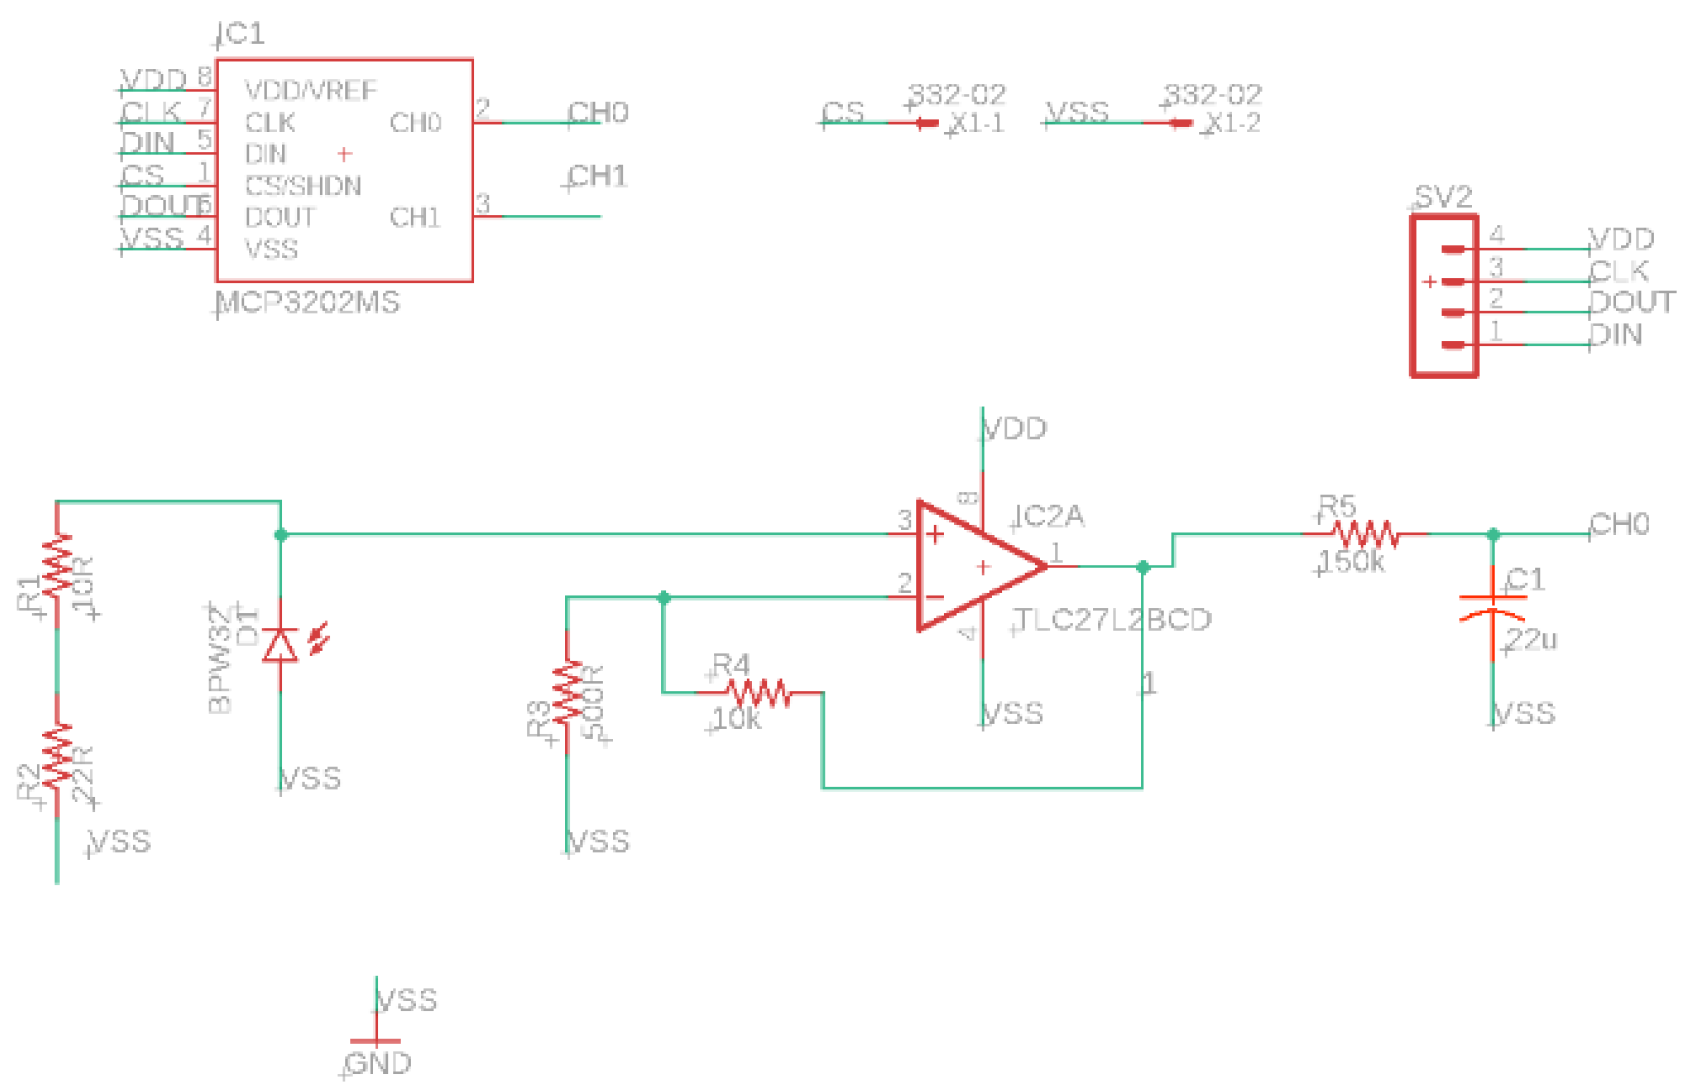
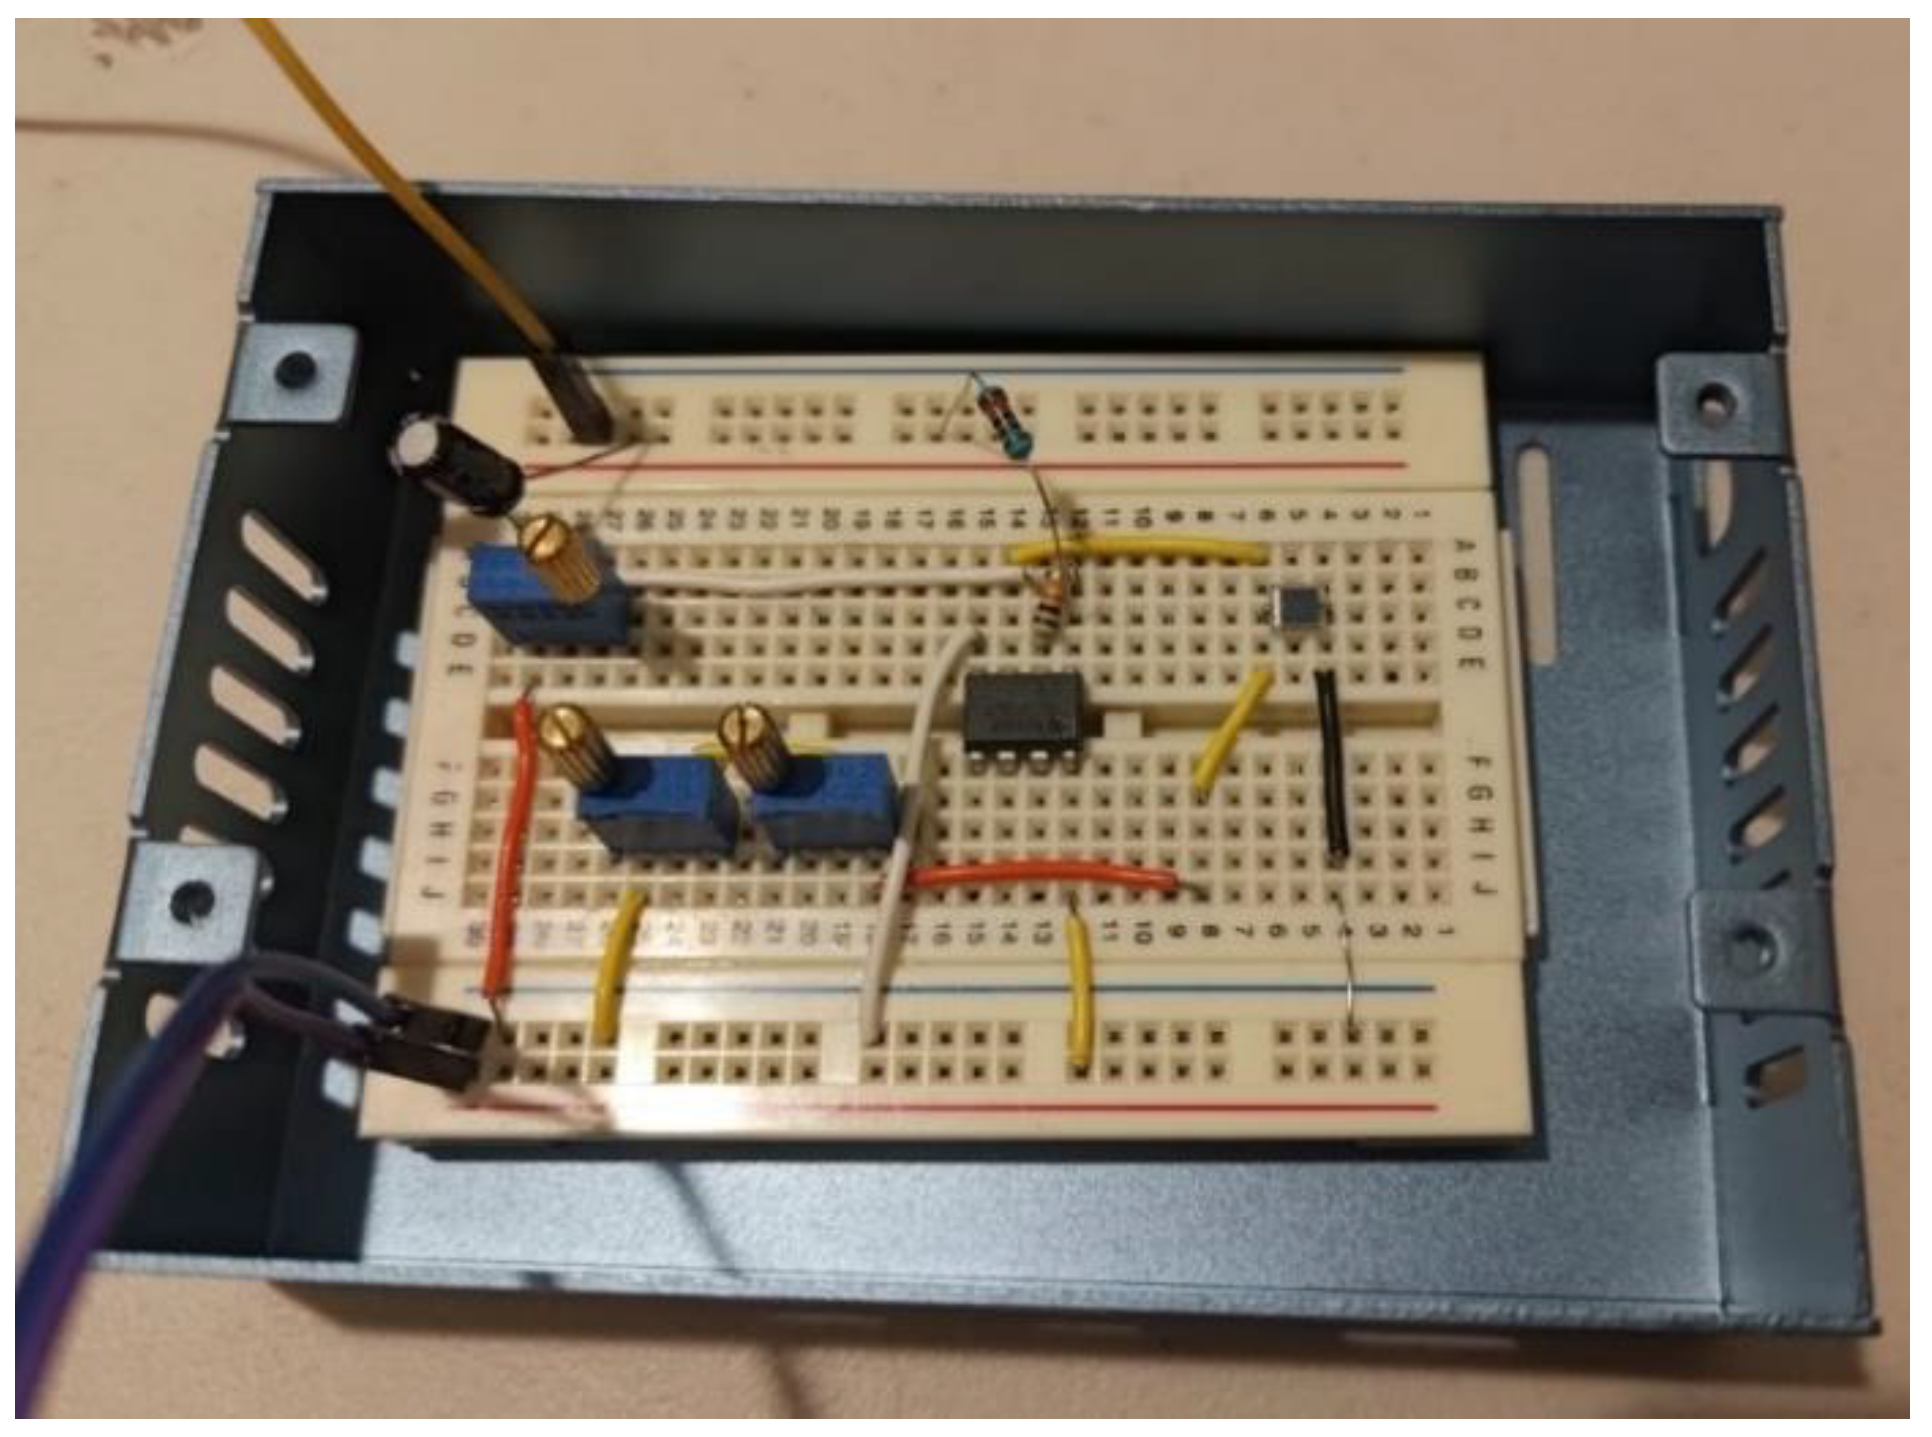
Additionally, incorporating filters into the circuit design is important for mitigating interference from extraneous sources, ensuring that the signal remains clear and undistorted; we aimed to reduce the noise produced by both the vibration of the motors and the external signal noise of the output signal by using a passive low-pass filter. The low-pass filter was applied to the front of the amplification (
Figure 11,
Figure 12). The low pass filter selected was a passive RC filter to “filter out” unwanted signals as they separate and allow to pass only those sinusoidal input signals based upon their frequency, with the simplest being a passive low pass filter network; the standard formula is shown in Equation 2. Utilizing the property of low-pass circuits to filter signals up to 100kHz, we prevent signals less than 0.07Hz from passing through the photodiode, allowing only very high frequencies to pass through, as is the case of light.
This dual approach of amplification and filtration is essential for optimizing the photodiode's responsiveness and reliability in various applications.[
22]
Equation 2 Low Pass-Filter equation
2.8. Graphic User Interface
As previously mentioned, we utilized the Raspberry Pi 4 as the microcontroller due to its capacity to support a graphical user interface (GUI). This GUI plays a pivotal role in the system's operation, functioning as a dedicated application for user interaction and prototype management. It is integral to the system's architecture, managing the real-time multiplexing wavelengths and actuation of the motors. This setup streamlines the user experience and enhances the precision and responsiveness of the prototype's mechanical movements. This application runs inside the device, allowing the user to interact tactilely with the detection platform since a touch screen was added to be more accessible.
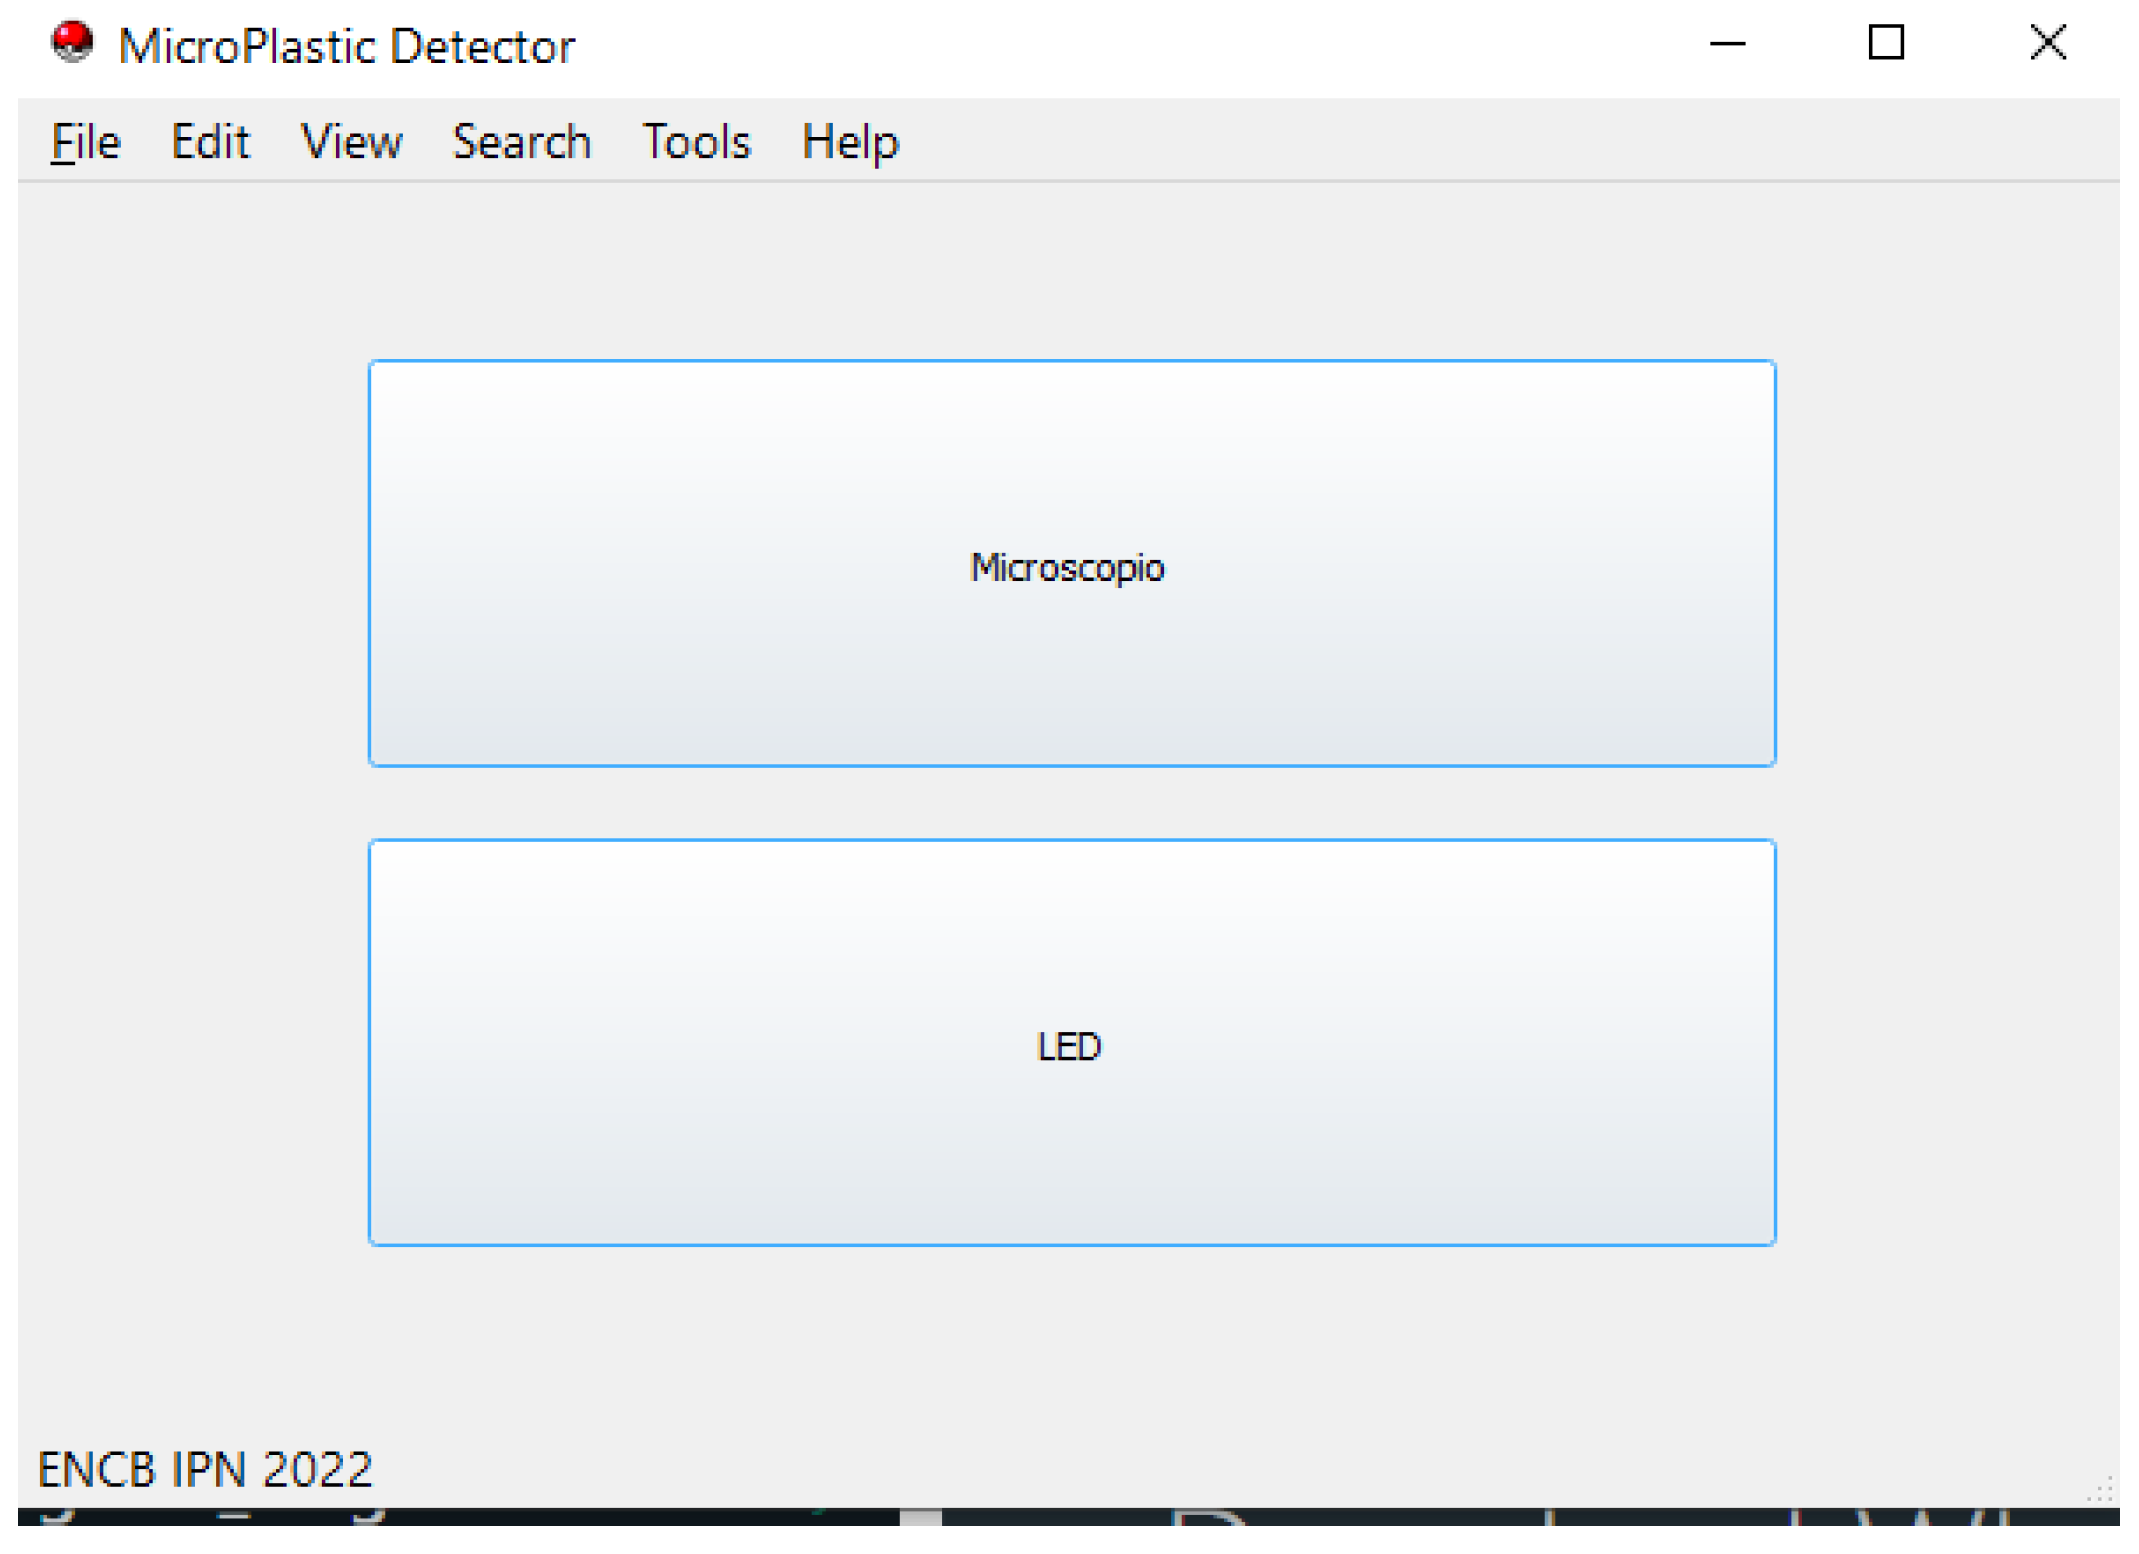
As the prototype is designed for use at workplaces and by laboratory personnel, the GUI eases the user's use of it, as shown in
Figure 13.
Based on the experience working with microplastics, the needs and the purpose for which the prototype will be used. The GUI was created using the following criteria.
3. Results
This section may be divided by subheadings. It should provide a concise and precise description of the experimental results, their interpretation, as well as the experimental conclusions that can be drawn.
Meticulous testing is paramount in sensor technology to ensure accuracy and reliability. Segmenting the testing process into three distinct stages is a strategic approach that allows for comprehensive analysis and fine-tuning of the sensor's performance.
3.1. Operation in an uncontrolled environment
The initial stage involves testing the sensor in an uncontrolled environment. This phase is important as it provides a baseline of the sensor's capabilities in real-world conditions where variables are not regulated. It resembles a field test, where the sensor's resilience and adaptability to unpredictable factors are evaluated.
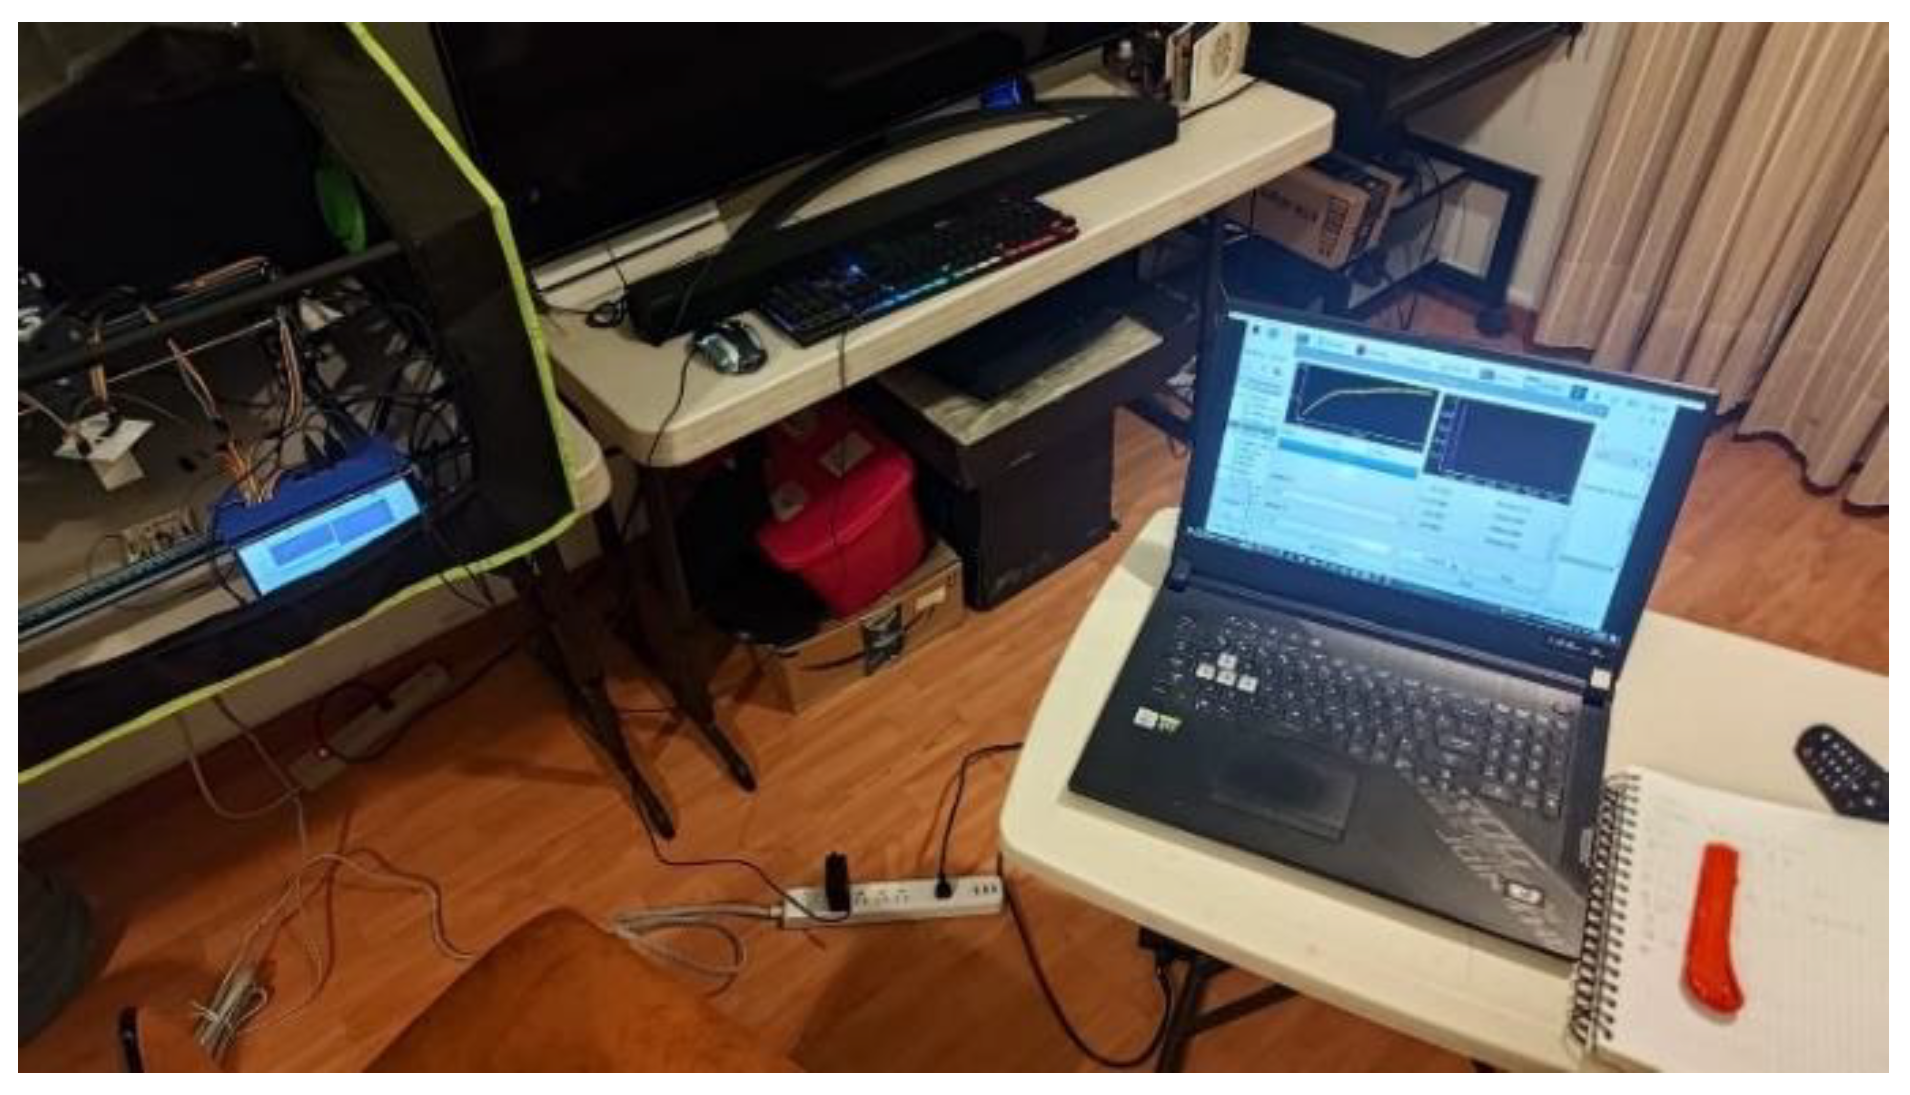
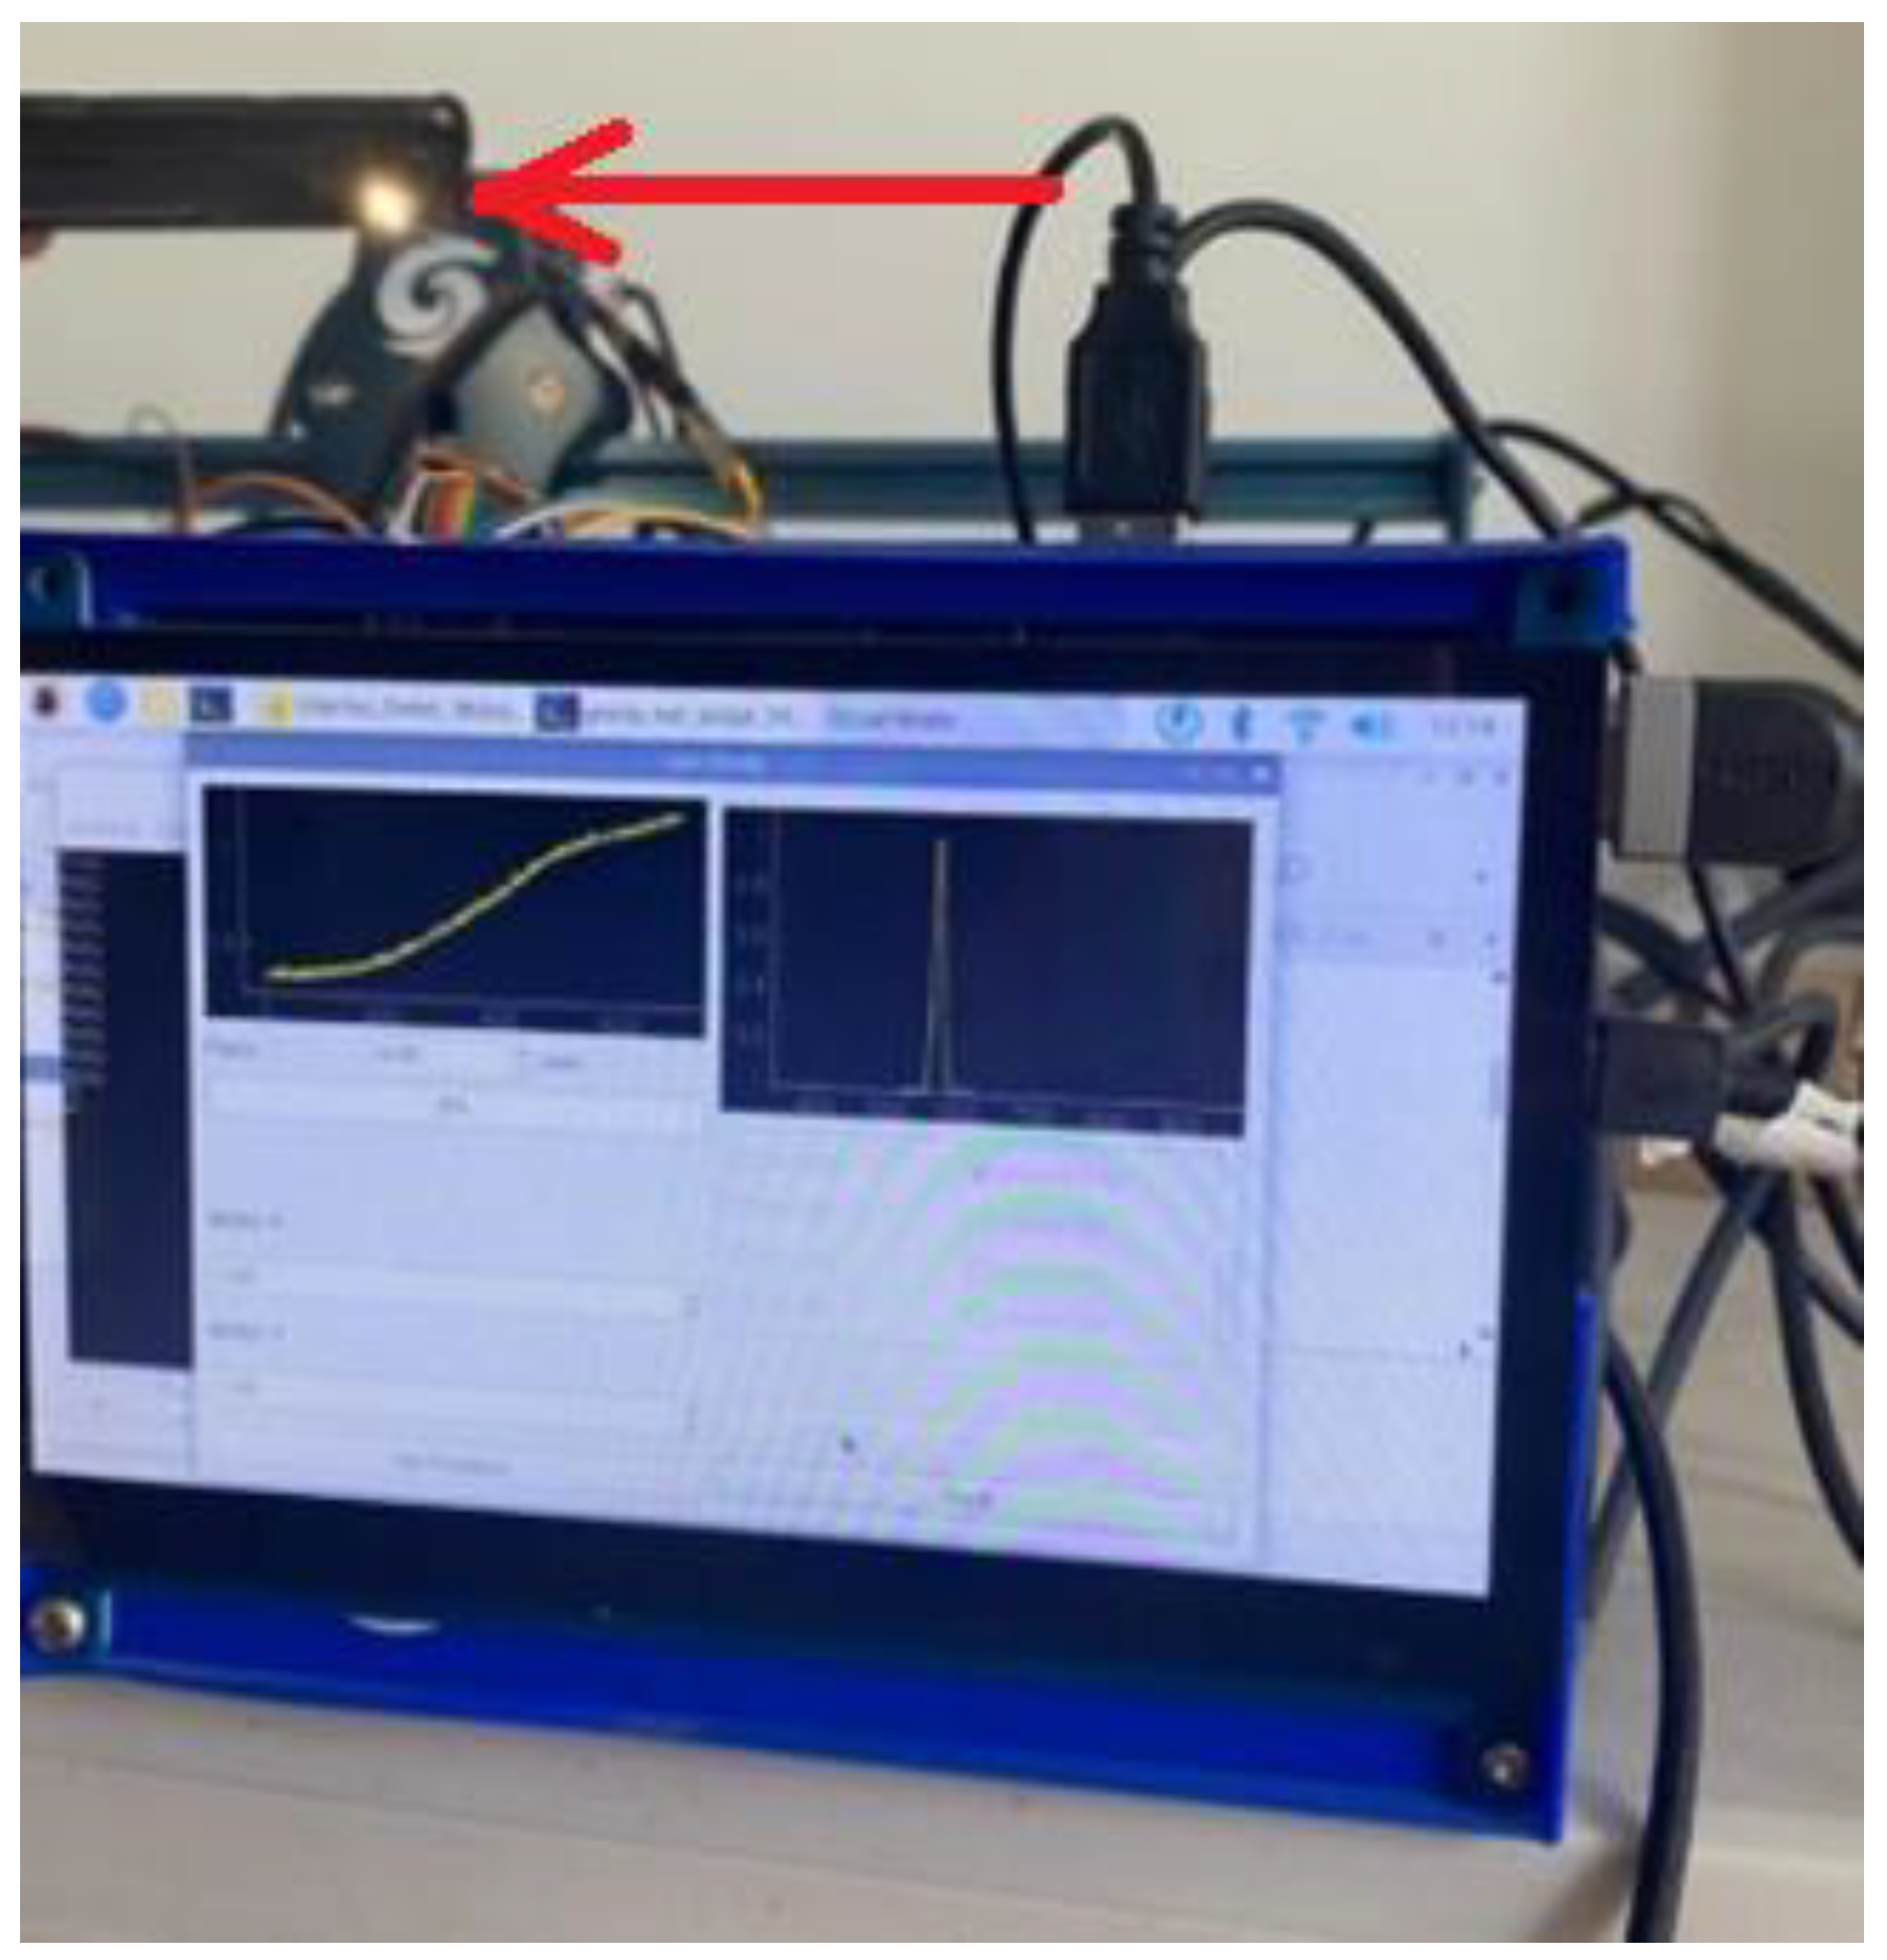
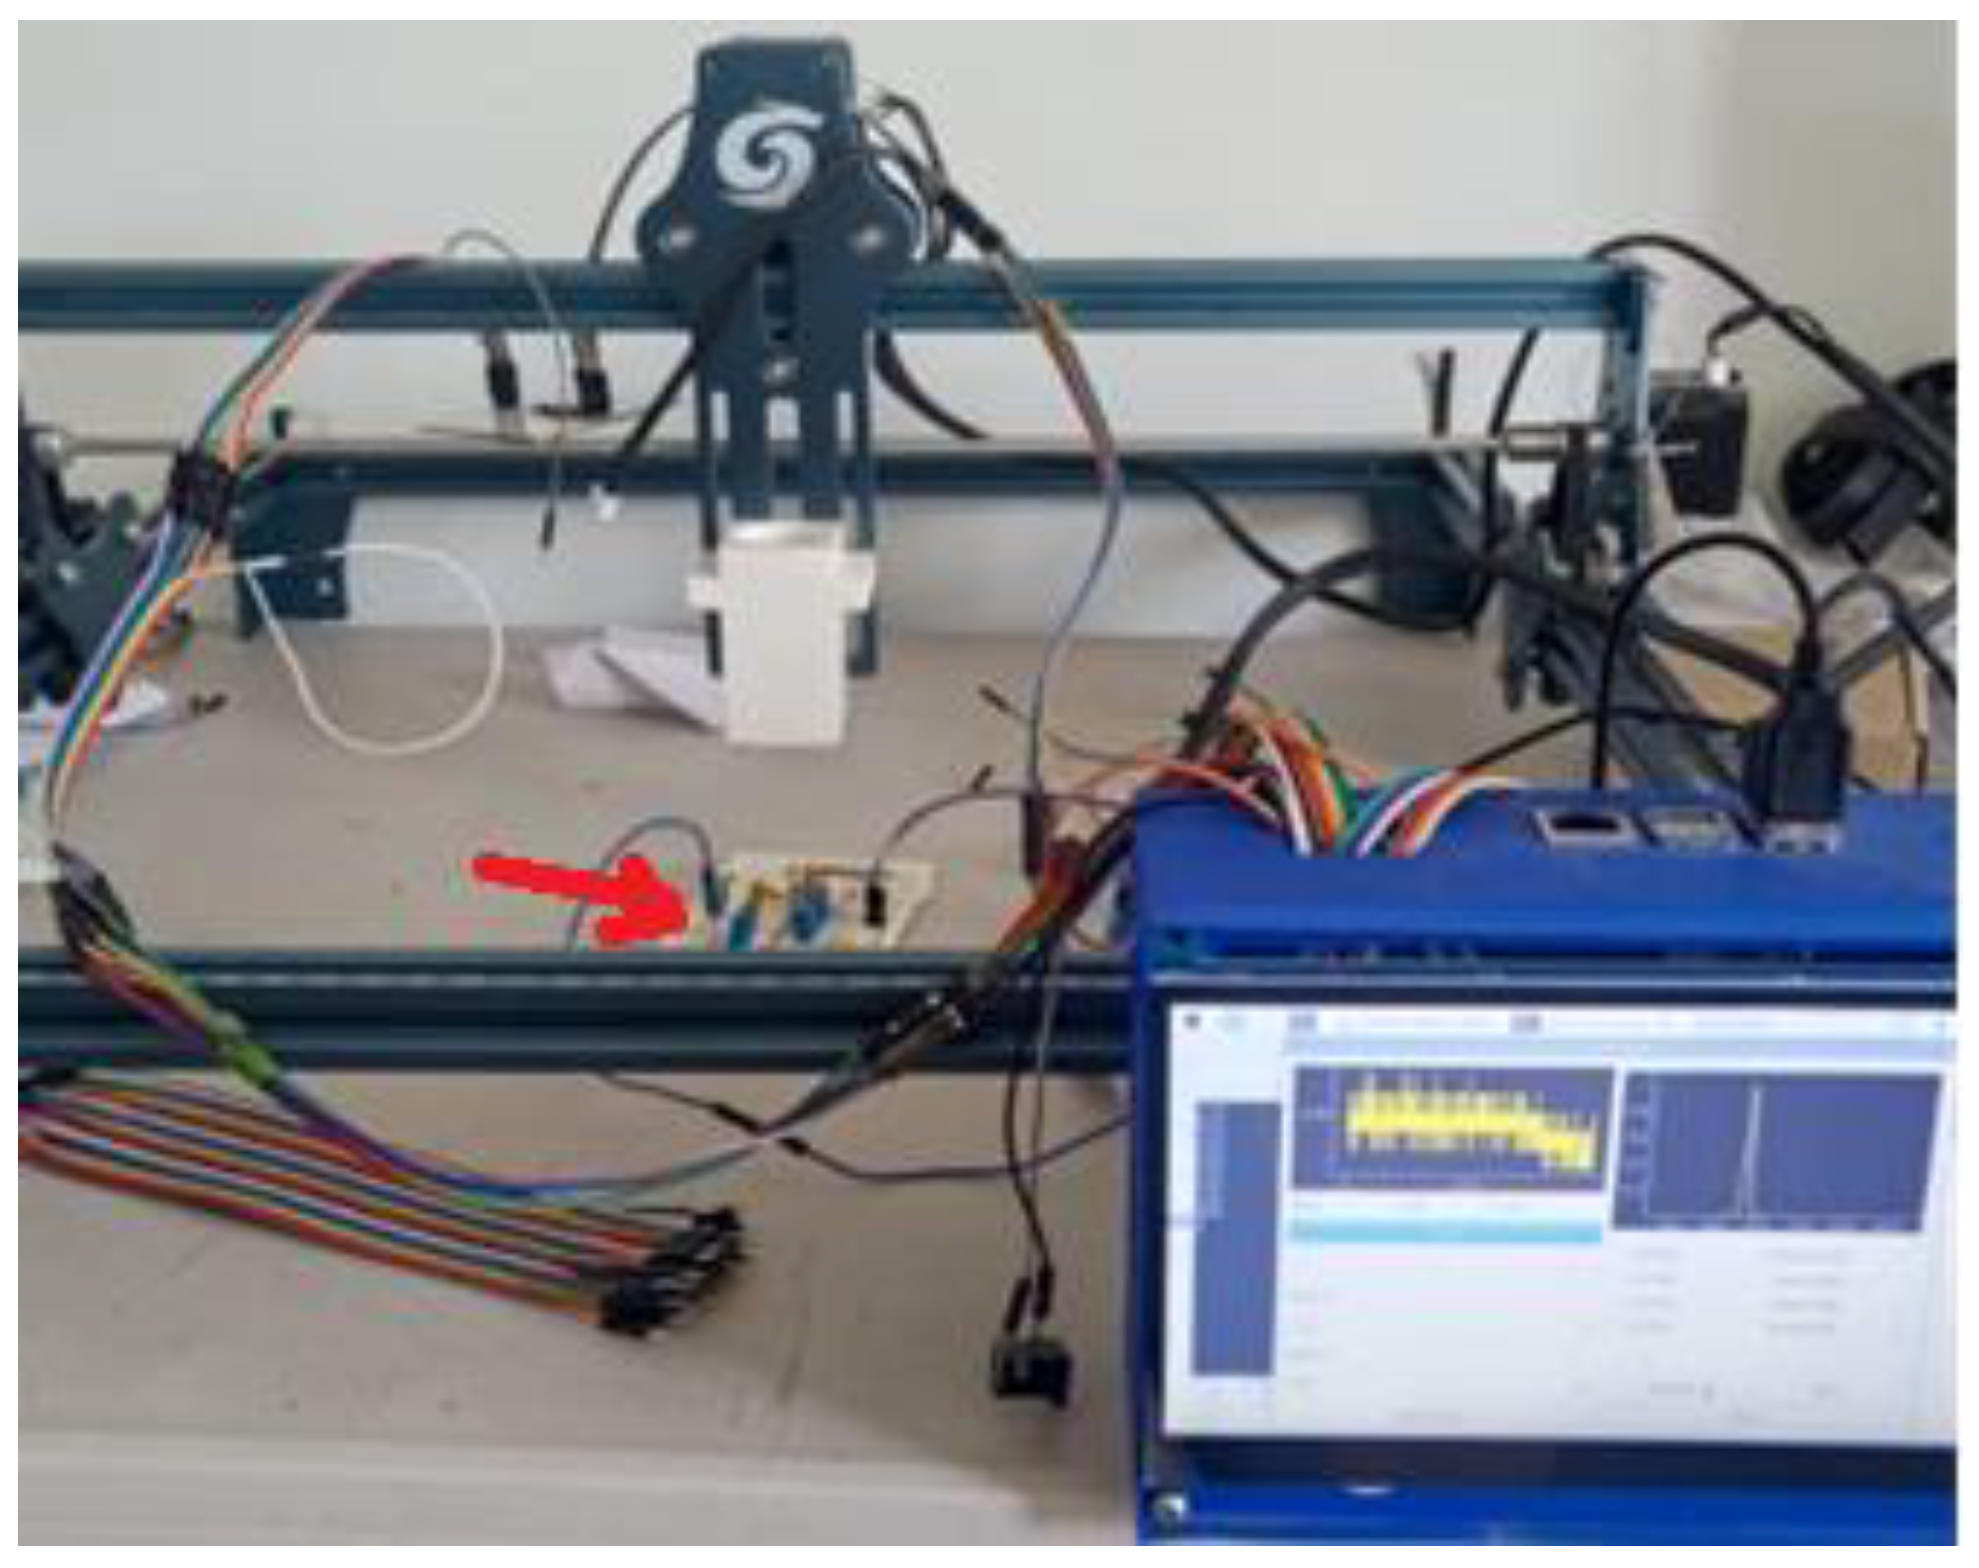
The sensor was tested in an open environment with low light, where we had peak signals of 0.2V, while when aiming the white light of an Asus Rog phone 6, the light intensity obtained scaled up to 2.6V, meanwhile with a handheld flashlight of 130 lumens at a distance of 10cm, we managed to saturate the sensor to 3.3V. When testing with the Blue(457) and Green(570) wavelengths, the sensor had different values, obtaining 1.1V in Blue and 1.3V in Green. Consequently, the noise reduction filter and the amplification are doing their purpose. Regarding the motors, these can be adjusted to select a specific position and scan the sample. This is shown in the figures below (
Figure 17,
Figure 18 and
Figure 19).
3.2. Operation in a controlled environment
The second stage transitions into a controlled environment, where variables can be manipulated to observe the sensor's response to specific conditions.
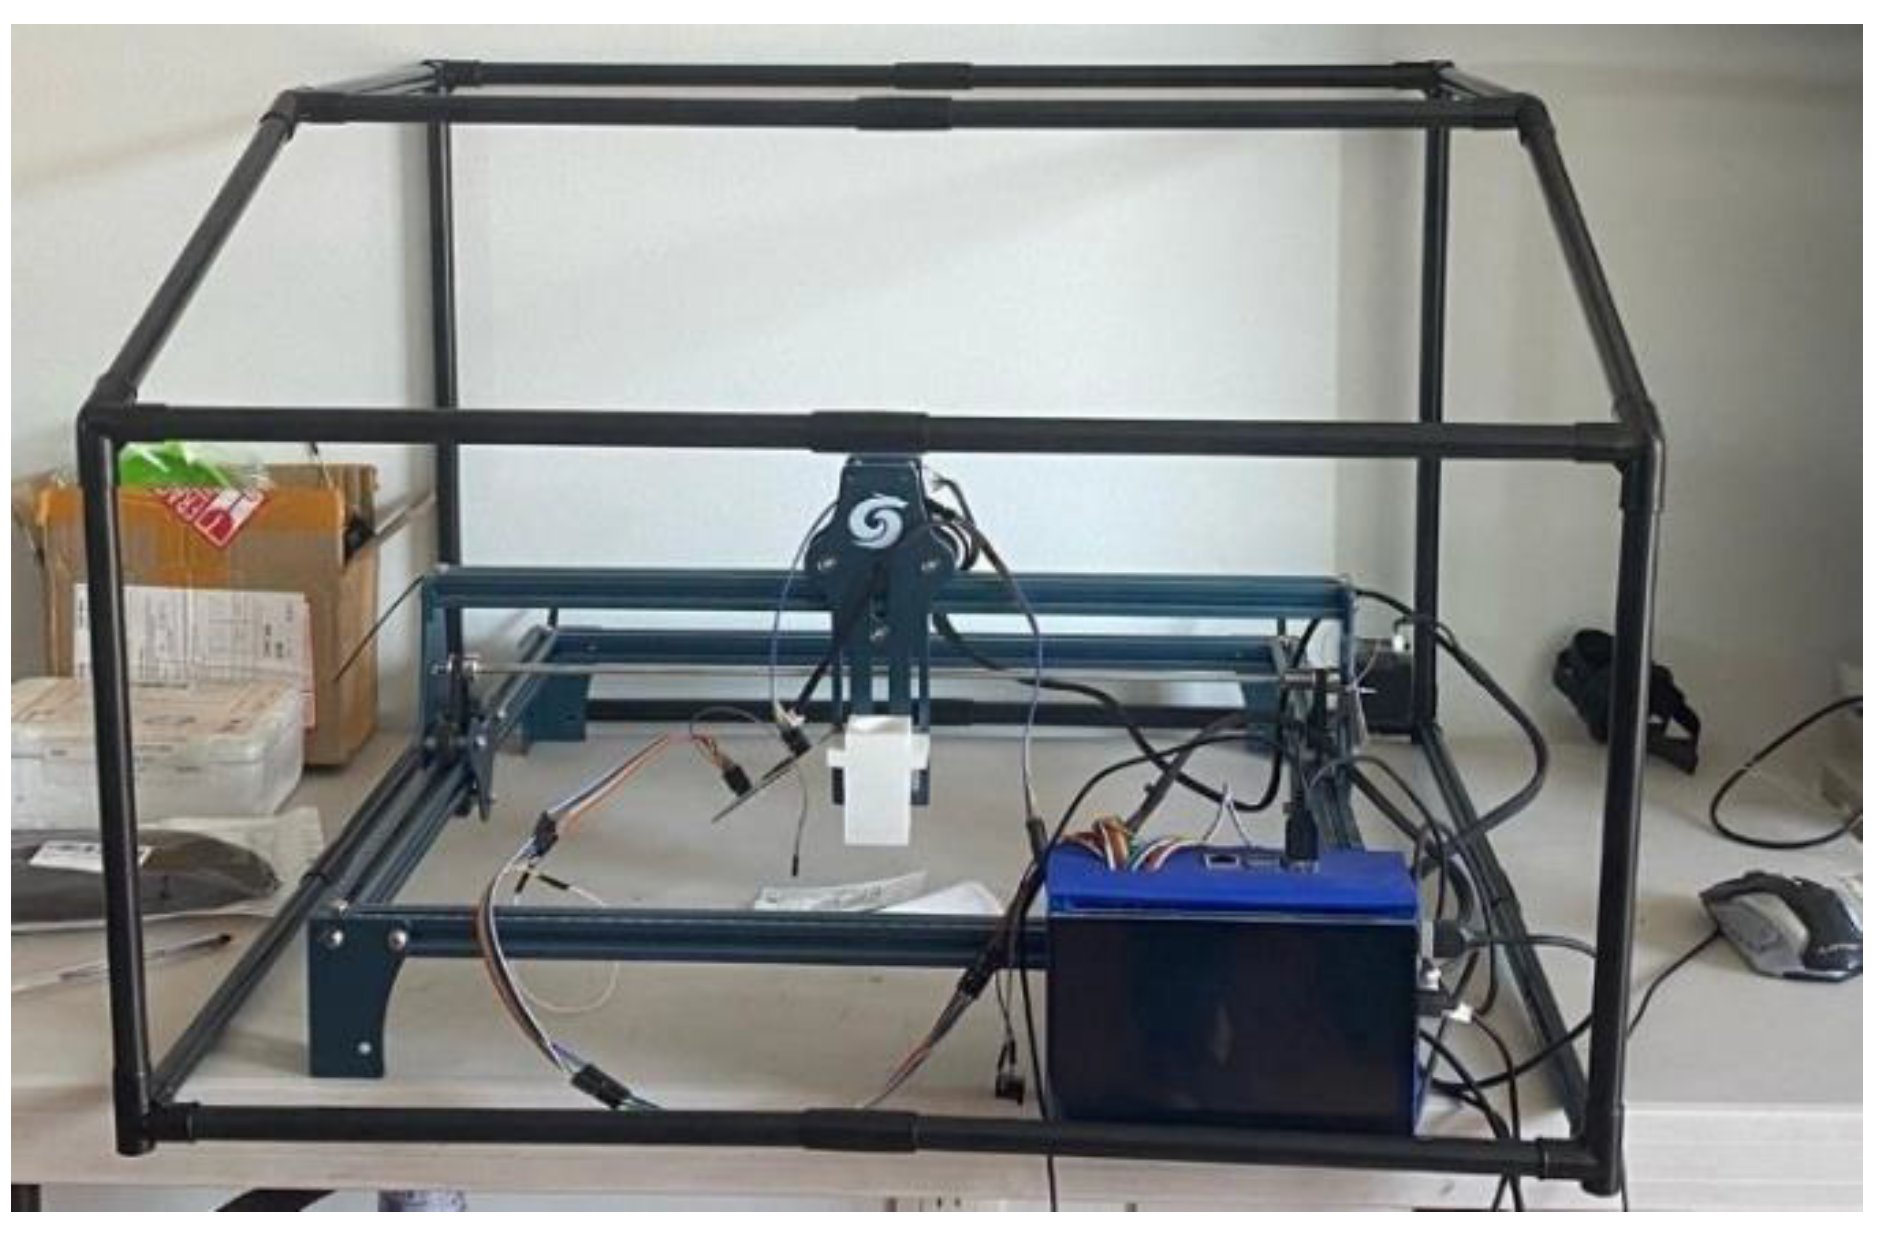
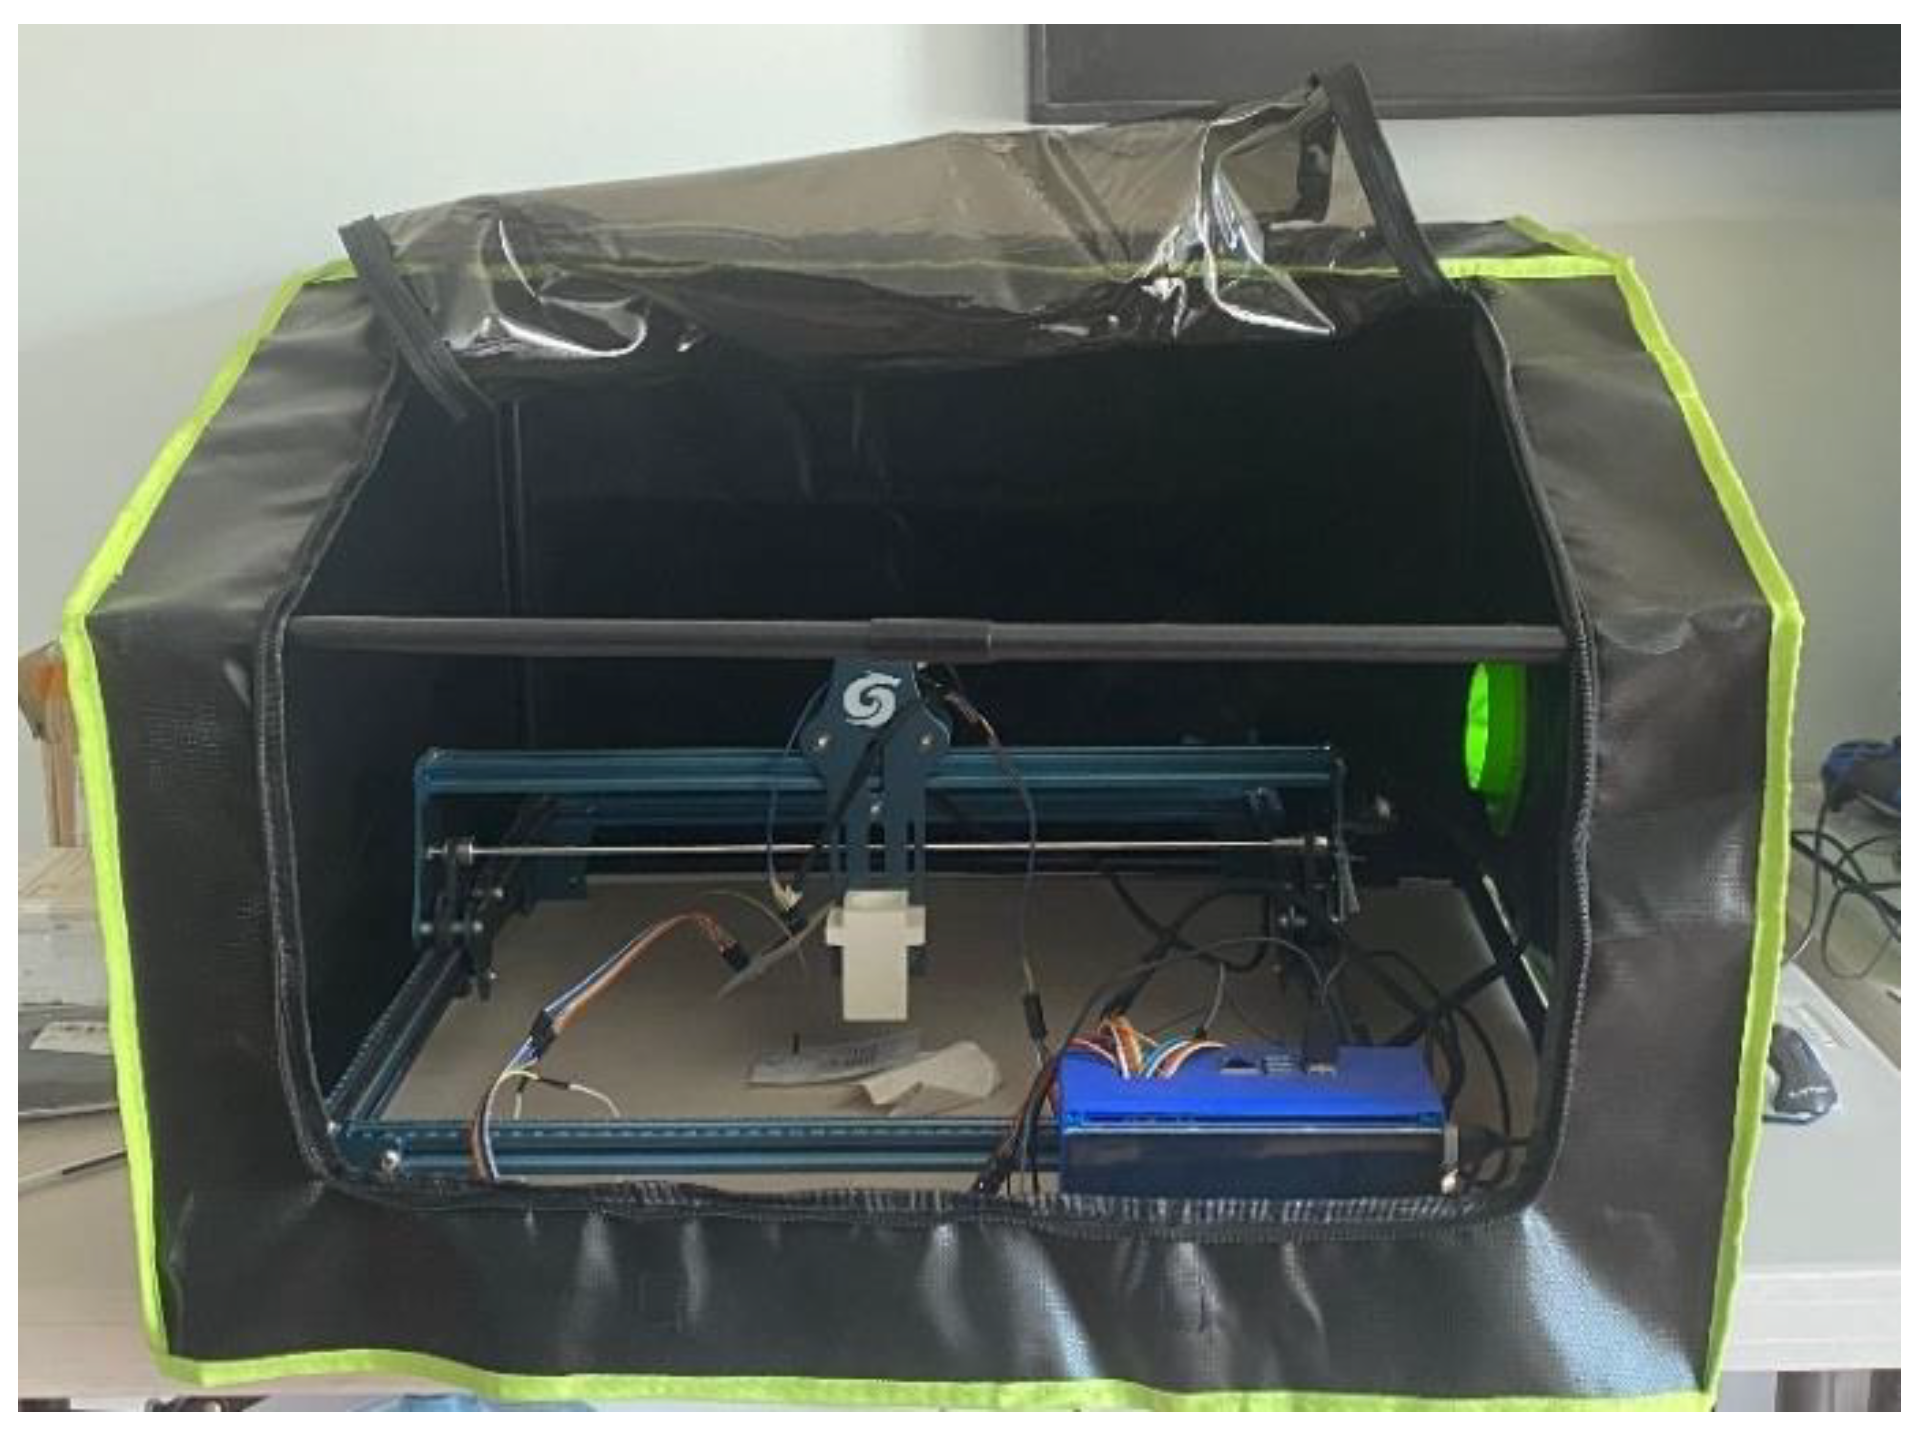
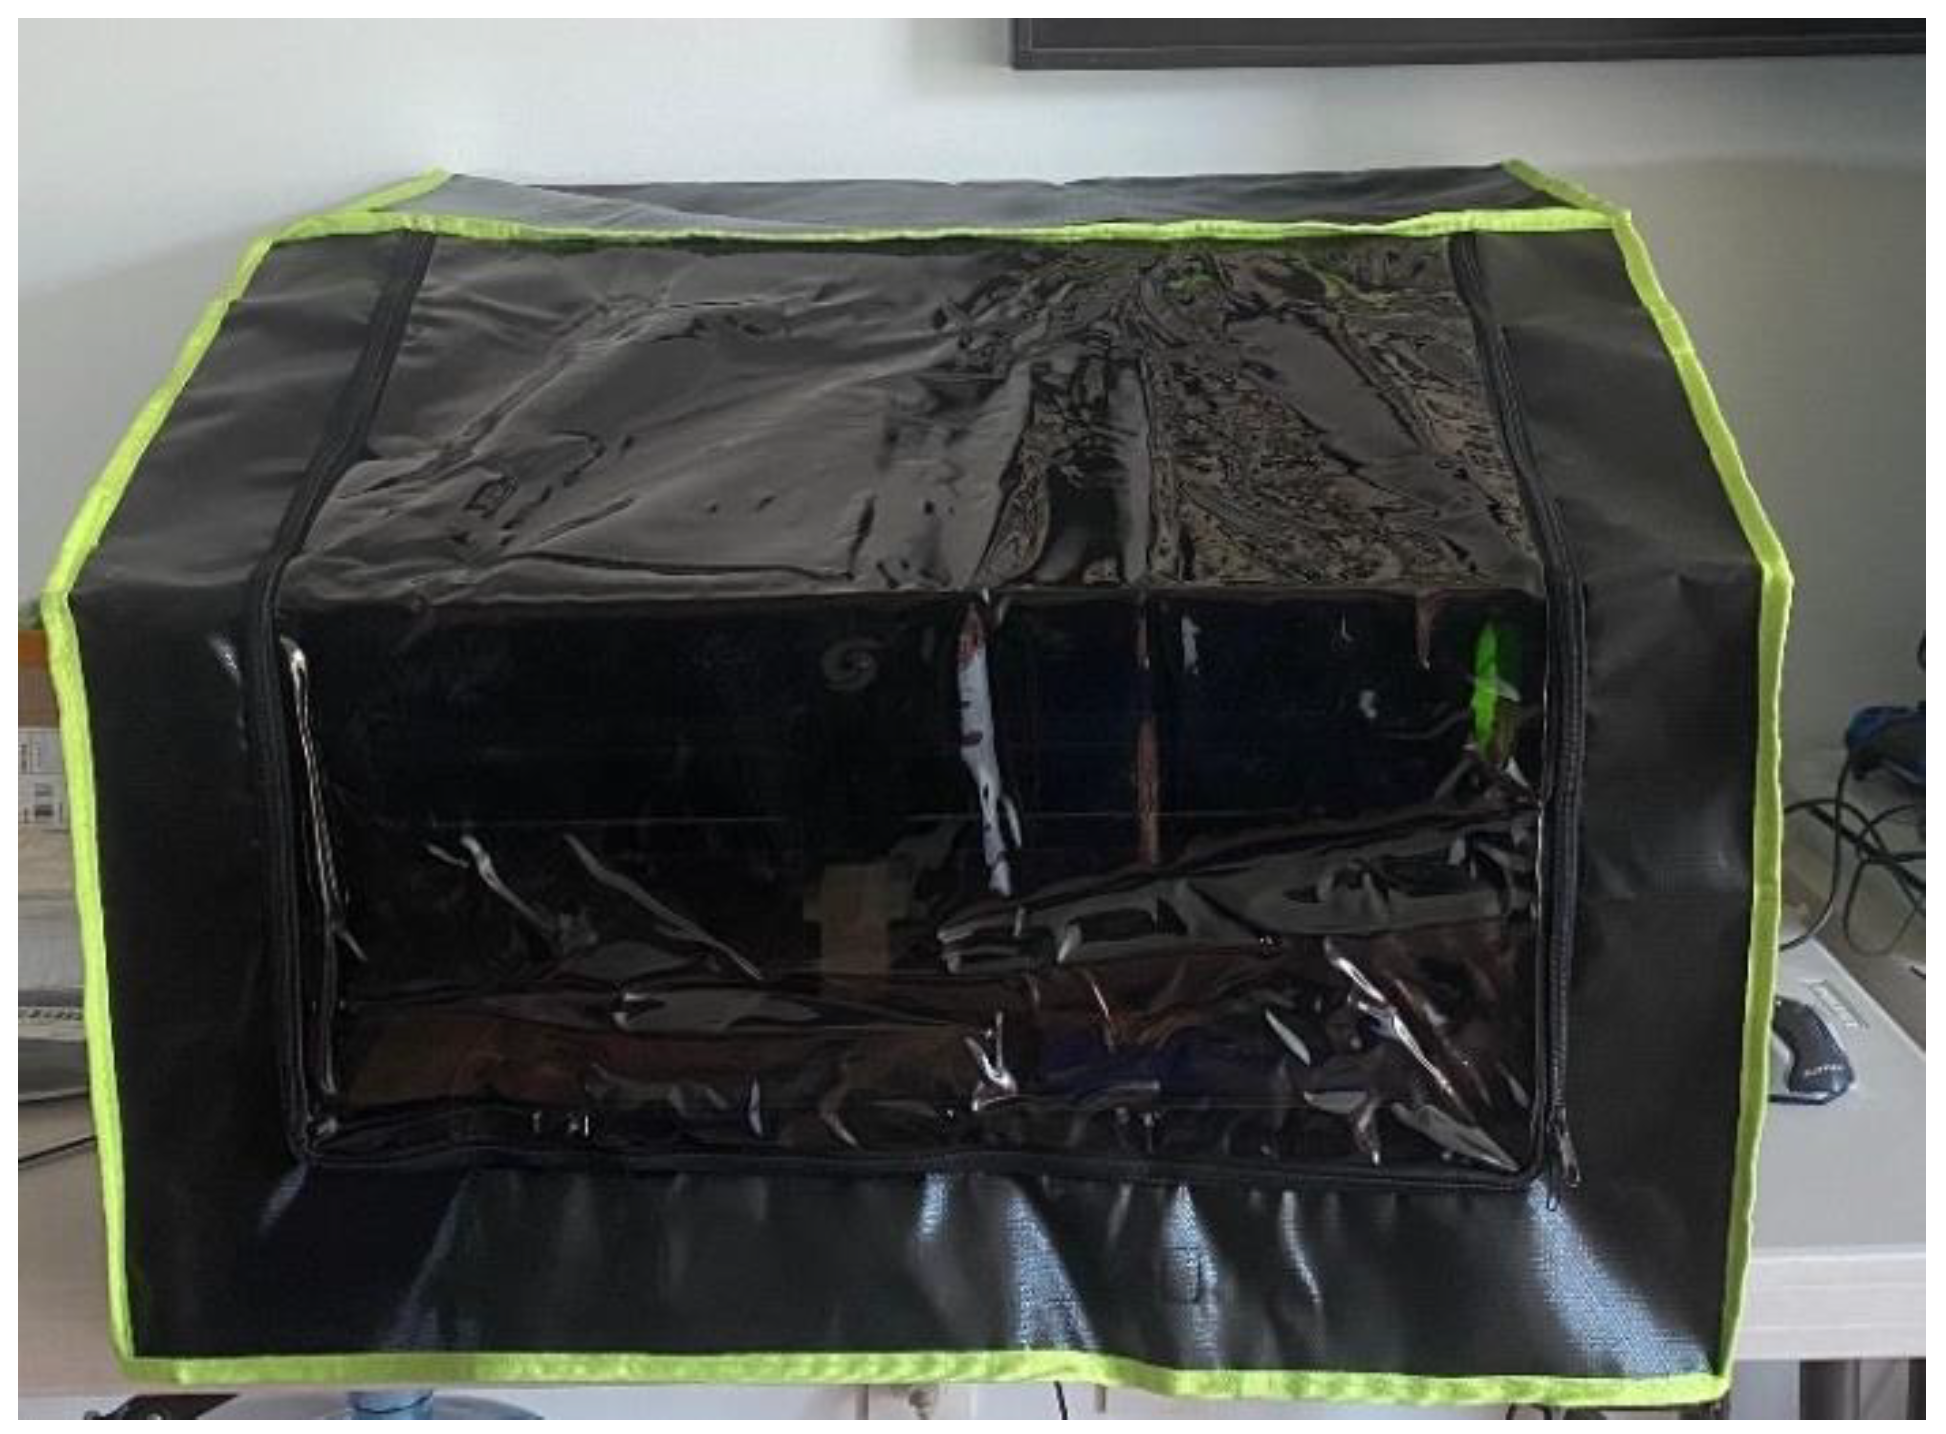
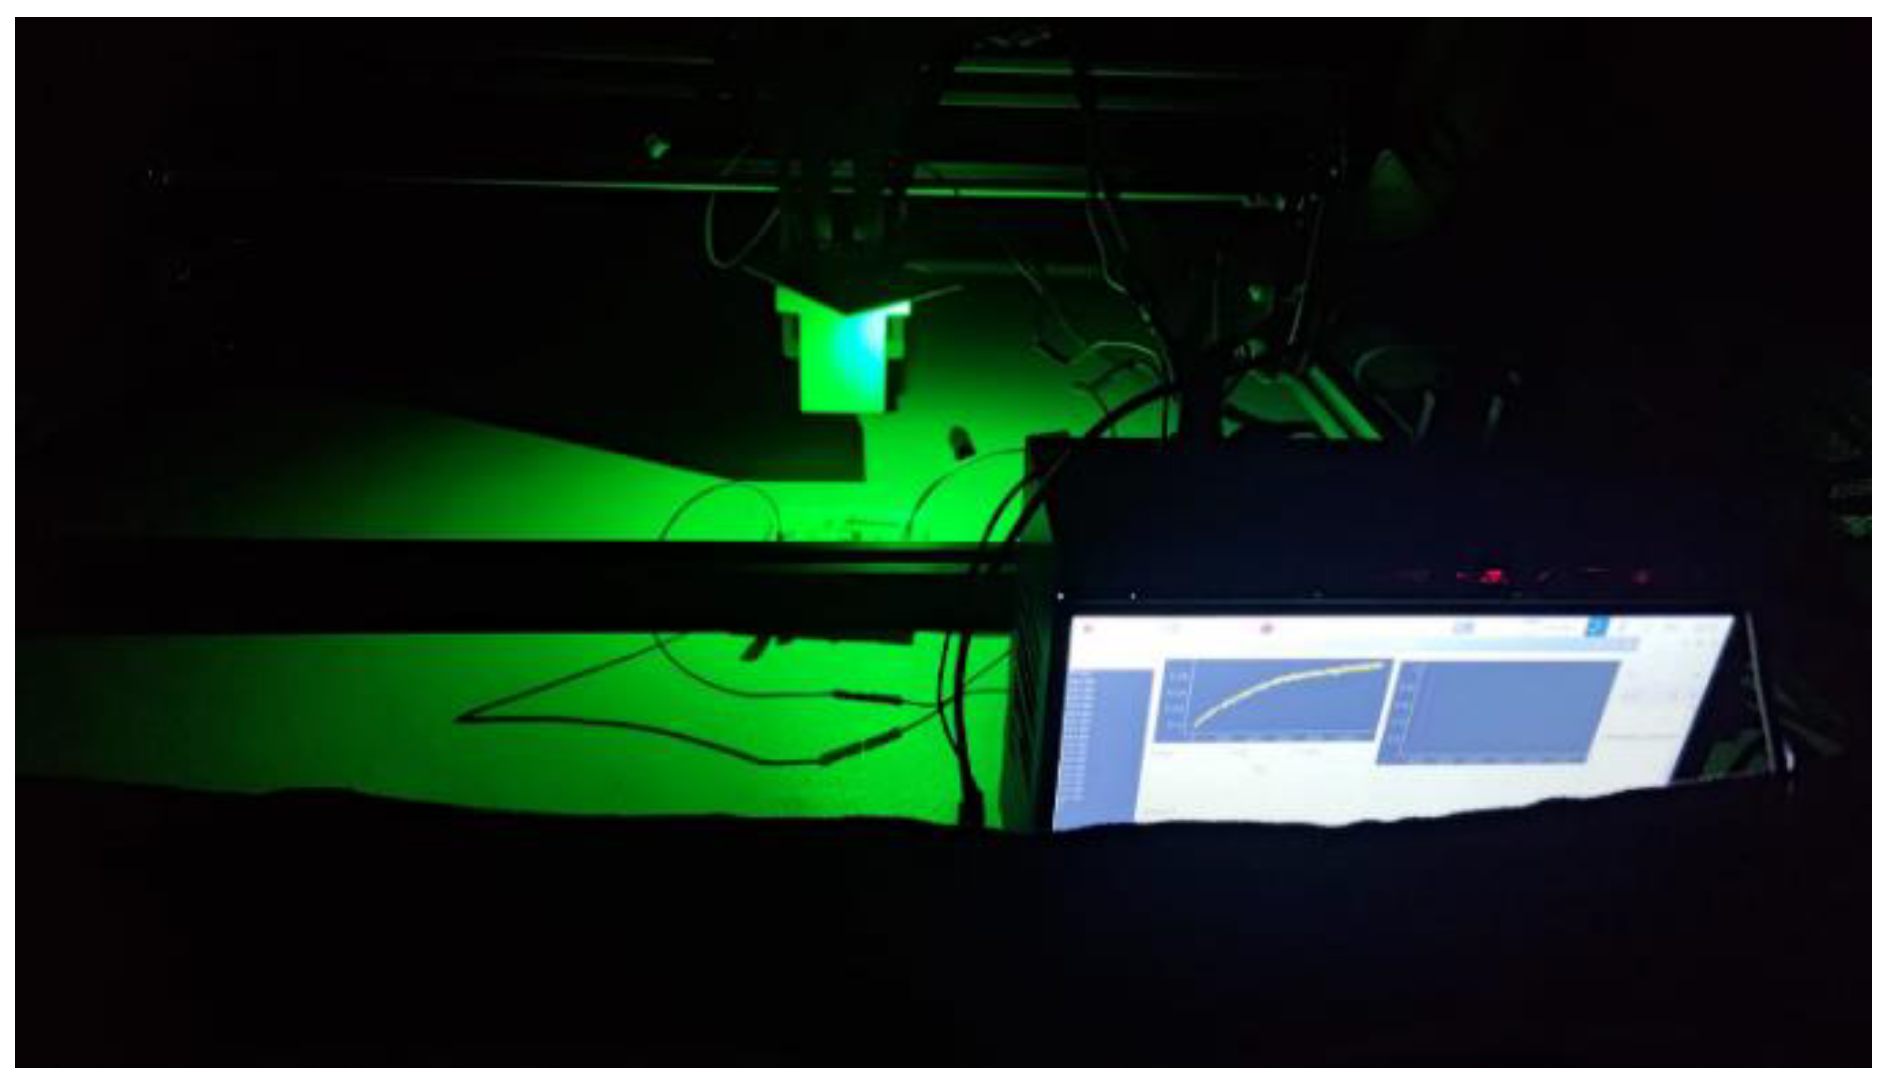
The meticulous approach to conducting controlled tests, as described, is commendable for its attention to detail in eliminating variables that could potentially skew the data. Utilizing a black fabric tarp to obstruct external light sources and scheduling the tests post-11:00 PM, the conditions are optimized to ensure that the only variable influencing the sensor readings is the green light beam itself.
The prototype underwent testing and calibration in the controlled setting using wavelengths in the green and blue spectra. The collimator tube assessed the sensor's detection capabilities at varying distances. This process generated a spectrum based on the light detected by the sensor. It is noteworthy that a dataset comprising 2000 samples was collected. Analysis of the prototype's graph revealed that the sensor's response plateaued at approximately 500 samples, after which it stabilized. This observation persisted, prompting the collection of an extensive dataset to ascertain any potential disturbances beyond this point. Additionally, measurements were conducted amidst noise to evaluate its impact on the signal, ensuring a comprehensive understanding of the sensor's behavior.
The high volume of data points collected per measurement can facilitate a detailed statistical analysis, enabling the identification of any anomalies or patterns within the data. With such a dataset, one could employ various analytical techniques, such as regression analysis, standard deviation calculations, and hypothesis testing, to draw meaningful conclusions about the green light's properties and effects.
Furthermore, the data collected from these tests could be invaluable in various applications, from improving the design of photosensitive devices to enhancing our understanding of light-matter interactions. The findings could also contribute to fields such as photobiology, optics, and materials science, where the behavior of light and its impact on different materials are fundamental areas of study.
Figure 20.
External structure with the prototype.
Figure 20.
External structure with the prototype.
Figure 21.
A black fabric tarp mounted in the external structure and accoupled with the device.
Figure 21.
A black fabric tarp mounted in the external structure and accoupled with the device.
Figure 22.
A black fabric tarp is mounted in the external structure and accoupled with the device’s 2nd view.
Figure 22.
A black fabric tarp is mounted in the external structure and accoupled with the device’s 2nd view.
Figure 23.
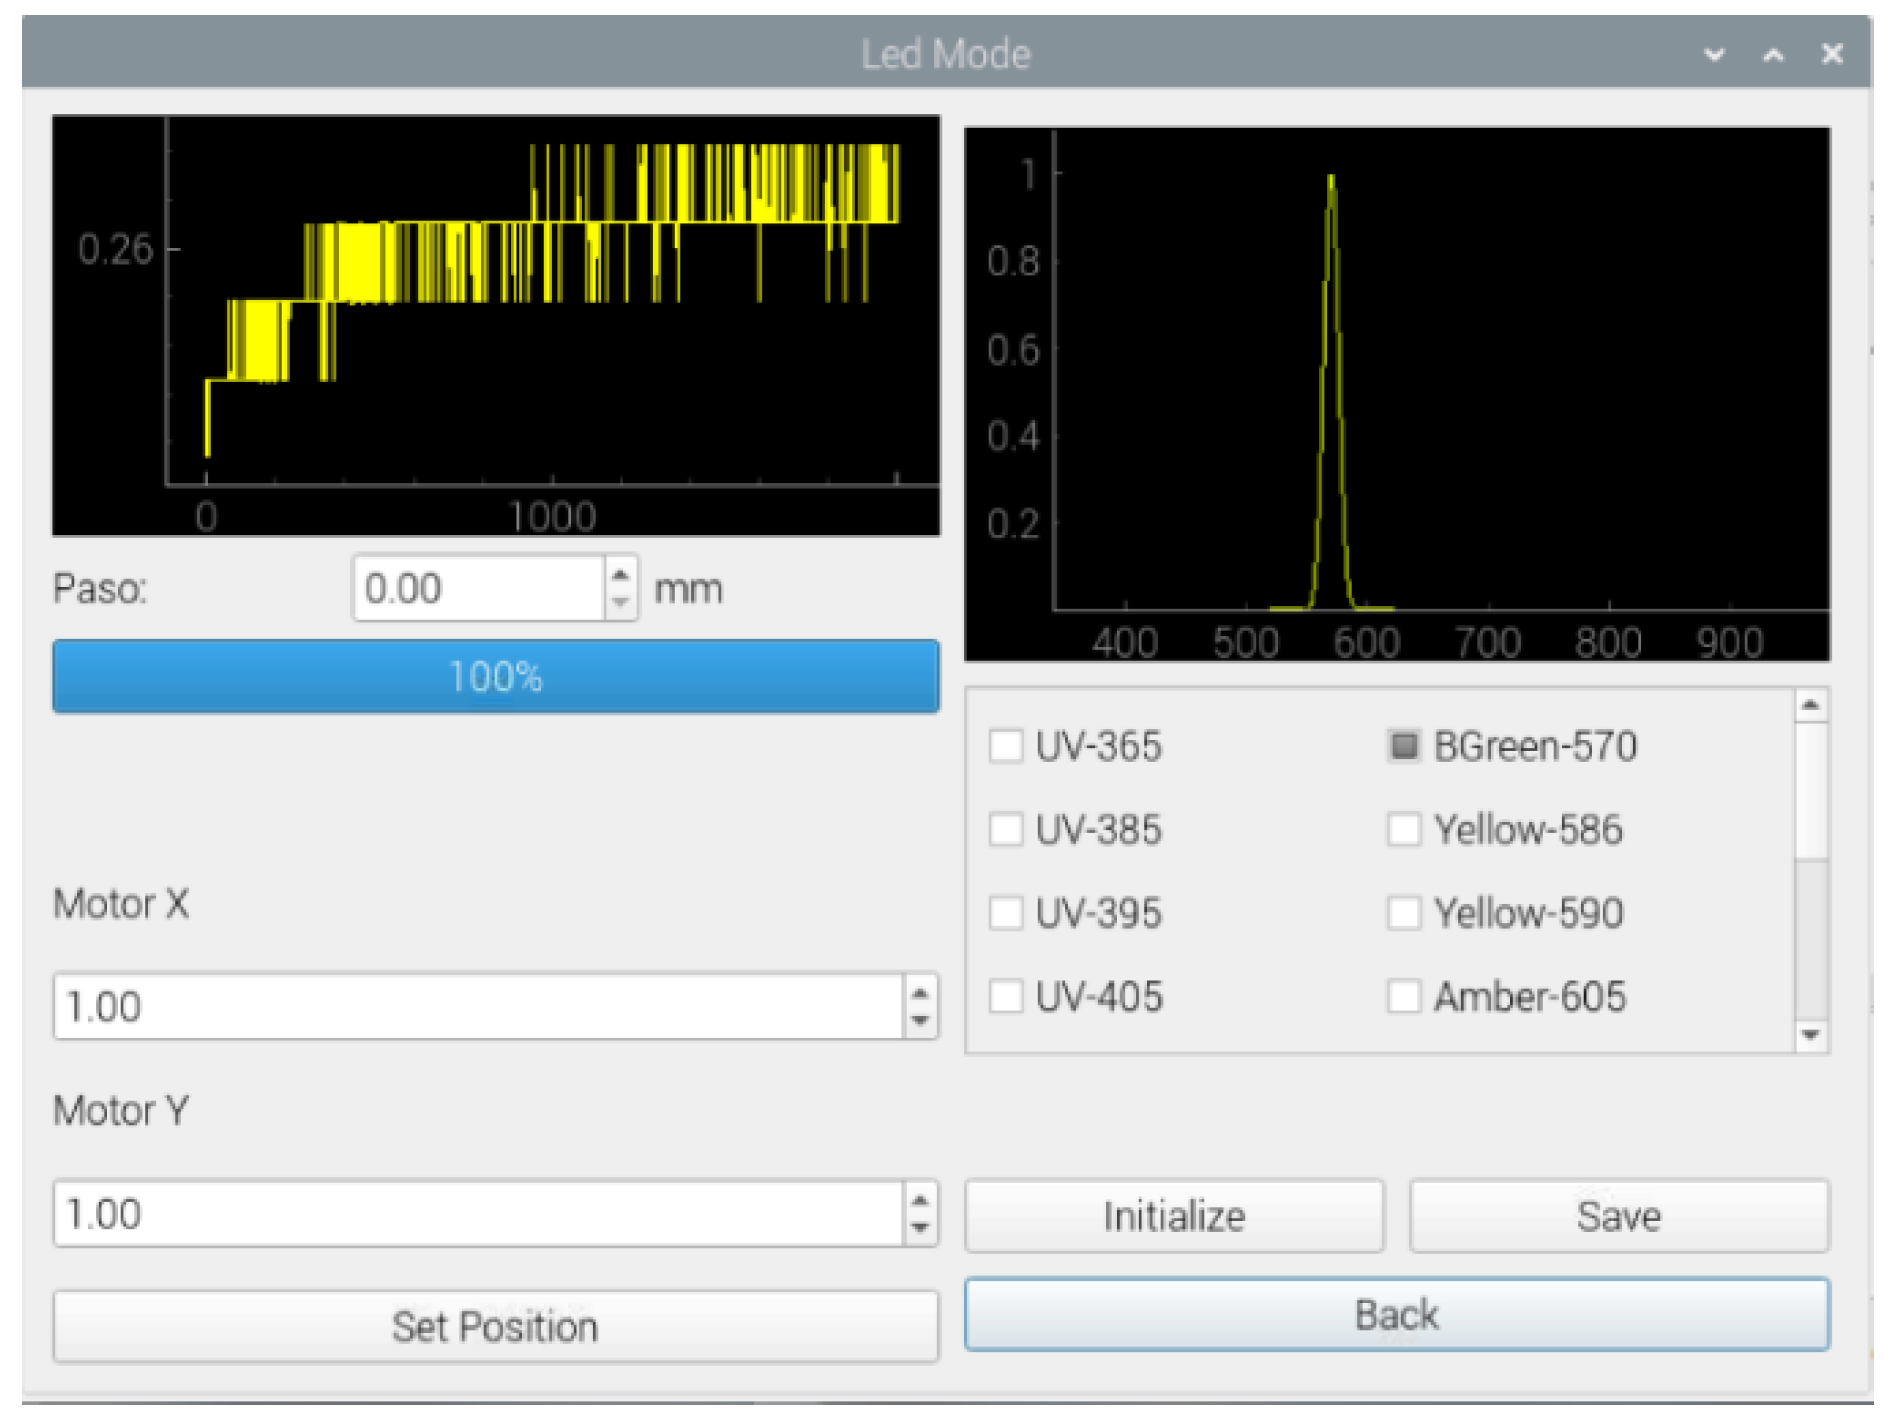
Graphic interface showing the reading values of the controlled experiment.
Figure 23.
Graphic interface showing the reading values of the controlled experiment.
Figure 24.
Graphic interface showing the reading values of the controlled experiment.
Figure 24.
Graphic interface showing the reading values of the controlled experiment.
Figure 25.
A view of the mounted experiment.
Figure 25.
A view of the mounted experiment.
Figure 26.
Doing testing with the green LED.
Figure 26.
Doing testing with the green LED.
Figure 27.
Basal state of the photodiode.
Figure 27.
Basal state of the photodiode.
3.3. Sensor Operation with Optics Mounted.
The final stage involves integrating optics with the sensor, a sophisticated process that examines the sensor's compatibility and performance when coupled with optical components. This stage is pivotal in determining the sensor's efficacy in applications with integral optical elements, such as imaging or light detection. The optics coupling can reveal insights into the sensor's potential limitations or enhancements when operating with other technological systems.
The experimental procedure described indicates a continuation of a systematic approach to sensor testing, consistent with the previous stage, to ensure the reliability and accuracy of results through repetition under controlled conditions. The choice of conducting tests at 11 PM suggests an attempt to minimize environmental light interference, which is particularly relevant when working with optical sensors sensitive to specific wavelengths, in this case, blue. The substantial number of samples, 2000 in total, provides a robust data set that enhances the statistical significance of the findings.
Focusing most of the light beam on the sensor, which increases signal amplitude, is an expected outcome as the sensor's exposure to the light source intensifies. However, the preservation of the signal's shape indicates the sensor's linearity and stability in response to varying light intensities. This characteristic is crucial for sensors deployed in precision applications where the fidelity of signal shape directly correlates to the measurement's accuracy.
Further analysis of the sensor's performance could involve examining the noise-to-signal ratio, determining the sensor's limit of detection, and assessing any potential saturation points that may arise at higher light intensities. Additionally, exploring the sensor's response time to changes in light intensity could yield insights into its suitability for dynamic measurement scenarios.
3.4. Analysis and Statistic
Curve analysis is a critical aspect of understanding the behavior of a dataset, particularly when it represents a relationship between continuously changing variables. Reproducibility in curve analysis is essential to ensure that the results are reliable and can be replicated under different conditions. Factors such as the distance over the sample can affect the reproducibility of curve analysis. For instance, variations in distance can lead to changes in the resolution of the data collected, which, in turn, can affect the analysis outcomes. Optics, such as lenses or mirrors, can also introduce variability due to differences in light paths or focal lengths, which must be accounted for in the analysis.
Operator variability is another factor that can impact reproducibility. Different operators may have varying levels of skill or may interpret the analysis protocol differently, leading to inconsistencies. To mitigate this, standard operating procedures and rigorous training are fundamental.
Statistical measures like the average and standard deviation provide insights into the central tendency and dispersion of the data, respectively. Chebyshev's theorem, which applies to a wide range of probability distributions, can be used to estimate the minimum proportion of observations within a certain number of standard deviations from the mean, providing a bound on the variability of the data.
Functional Data Analysis (FDA) is another statistical approach considering data in curves, surfaces, or other continuous variations. FDA is particularly useful when the data points are highly correlated, and it allows for the analysis of data that varies over a continuum, such as time or wavelength.
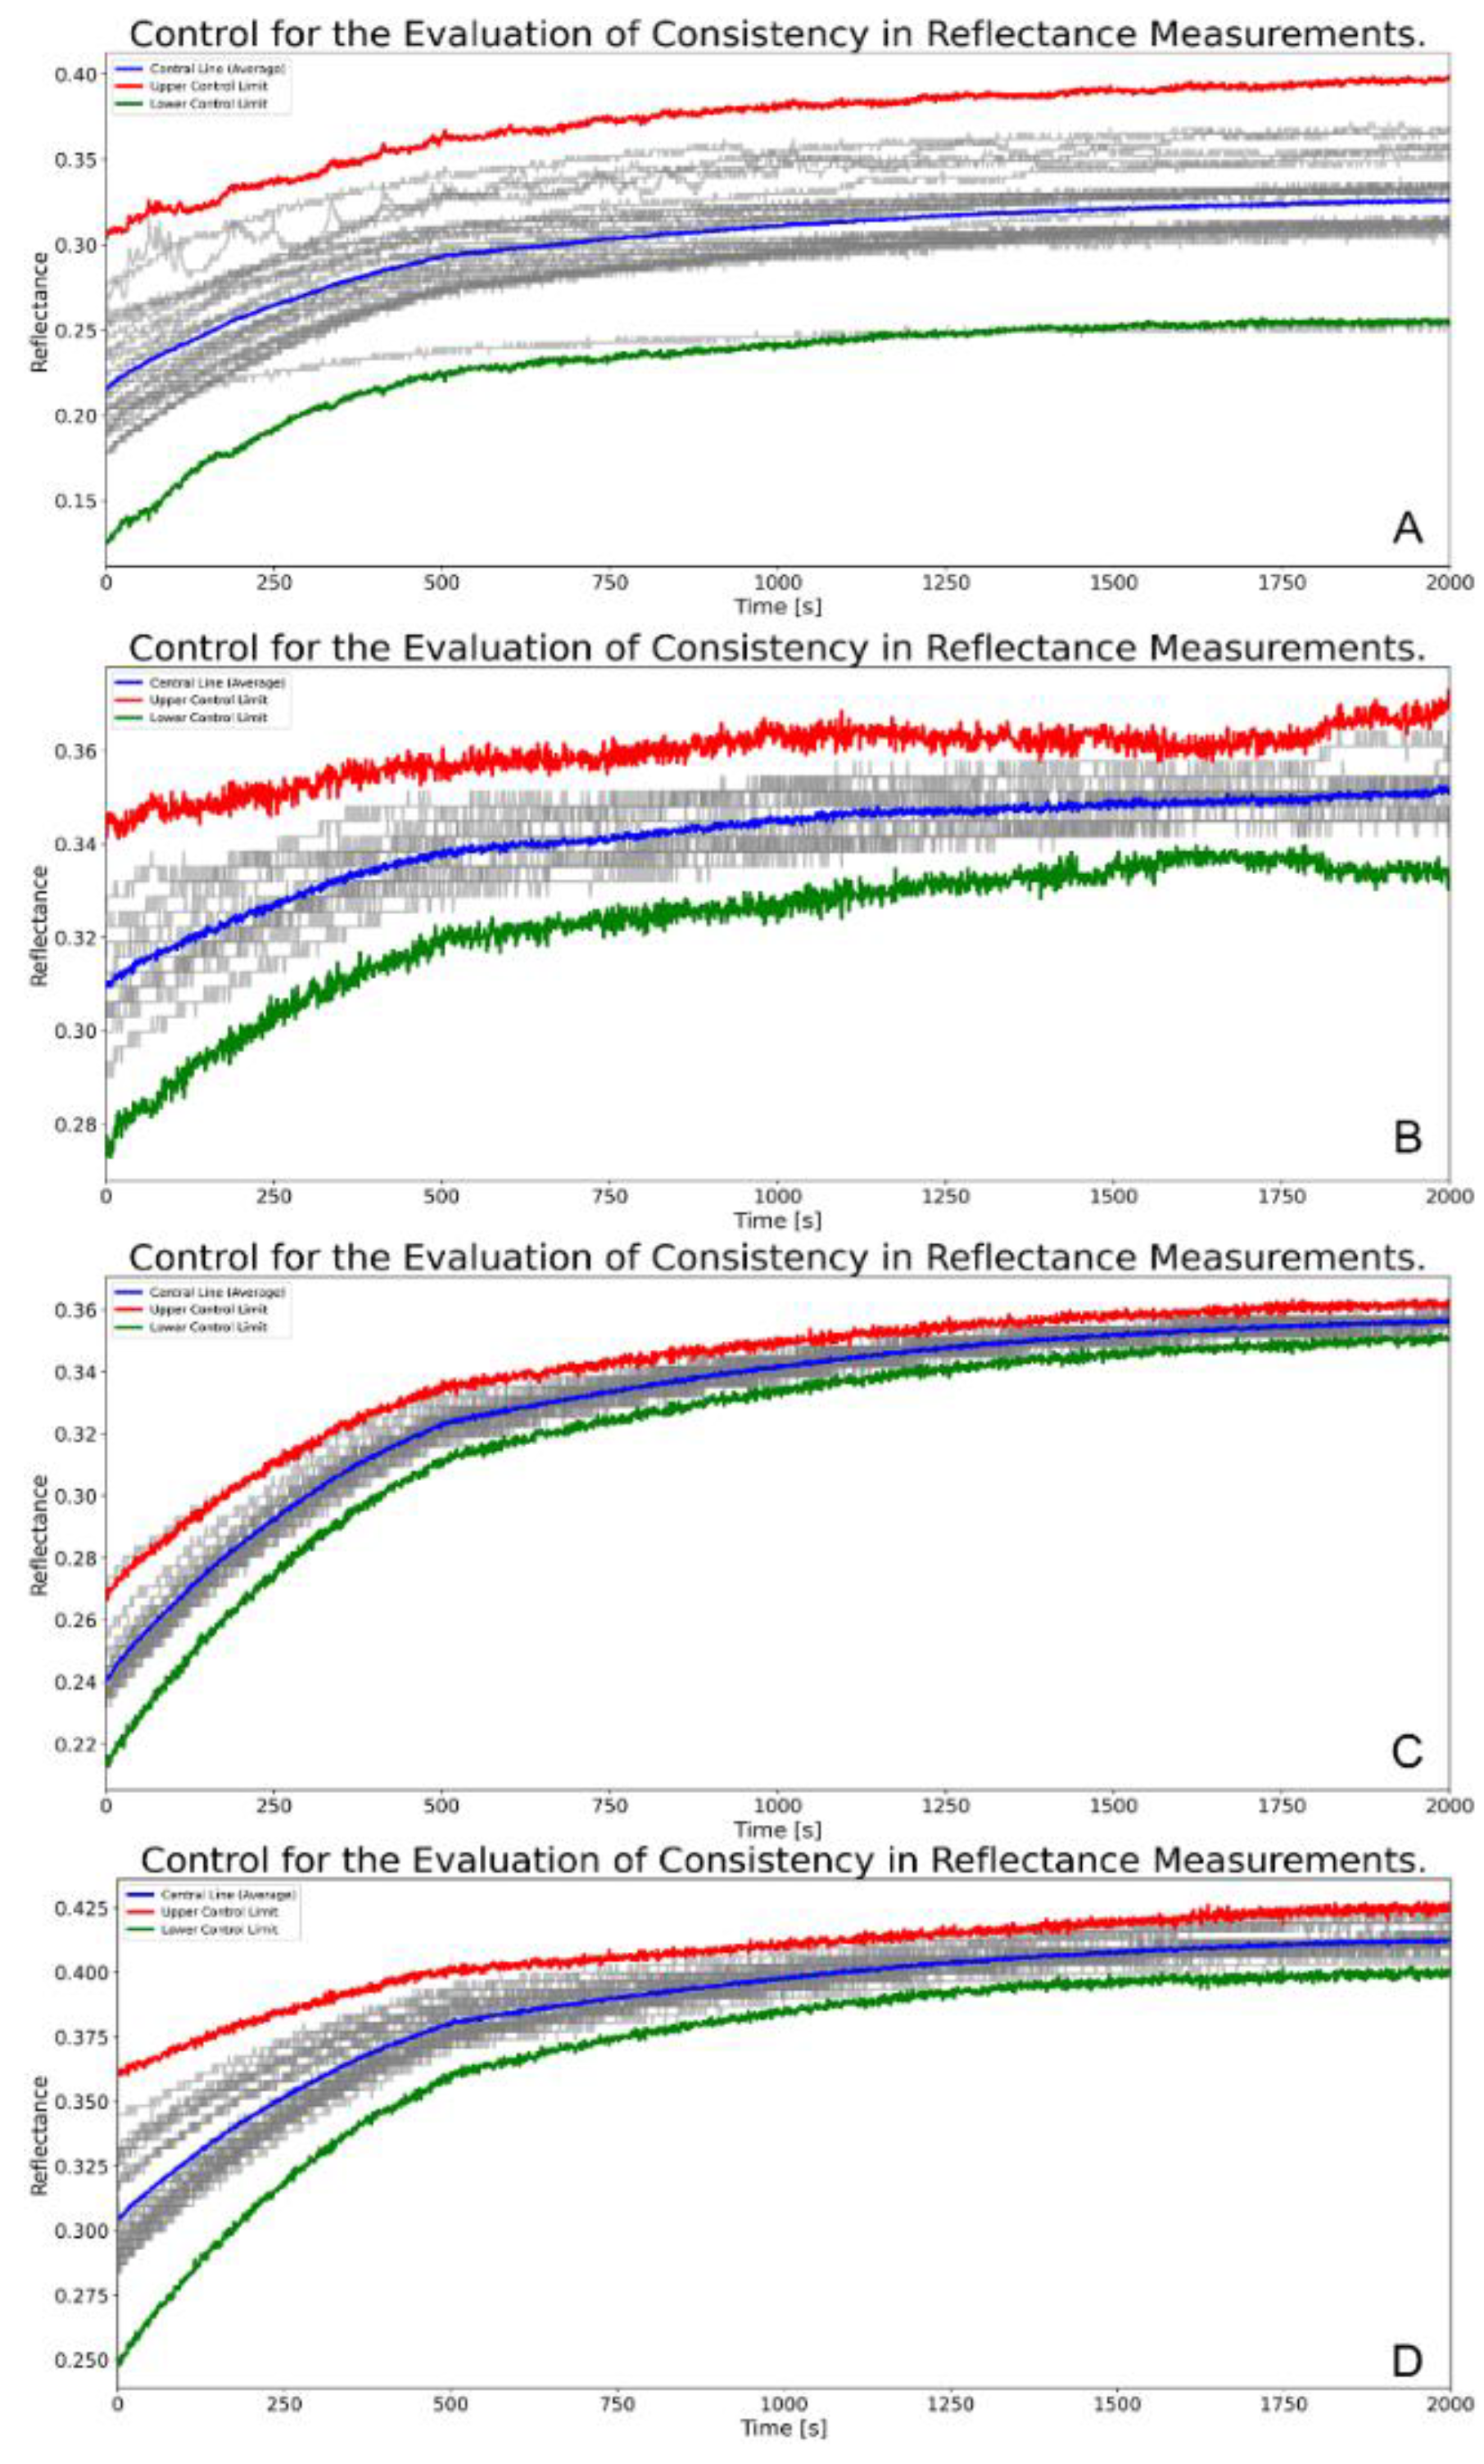
Figure 28.
Comparative Chebyshev’s Theorem Control Charts for Green and Blue Lasers with and without Optical Components. Each chart tracks reflectance over time (s), showcasing four distinct experimental setups indicated as A, B, C, and D. A: Green laser without optics. B: Green laser with optics. C: Blue laser without optics. D: Blue laser with optics. The central line (blue) denotes the average reflectance across measurements. At the same time, the upper (red) and lower (green) control limits represent the boundaries of three standard deviations from the mean, demonstrating the consistency and precision of reflectance measurements under different laser and optical conditions. The distribution of individual reflectance values (grey points) within the control limits indicates a controlled variability and highlights the effect of optical enhancements on measurement stability.
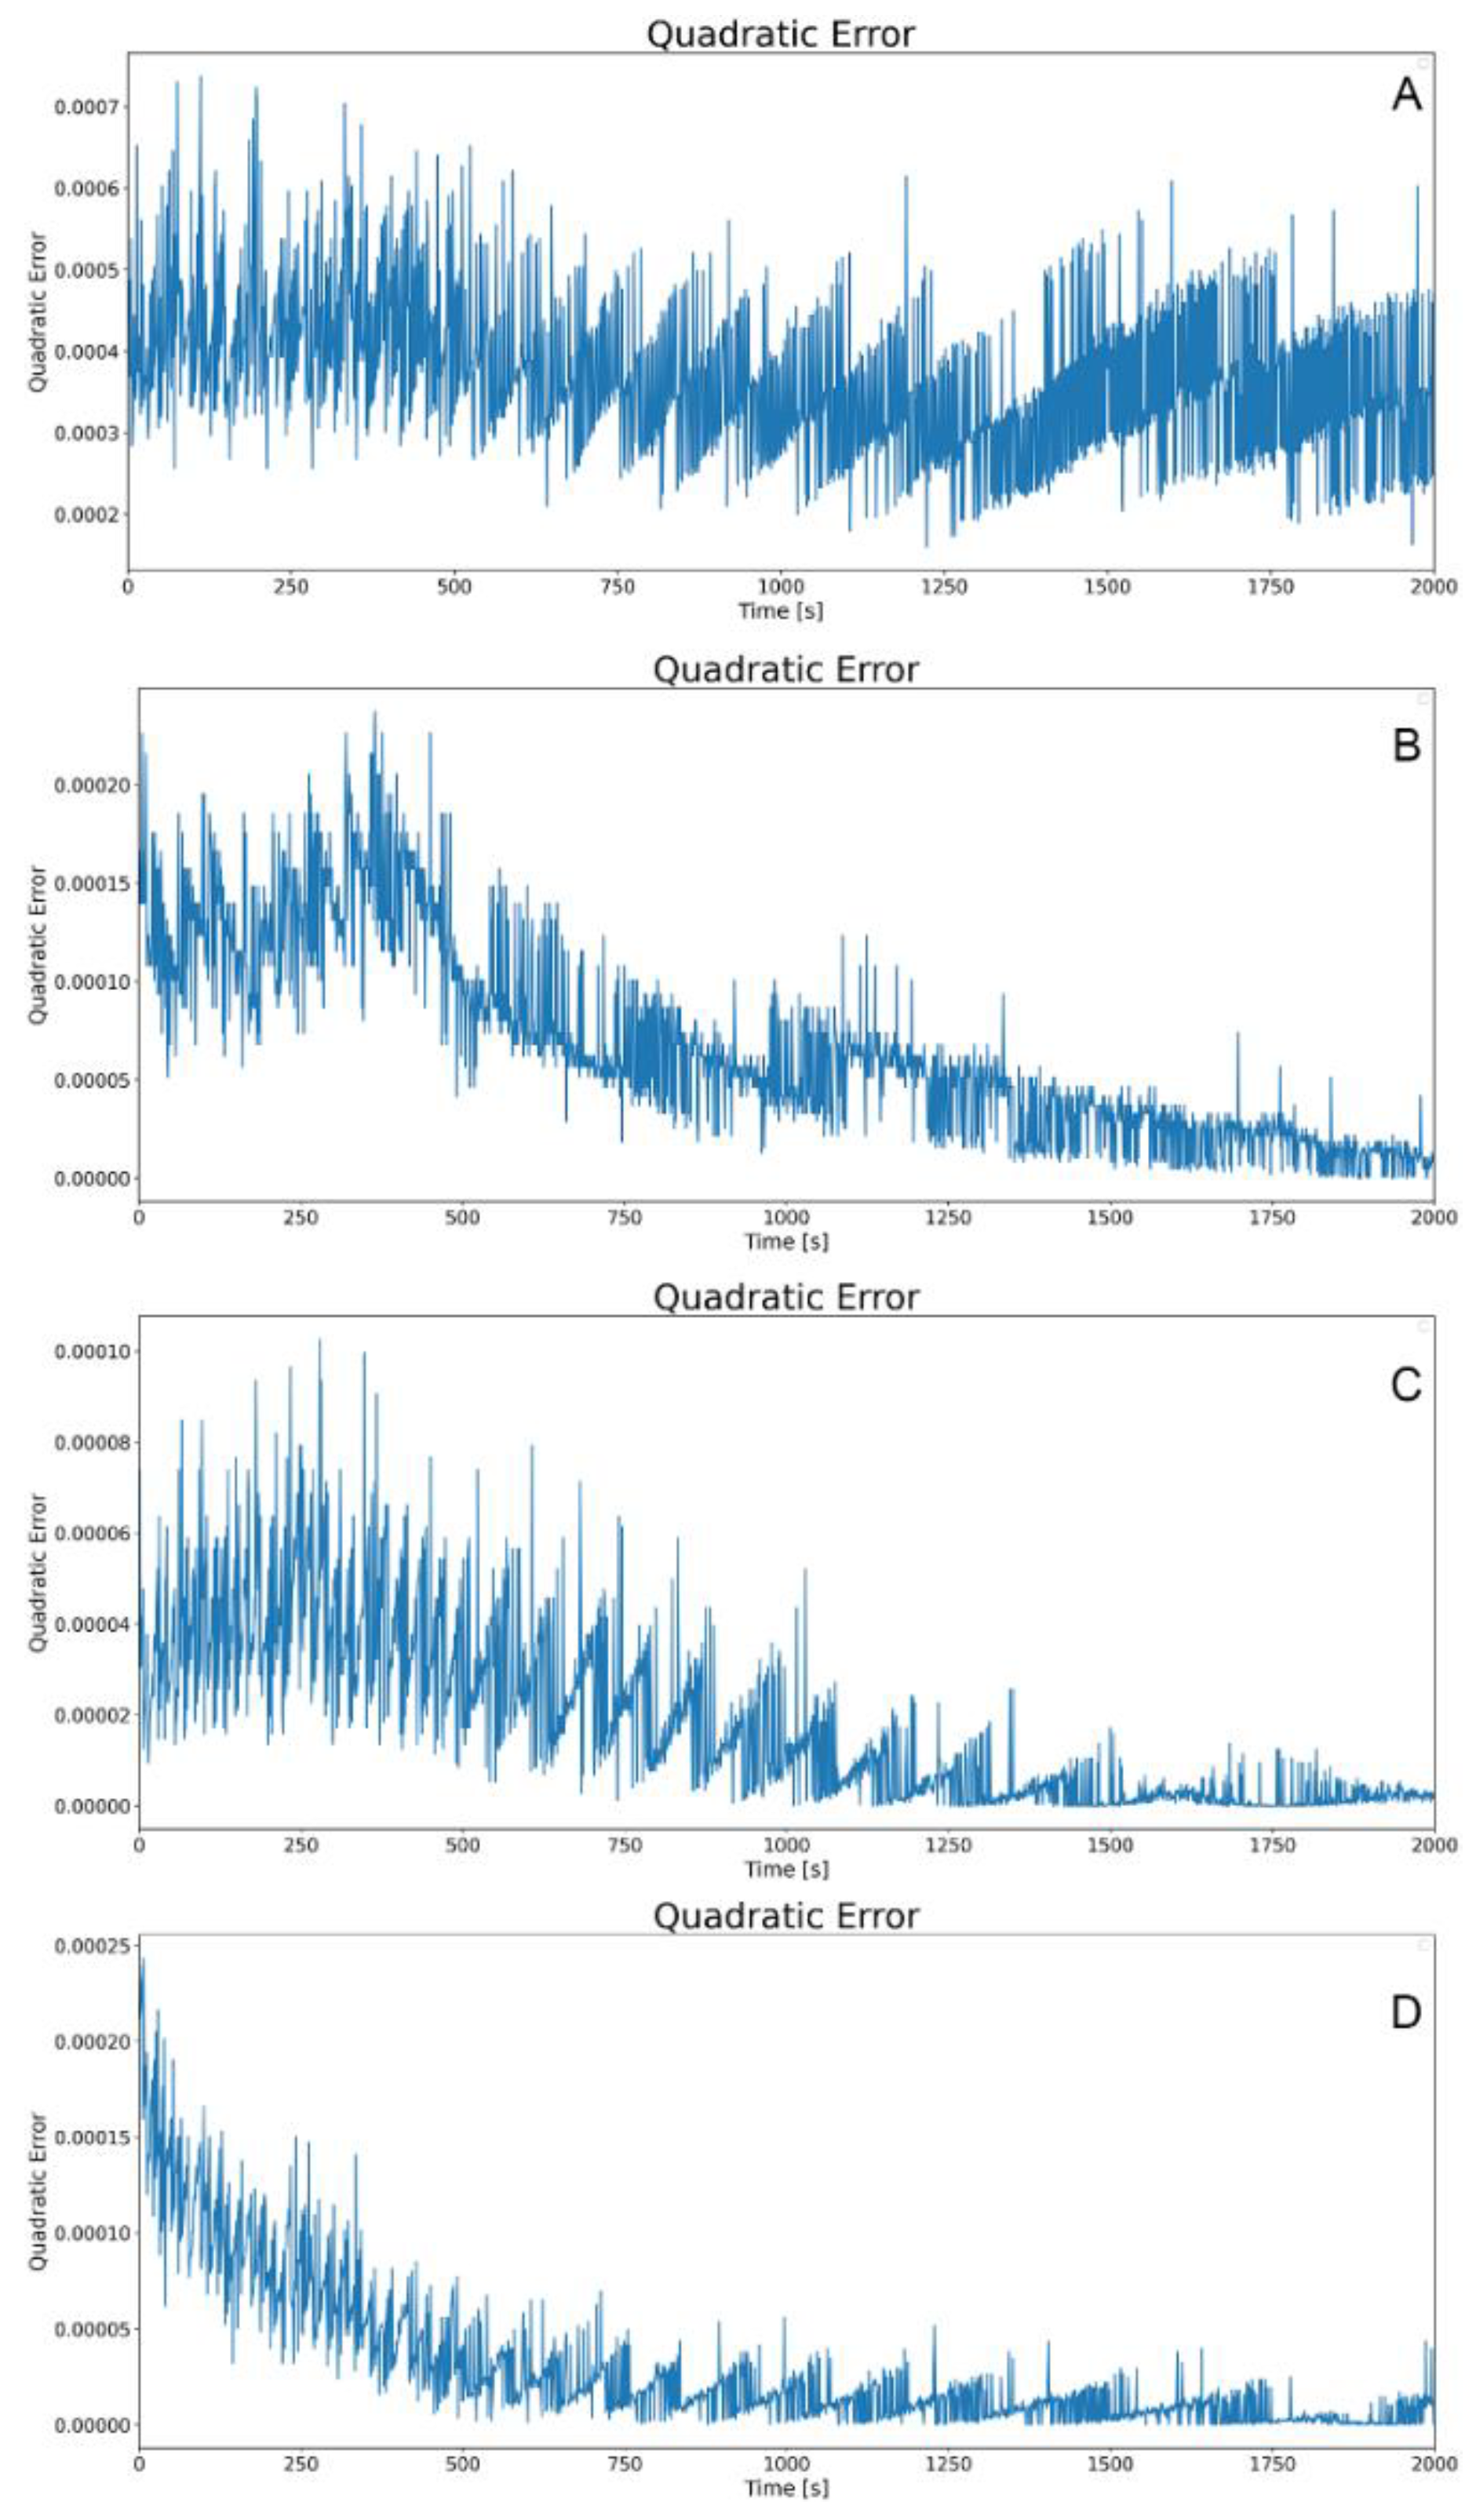
In the context of functional data analysis (FDA), error handling and variance estimation play crucial roles in interpreting functional data. The reflectance curves analyzed in this study are typical examples of functional data, where each curve represents a continuous function over time. These curves vary not only in their point values but also in their global structures, requiring a statistical approach that can capture these complexities.
Figure 29.
Comparative Analysis of Quadratic Error over Time for Laser-Induced Reflectance Measurements. The quadratic errors are displayed from top to bottom for A: Green laser without optics, B: Green laser with optics, C: Blue laser without optics, and D: Blue laser with optics. Each plot depicts the fluctuation of error values as a function of time (s), where sharp peaks represent higher variability in measurement precision. The gradual decline or steadiness of error over time for each setup illustrates the system's ability to adapt or maintain precision in detecting microplastics, with the influence of optical components observable in the reduced error variability.
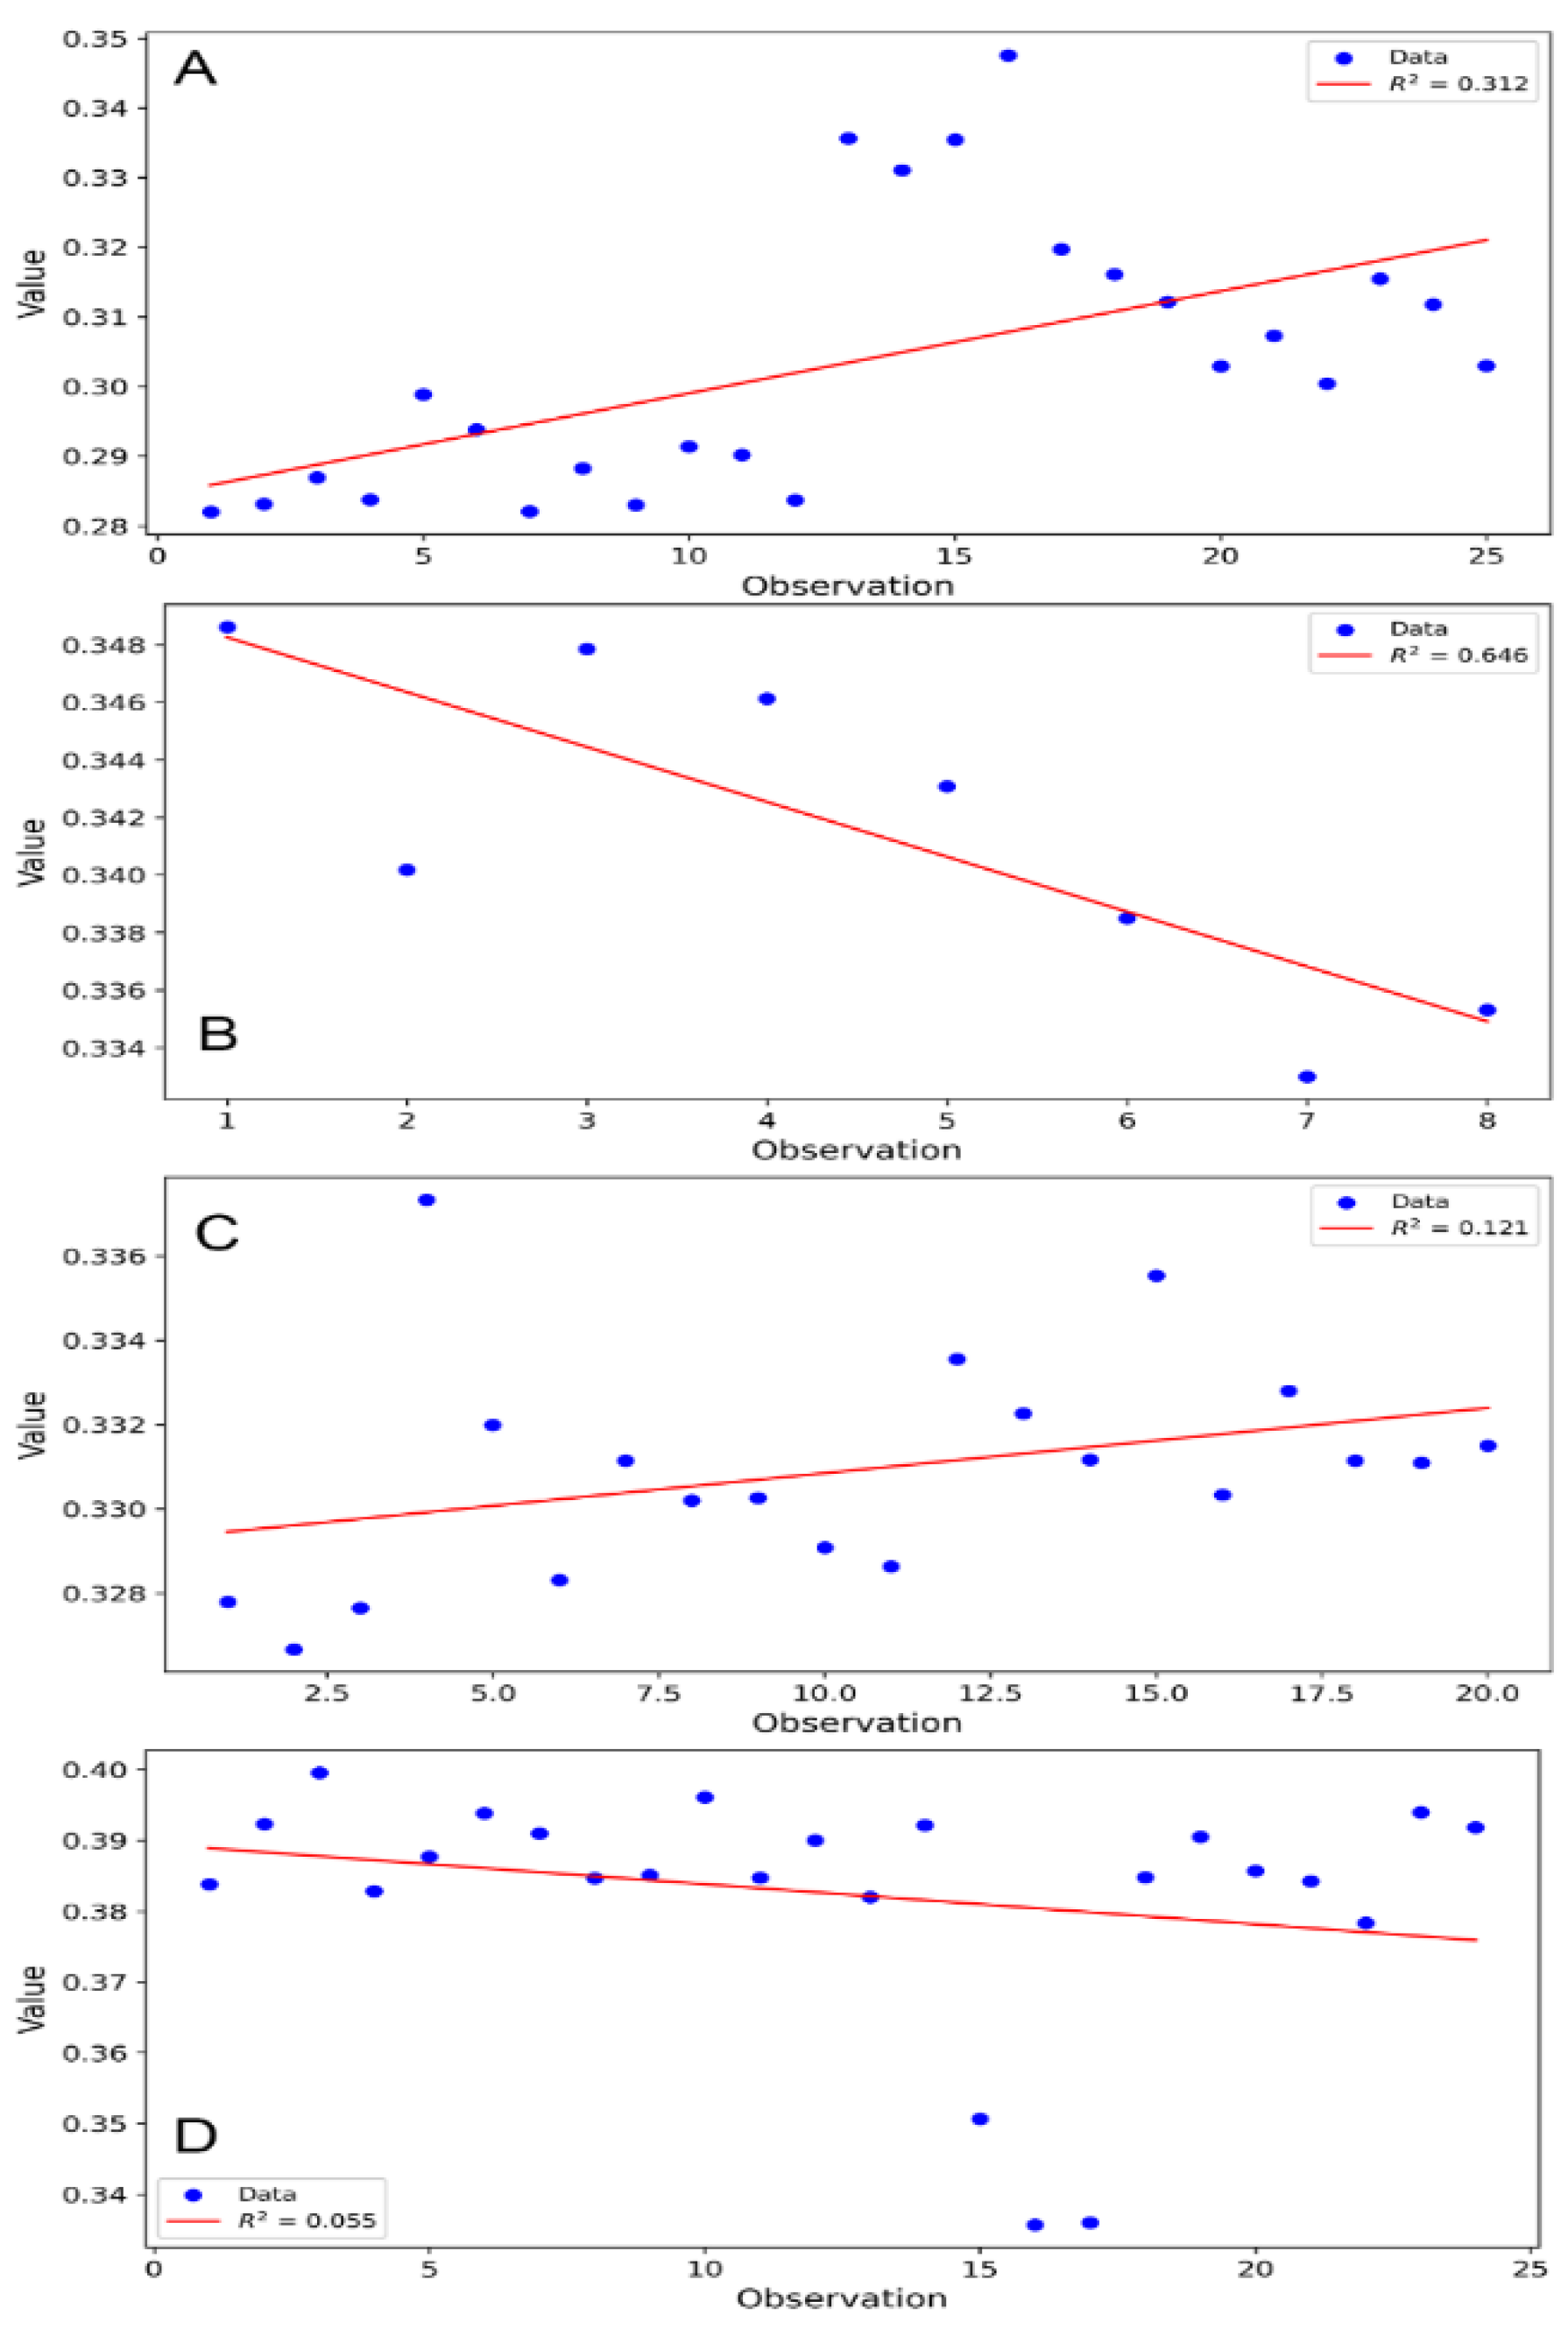
The variance in FDA describes how the functions (reflectance curves, in this case) are dispersed around the functional mean. In practical terms, variance is used to quantify the variability of the curves between different measurements or experimental conditions. In studying reflectance curves of different laser configurations, functional variance helps us understand how much the curves change in response to changes in laser configuration or the introduction of optical components.
Figure 30.
Scatter Plot Analysis of Mean Reflectance Values with Trend Lines for Different Laser Configurations. The plots, labeled from A to D, represent the mean reflectance values from multiple observations for each laser setup. A: Green laser without optics, B: Green laser with optics, C: Blue laser without optics, and D: Blue laser with optics. The trend lines (red) are accompanied by their respective R² values, indicating the degree of variance the linear model explains. A lower R² value suggests that the mean reflectance values for each setup are closely clustered, indicating little to no significant change over the observations, while a higher R² indicates more variability. These trends are remarkable for assessing the consistency of laser reflectance measurements in detecting microplastics.
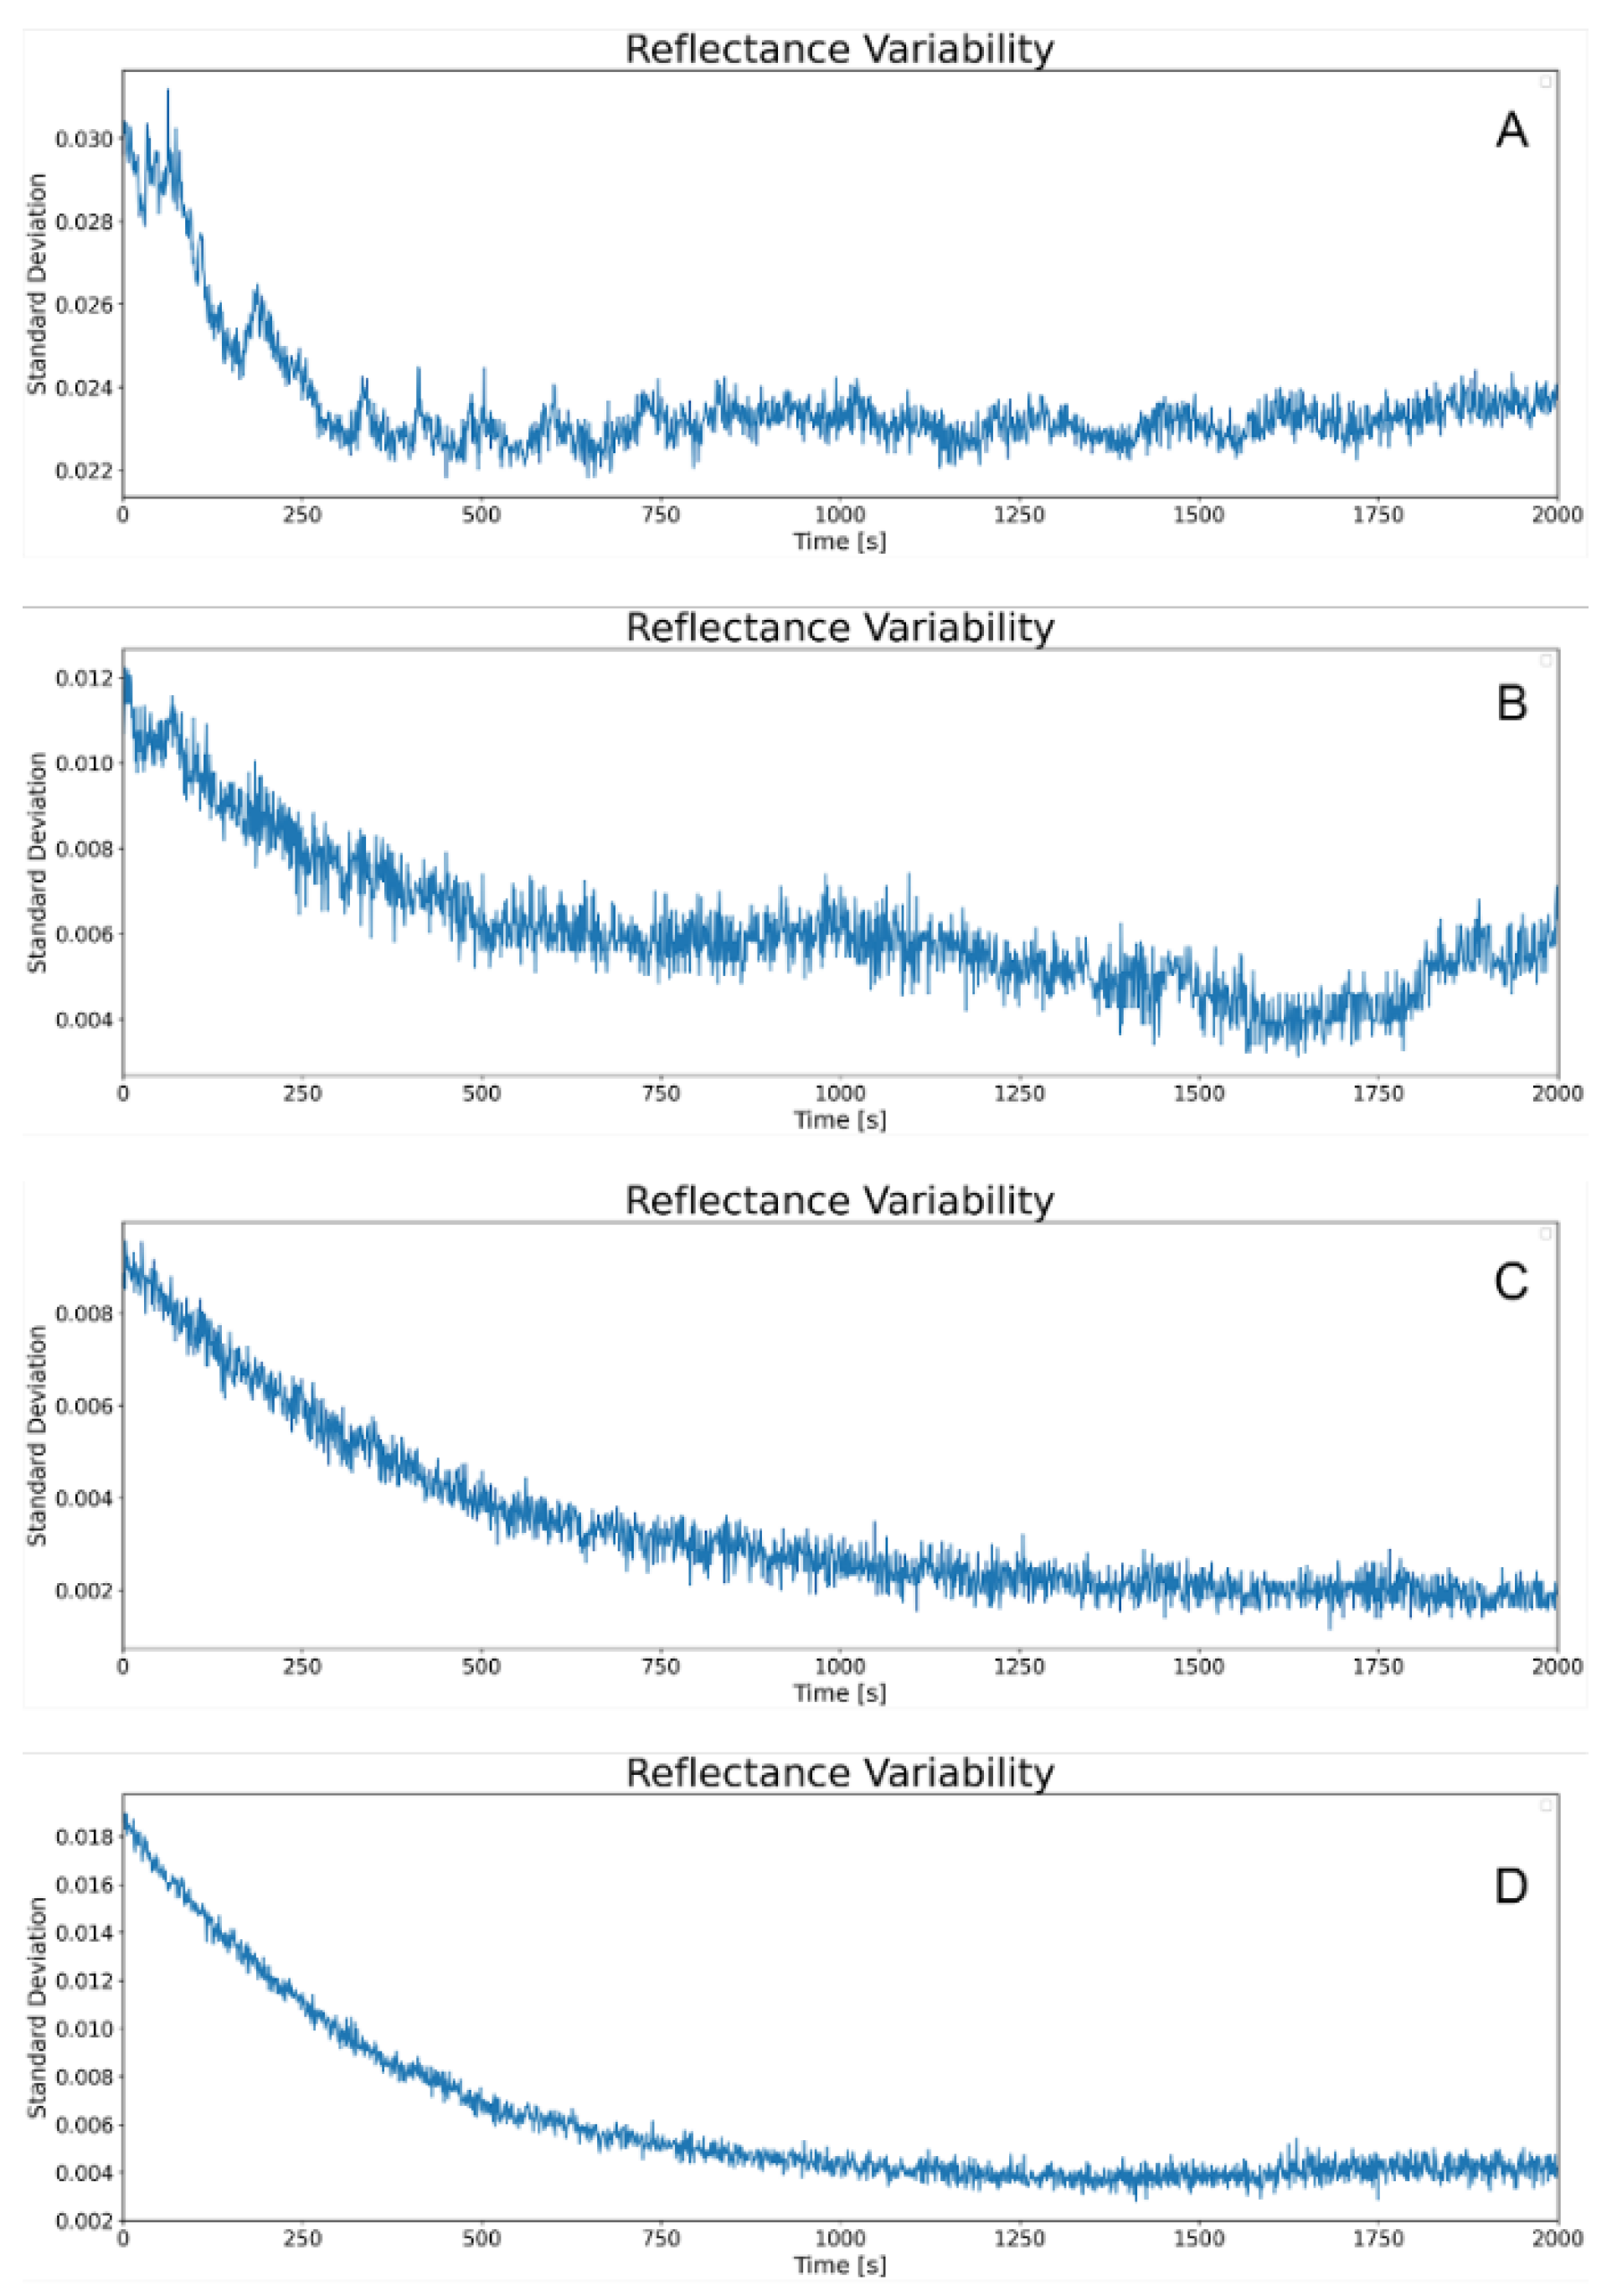
Common methods to analyze this variance include mean function plots and confidence bands representing functional confidence intervals. These methods clearly visualize where and how curves deviate significantly from the mean, offering insights into the stability and consistency of the studied laser configurations.
Figure 31.
Variance in Reflectance Measurements Over Time for Different Laser Setups. This composite graph illustrates the standard deviation as a proxy for variance in the reflectance data across four experimental conditions over time (s). A: Green laser without optics demonstrates initial high variance, stabilizing over time. B: Green laser with optics shows reduced variance, indicating increased measurement precision with optical assistance. C: Blue laser without optics depicts a similar trend to A, with a notable decrease in variance over time. D: Blue laser with optics presents the lowest initial variance, which further decreases, showcasing the impact of optics on measurement consistency. These trends are essential for evaluating the precision and reliability of microplastic detection methods using laser technology.
Understanding error and variance in FDA is key for validating the accuracy of reflectance measurements and optimizing device configurations used in optical experiments. By identifying configurations that minimize variance and error, researchers can improve their experiments' reproducibility and increase their conclusions' reliability.
Implementing FDA techniques for reflectance curve analysis in this study allows for a robust evaluation of the effects of different laser configurations, ensuring that decisions based on these analyses are well-founded and statistically valid.
3.5. Functional Variance Analysis of Reflectance Measurements with Different Laser Configurations
A Functional Analysis of Variance (FANOVA) was implemented using a linear mixed model to investigate the influence of different laser configurations on reflectance measurements. The data consisted of average reflectance measurements for blue and green lasers, both with and without optics, obtained over regular time intervals. The data structure facilitated direct comparison between the configurations under study by grouping the measurements by time instants to capture the inherent time dependence of the functional data.
Our study takes a novel approach by investigating the influence of different laser configurations on reflectance measurements. We employ a Functional Analysis of Variance (FANOVA) and a linear mixed model to analyze the data, which includes average reflectance measurements for blue and green lasers, both with and without optics, obtained over regular time intervals. This unique method allows for a direct comparison between the configurations under study and captures the inherent time dependence of the functional data.
We fitted a linear mixed model with reflectance as the dependent variable and laser configuration as the independent variable. The model included fixed terms for each configuration and a random term to capture intra-group variations associated with repeated measurements at each time point, thereby addressing correlation within time groups.
The model revealed statistically significant differences in reflectance measurements between laser configurations. The model intercept represents the mean reflectance for the reference configuration, which is the green laser with optics. The estimated coefficients for the other configurations indicate significant variations from this reference configuration compared to the green laser with optics:
Green laser without optics: 0.028 unit increase in reflectance (z=102.427, p<0.001).
Blue laser with optics: 0.047 unit increase in reflectance (z=171.488, p<0.001).
Blue laser without optics: Decrease of 0.010 unit in reflectance (z=-36.813, p<0.001).
These coefficients suggest that the use of optics and the type of laser have a systematic and differential effect on the measured reflectance, which is notable for the practical applications of these devices in controlled and experimental environments.
Group variance was estimated at 0.001, indicating significant homogeneity in measurements over time within each configuration. However, the caveat of convergence suggests caution when interpreting this parameter.
The results underscore the practical implications of our research, indicating that both laser color and the presence of optics are significant determinants of reflectance differences. These findings emphasize the importance of selecting optical device configurations based on the specific needs of the experiment or practical application. The statistical significance of the observed effects reinforces the robustness of our conclusions and suggests that subtle changes in device configuration can induce significant variations in data output.
The analysis further solidifies the robustness of our methodology, highlighting the need to consider temporal structure and intragroup correlation when analyzing functional data. These aspects are critically addressed through the use of linear mixed models. These models provide a flexible and robust framework for assessing the influence of categorical variables on functionally measured data, allowing precise adjustments for dependence and intragroup variability.
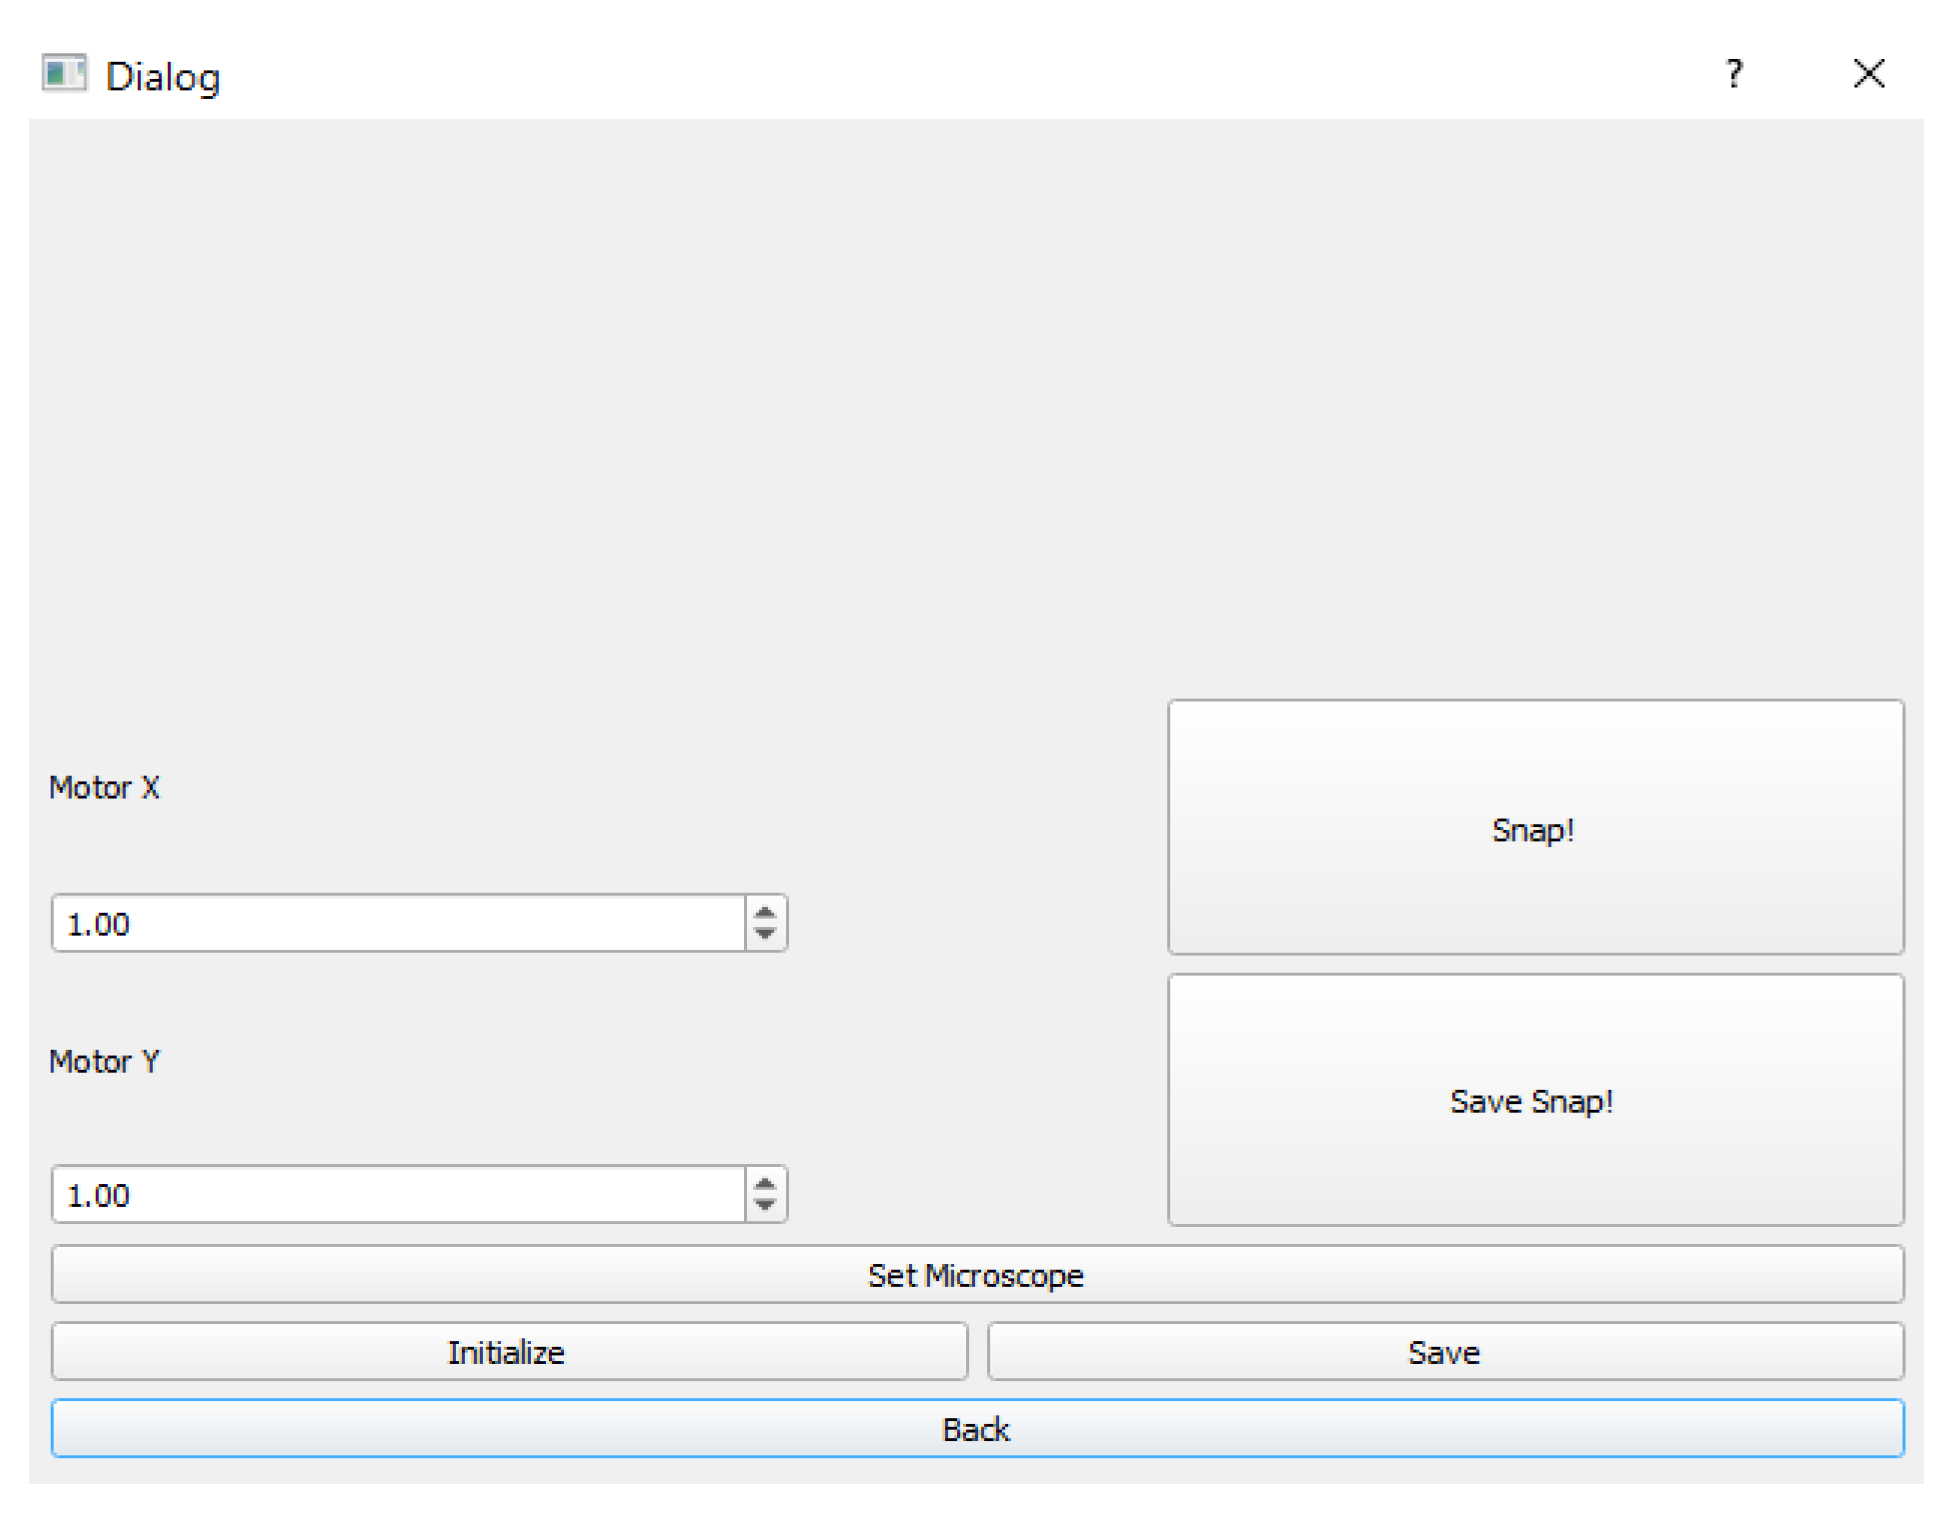
The experimental part with the microscope is already working, letting us take pictures of various materials, such as microplastics. However, this function is still in the beta phase, but it already allows us to process the images.
For the specific case of material detection, the calibration of the samples on which we are working still needs to be included. To calibrate the sensor with the type of sample to be detected, once the samples are detected, use the function of the microscope to observe that it is indeed the material to be detected. This will allow us to send the sample to be analyzed and obtain certainty that it is indeed the material we are looking for.
With this sensor, it is expected that the analysis of samples will be significantly improved since it allows the researcher to analyze many samples in a short time without depending on an external laboratory since one of the problems of having bulk tests is the work. It is an exhausting task for the researcher to review these, one by one, under a microscope, and then send them to a laboratory to be certain of the material where, in many cases, the results take weeks or months. These may or may not be satisfactory for the researcher. If they are not, it is to take and send samples again. Therefore, the sensor avoids that task where it tells the researcher if there was detection and in what coordinates. Then, it changes to microscope mode and goes through the coordinates to verify that the target material was, indeed, found. Another advantage that is being worked on is using the prototype remotely.
3.6. Operation and Data Acquisition
Here is how our prototype sensor operates:
The four-bar structure initiates a systematic sweep across the microplastic-containing filter.
As the structure moves, the photodiode captures the reflected light from microplastics.
The photodiode’s analog signal is routed through the ADC circuit, where it is digitized.
The Raspberry Pi processes digital data, identifying peaks corresponding to different wavelengths.
By selectively activating the multiplexer, we scan the sample at specific wavelengths.
The concentration of microplastics is determined based on the intensity of the detected signals.
Figure 1.
The spectrum of the blue wavelength at 456 nm illustrated the peak intensity and bandwidth.
Figure 1.
The spectrum of the blue wavelength at 456 nm illustrated the peak intensity and bandwidth.
Figure 2.
4-bar linkage system with bidirectional movement along the X and Y axes, akin to CNC machinery. Two stepper motors precisely control the system, enabling accurate positioning and maneuvering for complex tasks. The stepper motors operate on a micro-stepping mode to ensure smooth and fine motion control, which is critical for high-precision applications.
Figure 3.
Wiring diagram illustrating the connections between a Raspberry Pi, A4988 stepper motor driver, and a stepper motor. This schematic, created using Fritzing, provides a detailed representation of the circuitry required to control the stepper motor via the Raspberry Pi interface.
Figure 3.
Wiring diagram illustrating the connections between a Raspberry Pi, A4988 stepper motor driver, and a stepper motor. This schematic, created using Fritzing, provides a detailed representation of the circuitry required to control the stepper motor via the Raspberry Pi interface.
Figure 4.
Flowchart of the operation of the program implemented on the RaspberryPi.
Figure 4.
Flowchart of the operation of the program implemented on the RaspberryPi.
Figure 5.
a) Eagle board PCB schematic. b) Eagle schematic, wire diagram, and connections.
Figure 5.
a) Eagle board PCB schematic. b) Eagle schematic, wire diagram, and connections.
Figure 6.
Focal lens for LED light Collimation.
Figure 6.
Focal lens for LED light Collimation.
Figure 7.
Calibration setup for light beam and focal lens. This figure illustrates the platform configuration used to calibrate the light beam's intensity and the focal lens' precision.
Figure 7.
Calibration setup for light beam and focal lens. This figure illustrates the platform configuration used to calibrate the light beam's intensity and the focal lens' precision.
Figure 8.
Find the focal point of the lens.
Figure 8.
Find the focal point of the lens.
Figure 9.
Spectral Sensitivity and Range of BPW34 Photodiode. This graph illustrates the BPW34's sensitivity to visible and near-infrared radiation, with a spectral bandwidth ranging from 430 to 1100 nm. The photodiode's peak sensitivity occurs at 900 nm, ensuring high photo and radiant sensitivity within this spectrum.
Figure 10.
Schematic of the circuit implemented for the amplification of the bpw34 photodiode, based on the article circuit ([
21]).
Figure 10.
Schematic of the circuit implemented for the amplification of the bpw34 photodiode, based on the article circuit ([
21]).
Figure 11.
Amplifier circuit, with a low-pass filter and analog converter.
Figure 11.
Amplifier circuit, with a low-pass filter and analog converter.
Figure 12.
Circuit implemented for amplifying the bpw34 photodiode and the low pass filter, based on the article circuit ([
21]).
Figure 12.
Circuit implemented for amplifying the bpw34 photodiode and the low pass filter, based on the article circuit ([
21]).
Figure 13.
Microplastic GUI. This menu permits two modes: microscopy and LED scanning. Microscopy is a Beta prototype that allows using a microscope, and LED scanning uses LEDs.
Figure 13.
Microplastic GUI. This menu permits two modes: microscopy and LED scanning. Microscopy is a Beta prototype that allows using a microscope, and LED scanning uses LEDs.
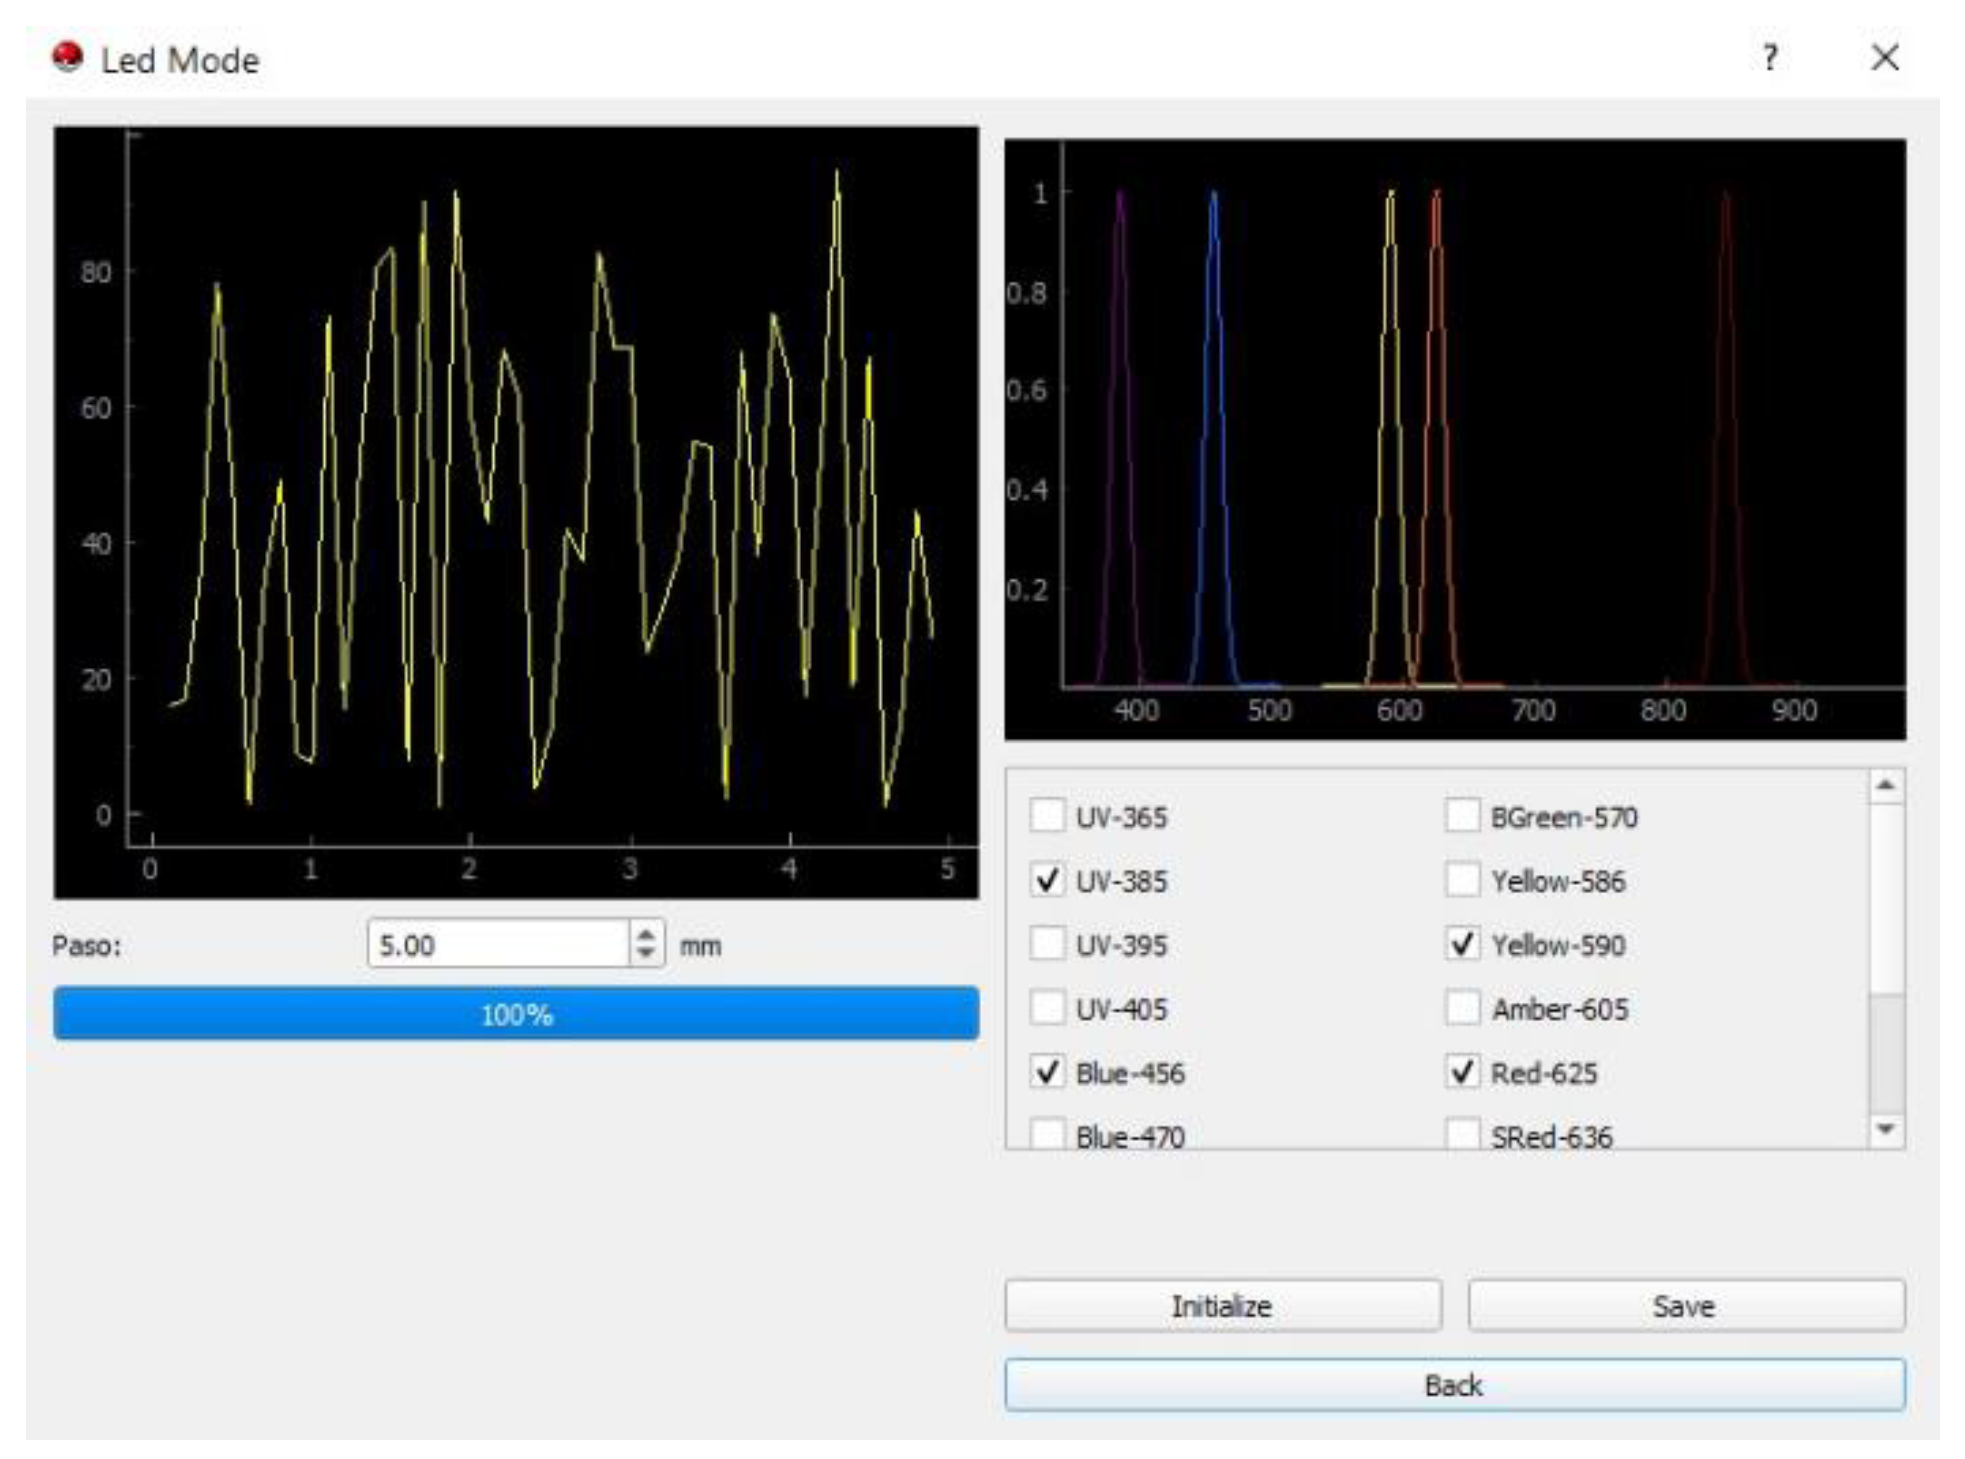
Figure 14.
Beta Window shows the wavelength selection and a preview of the detection carried out by the photodiode.
Figure 14.
Beta Window shows the wavelength selection and a preview of the detection carried out by the photodiode.
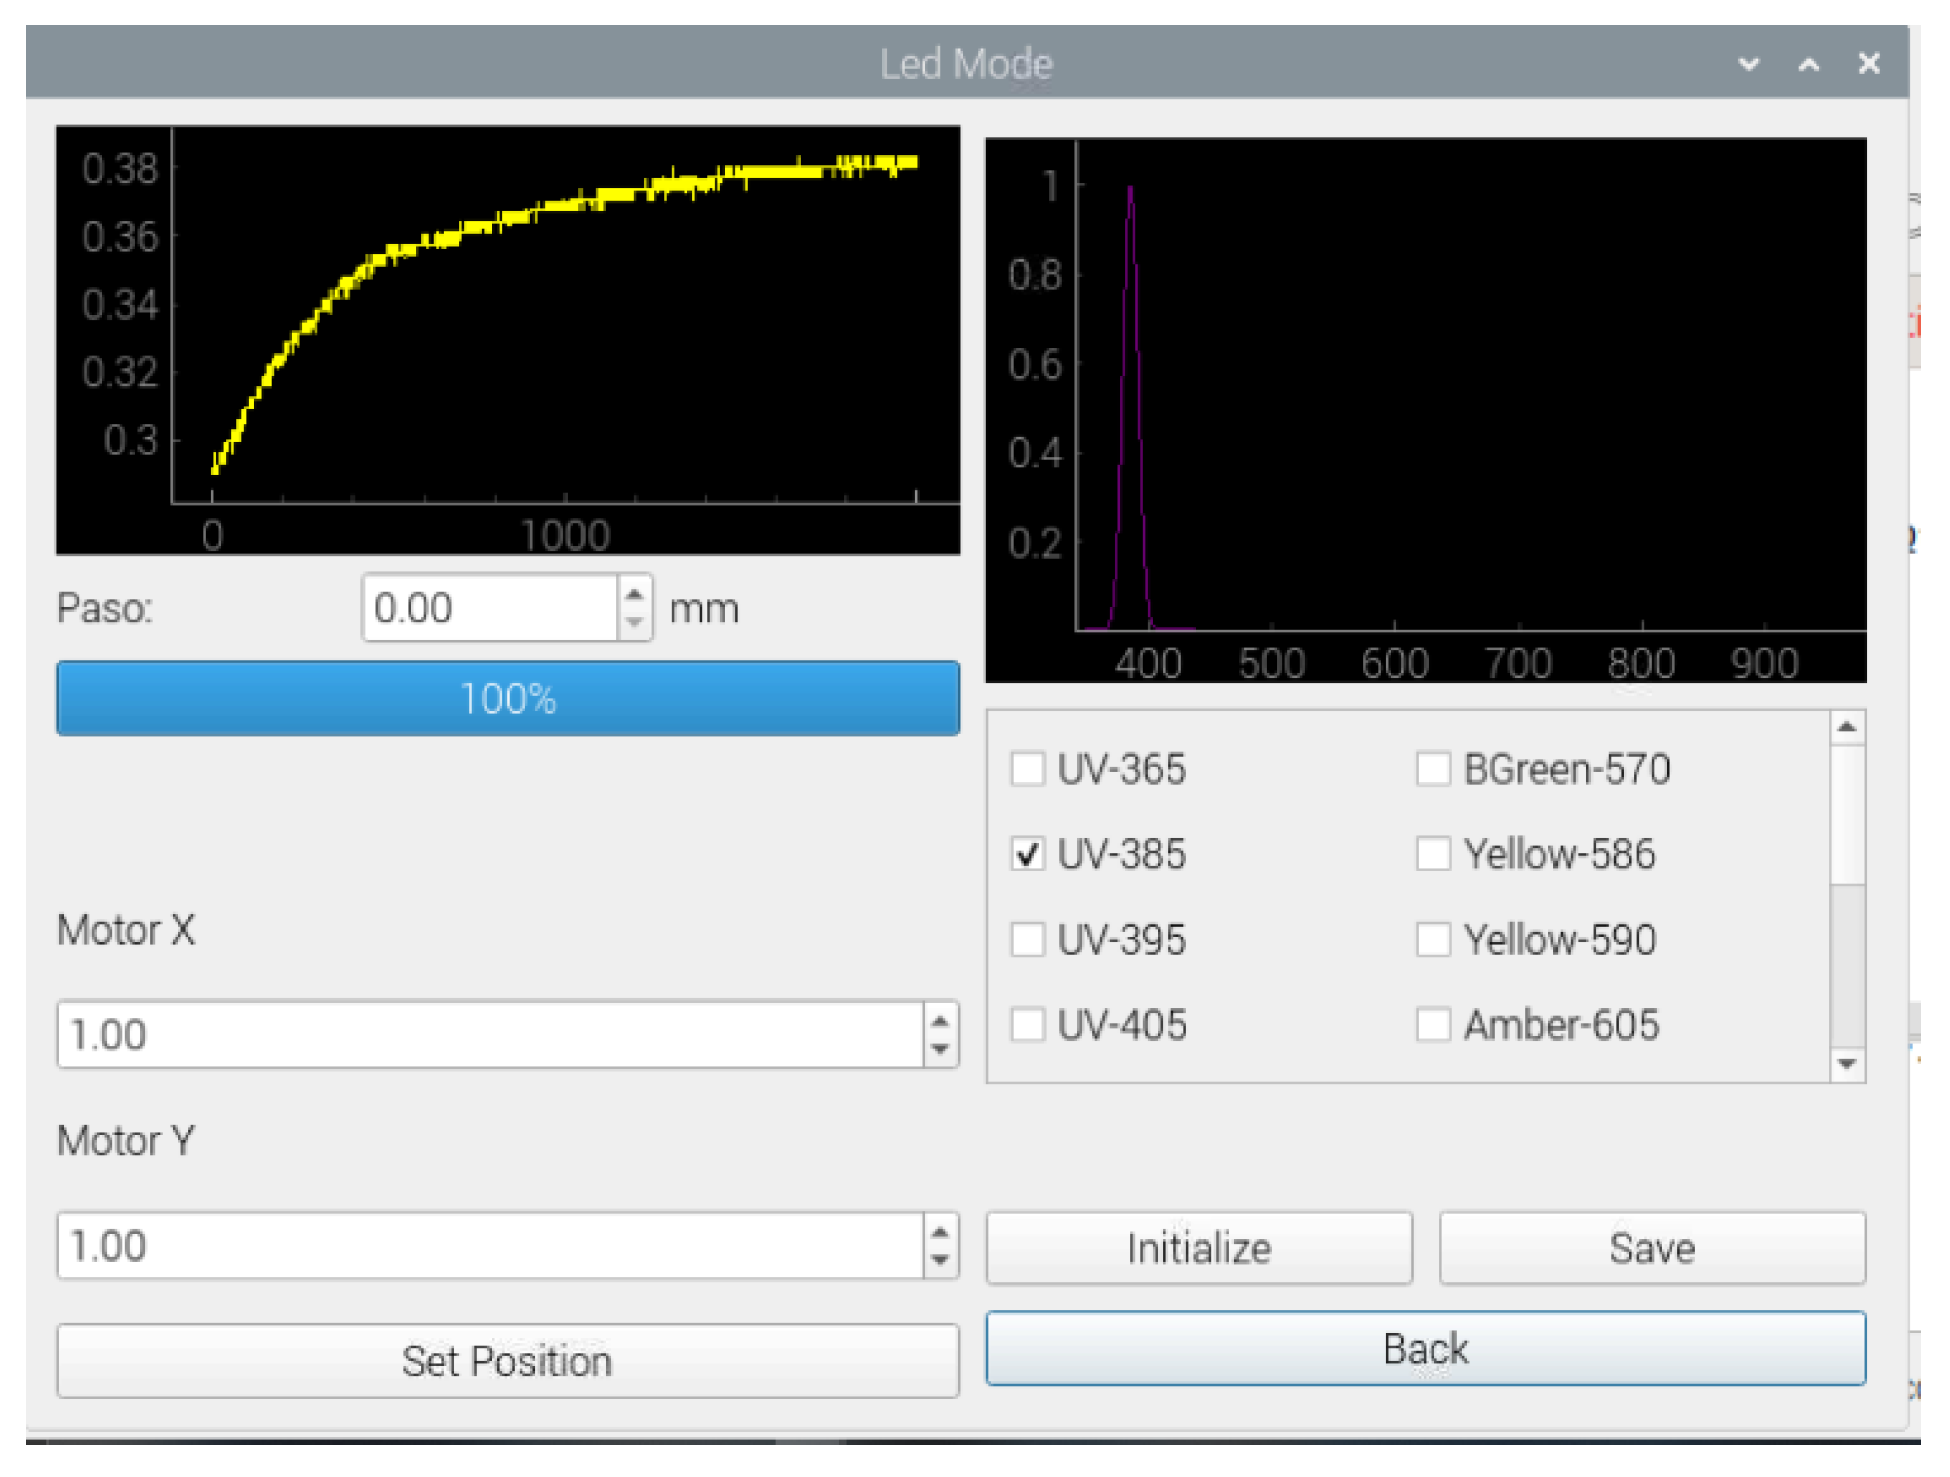
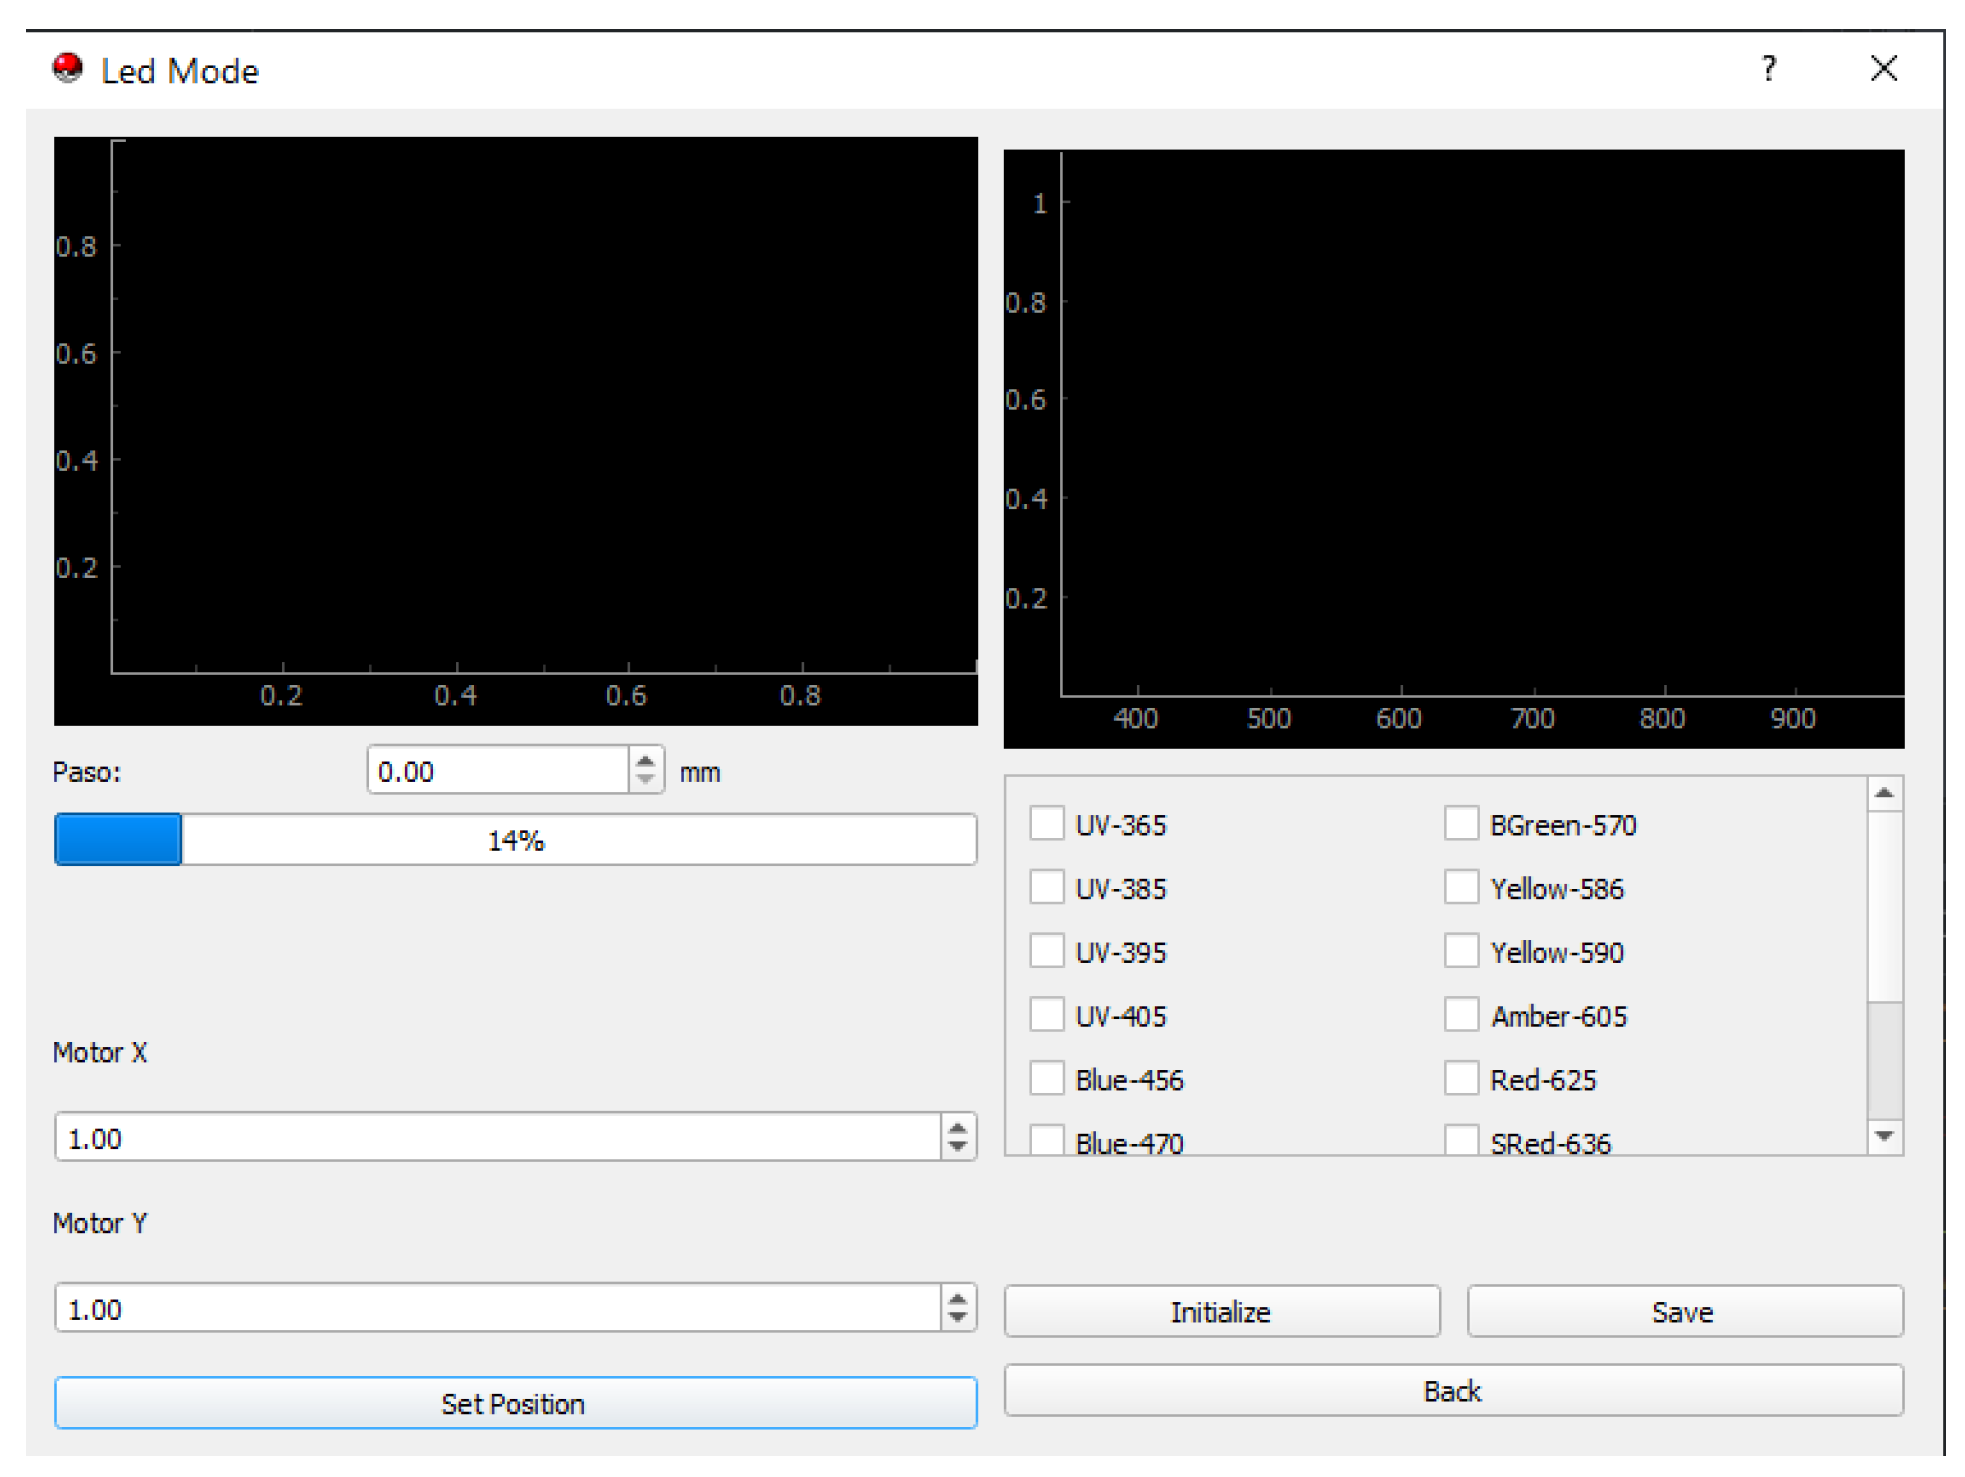
Figure 15.
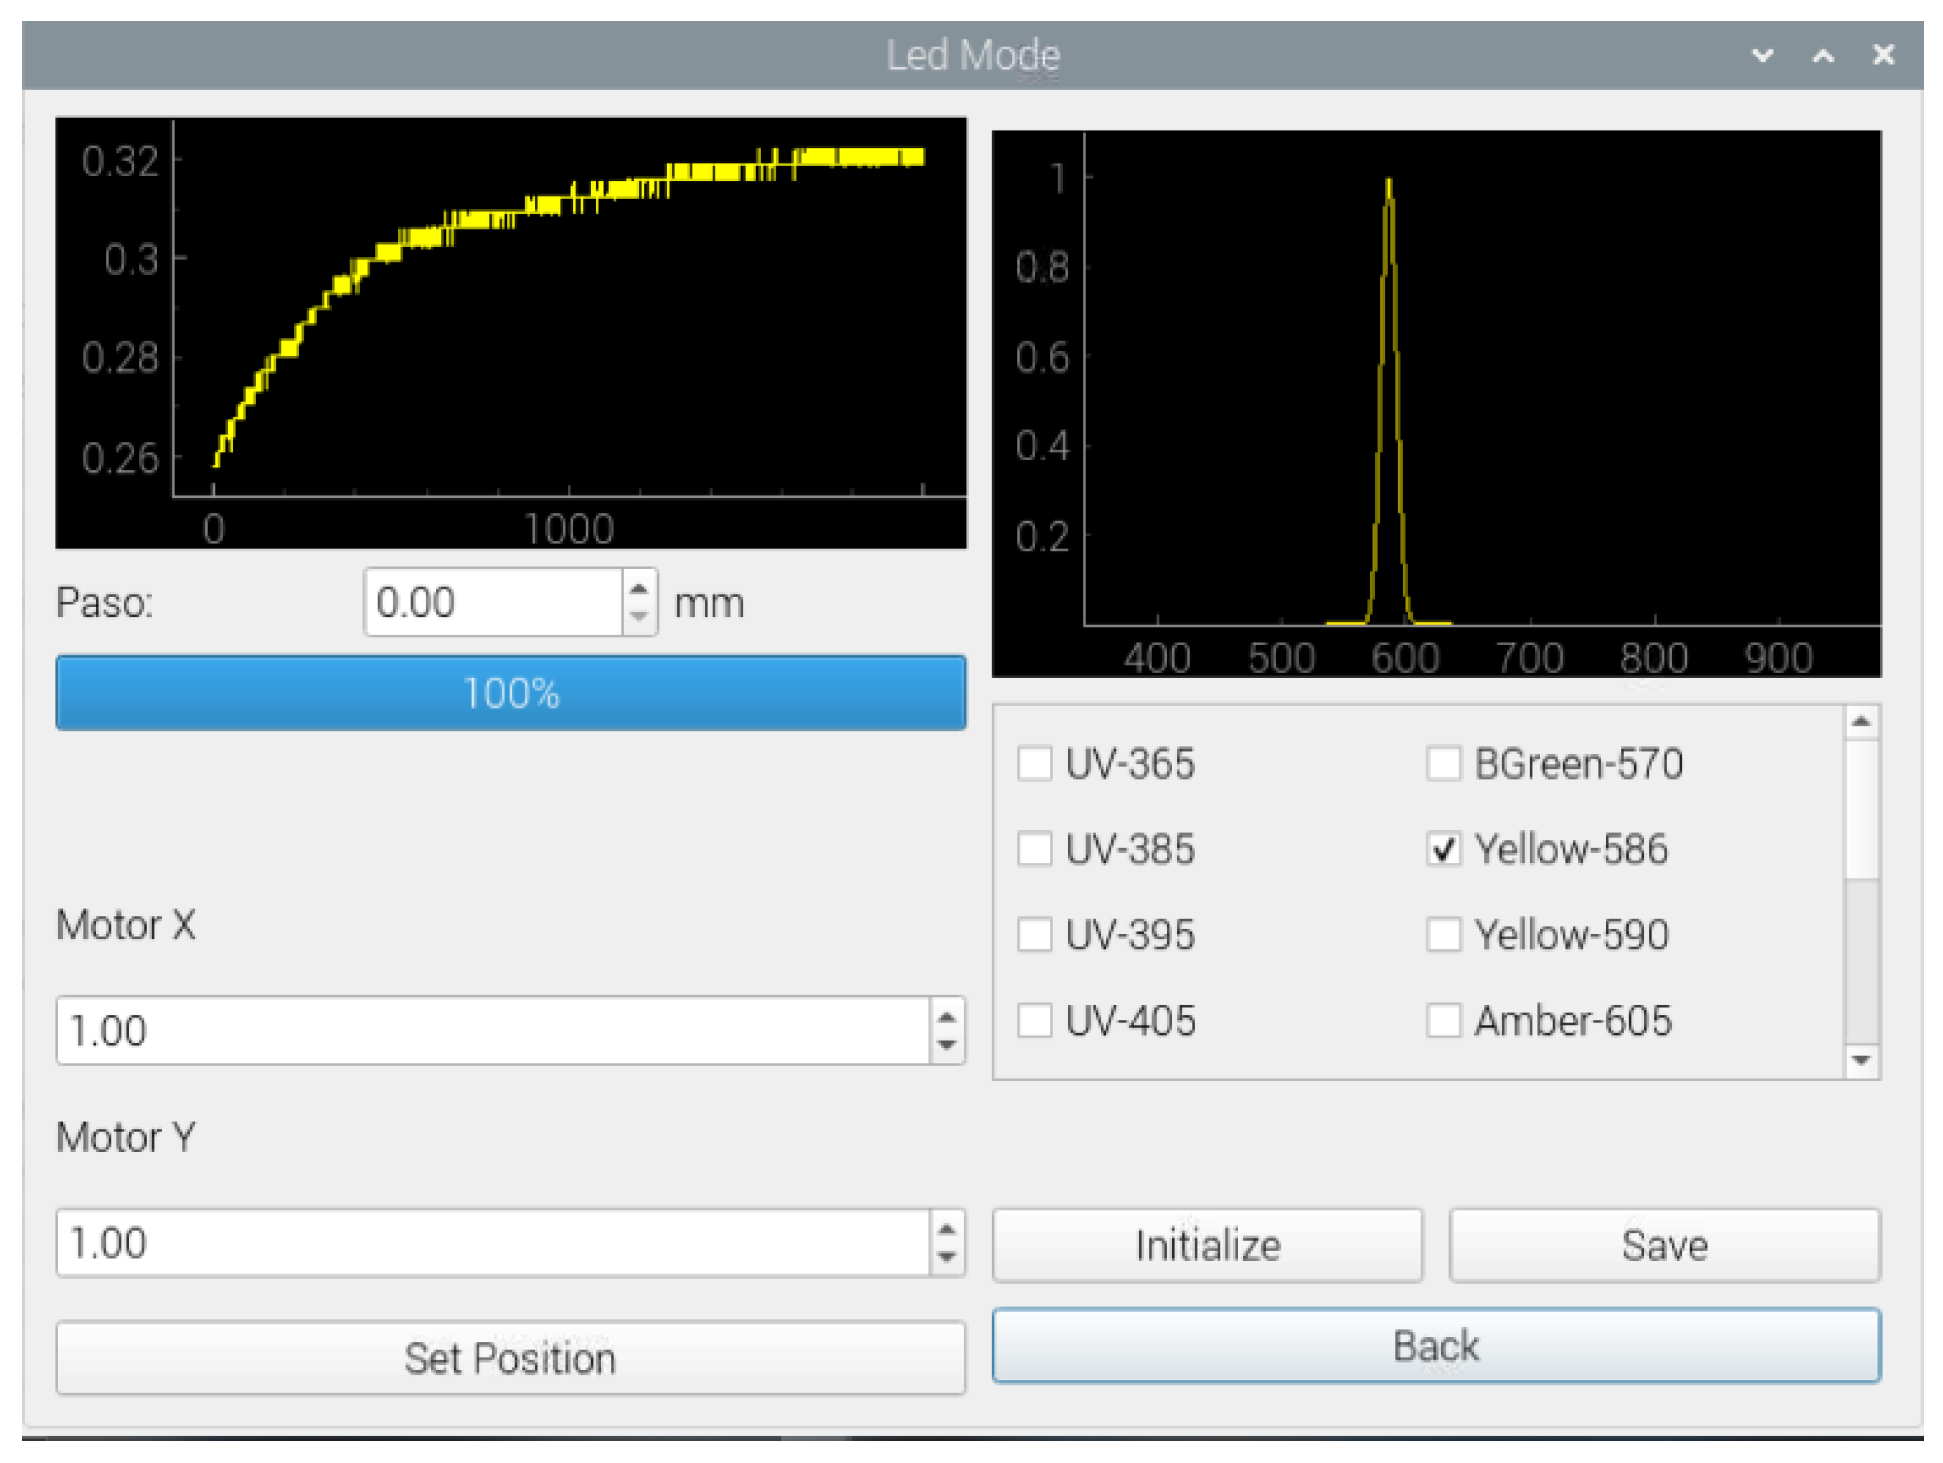
The final Menu of LED mode permits the control of the motors and the LEDs.
Figure 15.
The final Menu of LED mode permits the control of the motors and the LEDs.
Figure 16.
A beta of the microscopy Module.
Figure 16.
A beta of the microscopy Module.
Figure 17.
Working prototype, testing with external light (phone lamp) to see the photodiode's response.
Figure 17.
Working prototype, testing with external light (phone lamp) to see the photodiode's response.
Figure 18.
Working prototype, testing with external light (phone lamp) to see the photodiode's response.
Figure 18.
Working prototype, testing with external light (phone lamp) to see the photodiode's response.
Figure 19.
Prototype in operation, testing the detection of the prototype displaying the sensor reading in natural light and testing the high pass filter(Red arrow), where you can note that the peaks or noise that appears is due to the sampling that the sensor performs since it measures 700 values per second.
Table 1.
A4988 control library reference.
Table 1.
A4988 control library reference.
| Argument |
Name |
Type |
Description |
| 1 |
Direction |
Int |
Connects the GPIO pin that sets the direction of rotation |
| 2 |
Step_Pin |
Int. |
Step-pin Int Connects to the GPIO pin that sets the number of steps |
| 3 |
Mode_Pins |
Tuple 3 int. |
Mode-pin Tuple Connects the GPIO that determine the micro stepping mode. |
| 4 |
Motor_type |
String. |
Motor-type String Controller type, for this project the. A4988”will be used |
