
Submitted:
04 December 2024
Posted:
05 December 2024
You are already at the latest version
Abstract
Santa María Bay-La Reforma (SMBLR) is Mexico's most extensive estuarine lagoon system. The Secretariat of the Ramsar Convention on Wetlands declared it a wetland of international importance and it is made up of islands, estuaries, and mangrove areas, which provide a vital part of the habitat and refuge of a significant number of birds, fish, amphibians, reptiles, and mammals. The fishing of blue and brown shrimp, marine and estuarine fish, as well as the exploitation of crab and bivalve mollusks represent an important economic value for the established communities that live there and for the economic impact in the state of Sinaloa. This state ranked second in fisheries production and first in aquaculture production by 2023. Also, Mexico is the seventh largest producer of farmed crustaceans in the world. However, the biological richness of this ecosystem has historically been threatened by economic activities that, via watersheds, translate into continuous inputs of nutrients and other pollutants. This has led to modifications to the system such as changes in the structure of pelagic and benthic communities, mainly in response to the phenomenon of eutrophication. To understand the dynamics of nutrient inputs to the ecosystem, this work presents a comparative analysis of the trophic state of the system and the magnitude of the main economic activities which have been modified from dominance of livestock activities to aquaculture from 2007-2019. In the coastal component of SMBLR (agriculture, livestock and aquaculture) under hydrological criteria, the behavior of the system's trophic indices in each season of the year and its transitions were analyzed. We found, however, that in most of the seasons the system functions as a nitrogen and phosphorus sink, which is associated with autotrophic net ecosystem metabolism and nitrogen fixation processes. We suggest that while water residence times in SMBLR are short, these are strongly influenced by the high volumes of water and nutrient loads determined by the spatio-temporal variations of hydrological drainage from the drains of the basins of influence of the system. The influx of nutrients and other pollutants into an ecosystem affects the carrying capacity of the lagoon ecosystem. This is demonstrated in this study since SMBLR is mostly an autotrophic system; there are signs that the carrying capacity at some seasons of the year has been exceeded, and the adverse ecological and socioeconomic effects in the basin are evident.
Keywords:
carrying capacity
; coastal lagoon system
; Mexican Pacific
; Gulf of California
1. Introduction
Coastal lagoons are ecosystems recognized for their high biological productivity; they serve as habitats for numerous estuarine and marine species while providing material resources and varied ecosystem services of high economic value (Pérez-Ruzafa et al., 2019). However, these ecosystems are subject to constant anthropogenic pressure related to the activities around them, such as fishing, tourism, industry, agriculture, and aquaculture (Jara-Marini et al., 2020).
Despite its economic importance, human activities have accelerated the flow of nutrients in coastal ecosystems due to the discharge of treated and untreated wastewater rich in nitrogen (N) and phosphorus (P) derived from fertilizers (Esqueda and Rivera, 2004; Espejo et al., 2012).
The discharge of wastewater in coastal ecosystems with high concentrations of nutrients (N and P) is one of the main environmental problems since it favors the excessive growth of primary producers and alters the balance between the production-respiration of organic matter at the same time, causing changes in the hydrology, biogeochemistry, and net ecosystem metabolism NEM that disturb their ecological state, biodiversity and socioeconomic services (Cloern, 2001; Newton et al., 2018, 2020). Therefore, the relationship between the nutrient load and the net productivity of the ecosystem is complex and will depend on which nutrient is the limiting one (N and P) together with the water exchange capacity with the sea of the receiving ecosystem (Kiwango et al., 2018). Coastal lagoons provide environmental, ecological, and economic services, among others, and their deterioration affects an increasing number of inhabitants living in the area. As a result of population growth and its activities, combined with the effects of climate and global change, there is environmental degradation, which is why it is vital to evaluate the environmental carrying capacity for adaptive and sustainable management (Anthony et al., 2009; Pérez-Ruzafa et al., 2011). Carrying capacity is the limit of the capacity of a given coastal area to support all human activities, in which all activities are maintained at a sustainable level and this can be physical, ecological or social and its evaluation must be beyond qualitative, it must be functional and quantitative (Clarke, 2002; Miharja and Arsallia, 2016). The difficulty in establishing solid and clear methods to evaluate the carrying capacity of this type of complex, transitional, heterogeneous, and dynamic ecosystems in which hydrology, trophic state, and geomorphology can explain the structure of the fish and invertebrate communities that live there and whose fishing performance is related to the lagoon-basin interaction, considering rainfall, the surrounding wetland area and more than salinity, it is the gradients and magnitude of the exchange with the ocean that provides a large number of favorable microenvironments to house the vast diversity in this type of coastal ecosystem (Pérez-Ruzafa et al., 2011). This leads us in this work to apply models for the understanding and historical evaluation of trophic conditions and socioeconomic development, in addition to the evaluation of the carrying capacity necessary for the management of a sustainable development plan for the benefit of the ecosystem and the population that lives and depends on the lagoon ecosystem.
Biogeochemical mass balance models such as the LOICZ (Land-Ocean Interactions in the Coastal Zone) are a helpful tool that allows us to evaluate the loads, flows, and destination of nutrients, the residence time of the water, as well as the Net Ecosystem Metabolism NEM (Gordon et al., 1996; Swaney et al., 2011; Marinov et al., 2014).
The LOIZC biogeochemical model has been successfully applied in hypersaline coastal lagoons, where it has shown information about the responses of the ecosystem to the contribution of nutrients of anthropogenic origin, as well as in environmental management to prevent the effects of eutrophication (Valenzuela-Siu et al., 2007; Cervantes-Duarte, 2016; López-Monroy and Troccoli-Ghinaglia, 2017; Bejaoui et al., 2022). Studies on the response of ecological carrying capacity due to socioeconomic and environmental changes are relevant due to their importance in the sustainable development of coastal areas through the use of models that analyze socioeconomic information, changes in population and development activities, industrial or tourist, local regulations, considering the interest of people, academic and government institutions to propose management plans towards a sustainable future of the coastal community (Liu and McNeil, 2020; Bui and Trann, 2022).
2. Materials and Methods
2.1. Study Area
Santa María Bay-La Reforma (SMBLR) is the largest estuarine lagoon system in the state of Sinaloa, Mexico with 531.40 km2 located between the coordinates 25°17’ 00” N - 24° 42′ 00” W -108° 25’ 00” -107° 57′ 00” W (Figure 1). Inside the lagoon is Laguna Playa Colorada-Santa María La Reforma Ramsar Site (02-02-2004) which does not have a defined polygon, only the centroid 24° 59’ 50” N 108° 07’ 27” W, with an extension of approximately 530 km2 (SIS-Ramsar, 2004). It is also a mangrove site of international biological relevance with 217.28 km2 of extension and of that 0.14 km2 requires ecological rehabilitation (Rodríguez-Zuñiga et al., 2013) 25° 22’ 12” N, 108° 28’ 48” W and 24° 39’ 36” N y 107° 48’ 36” W (Acosta-Velázquez and Vázquez-Lule, 2009). The total surface area of the micro-basins that discharge water to the lagoon system is 6,137 km2, distributed in 1267, 823, 1231, 474, 1530 and 812 km2 for Corrientes Huyaqui Group, Corrientes Reforma Group, and Pericos 2 River, Pericos 1 River, Rio Mocorito 1 River, Mocorito 2 River sub-basins, respectively (Figure 1).
To understand the dynamics of nutrient inputs to the ecosystem, in this work, a comparative analysis of the trophic state of the system and the magnitude of the main economic activities in the coastal component of SMBLR (agriculture, livestock, and aquaculture) was carried out using hydrological criteria to differentiate the zones of influence: northern zone (Corrientes Huyaqui Group basin), central zone (Mocorito 1 River and Mocorito 2 River sub-basins) and southern zone (Corrientes Reforma Group, Pericos 1 River and Pericos 2 River sub-basins) Figure 1.
2.2. Sampling Strategy
This work is the result of the review of several hydrological, hydrodynamic, water quality, and carrying capacity studies carried out in the last 20 years (Lechuga-Devéze et al., 2006; Páez-Osuna et al., 2007; Martínez-López et al., 2013; Romero-Beltrán et al., 2014), complemented by the historical review of socioeconomic development about the economic activities that take place in SMBLR during that period and contrasted with the analysis and modeling of this work to look for the trend of the eutrophication process, changes in the quality of load and the evaluation of the carrying capacity to define a proposal for decision makers for the management of the lagoon system that allows the development of economic activities to continue in the immediate future, in a sustainable manner (Páez-Osuna et al., 2007; Reyes-Velarde et al., 2023).
2.3. Carrying Capacity
2.3.1. Historical Evaluation
From a bibliographic review, four documents that describe the load capacity of the SMBLR lagoon system were identified (Lechuga-Devéze et al., 2006; Páez-Osuna et al., 2007; Martínez-López et al., 2013; Romero-Beltrán et al., 2014). These studies cover the period from 2003 to 2014, which, together with the carrying capacity evaluation carried out in this work for the period 2020-2021 using the data reported by Reyes-Velarde (2022), stretch approximately two decades of observations on the behavior of carrying capacity of this coastal system.
2.3.2. Present Day Evaluation
The carrying capacity of the SMBLR lagoon system was obtained following the model developed by the group Land-Ocean Interactions in the Coastal Zone (LOICZ, Gordon et al., 1996). This model provides information on the hydraulic balance, water renewal time, nutrient flow, and net ecosystem metabolism. The model is carried out in three stages: 1) water balance, 2) salt balance, and 3) non-conservative material balance. The general equations used to calculate these balances are described in Gordon et al. (1996).
The equations that describe this model were used to evaluate the load capacity for four climatic seasons: rainy (September 2020), transition rainy-dry (November 2020), dry (February 2021), and transition dry-rainy (May 2021).
Precipitation and evaporation data were obtained from an automatic meteorological station at El Playón, Sinaloa, with station code CONAGUA-25030, adjacent to the lagoon (25º 13′ 19.92” N, 108º 11′ 25.08” W) and were used to estimate water balances. The wastewater expenses discharged by the collectors of the agricultural drains of the Río Fuerte Hydrological Subregion of the Hydrological Region number 10, Sinaloa, were obtained proportionally according to the area occupied by each micro-basin by the municipality to the technical studies of national surface waters (SEMARNAT, 2015).
2.4. Sub-Basin Economic Activities
A comparative analysis was conducted on the economic activities and demographic data of the hydrographic basins that impact the SMBLR system. This analysis used geographical delineations from Mexico’s INEGI (2023a) and the Hydrographic Network of Mexico from CONABIO (2014). The percentages of land cover contributions for each municipality influencing the SMBLR were determined, as detailed in Table I.
Municipalities were defined for each sub-basin, and databases on agriculture, livestock (SIAP 2023a and 2023b), and aquaculture activities (CESASIN, 2023) were reviewed. For the population component, population centers within each sub-basin were identified using the National Institute of Statistics, Geography, and Informatics (INEGI, 2020) census data.

Table I.
Percentage contribution of municipal land cover of sub-basins draining to SMBLR.
| Sub-basin | Municipality | Contribution of sub-basins on land cover (%) |
|---|---|---|
| Corrientes Huyaqui Group | Guasave | 17.20 |
| Sinaloa | 5.29 | |
| Salvador Alvarado | 36.81 | |
| Angostura | 23.00 | |
| Mocorito 1 River | Sinaloa municipio | 1.37 |
| Salvador Alvarado | 12.92 | |
| Mocorito | 47.77 | |
| Badiraguato | 2.01 | |
| Mocorito 2 River | Angostura | 40.73 |
| Mocorito | 1.60 | |
| Salvador Alvarado | 44.21 | |
| Corrientes Reforma Group | Angostura | 36.27 |
| Salvador Alvarado | 4.34 | |
| Mocorito | 8.31 | |
| Navolato | 9.03 | |
| Pericos 1 River | Badiraguato | 4.32 |
| Mocorito | 10.55 | |
| Pericos 2 River | Mocorito | 23.5 |
| Salvador Alvarado | 1.73 | |
| Navolato | 30.69 | |
| Badiraguato | 0.11 |
For the agriculture component, we used the SIAP agricultural database (SIAP, 2023a) to gather information on the total area planted with corn and sorghum during the spring-summer and autumn-winter cycles for the years 2007, 2014, and 2019 across various municipalities within the sub-basins of Guasave, Salvador Alvarado, Angostura, Mocorito, Badiraguato, and Navolato. For the livestock component, we consulted SIAP’s livestock data (SIAP, 2023b) for the same years and municipalities. Aquaculture data related to shrimp farming was obtained from CESASIN (CESASIN, 2023) specifically for the regions of Guasave Sur, Angostura, and Navolato Norte. Additionally, population estimates for each sub-basin were sourced from INEGI (2020) for the years 2005, 2010, and 2020.
Based on this information, we established the contribution percentages of each municipality within the identified sub-basins (see Table I). The distribution of economic activities was estimated for each runoff zone of the SMBLR system, where the primary drains to the system are located in the northern and southern sections of the lagoon system (see Figure 1).
2.5. Loading Nutrients, Trophic State, and Residence Time: Hydrodynamic Model Evaluation
It is important to note that the main surface runoff of the lagoon system, both in the northern and southern parts of the system, is due to the fact that most of the agricultural contributions in the northern part drain towards the “Without name River” and the Mocorito River, while in the southern part, they drain towards the Tule River as seen in Figure 1, so using TRIX values previously reported by our laboratory in SMBLR (network of 46 stations; Reyes-Velarde et al., 2023). A categorization of the trophic state of the system was carried out, comparing the northern, central, and southern zones of SMBLR for the 2020 rainy period, 2020 rainy-dry season, 2021 dry season, and 2021 dry-rainy season. On the other hand, to explain the different trophic concentrations and residence times of the waters discharged into the lagoon system through drains, the hydrodynamic model described by Serrano et al. (2013) was implemented in the SMBLR.
The advection equation diffusion (Crank, 1979) describes the change of a passive pollutant through time and space (See Eq. 1).
Where C is the concentration of a passive pollutant, t is time, is the velocity vector, is the horizontal gradient
operator, is the Laplacian operator, and k is the turbulent diffusion coefficient.
In this work, the definition of residence time was used as the time necessary for a parcel of water to leave the domain of interest (Zimmerman, 1988; Monsen et al., 2003), and the passive pollutant was used as a trace element.
The hydrodynamic model was forced with the tide in both mouths of the lagoon system according to the sampling dates. For September 2020, two days before neap tides (NT); for November 2020, one day after spring tides (ST); for February 2021, three days before NT and for May 2021, in ST. To determine the residence time, 14 control points (CP) were located at the two SMBLR mouths and six interior points (IP), from where the passive pollutant continuously emanated according to the TRIX concentration (Reyes-Velarde et al., 2023), (Figure 2). The pollutant began to emanate for each IP after 12 h of starting the model, thereby reaching hydrodynamic stability. The simulation for IP-3 was 6 days; for the rest of the IP, it was 3 days. IP was located at the mouth of the estuaries according to the monitoring of the drains through Google Earth Pro for Windows (version 7.3).
In the 14 borders of CP, the concentration was recorded over the time in which the pollutant arrived, constructing 14 series for each IP and for the four tidal conditions. The residence time was determined by recording the first relative maximum in the series that presented the highest concentration, guaranteeing that the contaminant that emerged in one of the IP within SMBLR came from one of the mouths.
2.6. Integrative Data Analysis
To integrate the results of this study, a qualitative analysis of the data was carried out, and with this, the inferences and proposals of the socioeconomic changes in relation to the carrying capacity of the lagoon system were made. To show the changes in economic activities in the lagoon system, an analysis of growth rates was carried out by area, sub-basin, and period (2007-2014 and 2014-2019). To graphically show the integrated historical results, a diagram was made by area, sub-basin and another of the current situation with the main elements obtained from the study.
3. Results
3.1. Carrying Capacity
3.1.1. Historical Evaluation
The first SMBLR water residence time Rt values were reported by Lechuga-Devéze et al. (2006), which in the rainy season was 1.6 days, similar to that reported by Serrano et al. (2013) of 2.2 days. At the same time, Martínez-López et al. (2013) recorded a value of 22.5 days in the dry season and 53 days in the rainy season. On the other hand, the values of Rt were 3.2 days for the dry season and 1.2 days for the rainy season, as reported by Medina-Galván et al. (2021). Likewise, Romero-Beltrán et al. (2014) indicated an Rt value of 18 days. In this study, Rt turned out to be shorter in time in the dry season (0.2 days) and longer in the dry-rainy season (20 days), with an average value of 5.3 days in the study period (Table II). Regarding the function of nitrogen flow in the lagoon system, Lechuga-Devéze et al. (2006) noted that the SMBLR functioned as a nitrogen source at a rate of 16.82 mmol m-2 day-1. In the same way, Martínez-López et al. (2013) indicated that the lagoon functioned as a source of nitrogen in rainy and dry seasons with transfer rates of 14.36 and 36.91 mmol m-2 day-1, respectively. SMBLR worked in this study as a dissolved inorganic nitrogen sink in the rainy season (-120.94 mmol m-2 day-1) and dry-rainy transition (-21.43 mmol m-2 day-1), and as a source of NID in rainy-dry transition (1.94 mmol m-2 day-1) and dry season (45.55 mmol m-2 day-1). NID transfer rates during the rainy period were higher (Table II).
Table II.
nutrient fluxes ΔDIN and ΔDIP (mmol m-2 day-1), net ecosystem metabolism NEM p-r (mmol C m-2 day-1), di-nitrogen fixation N2fix, and denitrification HD (mmol m-2 day-1) in SMBLR Bahia Santa María La Reforma lagoon system.
Table II.
nutrient fluxes ΔDIN and ΔDIP (mmol m-2 day-1), net ecosystem metabolism NEM p-r (mmol C m-2 day-1), di-nitrogen fixation N2fix, and denitrification HD (mmol m-2 day-1) in SMBLR Bahia Santa María La Reforma lagoon system.
| Season | Residence time Rt day-1 |
ΔDIN mmol m-2 day-1 |
ΔDIP mmol m-2 day-1 |
NEM (p-r) mmol C m-2 day-1 |
N2fix-HD mmol m-2 day-1 |
|---|---|---|---|---|---|
| 1Rainy | 1.6 | 16.82 | 2.05 | -217.92 | -16.07 |
| 2Rainy | 53 | 14.36 | 1.76 | -186.08 | -13.72 |
| 2Dry | 22.5 | 36.91 | 2.63 | -278.44 | -5.11 |
| 3Rainy | 1.2 | -0.02 | 0.03 | -3.70 | -0.45 |
| 3Dry | 3.2 | -0.03 | 0.02 | 2.46 | 0.40 |
| 4Rainy | 0.6 | -120.94 | -5.57 | 590.5 | -31.81 |
| 4Rainy-dry | 0.4 | 1.94 | 0.14 | -1684.6 | -252.34 |
| 4Dry | 0.2 | 45.55 | -2.03 | 215.7 | 78.11 |
| 4Dry-rainy | 20 | -21.43 | -2.72 | 289.17 | 22.21 |
1Lechuga-Devéze et al. (2006, unpublished data), 2Martínez-López et al. (2013), 3Medina-Galván et al. (2021); 4This study.
Regarding fluxes of dissolved inorganic phosphorus DIP, Lechuga-Devéze et al. (2006) and Martínez-López et al. (2013) showed that the lagoon maintained a DIP source operation but with transfer rates slightly higher than those observed in the present study, except in the rainy season. The system functioned as a sink throughout almost the entire study period; in rains (-5.57 mmol m-2 day-1), in the dry season (-2.03 mmol m-2 day-1), and in dry-rainy season (-2.72 mmol m-2 day-1); it was only a source of DIP in the rainy-dry transition season (0.14 mmol m-2 day-1). DIP transfer rates were higher in the rainy period (Table II).
Besides, Martínez-López et al. (2013) found that heterotrophic metabolism (p-r) was observed in both periods studied: rainy season (-186.08 mmol C m-2 day-1) and dry season (-278.44 mmol C m-2 day-1) with an average value of -232.26 mmol C m-2 day-1. In SMBLR the net ecosystem metabolism was autotrophic in most of the periods studied; rains (590.5 mmol C m-2 day-1), dry season (215.7 mmol C m-2 day-1) and dry-rainy transition (289.17 mmol C m-2 day-1) except in the rainy-dry transition where it was heterotrophic (1684.6 mmol C m-2 day-1), predominating a net autotrophic metabolism and exhibiting an average value of 694.72 mmol C m-2 day-1 (Table II).
The rates of di-nitrogen fixation (N2fix) - denitrification (HD) reported by Lechuga-Devéze et al. (2006) and Martínez-López et al. (2013) agree in indicating denitrification for rainy season (-16.07 mmol m-2 day-1 and -13.72 mmol m-2 day-1, respectively), and also for the dry season (-5.1 mmol m-2 day-1) by Martínez-López et al. (2013). Furthermore, Medina-Galván et al. (2021) indicated the lowest rates of fixation (N-fix) for the dry season and denitrification (HD) for the rainy season (0.40 and -0.45 mmol m-2 day-1, respectively). In this study, net autotrophic metabolism corresponded to nitrogen fixation for dry season (78.11 mmol m-2 day-1) and dry-rainy season (22.21 mmol m-2 day-1), except for the rainy season when a net autotrophic metabolism rate corresponded to denitrification (-31.81 mmol m-2 day-1), and finally, the highest rate of net heterotrophic metabolism in rainy-dry transition season corresponded to the highest rate of denitrification (-252.34 mmol m-2 day-1) (Table II).
3.1.2. Present Day Evaluation
Water Residence Time Rt
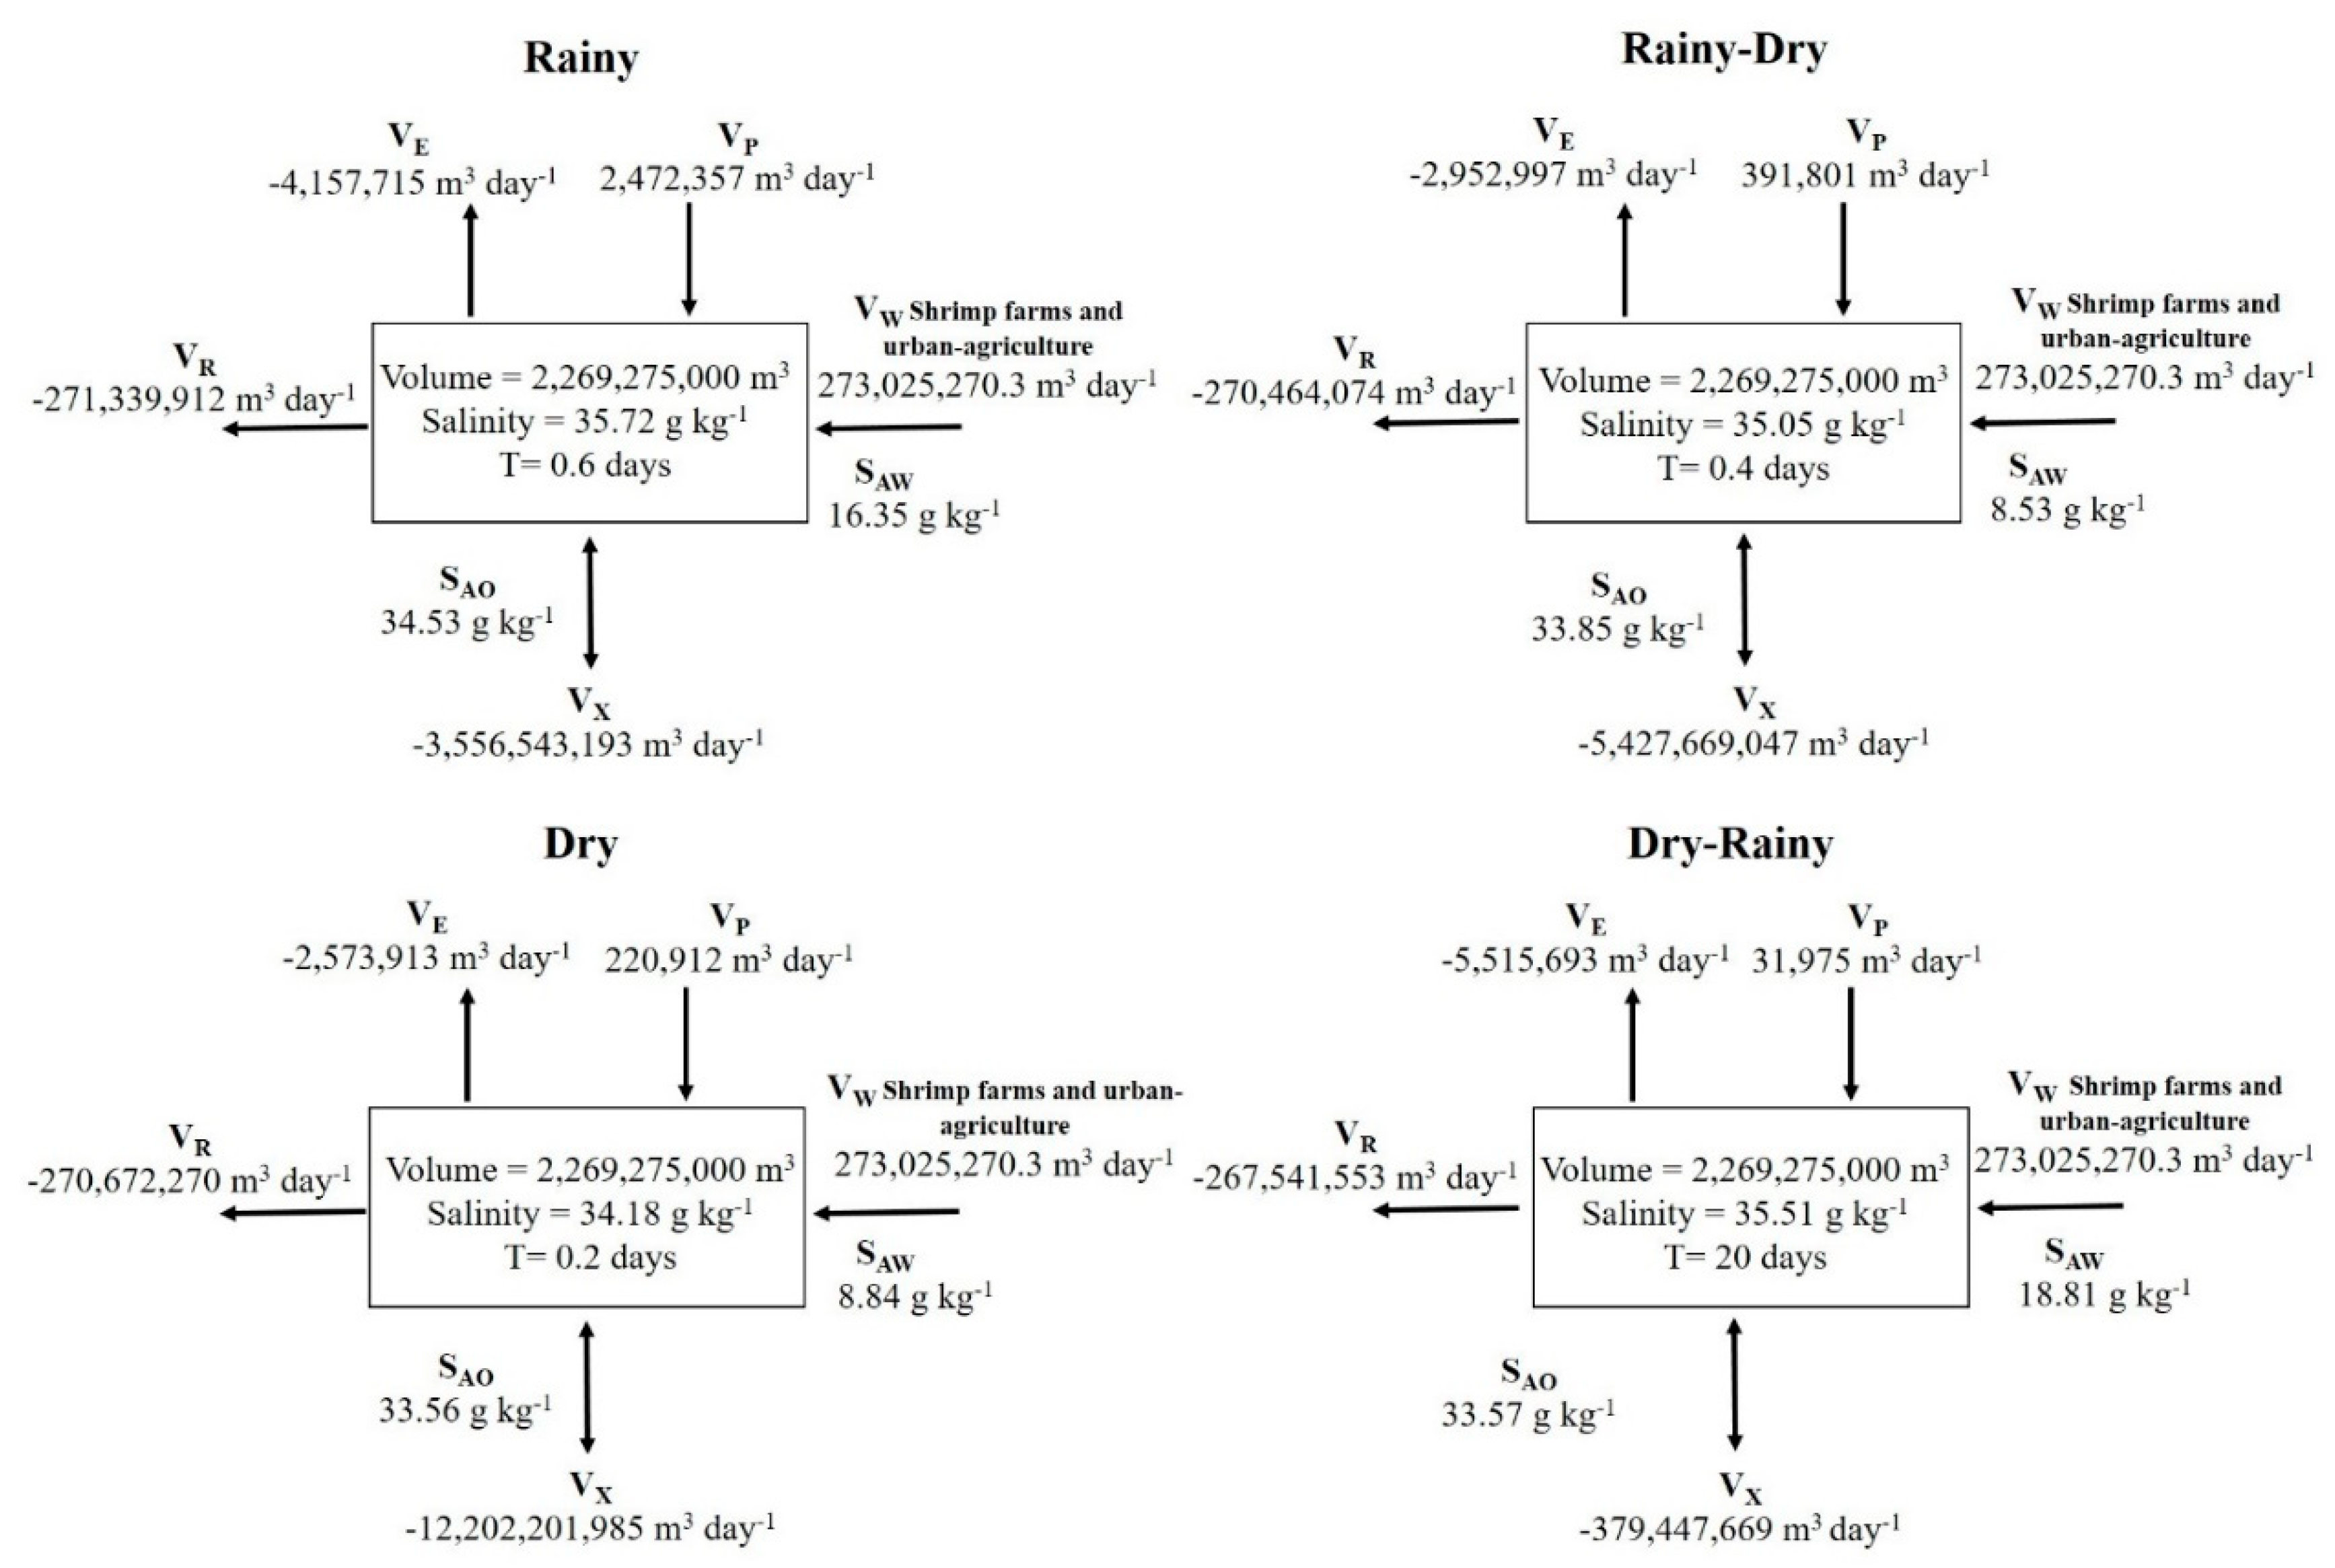
Water renewal times were shorter in the rainy, rainy-dry, and dry periods, with the lowest renewal rate in dry conditions (0.2 days). In contrast, in dry-rainy periods, the water renewal time was longer (20 days). The average lagoon water renewal time value was 5.3 days (Figure 7).
Figure 7.
Water and salt balances in the four seasons (rainy, rainy-dry, dry, and dry-rainy) in Bahía Santa María La Reforma lagoon system. The units of water volumes are given in m3 day-1 and salinity in g kg-1.
Figure 7.
Water and salt balances in the four seasons (rainy, rainy-dry, dry, and dry-rainy) in Bahía Santa María La Reforma lagoon system. The units of water volumes are given in m3 day-1 and salinity in g kg-1.
Nutrients Fluxes
The DIN fluxes showed that the lagoon functions as a sink during the rainy and dry-rainy periods, with the highest import rates in rainy seasons (ΔDIN = -120.94 mmol m-2 day-1), on the other hand, the lagoon functions as a source in dry and rainy seasons, with the greatest export of DIN in dry (ΔDIN = +45.55 mmol m-2 day-1) (Figure 8).
Figure 8.
DIN and DIP flows were observed in the four study periods in the Santa María La Reforma lagoon. (+) indicates source, (–) indicates sink. The units of the flows are given in mol day-1 and standardized in mmol m-2 day-1.
Figure 8.
DIN and DIP flows were observed in the four study periods in the Santa María La Reforma lagoon. (+) indicates source, (–) indicates sink. The units of the flows are given in mol day-1 and standardized in mmol m-2 day-1.
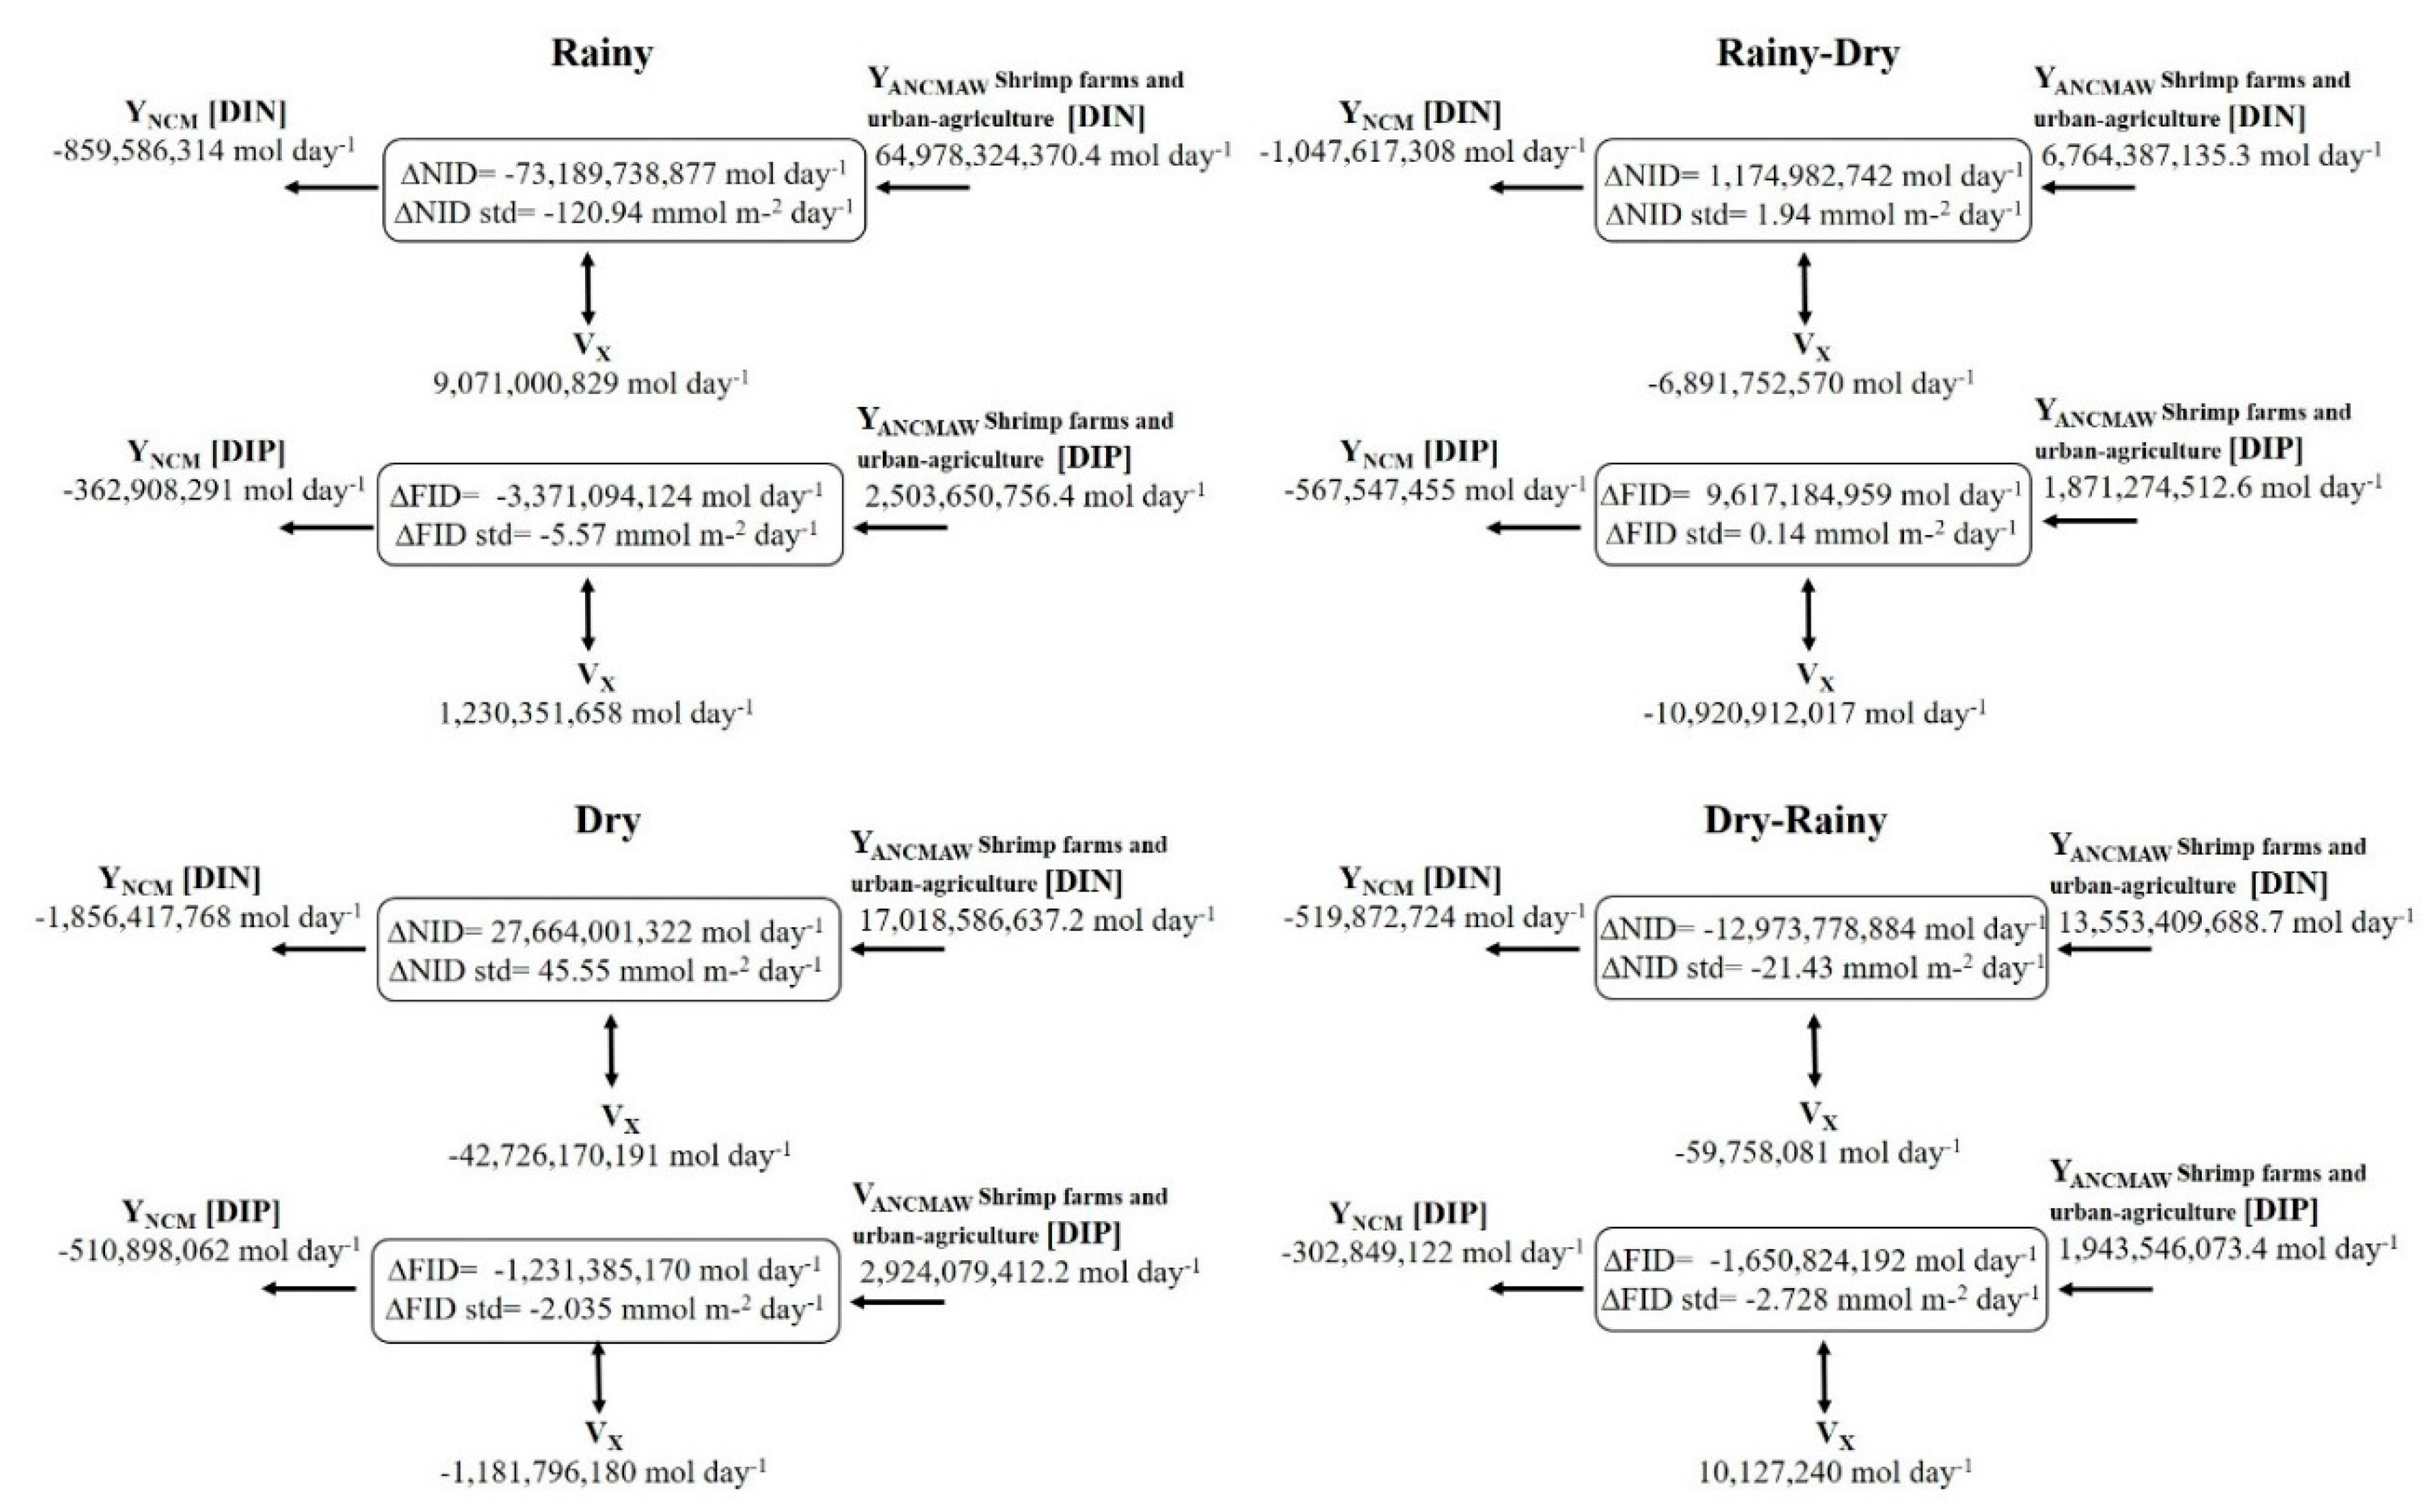
The DIP flows indicated that the lagoon was a sink during the entire study period, except in rainy-dry periods where it was a source, exporting ΔDIP = +0.14 mmol m-2 day-1.
The highest import rate in the rainy season was (ΔDIP = -5.57 mmol m-2 day-1) (Figure 8).
Net ecosystem Metabolism (NEM)
The net metabolism of the lagoon was autotrophic in the rainy, dry and dry-rainy periods, with the highest rates of autotrophy in the rainy season (590 mmol C m-2 day-1), and with an average value of 364.7 mmol C m-2 day-1. During dry-rainy transition season the metabolism was heterotrophic at a rate of -1684 mmol C m-2 day-1; higher values with almost three orders of magnitude compared to those of the rainy season were presented (Table III).
Table III.
Net ecosystem metabolism and fixation-denitrification in the four study periods in SMBLR.
Table III.
Net ecosystem metabolism and fixation-denitrification in the four study periods in SMBLR.
| Season | Rainy | Rainy-Dry | Dry | Dry-Rainy |
| NEM (mmol C m-2 day-1) | +590.50 | -1684.60 | +215.70 | +289.17 |
| N2fix-HD (mmol m-2 day-1) | +31.81 | -252.34 | +78.11 | +22.21 |
| Condition | Aut-N2fix | Het-HD | Aut-N2fix | Aut-N2fix |
NEM: net ecosystem metabolism; Aut: autotroph, Het: heterotrophic, HD: denitrifying, N2fix: nitrogen fixation.
The lagoon showed nitrogen fixation processes in rainy, dry, and dry-rainy periods, with the highest values in the dry period (+78.1 mmol m-2 day-1) and with an average of +44.04 mmol m-2 day-1, while in dry rains, the lagoon exhibits denitrification processes, with a rate of -252 mmol m-2 day-1 (Table III).
Residence Time:
Residence times fluctuated between 27.72 h (IP-6) for May 2021, in spring tides ST condition, and 102.57 h (IP-3) in September 2020, three days before neap tides NT (Table IV). Considering IP-1 and IP-2 are located in the southern zone (SZ) and IP-4, IP-5 and IP-6 are located in the northern zone (NZ), the residence times for each of the four tidal conditions in the six IP were similar, with the times in the SZ being slightly greater between 1.33% and 2.27%.
Table IV.
Residence time (Rt) in hours (h) for the six IP.
| IP number | September 2020 Rainy |
November 2020 Rainy - Dry |
February 2021 Dry |
May 2021 Dry - Rainy |
|---|---|---|---|---|
| IP | Rt (h) | Rt (h) | Rt (h) | Rt (h) |
| 1 | 40.02 | 33.01 | 34.21 | 28.67 |
| 2 | 39.94 | 32.58 | 33.97 | 28.33 |
| 3 | 102.57 | 57.75 | 84.33 | 53.55 |
| 4 | 39.82 | 32.86 | 34.06 | 28.65 |
| 5 | 38.79 | 32.64 | 33.33 | 28.29 |
| 6 | 38.62 | 31.73 | 32.77 | 27.72 |
Modeling the Concentration of the Pollutant in the Mouths:
The highest concentration of the contaminant (TRIX) in the Yameto mouth, south mouth (SM) emanated from IP-2 for the four tidal conditions, with a maximum of 0.036 in ST and a minimum of 0.004 in NT. The lowest concentration in the south mouth emanated from IP-1 with values lower by an order of magnitude. Likewise, the highest concentration of the contaminant in the Perihuete mouth, north mouth (NM) emanated from IP-6 in ST, with a concentration of 0.024. The lowest concentrations in both mouths occurred in periods close to NT. The concentration of the contaminant in the NM that emanated from IP-3 was between 1 and 4 orders of magnitude lower than the rest of the concentrations (Table V).
Table V.
Maximum TRIX concentration (MTC) in the mouths for 3 days of modeling, except for IP-3 which was simulated for 6 days.
Table V.
Maximum TRIX concentration (MTC) in the mouths for 3 days of modeling, except for IP-3 which was simulated for 6 days.
| IP number | September 2020 Rainy |
November 2020 Rainy - Dry |
February 2021 Dry |
May 2021 Dry - Rainy |
|---|---|---|---|---|
| IP | MTC | MTC | MTC | MTC |
| 1 | 9.39 × 10⁻⁵ | 0.0027 | 0.0012 | 0.0030 |
| 2 | 0.0040 | 0.0248 | 0.0160 | 0.0363 |
| 3 | 2.35 × 10⁻⁶ | 2.76 × 10⁻⁶ | 4.05 × 10⁻⁷ | 4.0 × 10⁻⁵ |
| 4 | 0.0024 | 0.0128 | 0.0041 | 0.0132 |
| 5 | 0.0039 | 0.0146 | 0.0121 | 0.0144 |
| 6 | 0.0030 | 0.0210 | 0.0057 | 0.0243 |
3.2. Sub-Basin Economic Activities
The characterization of economic activities in the sub-basins of influence of the system allows us to have a historical perspective of their growth for the first time in a little more than a decade. This growth can be both extension and intensification, depending on the nature of the activities, so we carry out this evaluation under the premise that, in both cases, the growth is related to the contributions of organic contamination and nutrients to the lagoon system.
Agricultural production:
For agricultural activity, it is observed that in the southern zone, it was relatively stable between 2007 and 2019 (from 67,733 to 85,236 ha), while in the northern zone, it remained stable between 2007 and 2014 (around 145,000 ha); however, there was a notable decrease in 2019 (SADER, 2022), with only 92,544 ha remaining (Figure 3).
Then again, when taking the corn crop as a reference as it is the predominant crop in the area, a significant increase in yield expressed t ha-1 metric tons (t) per hectare (ha) is observed in both areas, rising from 9.36 to 11.94-t ha-1 from 2007 to 2019 respectively (27.56% increase). Similarly, for the southern zone, the yield of this crop increased 24.4% (9.41-to-11,714-t ha-1) in the same years.
In contrast, for the livestock component, no notable changes are observed in the number of cattle heads reported (Figure 4); figures fluctuate between 10 and 12 million cattle heads in the northern zone, while in the southern zone, it remained at 14 million throughout the study period. However, in terms of production, a notable increase (484%) is observed in the northern zone from 10,834 to 52,460 t from 2007 to 2019 respectively; similarly, for the southern zone, the increase was from 14,205 to 57,752 t (357%) in the same period.
Aquaculture Production
For aquaculture activity (Figure 5), it is again observed that the area for aquaculture in the southern zone is relatively contrasting from 2007 to 2019 (between 4,443 and 9,474 ha), while the northern zone of 7,149 ha increased to 18,398 ha from 2007 to 2019. However, despite having more cultivation area, the yield in the northern zone fluctuated greatly from 2007 to 2019 with values ranging from 0.61 to 1.41-t ha-1, possibly due to diseases that have affected this activity.
Population:
During the 3 years of this study, the number of inhabitants behaved stably in both the northern and southern zones, having an average record of 145,705 inhabitants in the northern zone and 56,053 inhabitants for the southern zone, 2.6 times more inhabitants in the northern zone with respect to the southern zone. It should be noted that in the northern zone, the population of Guamúchil City municipality of Mocorito represents an average of 60.79% of the total population of the northern zone (Figure 6).
Basin Assessment
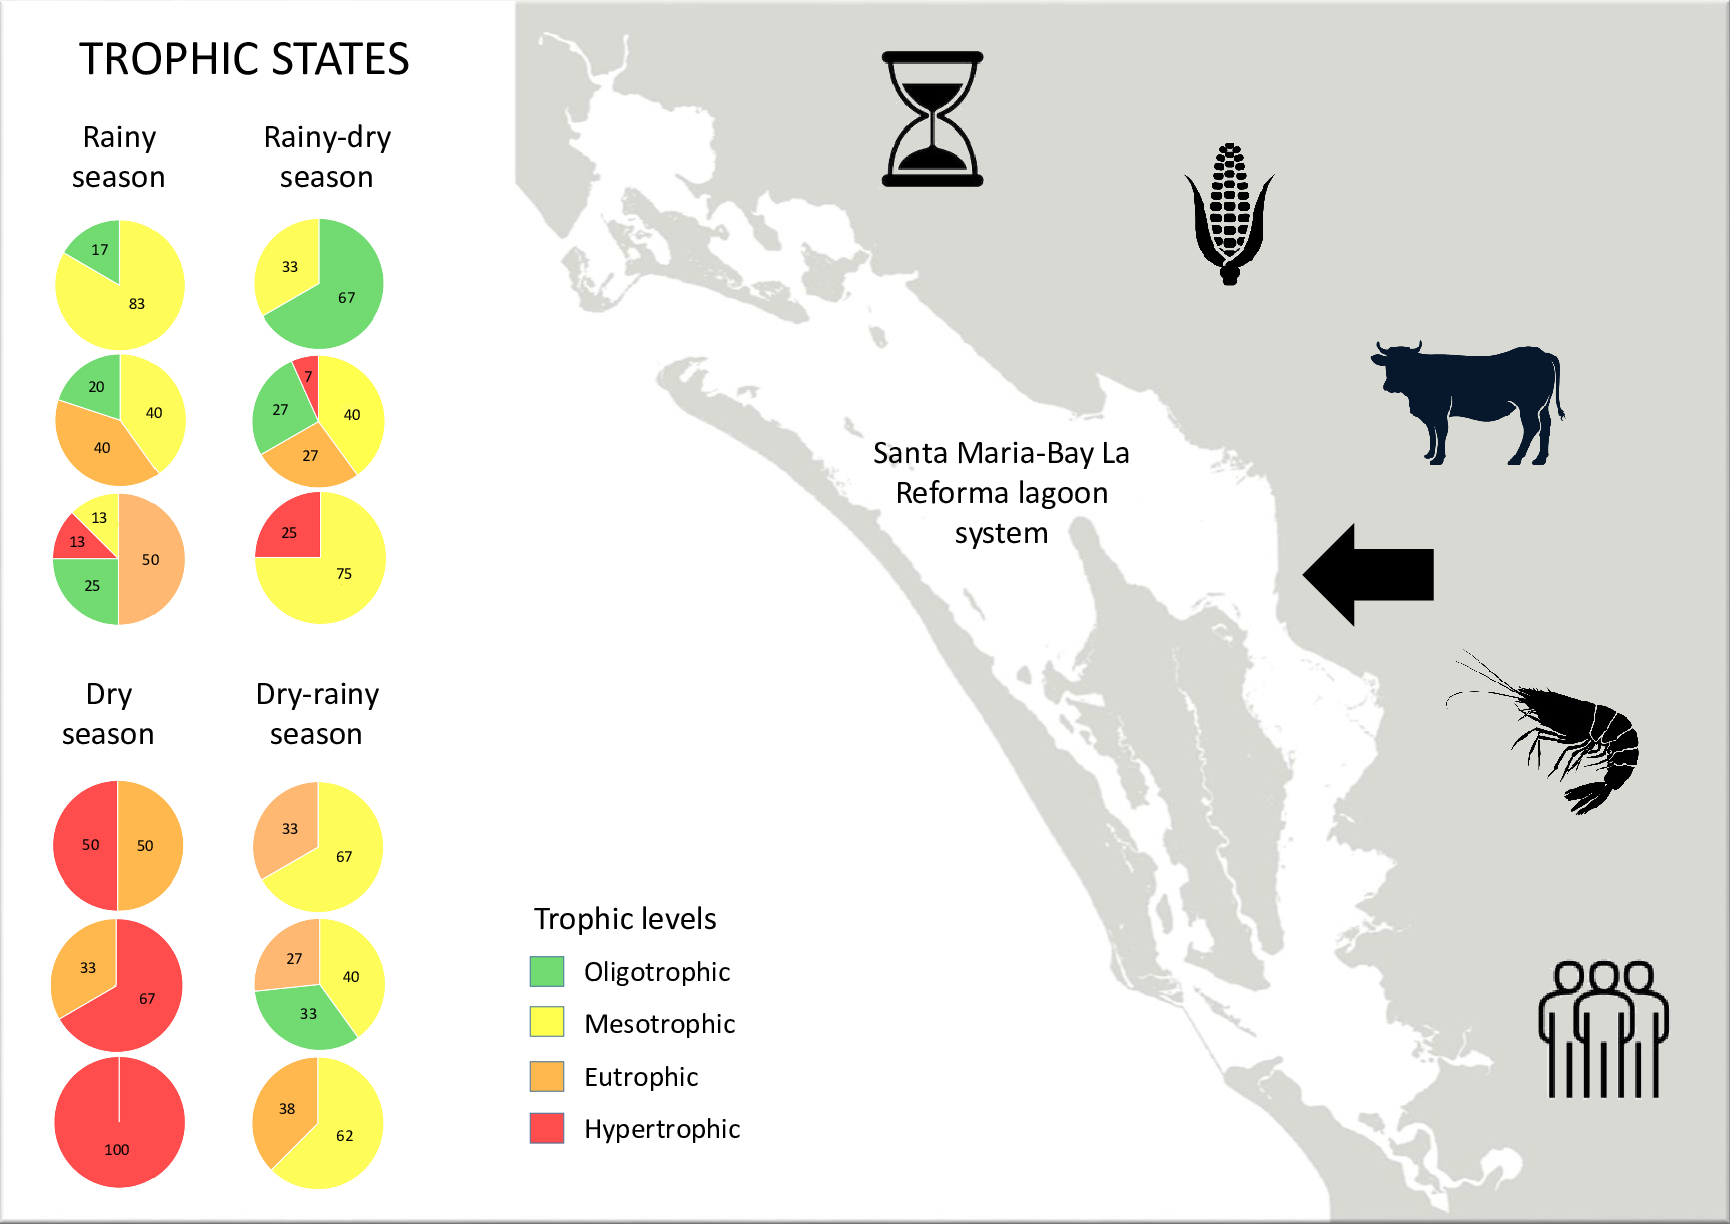
Considering the results of the analyzes obtained within the SMBLR lagoon system and the drains during the period of 2020-2021, the percentages of the trophic states were determined for the drains (Figure 9).
Regarding the trophic state for the total lagoon system SMBLR the percentages are found in Figure 10, including the Central Zone CZ.
During the rainy period (September 2020), the northern area of the SMBLR presented predominantly mesotrophic (83% of the stations) and oligotrophic (17%) conditions, while in the southern area, the 4 trophic states were present, with the predominant eutrophic (50%), followed by oligotrophic (25%) and with 13% the mesotrophic and hypertrophic states. Similarly, the drains in the southern zone present a higher level of hypertrophy (80%) compared to the northern zone, where 29% of hypertrophy occurred (the rest of the drains in each zone were oligotrophic).
Besides, during the transition period from rainy to dry (November 2020), a change to hypertrophy was observed in 100% of the drains in both areas. This enrichment coincides with what was observed in the southern zone of SMBLR, which presented the majority of stations with eutrophic (75%) and hypertrophic (25%) levels. In contrast, the northern area presented lower trophic levels in the bay, with 67% of the stations oligotrophic and 33% mesotrophic.
In the dry season (February 2021), The drains remained in a hypertrophic state in 100% of the stations in both areas, which was reflected in the bay, particularly in the southern area, which also presented 100% hypertrophy, while in the northern area, the trophic state was divided into 50% eutrophic and 50% hypertrophic.
For May 2021, corresponding to the transition season from dry to rainy, hypertrophy in the drains in the northern area remained at 100% of the stations, while in the southern area, 60% hypertrophic and 40% eutrophic were observed. In contrast, the lagoon system stations showed a significant decrease in their trophic state compared to the previous period.
Both zones were observed to be predominantly mesotrophic (63 and 67% for northern and southern zones, respectively) and eutrophic (38 and 33% for northern and southern zones, respectively).
The drains of the central zone presented 100% hypertrophy regardless of the sampling period.
However, the bay stations, in general, showed a greater diversity of trophic states compared to the northern and southern areas. Notably, the dry season (February 2021) coincided with the highest values of hypertrophy (67%) in the system, as observed for the other two areas.
In general, it was observed that the area with the greatest impact due to discharges to the lagoon system is the southern zone, followed by the northern zone and the central zone. The above can be related to anthropogenic activities that mainly affect the basins of the southern and northern areas.
Based on the description of these activities, it can be seen that agriculture and aquaculture have an important presence in both areas, but in particular livestock activity seems to have a greater presence in the basins that contribute to the south of SMBLR. The above suggests that, although the entire system presents a deteriorated trophic state, the influence of the water dynamics of the system modifies and is reflected in the zoning of the trophic states, both temporally and spatially.
Loading nutrients, trophic state and residence time: hydrodynamic model
The residence times are similar for the IP of the NZ and SZ due to the lower velocities in the SZ, in combination with shorter travel distances from the contaminant to the mouth. The path of the pollutant to the SM from points IP-1 and IP-2 is 7.8 and 8.5 km, respectively; The route to the NM from points IP-4, IP-5 and IP-6 is 12.4, 13.2 and 10.2 km, respectively, resulting in average pollutant propagation speeds of 1.0 m s-1 and 1.5 m s-1, for the SZ and NZ, respectively, speeds similar to those reported by Serrano et al. (2013) in the vicinity of both mouths (Figure 11a and 11b). The residence time is a function of the path of the contaminant from the IP to the mouths and the tidal condition in relation to the current it generates. The highest concentration of the contaminant in the SM emanated from IP-2. The highest concentration of the contaminant in the NM emanated from IP-6, followed by IP-5 and IP-4. An explanation for this result is that the four points are located in relatively closed places, within small bays, concentrating the contaminant in these areas in the tidal flow and when draining the drains (Figure 11a). At the ebb tide (Figure 11b), the parcel of water found in the bay is transported to the main channels, carrying with it the concentration of the contaminant towards the mouth (Figure 11c), the concentration towards the mouth decreases due to advection and molecular diffusion. On the other hand, the lowest concentrations in the SM and in the NM emanate from IP-1 and IP-3, respectively, points that are located in open places, making the accumulation of the contaminant difficult.
4. Discussion
4.1. Carrying Capacity
4.1.1. Historical Evaluation
Coinciding with this study, Montaño-Leyva and Soto-Jiménez (2019), calculated influence time using numerical models in SMBLR, the areas near the north mouth and south mouth have short influence times (less than 6 days), and in areas far from the mouths, on the opposite side of the lagoon, the influence time reaches 90 days due to poor horizontal mixing. Likewise, in Talchilitle, the influence time is 30-90 days because of the tide and the wind that drive the water towards the eastern part of the lagoon. The residence time estimated by tidal cycles for SMBLR in this study was 10 times lower than the maximum Rt recorded for Huizache-Caimanero and Chametla, Sinaloa (Martínez-López et al., 2013) and is also lower than most records of Rt or numerical models for the same SMBLR (Montaño-Leyva and Soto-Jiménez, 2019) and other coastal lagoons in the world (Umgiesser et al., 2014). However, the lowest values of Rt for SMBLR were recorded for the dry season in this study. The residence time values collected from studies carried out at SMBLR since 2006 are highly variable, their range is from 0.2 to 90 days; this is due to the time of analysis, the estimation method, whether through tidal cycles or numerical modeling was used (Montaño-Leyva and Soto-Jiménez, 2019).
Coastal lagoons can act as sinks or sources of nutrients, nitrogen, phosphorus, and other micronutrients and pollutants (Menció et al., 2023). Therefore, it is important to evaluate the trophic state and the point and non-point sources of nutrients and contaminants, since these ecosystems are providers of ecosystem services to coastal communities such as water, habitat, food, carbon sequestration, etc. (Newton et al., 2018).
SMBLR is a coastal lagoon that acts as a sink for DIN in the rainy and dry-rain transition seasons, whereas it is a source of DIN in the rainy-dry and dry seasons. Coastal lagoons of Sinaloa exhibit different behavior due to their hydrodynamics, number of mouths, geomorphology, depth, presence of bars, etc. In the case of the Santa María lagoon, located 140 km northwest of SMBLR, it is a DIN sink during the four seasons of the year, while in this study, DIN transfer rates for SMBLR were higher during the rainy period, similar to those observed in Santa María Lagoon (Medina-Galván et al., 2022). Santa María lagoon is less extensive and shallower than SMBLR, however it is also mesotrophic and receives discharges of anthropogenic origin (Medina-Galván et al., 2022).
Regarding fluxes of dissolved inorganic phosphorus (DIP), Martínez-López et al. (2013) and Lechuga-Devéze et al. (2006) showed that SMBLR maintained a DIP source operation throughout the year, contrary to our study, since the system worked as a sink throughout almost the entire study period, except in the rainy-dry transition season when the system behaved like a source of DIP with higher transfer rates in the rainy period, however, they were lower in the present study than in that of the aforementioned authors (Table II and Table III). In other coastal lagoons such as Santa María, DIP was a sink in the summer, coinciding with our results; however, in winter it was the opposite since it worked as a source in the winter (Medina-Galvan et al., 2022).
Regarding net ecosystem metabolism NEM, Martínez-López et al. (2013) reported heterotrophic metabolism in SMBLR, which is contrary to what was observed in the present study since autotrophic metabolism was observed in most seasons except in the rainy-dry transition where it was heterotrophic with the highest rate of heterotrophy recorded (Table II and Table III). Different behavior of the net metabolism was observed in another coastal lagoon of Sinaloa, Santa María, in which, during the summer, it was autotrophic, and in the winter, it was heterotrophic (Medina-Galvan et al., 2022).
Denitrification (HD) reported by Lechuga-Devéze et al. (2006) and Martínez-López et al. (2013) for the rainy season was consistent with net heterotrophic metabolism. For this study, net autotrophic metabolism corresponded to nitrogen fixation for the dry season and dry-rainy season, except for the rainy season when a net autotrophic metabolism rate corresponded to denitrification. An extremely high rate of net heterotrophic metabolism in the rainy-dry transition season corresponded to the extremely high rate of denitrification compared to those found in coastal lagoons and marshes (up to 99 mmol m-2 day-1, Caffrey et al., 2007) (Table III). On the other hand, Martínez-López et al. (2013) reported the lowest values in SMBLR for nutrient flux, net metabolism, and N2 fixation-denitrification rates.
The SMBLR is an important coastal ecosystem that supports human activities such as fishing, shrimp farming, and agriculture, among others. However, the constant discharges of wastewater from these activities have exerted considerable pressure on its carrying capacity due to its high concentrations of N and P. Over the years, studies have been carried out on its carrying capacity at different times, such as those by Lechuga-Devéze et al. (2006) and those by Martínez-López et al. (2013). Their results were compared to ones obtained in the present study, and it was observed that the residence times in most cases showed a similarity; however, the long renewal time that the SMBLR exhibits in the dry-rainy season can be explained due to various factors that cause changes in the hydrology of the system. Such as, for example, increases or decreases in flows of continental, oceanic, and atmospheric origin: wastewater discharges, river discharge, tides, evaporation, and precipitation rates (Brenes et al., 2007; Valenzuela-Sui et al., 2007). Therefore, variations in residence times can be influenced both spatially and temporally (González-Hernández and López-Monroy, 2020). The results of the present study indicate that SMBLR retains and exports nutrients at higher transfer rates compared to previous studies by Lechuga-Devéze et al. (2006) and Martínez-López et al. (2013). For instance, the maximum transfer rate of DIN was estimated at -120.94 mmol m-2 day-1 and of DIP at -5.57 mmol m-2 day-1, corresponding to the rainy period. This suggests that at this season, the overland flow is fertilizing the lagoon, probably due to the expansion of agricultural and aquaculture activities, thus increasing the volume of agricultural wastewater, also increasing the nutrient load, and, in addition, the high rates of precipitation that affects the lagoon system. The NEM demonstrated that the SMBLR is a producer of organic matter and differs from the heterotrophic NEM observed by Lechuga-Devéze et al. (2006) and Martínez-López et al. (2013). According to Cabral and Fonseca (2019), these spatiotemporal changes of the NEM in coastal lagoons and estuaries may be due to the influence of high contributions of nutrients of anthropogenic origin, where high rates of autotrophy and heterotrophy can favor eutrophication processes (Testa et al., 2012). On the other hand, in this study, the N2 fixation processes exceed the denitrification processes, contrary to what Lechuga-Devéze et al. (2006) found and Martínez-López et al. (2013) where denitrification processes were higher than N2 fixation. However, the magnitudes in these processes were higher in the present study (Table II and Table III). Estimates of residence times, nutrient dynamics, and net metabolism of coastal lagoons help us understand the changes in the functioning and vulnerability of these ecosystems to anthropogenic pressures over time (Camacho-Ibarra and Rivera-Monroy, 2014). In this sense, pristine coastal lagoons are useful for making comparisons with coastal lagoons receiving wastewater to understand the biogeochemical processes and understand the degree of fragility of these ecosystems. (Smith et al., 2012). To better understand the loading capacity of the SMBLR, a comparison of the results obtained were compared with those observed by Medina-Galvan et al. (2021) in El Soldado lagoon, a pristine system located in a subtropical semiarid region of the Gulf of California, where longer residence times with low N and P transfer rates are exhibited, as well as production-respiration and fixation-denitrification processes lower than those reported in the present study, which shows that although SMBLR is more dynamic by having shorter residence times, it is strongly influenced by the volume of water and the nutrient load from the drains, causing alterations in nutrient fluxes and in the net metabolism of the ecosystem.
4.1.2. Present Day Evaluation
The water and salt balance of SMBLR is influenced by the inflow of wastewater, rain, and losses via evaporation. The volume of wastewater that enters the system is greater than the losses due to evaporation; therefore, the lagoon presents a surplus of water that affects the ebb and flow of the tide by exceeding the losses by more than 70 orders of magnitude by evaporation. For this effect, considerably low water renewal rates were observed throughout the entire study period (average: 0.4 days). This pattern was also observed by Torregroza-Espinosa et al. (2020) in the Bocas de Cenizas Estuary, Colombia, influenced by the high volumes of wastewater that enter the system and the modifications that the estuary has suffered due to human activities. On the other hand, in the dry-rainy transition season, the highest rate (20 days) is attributed to the fact that evaporation losses increased and the volume of precipitation decreased. Also, the salinity of the wastewater was higher. It coincided with the greatest difference in salinities between the sea and the lagoon, so at this time, the volume of water exchange (Vx) between the sea and the lagoon was significantly reduced. As Villate and Ruiz (1989) explain, the water renewal rate is a factor that is associated with salinity, showing a tendency to increase in periods of higher saline concentration. On the east coast of the Gulf of California, there are coastal lagoons that are subject to agricultural, shrimp farming, and human settlement activities which generate wastewater that is destined for coastal lagoons and cause negative changes in the natural hydrological balance (Valenzuela-Siu et al., 2007; Ruiz-Ruiz et al., 2017; Medina-Galván et al., 2021). As such, residence time is a fundamental factor in determining the environmental health of coastal lagoons receiving wastewater (Béjaoui et al., 2022).
Estimates of nutrient fluxes showed that the largest contribution of DIN and DIP to the SMBLR comes from wastewater. The highest DIN load was recorded during the rainy season. In general, in the rainy and dry-rainy seasons, the SMBLR retains 97% of DIN that enters from wastewater, and in dry and rainy-dry seasons, it exports 59%. With respect to phosphorus, in almost the entire study period, the SMBLR retained 89% of it and was completely exported (100%) during the rainy-dry transition. The flows showed that the SMBLR functions as a source of DIN in rainy-dry transition and dry season and of DIP only in rainy-dry transition. On the other hand, it works as a sink for DIN in rainy and dry-rainy weather and for DIP in rainy, dry, and dry-rainy weather. The highest DIN and DIP transfer rates in the rainy season function as a sink. This behavior of the SMBLR is consistent with that reported by Romero-Beltrán et al. (2014) where DIN fluxes show that the lagoon system functions as a source and DIP fluxes show that the lagoon system functions as a sink. These results show that as the load of nutrients of anthropogenic origin increases, the export and import rate of DIN and DIP increases, maintaining a direct relationship. It has been shown that high concentrations of N and P are related to the excessive use of fertilizers on agricultural land, aquaculture activities, and urban waste (Aouissi et al., 2014). Therefore, the dynamic character between the source and sink of the lagoon occurs in response to the load of nutrients contained in the wastewater. Medina-Galvan et al. (2022) showed that in the Santa María lagoon, Sinaloa (located north of SMBLR), the highest transfer rates occurred during the summer, acting as a sink due to the contribution of nutrients by wastewater. This behavior has also been observed in other subtropical coastal lagoons of the Gulf of California, such as Laguna Lobos, Sonora, while it responded with an increase in the fluxes of DIN and DIP, functioning as a sink for the contribution of nutrients from wastewater (Valenzuela -Siu et al., 2007). Likewise, the El Rancho lagoons, which receive shrimp effluents, and El Soldado, Sonora, which receive nutrients from coastal upwelling, functioned as sinks during the time of greatest increase in the nutrient load (Medina-Galvan et al., 2021).
The net metabolism of the ecosystem (NEM) of the SMBLR lagoon was autotrophic, with nitrogen fixation processes occurring during the rainy, dry, and dry-rainy periods. While in dry rains, it had a heterotrophic metabolism with predominance in denitrification processes. Swaney et al. (2011) point out that the net metabolism of the ecosystem evaluated with the LOICZ model is a function of residence times, where heterotrophic conditions occur at long residence times. In our study, it was observed that the SMBLR is a net producer of organic matter in short (0.4 days) and long (20 days) times, and the greater retention of DIN favors the N2 fixation process, which implies a prevalence of organic matter production over respiration processes and N2 fixation over denitrification. These results coincide with those of Romero-Beltrán et al. (2014) where the annual estimate of the NEM has been 0.44 mmol C m-2 day-1 and nitrogen fixation at 1.89 mmol m-2 day-1. The SMBLR has highly productive waters due to the entry of dissolved inorganic nutrients from agricultural and shrimp drains. This means that the high rates of autotrophy (590.5 mmol C m-2 day-1) and heterotrophy (-1684.6 mmol C m-2 day-1) exhibited by SMBLR show the negative impact that wastewater has generated by exceeding the load capacity of the system. An example of this is the TRIX trophic status index which has revealed a mesotrophic to hypertrophic status in the SMBLR, with the highest levels near the mouth of the drains (Romero-Beltrán et al., 2014; Reyes-Velarde et al., 2023). These high NEM values are consistent with those observed in coastal lagoons impacted by human activities, such as the Caloosahatchee Estuary, USA (Buzzelli et al., 2013), Piratininga-Itaipu lagoon system, Brazil (Cerda et al., 2013), Courland lagoon, Lithuania (Vybernaite-Lubiene et al., 2022) and Ichkeul lagoon, Africa (Béjaoui et al., 2022).
4.2. Integrative Data Analysis
While the growth rate of agricultural activity decreased in the period 2007-2014, it had a slight rebound in the period 2014-2019 of close to 50% in the northern zone and is incipient in the southern zone for the same period (Figure 12). According to the historical analysis of the economic activities carried out in the SMBLR sub-basins, it is observed that in the period 2007-2014, the growth rate of livestock activity dominated in a similar way in the northern zone and the southern zone (Figure 12a and 12b).
However, a very drastic change occurred in the period 2014-2019 as the growth of livestock activity decreased, and aquaculture dominated mainly in the northern zone and in the central-southern zone of the lagoon system basin with a rate of growth of up to 250% (Figure 12c and 12d).
On the other hand, the population tends to decrease in the SMBLR basin in the southern area in both periods analyzed, probably due to labor displacement (Del-Río et al. 2016) or problems due to violence (Gobierno de México, 2022).
This highlights the need to design and implement a comprehensive management plan for SMBLR that involves all actors who participate in production chains and decision-making. In particular, mechanisms and incentives must be established for agricultural, cattle raising, livestock, and aquaculture producers to control and adequately treat runoffs and effluents resulting from their activities. As a result of this analysis, the beginning of management by actors and decision makers for the improvement of production practices with a positive impact on the profitability of operations under a circular economy approach would be expected. Together with the participation of the authorities responsible for environmental monitoring, the intervention actions will help to reduce the influx of nutrients and other pollutants into an ecosystem that affects the carrying capacity of the lagoon. This is demonstrated in this study since although SMRLR is mostly an autotrophic system, there are signs that the carrying capacity at some seasons of the year has been exceeded and the adverse ecological and socioeconomic effects in the basin are evident.
5. Conclusions
SMBLR behaves as a phosphorous sink during the year with transitional nitrogen changes from sink to source. This condition intensifies during the rainy season, with higher nitrogen and phosphorous loads toward the lagoon. The net metabolism of the ecosystem is mainly autotroph with clear nitrogen fixation processes. Annual water renewal times were close to 5.3 days.
The trophic state of the lagoon was mainly mesotrophic towards eutrophic, whereas the drains showed eutrophic to hypertrophic trophic conditions with enough productivity to maintain aquaculture projects and fishing activities.
It is essential to highlight the eutrophic to hypertrophic state in northern and southern zones during the dry season. However, especially in the rainy-dry transition season, when the maximum heterotrophy value and high denitrification are present, indicate that it is not possible to put further pressure on the use and exploitation of the lagoon’s resources.
The historical economic analysis of sub-basins showed that agricultural, livestock, and aquaculture activities constantly increase. This analysis also revealed a nutrient increase with time, mainly due to nitrogen and phosphorous concentrations. These high nitrogen and phosphorus concentrations modify the nutrient rates, the system’s net metabolism, and nitrogen fixation and denitrification.
Author Contributions
O. Calvario-Martínez: Investigation, Conceptualization, Methodology, Supervision, Visualization, Validation, Writing-original draft, Writing-review & editing. J. Medina-Galvan: Investigation, Methodology, Visualization, Validation, Writing-original draft, Writing-review & editing. V.P. Dominguez-Jiménez: Investigation, Methodology, Data curation, Validation, Writing-review & editing. M.A. Sánchez-Rodríguez: Investigation, Methodology, Validation, Writing-review & editing. R. Alonso-Rodríguez: Investigation, Validation, Writing-original draft, Writing-review & editing. P.M. Reyes-Velarde: Investigation, Methodology, Formal analysis, Data curation, Writing-review & editing. M. Betancourt-Lozano: Investigation, Validation, Writing-original draft, Writing-review & editing. D.E. Serrano-Hernández: Formal analysis, Writing–review & editing.
Acknowledgments
This research did not receive any specific grant from funding agencies in the public, commercial, or non-profit sectors. We are grateful to CIAD and ICML UNAM for supporting this research. This work is a contribution of Marine-Coastal Research Stressors Network for Latin America and the Caribbean (REMARCO, www.remarco.org).
Conflicts of Interest
The authors declare that they have no known competing financial interests or personal relationships that could have appeared to influence the work reported in this paper.
References
- Acosta-Velázquez, J. & Vázquez-Lule, A. D. (2009). Caracterización del sitio de manglar Santa María - La Reforma, en Comisión Nacional para el Conocimiento y Uso de la Biodiversidad (CONABIO). Sitios de manglar con relevancia biológica y con necesidades de rehabilitación ecológica. CONABIO, México, D.F., 18 pp.
- Anthony, A., Atwood, J., August, P., Byron, C., Cobb, S., Foster, C., Fry, C., Gold, A., Hagos, K., Heffner, L., Kellogg, D. Q., Lellis-Dibble, K., Opaluch, J. J., Oviatt, C., Pfeiffer-Herbert, A., Rohr, N., Smith, L., Smythe, T., Swift, J., & Vinhateiro, N. (2009). Coastal lagoons and climate change: ecological and social ramifications in U.S. Atlantic and Gulf coast ecosystems. Ecology and Society 14(1), 8. [online] URL: http: //www.ecologyandsociety.org/vol14/iss1/art8/.
- Aouissi, J., Benabdallah, S., Lili, C. Z., & Cudennec, C. (2014). Modelling water quality to improve agricultural practices and land management in a Tunisian catchment using soil and water assessment tool. Journal of Environmental Quality 43, 18–25.
- Béjaoui, B., Basti, L., Canu, D.M., Feki-Sahnoun, W., Salem, H., Dahmani, S., Sahbani, S., Benabdallah, S., Blake, R., Norouzi, H., & Solidoro, C. (2022). Hydrology, biogeochemistry and metabolism in a semi-arid mediterranean coastal wetland ecosystem. Scientific. Reports, 12, p. 9367. [CrossRef]
- Brenes, C., Hernández, A., & Ballesteros, D. (2007). Flushing time in Perlas Lagoon and Bluefields Bay, Nicaragua. Investigaciones Marinas 35(1), 89-96.
- Bui, L. T., & Tran, D.L.T. (2022). Assessing marine environmental carrying capacity in semi-enclosed coastal areas - Models and related databases. Science of The Total Environment 838 (Part 1), 156043. [CrossRef]
- Buzzelli, C., Wan, Y., Doering, P.H., & Boyer, J. N. (2013). Seasonal dissolved inorganic nitrogen and phosphorus budgets for two subtropical estuaries in South Florida, USA. Biogeosciences, 10, 6721–6736. [CrossRef]
- Cabral, A., & Fonseca, A. (2019). Coupled effects of anthropogenic nutrient sources and meteo-oceanographic events in the trophic state of a subtropical estuarine system. Estuarine Coastal and Shelf Science 225, 106228. [CrossRef]
- Caffrey, J.M., Murrell, M.C., Wigan, C., McKinney, R. (2007). Effect of nutrient loading on biogeochemical and microbial processes in a New England salt marsh Biogeochemistry, 82, 251–264. [CrossRef]
- Camacho-Ibarra, V. F., & Rivera-Monroy, V. H. (2014). Coastal Lagoons and Estuaries in Mexico: Processes and Vulnerability. Estuaries and Coasts, 37, 1313-1318.
- Cerda, M., Barboza, C.D.N., Carvalho, C.N., Jandre, K.A., & Marques, A.N. (2013). Nutrient Budget sinthe Piratininga–Itaipu lagoon system (southeastern Brazil): effects of sea-exchange management. Latin American Journal of Aquatic Research, 41(2), 226–238.
- Cervantes-Duarte, R. (2016). Nutrient fluxes and net metabolism in a coastal lagoon SW peninsula of Baja California, Mexico. Revista Bio Ciencias 4(2), 104-115.
- CESASIN. (2023). Reporte de producción: Ciclos de cultivo 2003-2019 proporcionado por CESASIN (Comité Estatal de Sanidad Acuícola de Sinaloa). Culiacán, Sinaloa. Archivos en Excel.
- Clarke, A.L. (2002). Assessing the Carrying Capacity of the Florida Keys. Population and Environment 23, 405–418.
- Cloern, J. E. (2001). Review our evolving conceptual model of the coastal eutrophication problem. Marine Ecology Progress Series 210, 223–253.
- CONABIO (2014). Red hidrográfica, subcuencas hidrográficas de México, escala 1:50000. Edición 2.0. En Red Hidrográfica. Instituto Nacional y Geografía. 2010. Comisión Nacional para el Conocimiento y Uso de la Biodiversidad. México. http://geoportal.conabio.gob.mx/metadatos/doc/html/redsub84gw.html. Accessed on August 28th, 2024.
- CONAPESCA (2024). Produce México más de 1 millón 900 mil toneladas de especies pesqueras y acuícolas en 2023. https://www.gob.mx/conapesca/es/articulos/registra-mexico-buena-produccion-pesquera-y-acuicola-en-el-2023?idiom=es#:~:text=Durante%20el%202023%2C%20M%C3%A9xico%20produjo,)%2C%20inform%C3%B3%20Octavio%20Almada%20Palafox. Accessed on October 16th, 2024.
- Crank, J. (1979). The mathematics of diffusion. Oxford Science Publications. Second edition. 414 pp.
- Del Río, S., M., Martínez-Durazo, A., & Jara-marini, M.E. (2016). The aquaculture and their impact in the coastal zone of the Gulf of California. Revista de Ciencias Biológicas y de la Salud, Universidad de Sonora, 18 (3), 37-46.
- Delhez, E.J.M., de Brye, B., de Brauwere, A., & Deleersnijder, E. (2014). Residence time vs influence time. Journal of Marine Systems 132, 185–195.
- Espejo, R. P., Ibarra, A. A., Hansen, A. M., Rodríguez, C. G., Márquez, L. C. G., González, M. B., Baca, A. S., & Durán, A.J. (2012). Agricultura y contaminación del agua. 1 Ed. 288 p., UNAM Instituto de Investigaciones Económicas, México, ISBN: 9786070235504.
- Esqueda, G. S. T., & Rivera, J. C. G. (2004). Saneamiento de las Aguas Costeras. In: E. R. Arriaga, G. J. V. Zapata, I. A. Adeath & F. R. May (eds.), El Manejo Costero en México, pp. 253-275, Universidad Autónoma de Campeche / SEMARNAT / CETYS Universidad / Universidad de Quintana Roo, Ensenada / Campeche, México, ISBN: 9685722129.
- FAO (2022). El estado mundial de la pesca y la acuicultura 2022. Hacia la transformación azul. Roma, FAO. [CrossRef]
- Gobierno de México (2022). Desplazamiento forzado interno en México: del reconocimiento a los desafíos. Gobierno de México, Secretaría de Gobernación, Subsecretaría de Derechos Humanos, población y migración. 192 p.
- González-Hernández, A.D., & López-Monroy, F. (2020). Modelaje de la interacción entre el humedal RAMSAR laguna de La Restinga (Isla de Margarita, Venezuela) y el Mar Caribe. Boletín del Centro de Investigaciones Biológicas 54 (2), 145-163.
- Gordon Jr., D. C., Boudreau, P. R., Mann, K. H., Ong, J. E., Silvert, W. L., Smith, S. V., Wattayakorn, G., Wulff, F., & Yanagi, T. (1996). LOICZ Biogeochemical modelling guidelines. LOICZ/R&S/95-5, VI +96 pp. LOICZ, Texel, The Netherlands. https://iwlearn.net/documents/3943.
- INEGI (2020). Instituto Nacional de Estadística y Geografía. Principales resultados por localidad (ITER) 2020. https://www.inegi.org.mx/app/scitel/Default?ev=9.
- INEGI (2023). División política municipal, 1:250000. 2022, escala 1:250000. Instituto Nacional de Estadística y Geografía. México.
- Jara-Marini, M. E., Molina-García, A., Martínez-Durazo, A. & Páez-Osuna, F. (2020). Trace metal trophic transference and biomagnification in a semiarid coastal lagoon impacted by agriculture and shrimp aquaculture. Environmental Science and Pollution Research 27(6), 1-14. [CrossRef]
- Kiwango, H., Njau, K. N., & Wolanski, E. (2018). The application of nutrient budget models to determine the ecosystem health of the Wami Estuary, Tanzania. Ecohydrology and Hydrobiology. 18 (2), 107–119. [CrossRef]
- Lechuga-Devéze, C., Mendoza-Salgado, R., Bustillos-Guzman, J., Salinas-Zavala, C., Diaz-Rivera, E., Beltran-Camacho, C., Amador-Silva, E., Salinas-Zavala, F., Bautista-Romero, J., Balart-Paez, E., Caraveo-Patiño, J., Estrada-Enriquez, C., Pacheco-Ayub, C., Rodríguez-Villeneuve, A., Maya-Delgado, Y., González-Zamorano, P., Rivera-Rosas, J., Magallon-Barajas, F., & Portillo-Clarck, G. (2006). Programa Nacional de Diagnóstico de los Ecosistemas Costeros: Sinaloa, I Nivel Sistema Lagunar. Procuraduría Federal de Protección al Ambiente, Programa Nacional de Diagnóstico de los Ecosistemas Costeros (PNDEC). 211 pp.
- Liu, Y., & McNeil, S. (2020). Using Resilience in Risk-Based Asset Management Plans. Transportation Research Record, 2674 (4), 178-192. [CrossRef]
- López-Monroy, F. & Troccoli-Ghinaglia, L. (2017). Modelaje de la interacción entre la laguna costera tropical Las Marites (Isla de Margarita, Venezuela) y el Mar Caribe adyacente. Ciencias Básicas y Tecnología 29, 534-545.
- Marinov, D., Miladinova, S., & Marinski, J. (2014). Assessment of material fluxes in aquatorium of Burgas Port (Bulgarian black sea coast) by LOICZ biogeochemical model. In: 3rdIAHR Europe Congress, Book of Proceedings. Portugal. p. 1-10.
- Martínez-López, A., Escobedo-Urías, D. C., Chiquete-Ozono, A. Y., & Bañuelos-Valles, J. L. (2013). Estudio Ambiental – Estudio de capacidad de carga de la actividad acuícola en el Sistema lagunar Santa María. Comisión Nacional de Áreas Naturales Protegidas. Informe Final, 23 p.
- Medina-Galván, J., Osuna-Martínez, C. C., Padilla-Arredondo, G., Frías-Espericueta, M. G., Barraza-Guardado, R. H., & Arreola-Lizárraga, J. A. (2021). Comparing the biogeochemical functioning of two arid subtropical coastal lagoons: the effect of wastewater discharges. Ecosystem Health and Sustainability 7(1), 1892532. [CrossRef]
- Medina-Galván, J., Osuna-Martínez, C. C., Padilla-Arredondo, G., Frías-Espericueta, M. G., Barraza-Guardado, R. H., León-Cañedo, J. A., & Arreola-Lizárraga, J.A. (2022). Estado trófico, dinámica de nutrientes y metabolismo neto de una laguna costera subtropical (Golfo de California) receptora de aguas residuales. Revista Internacional de Contaminación Ambiental, 38, 449-463. [CrossRef]
- Menció, A., Madaula, E., Meredith, W., Casamitjana, X., & Quintana, X.D. (2023). Nitrogen in surface aquifer - Coastal lagoons systems: Analyzing the origin of eutrophication processes. Science of The Total Environment, 871, 161947. [CrossRef]
- Miharja, M., & Arsallia S. (2017). Integrated Coastal Zone Planning Based on Environment Carrying Capacity Analysis CITIES 2016 IOP Publishing IOP Conf. Series: Earth and Environmental Science, 79012008. [CrossRef]
- Monsen, N. E., Cloern J. E., Lucas. L.V., (2003). A comment on the use of flushing time, residence time and age as transport time scales. Limnology and Oceanography 47(5), 1545–1553.
- Montaño-Ley, Y., & Soto-Jiménez M.F. 2019. A numerical investigation of the influence time distribution in a shallow coastal lagoon environment of the Gulf of California. Environmental Fluid Mechanics (2019) 19, 137–155. [CrossRef]
- Newton, A., Brito, A. B., Icely, J.D., Derolez, V., Clara, I., Angus, S., Schernewski, G., Inácio, M., Lillebø, A.I., Sousa, A.I., Béjaoui, B., Solidoro, C., Tosic, M., Cañedo-Argüelles, M., Yamamuro, M., Reizopoulou, S., Tseng, H.-C., Canu, D., Roselli, l., Maanan, M., Cristina, S., Ruiz-Fernández, A.C., Lima, R.F., Kjerfve, B., Rubio-Cisneros, N., Pérez-Ruzafa, A., Marcos, C., Pastres, R., Pranovi, F., Snoussi, M., Turpie, J., Tuchkovenko, Y., Dyack, B., Brookes, J., Povilanskas, R., & Khokhlov, V. (2018). Assessing, quantifying and valuing the ecosystem services of coastal lagoons, Journal for Nature Conservation, 44, 50-65. [CrossRef]
- Newton, A., Icely, J., Cristina, S., Perillo, G. M. E., Turner, R. E., Ashan, D., Cragg, S., Luo, Y., Tu, C., Li, Y., Zhang, H., Ramesh, R., Forbes, D. L., Solidoro, C., Béjaoui, B., Gao, S., Pastres, R., Kelsey, H., Taillie, D., Nhan, N., Brito, A. C., de Lima, R. & Kuenzer, C. (2020). Anthropogenic, Direct Pressures on Coastal Wetlands. Frontiers in Ecology and Evolution 8,144. [CrossRef]
- Páez-Osuna, F., Ramírez-Reséndiz, G., Ruiz-Fernández, A., & Soto-Jiménez, M. (2007). La contaminación por nitrógeno y fósforo en Sinaloa: flujos, fuentes, efectos y opciones de manejo. Instituto de Ciencias del Mar y Limnología, Universidad Nacional Autónoma de México. Serie Lagunas Costeras de Sinaloa, pp. 121-128.
- Pérez-Ruzafa, A., Pérez-Ruzafa, I., Newton, A., & Marcos, C. (2019). Coastal lagoons: environmental variability, ecosystem complexity, and goods and services uniformity. In: Coasts and Estuaries – the future. Eds. E. Wolanski, J. Day, M. Elliott & R. Ramachandran. Elsevier, U.K. 726 pp. [CrossRef]
- Redfield, A. C. (1934). On the Proportions of Organic Derivatives in Sea Water and Their Relation to the Composition of Plankton. James Johnstone Memorial Volume, University Press of Liverpool, 176-192.
- Reyes-Velarde, P. M., Alonso-Rodríguez, R., Domínguez-Jiménez V. P., & Calvario-Martínez, O. (2023). The spatial distribution and seasonal variation of the trophic state TRIX of a coastal lagoon system in the Gulf of California. Journal of Sea Research, 193, 102385. [CrossRef]
- Reyes-Velarde, P.M. (2022). Evaluación espacio-temporal del estado trófico en Bahía Santa María-La Reforma (MSc. Thesis). Centro de Investigación en Alimentación y Desarrollo, Mazatlán, Sinaloa, 91 p.
- Rodríguez-Zúñiga, M. T., C. Troche-Souza, A. D., Vázquez-Lule, J. D., Márquez-Mendoza, B., Vázquez- Balderas, L., Valderrama-Landeros, S., Velázquez-Salazar, M. I., Cruz-López, R. Ressl, A., Uribe-Martínez, S., Cerdeira-Estrada, J., Acosta-Velázquez, J., Díaz-Gallegos, R., Jiménez-Rosenberg, L., Fueyo-Mac Donald, L. & Galindo-Leal, C. (2013). Manglares de México/Extensión, distribución y monitoreo. Comisión Nacional para el Conocimiento y Uso de la Biodiversidad. México D.F., 128 pp.
- Romero-Beltrán, E., Aldana-Flores, G., Muñoz-Mejía, E. M., Medina-Osuna, P. M., Valdez-Ledón, P., Bect-Valdez, J. A., Gaspar-Dillanes, M. T., Huidobro-Campos, L., Romero-Correa, A., Tirado-Figueroa, E., Saucedo-Barrón, C. J., Osuna-Bernal, D. A., & Romero-Mendoza, N. (2014). Informe de Investigación: Estudio de la calidad del agua y sedimento en las lagunas costeras del estado de Sinaloa, México. Instituto Nacional de Pesca, Instituto Sinaloense de Acuacultura y Pesca, 191 pp.
- Ruiz-Ruiz T. M., Arreola-Lizárraga J. A., Morquecho L., Méndez-Rodríguez L. C., Martínez-López A., & Mendoza-Salgado, R. A. (2017). Detecting eutrophication symptoms by means of three methods in a subtropical semi-arid coastal lagoon. Wetlands 37, 1105-1118. [CrossRef]
- SADER (2020). Agricultura. Secretaria de Agricultura y Desarrollo Rural. Infografía agroalimentaria del estado de Sinaloa. https://estadisticas.sinaloa.gob.mx/documentos/Infografiasagroalimentarias/Sinaloa-Infografia-Agroalimentaria-2020.pdf. Accessed on September 14th, 2024.
- SEMARNAT (2015). Acuerdo por el que se da a conocer el resultado de los estudios técnicos de aguas nacionales superficiales de la Subregión Hidrológica Río Fuerte de la Región Hidrológica número 10 Sinaloa. Secretaría de Medio Ambiente y Recursos Naturales, Comisión Nacional de Mejora Regulatoria. Diario Oficial de la Federación, 11 de marzo 2015, México.
- Serrano, D., Ramírez-Félix, E., & Valle-Levinson, A. (2013). Tidal hydrodynamics in a two-inlet coastal lagoon in the Gulf of California. Continental Shelf Research, 63, 1-12. [CrossRef]
- SIAP (2023a). Anuario estadístico de la producción agrícola: Gobierno de México. https://nube.siap.gob.mx/cierreagricola/. Accessed on October 16th, 2024.
- SIAP (2023b). Anuario Estadístico de la producción Ganadera: Gobierno de México. https://nube.siap.gob.mx/cierre_pecuario/. Accessed on November 10th, 2024.
- SIS-RAMSAR (2004). Servicio de Información sobre Sitios Ramsar. Laguna Playa Colorada-Santa María la Reforma. 02-02-2004. Ramsar. https://rsis.ramsar.org/es/ris/1340?language=es. Accessed on October 22nd, 2024.
- Smith, J., Burford, M. A., Revill, A. T., Haese R. R., & Fortune, J. (2012). Effect of nutrient loading on biogeochemical processes in tropical tidal creeks. Biogeochemistry 108, 359-380.
- Swaney, D. P., Smith, S. V., & Wulff, F. (2011). The LOICZ Biogeochemical modelling protocol and its application to estuarine ecosystems. In Estuarine and Coastal Ecosystem Modelling, edited by D. Baird and A. Mehta, 135–160. Amsterdam: Academic Press.
- Testa, J. M., Kemp, W. M., Hopkinson, C. S., & Smith, S. V. (2012). Ecosystem Metabolism. In J. W. Day, B. C. Crump, W. M. Kemp, & A. Yáñez-Arancibia (Eds.), Estuarine Ecology (pp. 381–416). Hoboken, NJ: Wiley, Inc. https://doi.org/10.1002/9781118412787.ch15. [CrossRef]
- Torregroza-Espinosa, A. C., Restrepo, J. C., Escobar, J., Brenner, M., & Newton, A. (2020). Nutrient inputs and net ecosystem productivity in the mouth of the Magdalena River, Colombia. Estuarine Coastal of Shelf Science, 243, 106899. [CrossRef]
- 62. Umgiesser, G., Ferrarin, C., Cucco, A., DePascalis, F., Bellafiore, D., Ghezzo, M., Bajo, M. (2014) Comparative hydrodynamics of 10 Mediterranean lagoons by means of numerical modeling. Journal of Geophysical Research: Oceans 119(4), 2212–2226.
- Valenzuela-Siu, M., Arreola-Lizárraga, J.A., Sánchez- Carrillo, S., & Padilla-Arredondo, G. (2007). Flujos de nutrientes y metabolismo neto de la laguna costera Lobos, México. Hidrobiológica, 17(3), 193-202.
- Villate, F., & Ruiz, A. (1989). Caracterización geomorfología e hidrológica de cinco sistemas estuáricos del País Vasco. Kobie. XVIII, 157-170.
- Vybernaite-Lubiene, I., Zilius, M., Bartoli, M., Petkuviene, J., Zemlys, P., Magri, M., & Giordani, G. (2022). Biogeochemical Budgets of Nutrients and Metabolism in the Curonian Lagoon (South East Baltic Sea): Spatial and Temporal Variations. Water, 14, 164. [CrossRef]
- Zimmerman, J. T. F. (1988). Estuarine residence times, in: Hydrodynamics of estuaries, edited by Kjerfve, B., Hydrodynamics of Estuaries, CRC Press, 1, 75–84.
Figure 1.
River █ , Mocorito 2 River █ , Corrientes Reforma Group █ , Pericos 1 River █ , Pericos 2 River █ .
Figure 1.
River █ , Mocorito 2 River █ , Corrientes Reforma Group █ , Pericos 1 River █ , Pericos 2 River █ .
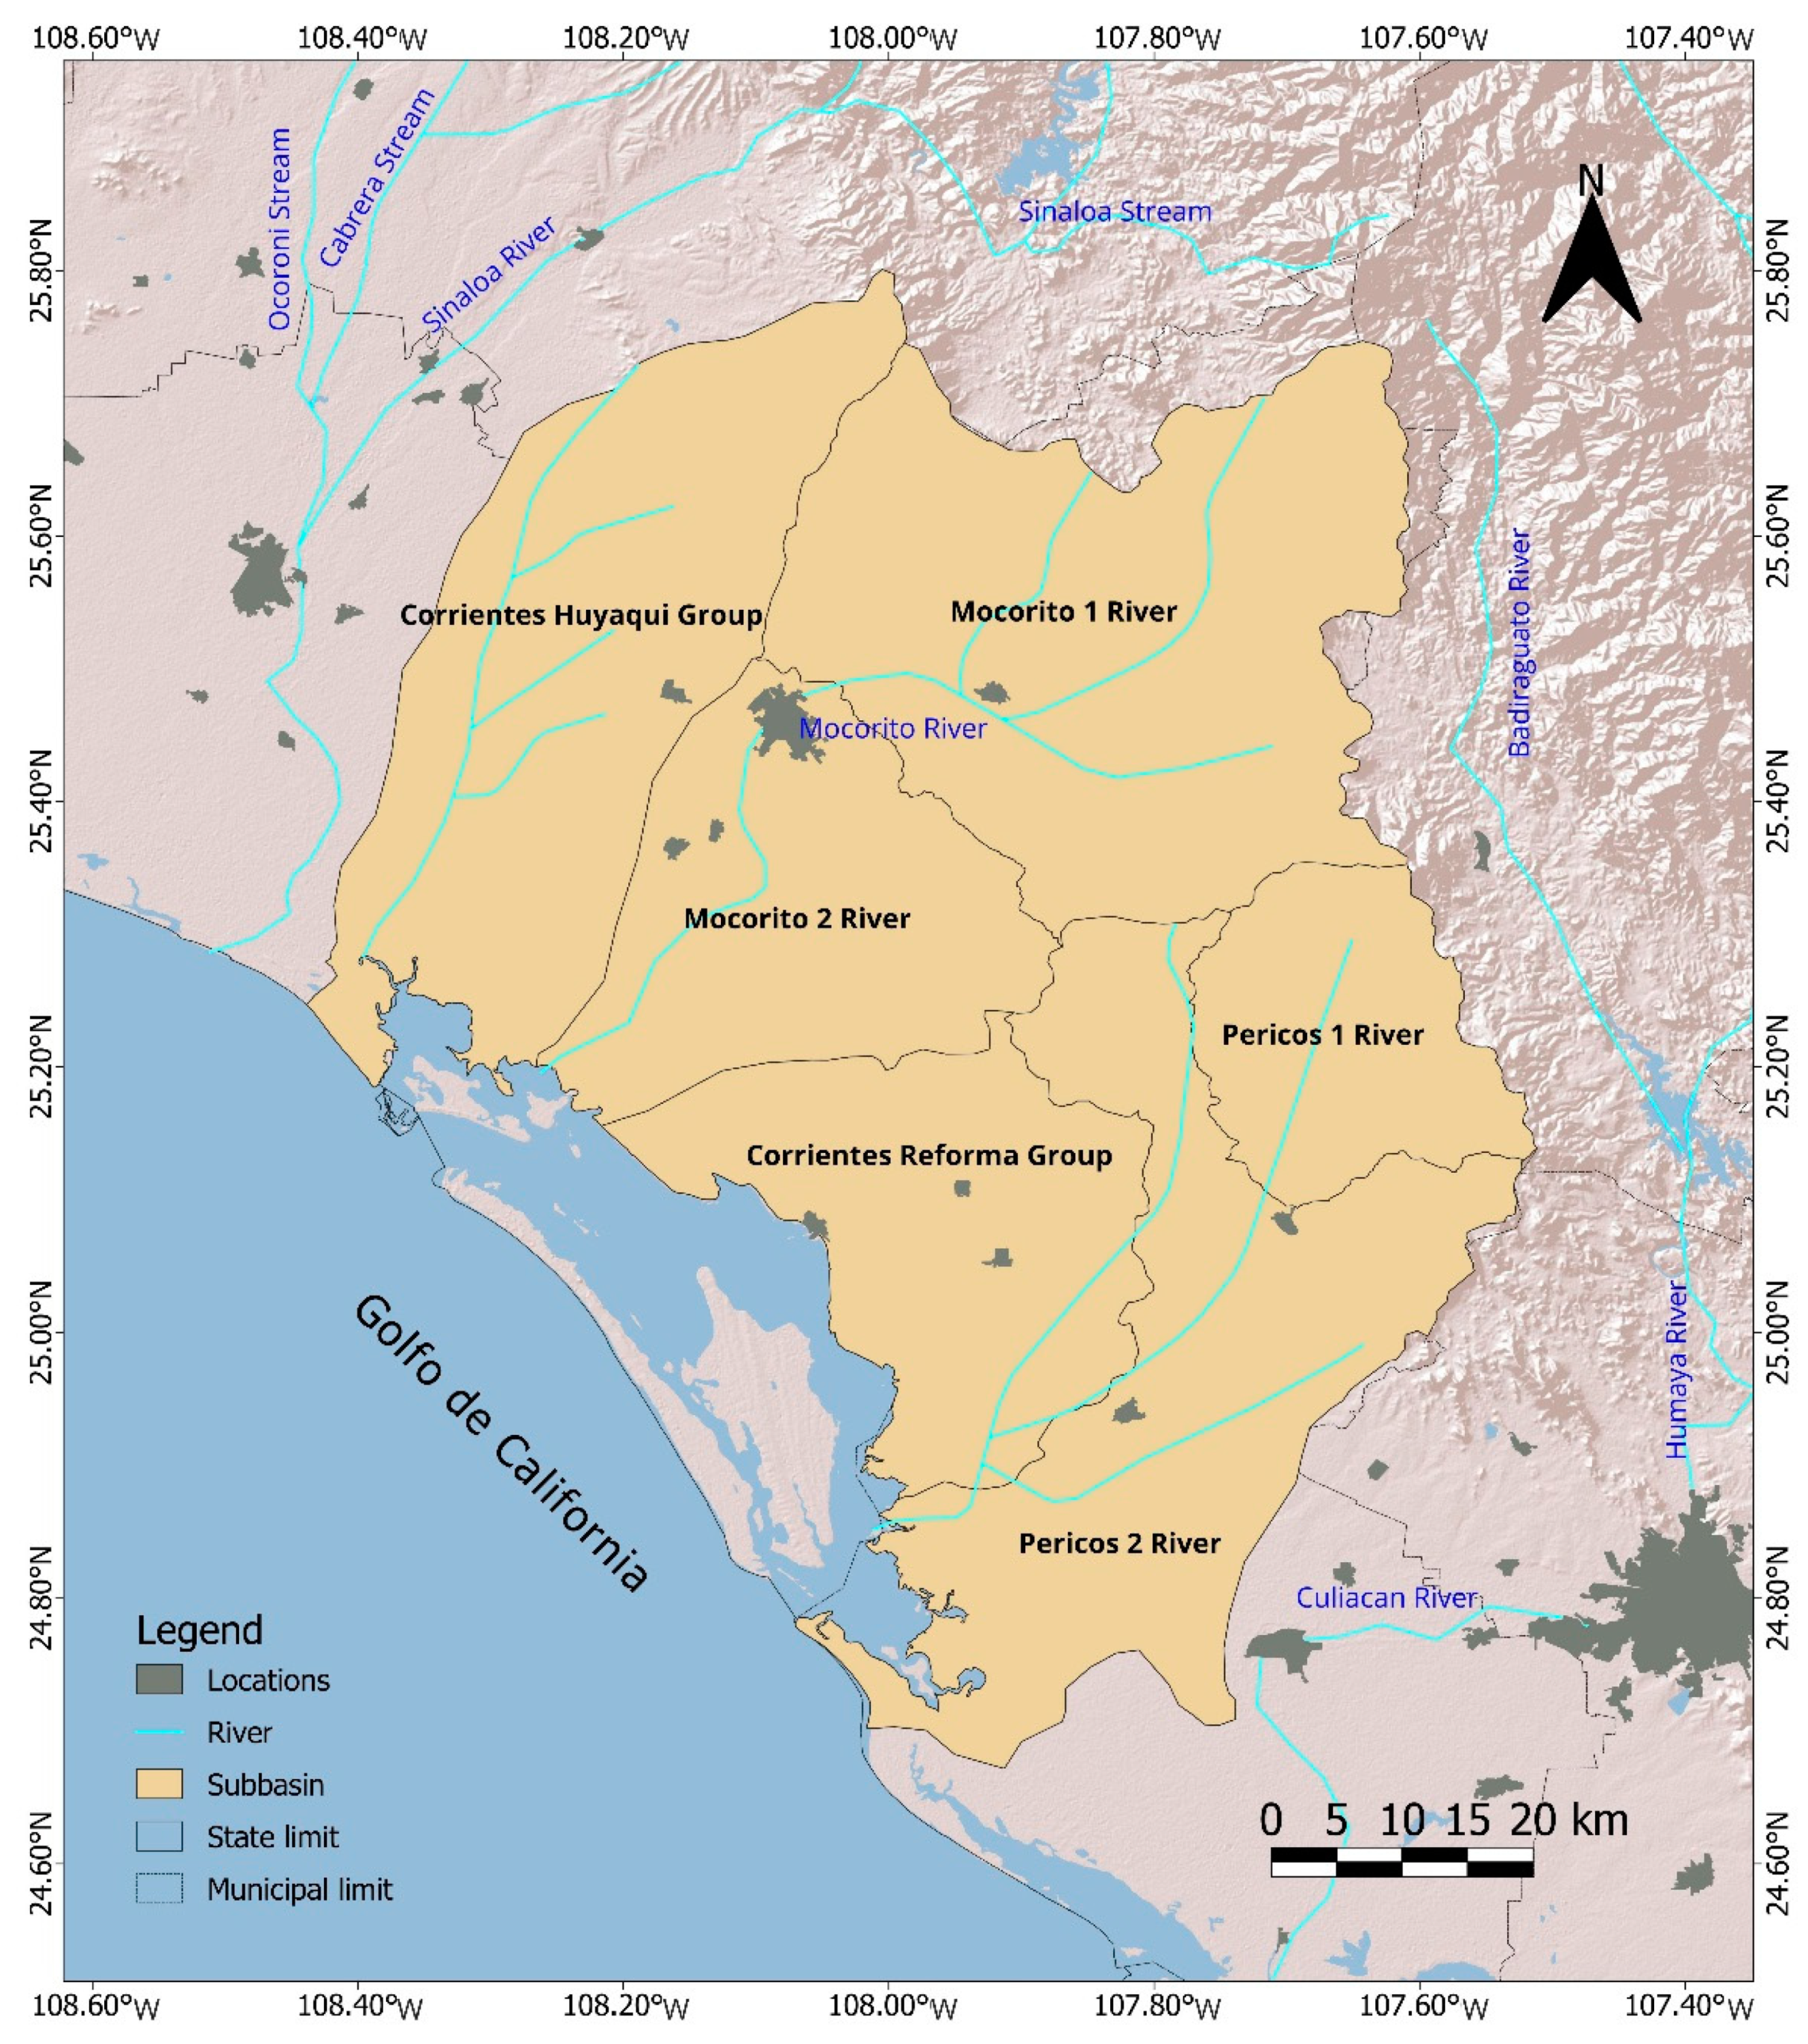
Figure 2.
The location of the 14 Points Control (PC) in the mouths is indicated with black squares, and the six IP are indicated with stars. The blue line marks the 3 m isobath.
Figure 2.
The location of the 14 Points Control (PC) in the mouths is indicated with black squares, and the six IP are indicated with stars. The blue line marks the 3 m isobath.
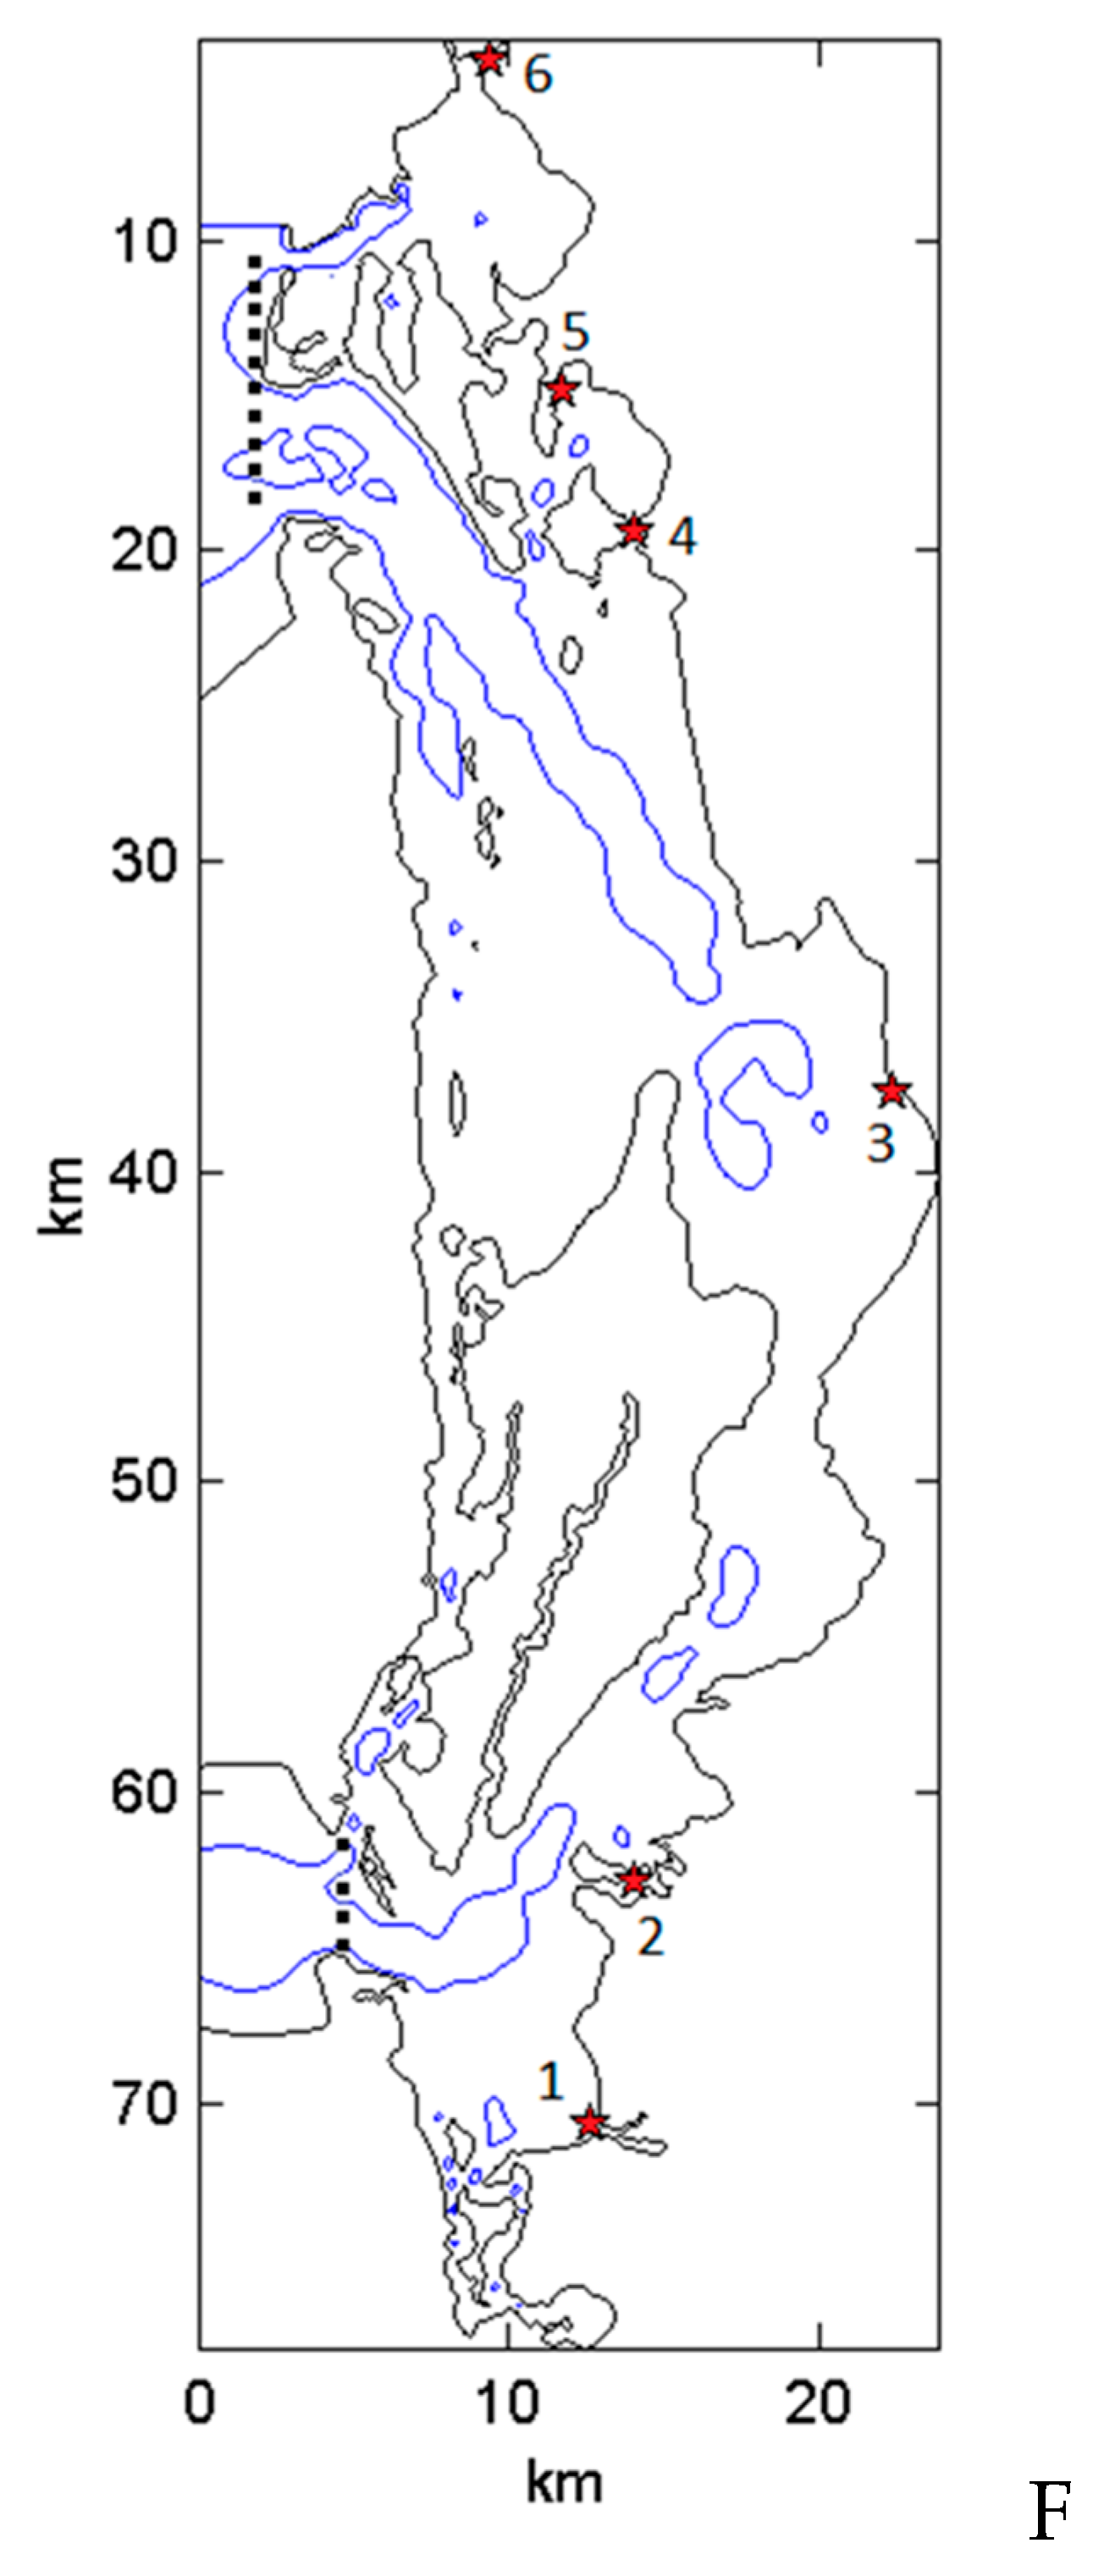
Figure 3.
Agricultural planted area and yield for a) the northern zone (Corrientes Huyaqui Group, Mocorito 1 River and Mocorito 2 River sub-basins) and b) the southern zone (Corrientes Reforma Group, Pericos 1 River and Pericos 2 River sub-basins). █ Corn crop; █ Other crops; ▬ Yield.
Figure 3.
Agricultural planted area and yield for a) the northern zone (Corrientes Huyaqui Group, Mocorito 1 River and Mocorito 2 River sub-basins) and b) the southern zone (Corrientes Reforma Group, Pericos 1 River and Pericos 2 River sub-basins). █ Corn crop; █ Other crops; ▬ Yield.
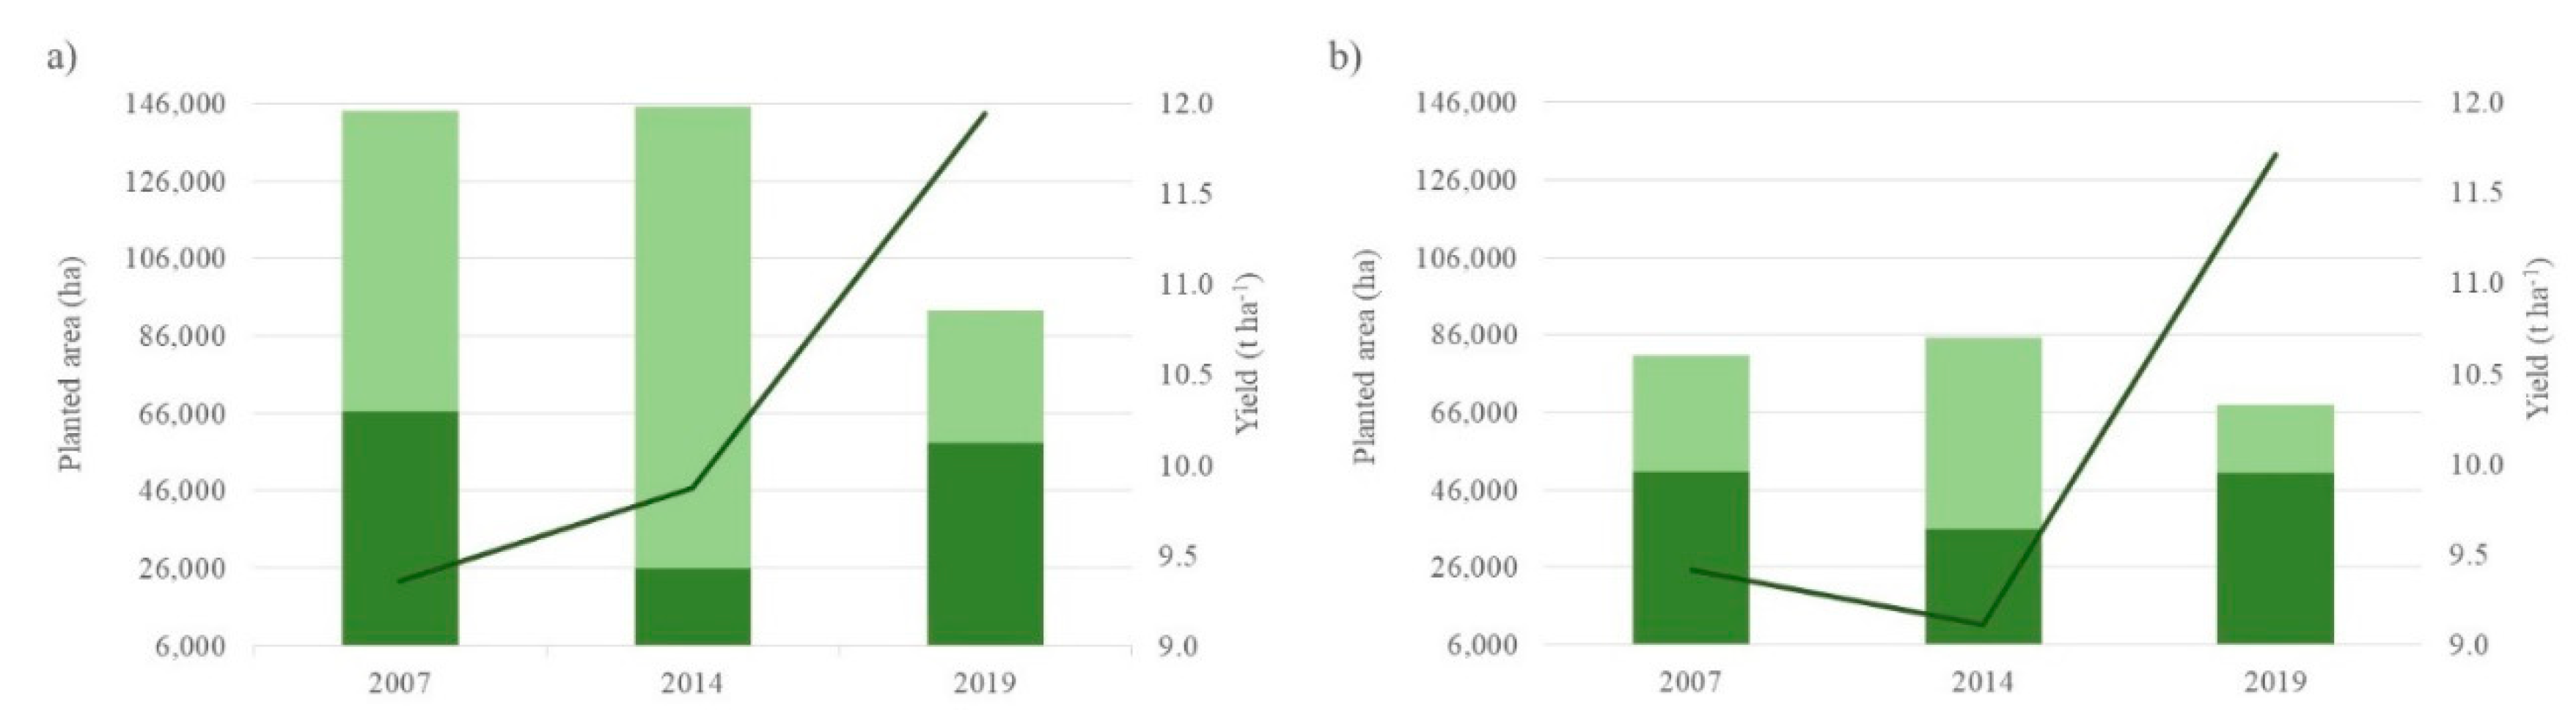
Figure 4.
Livestock production and performance for a) the northern zone (Corrientes Huyaqui Group, Mocorito 1 River and Mocorito 2 River sub-basins) and b) the southern zone (sub-basins: Corrientes Reforma Group, Pericos 1 River and Perico 2 River sub-basins). █ Livestock production; ▬ Slaughtered animal.
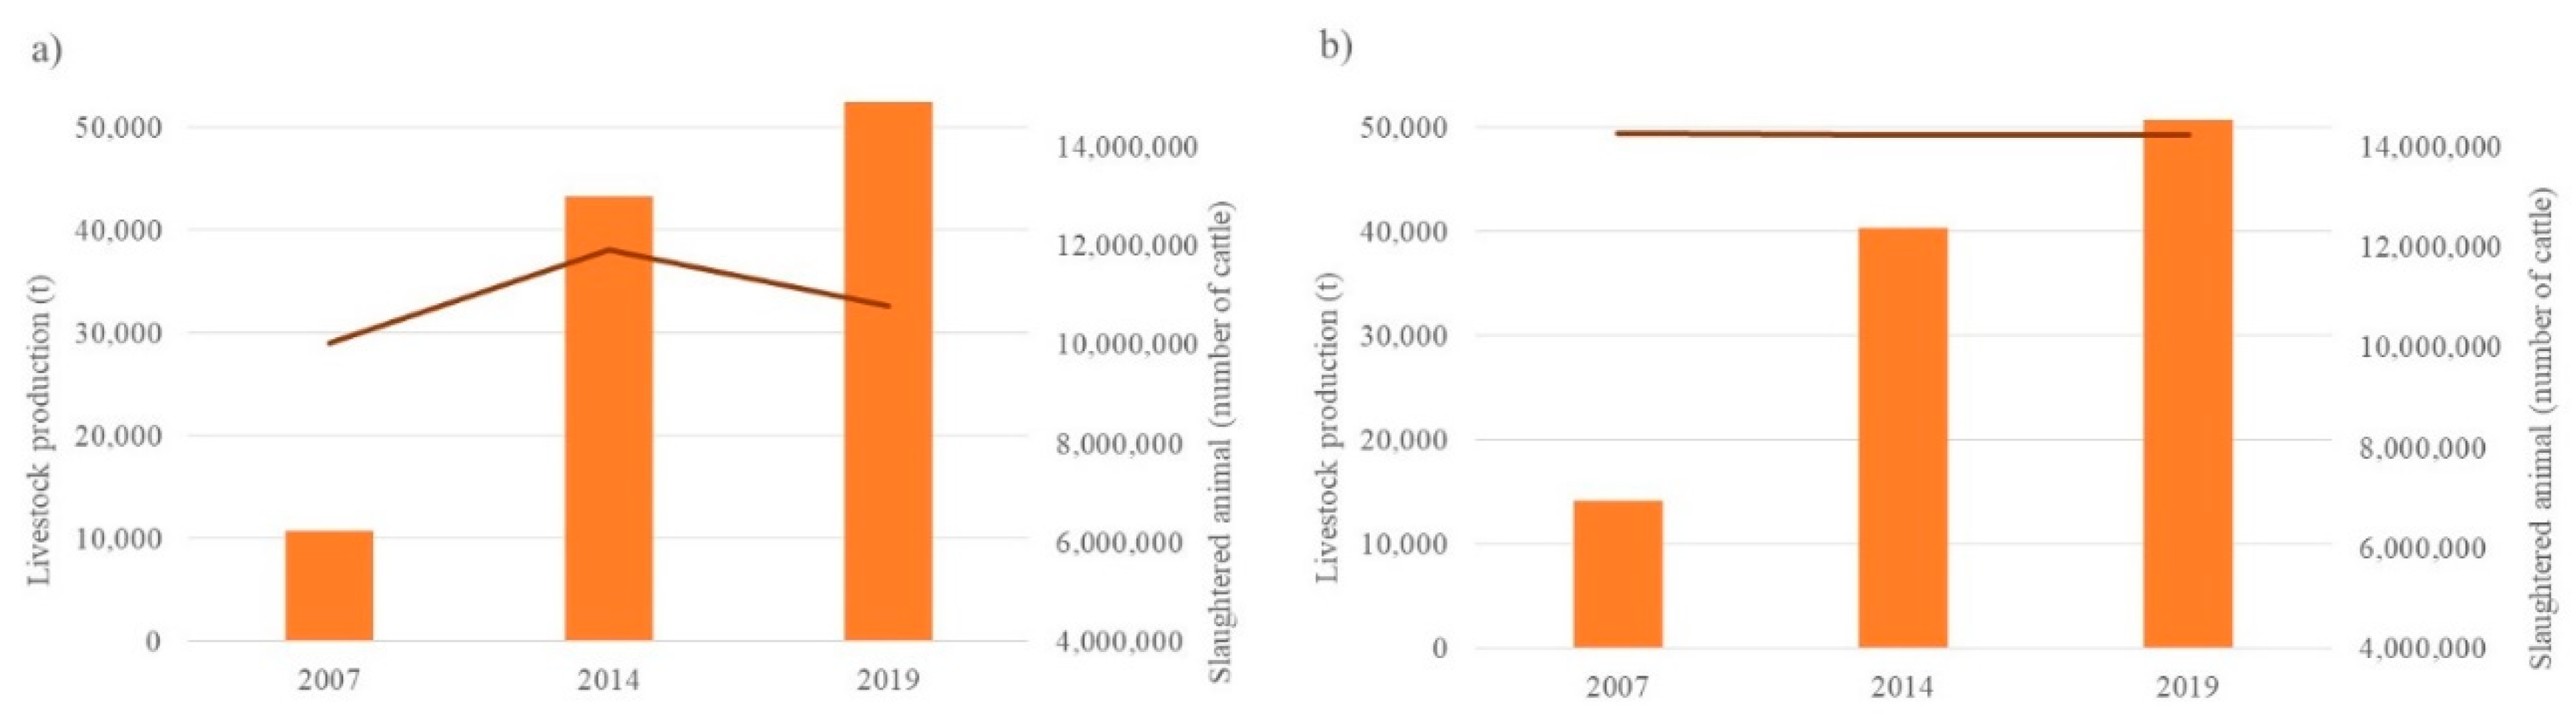
Figure 5.
Aquaculture area and performance, for a) the Northern zone (Guasave Sur board) and b) the Southern zone (Angostura board). █ Pond area; ▬ Yield.
Figure 5.
Aquaculture area and performance, for a) the Northern zone (Guasave Sur board) and b) the Southern zone (Angostura board). █ Pond area; ▬ Yield.
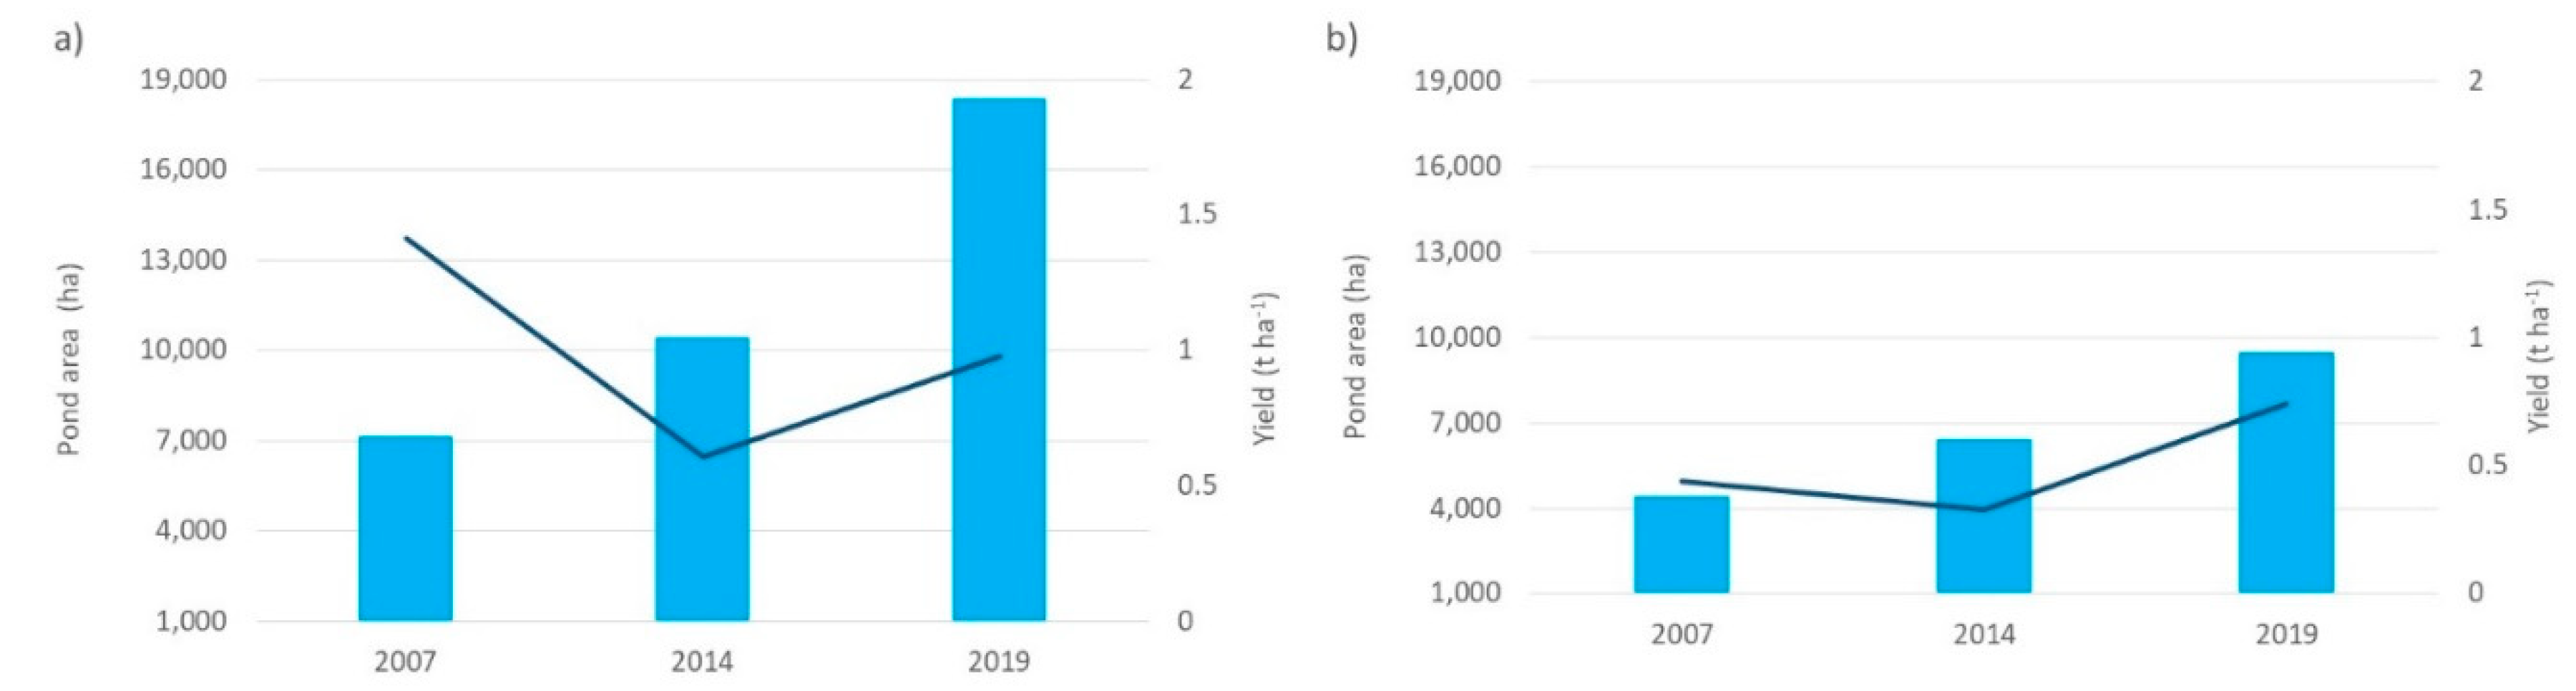
Figure 6.
Number of inhabitants, for the northern zone (Corrientes Huyaqui Group, Mocorito 1 River and Mocorito 2 River sub-basins) and the southern zone (Corrientes Reforma Group, Pericos 1 River and Pericos 2 River sub-basins). █ Northern zone and █ Southern zone.
Figure 6.
Number of inhabitants, for the northern zone (Corrientes Huyaqui Group, Mocorito 1 River and Mocorito 2 River sub-basins) and the southern zone (Corrientes Reforma Group, Pericos 1 River and Pericos 2 River sub-basins). █ Northern zone and █ Southern zone.
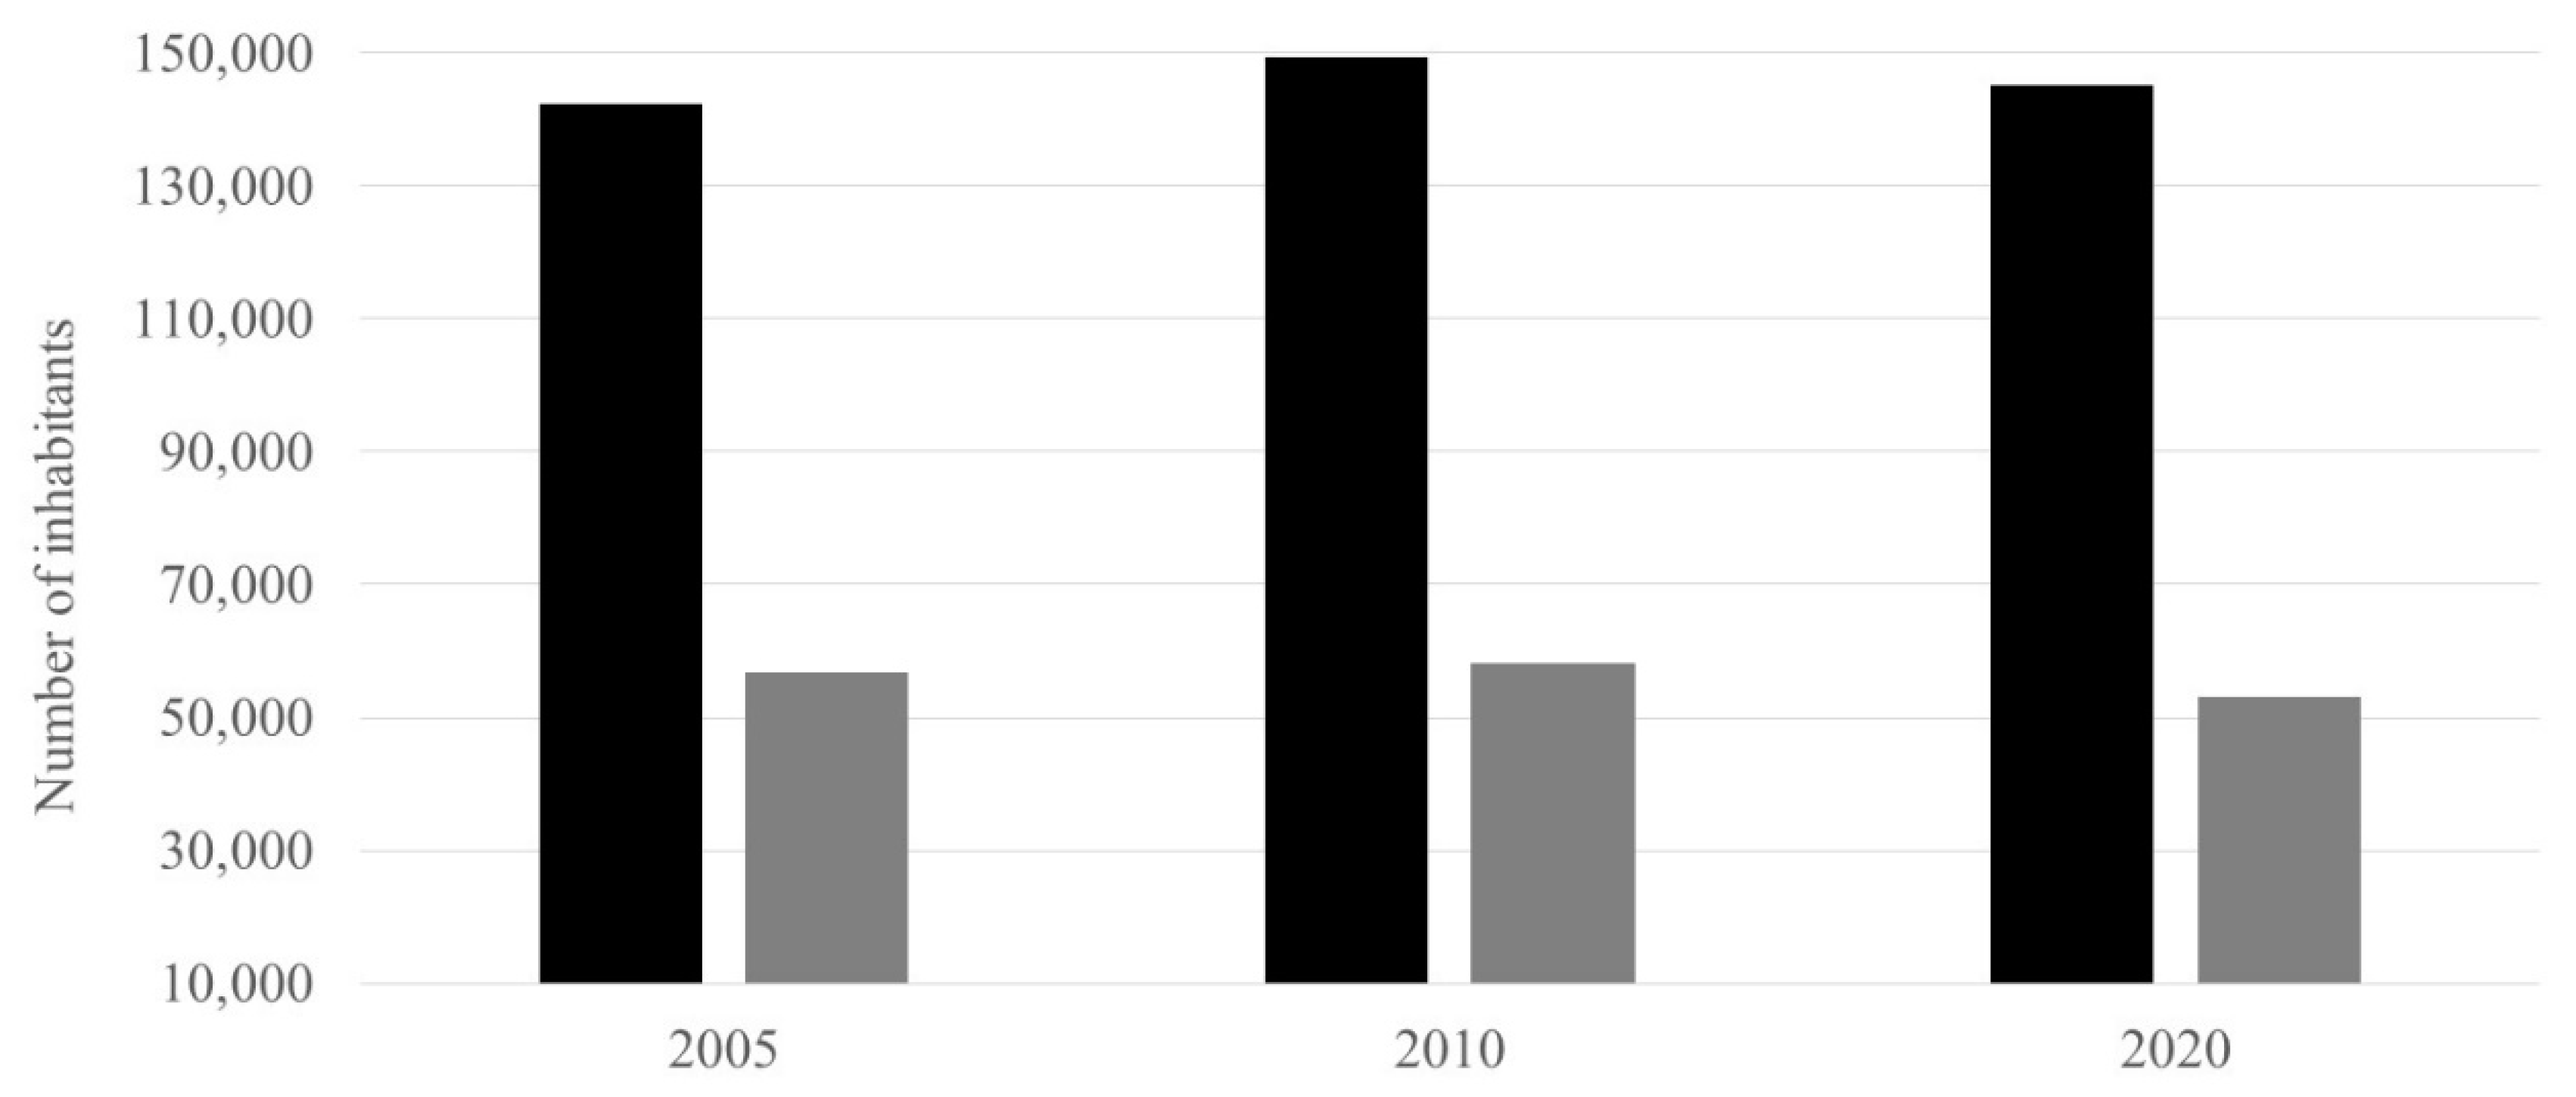
Figure 9.
Trophic status in the drains that discharge into SMBLR. The percentage of sampling stations for each trophic level (from Reyes-Velarde et al., 2023) is shown by area and date. █ oligotrophic, █ mesotrophic, █ eutrophic, and █ hypertrophic state.
Figure 9.
Trophic status in the drains that discharge into SMBLR. The percentage of sampling stations for each trophic level (from Reyes-Velarde et al., 2023) is shown by area and date. █ oligotrophic, █ mesotrophic, █ eutrophic, and █ hypertrophic state.
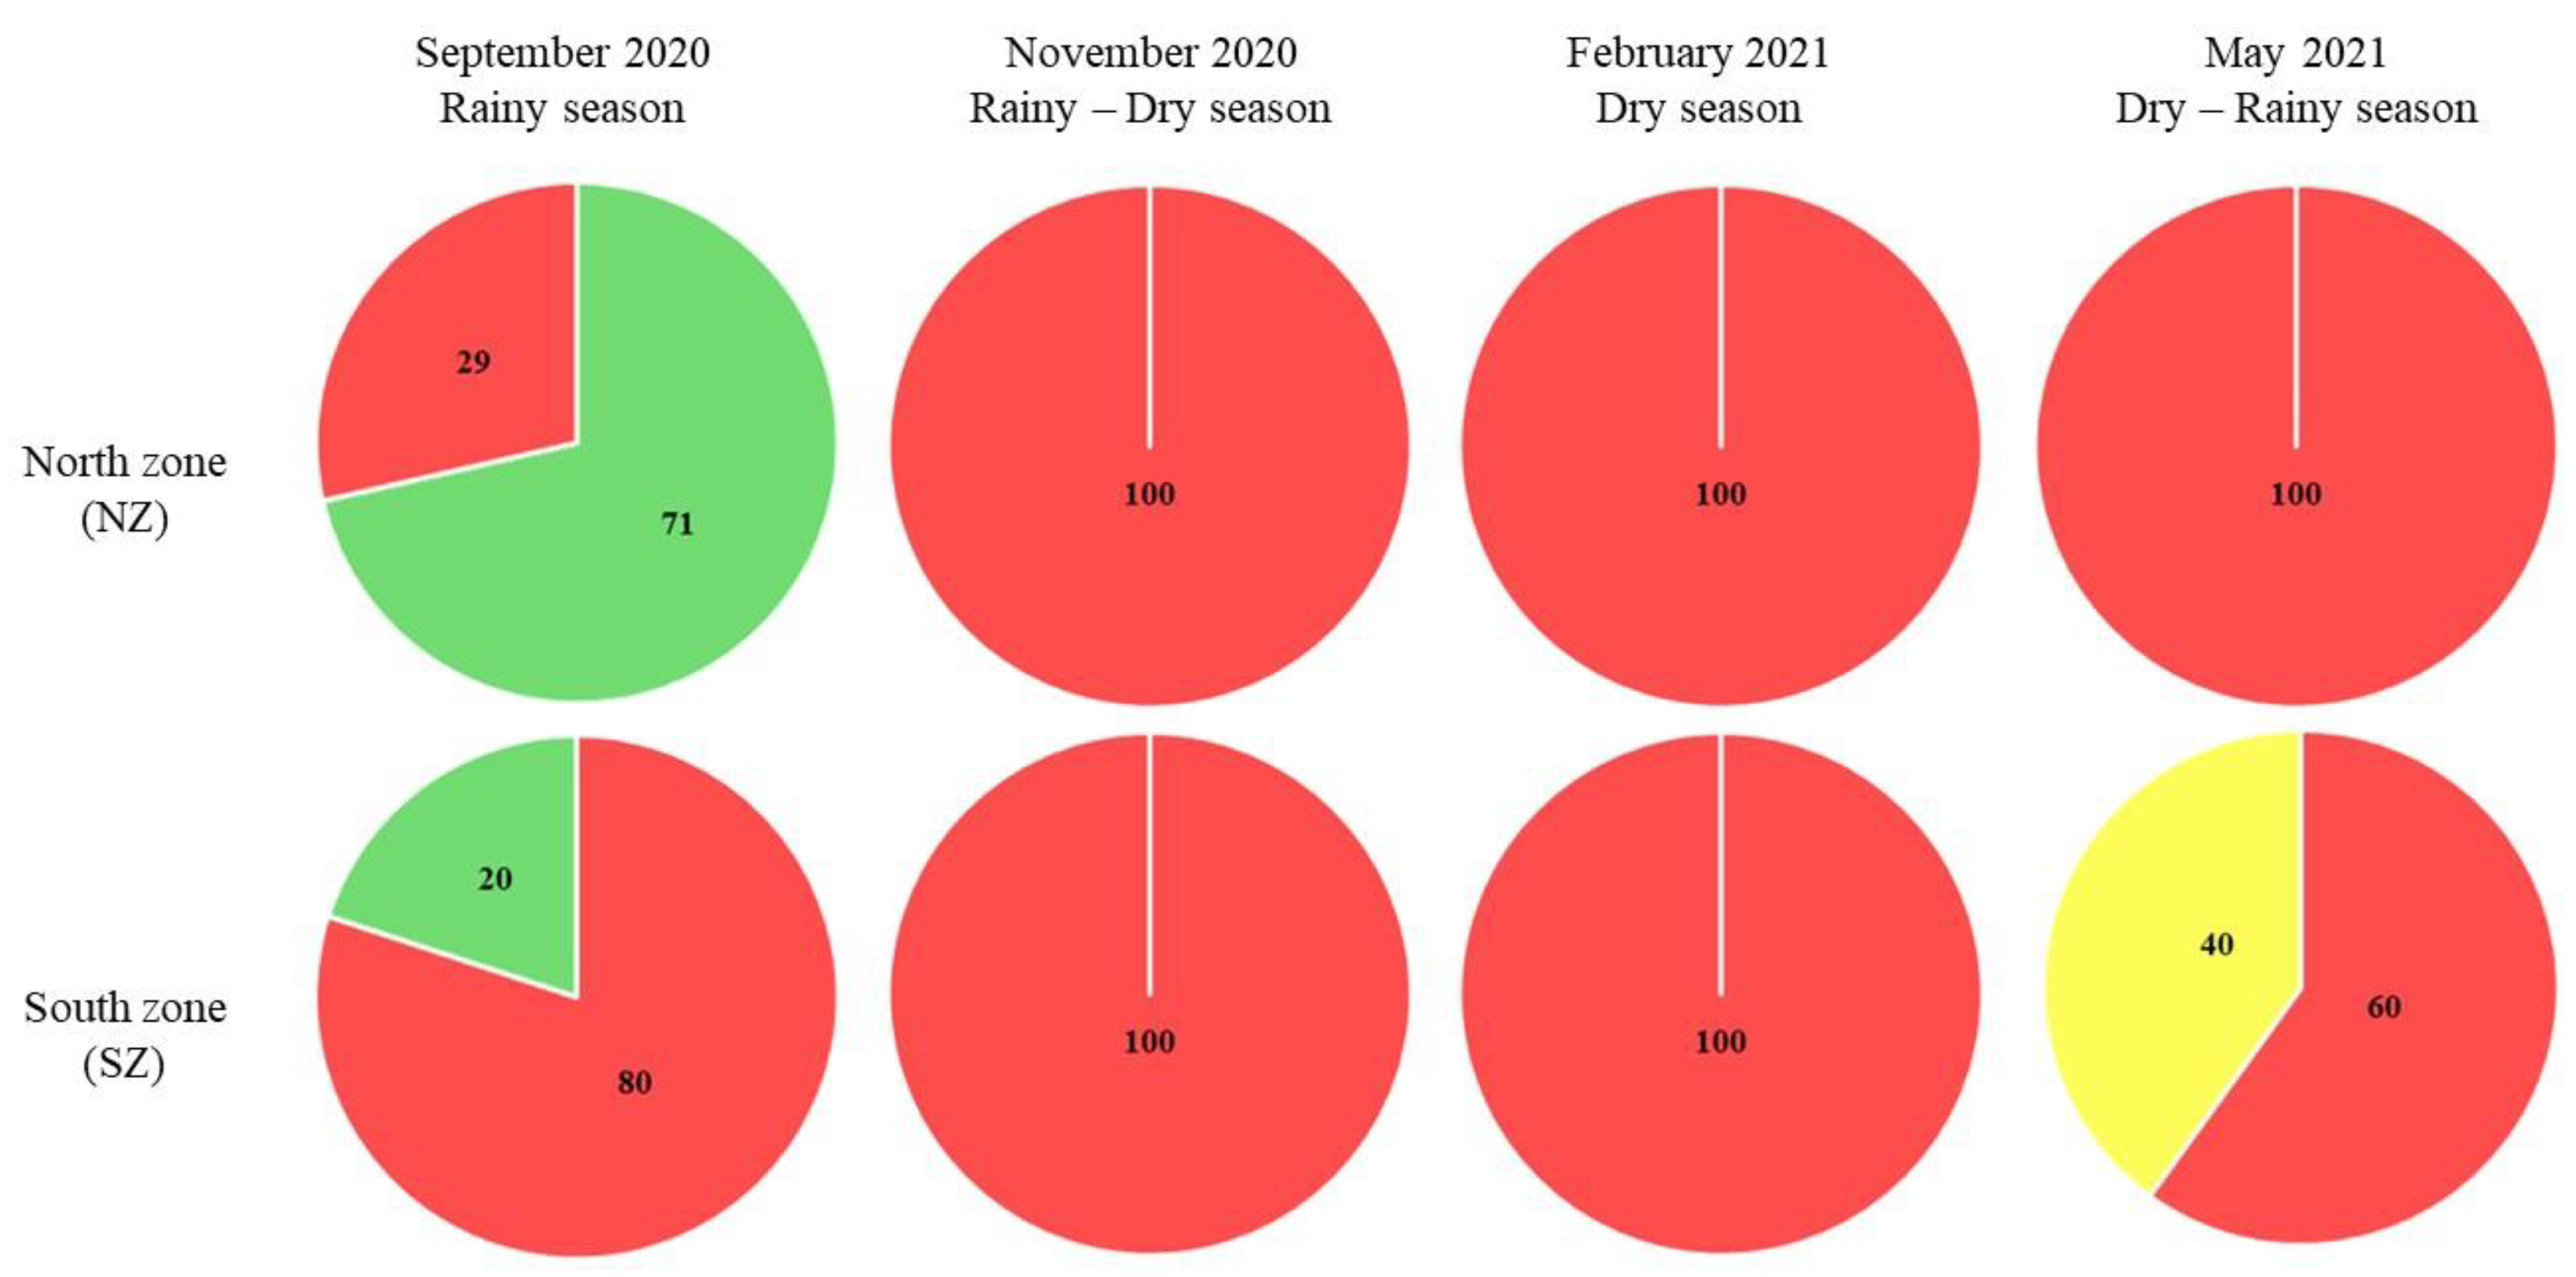
Figure 10.
Trophic states within the SMBLR lagoon system. The percentage of stations for each trophic level is shown by zone and date. █ oligotrophic, █ mesotrophic, █ eutrophic, and █ hypertrophic state.
Figure 10.
Trophic states within the SMBLR lagoon system. The percentage of stations for each trophic level is shown by zone and date. █ oligotrophic, █ mesotrophic, █ eutrophic, and █ hypertrophic state.
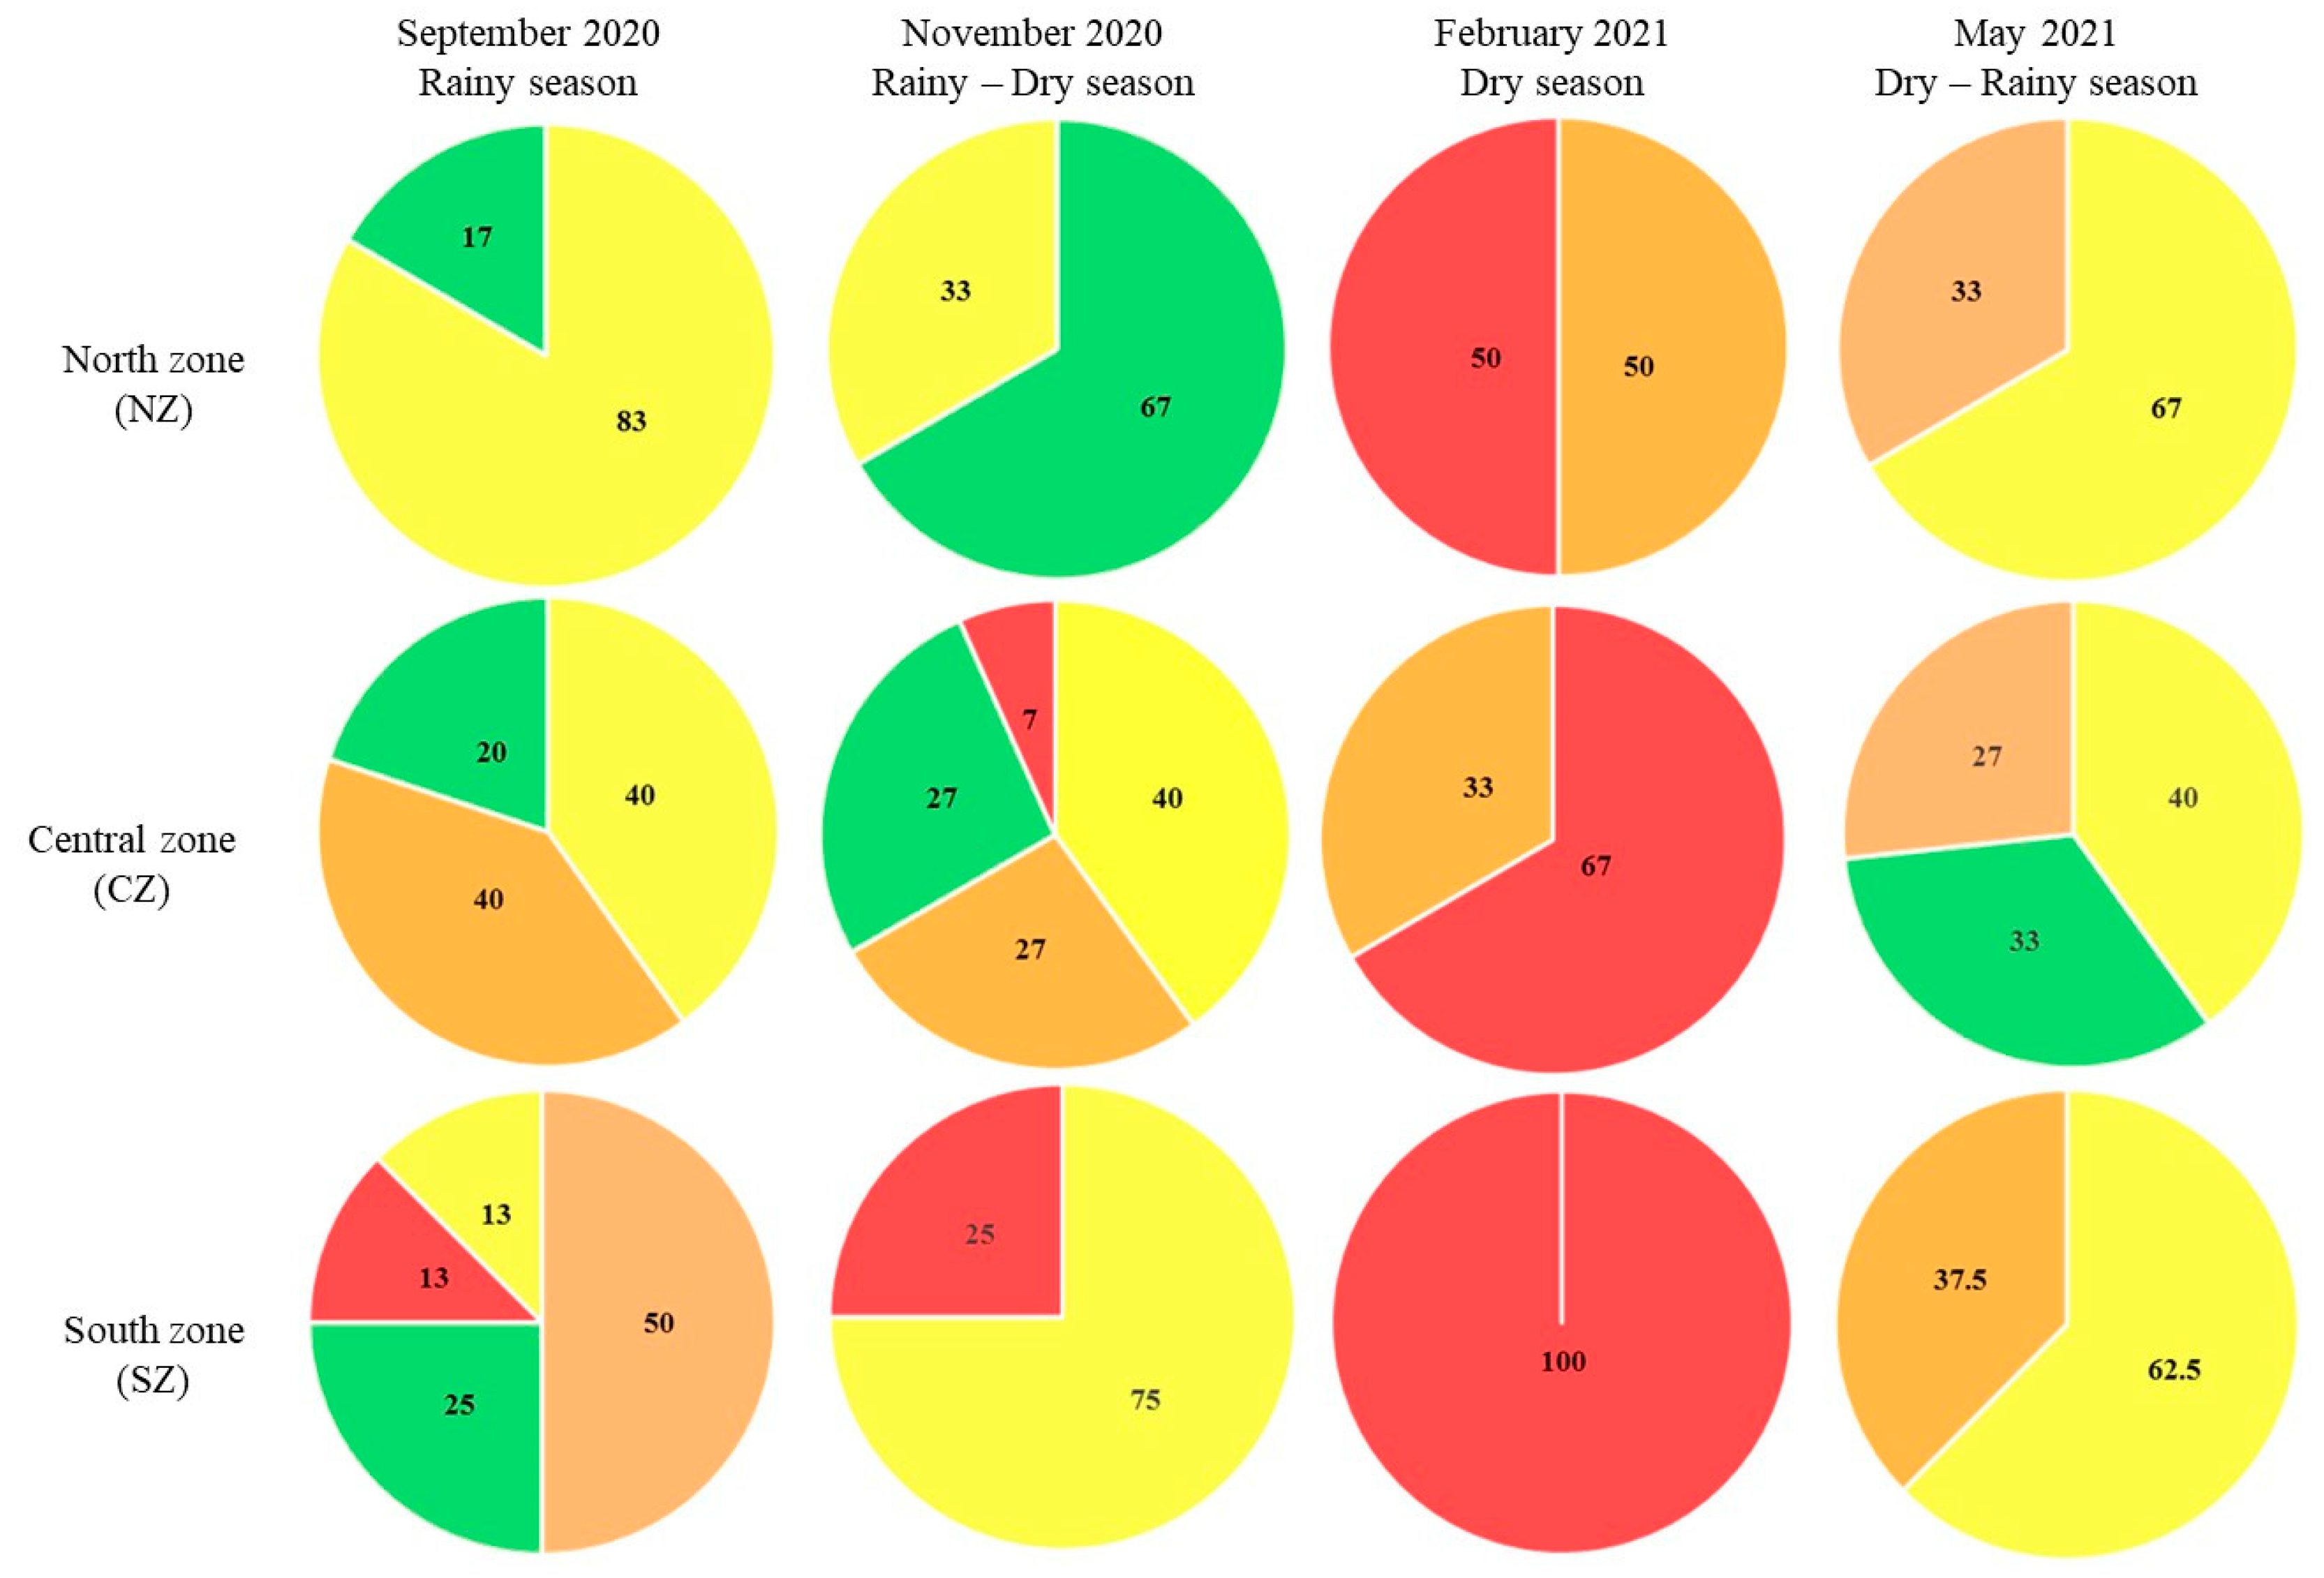
Figure 11.
Velocity field in SMBLR at spring tide (ST). Flow (a) and ebb (b) TRIX concentration in reflux after emanation of the contaminant for 12 days in the six IP.
Figure 11.
Velocity field in SMBLR at spring tide (ST). Flow (a) and ebb (b) TRIX concentration in reflux after emanation of the contaminant for 12 days in the six IP.
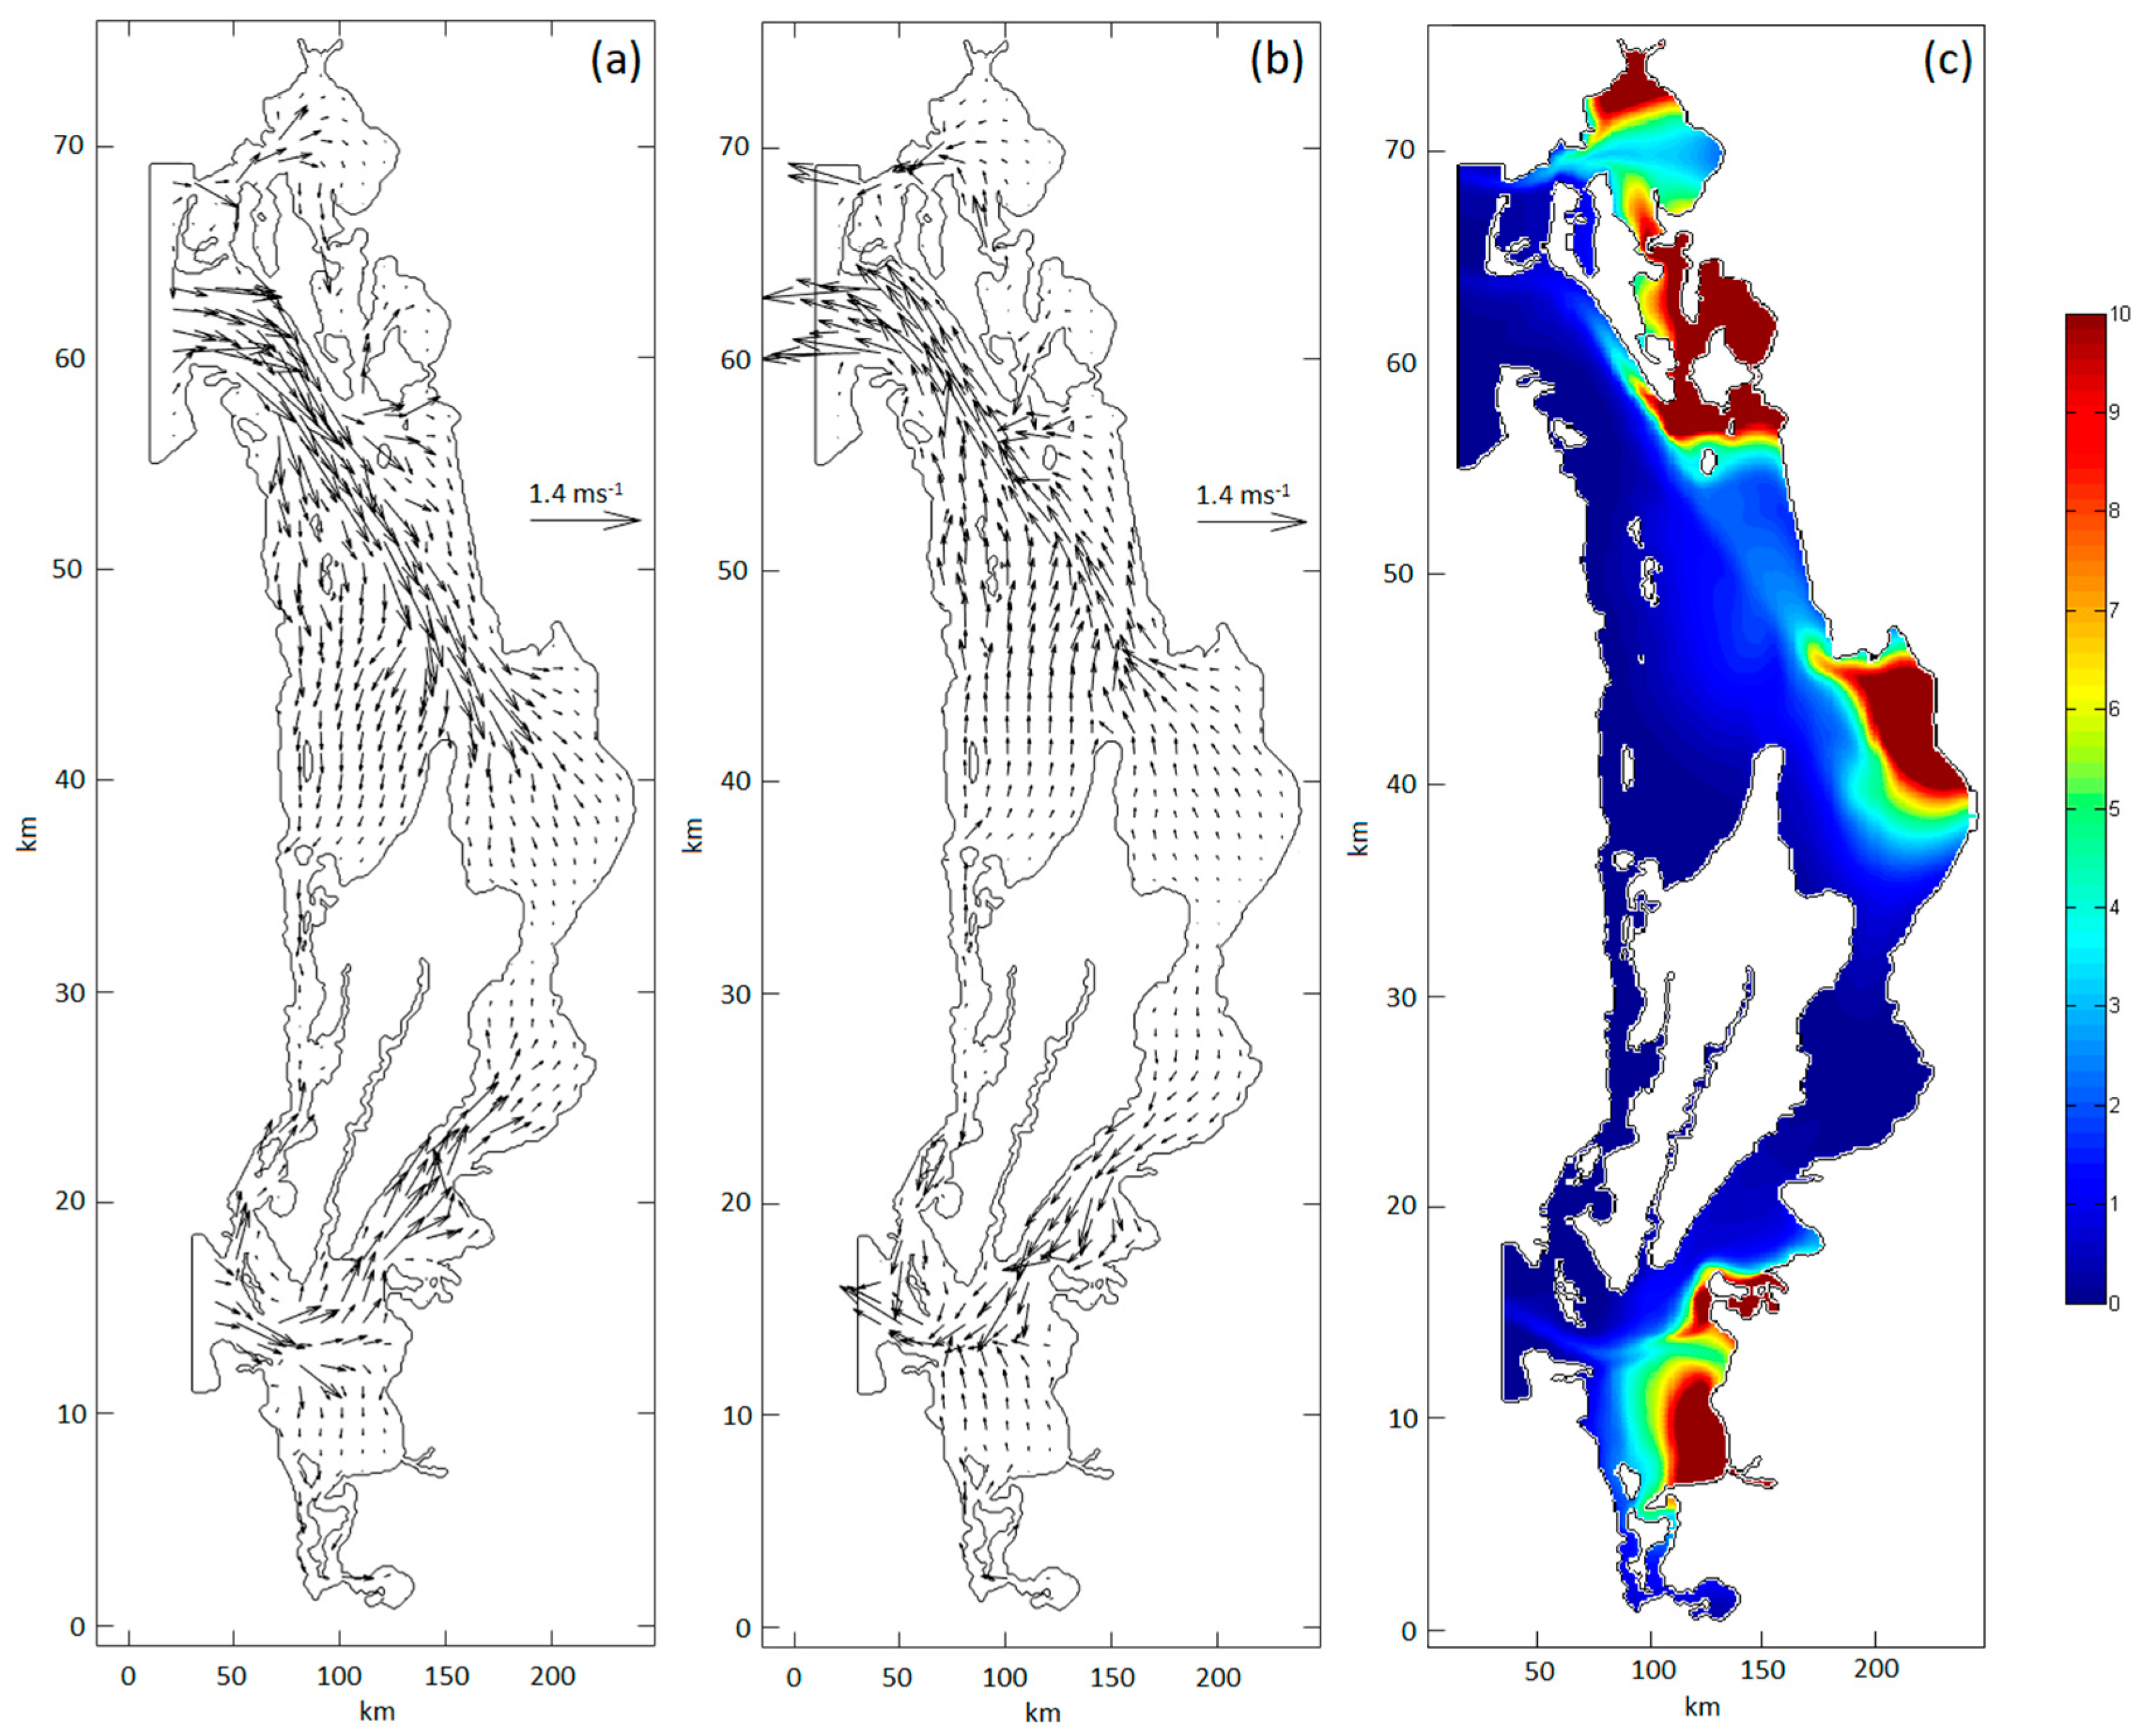
Figure 12.
Growth rates of economic activities and population. a) Corrientes Huyaqui Group (CHG), Mocorito 1 River and Mocorito 2 River in Northern zone 2007-2014; b) Corrientes Reforma Group (CRG), Pericos 1 River and Pericos 2 River in Southern Zone 2007-2014; c) Corrientes Huyaqui Group (CHG), Mocorito 1 River and Mocorito 2 River in Northern zone 2014-2019; d) Corrientes Reforma Group (CRG), Pericos 1 River and Pericos 2 River in Southern zone 2014-2019. The dotted line indicates the separation of the Northern zone and Southern zone.
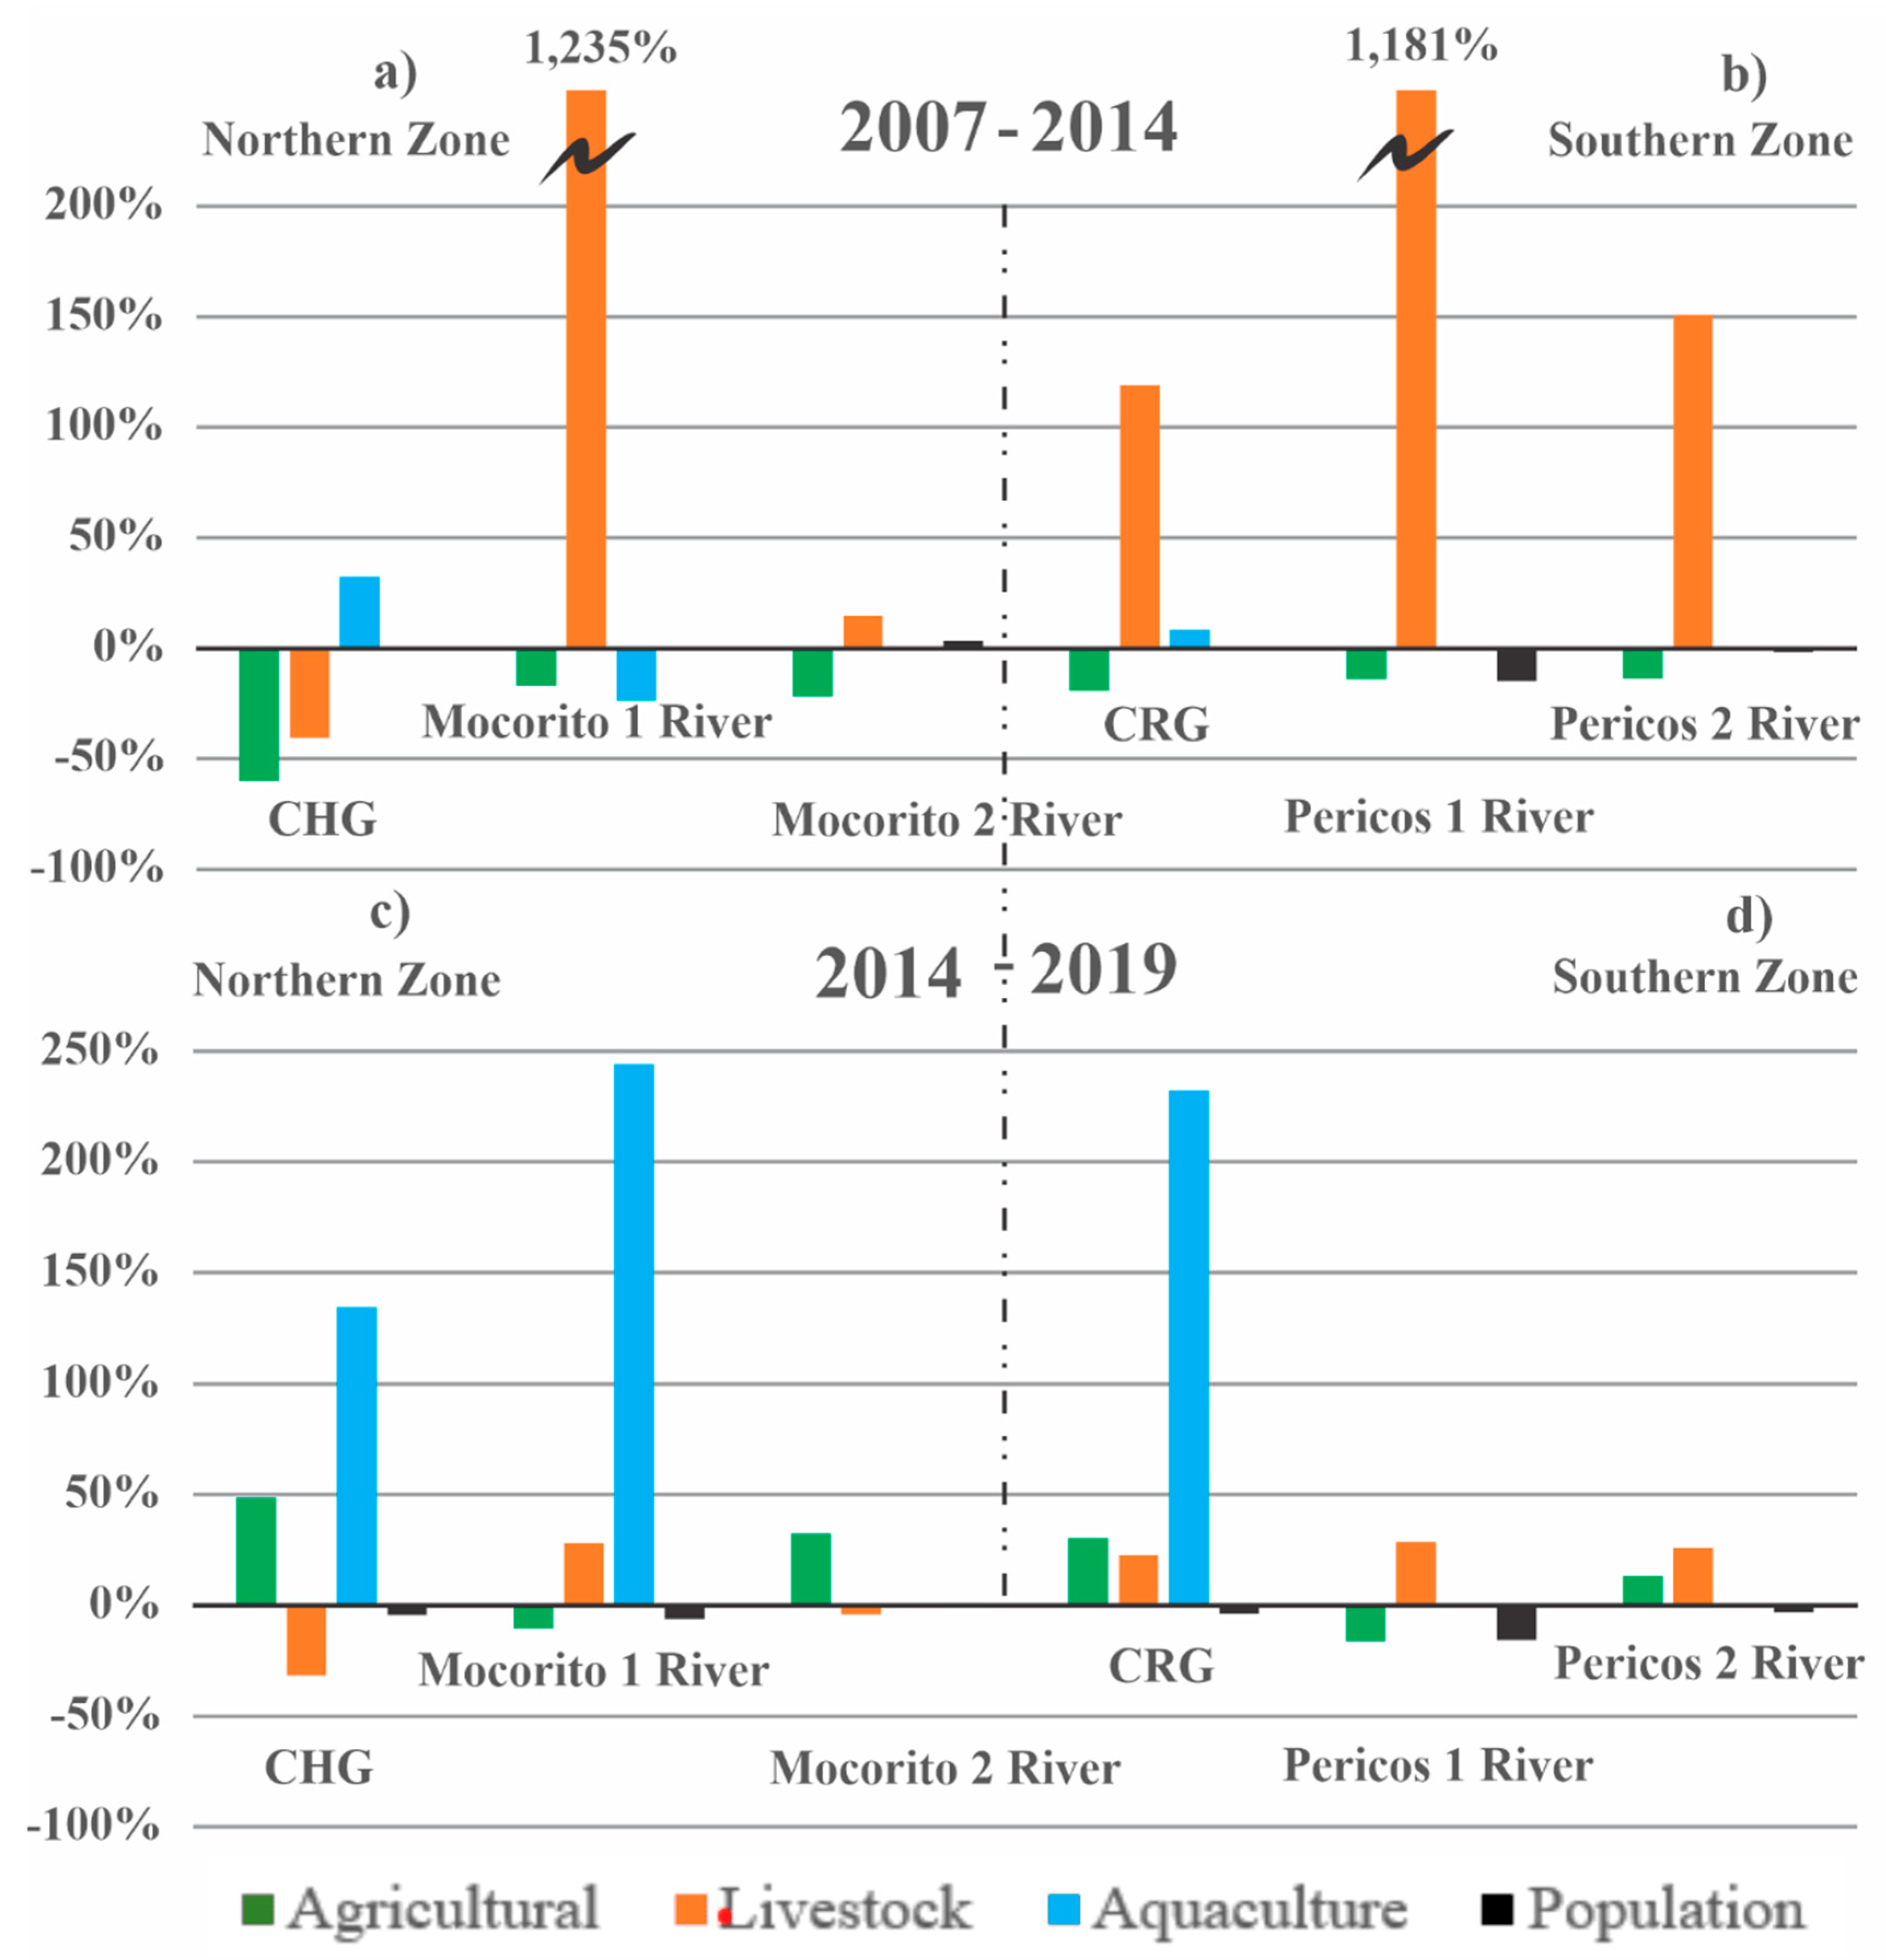
Disclaimer/Publisher’s Note: The statements, opinions and data contained in all publications are solely those of the individual author(s) and contributor(s) and not of MDPI and/or the editor(s). MDPI and/or the editor(s) disclaim responsibility for any injury to people or property resulting from any ideas, methods, instructions or products referred to in the content. |
© 2024 by the authors. Licensee MDPI, Basel, Switzerland. This article is an open access article distributed under the terms and conditions of the Creative Commons Attribution (CC BY) license (http://creativecommons.org/licenses/by/4.0/).
Copyright: This open access article is published under a Creative Commons CC BY 4.0 license, which permit the free download, distribution, and reuse, provided that the author and preprint are cited in any reuse.


