1. Introduction
Borehole imaging tools, like the Formation Micro-Imaging (FMI), for instance, carry triaxial magnetometers in an auxiliary orientation tool (also known as inclinometers) that acquire magnetic information used for spatial and geographical orientation of the images. Until recently, the use of the magnetic data acquired by these orientation tools was restricted to support the inclinometry data. According to [
1], the perception that changes in the measured magnetic field were caused by the presence of magnetic rocks in the borehole has extended the use of this data to help identifying igneous rock intervals during analysis of imaging tools data. The fact that these magnetic data can detect the presence of igneous rocks rises the question if they are sensitive enough to allow estimates of some magnetic properties of these rocks, more specifically, the magnetic susceptibility.
Interpretation of magnetic data is traditionally used in petroleum exploration to map the geological distribution of magnetic rocks in subsurface. Among various interpretation techniques, the forward modeling of magnetic data is a typical approach for estimation of positions, depths, geometries and magnetic properties of the rocks in exploration areas. In general, the forward modeling technique searches for a reliable geological solution that fits the magnetic anomaly observed in the survey area. This interpretation process is mainly ruled by two variables: the geometry of the rocks and their magnetic susceptibility. Well data and other geophysical data, like seismic and gravity for instance, may provide the necessary control to the source’s geometry variability, while measurements of magnetic susceptibility are rare specially in oil industry.
Forward modeling has played important role to the exploration of Pre-Salt prospects in offshore Brazil, where it has been used to help in the differentiation between carbonates and igneous rocks, whose distinction in seismic images are often difficult. Examples of such use can be found in [
2], who discussed the utility and problems encountered when modeling in Santos Basin, offshore Brazil.
Figure 1 shows a representative example from [
2]. In both
Figure 1a,b, the upper panels show the magnetic profiles where the blue dotted line represent the observed data, the continuous blue line is the data calculated from the model and the continuous red line accounts for the misfit. The models are shown in the lower panels where the blue region are the non-magnetic rocks (carbonates and other sedimentary rocks) while the pink regions represent the igneous rocks, whose magnetic susceptibility comes from literature values due to the absent of measurements. The green lines are the interface between the layers as interpreted from seismic data. The initial interpretation (
Figure 1a) suggested the presence a thicker and shallower igneous package at the top of the structure. The modeling solution (exhibited in
Figure 1b) shows that a thinner and deeper igneous package fits better the observed data and, therefore, should be more likely to be true ([
2]). Latter drilling has proved that the model proposed by the forward modeling was correct.
The importance of magnetic forward modeling to Pre-Salt exploration, specially where seismic interpretation is ambiguous, contrasts with the lack of susceptibility measurements in boreholes. Since magnetic susceptibility in rocks may vary in orders of magnitude, the use of literature values may not always provide reliable results. Estimates from borehole magnetic data collected in nearby wells may provide the necessary control for the forward modeling. The incorporation of more reliable magnetic susceptibility estimates into these models would make them more realistic contributing for exploration risks reduction.
Despite its utility for magnetic modeling, the development of tools for borehole magnetic susceptibility measurements was greatly driven by the magnetostratigraphy due to its application in determining the absolute age of geological formations. Examples of interpretation of magnetic logging data in sediments can be found in [
3] and [
4] who have studied the magnitude and variations of magnetic susceptibility in sedimentary and volcanoclastic rocks to understand their influence on induction logs.
Magnetic well logging tools have been developed by both oil and service companies since the middle of last century. Two magnetic well logging instruments capable of acquiring magnetic susceptibility as well as the total magnetic field were developed by Magnolia Petroleum according to [
5]. The development of the GHMT (Geological High Sensibility Magnetic Tool) by Total with the help of Schlumberger was described by [
6] and [
7]. The GHMT is a magnetic logging tool developed for recording the total magnetic field and the magnetic susceptibility of rocks in oil wells. Besides oil companies, the mineral industry was also researching borehole magnetic susceptibility tools. A magnetic susceptibility log system for uranium exploration whose development was supported by the Department of Energy of United States was described by [
8] and [
9]. The basic theory and results of an inductive magnetic susceptibility logger (Geonics EM39S) for shallow lithological applications was presented by [
10] who have used it to study unconsolidated sediments and rocks in Canada. A magnetic tensor gradiometer, developed by [
11] in Australia for iron ore exploration, is an instrument capable to measure magnetic field gradients in all directions within a borehole, however it does not provide susceptibility measurements.
Alternatively, methods of getting indirect measurements of the magnetic susceptibility of rocks have been proposed as well. Such methods were based mainly on changes in acquisition methodology, choice of parameters and data processing of induction and NMR (Nuclear Magnetic Resonance) tools. The use of induction logs to determine relative magnetic susceptibility with focus on the perturbations in induction results caused by the magnetic formations was proposed by [
12]. Apparent magnetic susceptibility contrast estimates between rock and a saturating liquid was performed by [
13] from measures of the free induction decay in core plugs, powdered rocks and drilled cuttings, but not in well logs.
The developments and applications of the logging magnetic tools have yielded promising results. Examples of the application of borehole magnetic susceptibility studies in different fields can be found in [
14], who evaluates the use of high-resolution magnetic susceptibility logs to characterize climate-forced sedimentation evolution and in [
15] who has used high-sensitivity induction magnetic susceptibility probe to infer mineralogical changes and lithology variations in shallow mapping applied to groundwater studies. Environmental studies has also made use of magnetic susceptibility to identify variations in sediment composition as in [
16], but in most of the cases, the logging is carried out on a core instead of inside the borehole. Magnetic susceptibility logs are also common in ocean drilling programs, as in [
17] for instance, but they usually log cores of recovered sediments and do not take borehole measurements. The use of magnetic susceptibility downhole finds applicability even in archaeology, as in [
18] who reviews the role of magnetic susceptibility in archaeogeophysical studies.
Despite of the large applicability of magnetic susceptibility for sediment studies, little application of borehole magnetic logging have emerged in oil exploration industry. Even though [
19] provides an extensive review of magnetic susceptibility measurements applications for reservoir characterization, most of the discussed results were based on laboratory rather than logging measurements. As a consequence, to our knowledge, this type of borehole logging tools can not be found for commercial use in oil industry nowadays. In this paper we propose to overcome this lack of direct measurements by estimating the magnetic susceptibility of the rocks along the borehole using the magnetic data acquired by the magnetometer included in the orientation tools of imaging logs.
2. Materials and Methods
The total field
F measured inside a borehole can be related to the Earth’s magnetic field
H and to the total magnetization
of a rock as:
where
is the component of magnetization produced in response to the Earth’s magnetic field,
is the natural remanent magnetization and
is the rock’s magnetic susceptibility. The natural remanent magnetization is a permanent magnetization that remains in the rock even in the absence of an inducing field, recording its magnetization history. The magnetic susceptibility is a dimensionless physical property of the rock that in cases of sufficiently weak fields, like the Earth’s magnetic field, represents a constant of proportionality relating the induced magnetization and the applied field. Since the induced magnetization is essentially parallel to the applied field, the magnetic susceptibility is a scalar quantity for most of rocks. Equation
1 is of fundamental importance because it represents the basis for all estimates carried in this study.
As Equation
1 is a vector sum, it can only be correctly done with the knowledge of the three parameters that describe a magnetic field vector: magnitude
F, inclination
I and declination
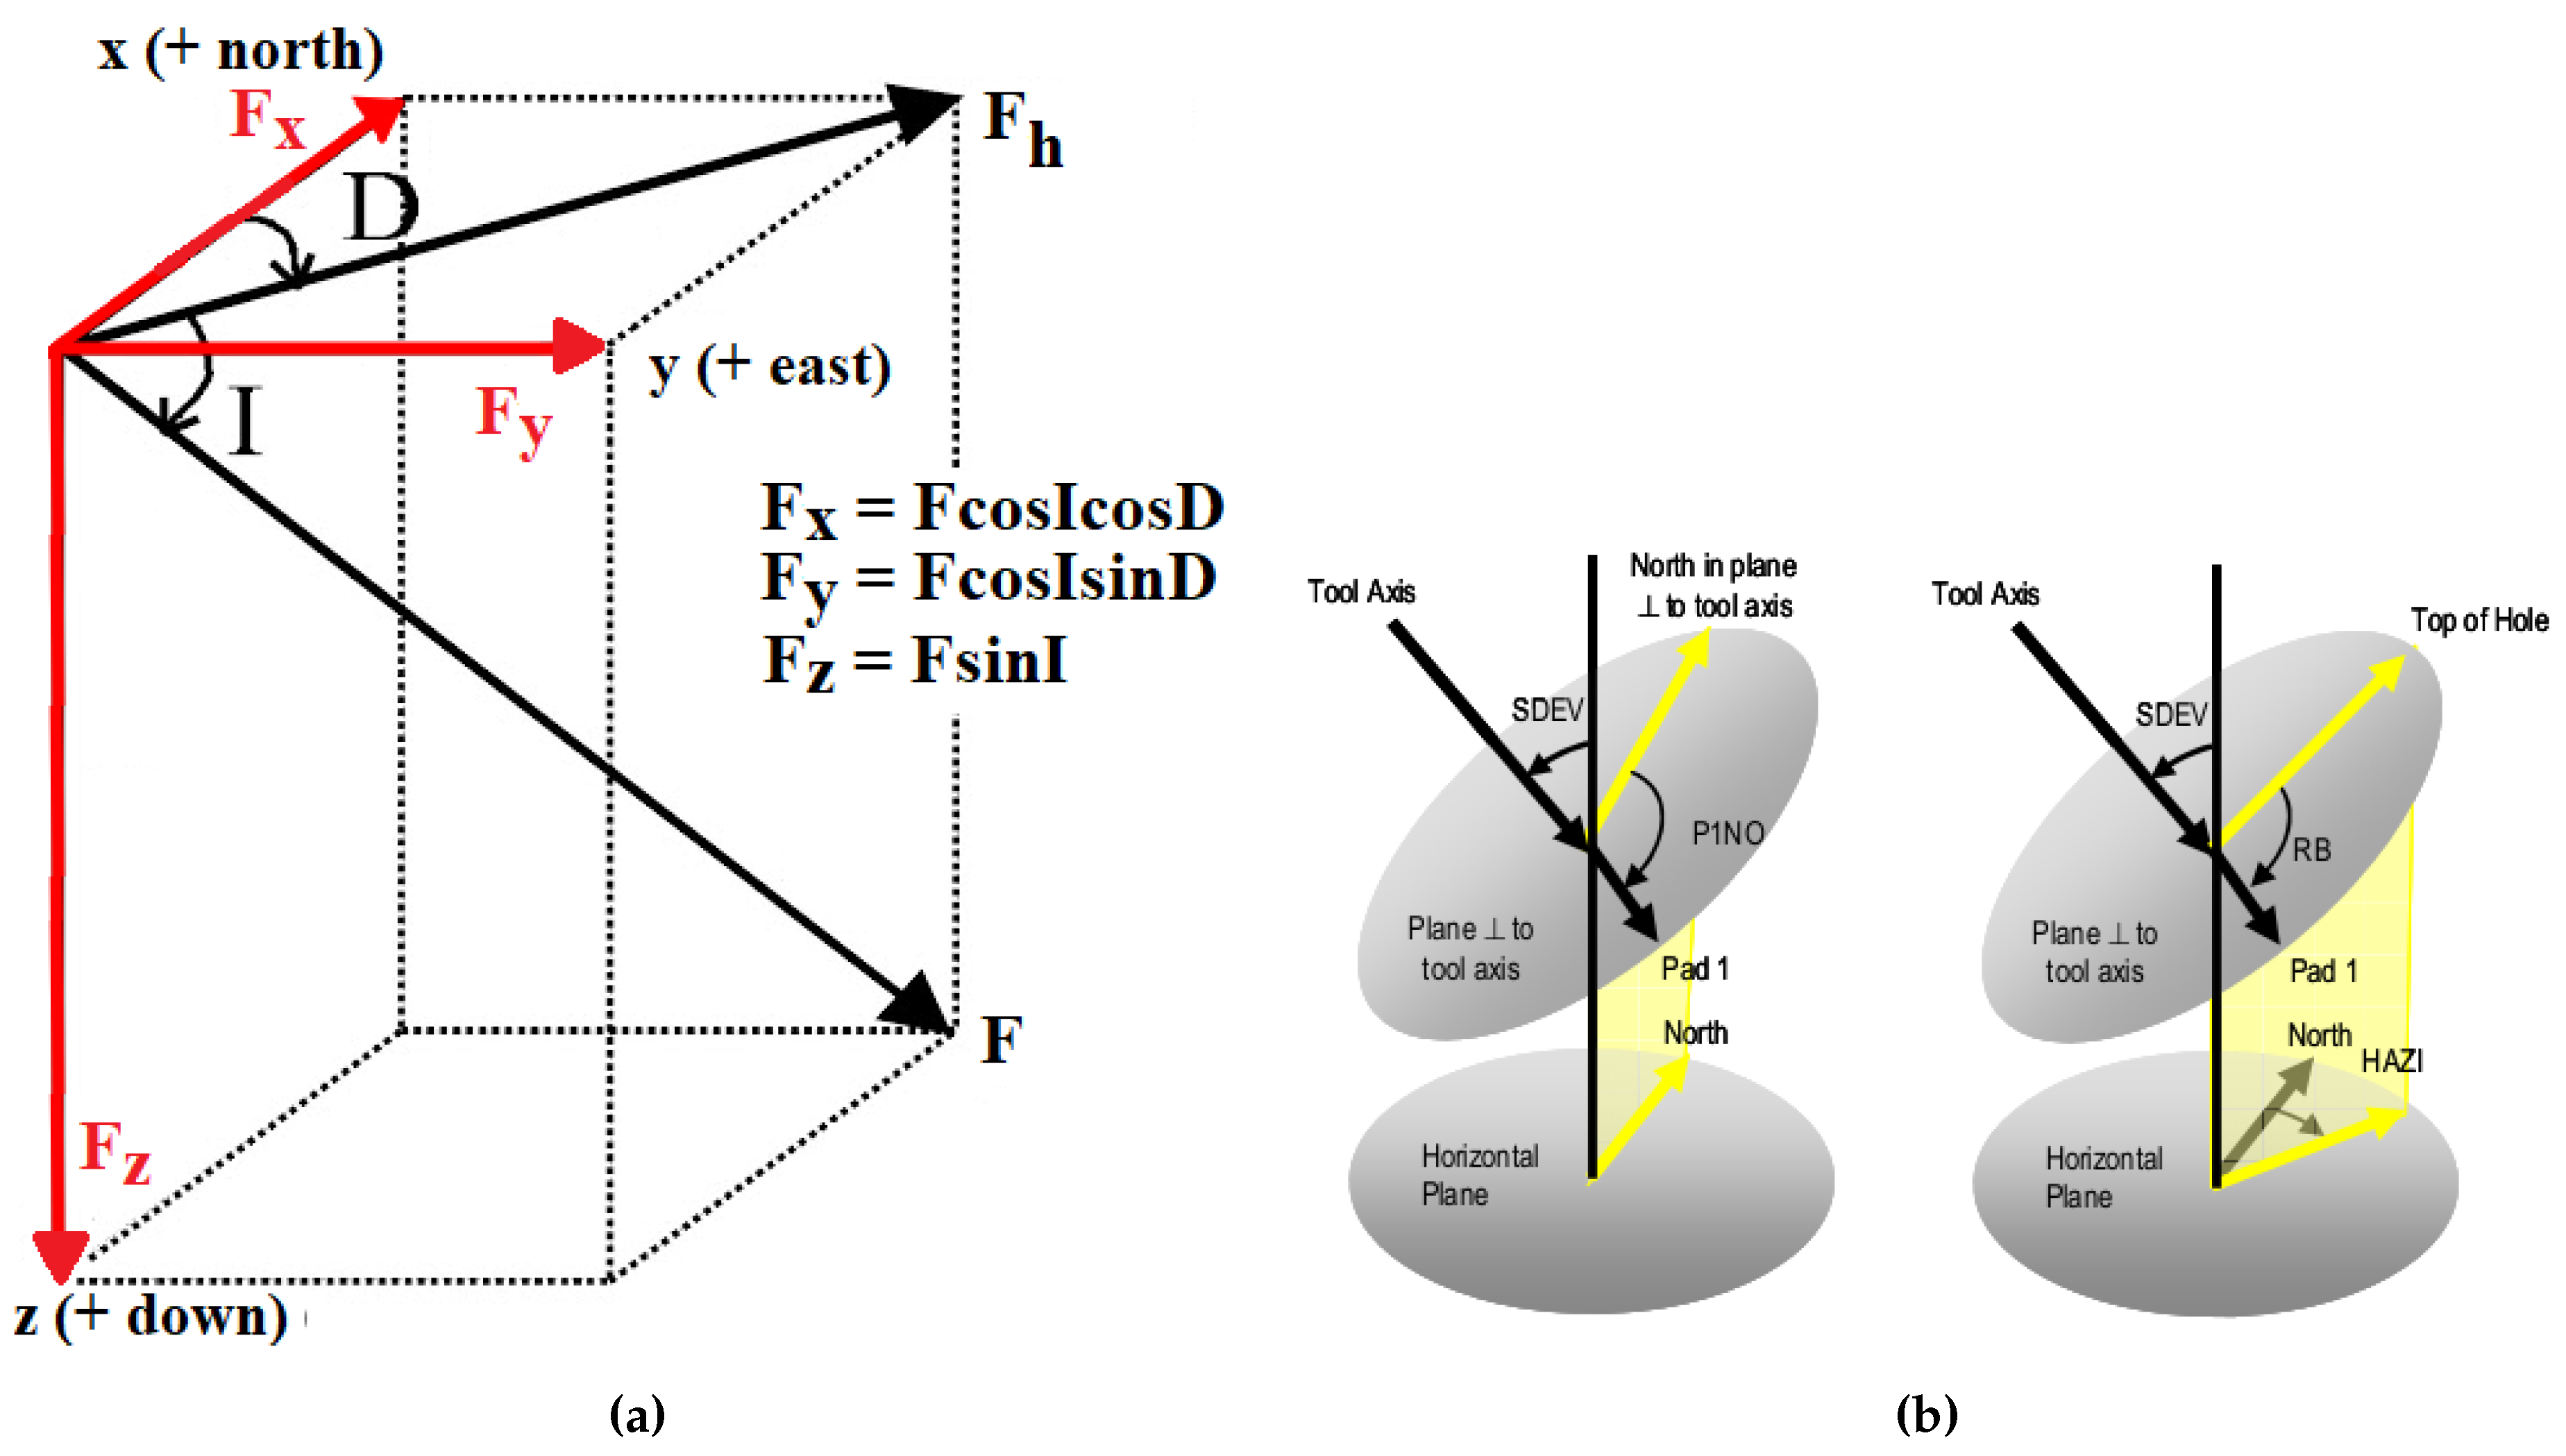
D. Alternatively, the sum can be simplified by decomposing each vector in its components in the x-, y- and z-directions as defined in
Figure 2a. However, the triaxial magnetometers used in image logs to determine tool orientation and/or well direction measure the three components of the magnetic field
F with respect to the tool coordinate system instead of true geographic coordinate system. In order to correctly perform the vector sum in Equation
1 it is necessary to project the field components from the tool’s system into the geographic system described in
Figure 2a.
In the tool orientation system, the x-axis points to the direction of a reference marker, called P1 or Pad #1, located in the plane perpendicular to the z-axis, which for vertical wells correspond to the borehole axis (
Figure 2b). As the tool rotates during logging operations, the tool’s x-axis points not to north as defined in
Figure 2a, but to different directions. Consequently, the magnitude of acquired horizontal components do not represent the true amplitude in north and east direction.
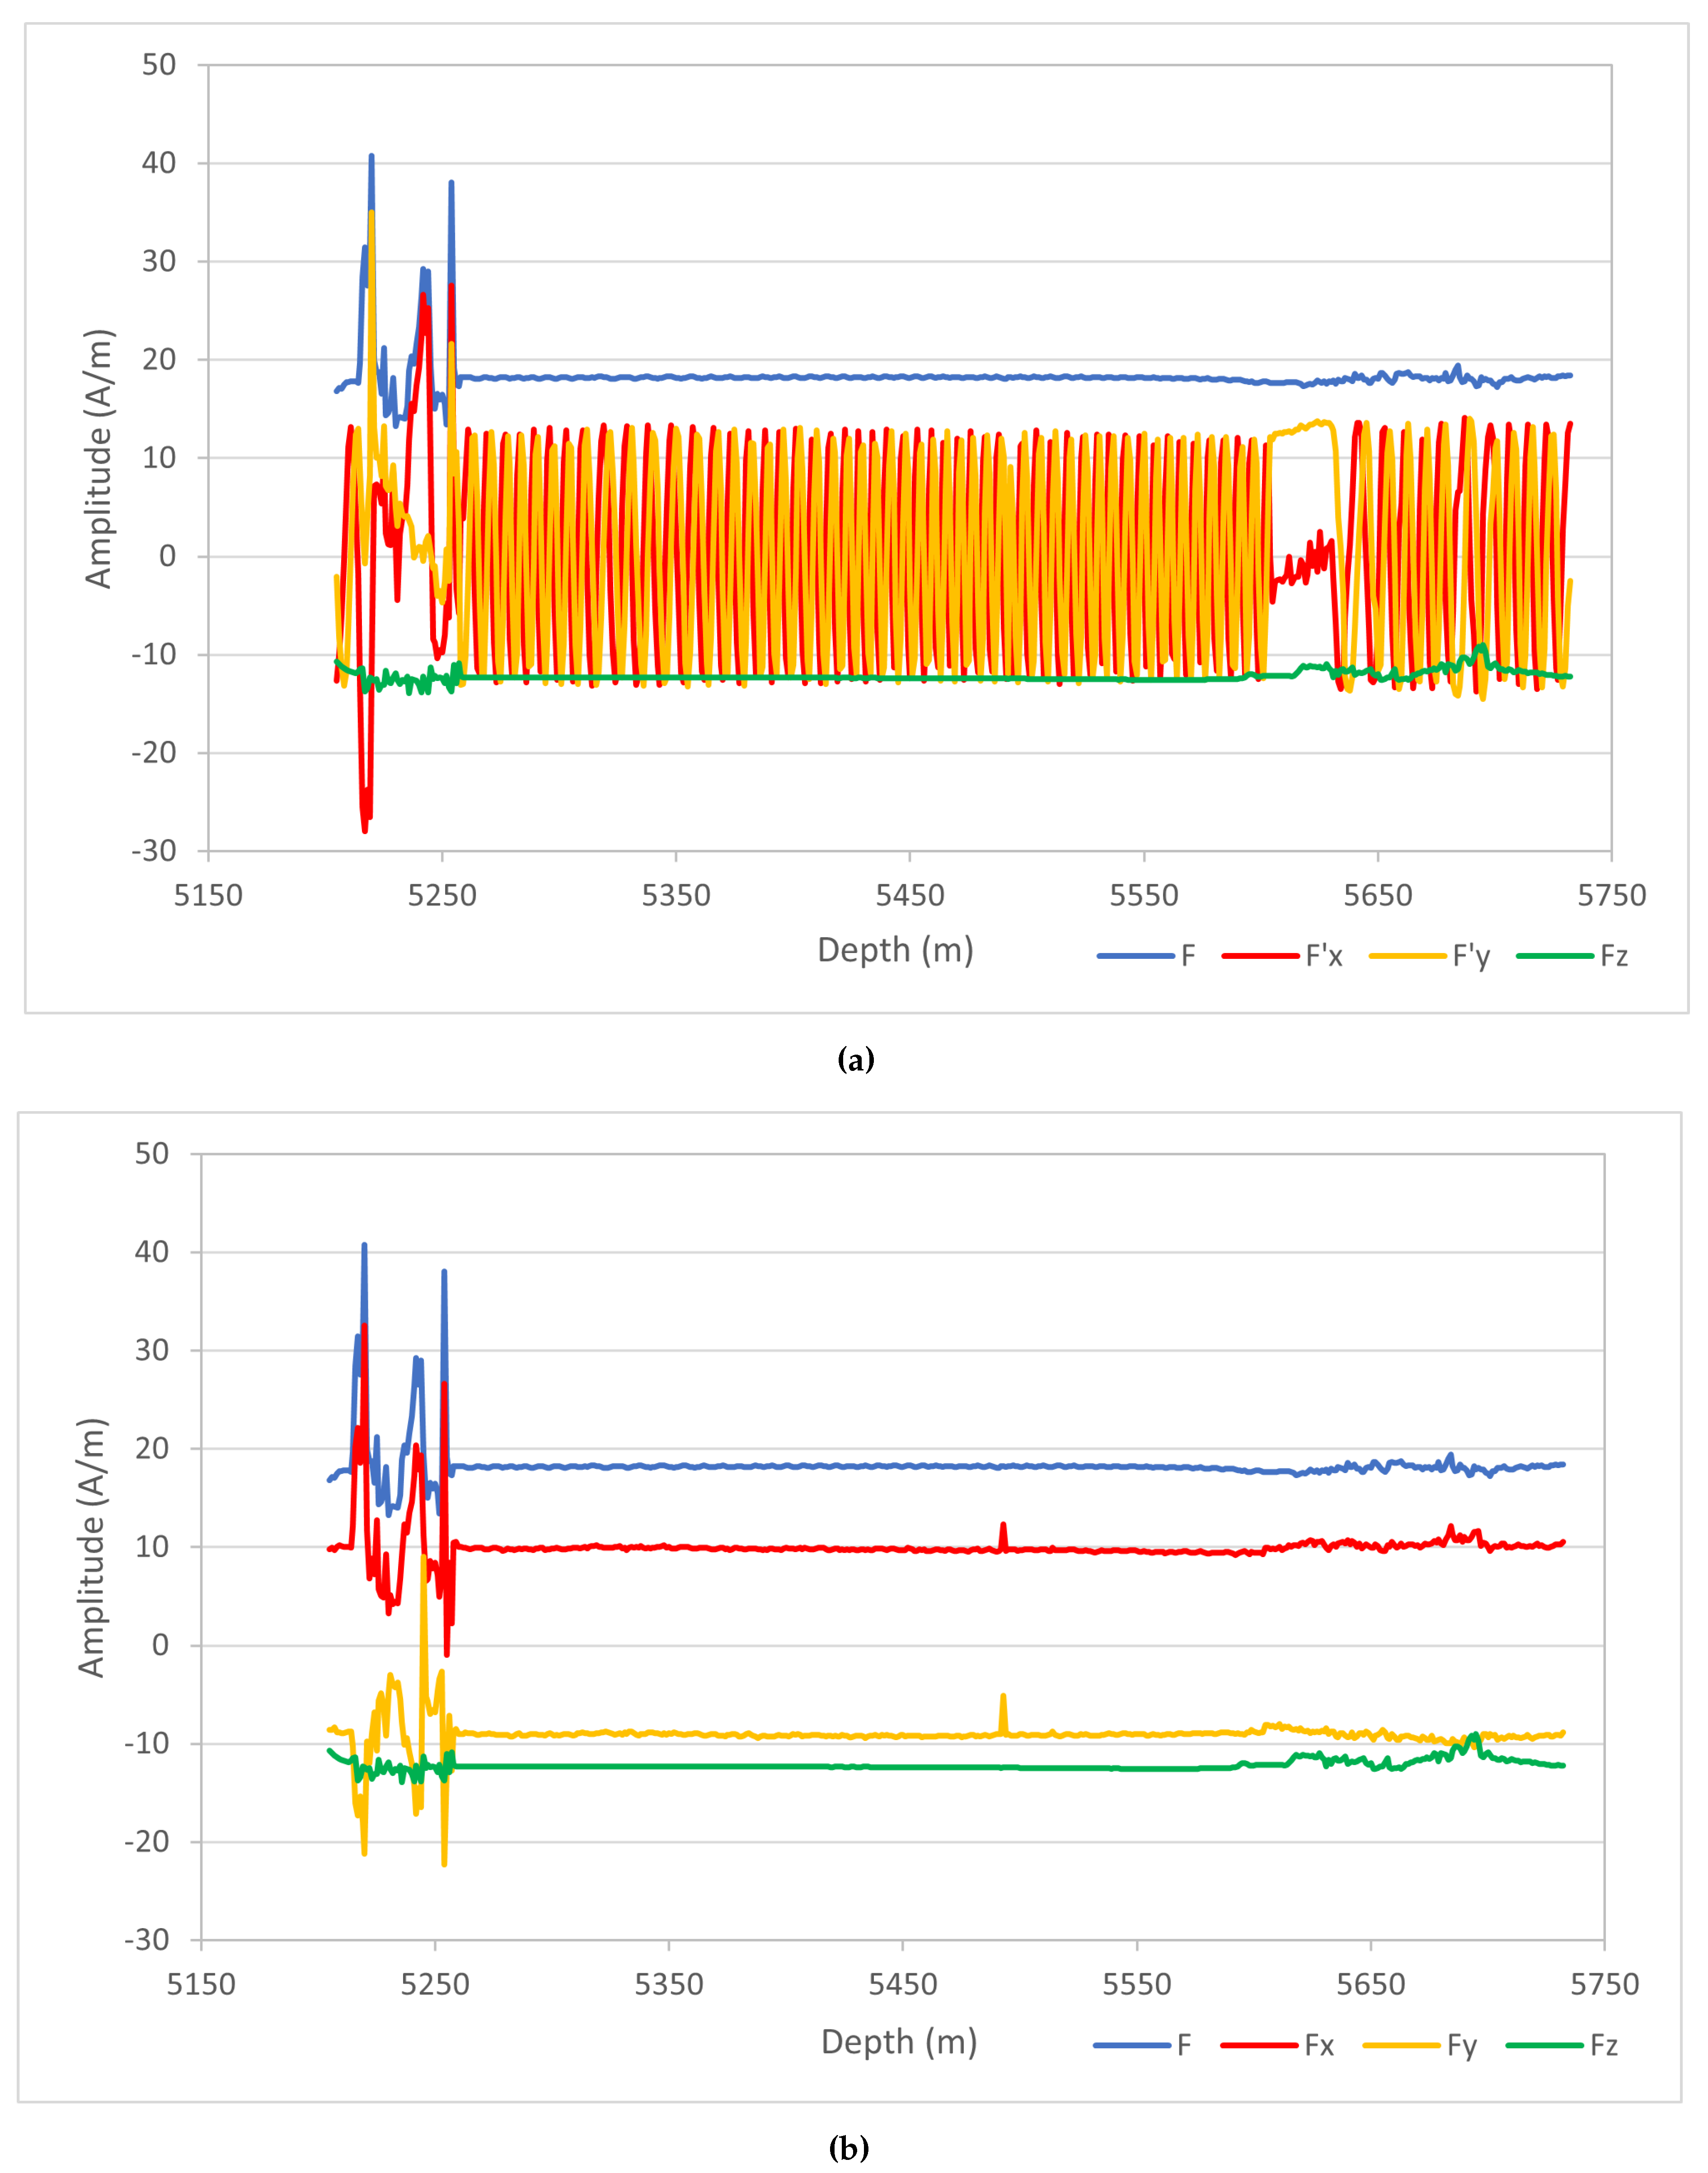
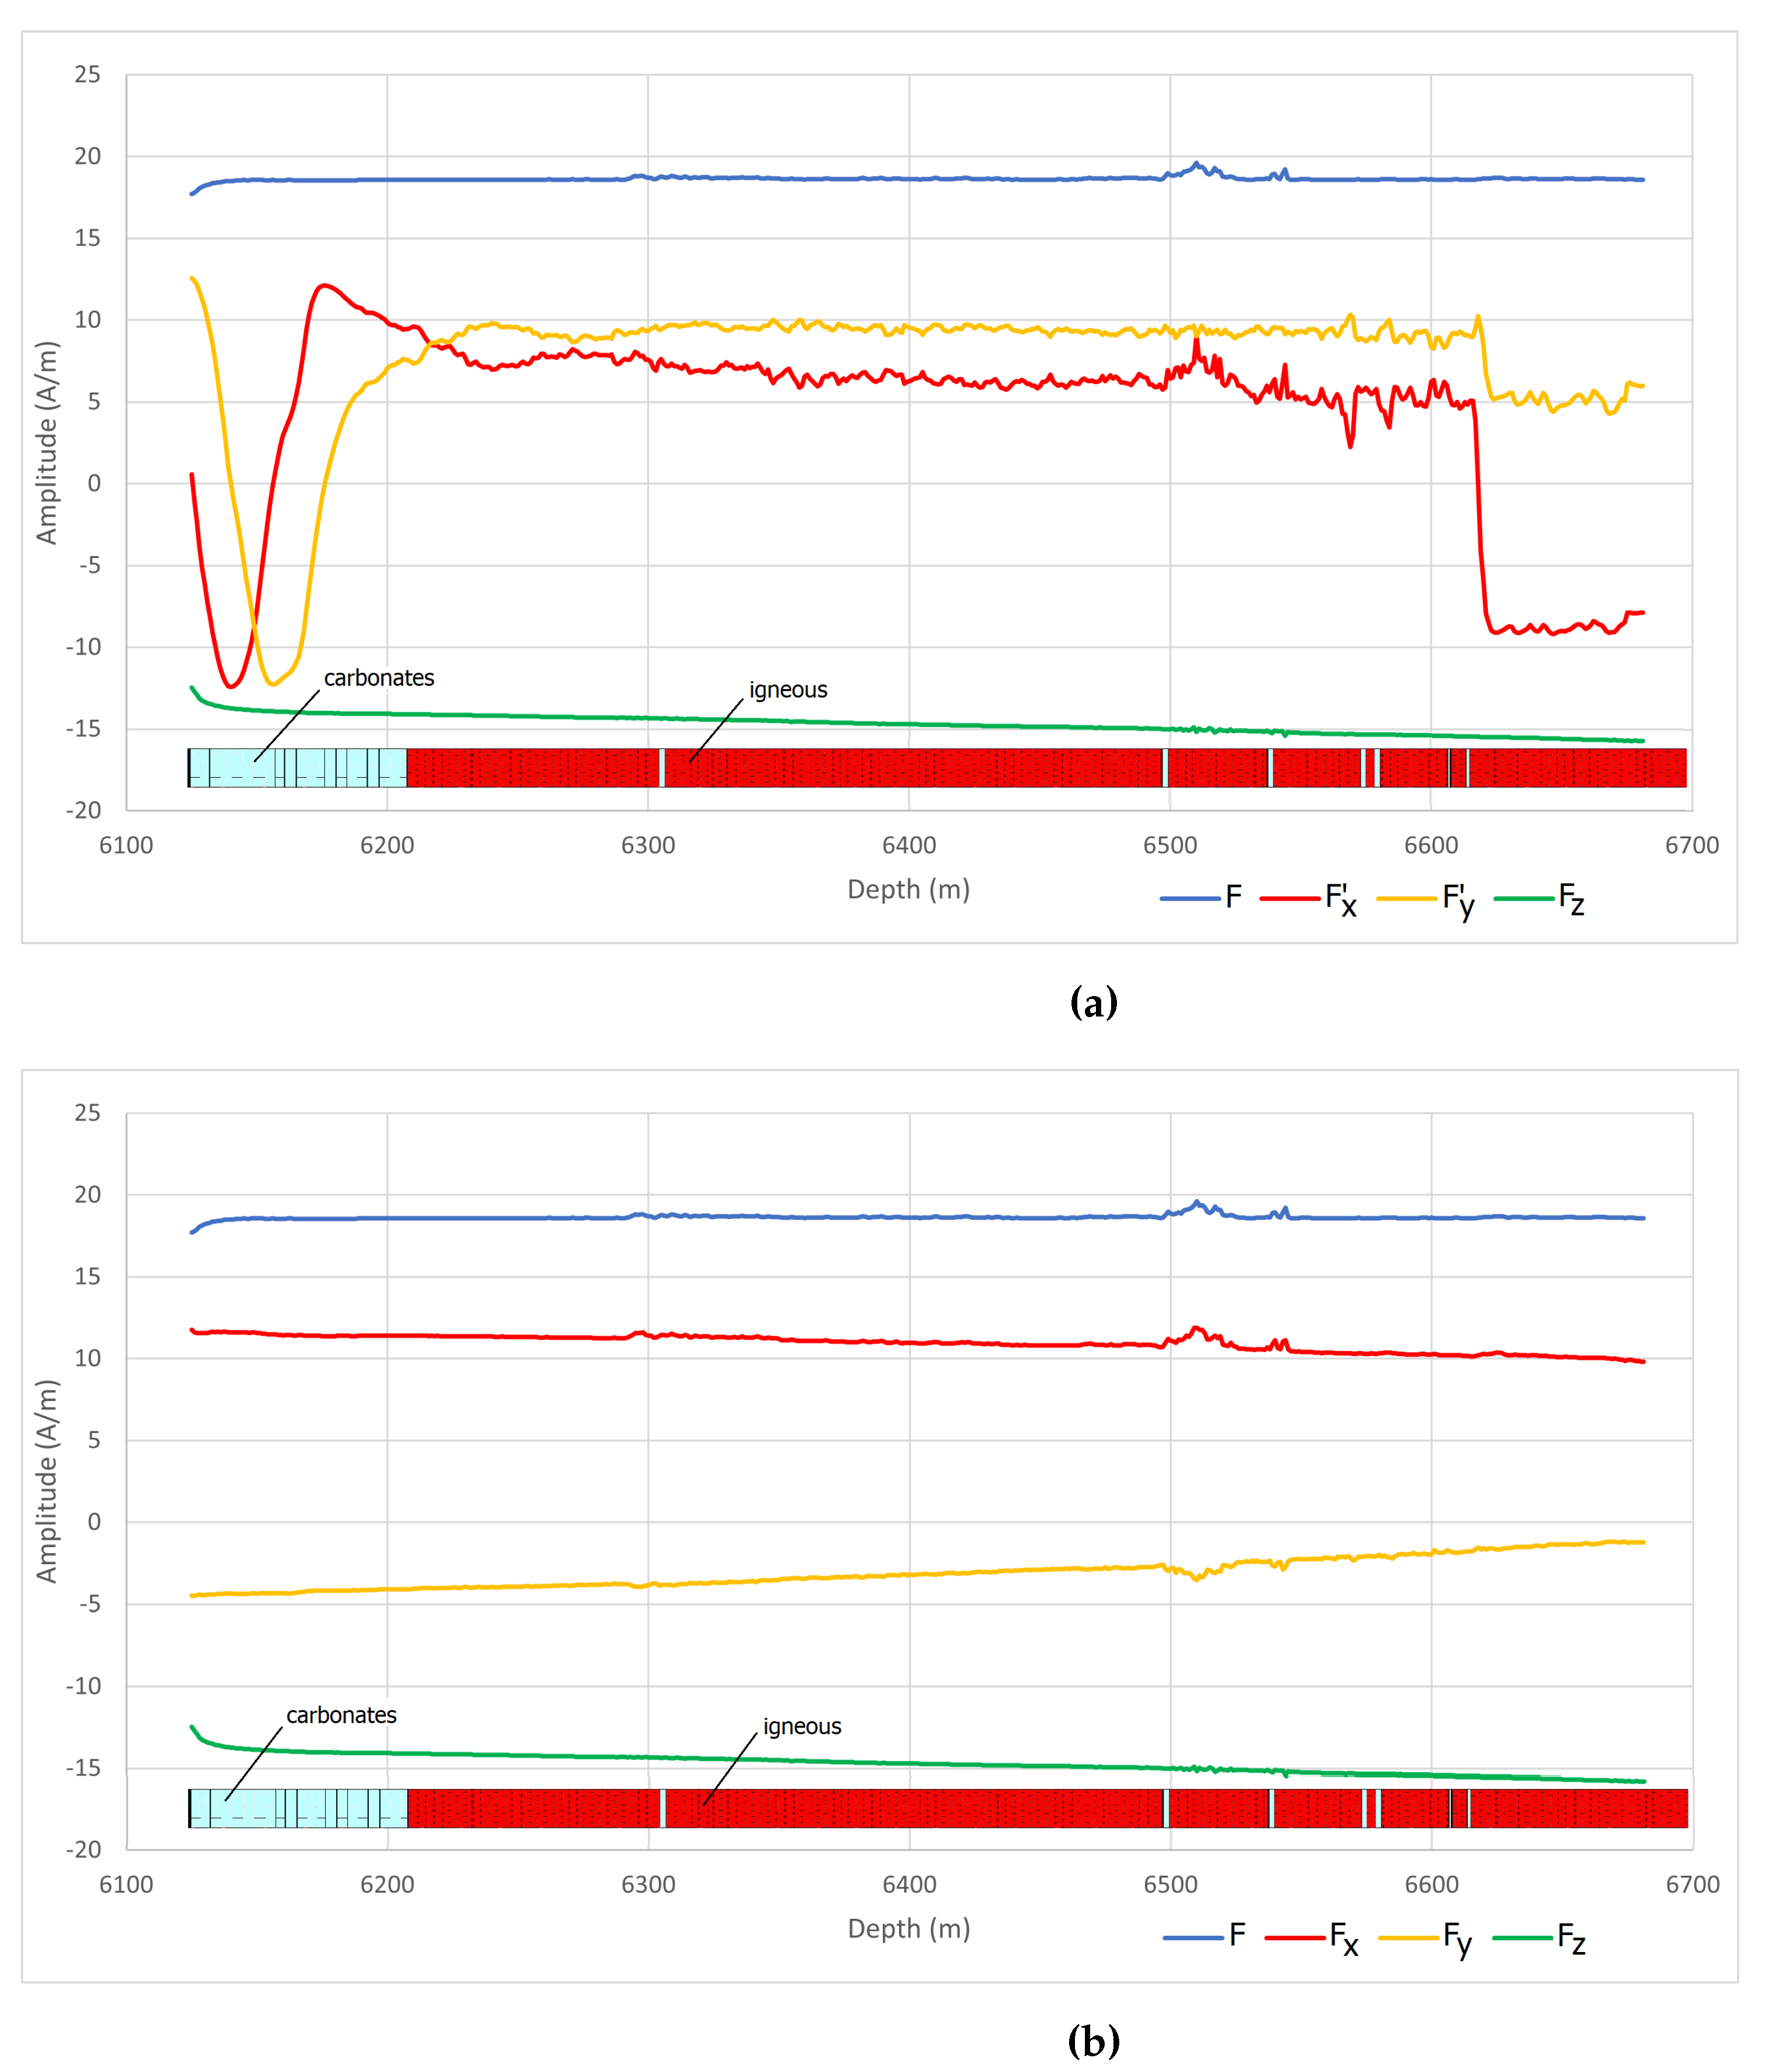
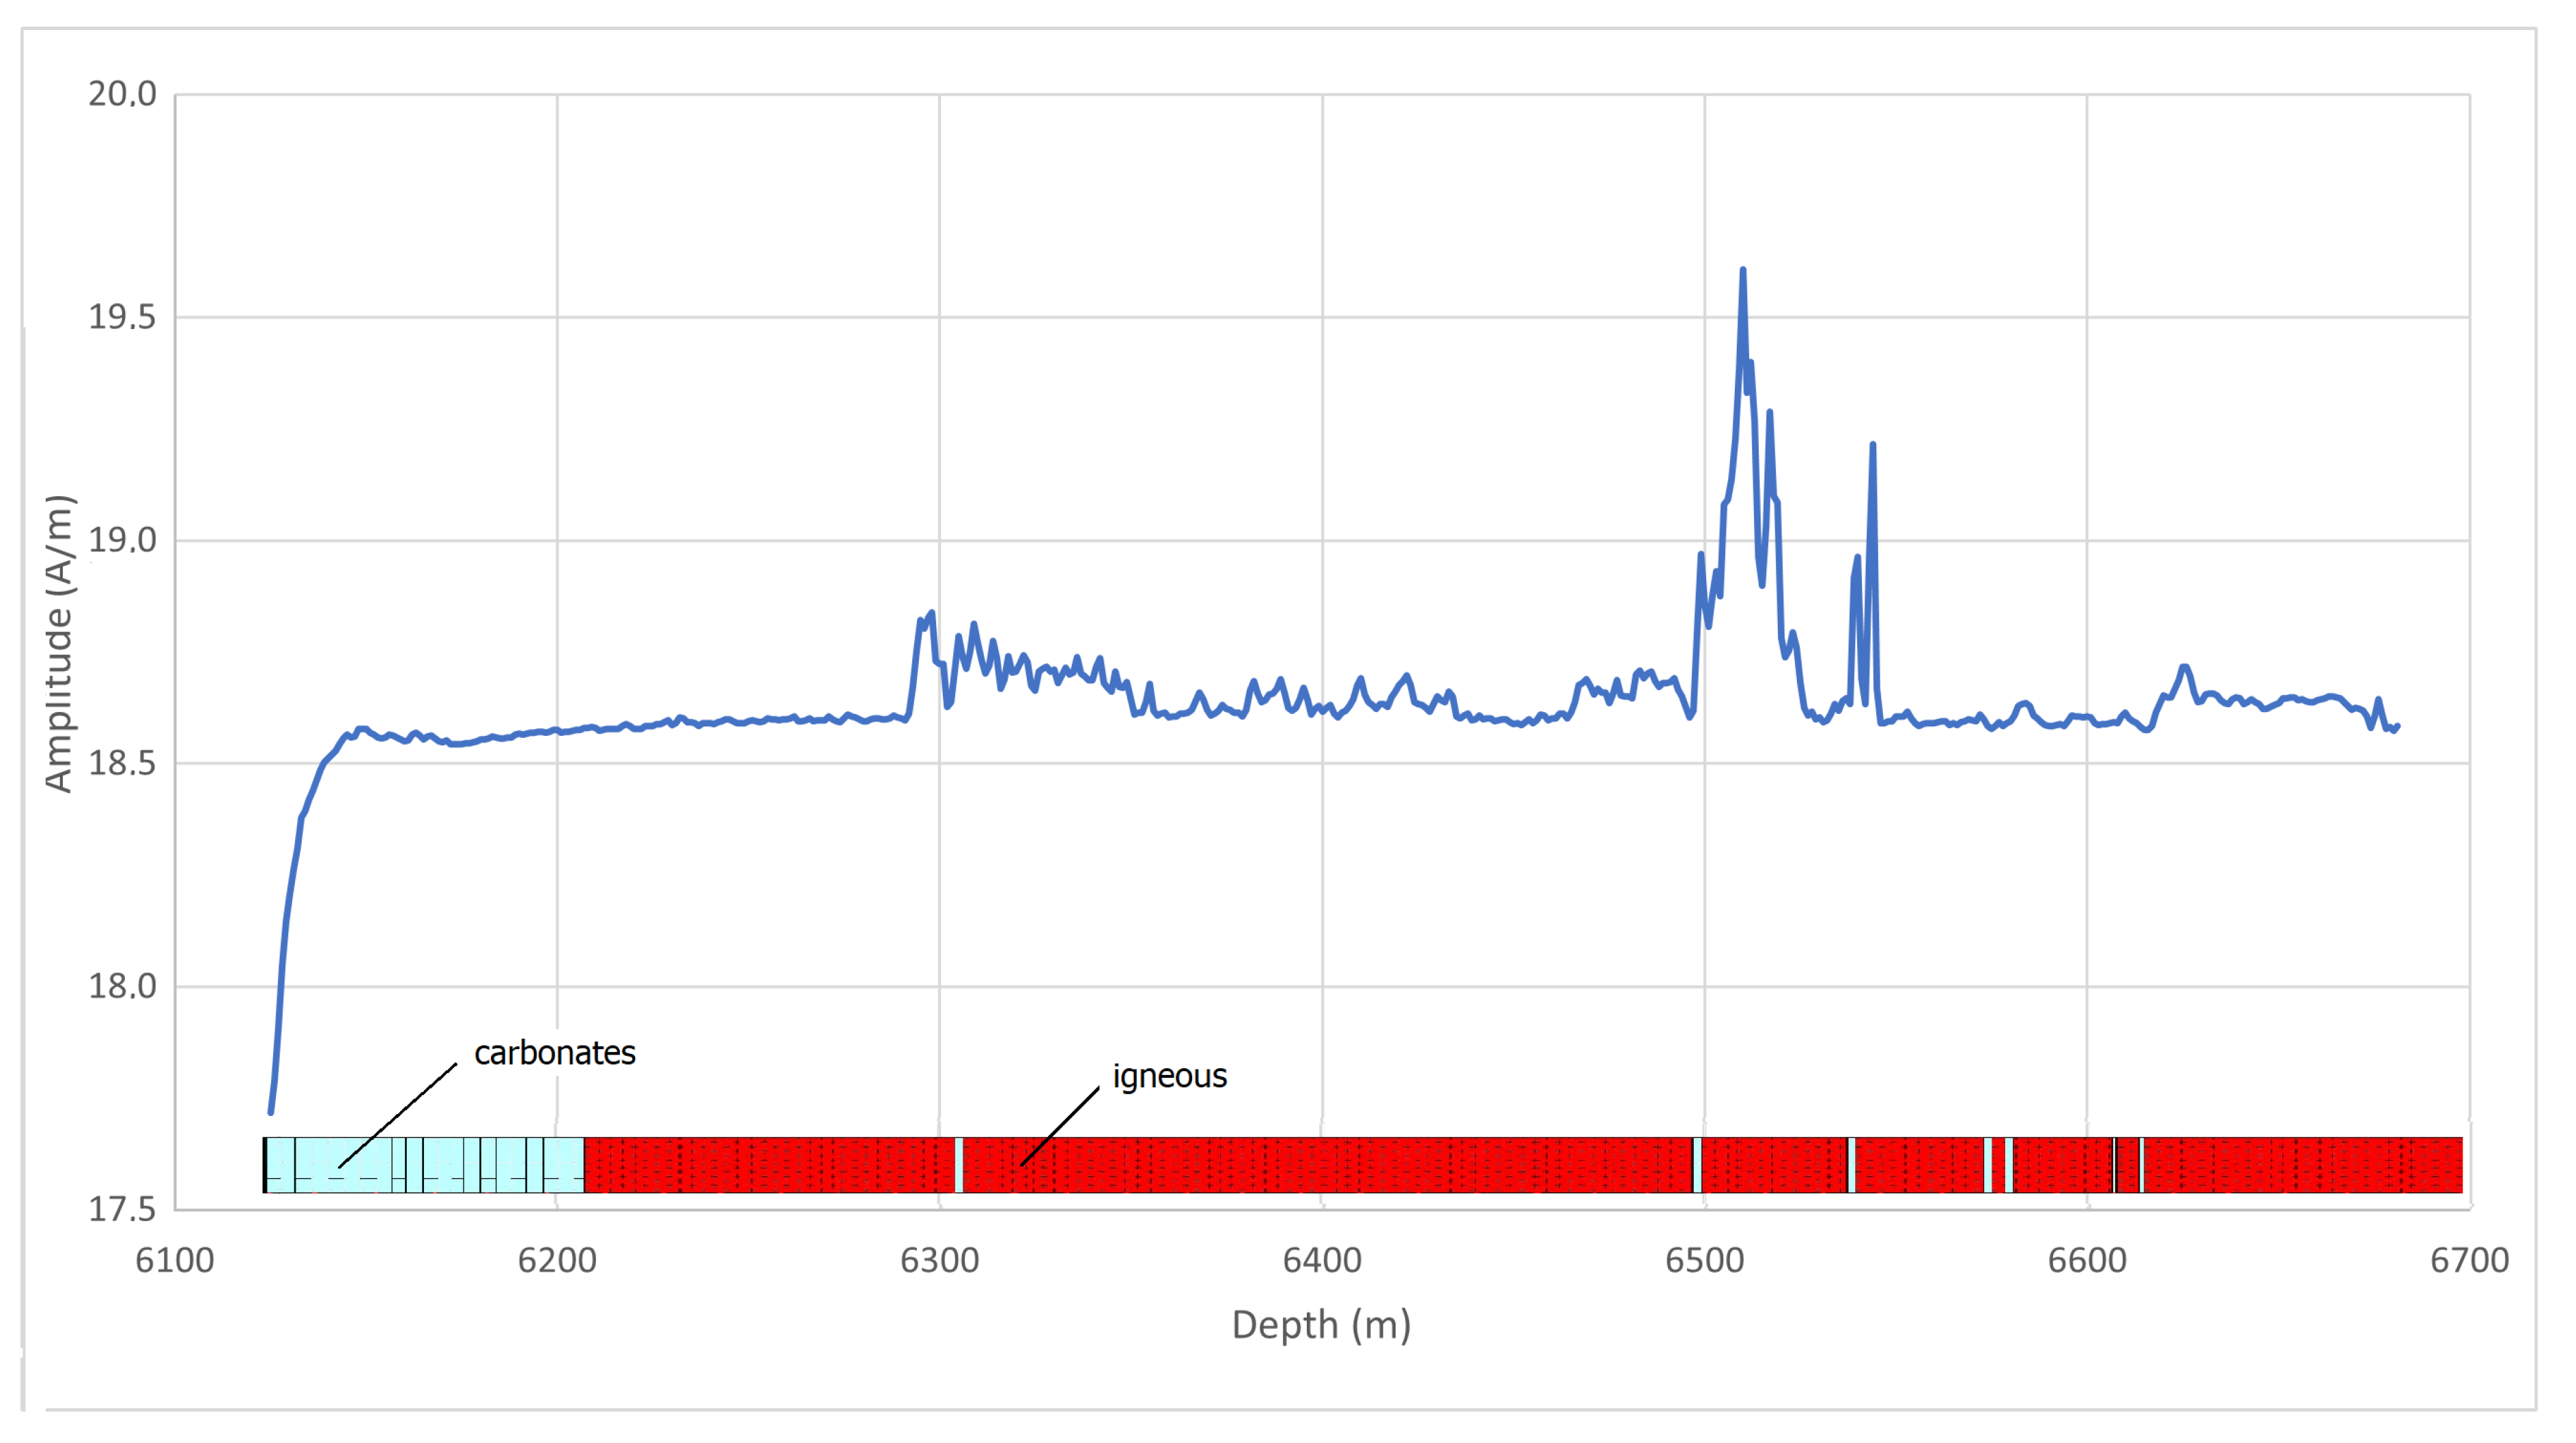
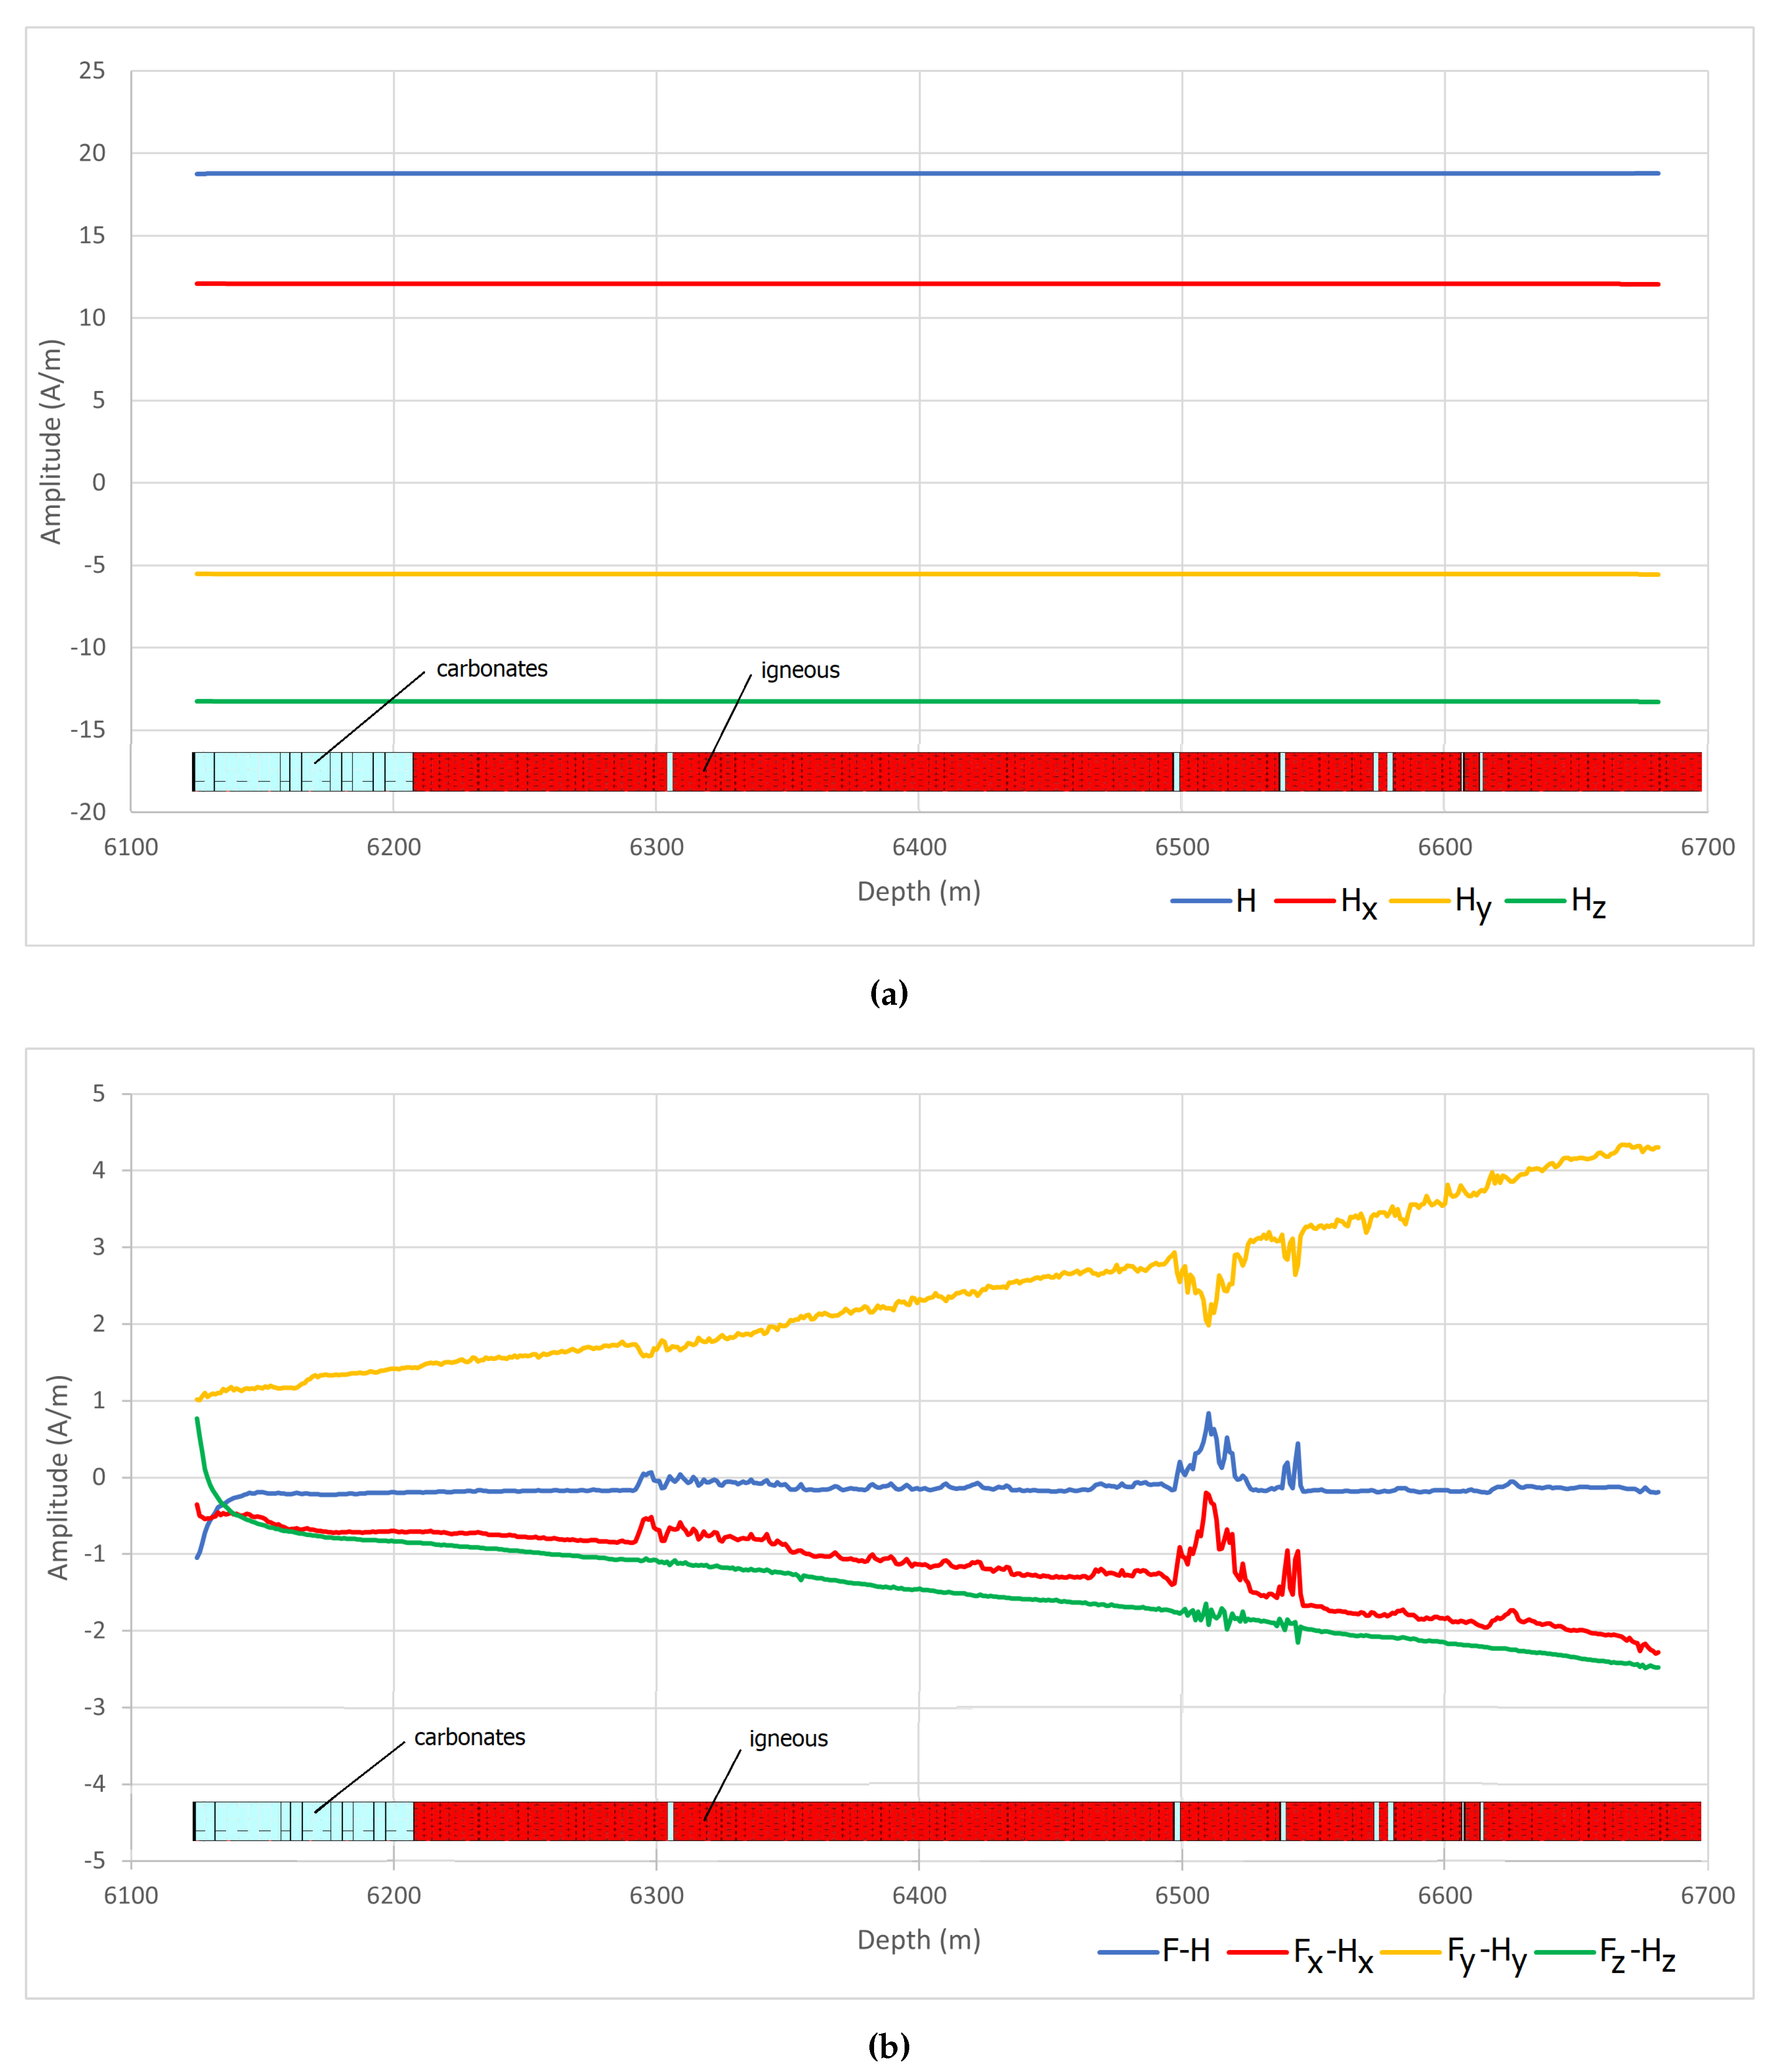
Figure 3a shows the magnetic field acquired in a typical well as an example of the variation in amplitude of the horizontal components caused by the tool’s rotation. The strong fluctuations occurring in the horizontal components of the acquired magnetic field need to be corrected before calculations.
According to [
20] the orientation of the tool in the geographical coordinate system can be described by four angles: Sonde Deviation (SDEV), Hole Azimuth (HAZI), Relative Bearing (RB) and Rotation of P1 from North (P1NO), as illustrated in
Figure 2b. Because P1NO angle represents the rotation of P1 from north, its measurements provide the declination of the tool’s x-axis along the logged interval. It is possible to compute the angle between tool’s x-axis and the direction of measured field using the relations between magnetic field and its components shown in
Figure 2a. The sum of these two angles provide the true magnetic declination of the total inducing field. The calculation of the true declination allows us to compute the correct
and
components by applying again the relations in
Figure 2a using the correct angles this time.
Figure 3b shows the field components after amplitude correction. As expected, the strong fluctuations present in the horizontal components of
Figure 3a were significantly reduced.
Once the true amplitude of the field components has been recovered, estimates for the magnetic susceptibility
can be made using two different approaches. The first and more simplistic case is that of sedimentary rocks. Since the majority of sedimentary rocks has very low content of ferromagnetic minerals, which are responsible for retaining magnetization, we assume that remanent magnetization is not preserved in these rocks. In such cases, Equation
1 simplifies to:
where
may represent any of the
x,
y and
z directions. In this case, the magnetic susceptibility
can be easily calculated by:
The second approach assumes the presence of a natural remanent magnetization
caused by the existing magnetic field at the time that rocks with high content of ferromagnetic minerals were formed. This case leads to a situation where there is only one equation and two unknowns
and
as:
However, if we assume
and
as constant along some measured interval, we will have
n measurements of
and can also get
n values for
in the same interval. This allows us to construct a system of
n equations and two unknowns
and
:
which in matrix form becomes:
These systems can be solved for
and
using the least squares method. So, the mean value of
and the magnitude of vector
will be given by:
Additionally, the inclination
and declination
of the remanent magnetization may be estimated by rearranging Equation
4 in terms of the remanent magnetization, and making use of the spatial relations shown in
Figure 2a. Therefore, we can define the remanent magnetization components as:
The vertical components of remanent magnetization in Equation
8 allows to estimate the inducing remanent field inclination
with the help of previously estimated remanent magnetization magnitude
,
Similarly, remanent magnetization declination
can be estimated from the horizontal components of remanent field (
and
) as:
The estimates of magnitude
, inclination
and declination
completely define the remanent magnetization.
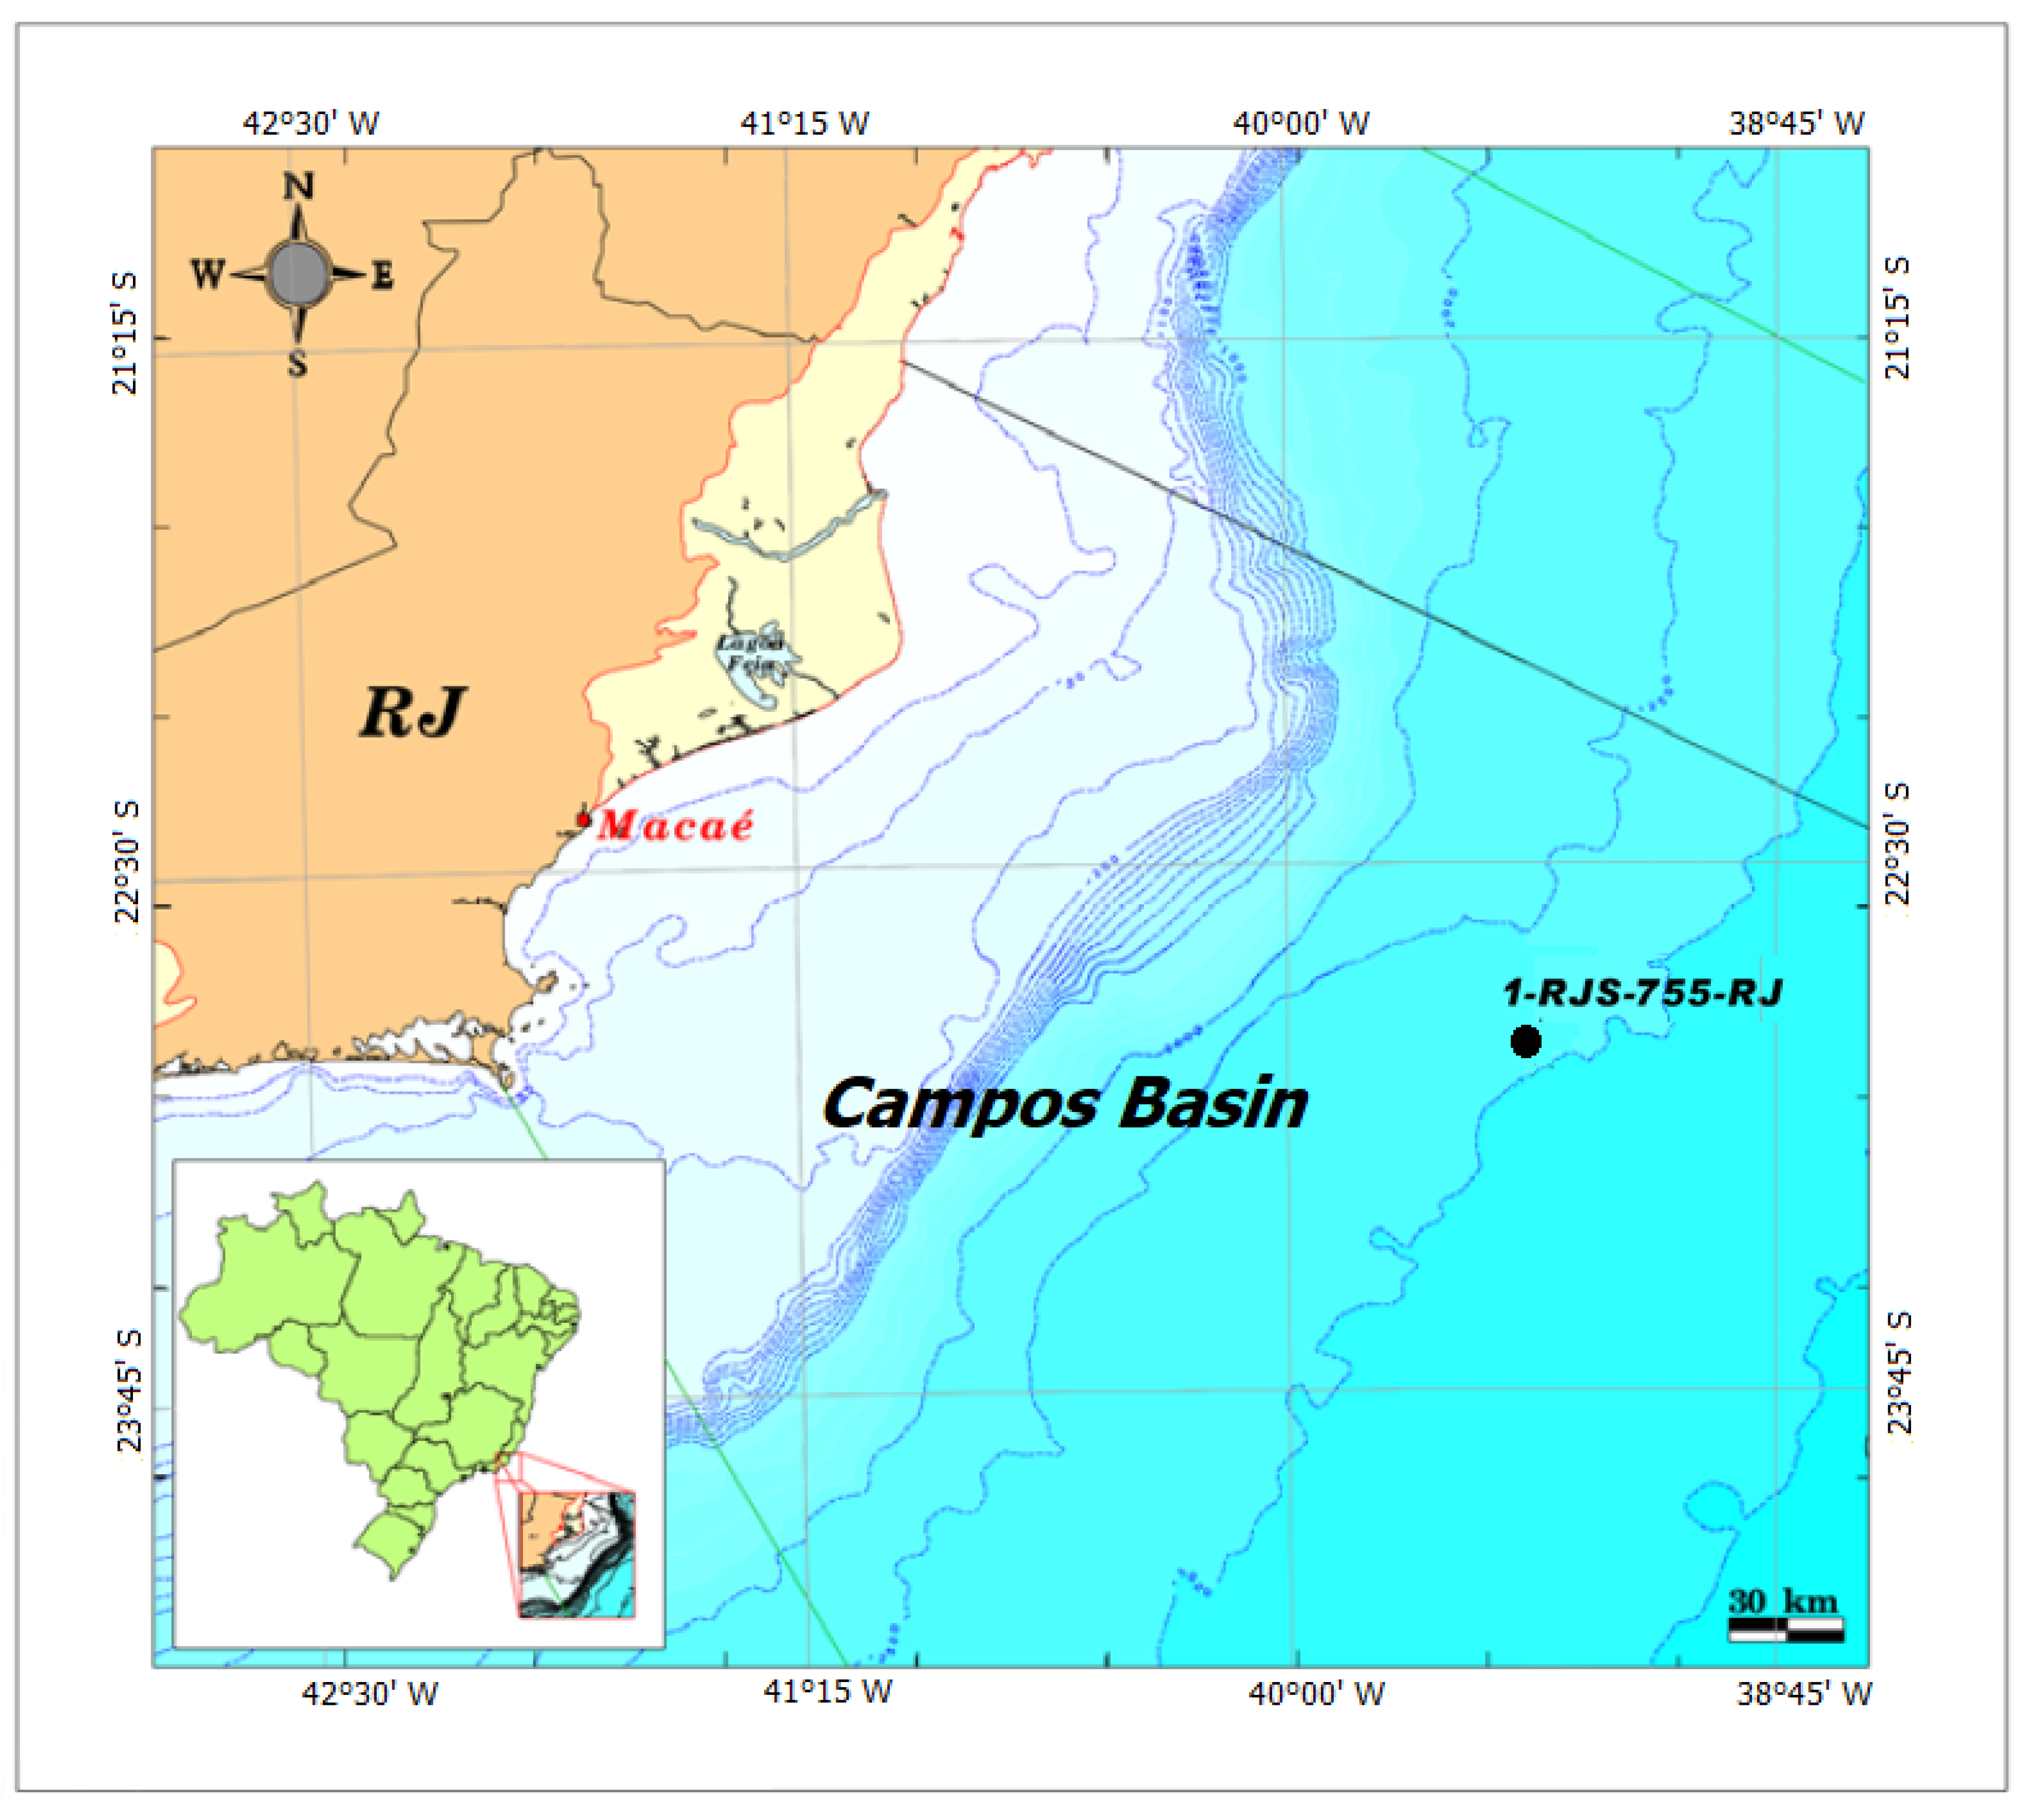
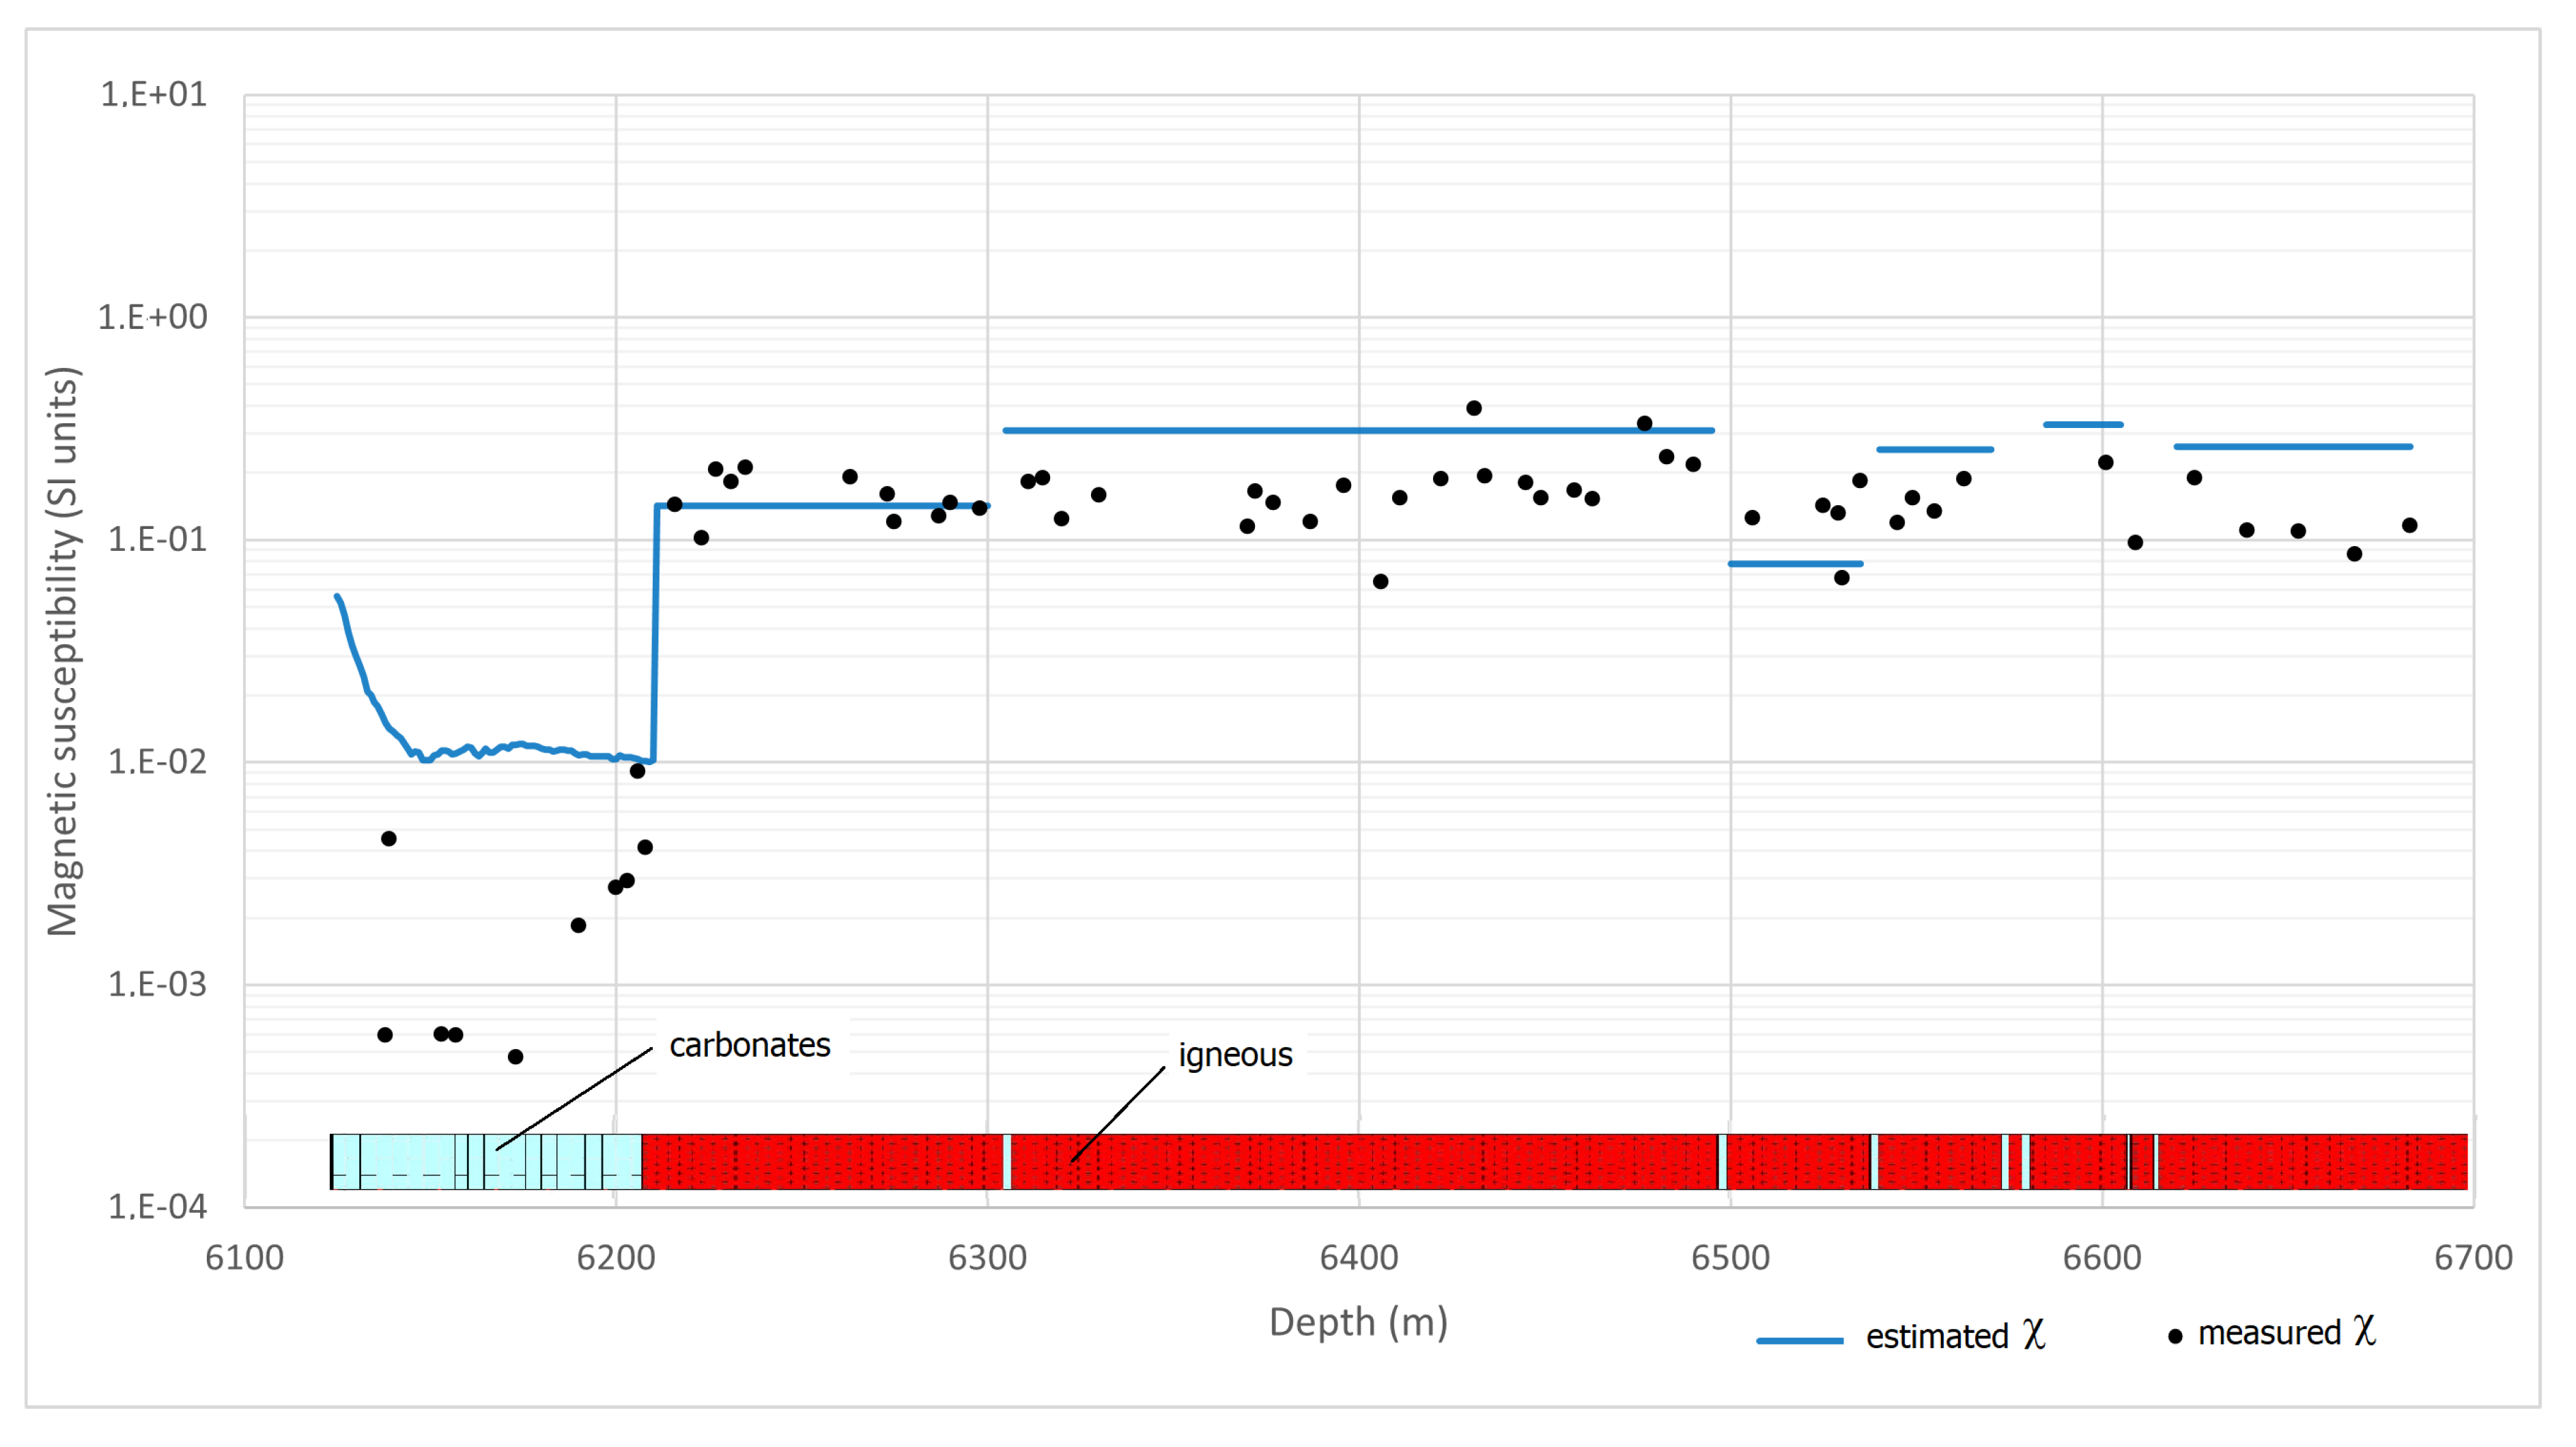
We have shown that estimates of magnetic susceptibility and remanence are possible through simple calculations when magnetic field data from orientation tools in borehole imaging logs are available. The proposed methodology was applied to real data example from Campos Basin, Brazil.

