Preprint
Article

Anthoteibinenes F–Q, New Sesquiterpenes from the Irish Deep-sea Coral Anthothela grandiflora

Altmetrics

Downloads

36

Views

19

Comments

0

Submitted:

06 December 2024

Posted:

06 December 2024

You are already at the latest version

Alerts
Abstract
New technology has opened opportunities for research and exploration of deep-water ecosystems, highlighting deep-sea coral reefs as a rich source of novel bioactive natural products. During our ongoing investigation of the chemodiversity of the Irish deep-sea and the soft coral Anthothela grandiflora, we report 12 unreported cadinene-like functionalized sesquiterpenes, anthoteibinenes F-Q. The metabolites were isolated using both bioassay- and 1H NMR-guided approaches. 1D/2D NMR spectroscopy and high-resolution mass spectrometry were used for structure elucidation, while a combination of NOESY NMR experiments, GIAO NMR calculations coupled with DP4+ probabilities measures, and ECD comparisons were incorporated to propose relative and absolute configurations of the anthoteibinenes. The metabolites were screened against the Respiratory Syncytial Virus (RSV), ESKAPE pathogens, five Candida albicans strains and one strain of C. auris.
Keywords: 
Subject: Chemistry and Materials Science  -   Organic Chemistry

1. Introduction

Over 60% of marketed drugs are natural products or their derivatives, making this source of new chemodiversity significant in the continuing search for new pharmaceuticals [1]. Marine organisms from the deep-sea have gained attention in recent years due to their promising secondary metabolites and new technology, like remotely operating vehicles (ROVs), making it possible to investigate these relatively unexplored areas [2,3]. Organisms found in the deep-sea have the potential to produce unique metabolites due to the unique combination of predators and physical environment, including lack of light and low levels of oxygen [4]. Our group has recently reported five new cadinene-like sesquiterpenes from the Irish deep-sea soft coral Anthothela grandiflora, with unusual substitution by dimethylamine-bearing groups [5], illustrating the unique chemistry that denizens of the deep-sea have to offer. Herein, we report on our continuing investigation of the deep-sea coral A. grandiflora.
Our specimens of A. grandiflora were collected from the Whittard Canyon, south of Ireland, at depths between 1304-1814 m. A lipophilic extract was screened for biological activity to identify its potential as a drug target. The screening identified the extract as a promising hit for multiple Candida strains and demonstrated anticonvulsive activity in a zebrafish model. Based on its activity profile, the extract was chosen for fractionation using a 1H NMR-guided approach until purified metabolites were obtained. We report here the isolation of 12 new sesquiterpenes, anthoteibinenes1 F–Q, bearing the cadinene carbon scaffold. Structure elucidation of the metabolites was achieved using 1D and 2D NMR and HRESIMS/HREIMS. Relative configurations of the anthoteibinenes were determined by NOE, J analysis, 1H and 13C shift predictions and DP4+ probability analysis [6,7,8,9]. Comparisons of predicted and experimental ECD spectra were used to assign the absolute configuration.

2. Results and Discussion

2.1. Isolation of the Anthoteibinenes

Dichloromethane and methanol extracts of Anthothela grandiflora were fractionated into six fractions each of decreasing polarity using reversed phase vacuum liquid chromatography (VLC). The twelve fractions were screened in a zebrafish model of epilepsy [10]. The preliminary data indicated the methanol extract to display anticonvulsant activity. Upon fractionation, 1H NMR spectroscopy identified samples with multiple methyl singlets, indicative of potential terpenoid metabolites. Repeated rounds of fractionation using reverse phase chromatography yielded 12 new cadinene-like sesquiterpenes, anthoteibinenes F-Q (Figure 1).
The twelve anthoteibinenes reported herein lack the amine feature previously reported [5], but share structural features useful for structure analysis. Anthoteibinenes F-H (13) each finds the cadinene C-14 position oxidized and cyclized into a furanone ring, while I-L (47) are similarly metabolized but with resultant furan rings. Anthoteibinene L (7) is further distinguished as the only halogenated member of the metabolite family. Three anthoteibinenes, M-O (810), have unadorned carboxylic acids at C-14. Of the remaining anthoteibinenes, one, P (11), is unsubstituted at C-14, while Q (12) is a C-14 nor-sesquiterpene.

2.1.2. The Furanone Anthoteibinenes (1–3)

Anthoteibinene F (1) was found with the molecular formula C15H20O3 (m/z 249.1503 [M + H]+), which requires six degrees of unsaturation. The 13C NMR spectrum (Table 1) corroborated the formula, displaying 15 carbons signals, including five quaternary carbons, four methine, three non-equivalent methylene, and three methyl groups. The 1H NMR data (Table 1) shows signals for an olefinic methine at δH 5.58 (H-5), three aliphatic methines, δH 1.19 (H-7), δH 2.12 (H-11) and δH 3.00 (H-6), three non-equivalent methylene groups at δH 1.35/δH 1.91 (H-8a/H-8b), δH 2.09/δH 2.42 (H-9a/H-9b), and δH 2.50/δH 2.71 (H-3a/H-3b), and three methyl groups at δH 0.89 (H3-13), δH 1.03 (H3-12), and δH 1.77 (H3-15). This accounts for 19 protons, suggesting one exchangeable proton.
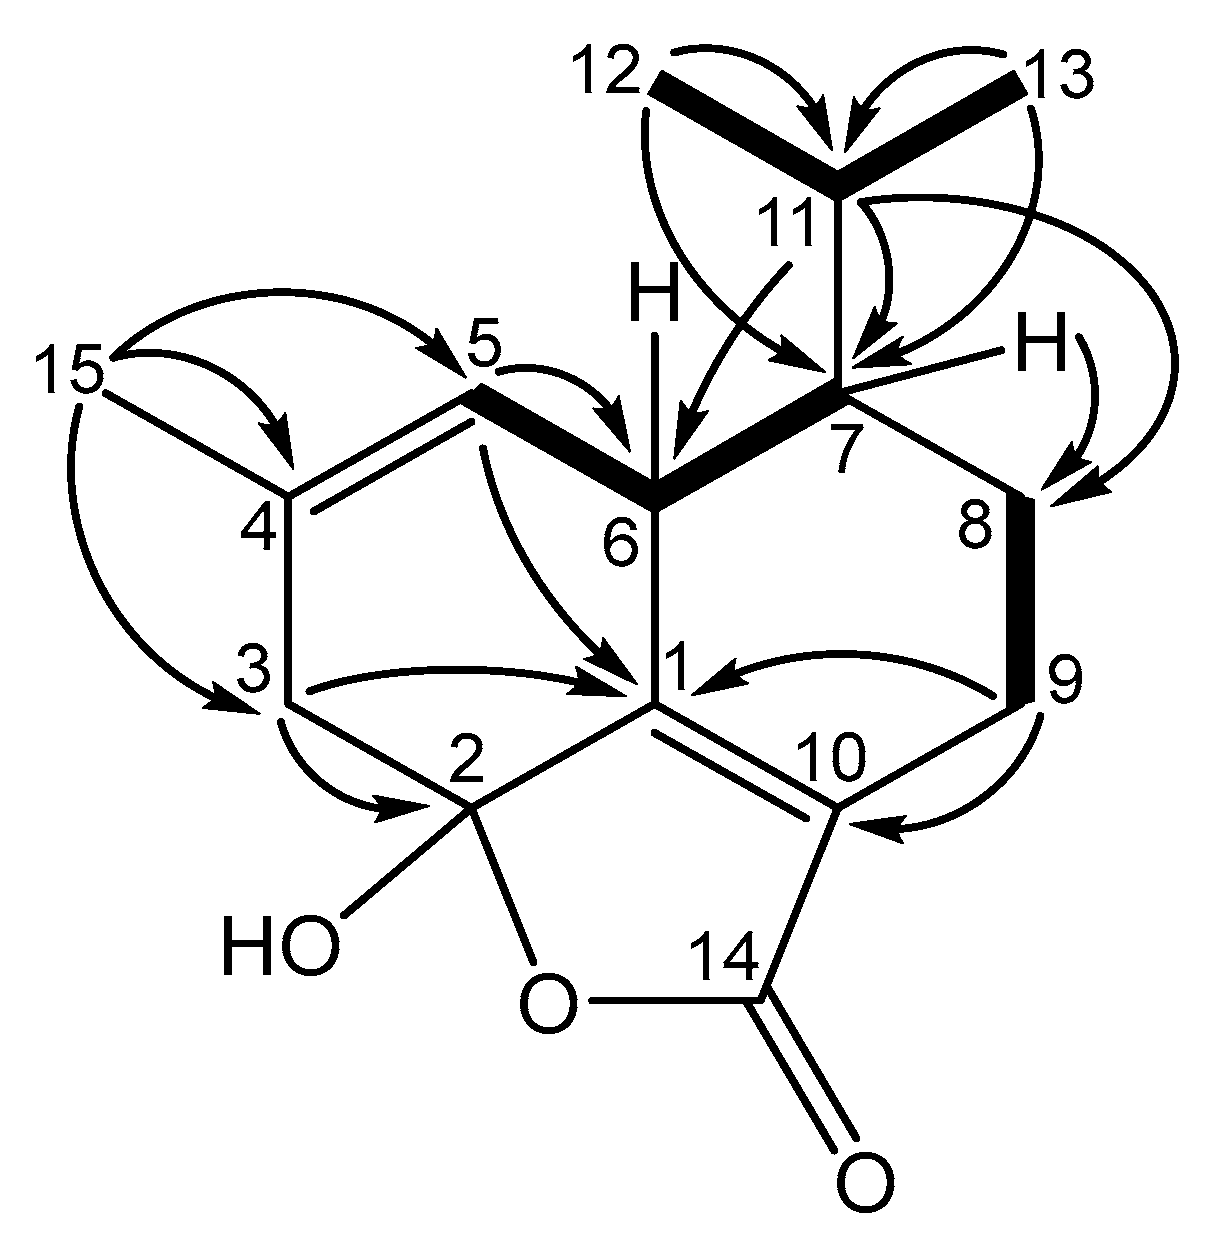
Key COSY correlations in anthoteibinene F (1) (Figure S5) from H-6 (δH 3.00) to H-5 (δH 5.58) and H-7 (δH 1.19), and from H2-8 to H2-9 were combined with HMBC correlations from H-7 to C-8 (δC 21.1), H2-9 to C-10 (δC 127.1) and C-1 (δC 162.0) to establish a spin system comprising nearly half of the carbon atoms (Figure 2). COSY correlations from H-11 to both H3-12 and H3-13 suggested the presence of the isopropyl group observed in other anthoteibinenes; HMBC correlations from H3-12 and H3-13 to C-11 (δC 26.8) and C-7 (δC 45.3) established its attachment to C-7. This was corroborated by HMBC correlations from H-11 to C-6 (δC 35.5), C-7 (δC 45.3), and C-8 (δC 21.1). The growing spin system could be further extended by observation of methyl singlet (H3-15) HMBC correlations to C-3 (δC 43.4), C-4 (δC 131.1), and C-5 (δC 120.3). The olefinic proton H-5 displays an HMBC correlation to C-6 and C-1, revealing a six-membered ring as part of the spin system. A second, fused, six-membered ring could be established by observation of H-3a HMBC correlations to C-1 and C-2 (δC 102.0). The chemical shift of C-2 recommends it as a hemi/ketal, which, taken with the last open valence on C-10, accommodates the remaining unaccounted carbonyl carbon, C-14 (δC 170.2), as a furanone ring. Hemiketal C-2 is completed with the remaining unaccounted oxygen atom and its aforementioned exchangeable proton, resulting in the planar structure for anthoteibinene F (1).
Anthoteibinene G (2) was found with the same carbon skeleton as anthoteibinene F (1). The molecular formula of C16H22O3 (HRESIMS proton adduct ion at m/z 263.1658) and NMR data (Table S2) of 2 identified the additional CH3 group by the appearance of methoxy signals [δH 3.22 (s), δC 50.9 (CH3-16)]. H3-16 displayed HMBC correlation to C-2 establishing anthoteibinene G (2) as the methoxy ketal of anthoteibinene F (1).
The molecular formula of anthoteibinene H (3), C15H18O2 (HREIMS [M]+ m/z 230.1308), was supported by the 13C NMR data (Table 2), which displayed 15 carbon signals, six of which were indicative of aromaticity. The multiplicity-edited HSQC spectrum, taken with the 13C NMR spectrum, suggested that 3 had one carbonyl group (δC 177.8, C-14), four additional quaternary carbons at δC 120.4 (C-1), δC 153.4 (C-2), δC 135.9 (C-4) and δC 141.7 (C-6), five methine carbons at δC 113.7 (C-3), δC 120.8 (C-5), δC 43.3 (C-7), δC 37.4 (C-10) and δC 30.7 (C-11), two non-equivalent methylene carbons, δC 21.2 (C-8) and δC 24.8 (C-9), and three methyl groups, δC 21.7 (C-12), δC 18.0 (C-13) and δC 21.3 (C-15).
Analysis of the COSY and HMBC spectra of anthoteibinene H (3) was sufficient to assign the planer structure. A singlet aromatic methyl group (H3-15: δH 2.13) displayed HMBC correlations to three aromatic carbons, positioning C-4 as the methyl-bearing aromatic carbon with adjacent protonated carbons C-3 and C-5. HMBC correlations from H-3 (δH 6.17) to C-1 and C-2, as well as from H-5 (δH 6.60) to C-1, established aromatic ring sub-structure. H-5 was further correlated in the HMBC spectrum to C-7. H-7 (δH 2.64) displayed COSY correlations to H-11 (δH 2.21), and H-11 to H3-12 (δH 1.02) and H3-13 (δH 0.76), establishing an isopropyl group on C-7. The remaining carbons could be assembled by observation of COSY correlations from H-7 to H2-8a (δH 1.94) and H2-8b (δH 1.56), HMBC correlations from H-10 (δH 4.05) to C-1, C-8, C-9 and C-14, resulting in a bicyclic structure with isopropyl and carboxylate substituents mirroring those found in anthoteibinenes F and G (1, 2). Remaining elements of the molecular formula require an oxygen at C-2, cyclized to C-14 as a lactone.

2.1.3. The Furano-Anthoteibinenes (4-7)

Anthoteibinenes I-L (4-7) are related as furan-bearing metabolites. A cyclohexane ring for all three is evident, starting with the now familiar isopropyl group and observing COSY and HMBC correlations much as was found in the other anthoteibinenes: COSY among the H3-12/H3-13 to H2-9 segment, HMBC from H-7 to aromatic C-1, C-5 and C-6, and H-9 to C-1, C-10 and C-14 (see Table 3 for shifts). The aromatic ring of 4 (C15H18O2 from HRESIMS m/z 231.1389, [M + H]+) could be completed by observation of HMBC correlations from the phenolic proton at δH 7.92 to C-4 (δC 123.1), C-5 (δC 147.0) and C-6 (δC 120.1) establishing the position of the phenol group on C-5, from an aromatic methyl at δH 2.25 (H3-15) to δC 109.4 (C-3), C-4 and C-5, and from aromatic proton δH 7.05 (H-3) to δC 125.2 (C-1), C-4 and C-5; the planar structure was completed by observation of and HMBC correlation between δH 7.44 (H-14) and δC 146.8 (C-2) establishing a benzofuran ring system. Anthoteibinene J (5) ([M + H]+ m/z 231.1389) was isomeric to 4 and could be assigned as the C-3 phenol by observation of HMBC correlations from δH 6.74 (H-5) to C-3 (δC 137.5), C-4 (δC 119.9) and C-7 (δC 41.9) as well as δH 2.59 (H-7) to the protonated aromatic carbon δC 122.2 (C-5). And a third benzofuran, anthoteibinene K (6) (C15H18O2 from HREIMS m/z 214.1363) was found as the related metabolite lacking phenolic groups observed in 4 and 5. This was established by observation of three aromatic protons, δH 7.19 (H-3), δH 6.95 (H-5) and δH 7.60 (H-14), the first two of which correlated in the HMBC with an aromatic methyl at δC 21.8 (C-15). H-14 was found to correlate with an oxygen-bearing aromatic carbon at δC 152.9 (C-2) as well as quaternary aromatic carbons δC 124.9 (C-1) and C-10 (δC 116.5). The 2D structure of 6 matches the published metabolite acorafuran, isolated from the flowering plant, Acorus calamus [11]. Acorafuran was published without assignment of the absolute configuration. The optical rotations of 6 and acorafuran were antipodal ( [ α ] D 22 +24 and -161 respectively), suggesting they are likely enantiomers.
The HREIMS spectrum of anthoteibinene L (7) displayed an m/z 282.1039 with a 3:1 isotopic pattern indicative of chlorine, supported by the calculated molecular formula of m/z 282.1028 for C15H1935ClO3 and fragmentation indicative of chlorine loss. In addition to the isopropyl-substituted cyclohexane spin system observed in other metabolites described herein, the 1H NMR data (Table 3) supported one olefinic proton at δH 7.45 (H-14) with COSY correlations to δH 2.49 and δH 2.83 (H-9b, H-9a) and HMBC correlations to δC 140.0 (C-1), δC 142.0 (C-2), and δC 123.3 (C-10), extending the spin system to a furan ring, as demonstrated for anthoteibinenes I-K (4-6). Further extending the spin system is a resonance at δH 4.35 (H-5) with COSY correlation to δH 3.49 (H-6) and HMBC correlation to C-1 in the furan ring, ketone δC 177.4 (C-3) and quaternary deshielded carbon δC 69.2 (C-4). The deshielded carbons C-4 and C-5 (δC 78.6) are the only open valences for the remaining heteroatoms, O and Cl, with the most deshielded position (C-5) assigned as the hydroxy-bearing carbon.

2.1.4. The Anthoteibinene Acids (8-10)

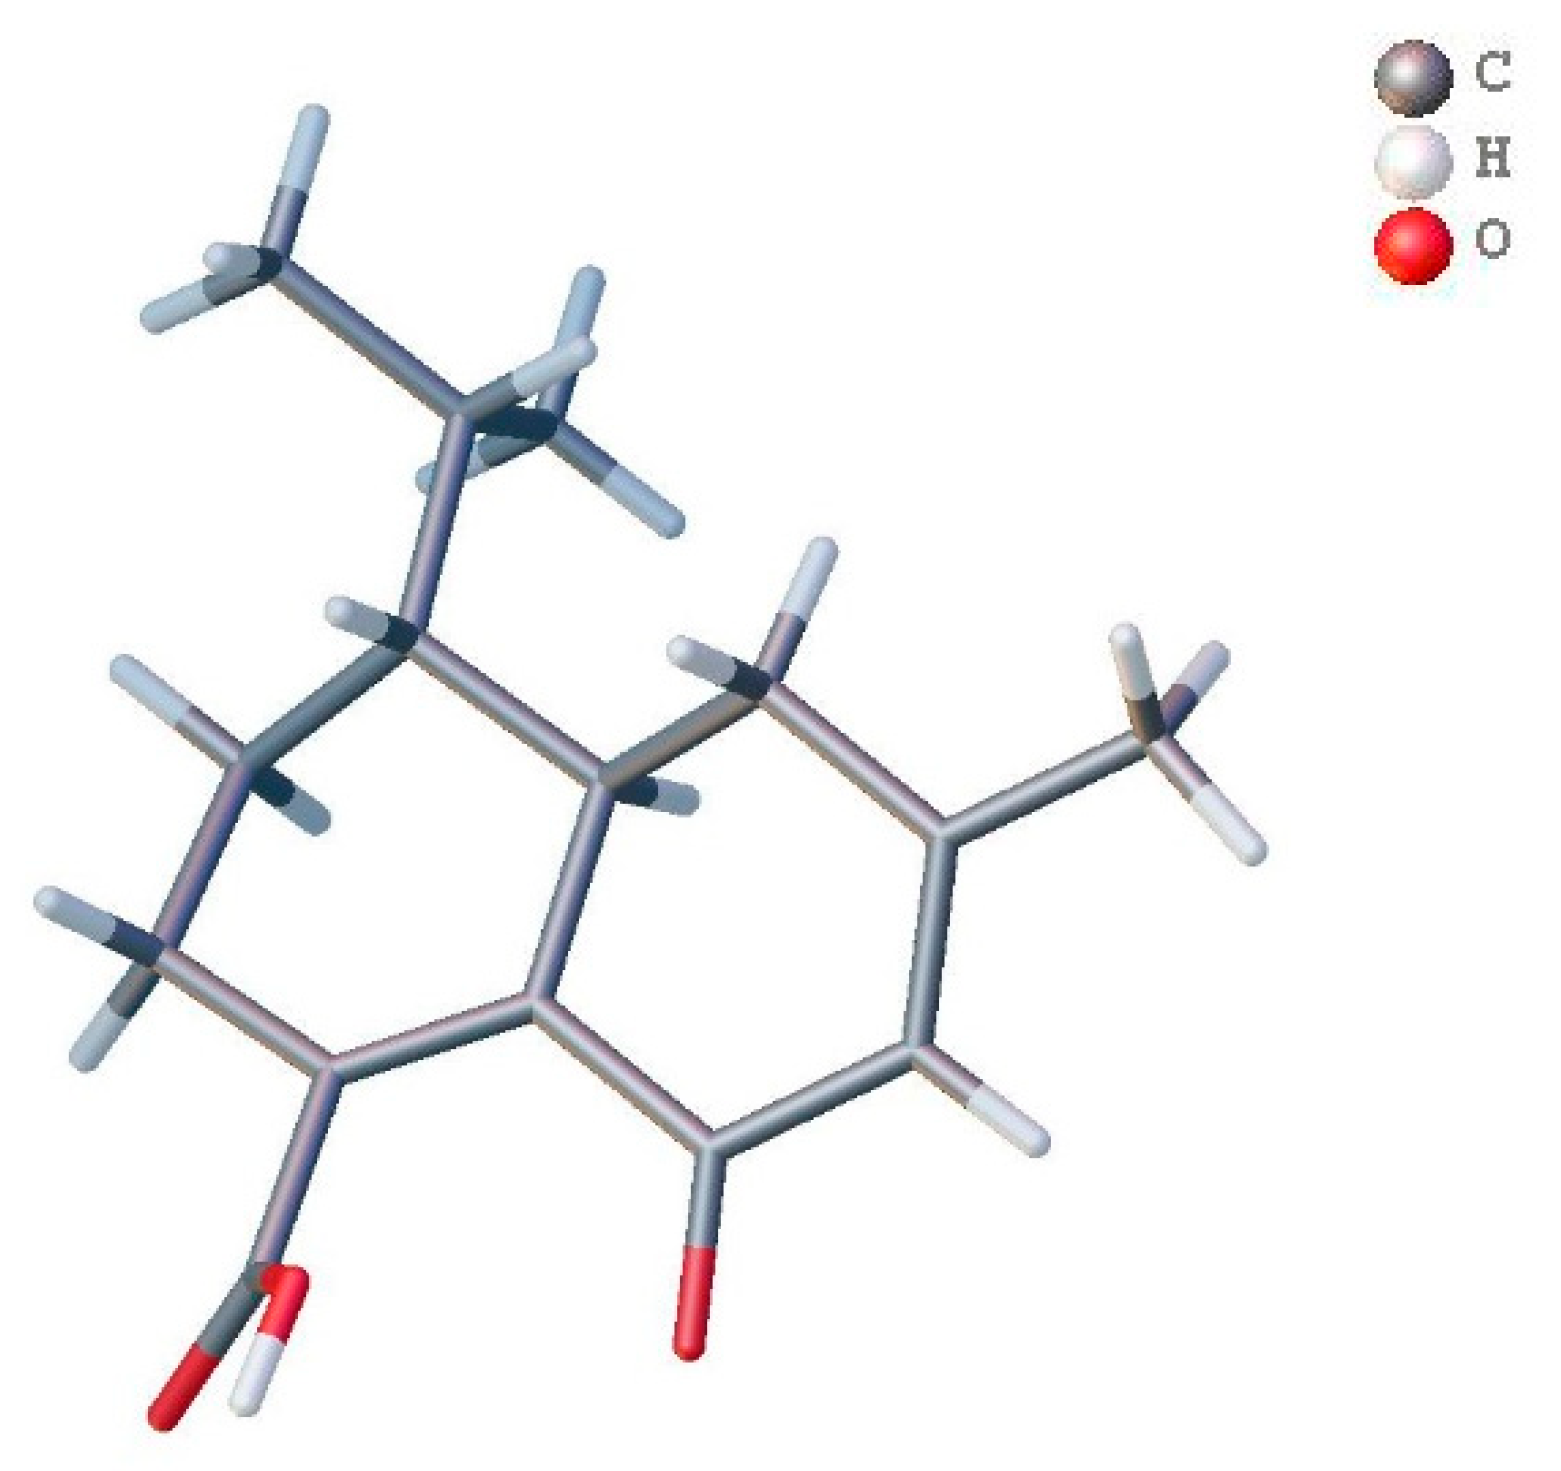
Anthoteibinene M (8), ([M + H]+ m/z 249.1499) has substantial NMR signal and correlation map overlap with NMR data of anthoteibinene F (1). Differences are observed, however, the 13C NMR shift (Table 4) of C-2 (δC 102.0 in 1; 190.6 in 8), and in the nature of C-5 and C-3, as assigned by the 2D NMR spectra. The noted differences between the two metabolites indicate the ketal of 1 has undergone hydrolysis to the ketone with concomitant isomerization of the Δ4 olefin from 1 to the conjugated Δ3 olefin in 8, all of which are supported by the NMR data (Table 4). Crystals of 8 obtained from 1:1 hexanes/ethyl acetate were subject to X-ray crystallography, confirming the structure and revealing the absolute configuration as 6R,7R (Figure 3).
Anthoteibinene N (9) provided an [M + H]+ of m/z 249.1500, establishing it as isomeric to anthoteibinene M (8). The 1H NMR data (Table 4) revealed a new, deshielded, olefinic proton at δH 7.10 (H-9) with COSY correlations to δH 2.22 (H-8a) and δH 1.97 (H-8b), the latter of which further correlates to δH 1.67 (H-7). H-7 has HMBC correlations to δC 41.7 (C-1), δC 38.6 (C-6), δC 27.1 (C-11) and δC 14.1 (C-13). COSY correlations of δH 2.18 (H-6) to H-1 (δH 3.63), H-5a (δH 2.62), H-5b (δH 2.48), and H-7 (δH 1.67), are indicative of the isomerization of the Δ1(10) observed in 8 as now Δ9. This was confirmed by HMBC correlations from H-9 to C-1, δC 35.1 (C-7), δC 25.2 (C-8), and δC 170.9 (C-14). HMBC correlations from H-5b to C-1, δC 125.6 (C-3), δC 159.3 (C-4), C-6 and δC 24.5 (C-15) confirm the second olefin to be Δ3 as in 8.
Anthoteibinene O (10) was found with an experimental mass of m/z 249.1499 ([M + H]+) for a molecular formula of C15H20O3. The NMR spectral data (Table S11) indicated substantial similarities to those of anthoteibinene H (3) with an average carbon Δδ of < 1.0 ppm and Δδmax = 3.9 (C-14, δC 177.8 in 3). Protons were similarly matched with Δδ of < 0.01 ppm and Δδmax = 0.28 (H-10, δH 3.74 in 10). Analysis of the 2D NMR data (Table S11) provided the same carbon skeleton, establishing anthoteibinene O (10) as the hydrolysis product of anthoteibinene H (3).

2.1.5. The Keto-Anthoteibinenes (11, 12)

Anthoteibinene P (11) was isolated as a white film with a molecular formula of C15H22O2 established by analysis of the HRESIMS proton adduct ion at m/z 235.1711. The 1D- and 2D spectral data (Table S12) were found to match of that tatarinowin A [12] from Acorus tatarinowii, a plant used in traditional Chinese medicine (TCM). Anthoteibinene P (11) and tatarinowin A are diastereomers, with our isolate measuring [ α ] D 22 +53.3 and the TCM metabolite [ α ] D 22 -55.3.
Anthoteibinene Q (12) appears as a nor-sesquiterpene, with formula C14H18O3 (HRESIMS m/z 234.1255 for the proton adduct). The 1H and 13C NMR spectral data (Table 5) provide evidence for 14 carbons and 16 protons, indicating two exchangeable protons. The 2D NMR data (Table S13) established an aromatic western ring, with an aromatic methyl group at δH 2.29 (H3-14) displaying HMBC correlations to δC 116.9 (C-3), δC 135.3 (C-4) and δC 143.0 (C-5), and aromatic proton δH 6.65 (H-3) correlating to δC 114.6 (C-1), 157.2 (C-2), δC 143.0 (C-5) and δC 17.4 (C-14). Both C-2 and C-5 appear oxygenated based on their shifts, which is not incompatible with other anthoteibinene metabolites. The fused ring comprising C-7 through C-10 only surprises in finding C-10 as a ketone (δC 204.4) and devoid of an attached carboxylate as seen in previous anthoteibinenes and accounting for the nor-terpenoid formula, as the isopropyl group also appears intact.

2.1.6. Configurational Analysis

Establishing the stereochemical relationships in the anthoteibinenes varied in complexity, depending on the number of chiral centers and overlapping NMR signals. A combination of NOESY correlations and coupling constants were used to determine relative stereochemistry. When NOE correlations and coupling constants were inconclusive, relative configurations were determined by comparing experimental to calculated 1H and 13C chemical shifts of energy-minimized conformers of all possible stereoisomers. Then experimental and calculated ECD spectra were used to establish the absolute stereochemistry of the reported compounds.
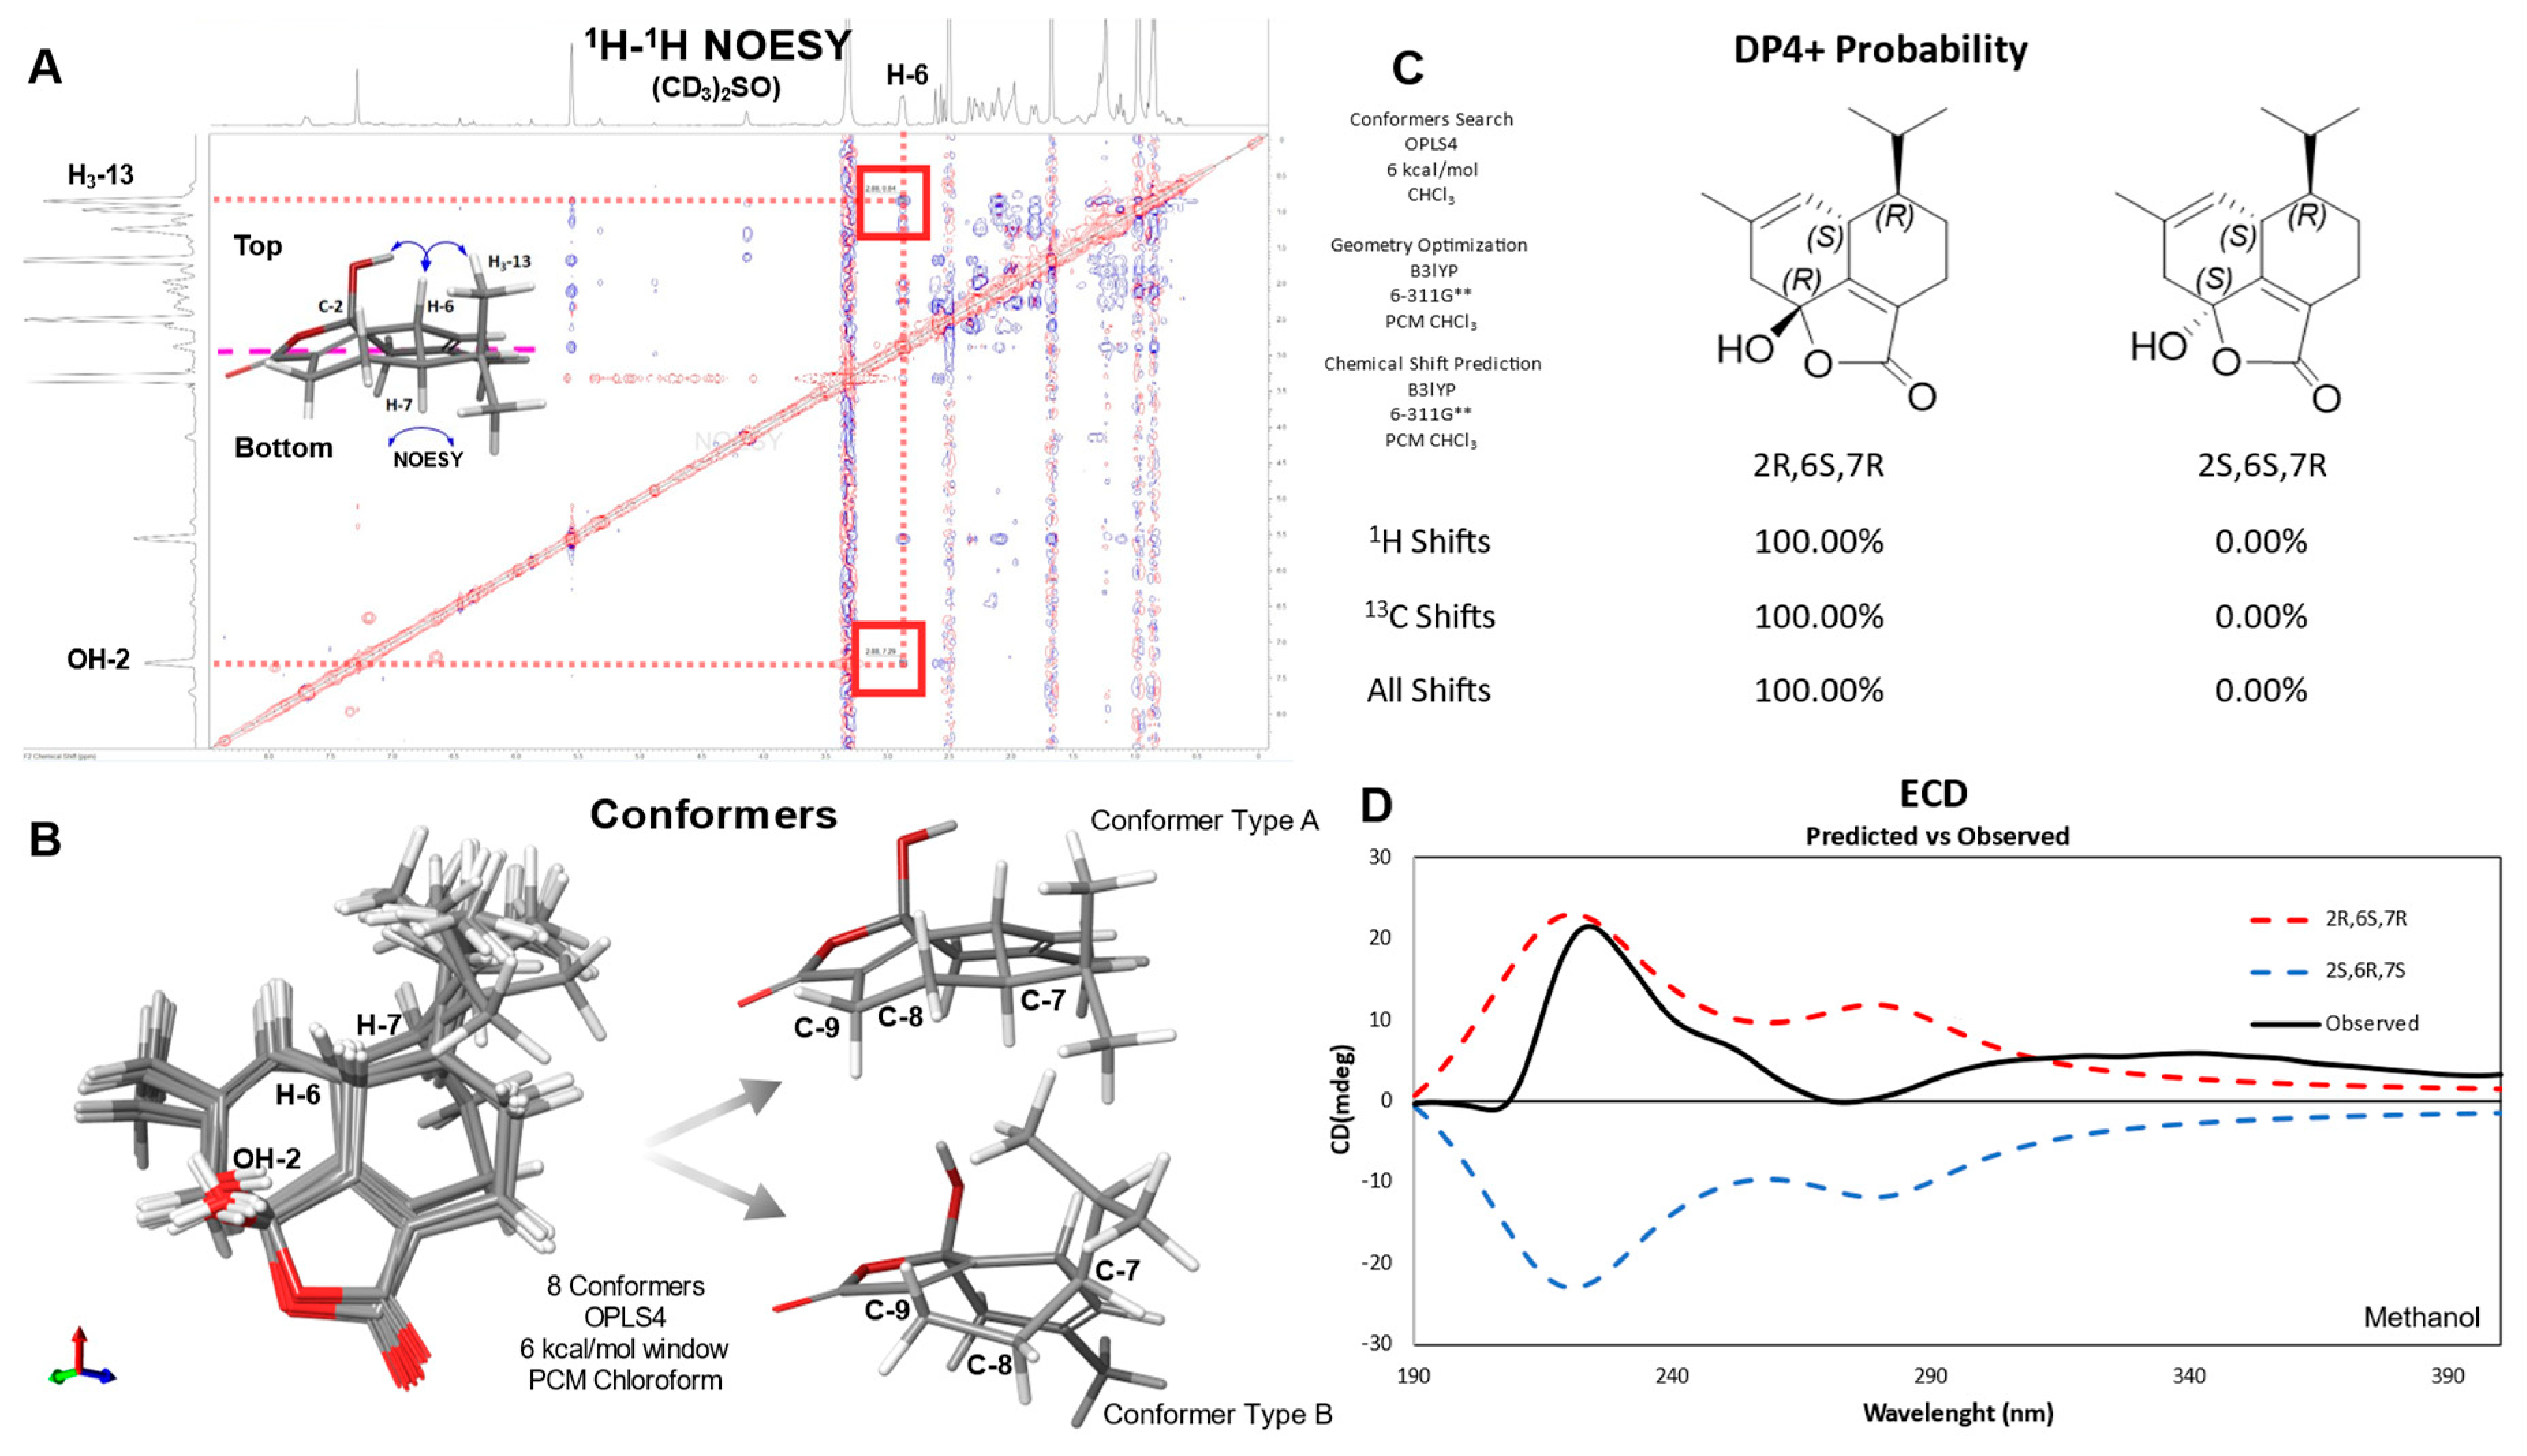
Anthoteibinene F (1) has three chiral centers, C-2, C-6, and C-7. The NOESY spectrum in DMSO-d6 (Figure S13) revealed correlations between H-6/H3-13 indicating an anti configuration for H-6 and H-7, as previously established for anthoteibinene M (8) by XRD. The hemiketal OH group on C-2 was established as syn to H-6 from NOESY correlation between the hydroxy proton and H-6. Similarly, the NOESY spectrum of anthoteibinene G (2) displayed correlations between H-6/H3-13 and H-6/H3-16, indicating 1 has the same relative configuration as 2.
The relative configuration of 1 as 2R,6S,7R was confirmed by calculating the chemical shifts of four diastereomeric configurations using density functional theory (DFT) and the gauge-invariant atomic orbital (GIAO) model. Conformer searches were performed using OPLS4, searching a 6.0 kcal/mol window. Boltzmann weighted average 1H and 13C chemical shift predictions were made using the PCM/B3LYP/6-311G**// B3LYP/6-311G** level of theory. The predicted chemical shifts were compared to the experimental data using DP4+ probability score [6] resulting in a 100% probability of 2R,6S,7R or 2S,6R,7S, when using all NMR data and both scaled and unscaled chemical shifts (Figure 4).
The absolute configuration of anthoteibinene F (1) was assigned by comparing experimental Electronic Circular Dichroism (ECD) and predicted ECD spectra for both enantiomers. OPLS4 forcefield and mixed torsional/low-mode sampling was used to search for conformers in a 5.0 Kcal/mol window. ECD predictions were computed with Time Dependent Density Functional Theory (TD-DFT) at the B3LYP-D3/LACVP**//B3LYP-D3/LACVP** level. Anthoteibinene F and G (1, 2) both showed positive Cotton effects at 220 nm, consistent with the 2R,6S,7R absolute configurations (Figure 4). This workflow was first validated by assigning the absolute configuration of anthoteibinene M (8), which was verified by X-ray crystallography (Figure 3).
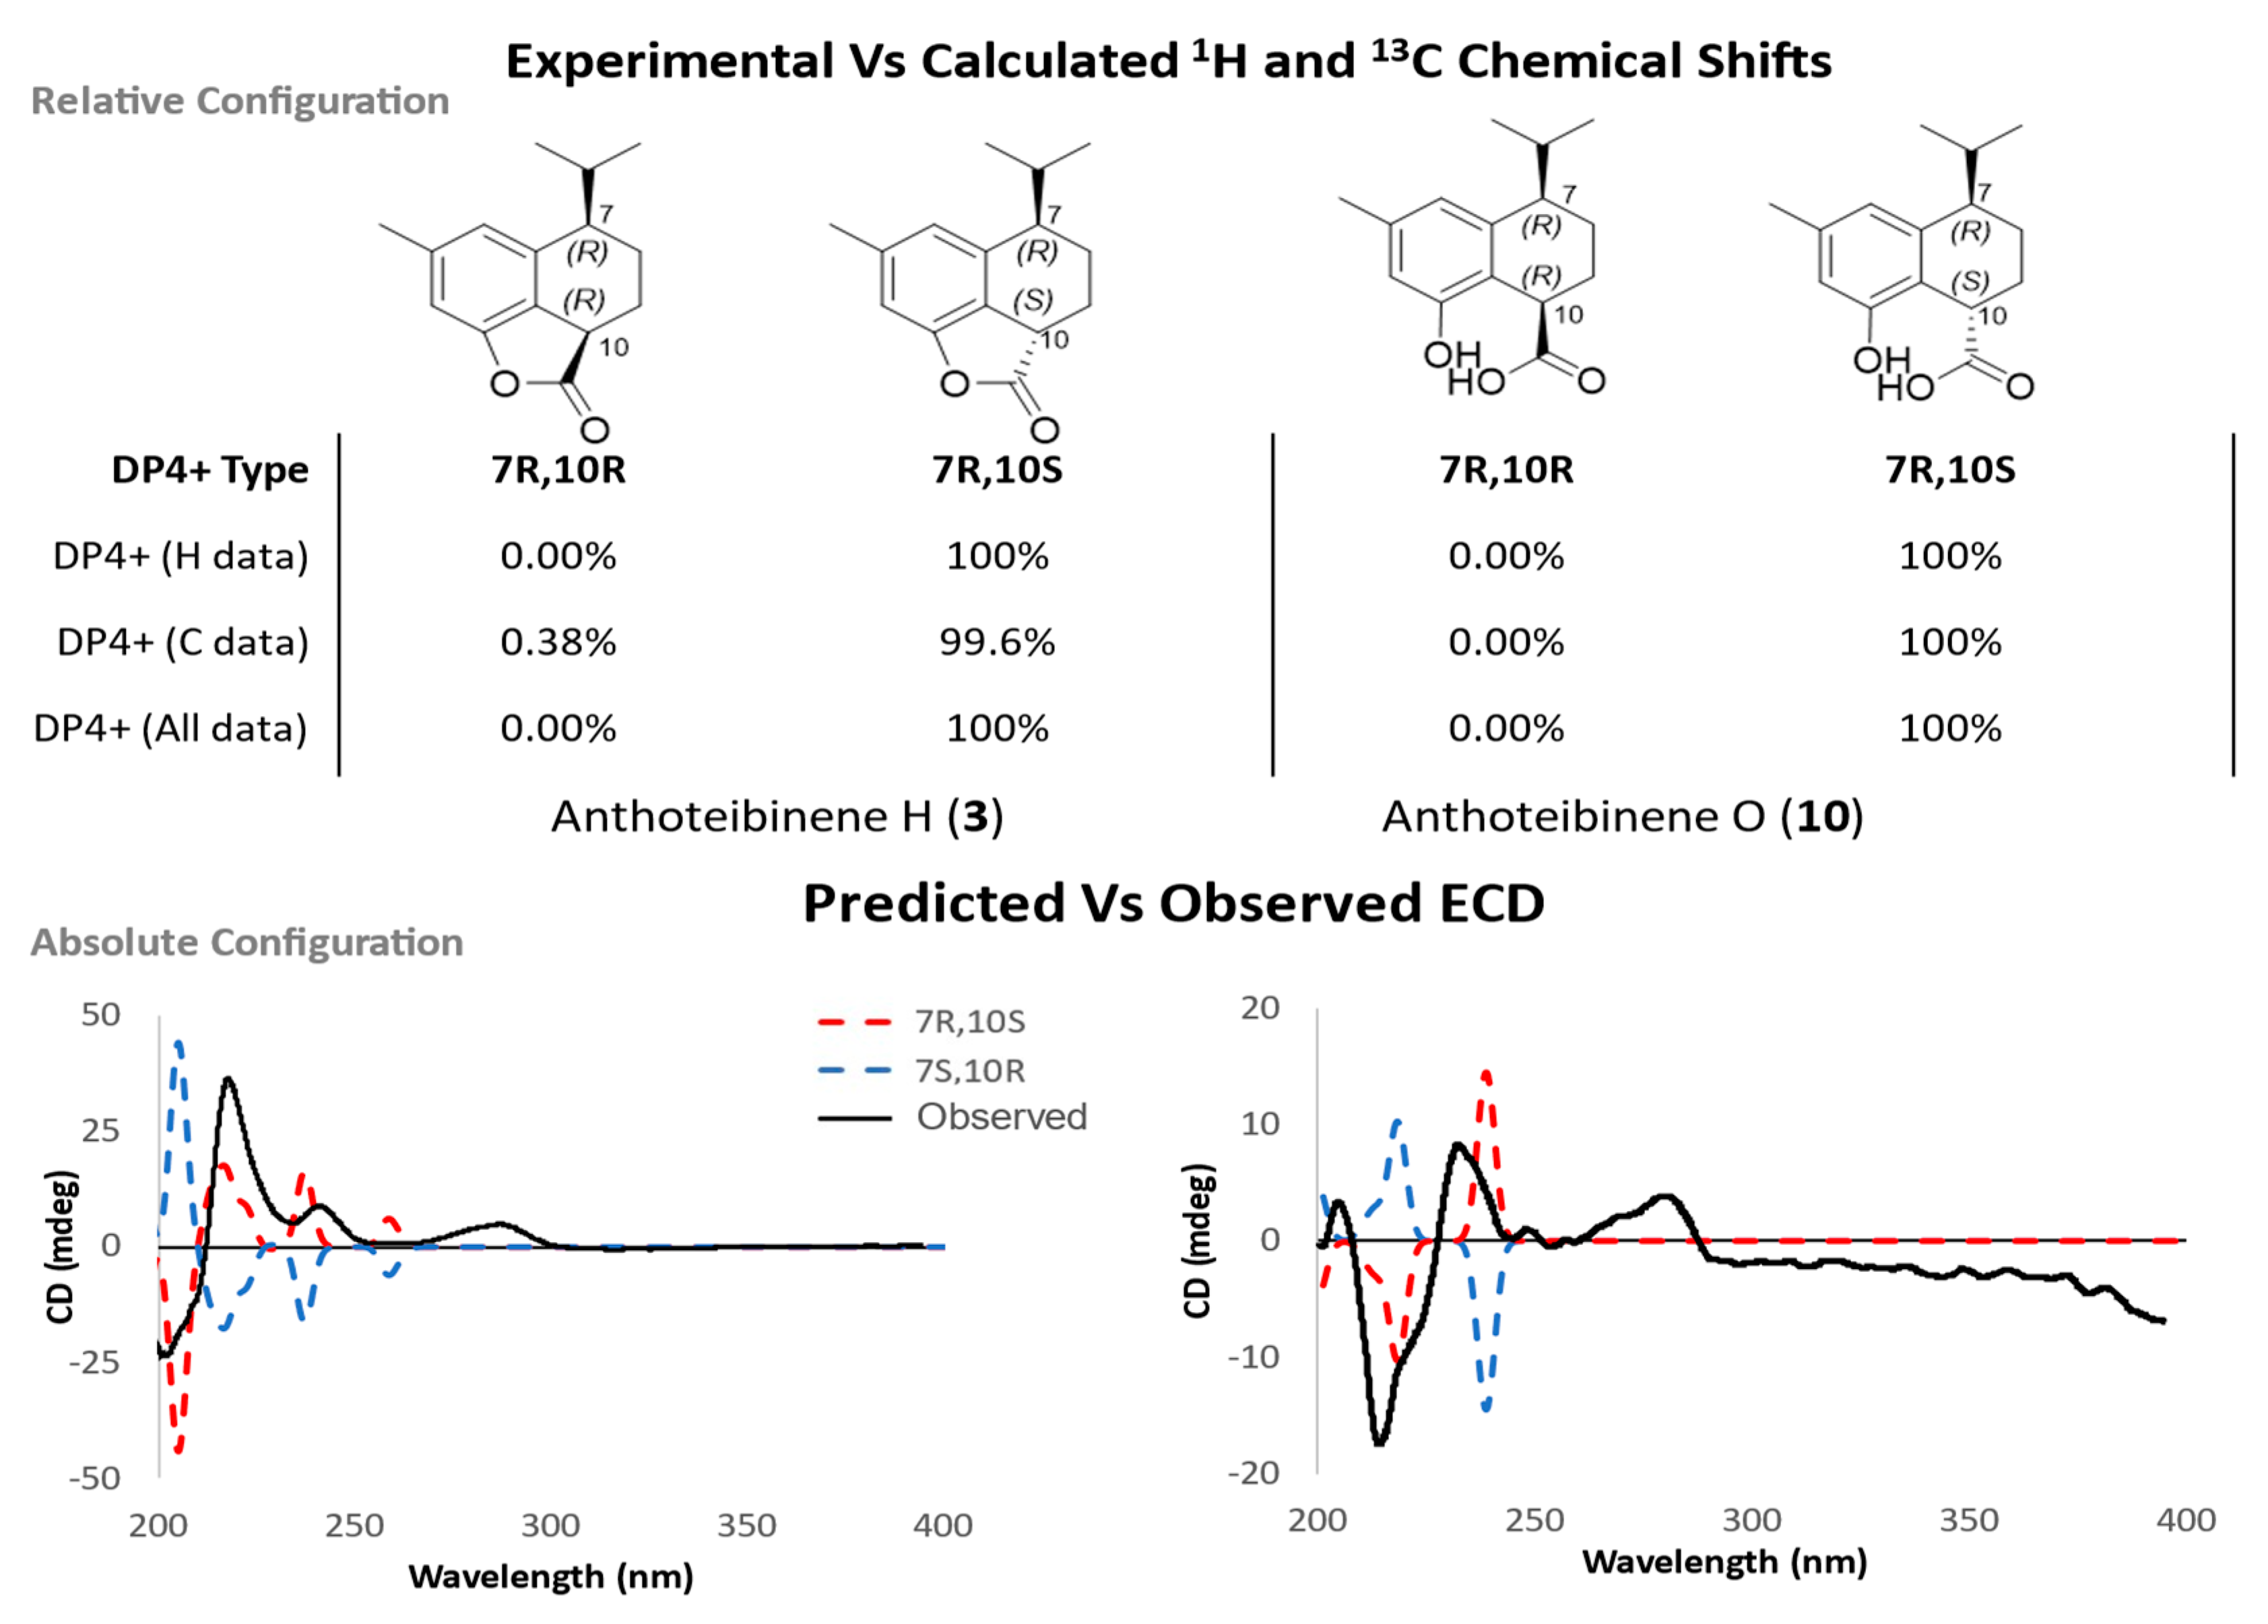
The anthoteibinenes, H (3) and O (10), share the stereochemical relationship whereby two stereocenters are found in a 1,4-relationship on a cyclohexane ring. Determining these relative configurations was challenging due to the lack of discriminatory NOE correlations and indistinguishable coupling constants as a result of key signal overlap in 1H NMR spectra (Table S3 and S11, respectively). To distinguish between the two possible relative configurations syn and anti, with respect to H-7 and H-10, a comparison of predicted chemical shifts for both configurations, using same workflow as 1, resulted in 100% DP4+ probability of H-7 and H-10 being in the anti configuration (Figure 5), when using unshielded predicted 1H and 13C chemical shifts. An absolute configuration of 7R,10S was deduced from examination of predicted and experimental ECD spectra for compounds all three compounds (Figure 5).
Anthoteibinene N (9) displayed key NOESY correlations from H3-13/H-6 and H-5b placing H-6 and the isopropyl group syn to one another. The relative configuration of H-1 was assigned anti to H-6, implied by NOE correlations from H-5a to H-1. An absolute configuration of 1S,6R,7R was determined by ECD spectral analysis (Figure 6).
Anthoteibinene L (7) has four chiral centers, C-4, C-5, C-6, and C-7. Clear NOE correlations from H3-13 to H-5 and H-6, place H-5 and H-6 syn to one another and anti to H-7. The relative configuration of C-4 was assigned through NOE correlations between H3-15/H-5, putting the methyl group on the same face as H-5. The NOESY spectrum (Figure S73) revealed a correlation from H-6 to the methylene at δH 1.53 (H-8b), and a weak correlation to δH 2.83 (H-9a), assigning H-8a and H-9a to the bottom face (Figure 6). An absolute configuration of 4R,5R,6R,7R was deduced from analysis of experimental and calculated ECD spectra (Figure 6).
Anthoteibinene P (11) has three chiral centres, C-5, C-6, and C-7. NOESY correlations between H-5/H-11 and H-6/H3-13 assigned H-5 and H-6 as syn and H-6/H-7 as anti. An absolute configuration of 5R,6R,7R was assigned through interpretation of predicted and observed ECD spectra. Tong et al., assigned H-5 and H-6 of tatarinowin A as anti, resulting an absolute configuration of 11 as 5S,6R,7R [12].
An absolute configuration of 7R was assigned to compounds 4-6 by comparing predicted ECD spectra for both enantiomers to the observed ECD spectra (Figures S45, S56 and S65).

2.1.7. Biological Activity of Anthoteibinenes

The newly isolated terpenes were screened for biological activity in several bioassays, including multiple strains of Candida albicans and C. auris and in a zebrafish model for epilepsy. Studies of the anticonvulsant activity in zebrafish are ongoing. Anthoteibinene I (4) and anthoteibinene J (5) were the only compounds with antifungal activity when tested at a concentration of 50 mg/mL against the six Candida albicans strains: MYA-2876, ATCC-18804, ATCC-28121, ATCC-76485 and ATCC-90029; as well as one C. auris strain: AR0385. Anthoteibinene J (5) displayed inhibition with an IC50 of 7.0 mg/mL for the 90021 strain, while anthoteibinene I (4) lost inhibition when tested at concentrations lower than 50 mg/mL for all strains. Anthoteibinene K (6) has the same backbone as the two molecules but lacks the phenol functional group. Anthoteibinene K (6) showed no inhibition when tested, suggesting the phenol and its position to be vital for activity toward Candida, as the only difference between the molecules is the presence and the placement of the phenol between C-3 and C-5. Table 6 shows the IC50 (µg/mL) values for the six strains tested for anthoteibinene J (5) calculated using Prism. Fluconazole (positive), DMSO (negative) and triplicate drug-free, yeast-free wells served as controls.

3. Materials and Methods

3.1. General Experimental Procedures

Optical rotations were measured using an AutoPol IV digital polarimeter at 589 nm with a 1 dm or 0.1 dm path length cell. UV/Vis spectra were extracted from HPLC chromatograms. ECD spectra were measured in MeOH using a JASCO Model J-1500 Circular Dichroism Optical Rotatory Dispersion. NMR spectra were acquired using a Bruker Neo 400 MHz broadband spectrophotometer with a cryoprobe, a Varian Inova 500 MHz spectrophotometer, or a Bruker Neo 600 MHz broadband spectrophotometer. The residual solvent peaks were used as an internal chemical shift reference (CDCl3: δC 77.0; δH 7.27, (CD3)2SO: δC 39.5; δH 2.50). High-resolution mass spectrometry-liquid chromatography data were obtained on an Agilent 6540 LC-MS QTOF coupled to an Agilent Jet-stream electrospray ionization detector. H2O (A) and 0.1% FA in CH3CN (B) were used as mobile phases on a Phenomenex Kinetex C18 column (2.6 mm, 100 Å, 150 x 3 mm: 0.5 mL/min). High-resolution mass spectrometry-gas chromatography data were obtained on an Agilent 7890A GC using a Zebron ZB-5HT Inferno (30 m x 0.25 mm, 0.25 mm film thickness) column coupled to an Agilent 7200 accurate-mass QTOF with electron impact ionization. Reverse-phase HPLC was performed on a Shimadzu LC20-AT system equipped with a photodiode array detector (M20A) using a preparative Phenomenex C18 column (5 mm, 100 Å, 250 x 21.2 mm: 10 mL/min) or a semi-preparative Phenomenex C18 column (10 mm, 100 Å, 250 x 10 mm: 4 mL/min. The methanol and acetonitrile used for column chromatography were obtained from Fisher Co. and were HPLC grade (>99% purity) while the H2O was distilled and filtered.

3.2. Biological Materials, Extraction, and Isolation

Specimens of Anthothela grandiflora were collected at depths between 1304-1814 m along the Irish continental margin during a 2017 cruise using the ROV Holland I deployed from the Irish national research vessel R/V Celtic Explorer. Specimens were stored in bioboxes on the ROV and immediately pooled, logged, labeled, and frozen at −80 °C when the ROV was recovered to the vessel. Specimens were freeze-dried on return to land and then stored until analysis at −20 °C.
The freeze-dried coral (734.7) was crushed and exhaustively extracted in DCM (1) via Soxhlet before being extracted with MeOH (2) at ambient temperature. The extracts were separately mixed with 50 g of C18 and eluted into six fractions of decreasing polarity using RP-C18 Vacuum Liquid Chromatography (VLC). The DCM extract (25.5g) was eluted with (A) 50% MeOH/H2O, (B) 75% MeOH/H2O, (C) 100% MeOH, (D) 25% DCM/MeOH, (E) 50% DCM/MeOH, and (F) 100% DCM.
Fraction 1B (180 mg) was reconstituted in MeOH, filtered, and fractionated using semipreparative C18 HPLC using a linear gradient of 20-100% ACN/H2O for 90 min. Fractions were collected by UV peak and purified further with a gradient of 50-100% MeOH/ H2O for 60 minutes. The fractions were determined pure by 1H NMR spectroscopy resulting in the pure compounds: anthoteibinene L (7: 1.0 mg), anthoteibinene P (11: 5.0 mg), and anthoteibinene Q (12: 2.8 mg). The same method was used for the initial fractionation of 1E (695 mg) resulting in: anthoteibinene F (1: 6 mg) and anthoteibinene M (8: 1.1 mg).
Fractions 1C (2526 mg) and 1D (3767 mg) went through a 90% aqueous MeOH/hexane partition to remove large amounts of fats. The methanol fractions were dried to yield 500 mg and 650 mg, respectively. Both fractions went through fractionation as described for 1B and resulted in anthoteibinene I (4: 3.0 mg), anthoteibinene J (5: 3.3 mg), and anthoteibinene K (6: 12.5 mg) from fraction 1C and anthoteibinene G (2: 3.0 mg), anthoteibinene H (3: 2.0 mg), anthoteibinene N (9: 0.8 mg), and anthoteibinene O (10: 1.9 mg) from fraction 1D.

3.3. Spectroscopic Data for the Anthoteibinenes (1-12)

Anthoteibinene F (1): white film; [ α ] D 22 -70 (c 0.1, MeOH); UV (ACN/H2O) λmax 217.5 nm; 1H (600 MHz) and 13C (150 MHz) NMR data, Table S1; HRESIMS m/z 249.1503 [M + H]+ (calcd for C15H21O3,249.1496; Δ 2.81 ppm).
Anthoteibinene G (2): colorless oil; [ α ] D 22 -97 (c 0.3, MeOH); UV (ACN/H2O) λmax 221 nm; 1H (600 MHz) and 13C (150 MHz) NMR data, Table S2; HRESIMS m/z 263.1658 [M + H]+ (calcd for C16H23NO3, 263.1653; Δ 1.90 ppm).
Anthoteibinene H (3): white film; [ α ] D 22 +3 (c 0.3, MeOH); UV (ACN/H2O) λmax 280 nm; 1H (400 MHz) and 13C (100 MHz) NMR data, Table S3; HREIMS m/z 230.1308 [M]+ (calcd for C15H18O2, 230.1312; Δ -1.74 ppm).
Anthoteibinene I (4): colorless oil; [ α ] D 22 -5 (c 0.1, MeOH); UV (ACN/H2O) λmax 255, 293 (sh) nm; 1H (600 MHz) and 13C (150 MHz) NMR data, Table S4; HRESIMS m/z 231.1389 [M + H]+ (calcd for C15H19O2, 231.1391; Δ -0.87 ppm).
Anthoteibinene J (5): colorless oil; [ α ] D 22 +1 (c 0.3, MeOH); UV (ACN/H2O) λmax 252 nm; 1H (600 MHz) and 13C (150 MHz) NMR data, Table S5; HRESIMS m/z 231.1392 [M + H]+ (calcd for C15H19O2, 231.1392; Δ 0.43 ppm).
Anthoteibinene K (6): colorless oil; [ α ] D 22 +24 (c 1.0, MeOH); UV (ACN/H2O) λmax 250 nm; 1H (400 MHz) and 13C (100 MHz) NMR data, Table S6; HREIMS m/z 214.1358 [M]+ (calcd for C15H18O, 214.1363; Δ -2.40 ppm).
Anthoteibinene L (7): white film; [ α ] D 22 -33 (c 0.3, MeOH); UV (ACN/H2O) λmax 291 nm; 1H (600 MHz) and 13C (150 MHz) NMR data, Table S7; HRESIMS m/z 283.1117 [M + H]+ (calcd for C15H1935ClO3, 283.1101; Δ 5.66 ppm); 285.1084 [M + H]+ (calcd for C15H1937ClO3, 285.1071; Δ 4.39 ppm).
Anthoteibinene M (8): white film; [ α ] D 22 +72 (c 0.1, MeOH); UV (ACN/H2O) λmax 263 nm; 1H (600 MHz) and 13C (150 MHz) NMR data, Table S8; HRESIMS m/z 249.1499 [M + H]+ (calcd for C15H21O3, 249.1496; Δ 1.20 ppm).
Anthoteibinene N (9): white film; [ α ] D 22 -120 (c 0.2, MeOH); UV (ACN/H2O) λmax 250 nm; 1H (400 MHz) and 13C (100 MHz) NMR data, Table S10; HRESIMS m/z 249.1500 [M + H]+ (calcd for C15H21O3, 249.1496; Δ 1.61 ppm).
Anthoteibinene O (10): white film; [ α ] D 22 +20 (c 0.3, MeOH); UV (ACN/H2O) λmax 282 nm; 1H (400 MHz) and (100 MHz) NMR data, Table S11; HRESIMS m/z 249.1499 [M + H]+ (calcd for C15H21O3, 249.1496; Δ 1.20 ppm).
Anthoteibinene P (11): white film; [ α ] D 22 +53 (c 0.15, MeOH); UV (ACN/H2O λmax 244, 283 (sh) nm; 1H (400 MHz) and 13C (100 MHz) NMR data, Table S12; HRESIMS m/z 235.1711 [M + H]+ (calcd for C15H23O2, 235.1704; Δ 2.98 ppm).
Anthoteibinene Q (12): white film; [ α ] D 22 +10 (c 0.3, MeOH); UV (ACN/H2O) λmax 238, 273 (sh) nm; 1H (600 MHz) and 13C (150 MHz) NMR data, Table S13; HREIMS m/z 234.1255 [M]+ (calcd for C14H18O3, 234.1261; Δ -2.75 ppm).

3.4. Antifungal Activity

In vitro antifungal activity was tested against five strains of Candida albicans (MYA-2876, ATCC-18804, ATCC-28121, ATCC-76458, and ATCC-90029) and one strain of Candida auris (AR0385) following the Reference Method for Broth Dilution Antifungal Susceptibility Testing of Yeasts [13]. Organisms were subcultured on Sabouraud dextrose agar and incubated at 35 °C for 24 h. Inoculum was prepared by picking five 24 h old colonies of 1 mm in diameter and suspending them in Sabouraud dextrose broth. The resulting suspension was then vortexed for 15 s and the optical density at 600 nm (OD600) adjusted to 1.00. This resulted in stock solution of 106 cells/mL. A working solution was made by diluting the stock solution at a 1:100 dilution followed by a 1:20 dilution resulting in a concentration of 5.0 x 10² cells/mL.
A stock solution of anthoteibinene J (5) was prepared at 2.5 mg/mL in DMSO. This was used to prepare 9 working solutions ranging in concentration from 1.25 mg/mL to 4.88 µg/mL. Triplicate aliquots of 1.0 µL were further transferred onto a 96 well plate. A positive standard of fluconazole, a negative control (1.0 µL of DMSO) and a triplicate of drug-free yeast free wells were also plated. Yeast inoculate (99 µL) was added to each well, resulting in concentrations ranging from 25 µg/mL to 48.8 µg/mL. Cultures were then incubated at 35 °C for 24 h. Yeast growth was measured using optical density at 600 nm with a Biotek 800 TS plate reader. The optical density of each well was compared to the negative control to establish the growth of yeast present within each well. IC50 was determined by plotting the log of concentration to the percentage of growth of yeast using a nonlinear regression in Prism.

3.5. Computational Methods

All molecular mechanics and quantum mechanic calculation were conducted using boltzmann_averaged_properties.py script, integrating Macromodel and Jaguar (version 2023-1, Schrodinger LLC).

3.5.1. Electronic Circular Dichroism Spectral Predictions

Conformation searches for each enantiomer utilized OPLS4 to generate low energy conformers within a 5 kcal/mol energy window, in the liquid phase incorporating water PCM solvation model. Conformers underwent geometry optimization and subsequent relative thermal free energies (ΔG) at 298.15 K, using DFT at a B3LYP-D3/LACVP** level. Geometry optimization was carried out using methanol PCM Solvation model, while single point energy calculations were conducted using PBF solvent model for improved energy calculation accuracy. Conformers with negative vibrational frequencies were removed. ECD spectra for each conformer were computed using TD-DFT at the B3LYP-D3/LACVP** level, using 20 excited states generated by Tamm-Dancoff approximation. Boltzmann conformer populations were used to create a weighted averaged ECD spectrum. Experimental and predicted spectra were visualized using Excel. Comparison between experimental and predicted UV spectra was used to determine wavelength corrections and to match intensities of signals. Metabolites were calculated as neutral molecules.

3.5.2. GAIO NMR Predictions

OPLS4 module was used for conformation generation with “mixed torsional/low mode sampling” in the OPLS4 force field. A 6 kcal/mol energy window and 3,000 maximum number of steps was employed for the search. Geometry optimization using Jaguar (version 2023-3, Schrodinger LLC) was performed at the B3lYP/6-113G** level in solvent phase using PCM (chloroform). 1H and 13C NMR chemical shifts were calculated at the same level, using gauge-invariant atomic orbital (GIAO) shielding constant calculations. PBF solvent model was used for calculation of free energies at B3lYP/6-113G** level. Boltzmann populations were computed and used to average NMR chemical shifts. Scaled and unscaled 1H and 13C NMR chemical shifts were used when calculated using the DP4+ excel sheet provided by Grimblat et al. [6]. Exchangeable protons were not included in DP4+ comparisons.

3.6. X-Ray Crystallography

Anthoteibinene M (8) was crystallized from a 50/50 mixture of hexanes and ethyl acetate in a refrigerator with limited oxygen for two days. X-ray diffraction data were measured on Bruker D8 Venture PHOTON II CMOS diffractometer equipped with a Cu Kα INCOATEC ImuS micro-focus source (λ = 1.54178 Å). Indexing was performed using APEX4 (Difference Vectors method) [14]. Data integration and reduction were performed using SaintPlus [15]. Absorption correction was performed by multi-scan method implemented in SADABS [16]. Space group was determined using XPREP implemented in APEX3 [17]. Structure was solved using SHELXT and refined using SHELXL-2019/1 (full-matrix least-squares on F2) through OLEX2 interface program [18,19]. The ellipsoid plot was made with Olex2 [19]. Hydrogen atoms of -OH group and H2O molecules were freely refined.

4. Conclusions

The unexplored deep-sea coral Anthothela grandiflora revealed new cadinene-like sesquiterpenes, anthoteibinenes F-Q, using both a bioassay guided and 1H NMR-guided approach, the latter targeting the two doublet methyl groups of the isopropyl group with olefinic and aromatic signals. The compounds showed a variety of two and three rings systems and functional groups varying among alcohols, acetals, hemiacetals, ketones, esters, carboxylic acids, and amides. One of the compounds showed moderate antifungal activity. The research shown here represent the unique biodiversity offered by the relatively unexplored deep-sea. These results highlight the importance for further research of deep-sea organisms and its potential for the discovery of novel chemical compounds for the drug discovery field.

Supplementary Materials

1H, 13C, COSY, HSQC and HMBC NMR spectra, HRMS and ECD spectra of anthoteibinenes F-Q (1-12) are available free of charge at Preprints.org.

Author Contributions

Conceptualization, A.L.A, M.J., B.J.B; methodology, S.S.H.O, S.A., E.C.R., R.M.Y., B.J.B.; formal analysis, S.S.H.O, S.A., E.C.R., R.M.Y., B.J.B.; data curation, S.S.H.O, B.J.B.; writing—original draft preparation, S.S.H.O., S.A. ; writing—review and editing, all authors; supervision, A.L.A., M.J., B.J.B.; funding acquisition, A.L.A., M.J., B.J.B. All authors have read and agreed to the published version of the manuscript.

Funding

This work was supported by Science Foundation Ireland (SFI) and the Marine Institute under the Investigators Programme Grant No. SFI/15/1A/3100, co-funded under the European Regional Development Fund 2014-2020, to ALA and the US National Institutes of Health grant R21 AT010939 to BJB. Expedition CE16006 funded under the Irish National Shiptime Programme.

Data Availability Statement

The NMR data for the following compounds has been deposited in the Natural Products Magnetic Resonance Database (NP-MRD; www.np-mrd.org) and can be found at NP0332688 (Anthoteibinene F), NP0332689 (Anthoteibinene G), NP0332690 (Anthoteibinene H), NP0332691 (Anthoteibinene I), NP0332692 (Anthoteibinene J), NP0332693 (Anthoteibinene K), NP0332694 (Anthoteibinene L), NP0332695 (Anthoteibinene M), NP0332696 (Anthoteibinene N), NP0332697 (Anthoteibinene O), NP0332698 (Anthoteibinene P) and NP0332699 (Anthoteibinene Q). X-ray metadata was deposited at the Cambridge Crystallographic Data Centre, deposition number 2345725. Other data not found in the Supporting Information will be available upon request to the corresponding author.

Acknowledgments

The authors wish to thank the crew and scientists of research expedition CE16006 aboard RV Celtic Explorer. We also thank USF core facility staff, including the Directors of the Chemical Purification, Analysis, and Screening, the Interdisciplinary NMR Facility and the X-ray Diffraction and Solid State Characterization core facilities.

Conflicts of Interest

The authors declare no conflict of interest.

References

  1. Newman, D.J.; Cragg, G.M. Natural products as sources of new drugs over the nearly four decades from 01/1981 to 09/2019. J. Nat. Prod. 2020, 83, 770–803. [Google Scholar] [CrossRef]
  2. Altmann, K.-H. Drugs from the oceans: Marine natural products as leads for drug discovery. Chimia 2017, 71, 646–646. [Google Scholar] [CrossRef]
  3. Macreadie, P.I.; McLean, D.L.; Thomson, P.G.; Partridge, J.C.; Jones, D.O.B.; Gates, A.R.; Benfield, M.C.; Collin, S.P.; Booth, D.J.; Smith, L.L.; et al. Eyes in the sea: Unlocking the mysteries of the ocean using industrial, remotely operated vehicles (ROVs). Sci. Total Environ. 2018, 634, 1077–1091. [Google Scholar] [CrossRef] [PubMed]
  4. Skropeta, D.; Wei, L. Recent advances in deep-sea natural products. Nat. Prod. Rep. 2014, 31, 999–1025. [Google Scholar] [CrossRef]
  5. Olsen, S.S.; Afoullouss, S.; Young, R.M.; Johnson, M.; Allcock, A.L.; Teng, M.N.; Tran, K.C.; Baker, B.J. Anthoteibinenes A–E from the Irish Deep-Sea Coral Anthothela grandiflora: An Amination Puzzle. Org. Lett. 2024. [Google Scholar] [CrossRef]
  6. Grimblat, N.; Zanardi, M.M.; Sarotti, A.M. Beyond DP4: an improved probability for the stereochemical assignment of isomeric compounds using quantum chemical calculations of NMR shifts. J. Org. Chem. 2015, 80, 12526–12534. [Google Scholar] [CrossRef]
  7. Bagno, A.; Saielli, G. Addressing the stereochemistry of complex organic molecules by density functional theory-NMR. WIREs Comp. Mol. Sci. 2015, 5, 228–240. [Google Scholar] [CrossRef]
  8. Zhuang, Y.; Yang, F.; Menon, A.; Song, J.M.; Espinoza, R.V.; Schultz, P.J.; Garner, A.L.; Tripathi, A. An ECD and NMR/DP4+ computational pipeline for structure revision and elucidation of diphenazine-based natural products. J. Nat. Prod. 2023, 86, 1801–1814. [Google Scholar] [CrossRef]
  9. Marcarino, M.O.; Cicetti, S.; Zanardi, M.M.; Sarotti, A.M. A critical review on the use of DP4+ in the structural elucidation of natural products: the good, the bad and the ugly. A practical guide. Nat. Prod. Rep. 2022, 39, 58–76. [Google Scholar] [CrossRef]
  10. Gawel, K.; Langlois, M.; Martins, T.; van der Ent, W.; Tiraboschi, E.; Jacmin, M.; Crawford, A.D.; Esguerra, C.V. Seizing the moment: Zebrafish epilepsy models. Neurosci. Biobehav. Rev. 2020, 116, 1–20. [Google Scholar] [CrossRef] [PubMed]
  11. Tkachev, A.V.; Gur’ev, A.M.; Yusubov, M.S. Acorafuran, a new sesquiterpenoid from Acorus calamus essential oil. Chem. Nat. Compd. 2006, 42, 696–698. [Google Scholar] [CrossRef]
  12. Tong, X.-G.; Qiu, B.; Luo, G.-F.; Zhang, X.-F.; Cheng, Y.-X. Alkaloids and sesquiterpenoids from Acorus tatarinowii. J. Asian Nat. Prod. Res. 2010, 12, 438–442. [Google Scholar] [CrossRef]
  13. CLSI. Performance standards for antimicrobial susceptibility testing: Twenty-fifth informational supplement; Clinical and Laboratory Standards Institute: Wayne, PA, 2015; Volume CLSI document M100-S25.
  14. Bruker APEX4, 2015.9; Bruker AXS Inc: Madison, WI USA, 2022.
  15. Bruker SAINT, 8.35A; Bruker AXS Inc.: Madison, WI USA, 2016.
  16. Krause, L.; Herbst-Irmer, R.; Sheldrick, G.M.; Stalke, D. Comparison of silver and molybdenum microfocus X-ray sources for single-crystal structure determination. J. Appl. Crystallogr. 2015, 48, 3–10. [Google Scholar] [CrossRef] [PubMed]
  17. Sheldrick, G. SHELXT - Integrated space-group and crystal-structure determination. Acta Crystallogr. Sec. A 2015, 71, 3–8. [Google Scholar] [CrossRef] [PubMed]
  18. Sheldrick, G., M. Crystal structure refinement with SHELXL. Acta Crystal. Sec. C 2015, 71, 3–8. [Google Scholar] [CrossRef] [PubMed]
  19. Dolomanov, O.V.; Bourhis, L.J.; Gildea, R.J.; Howard, J.A.K.; Puschmann, H. OLEX2: A complete structure solution, refinement and analysis program. J. Appl. Crystallogr. 2009, 42, 339–341. [Google Scholar] [CrossRef]
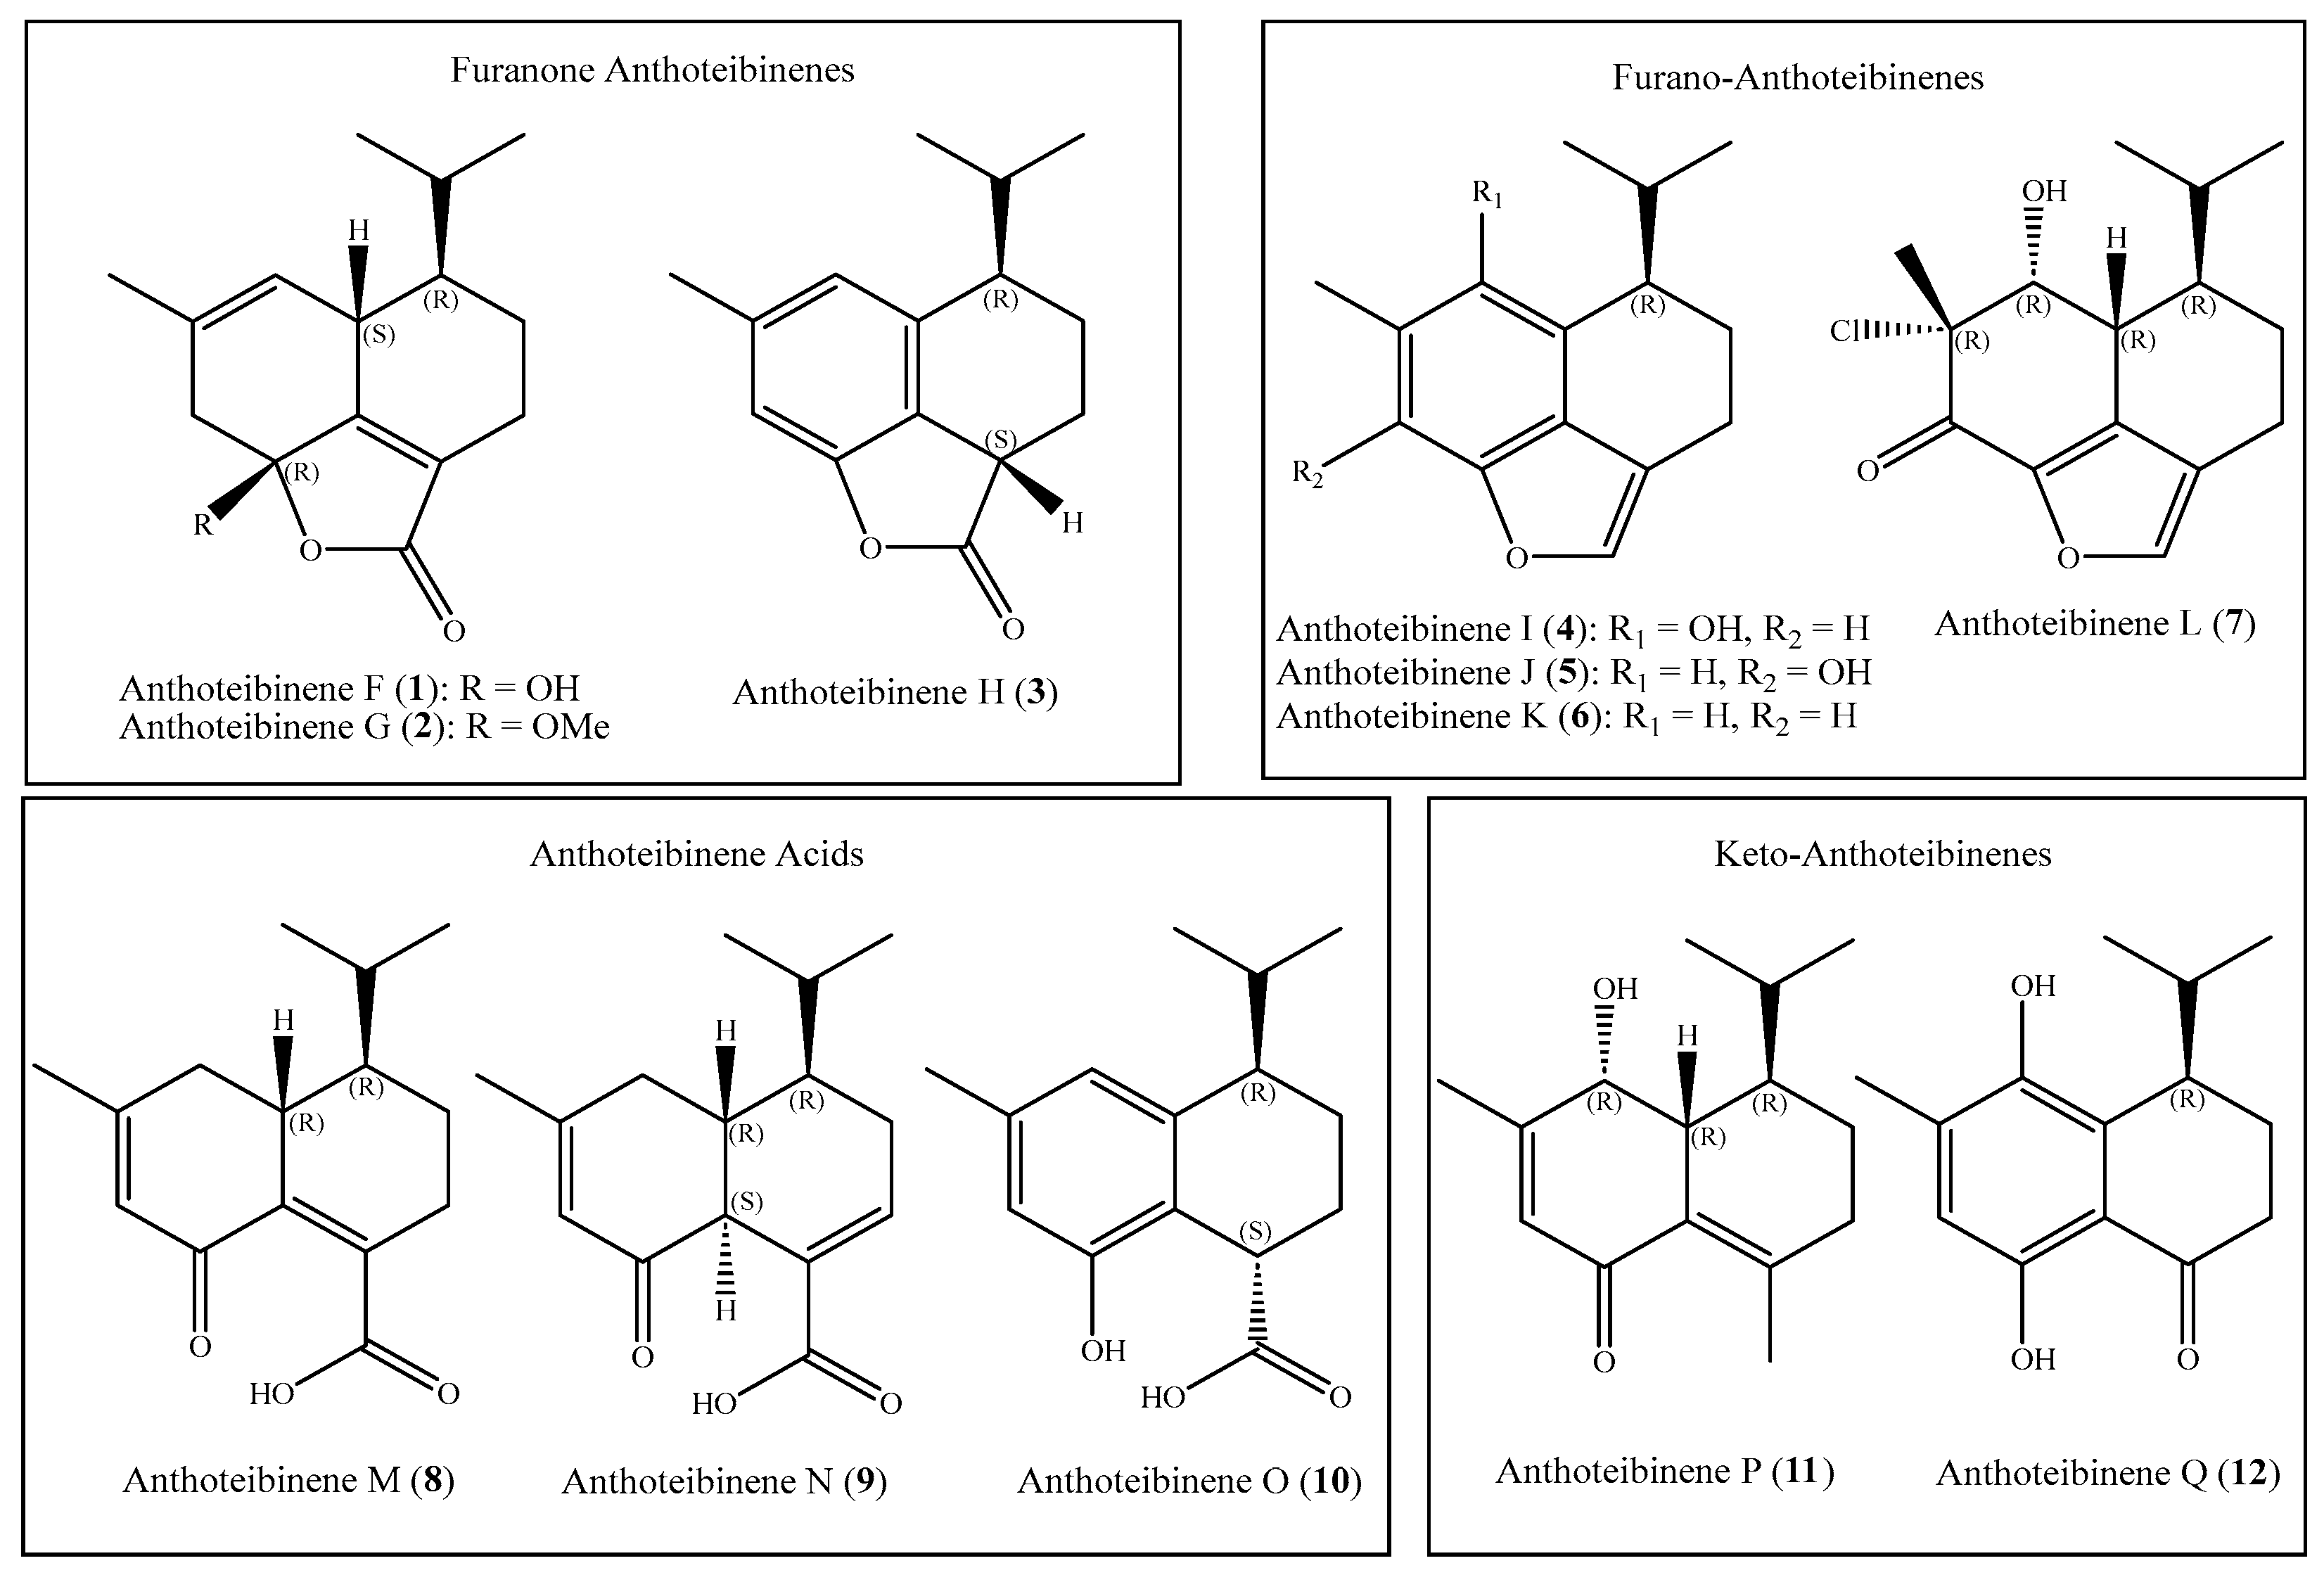
Figure 1. Anthoteibinenes F-Q, sesquiterpenes from the Irish deep-sea coral Anthothela grandiflora.
Preprints 142046 g001
Figure 2. Key COSY (bold bonds) and HMBC (arrows) correlations establishing the planar structure of anthoteibinene F (1).
Preprints 142046 g002
Figure 3. Wire frame plot of anthoteibinene M (8).
Preprints 142046 g003
Figure 4. Stereochemical analysis of anthoteibinene F (1). A) NOESY spectrum of 1, with key NOE correlations highlighted. B) Conformers of 1 found using OPLS4 highlighting two main conformer types. C) DP4+ probability of two possible diastereomers of 1. D) Experimental ECD (black) spectrum vs calculated spectra for 2R,6S,7R (red/upper broken trace) and 2S,6R,7S (blue/lower broken trace).
Preprints 142046 g004
Figure 5. Top) DP4+ probability of 7R,10R vs 7R,10S of 3 and 10. Bottom) Experimental ECD (black) and predicted ECD (7R,10R, blue) and (7R,10S, red) spectra of 3 and 10.
Preprints 142046 g005
Figure 6. Top) NOESY correlations establishing relative configuration of 7 and 9, respectively, displayed on low energy conformers. Bottom) Experimental ECD (black) spectrum vs calculated spectra for respective enantiomers (red/blue broken trace).
Preprints 142046 g006
Table 1. NMR Data for Anthoteibinene F (1) (600 (1H) and 150 (13C) MHz, CDCl3).
Position δC, type δH, mult. (J in Hz) gCOSY gHMBC
1 162.0, C
2 102.0, C
3a 43.4, CH2 2.50, br dd (1.3, 17.5) 3b, 5, 15 2, 4, 5
3b 2.71, d (17.5) 3a 1, 2, 4, 5, 15
4 131.1, C
5 120.3, CH 5.58, br s 3b, 6, 15 1, 3, 6, 15
6 35.5, CH 3.00, br dq (2.5, 7.9) 7, 15 1, 5, 7
7 45.3, CH 1.19, dddd (2.4, 2.4, 10.2, 12.4) 6, 8a, 8b, 11 5, 6, 11, 12, 13
8a 21.1, CH2 1.91, dddd (2.1, 2.1, 5.5, 13.4) 7, 8b, 9b 6, 7, 10, 11
8b 1.35, dddd (5.3, 12.2, 12.2, 13.1) 7, 8a, 9a, 9b 6, 7, 9
9a 20.3, CH2 2.42, br dddd (2.0, 2.5, 5.0, 18.0) 8b, 9b 1, 7, 10
9b 2.09, o/l* 8a, 8b, 9b 1, 10
10 127.1, C
11 26.8, CH 2.12, o/l* 7, 12, 13 6, 7, 12, 13
12 21.6, CH3 1.03, d (6.9) 11 7, 11, 13
13 15.8, CH3 0.89, d (6.9) 11 7, 11, 12
14 170.2, C
15 23.5, CH3 1.77, s 3b, 5, 6 3, 4, 5
OH 7.30, d (0.7) 1, 2, 3
*Overlapping 1H NMR signals, 2D assignments based on proximity likelihood.
Table 2. NMR Data for Anthoteibinene G and H (2, 3) (400 (1H) and 100 (13C) MHz, CDCl3).
Position 2 3
δC, type δH, mult. (J in Hz) δC, type δH, mult. (J in Hz)
1 160.6, C 120.4, C
2 105.4, C 153.4, C
3a 42.5, CH2 2.73, d (17.4) 113.7, CH 6.17, s
3b 2.41, ddq (1.3, 1.3, 17.3)
4 131.4, C 135.9, C
5 120.2, CH 5.55, s 120.8, CH 6.60, s
6 36.1, CH 2.86, br dq (2.5, 7.9) 141.7, C
7 45.5, CH 1.20, dddd (2.2, 2.4, 10.1, 12.4) 43.3, CH 2.64, ddd (5.0, 5.5, 6.8)
8a 21.3, CH2 1.93, dddd (2.1, 2.1, 5.5, 13.4) 21.2, CH2 1.94, dddd (3.6, 5.0, 8.5, 13.0)
8b 1.35, dddd (5.3, 12.2, 12.2, 13.1) 1.56, dddd (2.8, 6.5, 9.8, 13.0)
9a 20.6, CH2 2.48, dddd (2.0, 2.5, 5.0, 18.0) 24.8, CH2 1.74, dddd (3.0, 6.5, 10, 13.0)
9b 2.13, o/l* 2.14, o/l*
10 129.4, C 37.4, CH 4.05, t (7.0)
11 26.8, CH 2.13, o/l* 30.7, CH 2.21, octet (6.4)
12 21.6, CH3 1.03, d (6.9) 21.7, CH3 1.02, d (6.8)
13 15.9, CH3 0.90, d (6.9) 18.0, CH3 0.76, d (6.8)
14 170.1, C 177.8, C
15 23.5, CH2 1.75, s 21.2, CH3 2.13, s
16 50.9, CH3 3.22, s
*Overlapping 1H NMR signals, 2D assignments based on proximity likelihood.
Table 3. NMR Data for Anthoteibinenes I-L (4-7).
Position 4 5 6 7
δC, typea δH, mult. (J in Hz)b δC, typea δH, mult. (J in Hz)b δC, typec δH, mult. (J in Hz)d δC, typee δH, mult. (J in Hz)f
1 125.2, C 126.7, C 124.9, C 140.0, C
2 146.8, C 141.7, C 152.9, C 142.0, C
3 109.4, CH 7.05, s 137.5, C 108.4, CH 7.19, s 177.4, C
4 123.1, C 119.9, C 134.0, C 69.2, C
5 147.0, C 122.2, C 6.74, s 120.6, CH 6.95, s 78.6, CH 4.35, br d (2.9)
6 120.1, C 125.0, C 135.1, C 36.7, C 3.49, dd (2.8, 11.6)
7 37.5, CH 2.98, ddd (3.4, 3.9, 7.8) 41.9, CH 2.59, ddd (4.6, 5.8, 6.3) 42.4, CH 2.76, o/l* 39.9, CH 1.70, dddd (1.9, 1.9, 11.7, 11.7)
8a 25.7 CH2 2.23, o/l* 25.1 CH2 1.86, o/l* 24.9, CH2 1.96, m (2H) 22.3, CH2 2.01, br dddd (1.5, 1.5, 5.9, 13.4)
8b 1.54, dddd (4.8, 6.0, 12.5, 13.0) 1.81, o/l* 1.53, dddd (5.7, 12.6, 12.6, 12.6)
9a 15.9, CH2 2.66, m (2H) 17.7, CH2 2.65, ddd (5.6, 5.8, 16.1) 17.7, CH2 2.88, m 19.4, CH2 2.83, br ddd (<0.5, 5.4, 16.6)
9b 2.76, ddd (4.9, 8.0, 16.0) 2.78, o/l* 2.49, ddd (5.0, 12.1, 16.7)
10 116.2, C 117.1, C 116.5, C 123.3, C
11 31.1, C 1.72, octet (7.3) 29.0, C 2.03, octet (6.6) 28.8, CH 2.17, octet (6.9) 26.3, CH 2.09, d sept (2.2, 6.9)
12 20.7, CH3 0.94, d (6.5) 21.3, CH3 0.97, d (6.8) 21.2, CH3 1.08, d (6.8) 21.2, CH3 1.07, d (6.9)
13 21.2, CH3 0.91, d (6.7) 18.9, CH3 0.89, d (6.8) 18.8, CH3 0.99, d (6.9) 15.8, CH3 0.97, d (7.0)
14 137.6, CH 7.44, s 137.1, CH 7.50, s 137.3, CH 7.60, s 145.2, CH3 7.45, s
15 17.8, CH3 2.25, s* 16.2, CH3 2.24, s 21.8, CH3 2.50, s 22.8, CH3 1.88, s
OH 7.92, s 9.29, br s
a150 MHz, (CD3)2SO; b600 MHz, (CD3)2SO; c100 MHz, (CD3)2SO; d400 MHz, (CD3)2SO; e150 MHz, CDCl3; f600 MHz, CDCl3; *Overlapping 1H NMR signals, 2D assignments based on proximity likelihood.
Table 4. NMR Data (CDCl3) for Anthoteibinenes M-O (8-10).
Position 8 9 10
δC, typea δH, mult. (J in Hz)b δC, typec δH, mult. (J in Hz)d δC, typec δH, mult. (J in Hz)d
1 137.0, C 47.1, CH 3.63, br d (3.9) 118.6, C
2 190.6, C 199.3, C 153.8, C
3 127.0, CH 6.05, s 125.6, CH 5.89, s 113.9, CH 6.41, s
4 165.0, C 159.3, C 136.9, C
5a 37.5, CH2 2.59, dd (5.3, 17.8)* 32.2, CH2 2.62, br d (20.1) 121.8, CH 6.63, s
5b 2.18, dd (11.3, 17.4) 2.48, d (18.5)
6 39.3, CH 2.65, o/l* 36.8, CH 2.18, o/l* 141.8, C
7 44.9, CH 1.34, o/l* 35.1, CH 1.67, dddd (4.6, 4.6, 11.0, 11.0, ) 42.8, CH 2.55, ddd (5.5, 5.5, 5.5)
8a 19.9, CH2 1.75, br m 25.2, CH2 2.22, o/l* 20.8, CH2 1.87, br m
8b 1.31, o/l* 1.97, o/l* 1.65, dddd (5.8, 5.8, 5.8, 5.8)
9a 28.7, CH2 2.53, o/l* 141.4, CH 7.10, br s 24.1, CH2 1.93, o/l*
9b 2.09, br dd (7.4, 9.7)
10 140.4, C 129.3, C 40.2, CH 3.74, t (5.8)
11 27.1, CH 1.90, dsept (2.0, 6.7) 27.1, CH 1.83, octet (4.8) 31.6, CH 2.13, octet (6.2)
12 21.5, CH3 1.01, d (6.7) 20.6, CH3 0.89, d (6.9) 21.8, CH3 1.00, d (6.6)
13 16.2, CH3 0.82, d (6.9) 14.1, CH3 0.78, d (6.8) 18.5, CH3 0.76, d (6.8)
14 171.4, C 170.9, C 181.7, C
15 24.5, CH3 2.03, s 24.5, CH3 1.99, s* 21.3, CH3 2.19, s
a150 MHz; b500 MHz; c100 MHz; d400 MHz; *Overlapping 1H NMR signals, 2D assignments based on proximity likelihood.
Table 5. NMR Data (CDCl3) for Anthoteibinenes P and Q (11, 12).
Position 11 12
δC, typea δH, mult. (J in Hz)b δC, typec δH, mult. (J in Hz)d
1 125.7, C 114.6, C
2 190.6, C 157.2, C
3 129.4, CH 5.94, s 116.9, CH 6.65, s
4 158.5, C 135.3, C
5 68.6, CH 4.01, br d (2.6) 143.0, C
6 44.2, CH 2.59, br ddq (2, 4.5, 10) 132.6, C
7 39.4, CH 1.80, dddd (2.5, 2.9, 9.8, 12.5) 38.1, CH 2.87, ddd (3.5, 3.5, 9.5)
8a 19.9, CH2 1.72, dddd (3.9, 3.9, 3.9, 12.8) 33.3, CH2 2.29, o/l*
8b 1.22, dddd (5.5, 11.0, 12.5, 12.5) 2.04, dddd (4.7, 4.7, 14.0, 14.0)
9a 34.2, CH2 2.22, m 24.7, CH2 2.79, ddd (5.8, 14.0, 19.3)
9b 2.55, ddd (1.6, 5.2, 19.3)
10 153.1, C 204.4, C
11 27.2, CH 1.95, d sept (2.8, 6.9) 31.3, CH 1.87, d sept (6.7, 9.6)
12 21.6, CH3 1.03, d (6.9) 21.3, CH3 1.10, d (6.5)
13 16.2, CH3 0.82, d (6.9) 21.2, CH3 0.91, d (6.7)
14 22.5, CH3 2.10, s* 17.4, CH3 2.29, s*
15 22.0, CH3 2.10, s*
OH 12.21
a100 MHz; b400 MHz; c150 MHz; d600 MHz; *Overlapping 1H NMR signals, 2D assignments based on proximity likelihood.
Table 6. Antifungal activity (IC50) of Anthoteibinene J (5) toward Candida spp.
Strain 5 (µg/mL) Fluconazole (µg/mL)
C. albicans MYA-2876 9.1 ± 0.64 0.25 ± 0.04
C. albicans ATCC-18804 7.7 ± 0.71 0.29 ± 0.09
C. albicans ATCC-28121 7.7 ± 0.79 0.61 ± 0.09
C. albicans ATCC-76485 8.2 ± 0.78 0.92 ± 0.26
C. albicans ATCC-90029 7.0 ± 0.81 0.19 ± 0.04
C. auris AR0385 10.0 ± 1.20 0.92 ± 0.26
1
iAnthoteibinenes derive their name from a contraction of the genus, Anthothela, with the Irish word for terpene, teibín.
Disclaimer/Publisher’s Note: The statements, opinions and data contained in all publications are solely those of the individual author(s) and contributor(s) and not of MDPI and/or the editor(s). MDPI and/or the editor(s) disclaim responsibility for any injury to people or property resulting from any ideas, methods, instructions or products referred to in the content.
Copyright: This open access article is published under a Creative Commons CC BY 4.0 license, which permit the free download, distribution, and reuse, provided that the author and preprint are cited in any reuse.
Prerpints.org logo

Preprints.org is a free preprint server supported by MDPI in Basel, Switzerland.

Subscribe

© 2024 MDPI (Basel, Switzerland) unless otherwise stated