
Submitted:
06 December 2024
Posted:
09 December 2024
You are already at the latest version
Abstract
With the increasing demand for electricity and the rapid changes in their energy resources portfolio, utilities need to protect the reliability of their systems. This need for reliability and resource adequacy is the foundation of the Integrated Resources Plan (IRP) required by many states. A component of the plan includes the study of a system’s ability to transfer power over the transmission network through import and/or export. Utilities commonly study this by manually simulating large sets of contingencies—an exhaustive and multi-step process. Dominion Energy has developed an automation toolset that leverages pyPowerGEM and Python to create simulations and tune generation dispatch, while maintaining N-1 security. Results for various use cases showed that the transfer capability automation tool, the first component of the toolset, dramatically reduced the time to calculate transfer capability—by up to 90%. Moreover, the transfer capability enhancement tool, the second component of the toolset, improved the transfer capability through generation re-dispatching, which provided engineers with a better understanding of the transmission network constraints and how they can affect access to needed electricity. The tool’s graphical user interface (GUI) allows access to a large range of users interested in understanding both import and export transfer capability limits. While this automation tool was built and tested for Dominion Energy, the general outline of the tool provided in this paper can be adopted by other utilities and adapted to their systems.
Keywords:
Integrated resource plan (IRP)
; pyPowerGEM
; TARA
; transfer capability analysis
; transfer capability improvement
I. Introduction
Dominion Energy Virginia delivers electricity to customers in Virginia and North Carolina. As both a generator owner and transmission owner, the company is legally required to develop an Integrated Resource Plan (IRP) to be reviewed by the respective State Corporation Commissions bi-annually. The IRP is a 15-year planning document with a 15-year planning horizon that uses current laws, technology, and cost assumptions to ensure both reliability and cost efficiency for customers in the future [1]. It does not officially request any changes to the system, but it highlights a variety of futures regarding cost, resource adequacy, transmission reliability, and carbon emissions. The IRP introduces resources to be used in other filings, evaluates the retirement of existing resources, addresses current and possible future environmental regulations, and estimates cost for the multiple plans proposed.
The importance and scope of this document has changed dramatically over the years as conventional fossil-fuel-based generation is rapidly being retired and replaced by intermittent, renewable-based sources. Due to the sharp increase in forecasted loads, transmission systems are also facing possible limitations of their carrying capability due to thermal and voltage limit violations. To perform the resource adequacy analysis required by the IRP, one input must be the transmission network’s transfer capability. The ability to import or export power supports Dominion Energy’s load when internal generation resources are low. The system’s transfer capability needs to be measured and studied under different generation dispatch levels to determine resource adequacy and to assess system reliability. Measuring an area’s transfer capability means analyzing the system’s capacity to transfer power after various contingencies have been applied.
Both over- and under-estimation of transfer capability can have a negative impact on the system. Over-estimation can lead to loss of reliability during an event if the system cannot import or export the expected amount of power, causing load loss or other technical constraint violations. One reason for the major blackout in the Northeastern U.S. and Canada in August 2003 was over-estimation of transfer capability [2]. On the other hand, under-estimation can prevent proper utilization of resources, leading to economic loss when utilities have additional power available that goes unsold. Moreover, with the increase in extreme weather events and their socioeconomic impact [3], proper estimation of transfer capability under various scenarios is required. Thus, a proper and accurate assessment of the transfer capability needs to consider various contingencies.
Two of the criteria used to assess the transfer capability are first-contingency incremental transfer capability (FCITC) and first-contingency total transfer capability (FCTTC). As defined by North American Electric Reliability Corporation (NERC), FCITC is the maximum incremental power that, given a set of initial conditions, can reliably be transferred from one area of an interconnected system to another without violating the N-1 contingency level. FCTTC refers to the total maximum power that can be transferred across areas under a given set of initial conditions and satisfying N-1 contingencies [4].
Ongoing and recent studies and rulings at the federal levels further highlight the importance of transmission transfer capability.
- NERC is conducting an Interregional Transfer Capability Study (ITCS) that will be released in 2025 [5]. The study focuses on analyzing the ability to transfer power among the U.S.’s six regional entities.
- The Department of Energy completed a National Transmission Needs Study in 2023 and identified transmission constraint corridors. [6]
- The Federal Energy Regulatory Commission released Order 1920 on May 13, 2024, which addresses regional transmission policy. Its purpose is to increase the speed at which the transmission network can expand to bolster system reliability and support the connections of generation resources [7].
There are different ways to measure a system’s transfer capability. AC-power-flow-based approaches consider non-linear power flow equations, such as repetitive power flow, continuation power flow and optimal power flow. But because of the large data sets that need to be analyzed, these methods face challenges with scalability and computational efficiency. They also might not be feasible in real scenarios that have a large number of contingencies [2,8].
For these reasons, utilities normally employ linear approximation methods for transfer limit studies [9]; AC verification can be performed for the top mon/con pairs— a monitored electrical element and the applied contingency element—that limit the transfer capability. In the linear method, transfer capability is calculated based on a sensitivity metric called the “transfer distribution factor,” which will be described in Section II.
The linear approximation method that Dominion Energy uses is the proportional transfer limit by DC with AC verification. This function is available in TARA through the TARAViewer and is used to calculate the incremental transfer limit and total transfer capability for both import and export cases.
Using the TARAViewer is a time-intensive, manual process. First, the user has to calculate the FCITC, formulate an updated case using the data, and then run the power flow to obtain the total transfer capability. If there are separate files for different contingencies, each file is uploaded manually, a simulation is performed for each, and then the results are post-processed. Furthermore, in instances where the base case simulation might not provide the satisfied transfer capability (which could lead to under-utilization of resources), the system generation and load dispatch patterns would need to be iteratively readjusted.
To reduce the time and increase the ease of conducting transfer capability analyses, Dominion has developed a framework and an automation tool which can achieve an accurate and satisfied transfer limit capability in much less time. Instead of performing hundreds of manual steps, a user only has to run this automation tool twice, no matter how many contingency files are included. Processing time has decreased up to 90% and any possible errors caused by manually handling files have been eliminated. We also developed a Graphical User Interface (GUI) that can be used by anyone to conduct a transfer capability study, even a person with no background knowledge of the software.
This paper is organized as follows: Section II describes the transfer limit analysis based on DC with AC verification. Section III describes the software used to develop the automation toolset. Section IV describes the methodologies for the transfer limit study automation toolset which consists of a transfer capability automation tool (TRACT) and a transfer capability enhancement tool (TRACE). Section V presents the study’s results, followed by our conclusions and suggestions for future work in Section VI.
II. Transfer Limit Analysis
Transfer limit analysis measures a system’s capability to import or export power under various scenarios. This section describes a linear method we used for studying transfer limits where the thermal loading in the monitored elements was considered to help find the limit. MVAR flows were assumed to be negligible, the voltage was assumed to be 1 p.u., and DC power flow was used. In a linear assumption, changing the power flow in one element in the network causes a linear change in power flow in other elements of the network. The transfer distribution factor (TDF) of branch measures the impact of incremental transfer on it. The outage transfer distribution factor (OTDF) measures the impact that one element’s change in power has on other monitored elements for a given contingency; the TDF is calculated after the contingency is applied. Incremental power flow in the monitored branch due to incremental transfer is calculated by Equation (1).
The incremental transfer limit of the monitored branch under a given contingency is calculated by Equation (2). See Figure 1.
Once the transfer limit is found for all monitored branches under all contingencies, the lowest incremental transfer limit is chosen. For example, in Figure 1, line 1 has a lower incremental transfer limit than line 2, so line 1’s incremental transfer limit would be taken. Linear analysis is used to find the top x worst case mon/con pair- a monitored electrical element and the applied contingency element—that limit the transfer capability. The AC power flow-based method can then be used for verification.
Generator distribution factor (DFAX) can also be used to indicate the change in power flow when generator output changes using mon/con pairs. If the DFAX is positive, flow in the monitored line increases as the generator output increases; this is known as a harmer generator because it increases the line’s load, thus decreasing its capacity to carry further. On the other hand, if the DFAX is negative, the flow in the line will decrease as the generator output increases; this is known as a helper generator.
III. Software
This section briefly summarizes the commercial software packages used to develop the automation toolset.
A. TARA
TARA (Transmission Adequacy and Reliability Assessment) by PowerGEM identifies and analyzes transmission bottlenecks. In this paper we will discuss some of TARA’s features that apply to transfer capability studies. TARA can perform linear, power flow-based transfer-limit analysis with AC verification. This provides the satisfied accuracy with less computational effort than a fully AC-based method, thus making it suitable for analyzing a large number of contingencies. The distribution factor cutoff can be specified to include only those mon/con pairs with a DFAX higher than the cutoff point. As we conducted our study, TARA’s Excel module recorded every operation we performed in ExcelViewer and generated a script, which we then used in the automation tool.
B. pyPowerGEM
This Python module developed by PowerGEM provides flexibility in running, analyzing and updating test cases, and develops automation. It includes many application programming interfaces (APIs). The pyTARA API functionalities include loading cases, solving them, and looping over elements, as well as modifying and saving updated cases. The wrapper API, another available module, can be used to run the automation script. Both pyTARA and wrapper APIs were used to develop the automation tool.
C. Python
Python is an open-source, high-level, interpreted, general-purpose dynamic programming language that is powerful, flexible, and easy to use. A large and active user community contributes to the development of many open-source packages that can be leveraged while writing a script. User-friendly data structures make it popular in various industries.
IV. Methodology
The first part of this section describes the approach used to create the Transfer Capability Automation Tool (TRACT) and the second part describes the Transfer Capability Enhancement Tool (TRACE). TRACT is used to assess the transfer capability of the system, while TRACE is used to improve transfer limits by re-dispatching the generators based on the helper/harmer bus.
A. Transfer Capability Automation Tool (TRACT)
Before implementing TRACT, a script of the transfer limit analysis and power flow was recorded using ExcelViewer. A template was then formulated from the script, where the parameters (like name of files, mode of study, and solving options) were replaced with the names of variables, then later replaced again during the simulation with actual values.
The process used to implement TRACT is shown in the flow chart in Figure 2. The first step was to decide whether to conduct an import or export capability study.
Once the user selected the mode of study, the GUI asked the user to upload a variety of files: the case file, study file, monitor file, contingency files, and exclusion file, if any. An advantage of this automation tool is that users can select as many contingency files as needed for a given case, unlike the conventional method where the user has to upload one contingency file at a time. It is often desirable to use many contingency files to find the most limiting contingency set, based on the NERC-defined contingency criteria [3]. For a transfer analysis, an N-1-1 is the most conservative, but it is extremely computationally intensive. Thus, we determined that, for the IRP, it was desirable to find the most limiting contingency in P1 - P7. Once the file was loaded, the automation tool ran and output the FCITC and FCTTC.
TRACT first chose one contingency file and created a TARA object using a pyPowerGEM wrapper. The template script created a “dictionary” of variables names which contained values such as the file name paths, modes of study and other simulation parameters. Once the FCITC is calculated, it saved the new transfer limit file in a specific directory; then the file was parsed, and the base case updated with the new incremental value.
Next, a script for power flow was run to calculate the FCTTC. At the same time, the corresponding template needed to be updated with file names and other variables. Once the simulation was complete, corresponding files were parsed from the directory and post-processed to get the FCTTC value, as well as the amount of power transferred across the neighboring areas at the given FCITC.
The same analysis was automatically performed with each contingency file in the stack until all .con files were processed. Then FCITC and FCTTC minimum values were reported. The same algorithm was used for export analysis; the only difference was that the import and export areas needed to be interchanged during the course of simulation, which could be updated in the template.
B. Transfer Capability Enhancement Tool (TRACE):
Enhancing the transfer capability analysis by tuning and re-dispatching the case has traditionally been an intensely manual process:
- Perform the transfer capability analysis
- Generate the DFAX report
- Identify the harmer/helper bus
- Take corrective action
- Perform repeated iterations.
A transfer capability enhancement tool, called TRACE, was designed and built to automate the process, leveraging TRACT to increase the transfer capability of the system. We used an iterative-based approach to determine the transfer limits, as shown in the process flow diagram in Figure 3.
An additional script that calculated the DFAX report was generated using TARA Excel and the template previously created. First, users read the required fields using the GUI interface. Then TRACT was run to get FCITC and FCTTC. Next, the DFAX report corresponding to mon/con pair, which determines the transfer limit, was obtained by running the script. The DFAX report was parsed, and the most impactful helper/harmer bus, if any, was chosen.
Generators present in those buses were then re-dispatched. For example, one option would be to shut down generators of the harmer bus or re-dispatch to some lower value and switch on helper buses to increase output. After the case was updated, the power flow was performed and the limits of the swing bus were checked. If limits were violated, the generators were re-dispatched so that the remaining generators compensated for the violations. After rescaling the generators, a new updated case was created and the process is re-iterated to obtain a better level of transfer capability. Iterations continued until the stopping criteria is reached.
C. Study Cases
Because Dominion Energy is a member of PJM, the Regional Transmission Organization, we performed our transfer analysis using two transmission study cases that they developed.
- (1)
- The RTEP Model
PJM develops the Regional Transmission Expansion Plan (RTEP) model each year, in compliance with NERC standards. According to PJM Manual 14B [9], the RTEP base case is developed in three periods: Summer, Winter and Light Load. Besides NERC criteria, the model also considers the regional planning criteria that drive the analysis, studies, and proposal windows. Specific results from PJM studies conducted throughout the year are summarized in the model, including baseline reliability, market efficiency, operational performance, transmission owner criteria analyses, and interregional studies. The goal is to identify necessary additions and improvements to the transmission system. The model is also used to ensure the reliable and efficient flow of electricity to the millions of people throughout PJM’s region. A comprehensive analysis of this model ensures that the transmission system upgrades and enhancements are integrated with generation and transmission projects to meet load-serving obligations.
Dominion Energy’s transmission planning team use all three periods of the RTEP model to perform transmission planning analyses so we can maintain transmission reliability, identify issues and provide solutions.
- (2)
- The CETL Model
PJM uses a load-deliverability analysis to measures a system’s import capability under emergency peak load conditions called the Capacity Emergency Transfer Limit (CETL) case, it is a key metric used in PJM’s deliverability testing to ensure the reliability of the electrical grid. It measures the transfer limit, indicating the maximum amount of emergency power that can be reliably transferred from the remainder of PJM in the event of generation deficiency within the study area. To determine the CETL case transfer limit, imports into the study area were incrementally increased. The CETL model limit ensures that the transmission system can supply the necessary energy support during emergencies and helps verify that the import capability required to meet the reliability objective is sufficient.
Using TRACT, we produced results for all the above cases. Then we re-dispatched the non-dispatched base case using TRACE in order to enhance the transfer capability.
Because no utility stands alone, in our analysis we included four neighboring utilities within the Eastern Interconnection: PEPCO, Duke Energy, American Electric Power (AEP) and First Energy (FE) (see Figure 4), where DEV is Dominion Energy.
When we studied the export transfer capability, TRACE became extremely valuable in determining the transmission limits. PJM’s RTEP cases were built to represent realistic conditions and, as a rule, Dominion Energy generally imports power. Although there are numerous real-time instances of Dominion Energy exporting power, there was not a planning model that could reflect that without significant modification. However, it was necessary for the study to know the export capability of the transmission network. It was apparent from the import transfer capability that our lines should be able to carry more power. By using TRACE to re-dispatch the units, we were able to determine more realistic export capabilities under contingencies.
V. Results
Our case results were obtained using TRACT and TRACE. For confidentiality reasons, in this paper we designated the interconnected utilities as A, B, C and D. Figure 5(a) shows Dominion’s import capability using PJM’s 2023 series RTEP for the 2028 summer case. Here, “non-dispatched attribute” refers to the values obtained using the generation of the base case, while “dispatched attribute” refers to the values obtained after re-dispatching the case using TRACE.
Values corresponding to neighboring utilities A, B, C, and D showed the tie-line power flow from them to Dominion at the import transfer limit. Using the re-dispatching tool, FCITC increased from 8047 MW to 10227MW, thereby increasing the FCTTC from 11773 MW to 15092 MW— a 28.2% increase. Figure 5(b) shows the increase in FCITC and FCTTC obtained by TRACE through re-dispatching. The values did not monotonically increase, but they did increase from the base case. After 24 iterations, the re-dispatched case did not converge, indicating that the maximum possible transfer limits were reached. For time comparison, a single manual iteration took an average of 18 minutes while an iteration in TRACE took 1 minute 45 seconds, a significant time savings of ~90%.
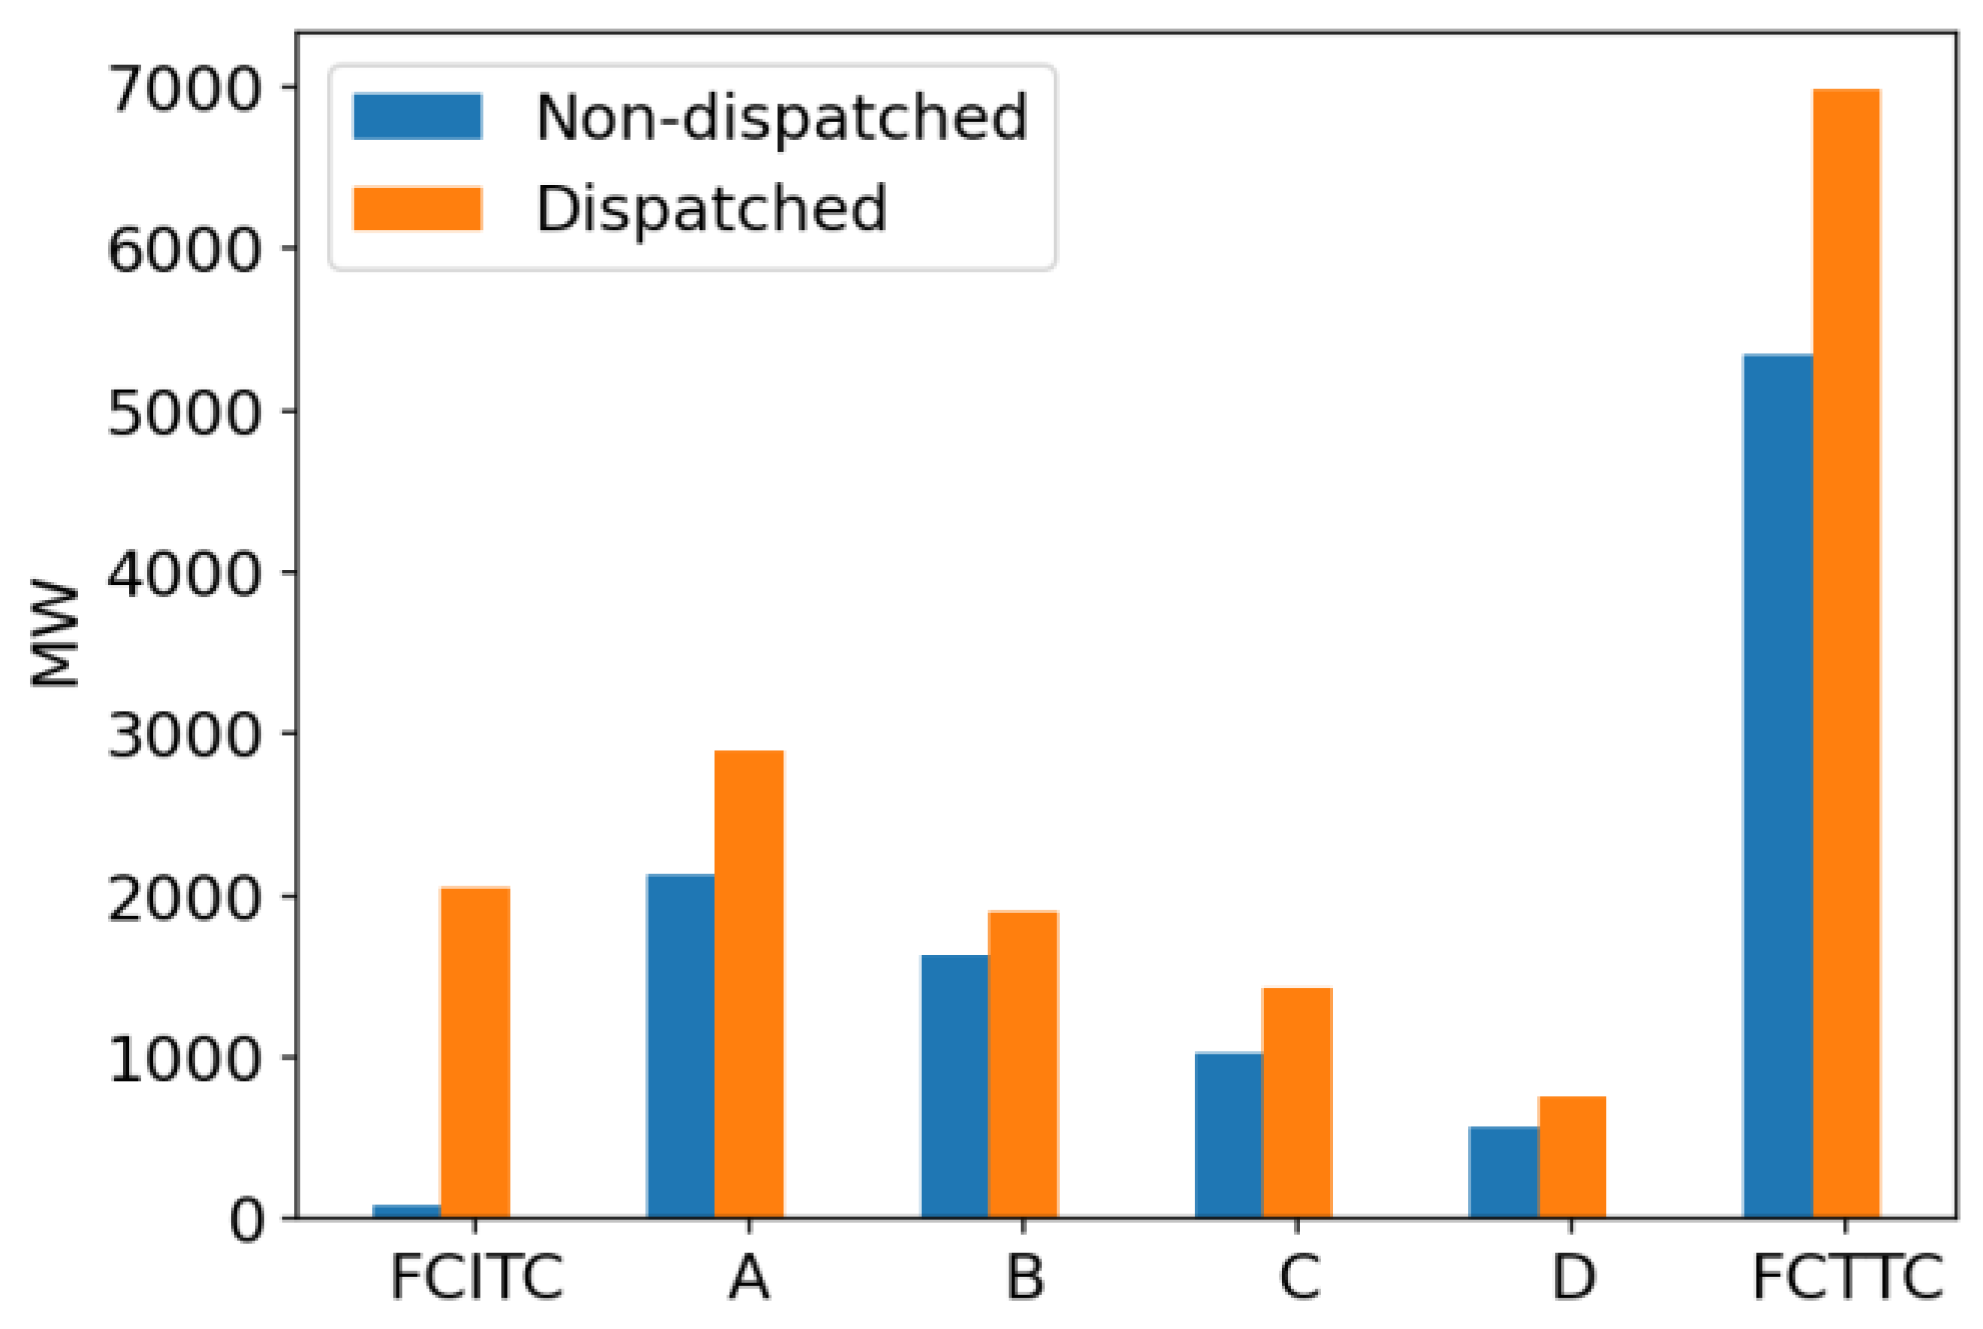
Similarly, Figure 6 and Figure 7 show the import capability results for PJM’s 2023 series RTEP 2028 case for winter and light load condition respectively. The dispatched cases generally had higher import transfer limits than non-dispatched cases at each tie-line. In the winter case, total FCTTC increased by 40.6%, while in the light load case FCTTC increased by 27.4 %. The result shows that generation re-dispatch within Dominion Energy can have a big impact on its import capability with neighboring utilities.
Figure 8, Figure 9 and Figure 10 show Dominion’s export capability results for all three 2023 series RTEP 2028 cases. Dispatched cases generally had higher export transfer limits than non-dispatched cases. Total FCTTC transfer limits increased by 64% for the summer case, 63% for the winter case, and 69.3% for the light load condition.
Figure 11 shows the transfer limits result for the CETL case which assessed Dominion’s import capability during a peak load emergency condition. In the dispatched case, total transfer capability increased by 29.2%. The result shows that generation re-dispatch in the CETL case also had a big impact on import capability and TRACE helped find 30% more enhanced transfer capability compared to CETL base case.
VI. Conclusions and Future Work
This paper discussed an automation toolset developed to study the transfer capability of interconnected electric systems. Such studies help assess the reliability and resource adequacy of the grid; they are also an important component of the Integrated Resource Plan (IRP). Python and pyPowerGEM were used to develop both the TRACT tool that determines transfer capability and the TRACE tool that finds increased transfer limits through iterative re-dispatching. The tools were tested using a variety of real cases.
Using the toolset significantly reduced task time by ~90% compared to manual iteration. The automated process also has a minimal number of steps, unlike the manual process, which is complex, repetitive, and highly prone to human error. Another advantage is the GUI interface that allows users who are not TARA experts to run the calculations.
This toolset can have several robust applications in the future. For example, future work could include deploying this tool on servers, making it accessible to many more people with more powerful computing power. It allows the company to ask “what-if” questions with little burden on the engineers. With this tool, it may be possible to see how delays could impact the system across various years of construction and how changes in topology will impact the import capability over the years to come. The toolset can also be leveraged as a model to automate other TARA applications.
References
- “Meeting Future Energy Needs.” Dominion Energy, cdn-dominionenergy-prd-001.azureedge.net/-/media/pdfs/global/company/2023-va-integrated-resource-plan.pdf.
- Poudyal, A. , Lamichhane, S., Wertz, C., Mahmud, S.U., and Dubey, A., "Hurricane and Storm Surges-Induced Power System Vulnerabilities and their Socioeconomic Impact," 2024 IEEE Power & Energy Society General Meeting (PESGM), Seattle, WA, USA, 2024, pp. 1-5.
- Mohammed, Olatunji Obalowu, et al. "Available transfer capability calculation methods: A comprehensive review." International Transactions on Electrical Energy Systems 29.6 (2019): e2846.
- Rep, N. “Available transfer capability definitions and determinations,” North American Electric Reliability Council (NERC), 1996.
- Interregional Transfer Capability Study (ITCS). www.nerc.com/pa/RAPA/Pages/ITCS.aspx.
- National Transmission Needs Study. (n.d.). Energy.gov. https://www.energy.gov/gdo/national-transmission-needs-study.
- “News Releases and Headlines.” Federal Energy Regulatory Commission, Explainer on the Transmission Planning and Cost Allocation Final Rule | Federal Energy Regulatory Commission ferc.gov).
- Khairuddin, AB; Khalifa, OO; Alhammi, AI; Larik, RM. “Deterministic approach available transfer capability (ATC) calculation methods.
- Ejebe GC, Waight JG, Sanots-Nieto M, Tinney WF. Fast calculation of linear available transfer capability. IEEE Trans Power Syst. 2000, 15, 1112–1116. [CrossRef]
- “Region Transmission Planning Process”, PJM, https://www.pjm.com/-/media/documents/manuals/m14b.ashx.
Figure 1.
Illustrating linear transfer limit analysis.
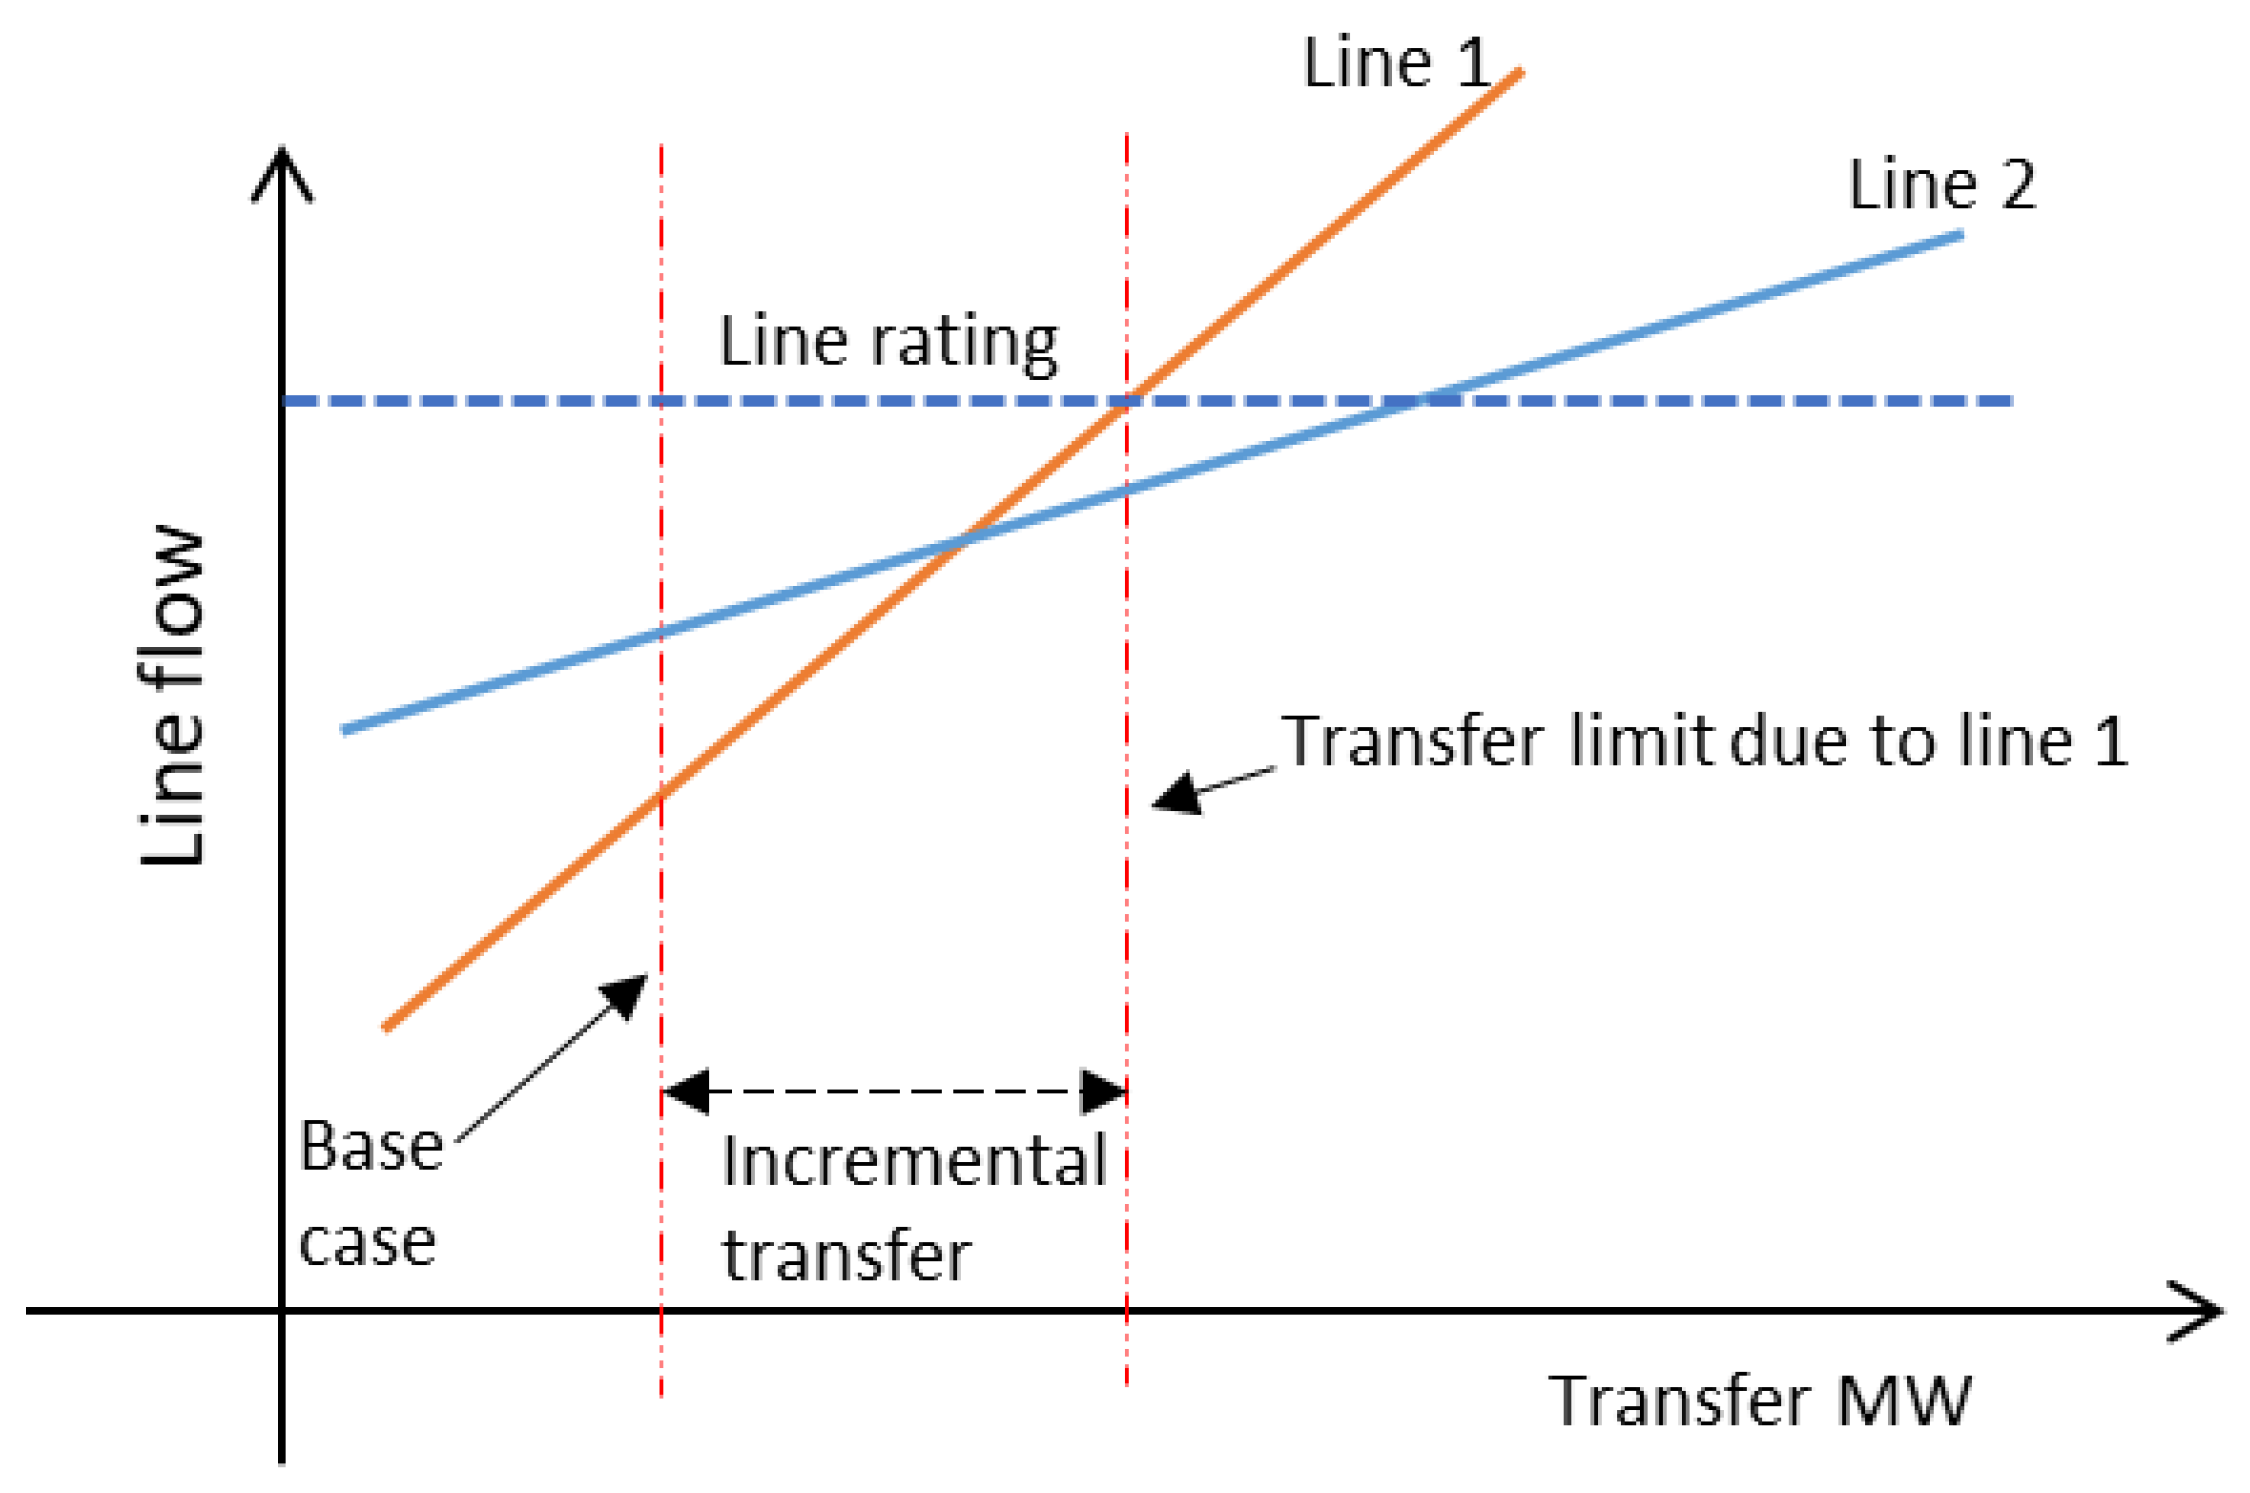
Figure 2.
Flow chart for TRACT.
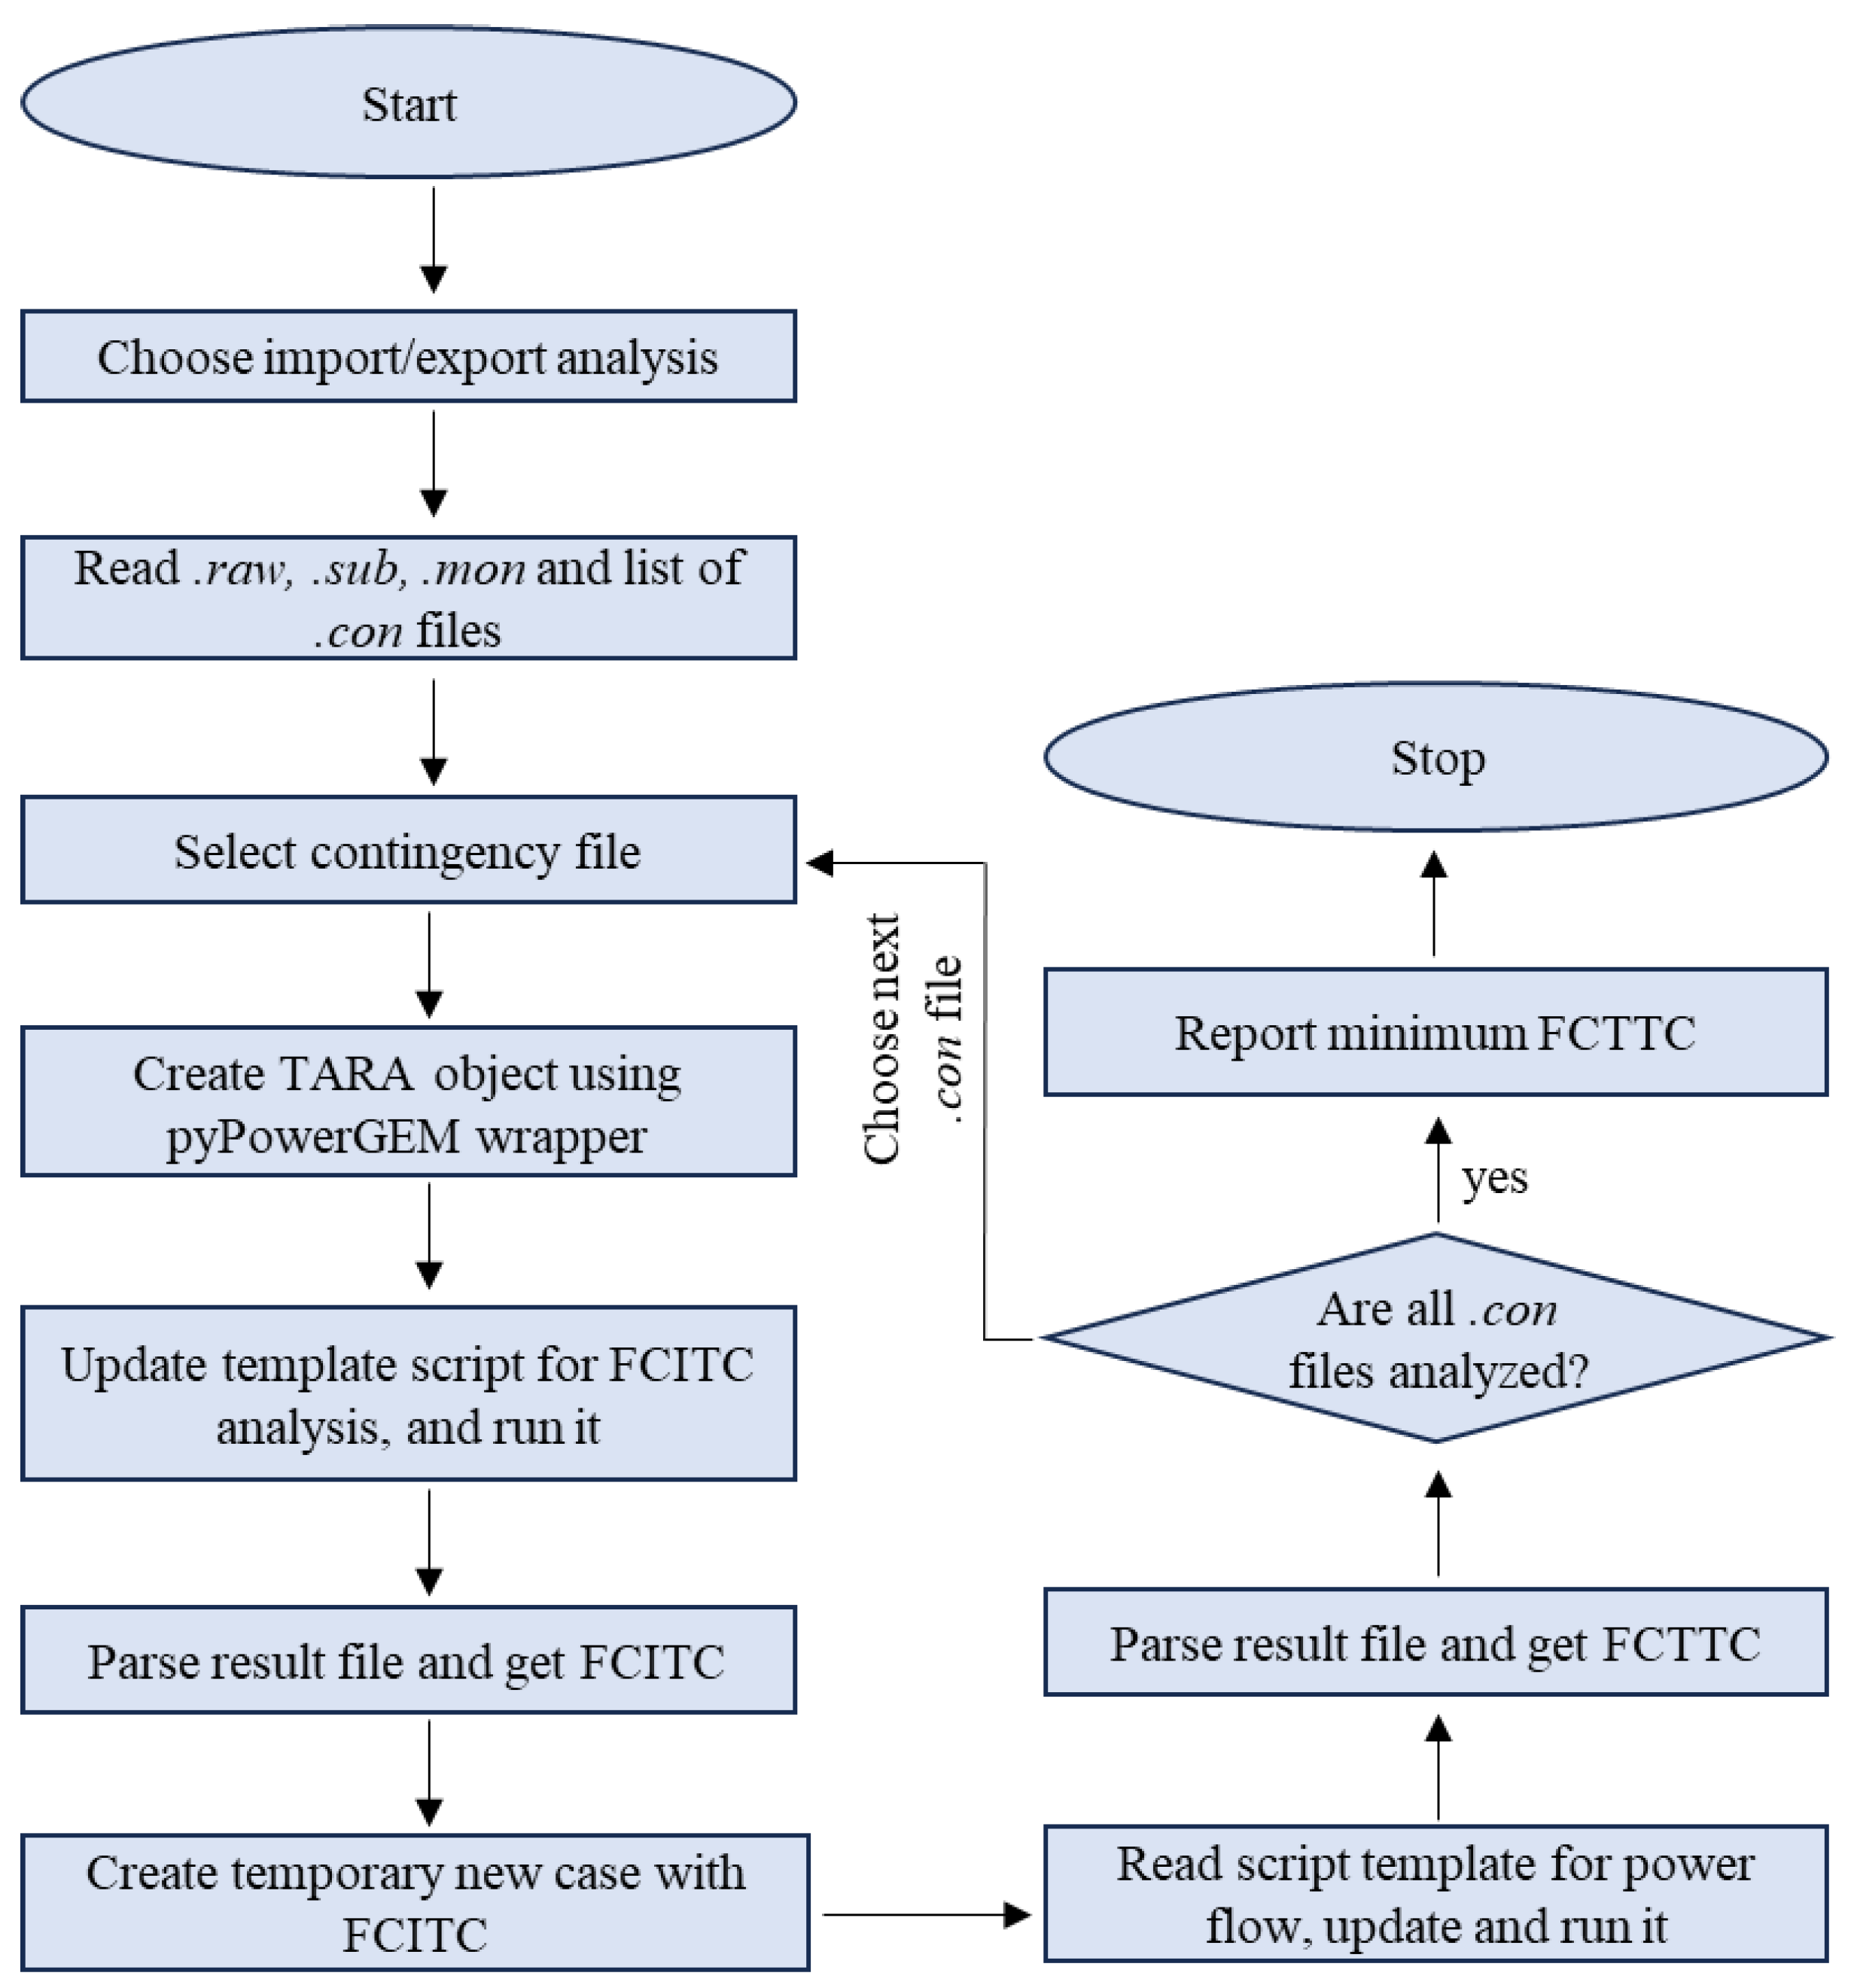
Figure 3.
Flow chart for TRACE.
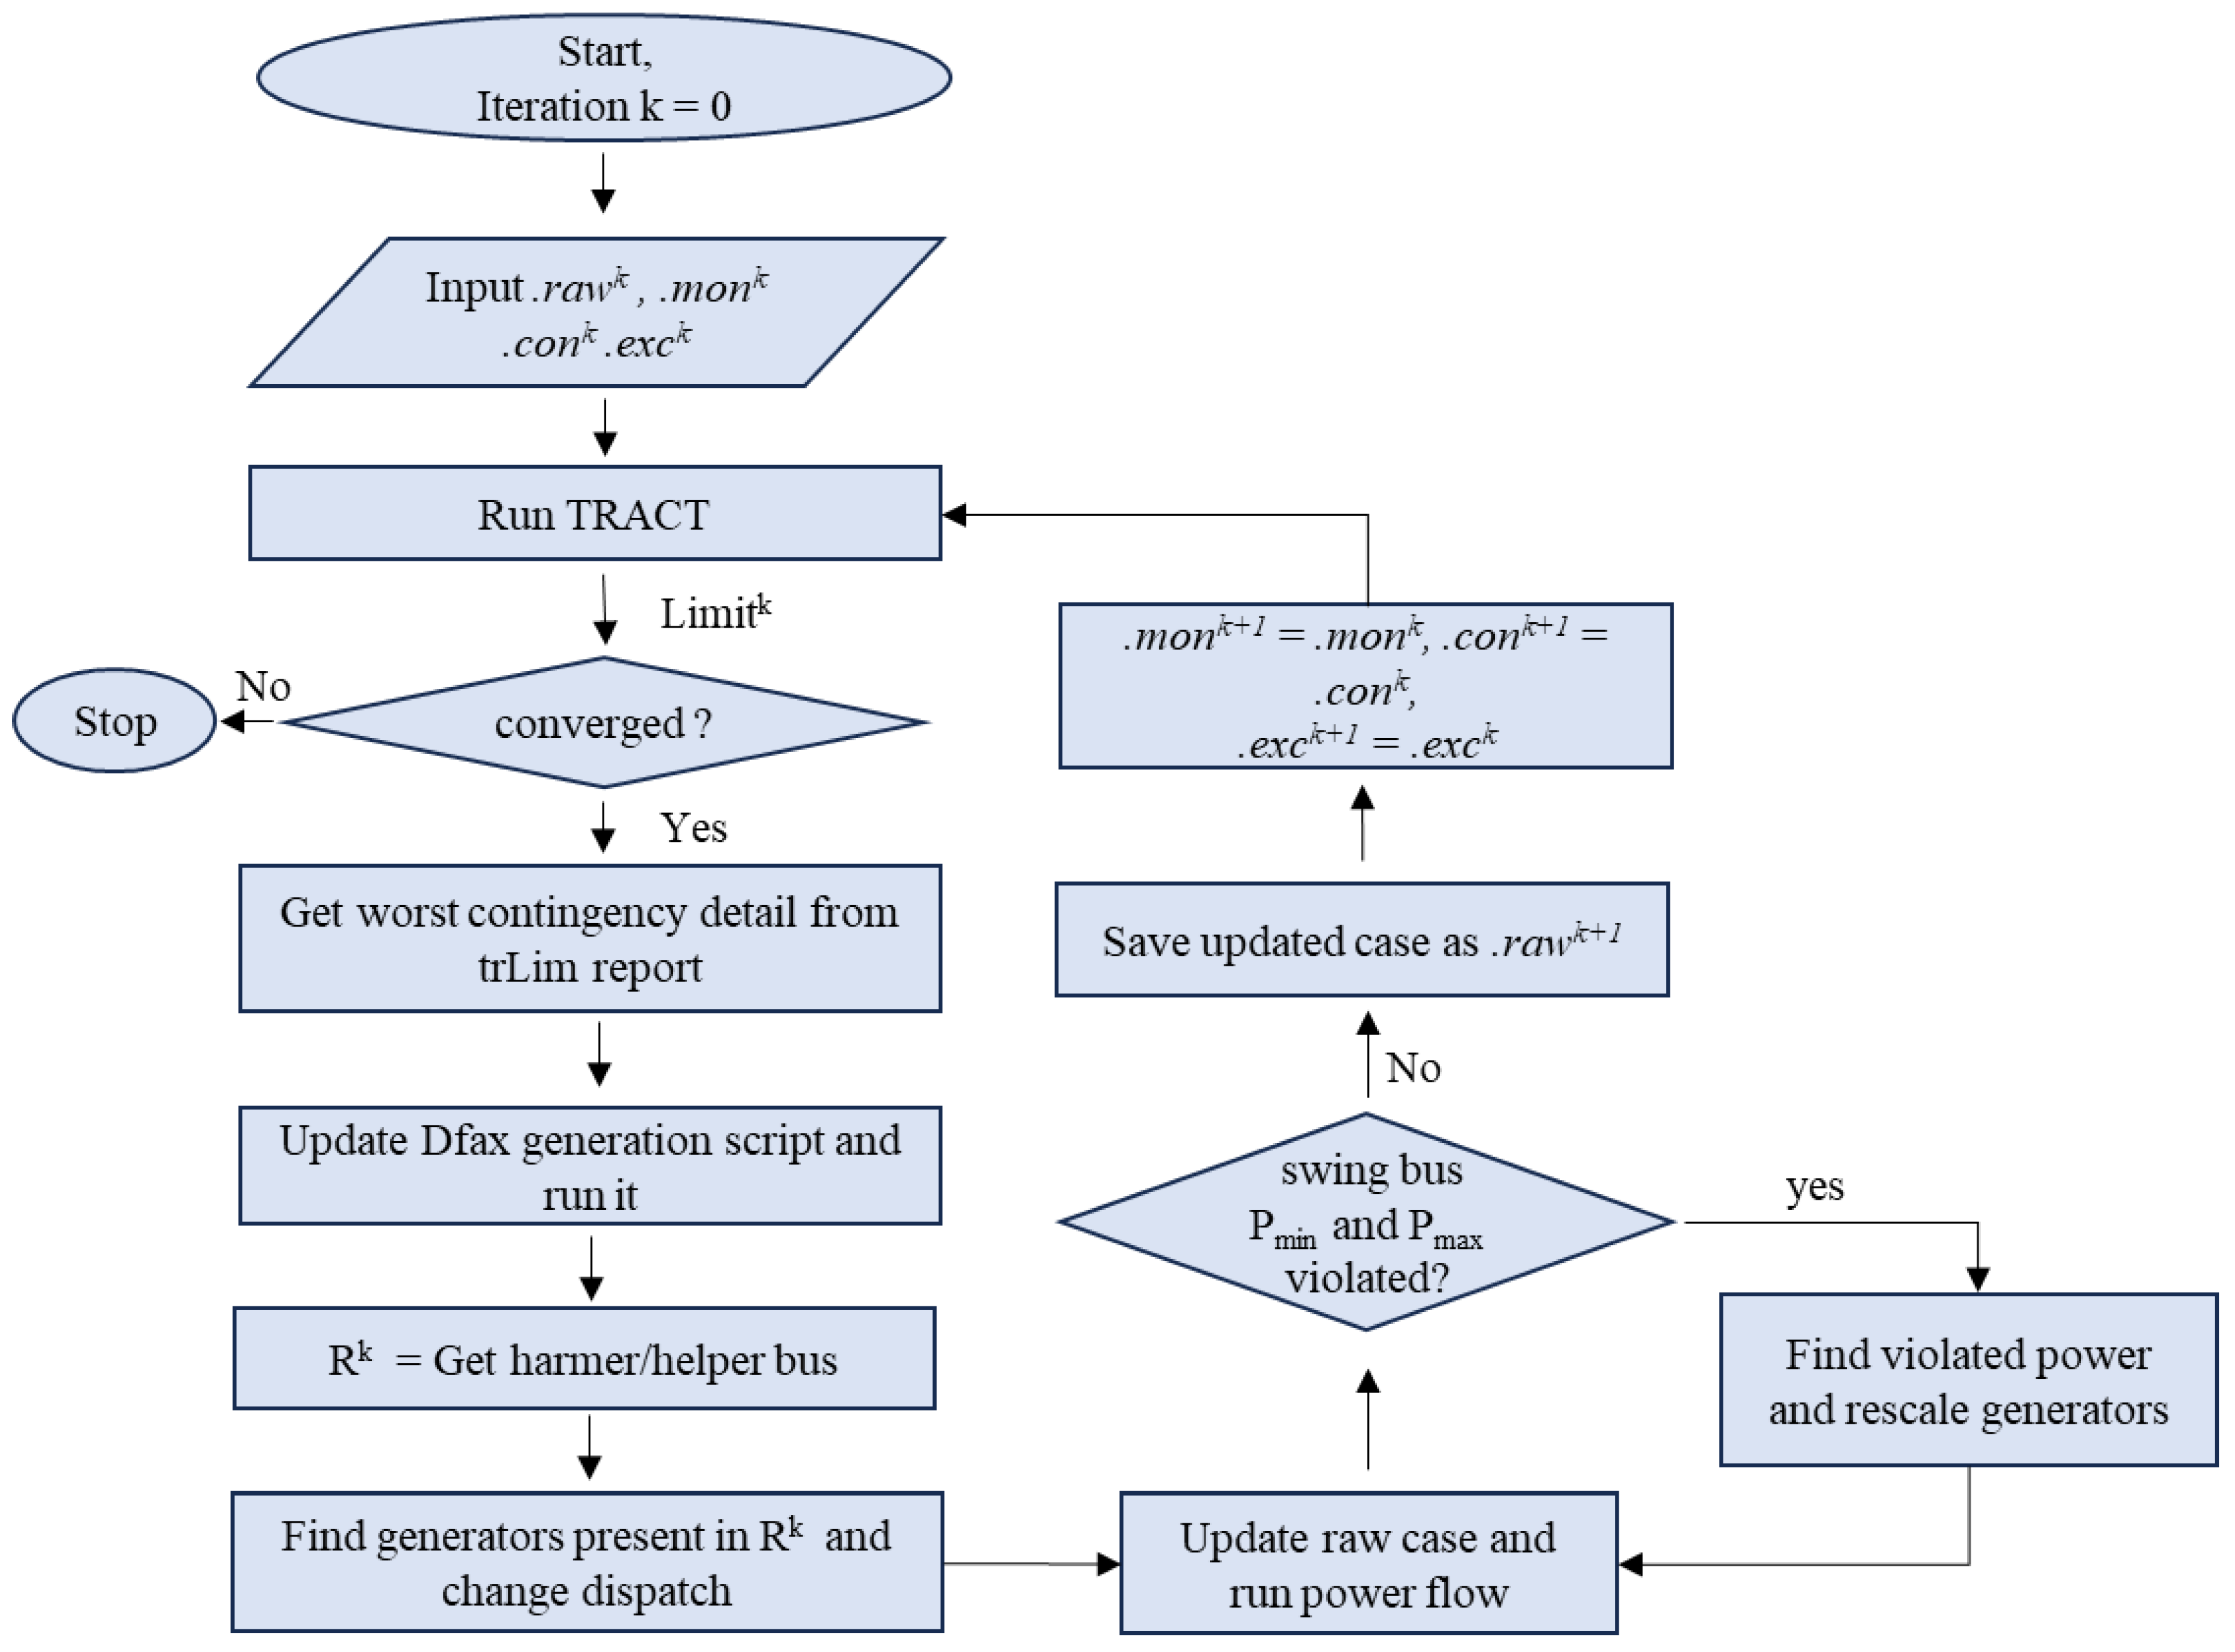
Figure 4.
Utilities interconnected with Dominion.
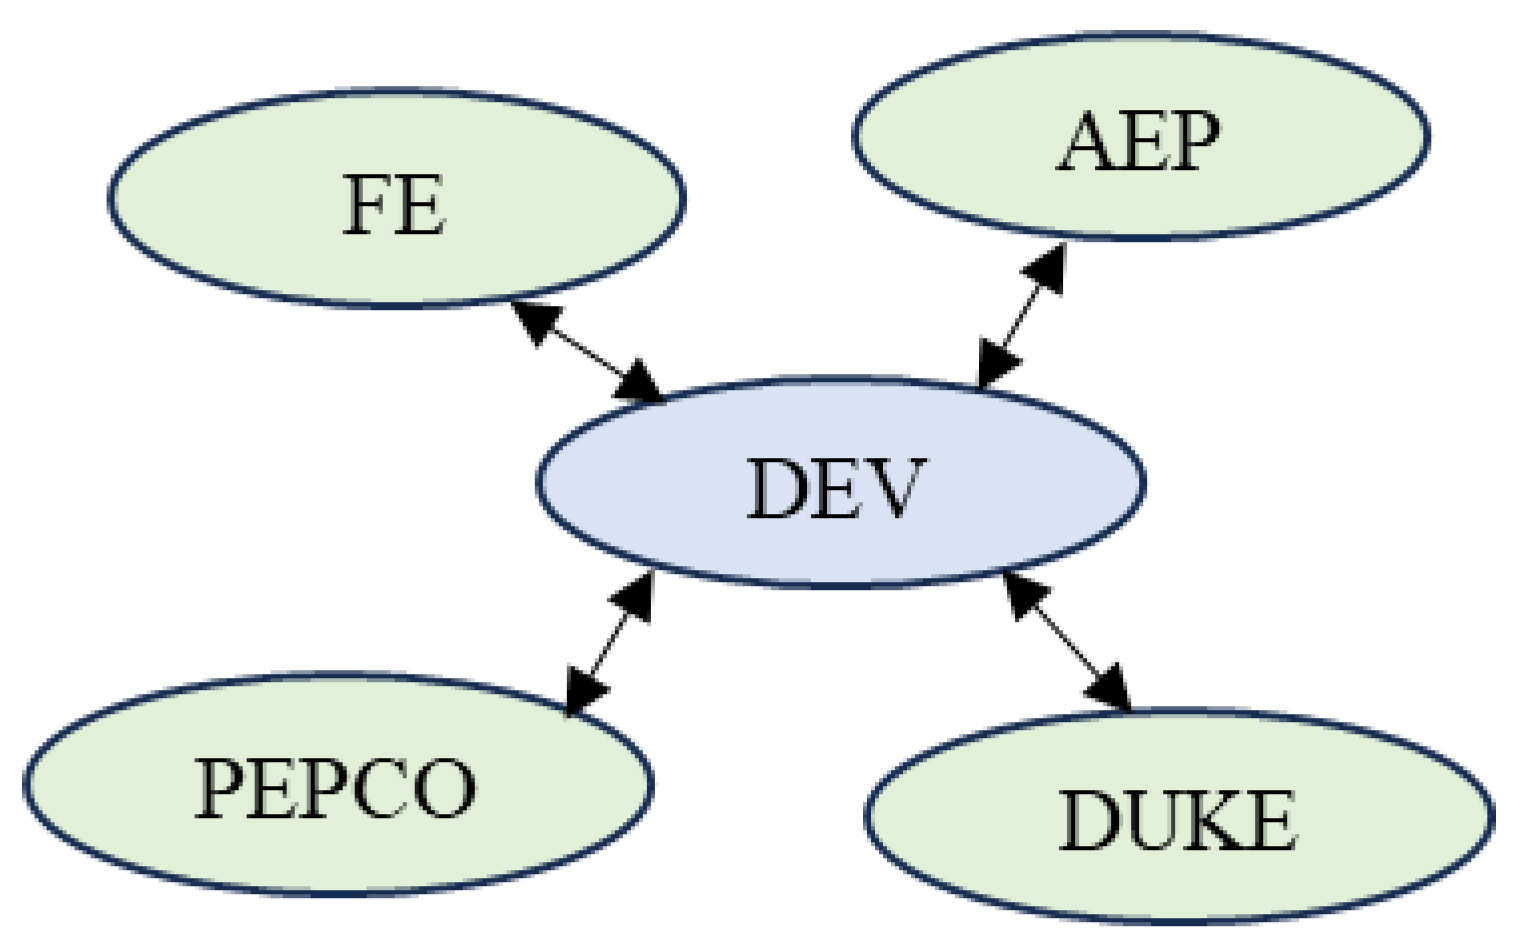
Figure 5.
(a) Import capability with PJM’s 2023 series RTEP 2028 summer. (b) Progression of FCITC and FCTTC obtained using TRACT.
Figure 5.
(a) Import capability with PJM’s 2023 series RTEP 2028 summer. (b) Progression of FCITC and FCTTC obtained using TRACT.
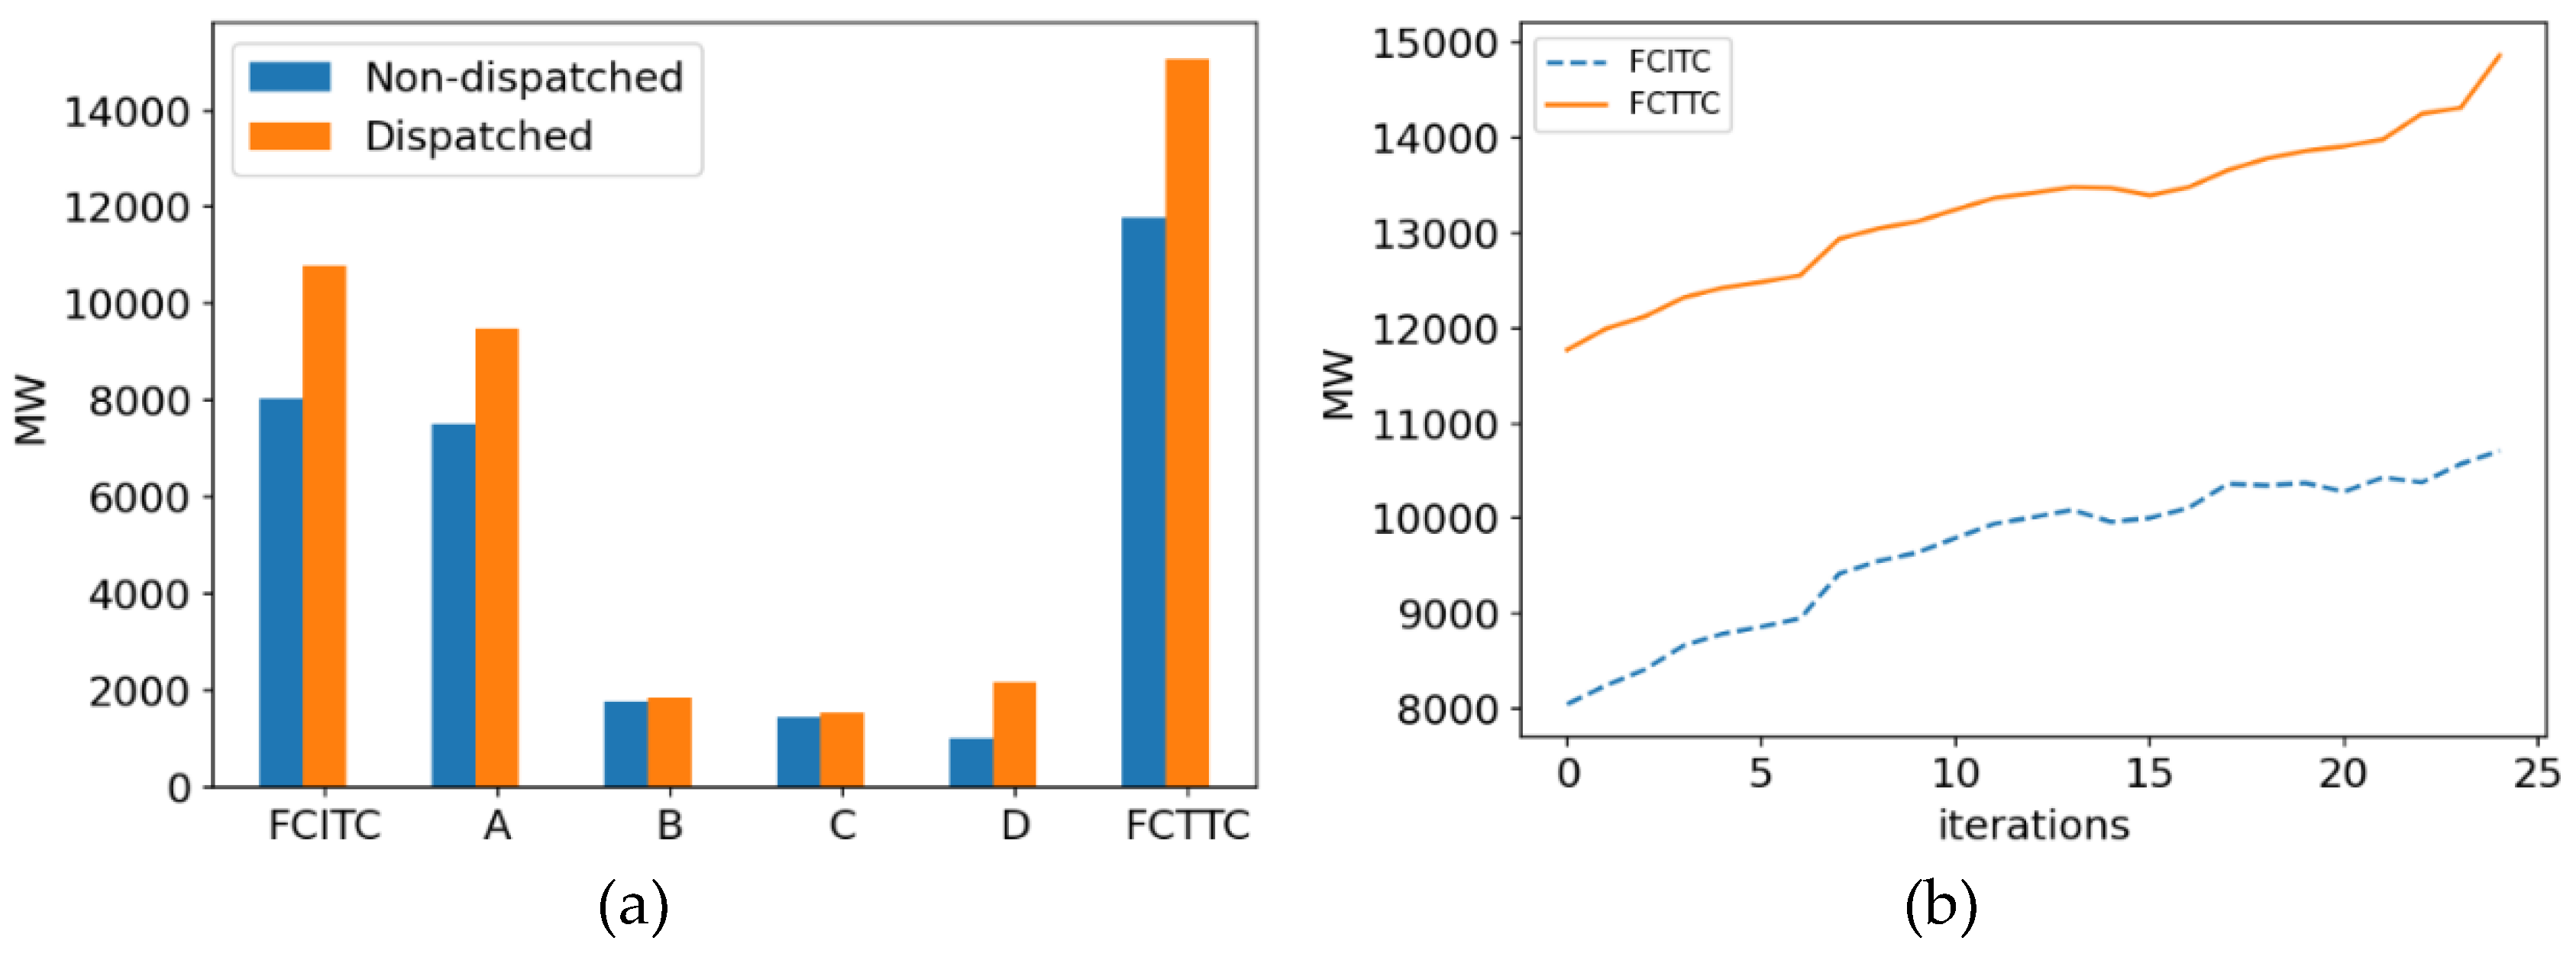
Figure 6.
Import capability with 2023 series RTEP 2028 winter.
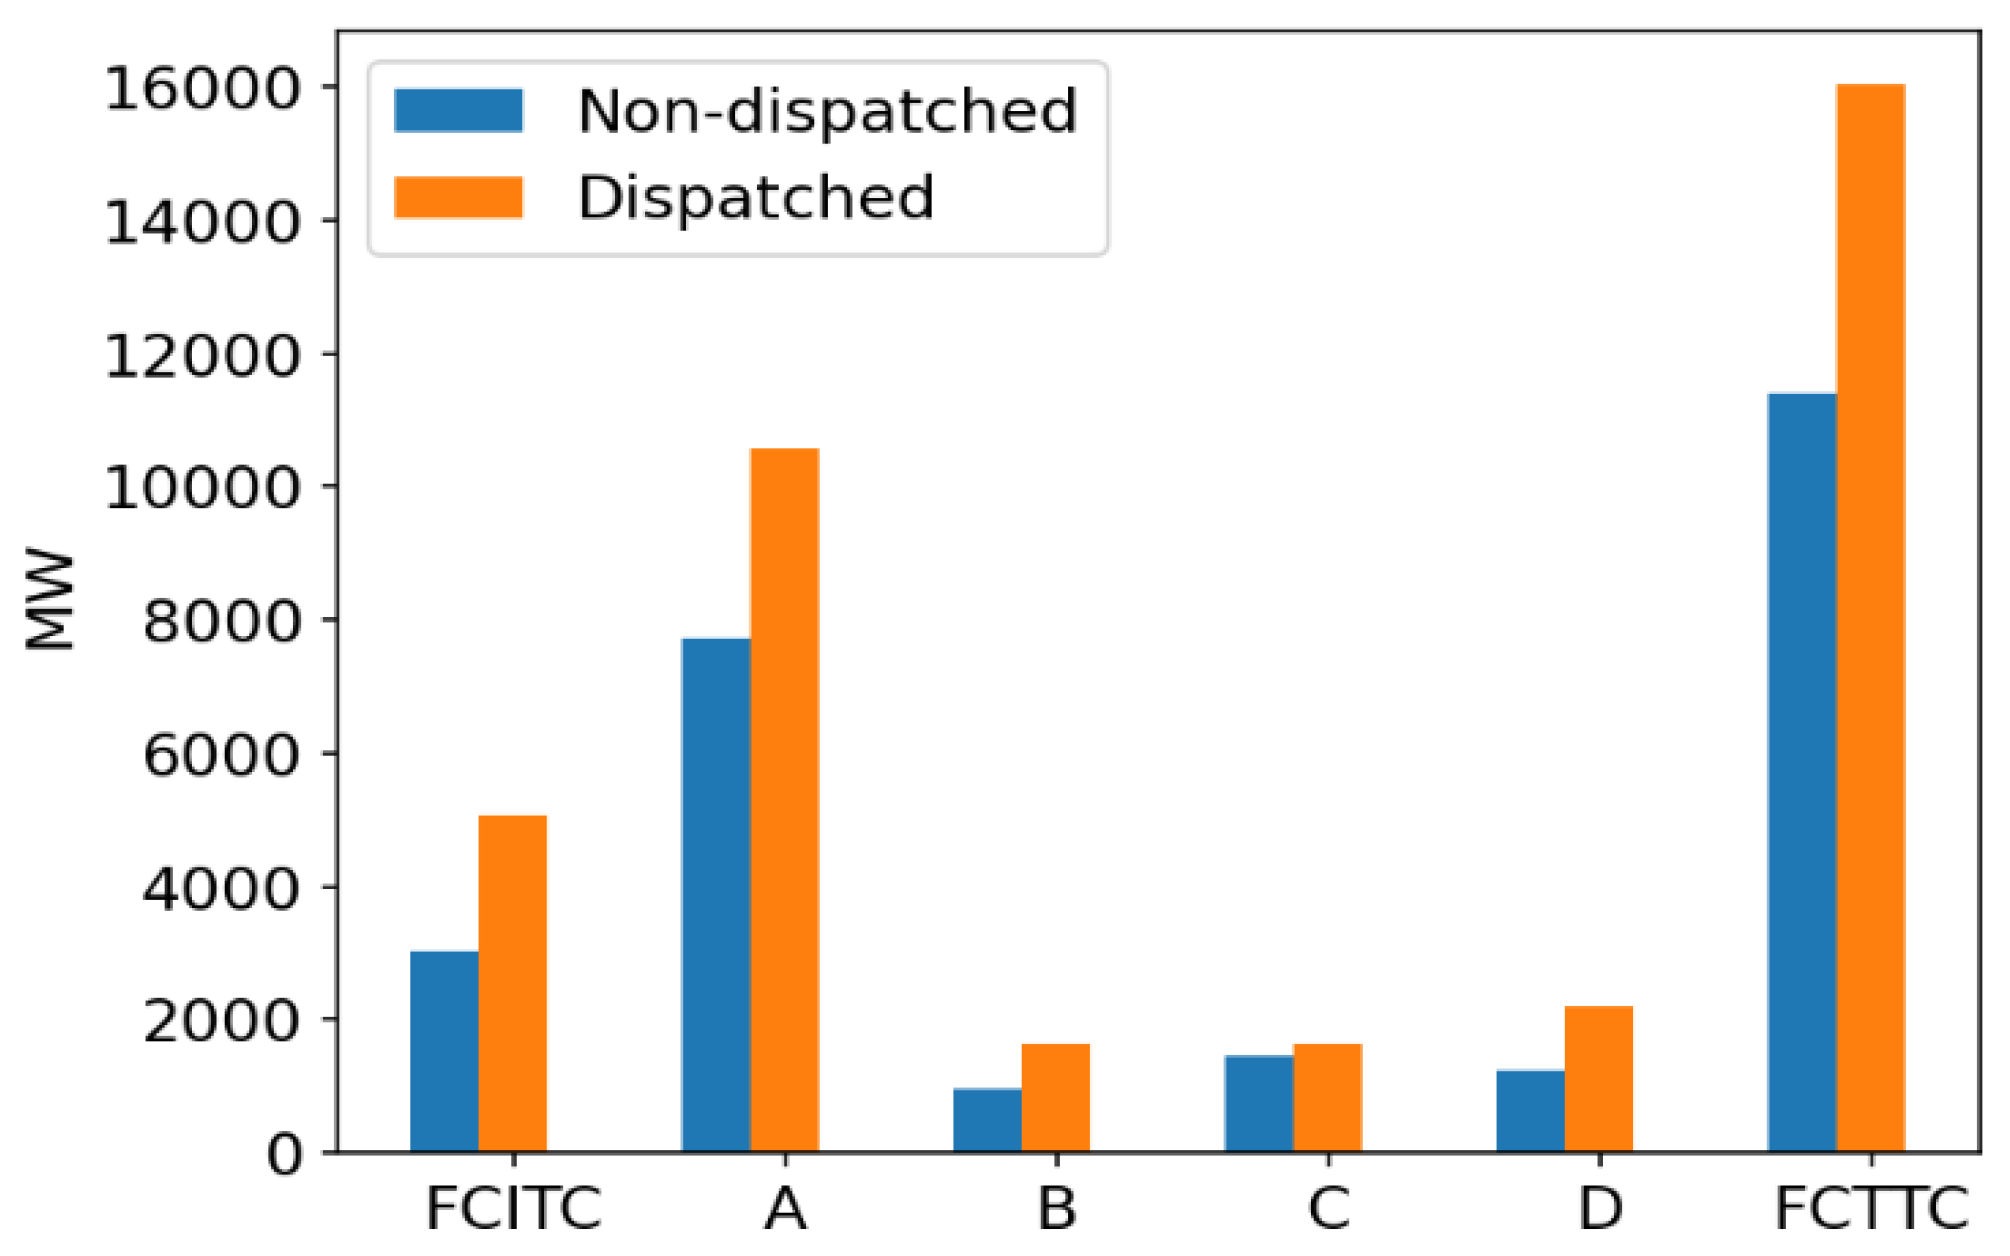
Figure 7.
Import capability with 2023 series RTEP 2028 light load.
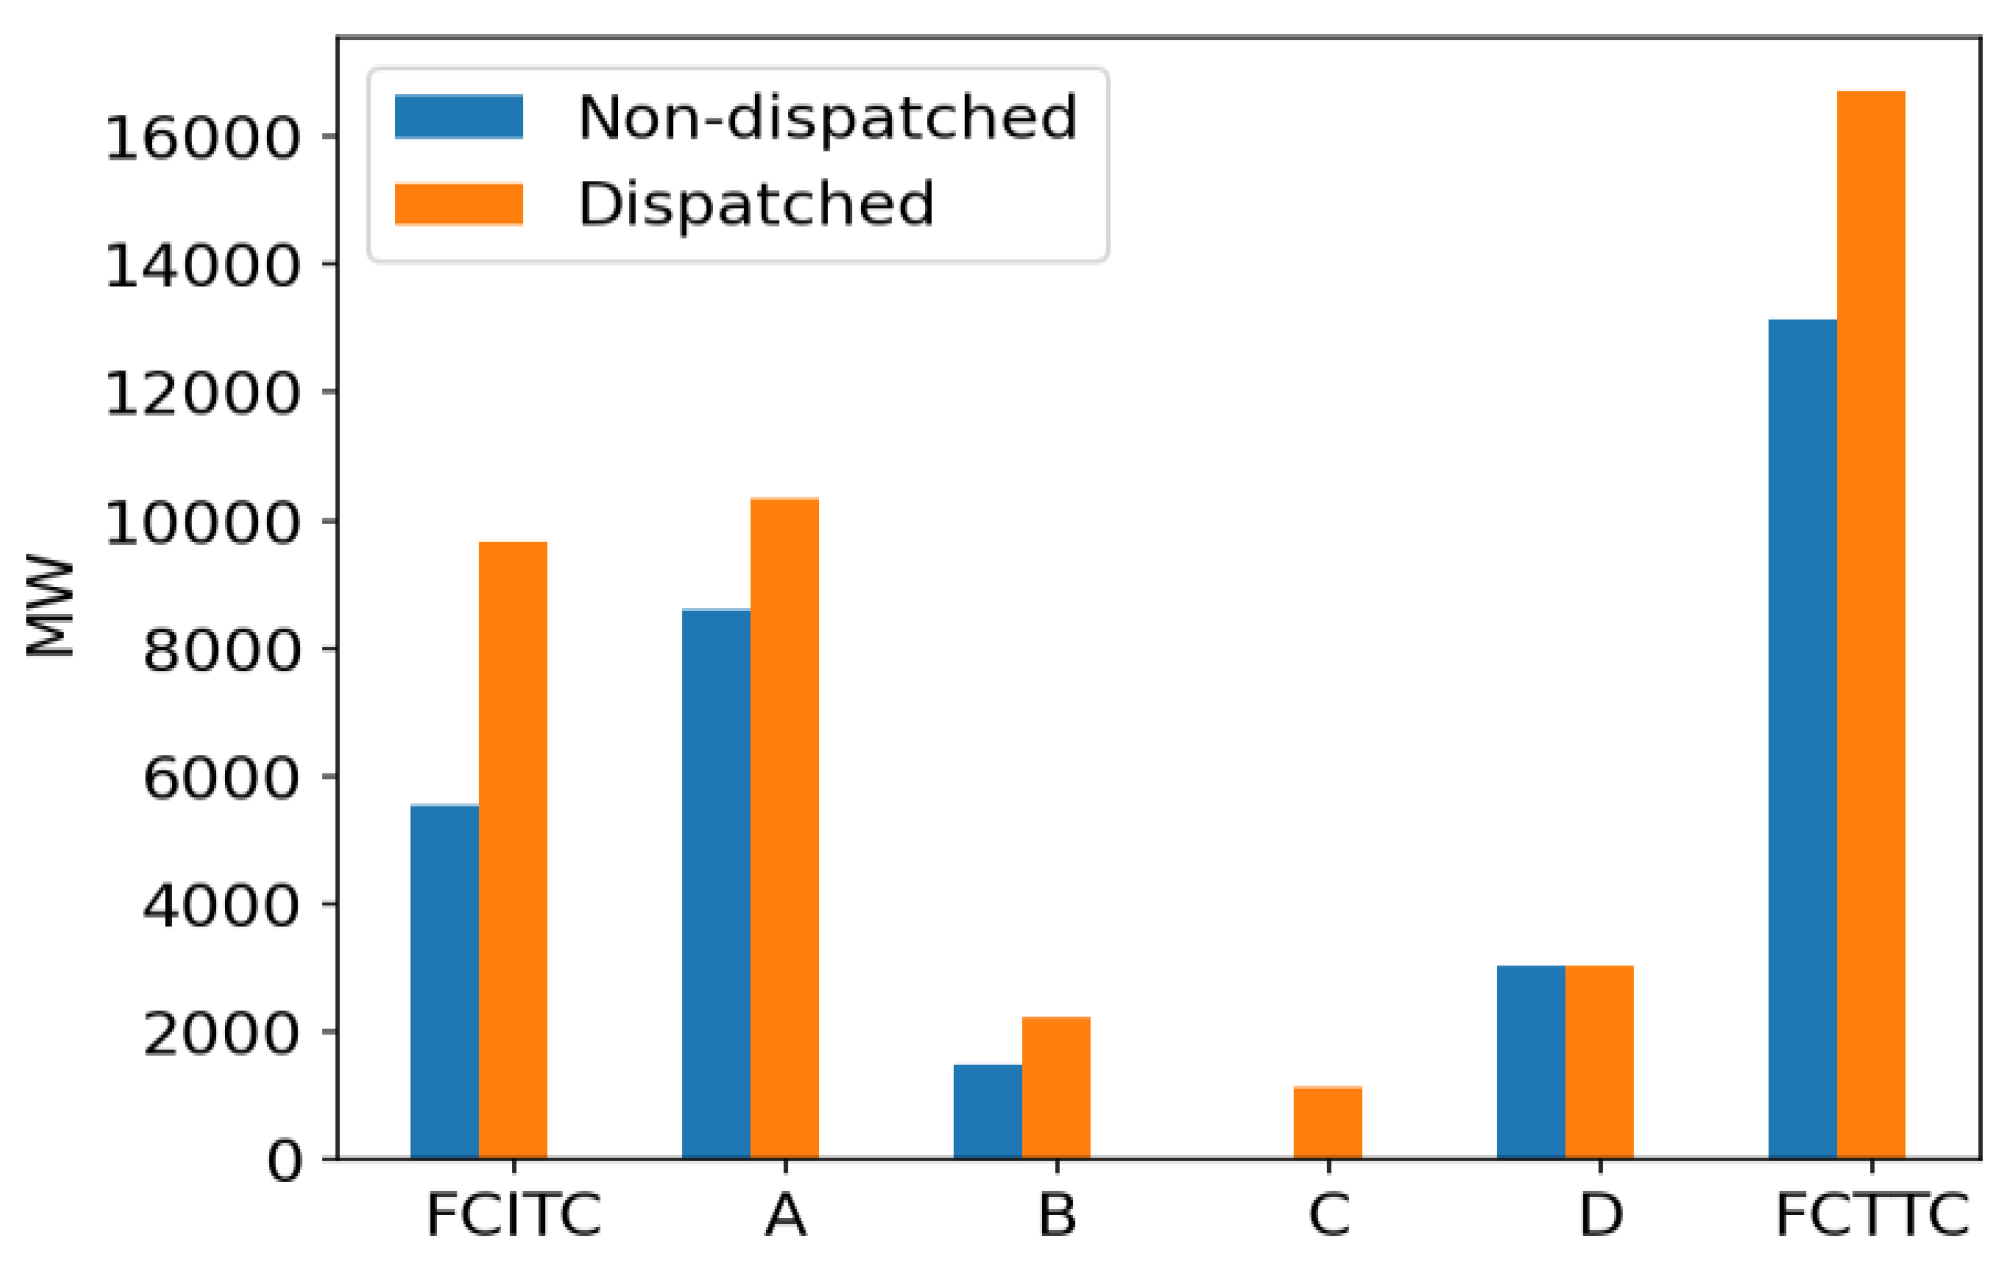
Figure 8.
Export capability with 2023 series RTEP 2028 summer.
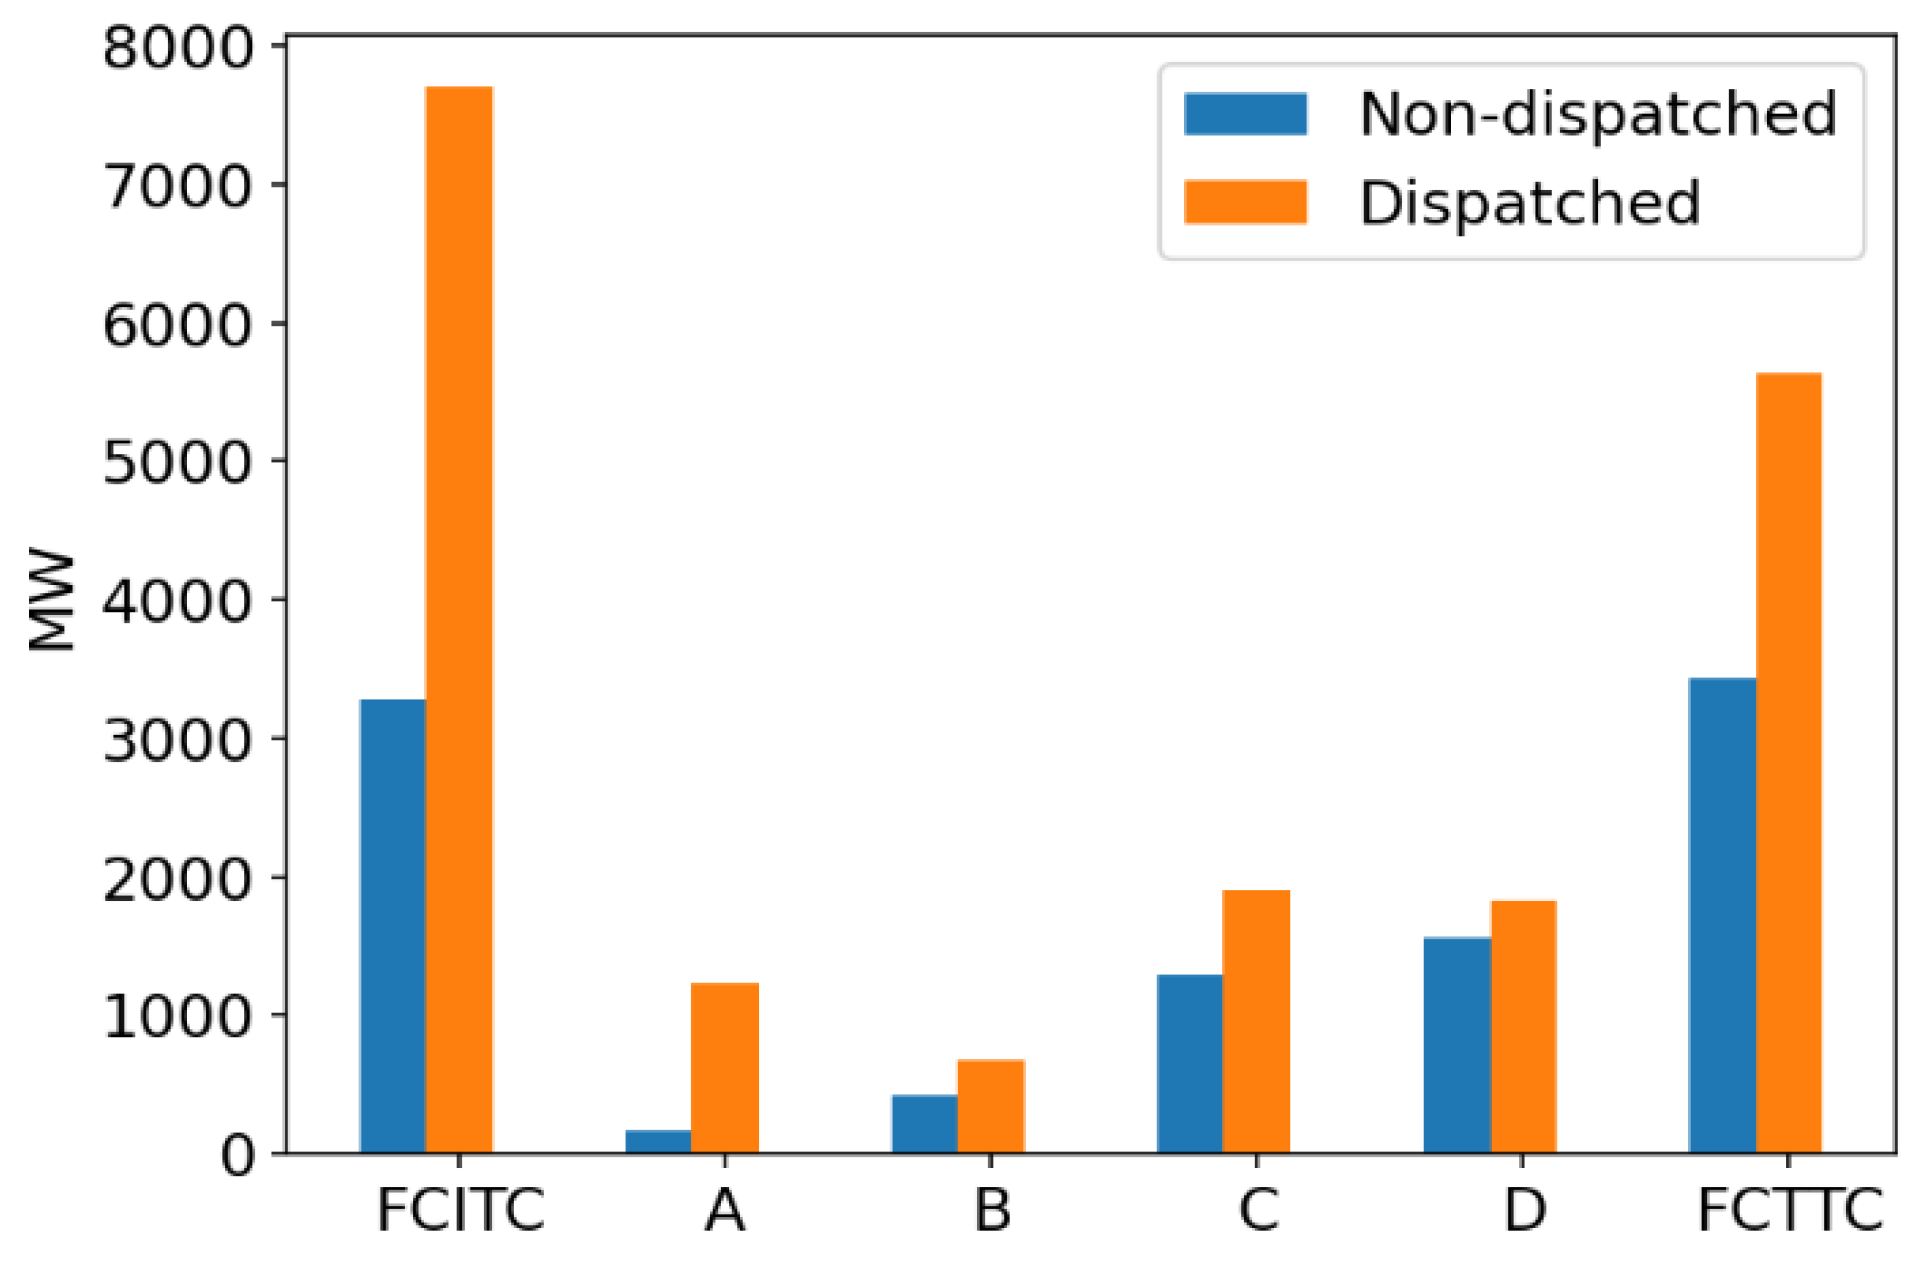
Figure 9.
Export capability with 2023 series RTEP 2028 winter.
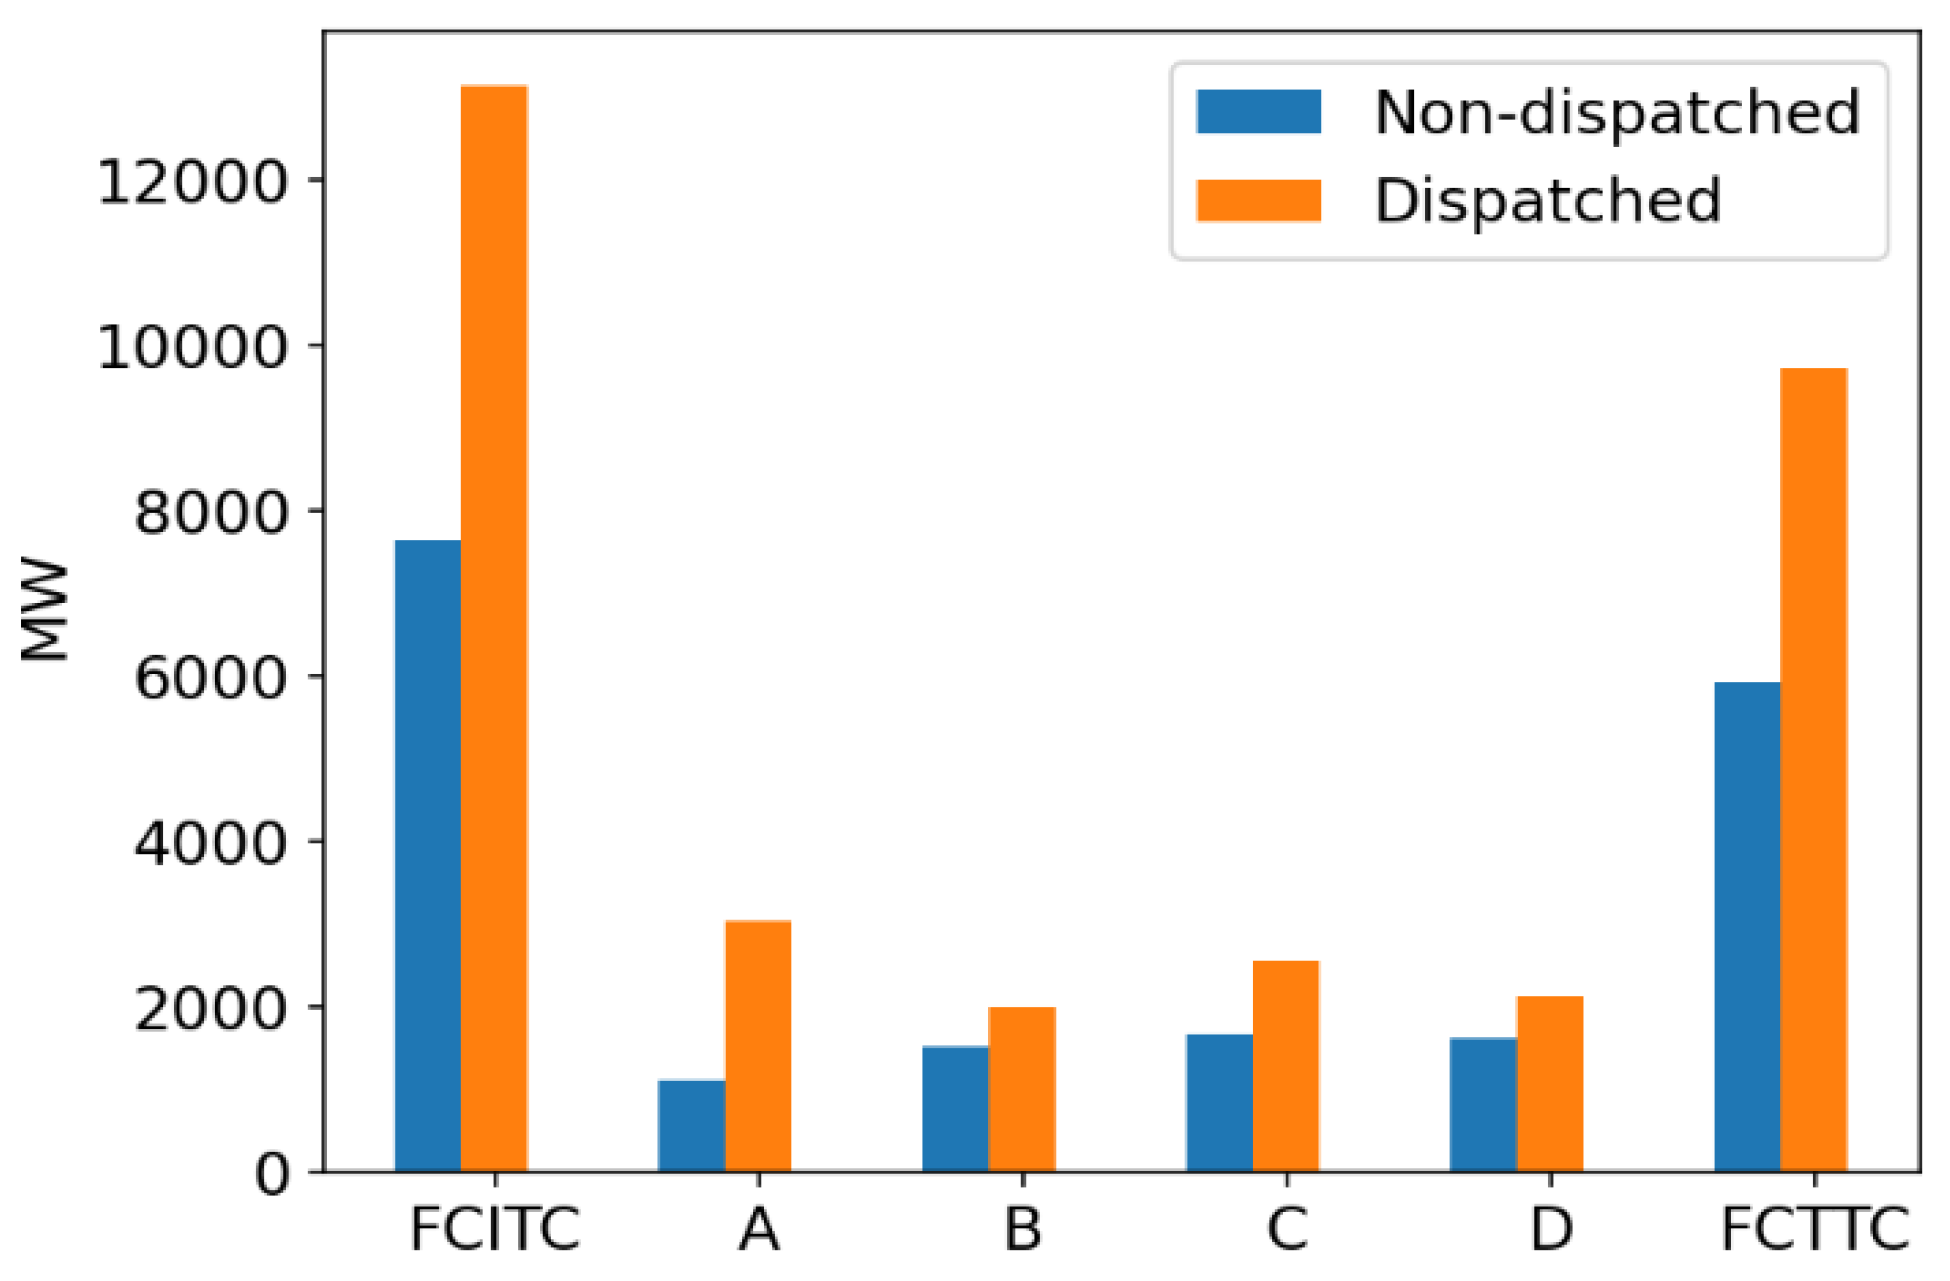
Figure 10.
Export capability with 2023 series RTEP 2028 light load.
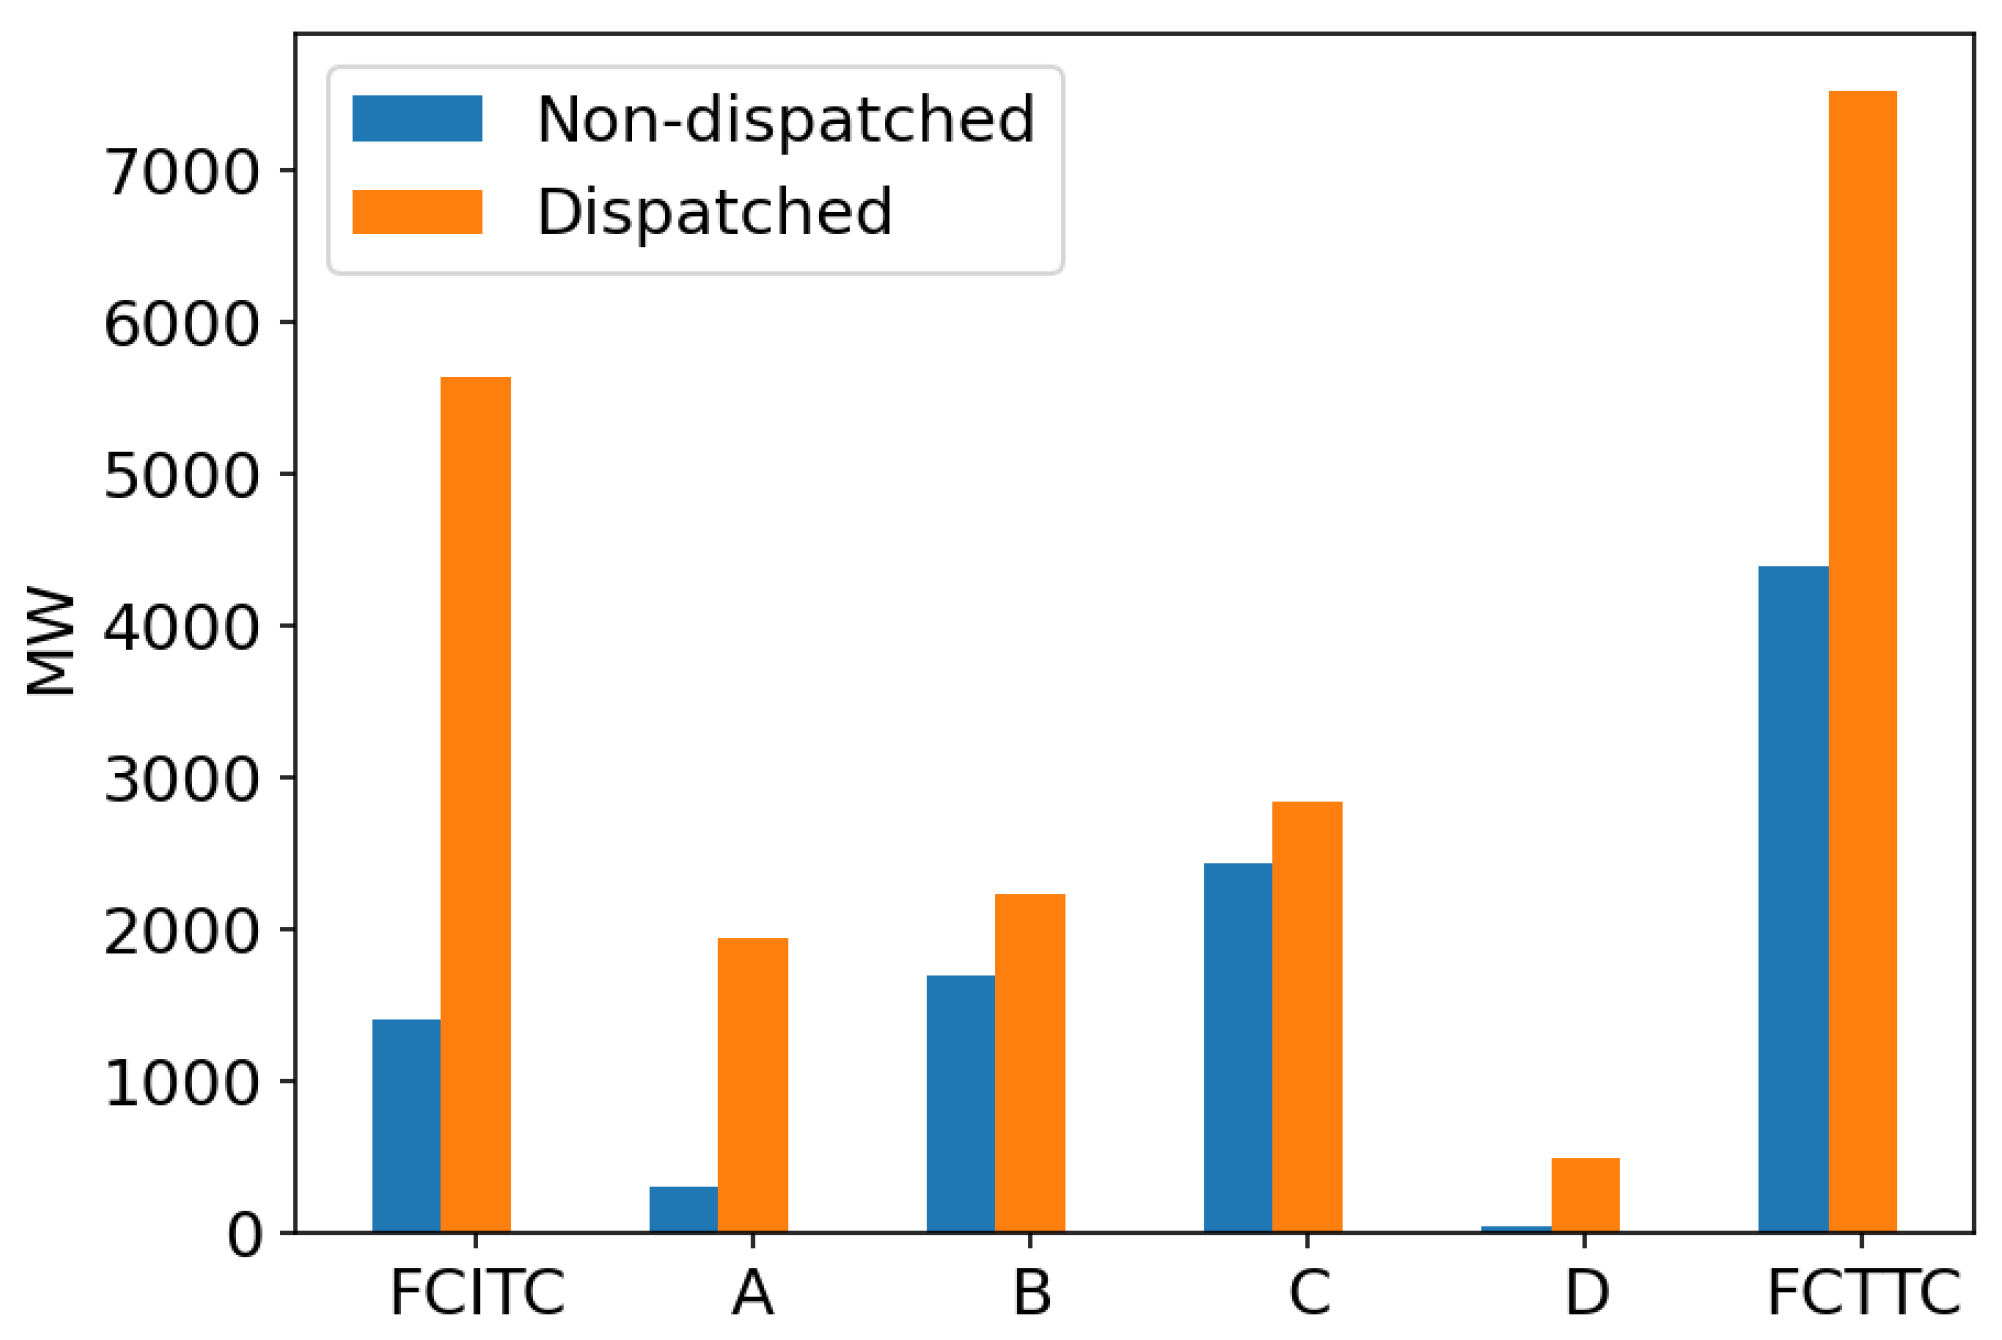
Figure 11.
Import capability with CETL 2025/2026.
Disclaimer/Publisher’s Note: The statements, opinions and data contained in all publications are solely those of the individual author(s) and contributor(s) and not of MDPI and/or the editor(s). MDPI and/or the editor(s) disclaim responsibility for any injury to people or property resulting from any ideas, methods, instructions or products referred to in the content. |
© 2024 by the authors. Licensee MDPI, Basel, Switzerland. This article is an open access article distributed under the terms and conditions of the Creative Commons Attribution (CC BY) license (http://creativecommons.org/licenses/by/4.0/).
Copyright: This open access article is published under a Creative Commons CC BY 4.0 license, which permit the free download, distribution, and reuse, provided that the author and preprint are cited in any reuse.


