Submitted:
06 December 2024
Posted:
06 December 2024
You are already at the latest version
Abstract
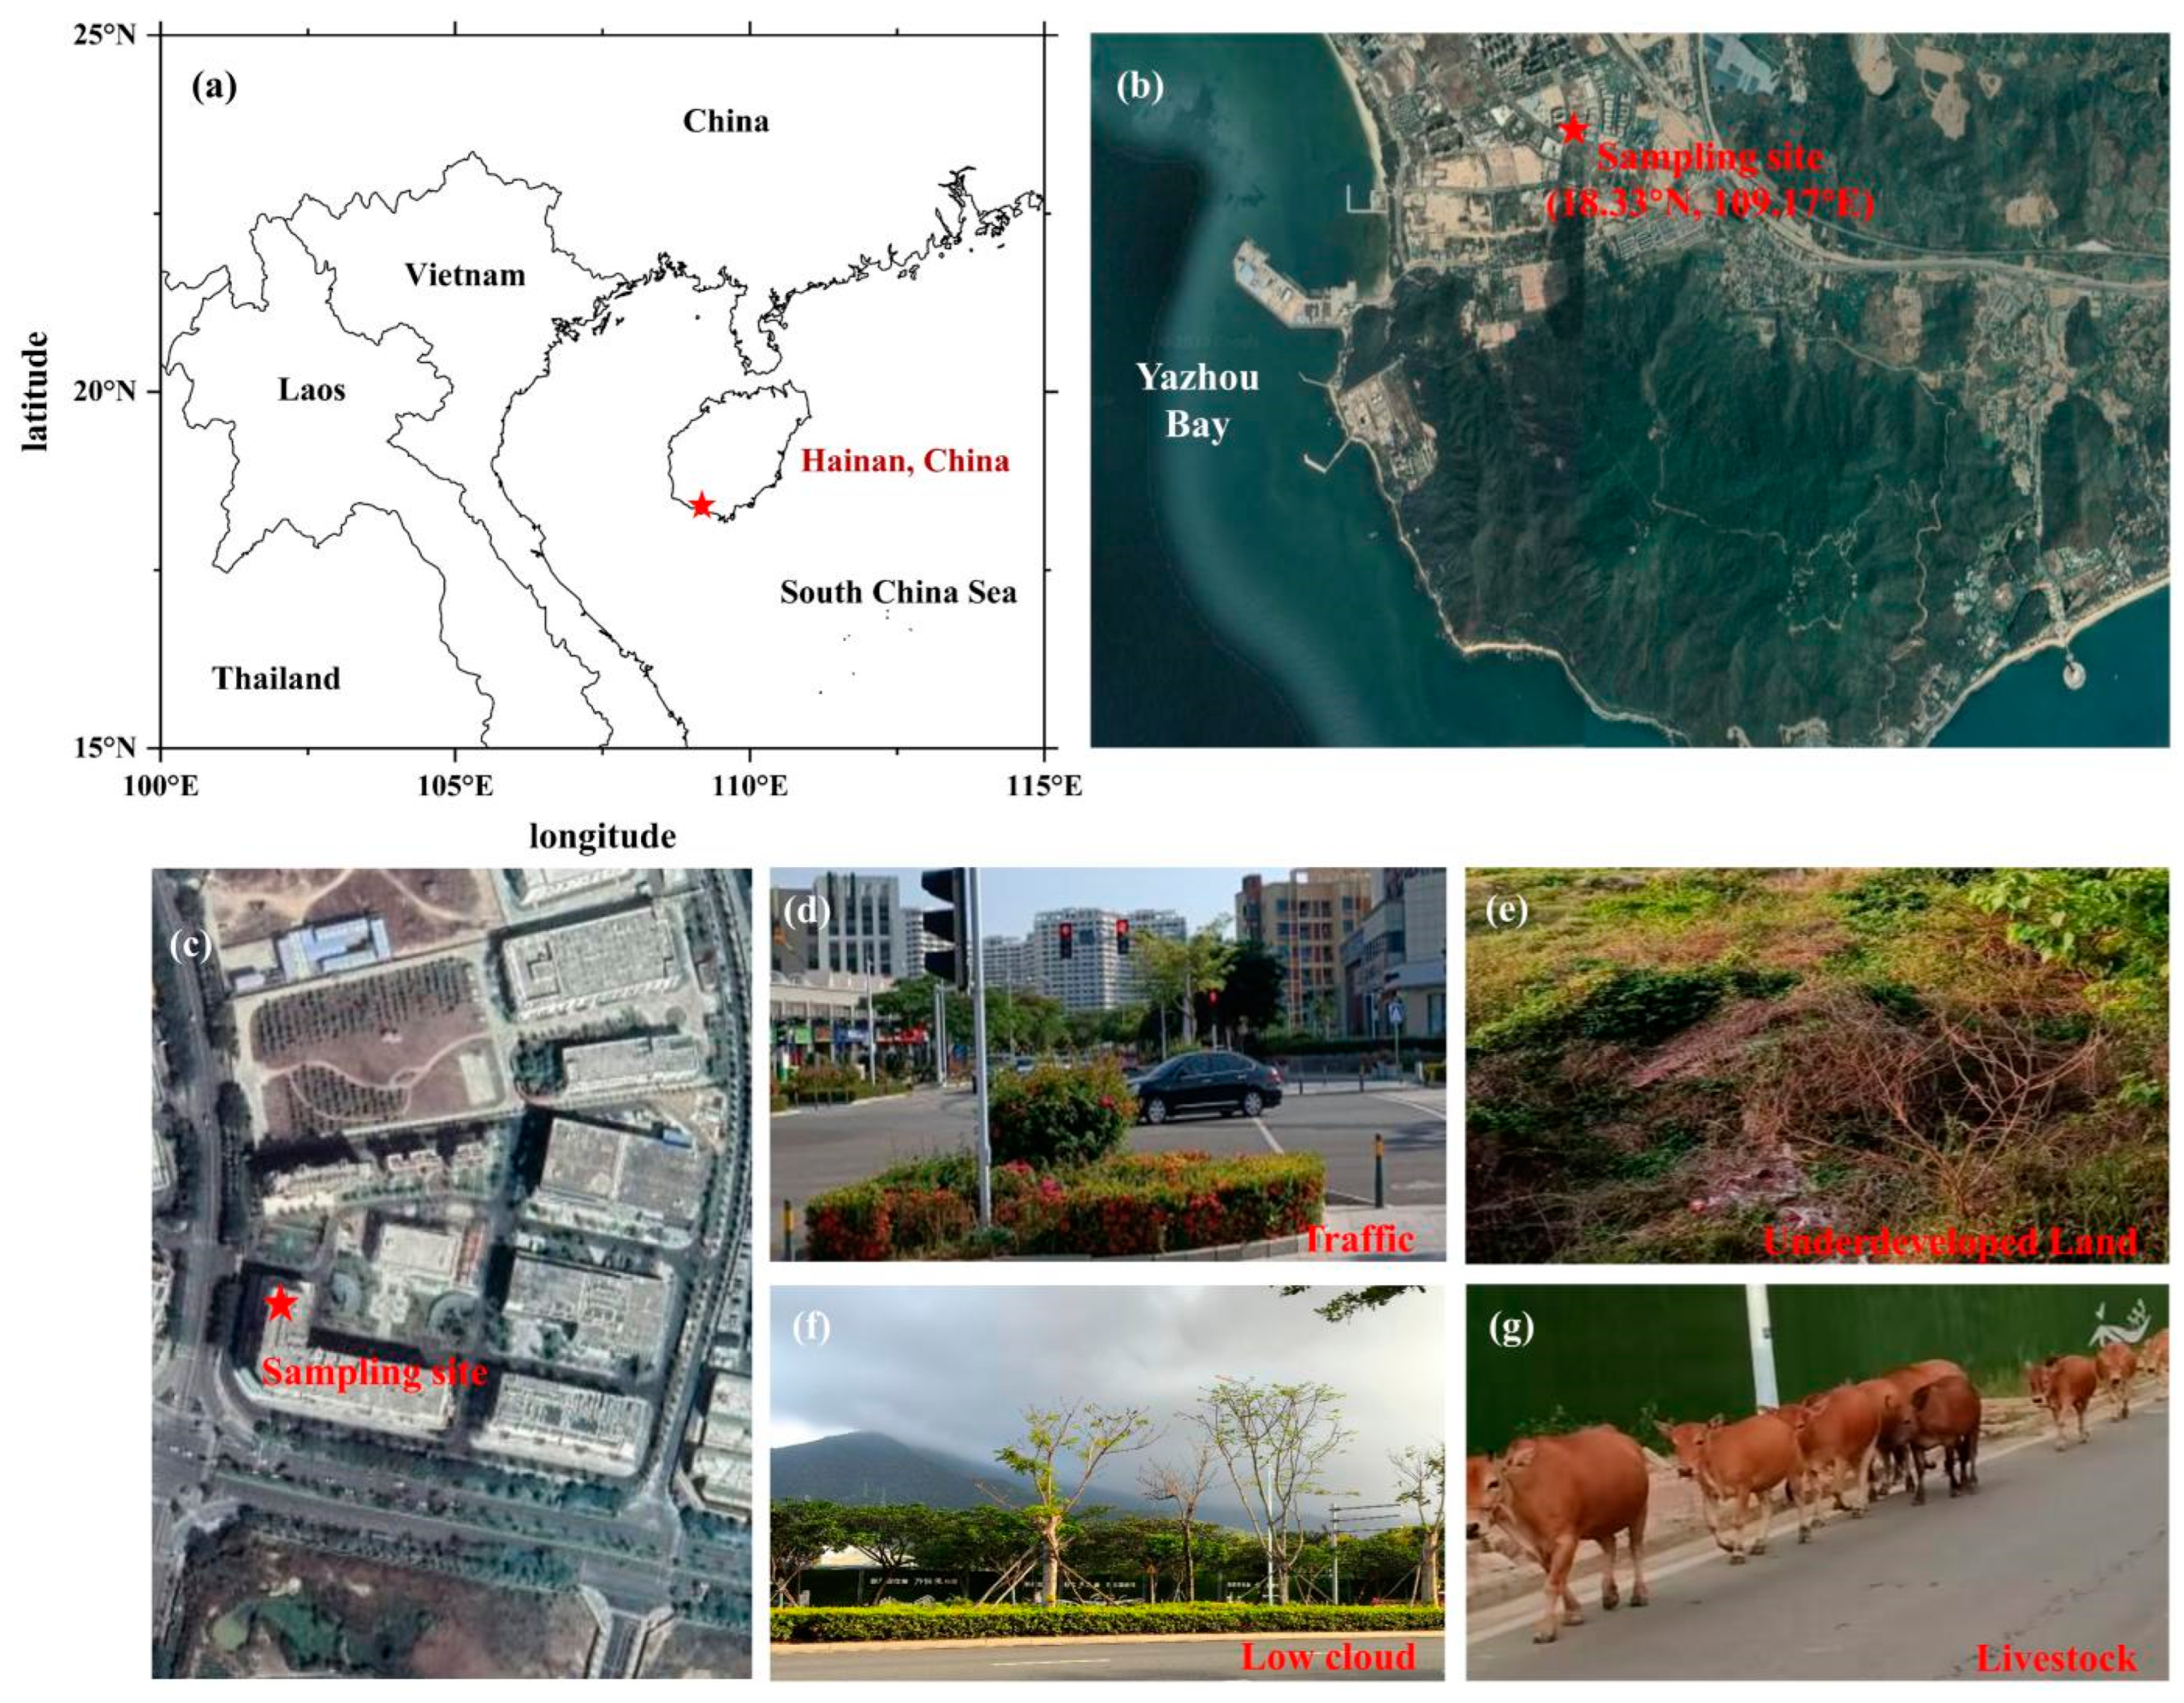
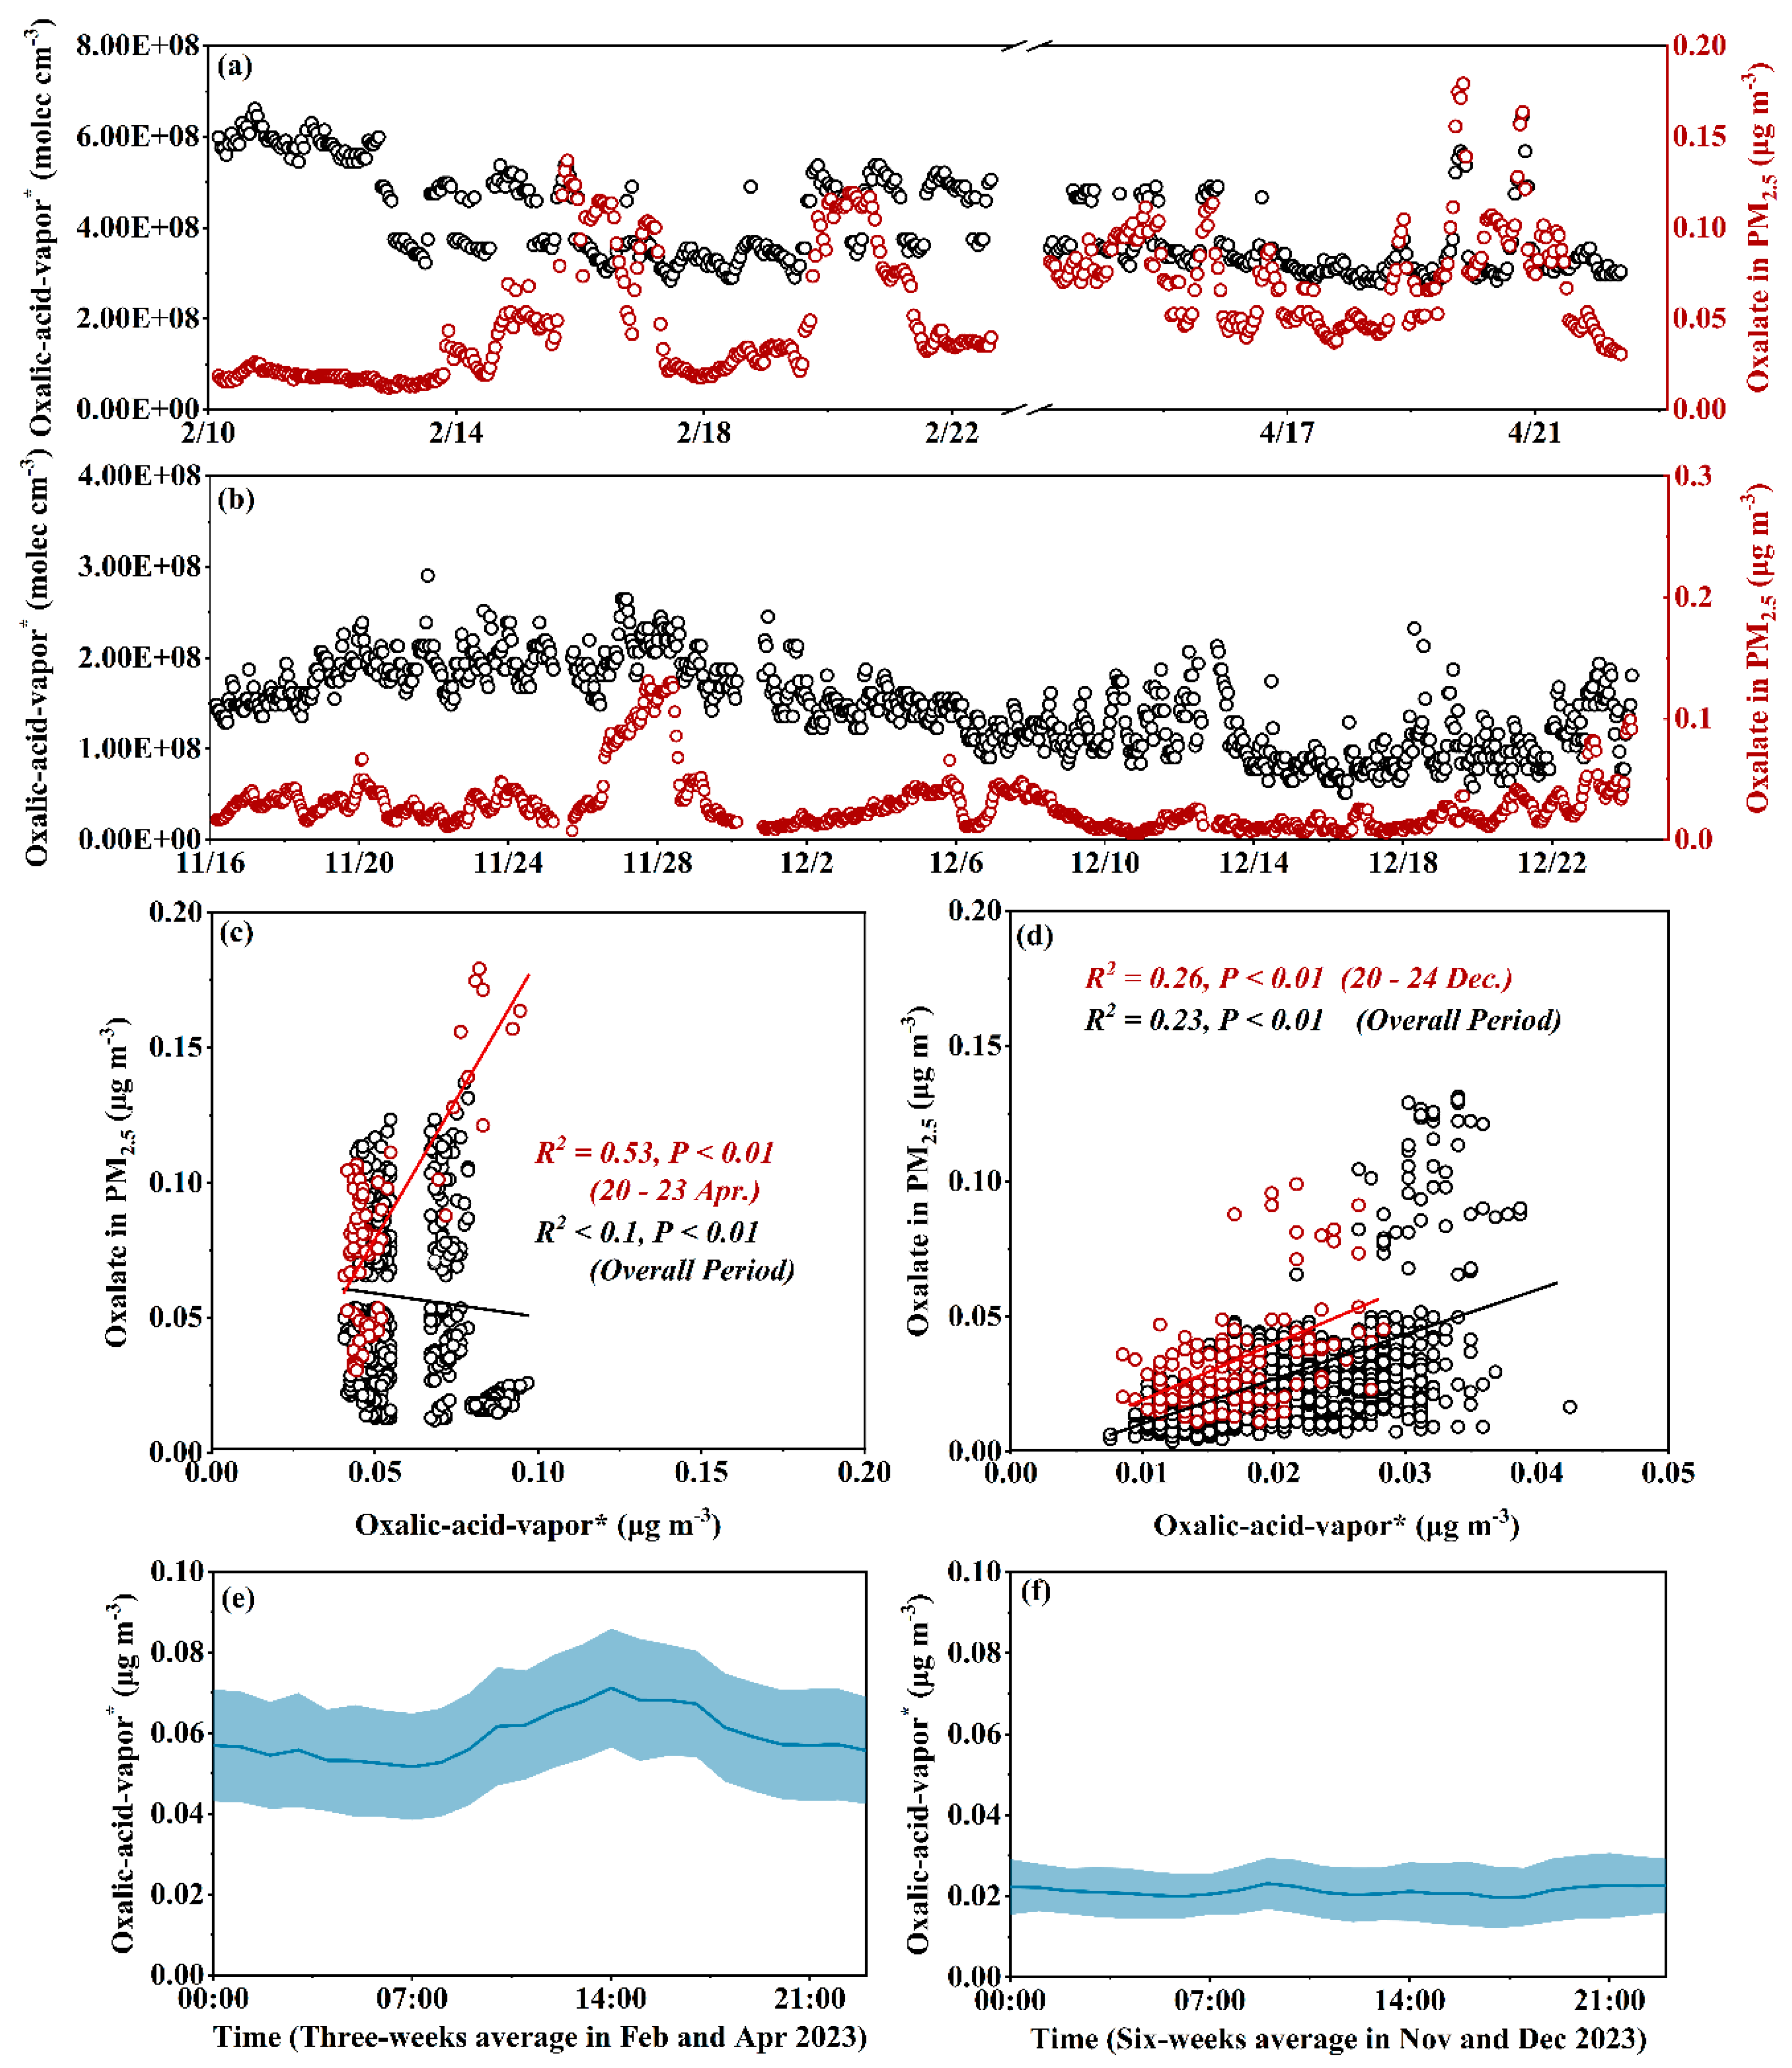
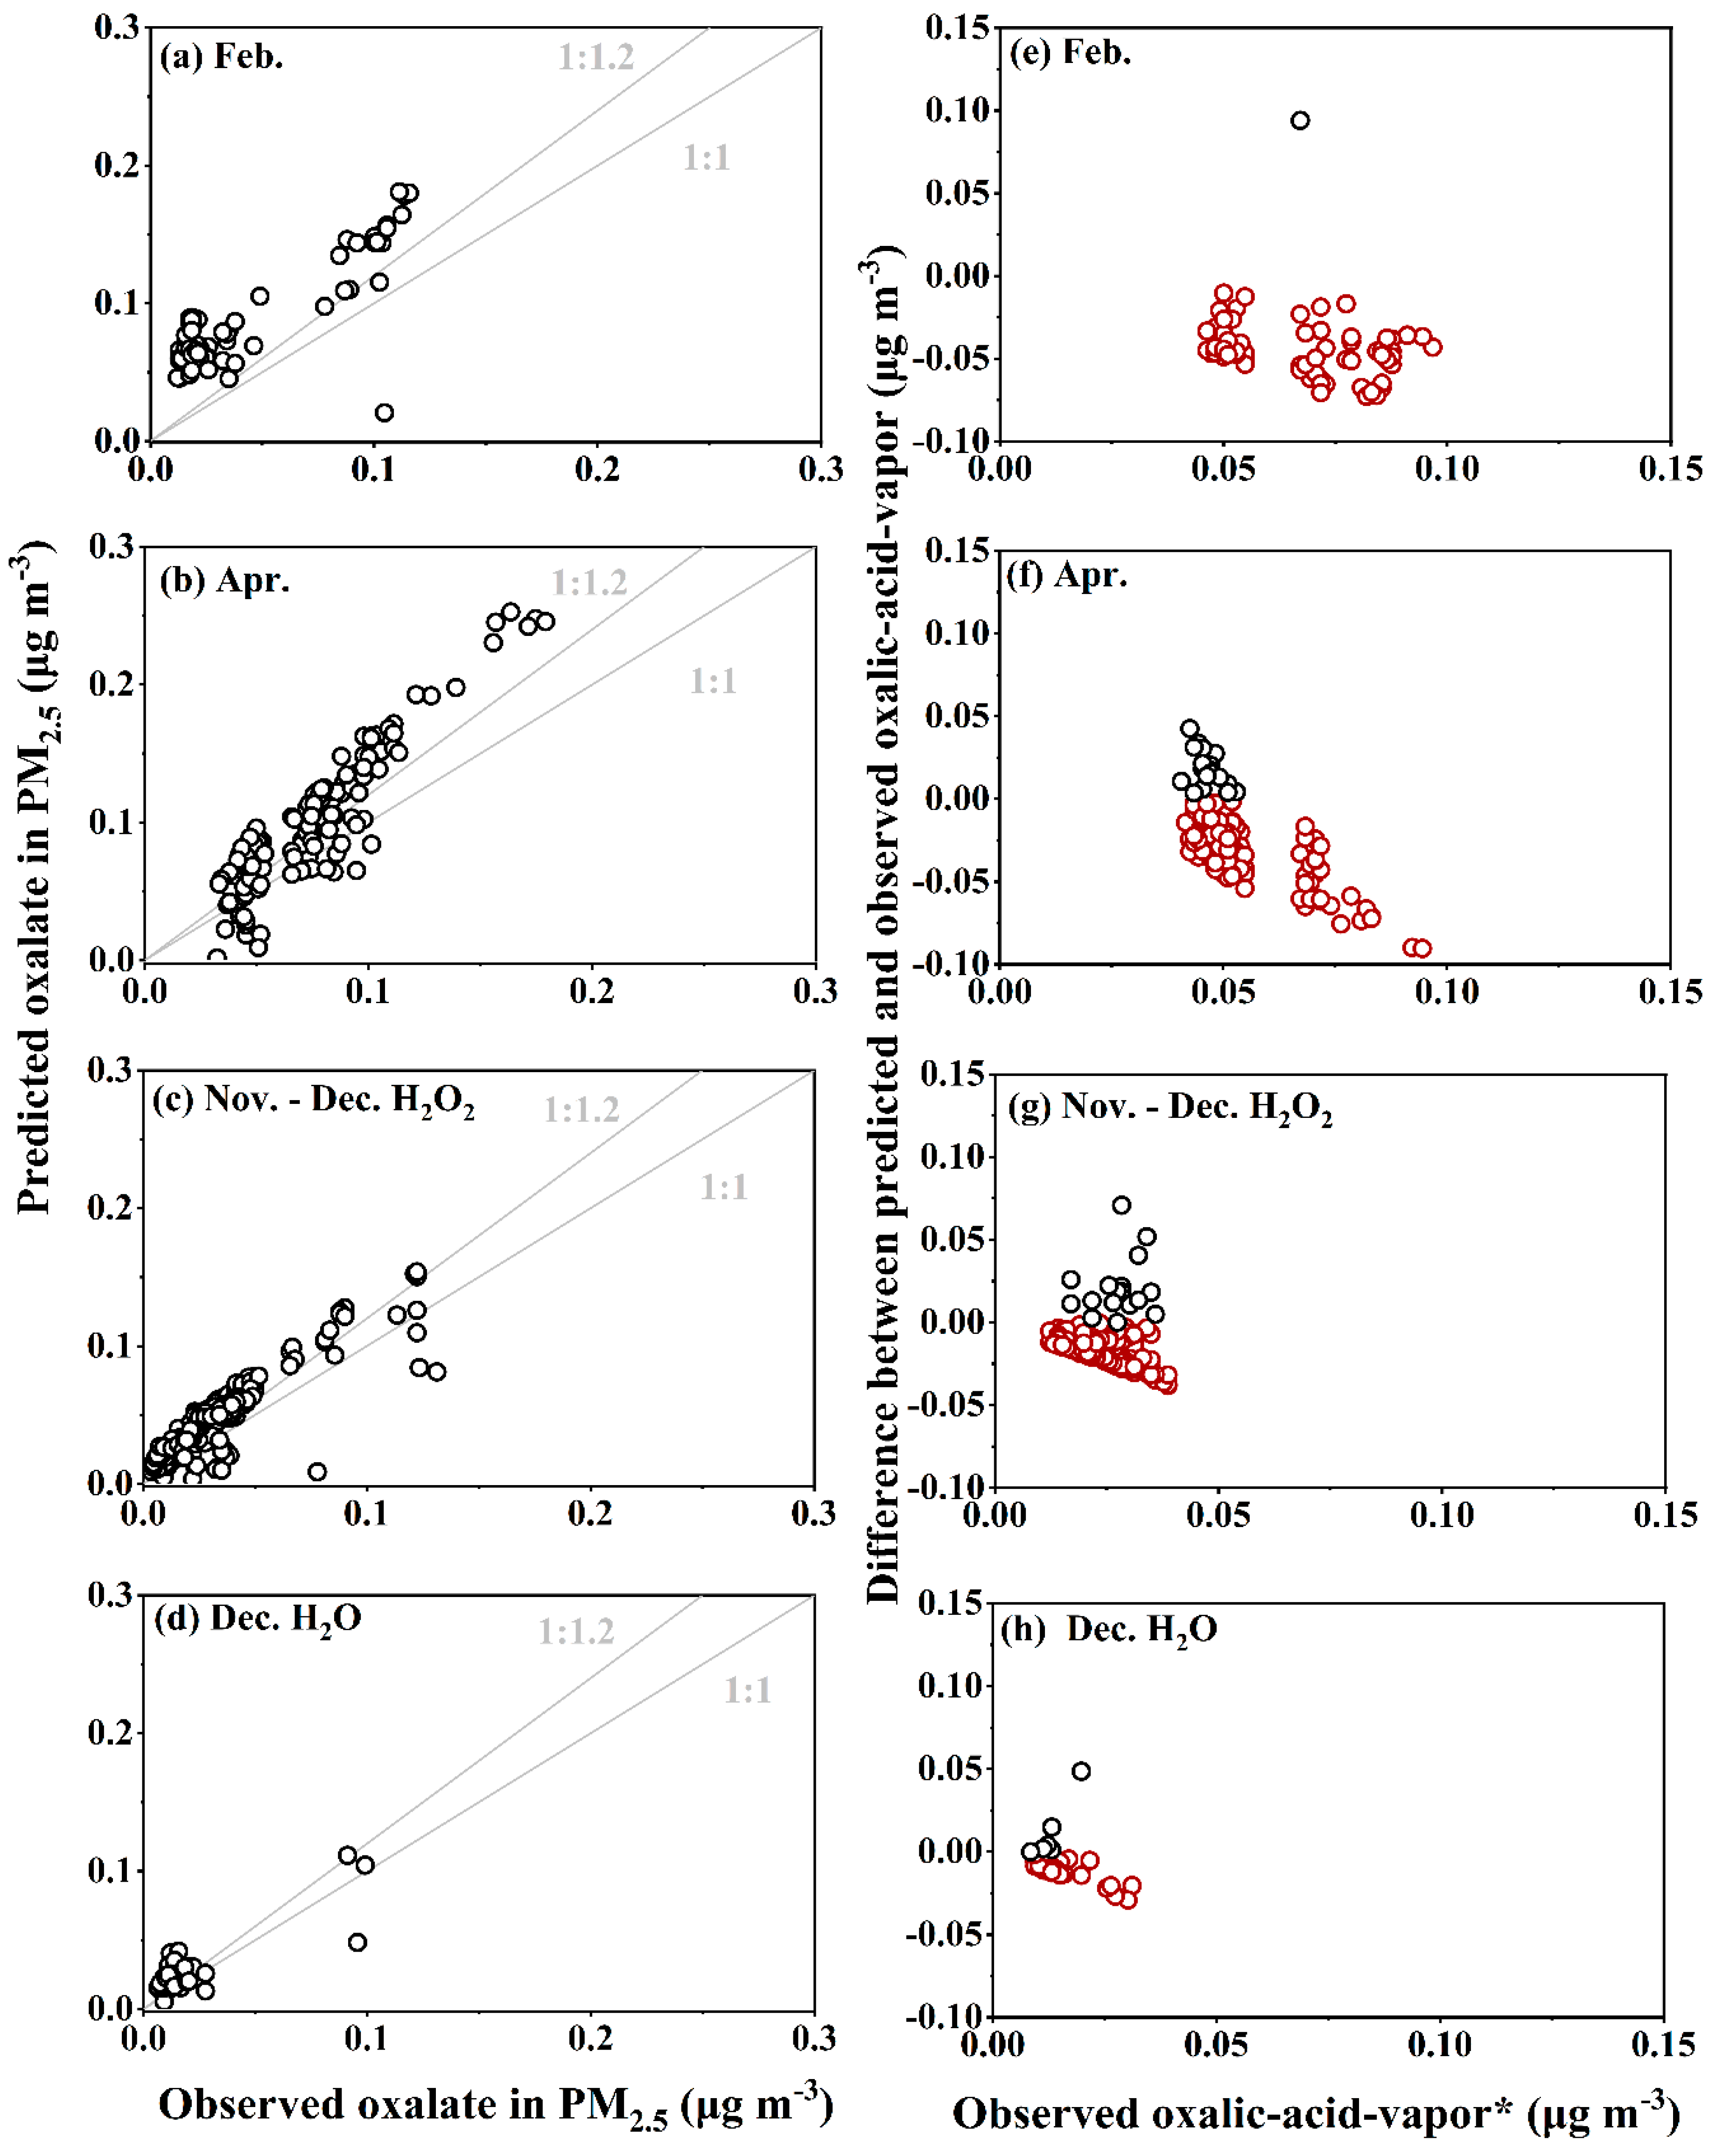
Oxalic acid is the most abundant low-molecular-weight dicarboxylic acid in theatmosphere and plays a crucial role in the formation of new particles and cloud condensation nuclei. However, most observational studies have focused on particulate oxalate, leaving a significant knowledge gap on oxalic acid vapor. This study investigated the concentrations and formation of oxalic acid vapor and oxalate in PM2.5 at a rural tropical coastal island site in south China across different seasons, based on semi-continuous measurements using an Ambient Ion Monitor-Ion Chromatograph (AIM-IC) system. We replaced the default 25 μL sampling loop on the AIM-IC with a 250 μL loop, improving the ability to distinguish the signal of oxalic acid vapor from noise. The data revealed clear seasonal patterns in the depedent daytime and nighttime formation of oxalic acid vapor, benefiting from high signal-to-noise ratios. Specifically, concentrations were 0.059 ± 0.15 μg m-3 in February and April 2023, exhibiting consistent diurnal variations similar to those of O3, likely driven by photochemical reactions. These values decreased to 0.021 ± 0.07 μg m-3 in November and December 2023, with higher nighttime concentrations likely related to dark chemistry processes, amplified by accumulation due to low mixing layer height. The concentrations of oxalate in PM2.5 were comparable to those of oxalic acid vapor, but exhibited (3-7)-day variations, superimposed on diurnal fluctuations to varying degrees. Additionally, thermodynamic equilibrium calculations were performed on the coastal data, and independent size distributions of particulate oxalate in the upwind marine atmosphere were analyzed to support the findings.

Keywords:
1. Introduction
2. Methodology
3. Results and Discussion
3.1. Overview of Oxalic-Acid-Vapor* and Particulate Oxalate in the Coastal Atmosphere
3.2. Daytime and Nighttime Formation of Oxalic-Acid-Vapor* and Particulate Oxalate
3.3. Thermodynamic Examination for True Oxalic Acid Vapor and Its Volatility
3.4. Size Distributions of Oxalate in Atmospheric Particles over the SCS
4. Summary and Atmospheric Application
Supplementary Materials
Author Contributions
Funding
Acknowledgments
Conflicts of Interest
Abbreviations
References
- Yu, L. Global air–sea fluxes of heat, fresh water, and momentum: energy budget closure and unanswered questions. Annu. Rev. Mar. Sci. 2019, 11, 227–248. [Google Scholar] [CrossRef]
- Michael, J. McPhaden P NOAA Pacific Marine Environmental Laboratory, S.W.U.P., Tropical Ocean observations for weather and climate: a decadal overview of the global tropical moored buoy array. Oceanography 2023, 36, 32–43. [Google Scholar] [CrossRef]
- Williamson, C.J.; Kupc, A.; Axisa, D.; Bilsback, K.R.; Bui, T.; Campuzano-Jost, P.; Dollner, M.; Froyd, K.D.; Hodshire, A.L.; Jimenez, J.L.; et al. A large source of cloud condensation nuclei from new particle formation in the tropics. Nature 2019, 574, 399–403. [Google Scholar] [CrossRef] [PubMed]
- Good, P.; Chadwick, R.; Holloway, C.E.; Kennedy, J.; Lowe, J.A.; Roehrig, R.; Rushley, S.S. High sensitivity of tropical precipitation to local sea surface temperature. Nature 2021, 589, 408–414. [Google Scholar] [CrossRef]
- Leung, G.R.; Saleeby, S.M.; Sokolowsky, G.A.; Freeman, S.W.; van den Heever, S.C. Aerosol–cloud impacts on aerosol detrainment and rainout in shallow maritime tropical clouds. Atmos. Chem. Phys. 2023, 23, 5263–5278. [Google Scholar] [CrossRef]
- Guo, T.; Guo, Z.; Wang, J.; Feng, J.; Gao, H.; Yao, X. Tracer-based investigation of organic aerosols in marine atmospheres from marginal seas of China to the northwest Pacific Ocean. Atmos. Chem. Phys. 2020, 20, 5055–5070. [Google Scholar] [CrossRef]
- Chen, D.; Yao, X.; Chan, C.K.; Tian, X.; Chu, Y.; Clegg, S.L.; Shen, Y.; Gao, Y.; Gao, H. Competitive uptake of dimethylamine and trimethylamine against ammonia on acidic particles in marine atmospheres. Environ. Sci. Technol. 2022, 56, 5430–5439. [Google Scholar] [CrossRef]
- Miller, R.M.; Rauber, R.M.; Di Girolamo, L.; Rilloraza, M.; Fu, D.; McFarquhar, G.M.; Nesbitt, S.W.; Ziemba, L.D.; Woods, S.; Thornhill, K.L. Influence of natural and anthropogenic aerosols on cloud base droplet size distributions in clouds over the South China Sea and West Pacific. Atmos. Chem. Phys. 2023, 23, 8959–8977. [Google Scholar] [CrossRef]
- Shen, X.; Chen, J.; Li, G.; An, T. A new advance in the pollution profile, transformation process, and contribution to aerosol formation and aging of atmospheric amines. Environ. Sci.: Atmos. 2023, 3, 444–473. [Google Scholar] [CrossRef]
- Xiao, Q.; Zhang, J.; Wang, Y.; Ziemba, L.D.; Crosbie, E.; Winstead, E.L.; Robinson, C.E.; DiGangi, J.P.; Diskin, G.S.; Reid, J.S.; et al. New particle formation in the tropical free troposphere during camp2ex: statistics and impact of emission sources, convective activity, and synoptic conditions. Atmos. Chem. Phys. 2023, 23, 9853–9871. [Google Scholar] [CrossRef]
- Kawamura, K.; Bikkina, S. A review of dicarboxylic acids and related compounds in atmospheric aerosols: molecular distributions, sources and transformation. Atmos. Res. 2016, 170, 140–160. [Google Scholar] [CrossRef]
- Mochizuki, T.; Kawamura, K.; Miyazaki, Y.; Wada, R.; Takahashi, Y.; Saigusa, N.; Tani, A. Secondary formation of oxalic acid and related organic species from biogenic sources in a larch forest at the northern slope of mt. Fuji. Atmos. Environ. 2017, 166, 255–262. [Google Scholar] [CrossRef]
- Mahilang, M.; Deb, M.K.; Pervez, S. Biogenic secondary organic aerosols: a review on formation mechanism, analytical challenges and environmental impacts. Chemosphere 2021, 262, 127771. [Google Scholar] [CrossRef]
- Arquero, K.D.; Gerber, R.B.; Finlayson-Pitts, B.J. The role of oxalic acid in new particle formation from methanesulfonic acid, methylamine, and water. Environ. Sci. Technol. 2017, 51, 2124–2130. [Google Scholar] [CrossRef] [PubMed]
- Lee, S.; Gordon, H.; Yu, H.; Lehtipalo, K.; Haley, R.; Li, Y.; Zhang, R. New particle formation in the atmosphere: from molecular clusters to global climate. J. Geophys. Res. Atmos. 2019, 124, 7098–7146. [Google Scholar] [CrossRef]
- Zhang, R.; Shen, J.; Xie, H.B.; Chen, J.; Elm, J. The role of organic acids in new particle formation from methanesulfonic acid and methylamine. Atmos. Chem. Phys. 2022, 22, 2639–2650. [Google Scholar] [CrossRef]
- Boreddy, S.K.R.; Kawamura, K. Investigation on the hygroscopicity of oxalic acid and atmospherically relevant oxalate salts under sub- and supersaturated conditions. Environ. Sci. Process. Impacts 2018, 20, 1069–1080. [Google Scholar] [CrossRef]
- Sorooshian, A.; MacDonald, A.B.; Dadashazar, H.; Bates, K.H.; Coggon, M.M.; Craven, J.S.; Crosbie, E.; Hersey, S.P.; Hodas, N.; Lin, J.J.; et al. A multi-year data set on aerosol-cloud-precipitation-meteorology interactions for marine stratocumulus clouds. Sci. Data 2018, 5, 180026. [Google Scholar] [CrossRef] [PubMed]
- Tsigaridis, K.; Kanakidou, M. The present and future of secondary organic aerosol direct forcing on climate. Curr. Clim. Chang. Rep. 2018, 4, 84–98. [Google Scholar] [CrossRef]
- Yao, X.; Fang, M.; Chan, C.K. Size distributions and formation of dicarboxylic acids in atmospheric particles. Atmos. Environ. 2002, 36, 2099–2107. [Google Scholar] [CrossRef]
- Martinelango, P.K.; Dasgupta, P.K.; Al-Horr, R.S. Atmospheric production of oxalic acid/oxalate and nitric acid/nitrate in the Tampa Bay airshed: parallel pathways. Atmos. Environ. 2007, 41, 4258–4269. [Google Scholar] [CrossRef]
- Yao, Y.; Ye, X.; Chen, Y.; Zhou, Y.; Lv, Z.; Wang, R.; Zheng, H.; Chen, J. Gas-particle partitioning of low-molecular-weight organic acids in suburban shanghai: insight into measured henry's law constants dependent on relative humidity. Sci. Total Environ. 2024, 939, 173636. [Google Scholar] [CrossRef]
- Hodas, N.; Sullivan, A.P.; Skog, K.; Keutsch, F.N., Jr.; Collett, J.L.; Decesari, S.; Facchini, M.C.; Carlton, A.G.; Laaksonen, A.; Turpin, B.J. Aerosol liquid water driven by anthropogenic nitrate: implications for lifetimes of water-soluble organic gases and potential for secondary organic aerosol formation. Environ. Sci. Technol. 2014, 48, 11127–11136. [Google Scholar] [CrossRef]
- Nah, T.; Guo, H.; Sullivan, A.P.; Chen, Y.; Tanner, D.J.; Nenes, A.; Russell, A.; Ng, N.L.; Huey, L.G.; Weber, R.J. Characterization of aerosol composition, aerosol acidity, and organic acid partitioning at an agriculturally intensive rural southeastern us site. Atmos. Chem. Phys. 2018, 18, 11471–11491. [Google Scholar] [CrossRef]
- Chen, Y.; Guo, H.; Nah, T.; Tanner, D.J.; Sullivan, A.P.; Takeuchi, M.; Gao, Z.; Vasilakos, P.; Russell, A.G.; Baumann, K.; et al. Low-molecular-weight carboxylic acids in the southeastern U.S.: Formation, partitioning, and implications for organic aerosol aging. Environ. Sci. Technol. 2021, 55, 6688–6699. [Google Scholar] [CrossRef] [PubMed]
- Lv, S.; Wu, C.; Wang, F.; Liu, X.; Zhang, S.; Chen, Y.; Zhang, F.; Yang, Y.; Wang, H.; Huang, C.; et al. Nitrate-enhanced gas-to-particle-phase partitioning of water-soluble organic compounds in Chinese urban atmosphere: implications for secondary organic aerosol formation. Environ. Sci. Technol. Lett. 2023, 10, 14–20. [Google Scholar] [CrossRef]
- Booth, A.M.; Markus, T.; McFiggans, G.; Percival, C.J.; Mcgillen, M.R.; Topping, D.O. Design and construction of a simple Knudsen Effusion Mass Spectrometer (KEMS) system for vapour pressure measurements of low volatility organics. Atmos. Meas. Tech. 2009, 2, 355–361. [Google Scholar] [CrossRef]
- Paciga, A.L.; Riipinen, I.; Pandis, S.N. Effect of ammonia on the volatility of organic diacids. Environ. Sci. Technol. 2014, 48, 13769–13775. [Google Scholar] [CrossRef]
- Ortiz-Montalvo, D.L.; Häkkinen, S.A.K.; Schwier, A.N.; Lim, Y.B.; McNeill, V.F.; Turpin, B.J. Ammonium addition (and aerosol ph) has a dramatic impact on the volatility and yield of glyoxal secondary organic aerosol. Environ. Sci. Technol. 2014, 48, 255–262. [Google Scholar] [CrossRef] [PubMed]
- Marti, J.J.; Jefferson, A.; Cai, X.P.; Richert, C.; McMurry, P.H.; Eisele, F. H2SO4 vapor pressure of sulfuric acid and ammonium sulfate solutions. J. Geophys. Res. Atmos. 1997, 102, 3725–3735. [Google Scholar] [CrossRef]
- Yao, L.; Garmash, O.; Bianchi, F.; Zheng, J.; Yan, C.; Kontkanen, J.; Junninen, H.; Mazon, S.B.; Ehn, M.; Paasonen, P.; et al. Atmospheric new particle formation from sulfuric acid and amines in a Chinese megacity. Science 2018, 361, 278–281. [Google Scholar] [CrossRef] [PubMed]
- Carlton, A.G.; Turpin, B.J.; Altieri, K.E.; Seitzinger, S.; Reff, A.; Lim, H.; Ervens, B. Atmospheric oxalic acid and SOA production from glyoxal: results of aqueous photooxidation experiments. Atmos. Environ. 2007, 41, 7588–7602. [Google Scholar] [CrossRef]
- Ip, H.S.S.; Huang, X.H.H.; Yu, J.Z. Effective henry's law constants of glyoxal, glyoxylic acid, and glycolic acid. Geophys. Res. Lett. 2009, 36, L01802. [Google Scholar] [CrossRef]
- Rinaldi, M.; Decesari, S.; Carbone, C.; Finessi, E.; Fuzzi, S.; Ceburnis, D.; O'Dowd, C.D.; Sciare, J.; Burrows, J.P.; Vrekoussis, M.; et al. Evidence of a natural marine source of oxalic acid and a possible link to glyoxal. J. Geophys. Res. Atmos. 2011, 116, D16204. [Google Scholar] [CrossRef]
- Hilario, M.R.A.; Crosbie, E.; Bañaga, P.A.; Betito, G.; Braun, R.A.; Cambaliza, M.O.; Corral, A.F.; Cruz, M.T.; Dibb, J.E.; Lorenzo, G.R.; et al. Particulate oxalate-to-sulfate ratio as an aqueous processing marker: similarity across field campaigns and limitations. Geophys. Res. Lett. 2021, 48, e2021GL096520. [Google Scholar] [CrossRef]
- Hegde, P.; Boreddy, S.K.R.; Aswini, A.R.; Aryasree, S. Influence of south Asian outflow on secondary organic aerosol formation over the Indian ocean: inferences from water-soluble low molecular weight dicarboxylic acids and related organic compounds during ICARB 2018 experiment. Mar. Chem. 2022, 239, 104071. [Google Scholar] [CrossRef]
- Yang, C.; Zhou, S.; Zhang, C.; Yu, M.; Cao, F.; Zhang, Y. Atmospheric chemistry of oxalate: insight into the role of relative humidity and aerosol acidity from high-resolution observation. J. Geophys. Res. Atmos. 2022, 127, e2021JD035364. [Google Scholar] [CrossRef]
- Hoque, M.M.M.; Kawamura, K.; Uematsu, M. Spatio-temporal distributions of dicarboxylic acids, ω-oxocarboxylic acids, pyruvic acid, α-dicarbonyls and fatty acids in the marine aerosols from the north and south pacific. Atmos. Res. 2017, 185, 158–168. [Google Scholar] [CrossRef]
- Boreddy, S.K.R.; Kawamura, K.; Gowda, D.; Deshmukh, D.K.; Narasimhulu, K.; Ramagopal, K. Sulfate-associated liquid water amplifies the formation of oxalic acid at a semi-arid tropical location over peninsular India during winter. Sci. Total Environ. 2023, 874, 162365. [Google Scholar] [CrossRef]
- Shah, V.; Jaeglé, L.; Jimenez, J.L.; Schroder, J.C.; Campuzano-Jost, P.; Campos, T.L.; Reeves, J.M.; Stell, M.; Brown, S.S.; Lee, B.H.; et al. Widespread pollution from secondary sources of organic aerosols during winter in the northeastern united states. Geophys. Res. Lett. 2019, 46, 2974–2983. [Google Scholar] [CrossRef]
- Kuang, Y.; He, Y.; Xu, W.; Yuan, B.; Zhang, G.; Ma, Z.; Wu, C.; Wang, C.; Wang, S.; Zhang, S.; et al. Photochemical aqueous-phase reactions induce rapid daytime formation of oxygenated organic aerosol on the north China plain. Environ. Sci. Technol. 2020, 54, 3849–3860. [Google Scholar] [CrossRef]
- Srivastava, D.; Vu, T.V.; Tong, S.; Shi, Z.; Harrison, R.M. Formation of secondary organic aerosols from anthropogenic precursors in laboratory studies. npj Clim. Atmos. Sci. 2022, 5, 22. [Google Scholar] [CrossRef]
- Guo, T.; Li, K.; Zhu, Y.; Gao, H.; Yao, X. Concentration and size distribution of particulate oxalate in marine and coastal atmospheres – implication for the increased importance of oxalate in nanometer atmospheric particles. Atmos. Environ. 2016, 142, 19–31. [Google Scholar] [CrossRef]
- Bian, Q.; Huang, X.H.H.; Yu, J.Z. One-year observations of size distribution characteristics of major aerosol constituents at a coastal receptor site in Hong Kong–Part 1: inorganic ions and oxalate. Atmos. Chem. Phys. 2014, 14, 9013–9027. [Google Scholar] [CrossRef]
- Clegg, S.L.; Qiu, C.; Zhang, R. The deliquescence behaviour, solubilities, and densities of aqueous solutions of five methyl- and ethyl-aminium sulphate salts. Atmos. Environ. 2013, 73, 145–158. [Google Scholar] [CrossRef]
- Lin, Y.; Zhang, L.; Fan, Q.; Meng, H.; Gao, Y.; Gao, H.; Yao, X. Decoupling impacts of weather conditions on interannual variations in concentrations of criteria air pollutants in South China – constraining analysis uncertainties by using multiple analysis tools. Atmos. Chem. Phys. 2022, 22, 16073–16090. [Google Scholar] [CrossRef]
- Chen, D.; Shen, Y.; Wang, J.; Gao, Y.; Gao, H.; Yao, X. Mapping gaseous dimethylamine, trimethylamine, ammonia, and their particulate counterparts in marine atmospheres of China’s marginal seas – part 1: differentiating marine emission from continental transport. Atmos. Chem. Phys. 2021, 21, 16413–16425. [Google Scholar] [CrossRef]
- Shen, Y.; Wang, J.; Gao, Y.; Chan, C.K.; Zhu, Y.; Gao, H.; Petäjä, T.; Yao, X. Sources and formation of nucleation mode particles in remote tropical marine atmospheres over the South China Sea and the Northwest Pacific Ocean. Sci. Total Environ. 2020, 735, 139302. [Google Scholar] [CrossRef] [PubMed]
- Yu, Y.; Xing, X.; Liu, H.; Yuan, Y.; Wang, Y.; Chai, F. The variability of chlorophyII-a and its relationship with dynamic factors in the basin of the South China Sea. J. Mar. Syst. 2019, 200, 103230. [Google Scholar] [CrossRef]
- Wexler, A.S.; Seinfeld, J.H. The distribution of ammonium salts among a size and composition dispersed aerosol. Atmos. Environ. A, Gen. Top. 1990, 24, 1231–1246. [Google Scholar] [CrossRef]
- Shiraiwa, M.; Seinfeld, J.H. Equilibration timescale of atmospheric secondary organic aerosol partitioning. Geophys. Res. Lett. 2012, 39, L24801. [Google Scholar] [CrossRef]
- Gen, M.; Liang, Z.; Zhang, R.; Go, B.R.; Chan, C.K. Particulate nitrate photolysis in the atmosphere. Environ. Sci.: Atmos. 2022, 2, 111–127. [Google Scholar] [CrossRef]
- Ondov, J.M.; Wexler, A.S. Where do particulate toxins reside? An improved paradigm for the structure and dynamics of the urban mid-Atlantic aerosol. Environ. Sci. Technol. 1998, 32, 2547–2555. [Google Scholar] [CrossRef]
- Mochida, M.; Umemoto, N.; Kawamura, K.; Uematsu, M. Bimodal size distribution of C2–C4 dicarboxylic acids in the marine aerosols. Geophys. Res. Lett. 2003, 30, 1672. [Google Scholar] [CrossRef]
- Feng, J.L.; Guo, Z.G.; Zhang, T.R.; Yao, X.H.; Chan, C.K.; Fang, M. Source and formation of secondary particulate matter in PM2.5 in Asian continental outflow. J. Geophys. Res. Atmos. 2012, 117, D03302. [Google Scholar] [CrossRef]
- Van Pinxteren, M.; Fiedler, B.; van Pinxteren, D.; Iinuma, Y.; Körtzinger, A.; Herrmann, H. Chemical characterization of sub-micrometer aerosol particles in the tropical Atlantic Ocean: marine and biomass burning influences. J. Atmos. Chem. 2015, 72, 105–125. [Google Scholar] [CrossRef]
Disclaimer/Publisher’s Note: The statements, opinions and data contained in all publications are solely those of the individual author(s) and contributor(s) and not of MDPI and/or the editor(s). MDPI and/or the editor(s) disclaim responsibility for any injury to people or property resulting from any ideas, methods, instructions or products referred to in the content. |
© 2024 by the authors. Licensee MDPI, Basel, Switzerland. This article is an open access article distributed under the terms and conditions of the Creative Commons Attribution (CC BY) license (https://creativecommons.org/licenses/by/4.0/).


