1. Introduction
Infrastructural networks can be metaphorically likened to the veins and arteries of a nation, facilitating the flow of people and goods essential for cultural and economic prosperity. Among these networks, bridges play a critical role in maintaining system resilience. However, bridges are particularly vulnerable to a wide range of degradation processes, influenced by their construction materials, structural design, and exposure to environmental factors. Consequently, efficient management and maintenance of these structures have always been a top priority, with the United States leading these efforts since the 1970s [
1,
2,
3].
In recent years, bridge management has become an increasingly pressing issue, underscored by a series of high-profile collapses around the world. Scientific research highlights ageing and damage from natural disasters as the primary threats to bridge integrity, with 70% of structural failures resulting from a combination of these factors. Alarmingly, data from the World Meteorological Organization reveals a fivefold increase in natural disasters over the past 50 years, driven by climate change and intensifying weather extremes [
4,
5].
In recent years, research into bridge monitoring activities has intensified, driven by the need to assess structural health and guide maintenance efforts, thereby preventing failures with potentially catastrophic consequences [
6,
7]. The standard method for conducting such monitoring involves equipping bridges with systems of wired vibration sensors, such as accelerometers or velocimeters [
8]. These sensors are strategically placed to measure the structure’s natural frequencies, reconstruct mode shapes, and determine damping factor. Tracking the variation of these parameters over time serves as a fundamental approach to SHM of civil infrastructure, with continuous monitoring over the lifespan of the structure being the ultimate goal [
9].
While continuous monitoring systems are well-established in other engineering domains, such as railway vehicles and wind turbines, implementing such systems for bridges and viaducts presents unique challenges. Both traditional wired and emerging wireless monitoring systems have their respective advantages and limitations:
Wired Monitoring Systems
Traditional wired systems are highly effective in ensuring reliable data transmission and synchronization. However, their deployment on bridges presents practical challenges:
Wireless Monitoring Systems
Wireless sensor networks (WSNs) address many of the logistical and financial drawbacks of wired systems:
Rapid Installation: The absence of physical cabling significantly reduces installation times, particularly for long-span bridges.
Cost Efficiency: WSNs eliminate the need for extensive hardware infrastructure, lowering both initial and ongoing costs.
Flexibility: Wireless systems are easier to reconfigure or expand compared to their wired counterparts.
However, WSNs present unique technical challenges, particularly in achieving precise data synchronization across multiple nodes. Synchronization is critical for accurate structural health monitoring, as even minor timing discrepancies can impact data integrity and analysis.
Protocols such as the Time-sync Protocol for Sensor Networks (TPSN), Reference Broadcast Synchronization (RBS), and Flooding Time Synchronization Protocol (FTSP) have been developed to address this challenge. While these protocols help align clocks among WSNs, factors such as software processing delays and low-quality crystals can introduce variations in sensing start times and fluctuations in sampling rates. Further complications arise during extended sensing durations and with temperature variations, leading to synchronization errors that may compromise application results like system identification and damage detection [
10]. In particular, for OMA purposes, time synchronization error leads to problems in mode shape identification [
9].
Several works in the literature have proposed WSN prototypes tailored for the Structural Health Monitoring (SHM) of civil infrastructure, typically utilizing MEMS-based (micro electro-mechanical systems) accelerometers. These sensors are essential for performing Operational Modal Analysis (OMA), as acceleration measurements are required to capture the dynamic behavior of structures. These studies are reviewed below, highlighting their key strengths and limitations. Zhang et al. [
12] developed sensors nodes that are not synchronized and they proposes an approach for synchronization by means of offline data processing. Kustiana et al. [
13] proposed a WSN where no synchronization is mentioned and no information are provided about the possible deployment of the system in a real world scenario. Pineda et al. [
14] proposed a node based on ADXL345 accelerometer (noise density of
), that is not suitable for OMA purposes of bridges. In addition LoRa communication is proposed, that is not suitable for high frequency data due to the low data rate of this technology. Zanelli et al. [
11] developed a node equipped with solar panel by employing an accelerometer with a noise density of
, without describing how the time synchronization is guaranteed. Hasani et al. [
15] adopted ADXL355 accelerometer synchronized by means IEEE 802.11 timing synchronization function that results to have a maximum error of 2 ms. In this work, no harvesting unit are considered but the authors states that the battery can last five years by considering 30 minutes daily operation. This is a limitation if the objective is to both have multiple acquisitions during the day and long life sensors.
Moreover, modern MEMS accelerometers designed for mounting on printed circuit boards (PCB) now offer performance levels that closely rival those of traditional wired models [
16]. Significant advancements have been achieved, particularly in reducing noise density, a critical factor for the modal analysis of civil structures. In this regards, Cigada et al. [
17] demonstrates that for carrying out operational modal analysis of civil infrastructure, by employing random white noise technique, a noise density lower than
is mandatory to catch most of the primary natural frequencies of the structure.
WSN offers a promising solution for long-term SHM by providing easier installation and lower costs compared to traditional wired systems [
10]. To ensure long autonomy for sensor nodes, it is essential to use ultra-low-power components in the electronic board design and implement a smart acquisition strategy. This approach keeps the sensor in a low-power "sleep" mode when data collection is unnecessary. Simultaneously, a consistent energy inflow is required to recharge the sensor’s battery, typically achieved through an energy harvester [
18]. Various energy harvesting methods are discussed in the literature, including piezoelectric harvesters, micro wind turbines. However, for structures in outdoor environments, photovoltaic (PV) panels are the most effective solution, as they harvest solar energy that is a reliable source with high power density [
19].
Contributions of This Paper
In this work, to overcome the main criticity found in the previous works and to meet the requirements for SHM, a novel WSN is proposed with the following characteristics:
An accelerometer with a noise density of is adopted.
Global Navigation Satellite System (GNSS) synchronization is employed in order to guarantee a maximum synchronization error of .
The nodes are equipped with battery and a PV panel to guarantee potentially longer lifetimes with respect to state of the art solution.
The number of acquisitions per day can be increased when solar energy is more available due to seasonality.
The nodes are then tested in laboratory for metrological verification and finally on the a real bridge to verify the effectiveness of the proposed solution. The paper is structured as follows:
Section 2 describes the sensor node and the gateway architecture,
Section 3 defines the state machine of the sensor node by defining the different working phases,
Section 4 describes the methodological validation of the sensor node through experimental test and
Section 5 describes the case study considered for validation on a real bridge.
2. Wireless Sensor Network Architecture
2.1. Sensor Node
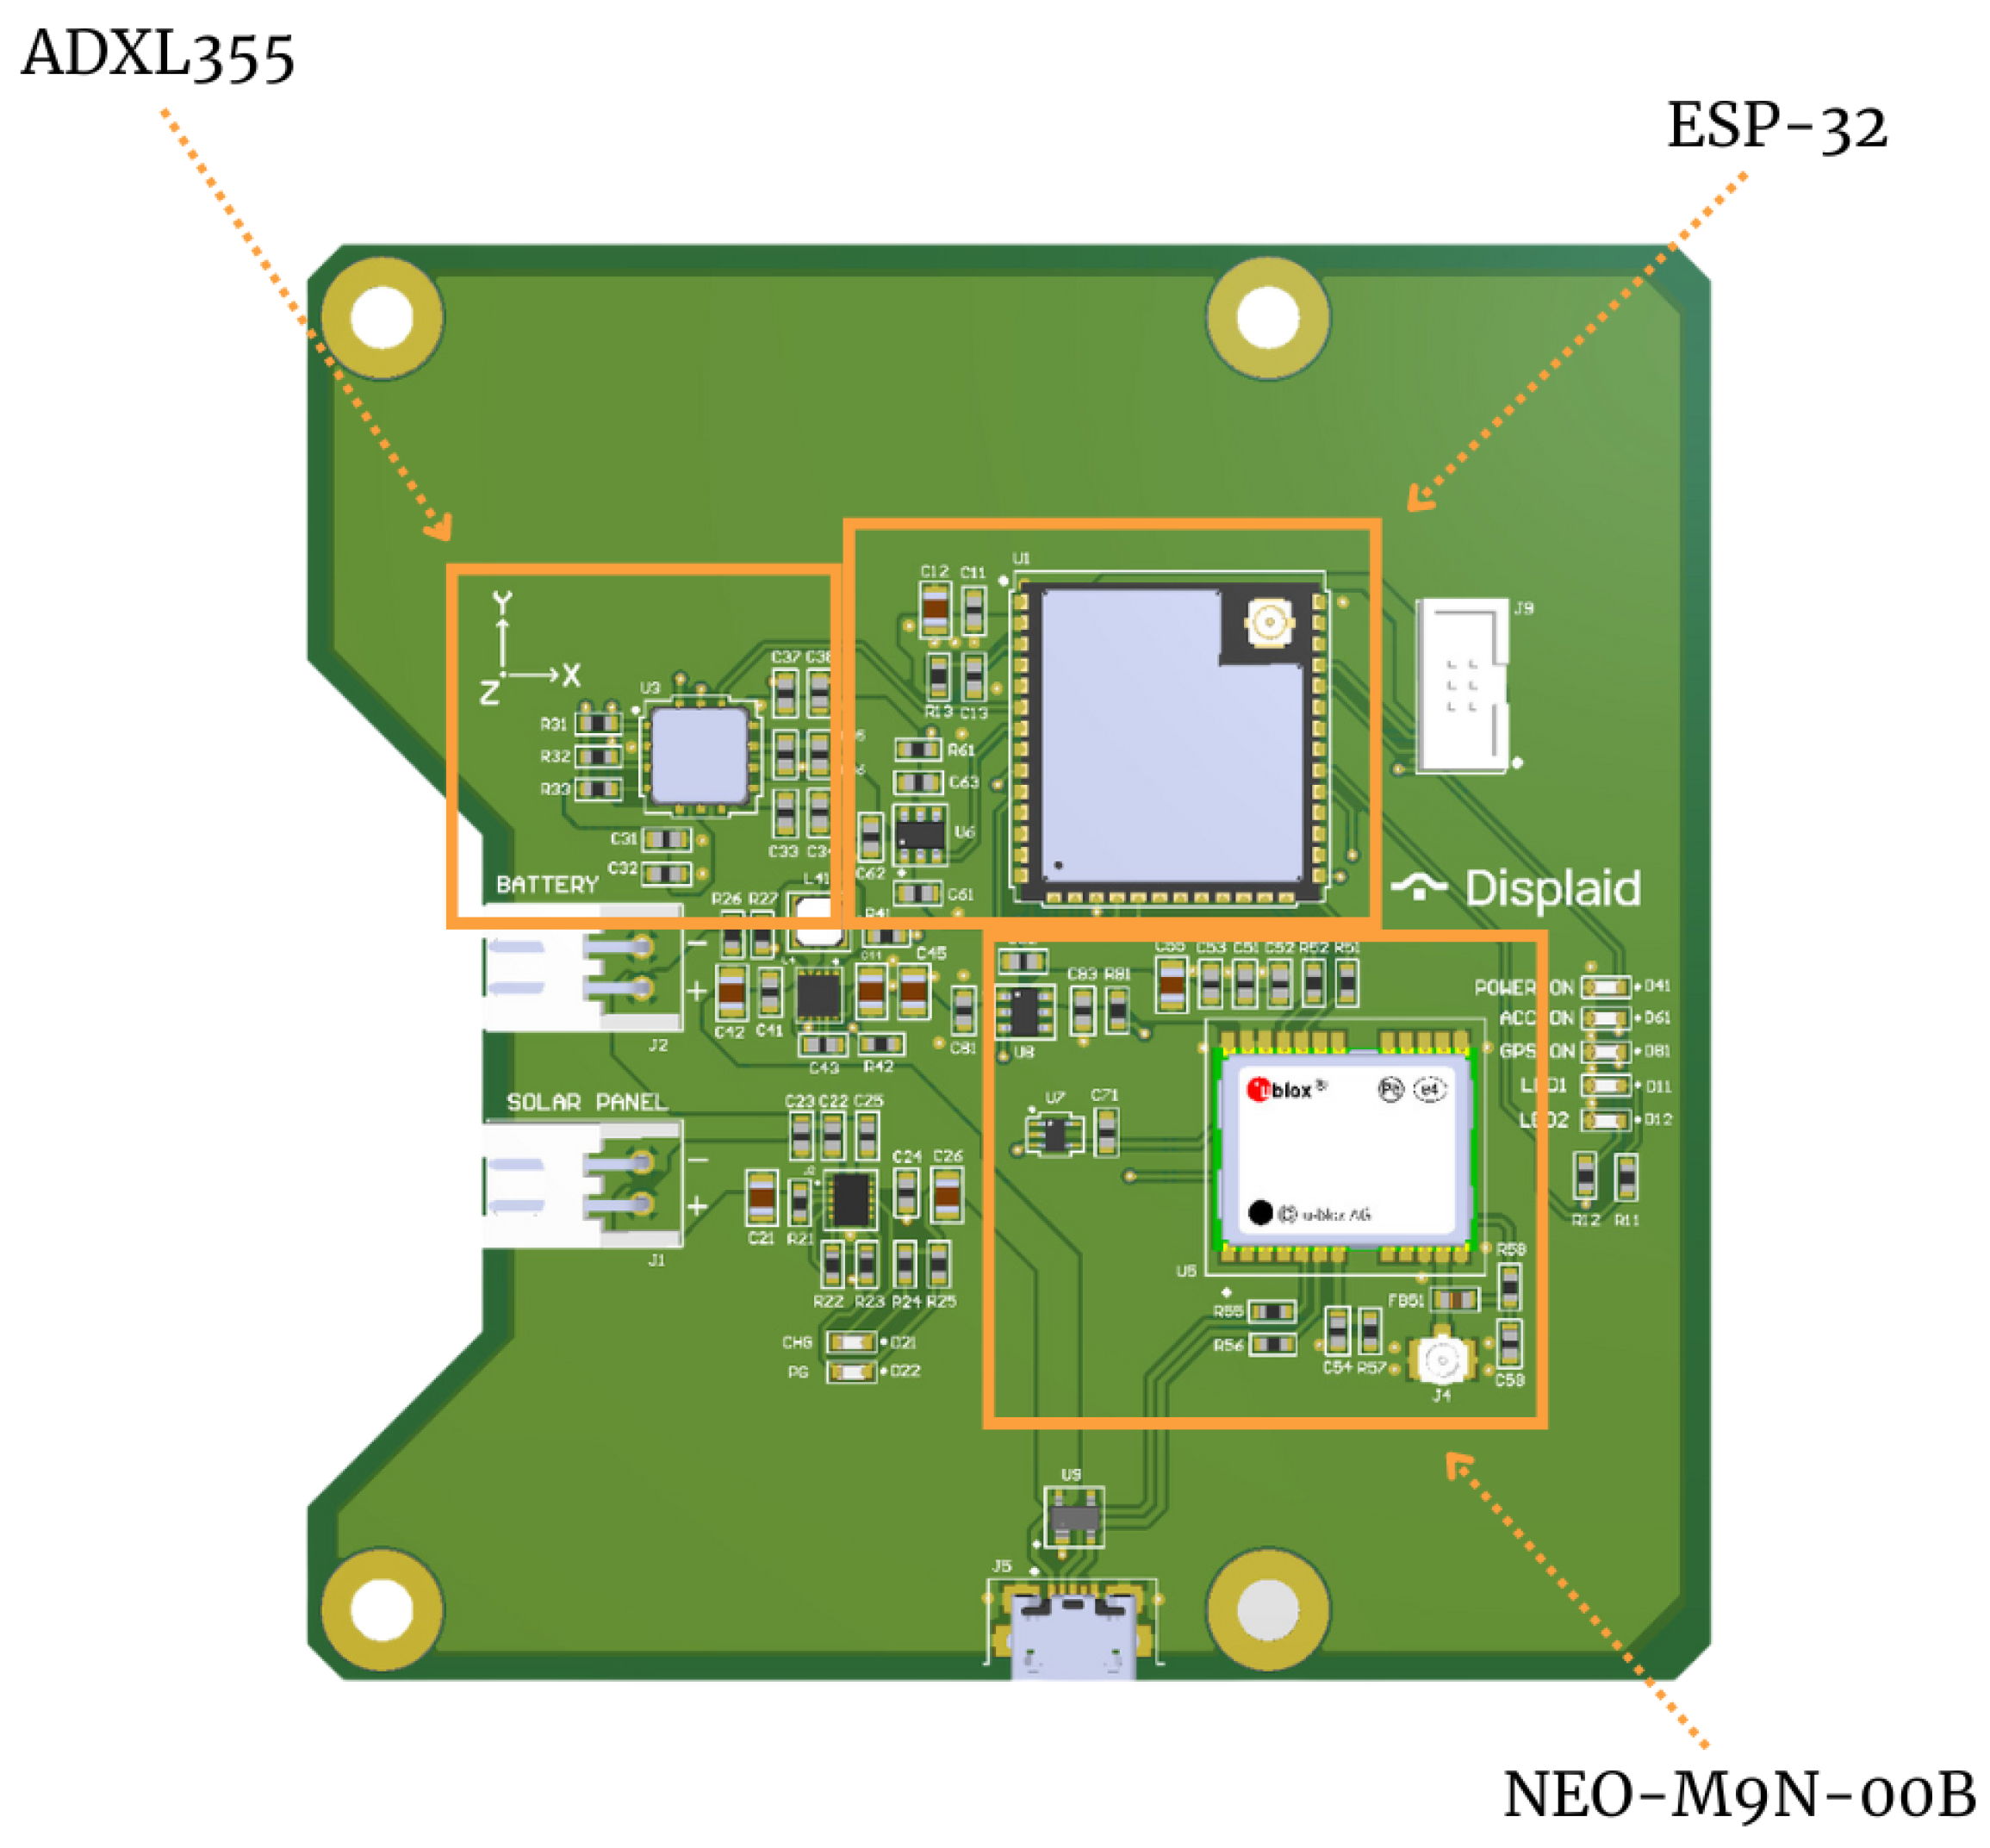
The architecture consists of four main units: an ESP32-S3 microcontroller unit, a GNSS module (NEO-M9N-00B), the accelerometer (ADXL355), and the power management unit. Each unit plays a distinct role in the overall functionality of the sensor node.
The ESP32-S3, in this configuration, operates in two distinct phases: data collection and transmission, with each process occurring at separate times.
NEO-M9N-00B GNSS module is used to synchronize between the different nodes. In particular, the acquisition start time is triggered at a given instant by checking it from the atomic clock of the GNSS satellites. [
20,
21].
ADXL355 MEMS accelerometer is chosen to ensure a reliable measurement; in fact, the main parameter that drives the selection of this accelerometer is its low noise density (
), which is important when dealing with ambient vibration of civil infrastructures [
17]. Furthermore, the selectable scale ensures that it can accurately measure the acceleration range (
) relevant to this application without saturating or losing sensitivity. Finally, the selectable sampling frequency allows us to adjust it based on the natural frequencies of the considered structure.
The power management unit is made up of a DC-DC converter, the BQ24210, which manages the energy flow from the solar panel to power the sensor node. It’s input voltage regulation loop detects if the current required from the converter is too high and is causing an overload of the power source; if this happens it reduces the current until there is no further drop in the voltage on the input. This feature allows the solar panel to work near its MPP (maximum power point) for a wide range of light conditions. In addition, it controls the charging process to prevent overcharging or discharging of the battery, thus preserving its longevity and ensuring stable operation of the sensor node. Finally, a buck-boost DC-DC converter is used to convert the battery voltage to the value of 3.3V, which is the operating voltage of the whole node.
All components are mounted on a PCB as shown in
Figure 1. In addition to the main components previously described, each node in the network is equipped with two antennas, one is dedicated to GNSS module and the other one, connected to the ESP32 microcontroller, is used for Wi-Fi communication. In addition, a temperature sensor is integrated into the node, providing critical environmental data for analysis.
2.2. Gateway
The network gateway, powered by a Raspberry Pi, serves as a pivotal component for data aggregation, management, and communication. Acting as an MQTT broker, it allows sensor nodes to publish data on specific topics, facilitating communication between the nodes and the central server. Furthermore, the gateway enables remote configuration of critical parameters such as sampling frequency and duty cycle of the sensor nodes.
The Raspberry Pi gateway connects to the internet via a 4G modem, providing reliable connectivity even in remote locations. It is powered by a battery system that is charged using a solar panel, ensuring continuous operation independent of the power grid. The gateway also generates a Wi-Fi network, enabling wireless connectivity for the sensor nodes. To ensure that the connection is accessible for all nodes, one or more Wi-Fi repeaters may be needed if ranges higher than 150 meters are necessary for long bridge monitoring. The next section will detail the structure and implementation of these repeaters.
2.3. Repeater
The repeater shares the same structural framework as the sensor node, consisting primarily of an ESP32 microcontroller (equipped with an external Wi-Fi antenna) and a power management unit. However, unlike the sensor node, the repeater does not include additional sensors for data collection and GNSS module. Its primary function is to extend the network coverage by relaying data between distant sensor nodes and the gateway; to do this, the repeater node acts as a hotspot generator.
The shared structure between the sensor nodes and the repeater facilitates scalability within the network architecture. By adopting a common design framework, both devices can be easily replicated and deployed across the network as needed, while keeping design and production costs low.
3. Acquisition Procedure and Data Transmission
The data acquisition phase spans a duration of half an hour and it is activated one or more times throughout the day, aligning with the monitoring requirements of most bridge SHM systems [
22].
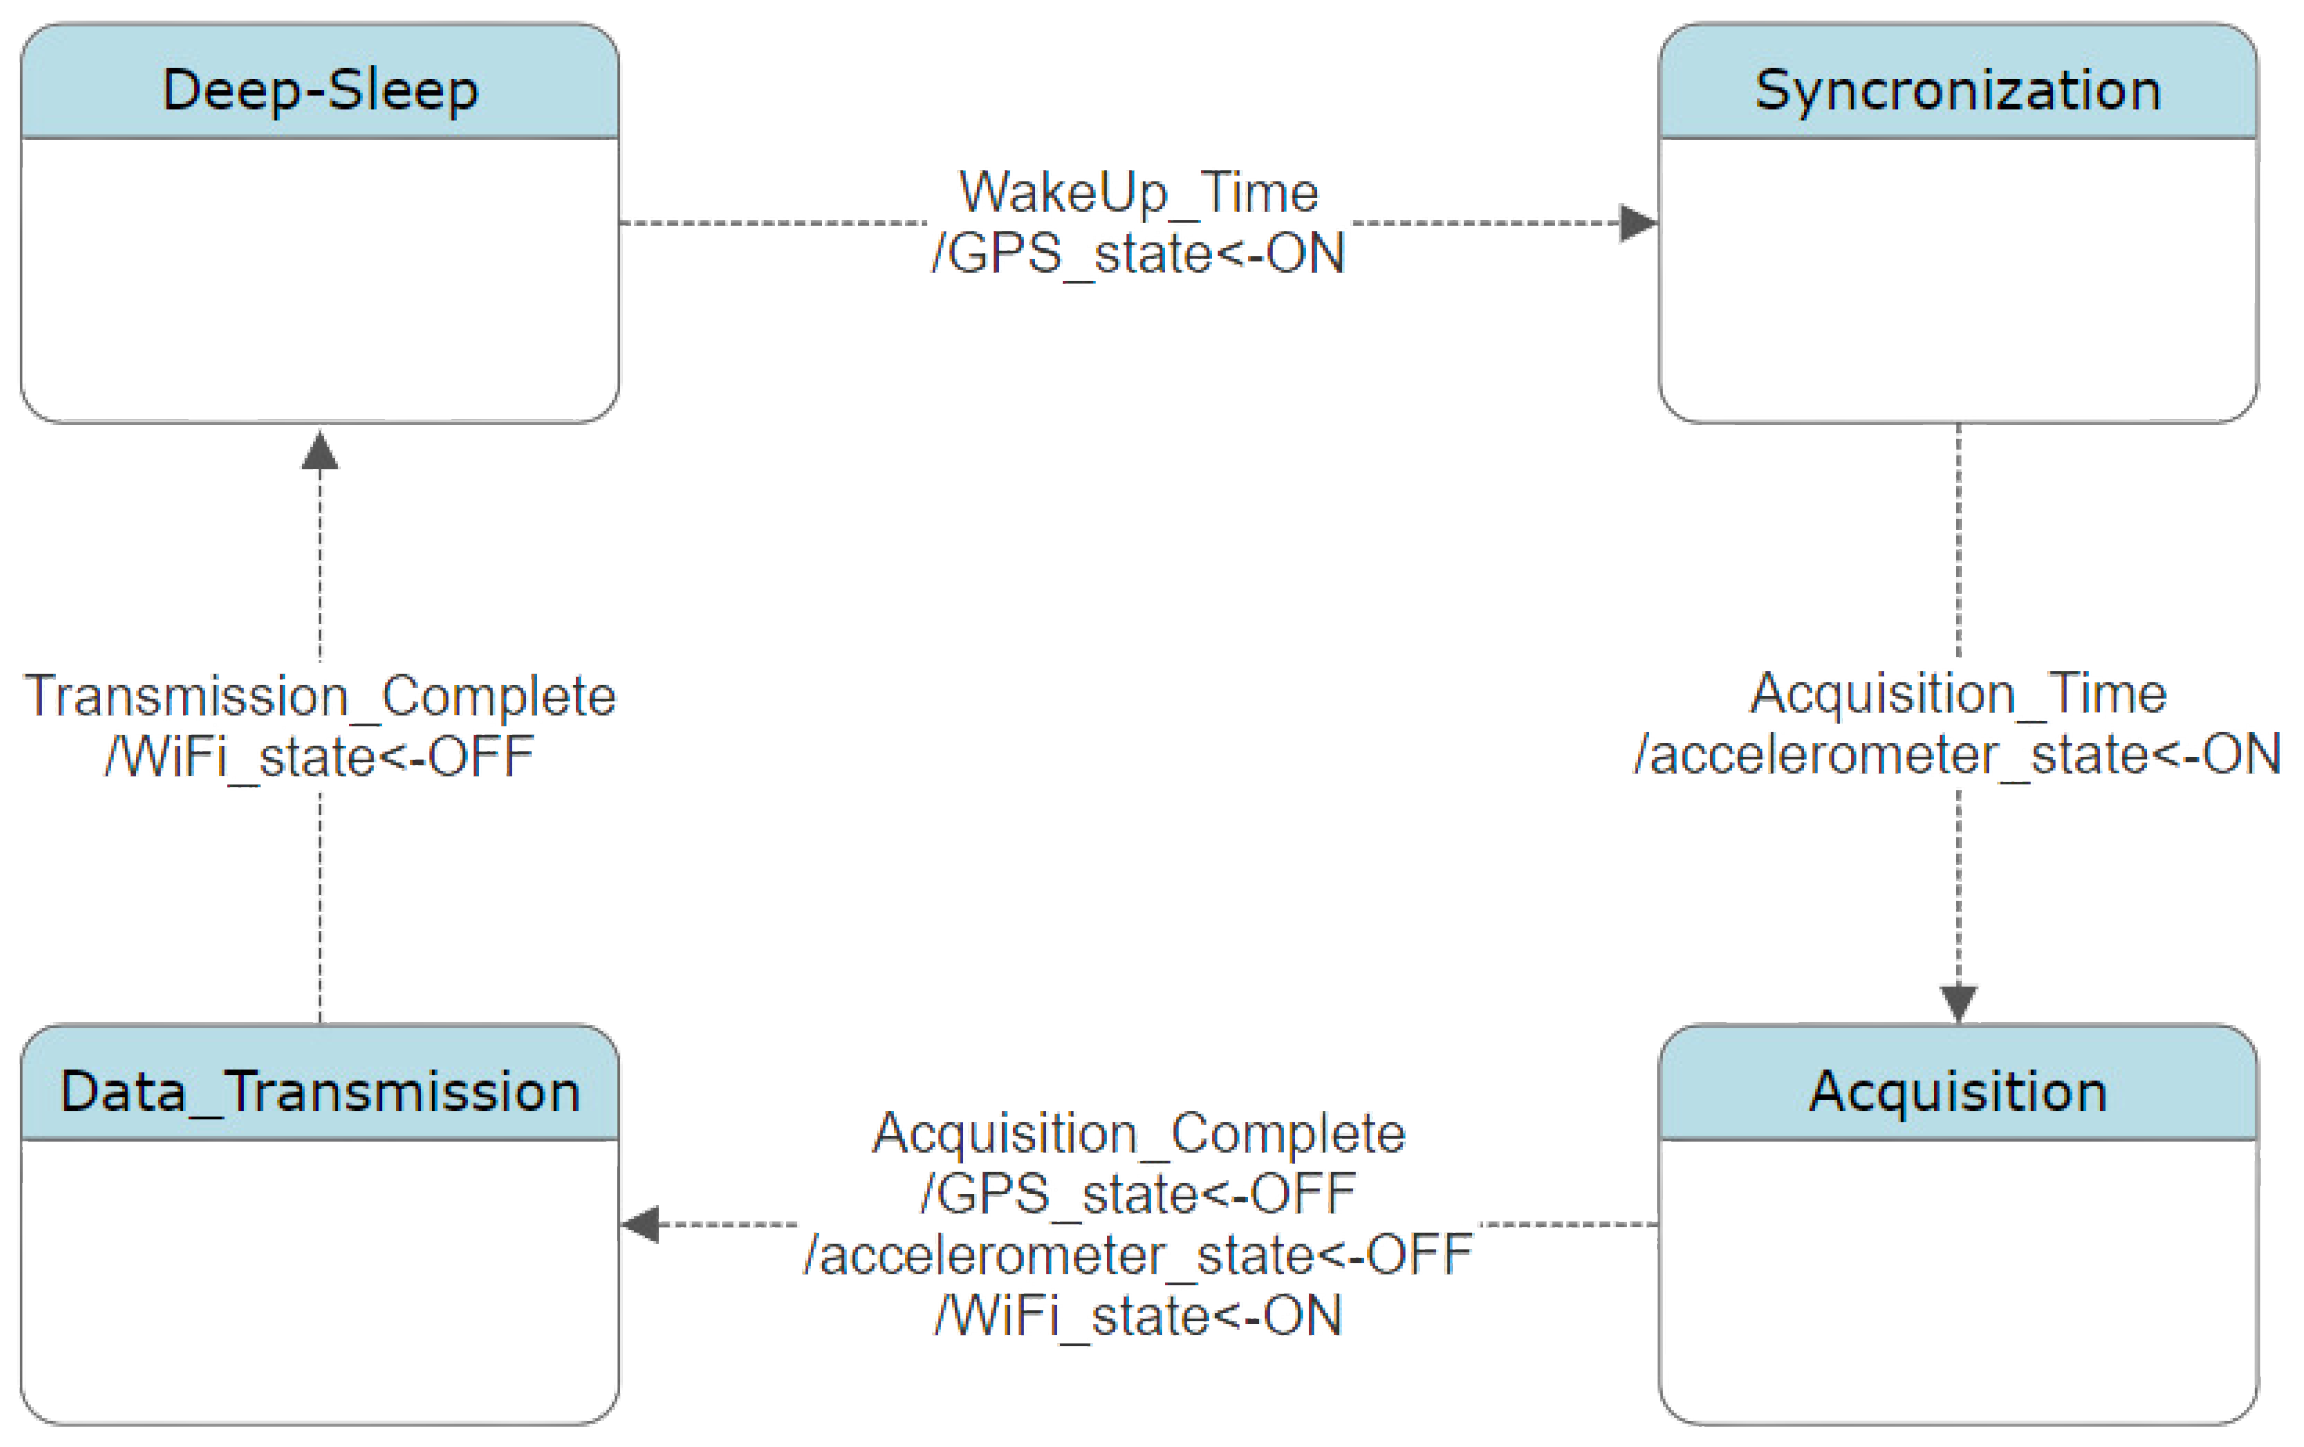
Before starting the data acquisition phase, each sensor node initiates the process by turning on its GNSS module. The node proceeds to establish a connection with the satellites to synchronize its internal clock and retrieve accurate time information. Once synchronized, the ESP32 wait for the scheduled time to trigger the start of the data gathering phase. This synchronization mechanism ensures coordinated data acquisition across the entire network.
During each activation period, sensor nodes engage in the collection of data and store it into the ESP32 memory. Following the completion of the one-hour acquisition period, sensor nodes switch to the data transmission phase, wherein collected data is sent to the central gateway.
Upon the conclusion of the sending phase, each sensor node transitions into a deep sleep mode, a low-power state optimized for energy conservation. In this mode, the node deactivates non-essential functions and enters a state of dormancy. The duration of the sleep period is predetermined by the node’s internal clock, calculated based on a fixed interval established within the system architecture.
Figure 2 gives a graphical representation of the evolution of the node state during the acquisition routine.
The segmentation of data acquisition and transmission into two discrete phases within the acquisition strategy is implemented to optimize energy utilization and operational efficiency. During the acquisition phase, sensor nodes performs data collection, with the Wi-Fi functionality temporarily deactivated to conserve energy. Then, during transmission phase, Wi-Fi is briefly activated to enable MQTT communication, while the GNSS and the accelerometer are turned off. The efficiency of the system hinges significantly on the transfer speed of this protocol, which allows the data sending duration to be in the order of few minutes.
The repeater node follows the same logic, but unlike the sensor nodes. it has only two states. The first one is the deep sleep mode and the other one is the hotspot generation. The switching between the two is dictated by the internal clock of the ESP32 and based on the current state of the network. Once the transmission process is completed for all nodes, the Raspberry Pi can undertake local data processing tasks and eventually transmit the processed data to the central server via FTP (File Transfer Protocol).
4. Laboratory Tests Results
In this section, the results achieved in terms of energy consumption and metrological accuracy are separately discussed.
4.1. Energy Management
Effective energy management is paramount to ensure a long-term reliability and sustainability of the monitoring system. With sensor nodes typically deployed in inaccessible locations, reliable power sources are essential for uninterrupted operation. Therefore, prioritizing energy management is crucial for achieving the long-term effectiveness of the sensors network. This section is aimed at presenting the testing activity carried out in order to asses the capability of the node to operate while keeping the battery level within a safe region. To devise an effective energy management strategy, it’s essential to start by estimating the power requirements for every state of the node. This involves analyzing the energy consumption patterns associated with each operational state: deep-sleep, synchronization, acquisition, and transmission. This analysis was done in the laboratory and the next paragraph presents the metodologies and the obained results.
The experimental setup used for this test is very simple and consists of a sensor node, a power supply and a multimeter to measure the current consumption. The power supply is set to be in constant voltage mode and provide
to the battery connector pins, while the multimeter is placed in series with the positive pole of the power supply. Finally the sensor node is programmed to follow the previously presented acquisition procedure. For each of the state, the current is measured and recorded; the obtained results are collected in
Table 1.
Given this information the energy consumption of the sensor node for one day of operation can be estimated with the following equation:
Where:
: Total energy consumed in one day.
: Power consumption for each operational state i.
: Time duration for each operational state i.
sl: Sleep mode.
sy: Synchronization phase.
ac: Data acquisition phase.
tr: Transmission phase.
Equation
1 give an important information to predict the evolution of the charge of the battery. Moreove, accurately estimating the energy consumed by the sensor node serves as a crucial factor in selecting the frequency of data acquisition throughout the day, ensuring that the battery remains operational without depletion. Dynamically adjusting the frequency of data acquisition based on estimated energy consumption becomes particularly pertinent during periods of limited solar energy availability, such as overcast days.
Following the laboratory tests, an on-field test was conducted to evaluate the sensor node’s performance in real-world conditions. During the field test, the sensor node collected data twice daily, with each data collection session lasting for 30 minutes. The sensor node was powered by a 4500mAh, 3.7V lithium-polymer (LiPo) battery and supplemented by a 6V (open circuit voltage) solar panel with a nominal output power of 1.1 W. Throughout the test period, the sensor node successfully transmitted collected data to a Raspberry Pi gateway. The node operated continuously for 50 days and at the conclusion of the test, the LiPo battery remained fully charged, demonstrating the effectiveness of the solar-powered setup in sustaining prolonged operation.
4.2. Metrological Verification
The second phase of testing aims to assess the precision and synchronization capabilities of the sensors. For this task two sensor nodes has been employed. This section will detail the methodologies employed and present the findings regarding these performance aspects.
4.2.1. Calibration Procedure
The first part of the analysis is dedicated to remove biases from the signals acquired from the accelerometers. The calibration procedure is fundamental beacause each sensor comes from the factory with slightly different caratheristic due to production toleraces. For this static analysis, the sensors are positioned with one axis perpendicular to the ground, and acceleration data from each axis is recorded. Signals from the axes parallel to the ground, which are expected to measure zero acceleration, are used to de-bias the accelerometers. Meanwhile, the vertical axis, expected to measure 1g of acceleration due to gravity, is utilized to determine the gain, allowing for the conversion of raw sensor data into units of g. The calibration involves rotating the sensor to align each axis sequentially with the vertical direction. All obtained values are summarized in
Table 2. This calibration procedure significantly enhances the reliability and accuracy of the sensor system, providing a robust foundation for subsequent data collection and analysis.
Given the previous derivation, if
is the acceleration data recorded in LSB from i-sensor and j-axis, in order to get the value for the acceleration in units of g the following equation has to be used.
4.2.2. Metrologic Certification
The accelerometer underwent metrological certification to validate its accuracy and ensure compliance with rigorous measurement standards. The test procedure involved applying a sinusoidal acceleration input of unknown amplitude at various frequencies. To evaluate the sensor’s performance, simultaneous measurements were conducted using a high-precision laser interferometer provided by the Istituto Nazionale di Ricerca Metrologica (INRIM). This reference device, traceable to internationally recognized metrological standards, served as the benchmark for comparison.
The acceleration data obtained from the tested sensor was compared against the INRIM laser measurements across a range of frequencies. Any deviations observed between the two sets of measurements were quantified, and computed in terms of percentage. This approach not only validated the sensor’s performance but also established a calibration framework that enhanced its reliability in practical applications.
Table 3 below reports some of the results obtained.
The process further demonstrated the accelerometer’s ability to produce results within an acceptable tolerance range, even at high frequencies where dynamic errors are more likely. By leveraging a certified metrological reference, the test confirmed that the device meets stringent requirements for precision, laying the foundation for its use in high-accuracy measurement environments.
4.2.3. Synchronization Tests
Synchronization Error Analysis Between Two Sensors
To quantify the synchronization error between two sensors, let us define the following variables:
: Time when the acquisition is triggered for Sensor 1.
: Time when the data is ready for Sensor 1.
: Time when the acquisition is triggered for Sensor 2.
: Time when the data is ready for Sensor 2.
The effective time of data acquisition for Sensor 1,
, lies within the interval
, while the effective time for Sensor 2,
, lies within
. The time difference between data acquisition for the two sensors is given by:
To compute the maximum synchronization error, we consider two main sources of uncertainty:
Dataset Analysis
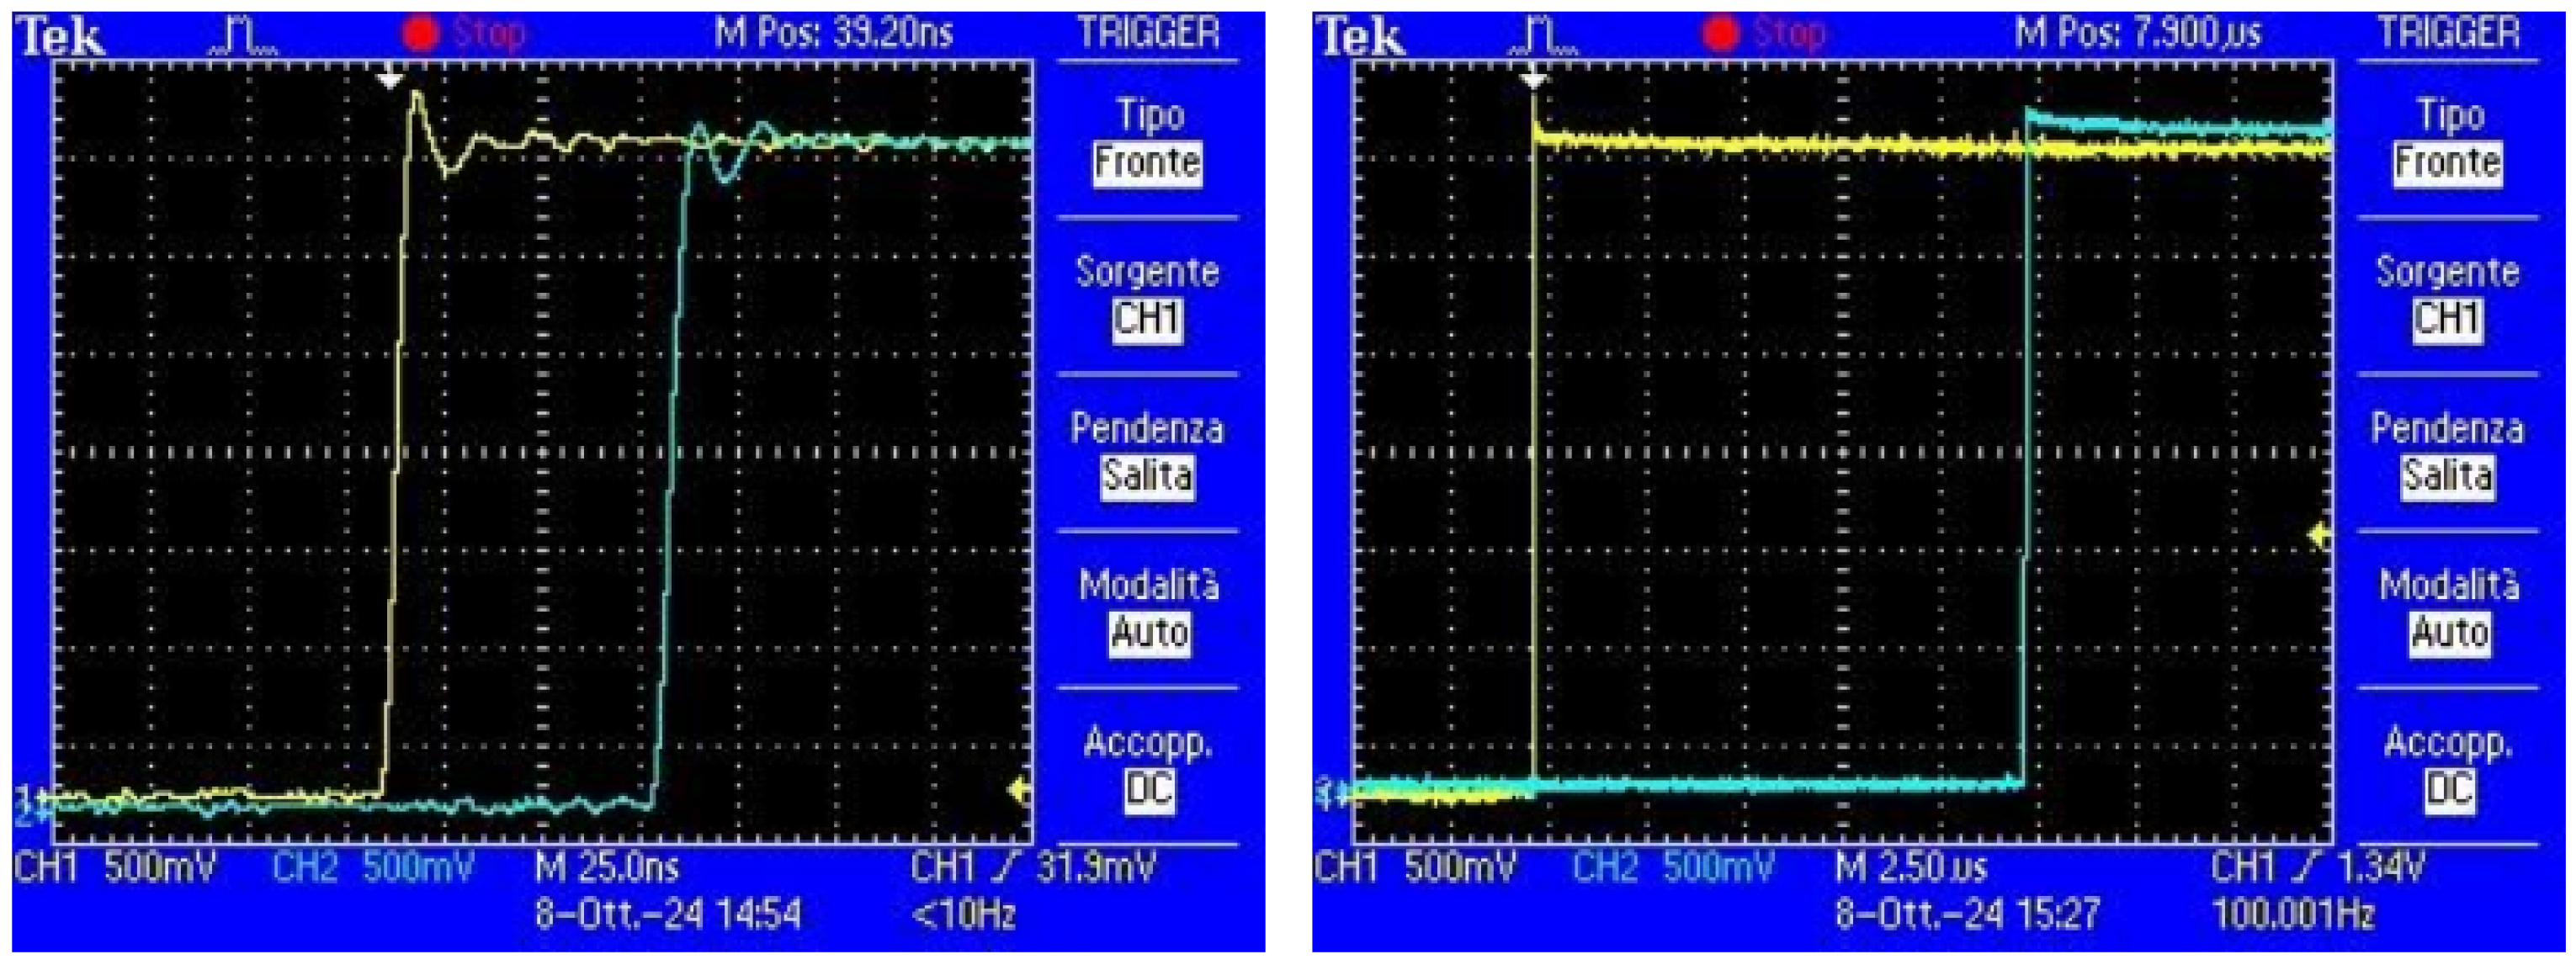
Two datasets are analyzed to compute the synchronization error:
The first dataset contains the time differences between trigger signals from different sensors.
The second dataset contains measurements of the time between a trigger signal and the corresponding "data ready" signal for one sensor.
Figure 3 illustrates examples from these datasets:
Synchronization Uncertainty and Variance Computation
From the first dataset, the synchronization uncertainty between trigger signals is computed as:
where the factor
accounts for the dataset measuring differences between two independent realizations of the trigger signal timing. From the second dataset, the mean (
) and variance (
) of the time between the trigger signal and the data-ready signal are extracted.
Maximum Synchronization Error
Combining the synchronization uncertainty and the data-ready delays, the worst-case synchronization error is given by:
Here:
: Mean value of the time to data readiness from the second dataset.
: Variance of the time differences between trigger signals from the first dataset.
: Variance of the time to data readiness from the second dataset.
Results
Using the datasets:
From the first dataset, the synchronization uncertainty () was calculated.
From the second dataset, the mean () and variance () of the data-ready delay were determined.
The computed maximum synchronization error is:
5. Results from on Fields Test
Finally, the sensor network has been tested on a real case-study and the acceleration collected were used to perform modal analysis on a bridge located near Florence in Italy.
5.1. Case Study
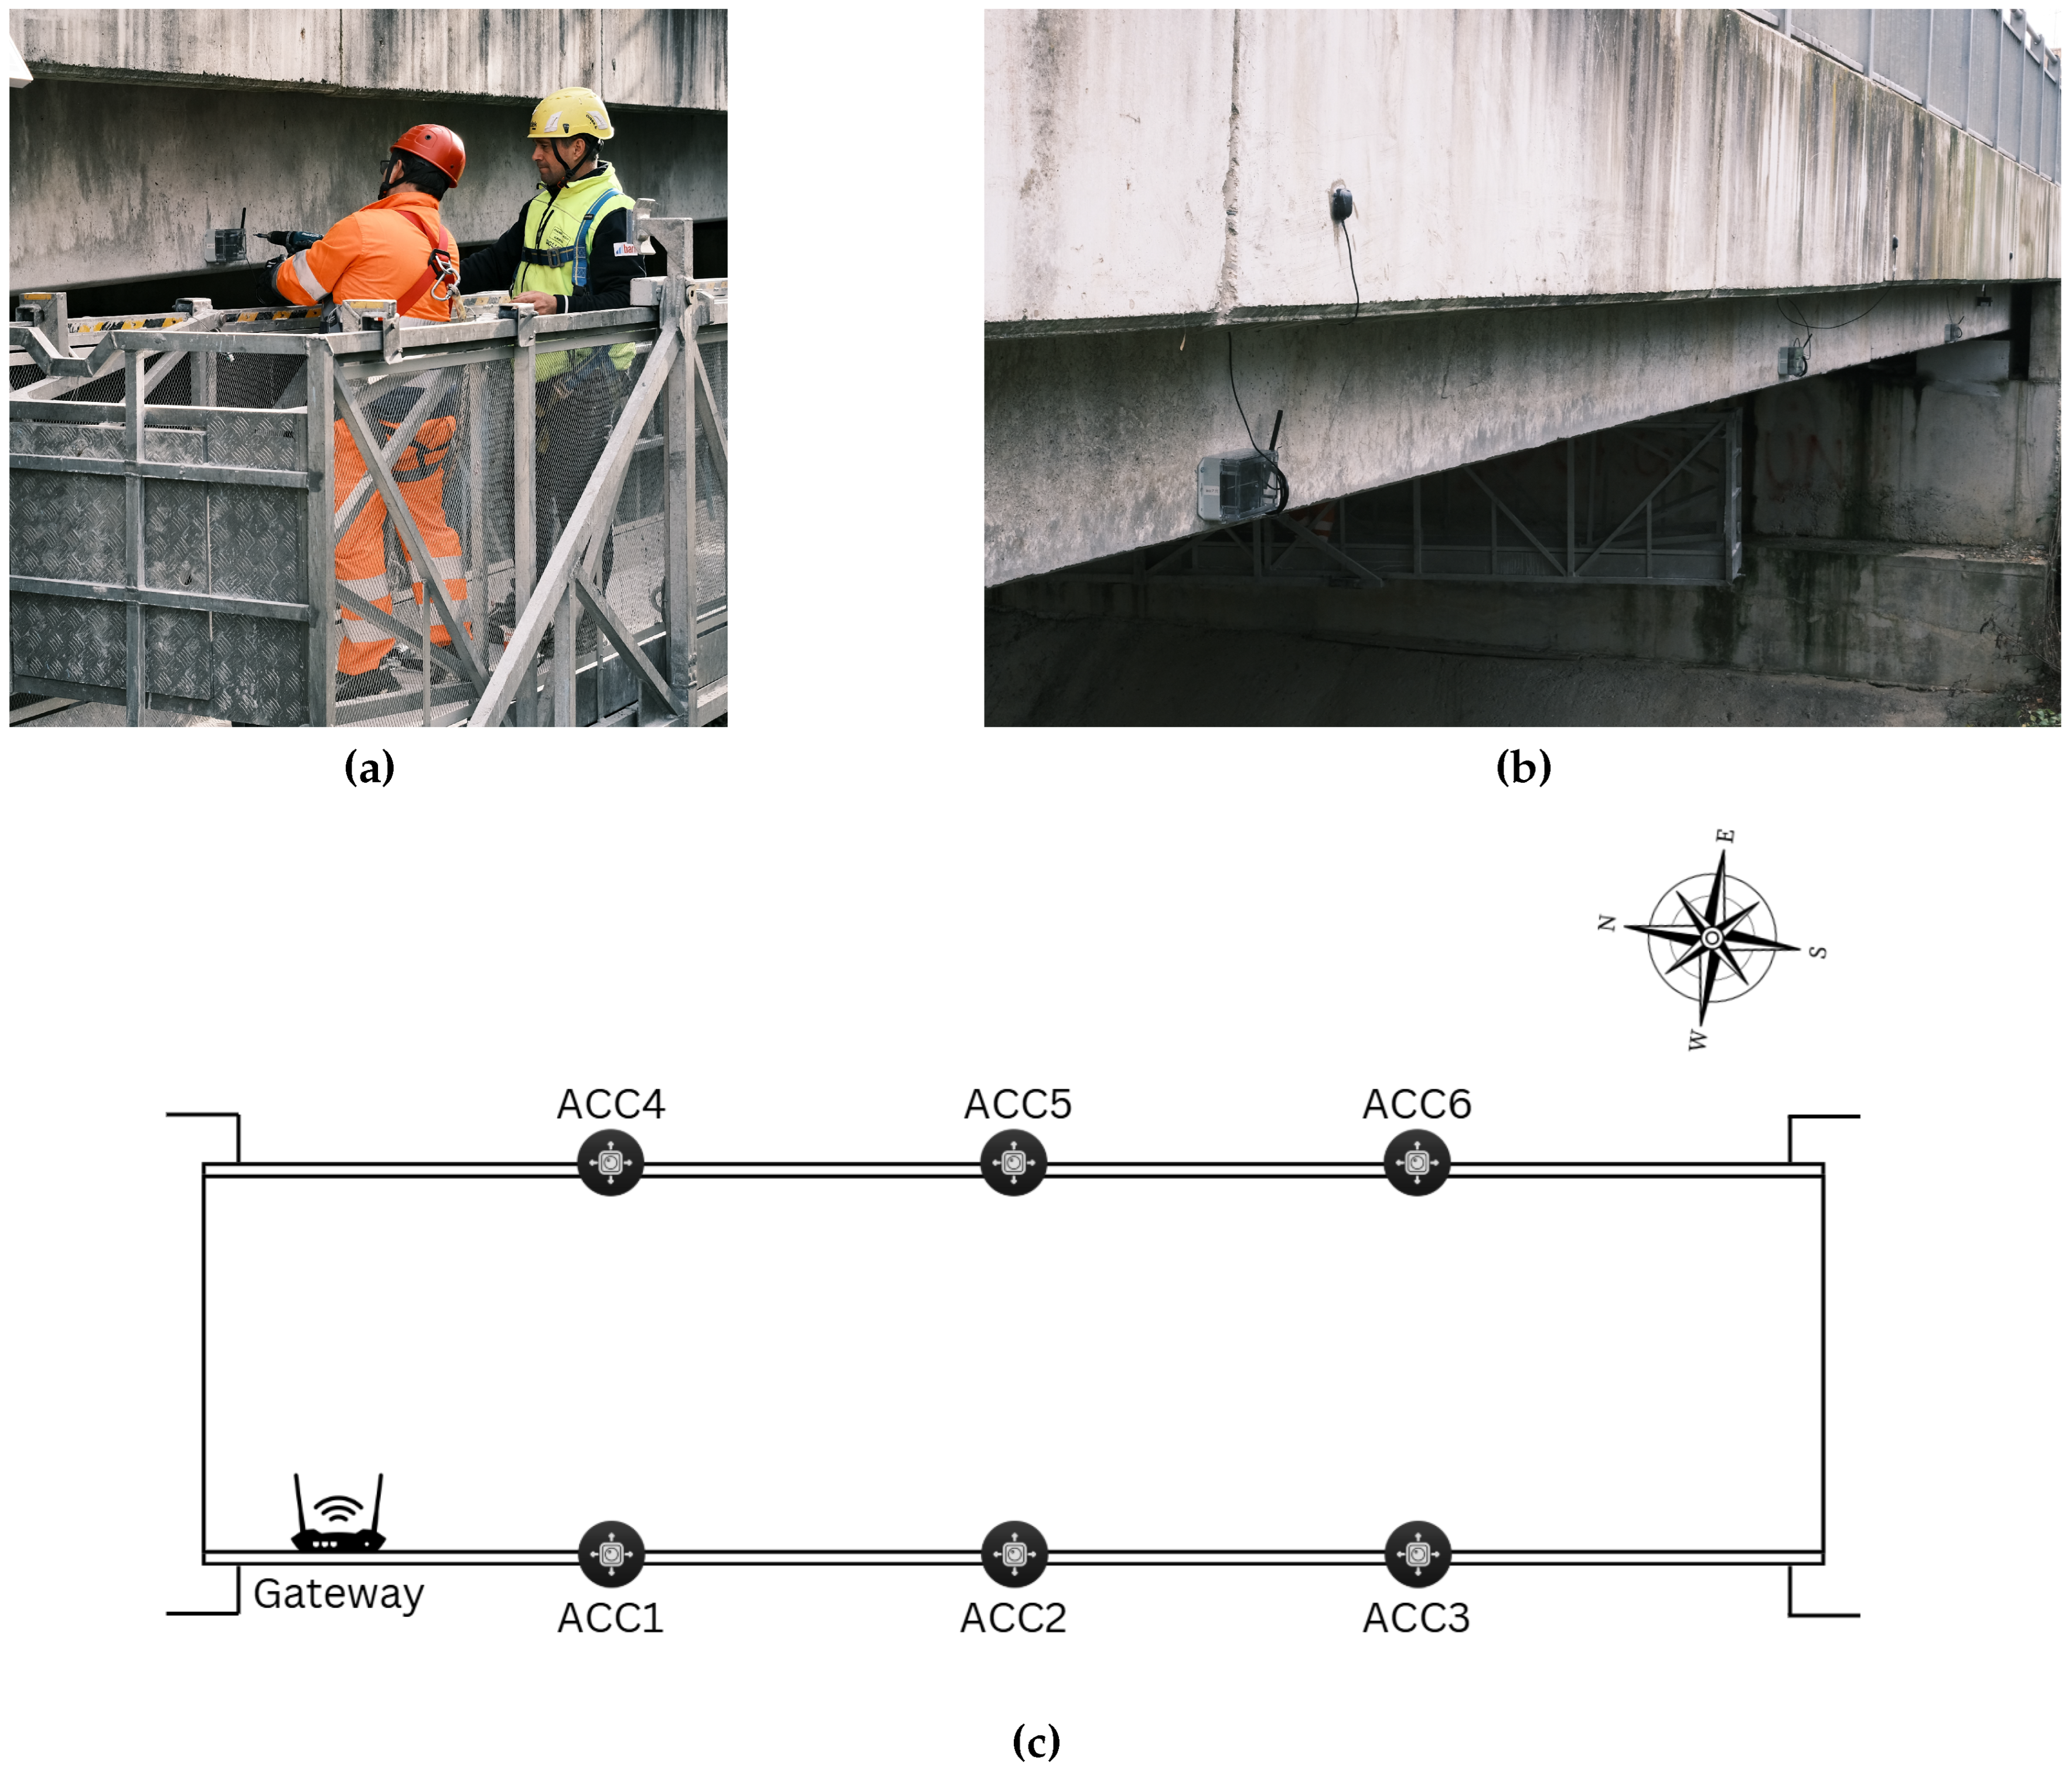
Wireless accelerometers were deployed on a road bridge near Florence, to monitor its structural integrity and dynamic behavior under operational conditions. The bridge, which spans 18.2 meters, was equipped with six sensors, strategically distributed to ensure comprehensive monitoring, with three placed on each side. One accelerometer was positioned at the central span, while the other two were installed at the quarter-span and three-quarter-span positions.
Figure 4 shows the mounting schema of the sensors along the bridge and some photos taken during the mounting operations.
The decision to use wireless accelerometers provided a significant advantage in terms of installation time and system scalability. The entire setup process was completed in just three hours, a stark contrast to the time-consuming and labor-intensive procedures required for traditional wired systems. Wired installations typically involve extensive cable routing, physical connections, and additional infrastructure to support data transmission, often requiring several days to complete. By eliminating the need for cables, the wireless system reduced not only the installation time but also the overall complexity of the process. This efficiency translates directly into cost savings, as it minimizes labor hours and reduces the need for specialized equipment or personnel.
5.2. Operational Modal Analysis
The Covariance-driven Stochastic Subspace Identification (SSI-COV) algorithm is a robust time-domain methodology employed for identifying modal parameters of engineering structures, particularly in output-only configurations. This algorithm is well-suited for applications where excitation forces are unknown, such as OMA of civil structures under ambient or operational vibrations [
23].
The SSI-COV algorithm is rooted in the stochastic state-space model, which represents the dynamics of the system as:
where
denotes the state vector at time k,
represents the measured output vector (e.g., accelerations or velocities), and
A and
C are the discrete state and output matrices, respectively. The terms
and
account for process noise and measurement noise, encapsulating uncertainties and disturbances inherent to the system.
Modal parameters are derived by decomposing the discrete state matrix
A, whose eigenvalues yield natural frequencies and damping ratios, while the eigenvectors of the output matrix
C provide the corresponding mode shapes. The effectiveness of SSI-COV depends on two key input parameters [
24]:
Model Order : A crucial parameter linked to the degrees of freedom in the system. This is typically set conservatively, often exceeding twice the expected number of modes in the analysis frequency range, to ensure all significant modes are captured.
Correlation Points
: Defined by the number of block rows in the Toeplitz covariance matrix, this parameter influences the stabilization diagram’s resolution. Its value is determined based on the sampling frequency
and lowest frequency of interest (
that corresponds to the first natural frequency of the bridge), using the following rules:
The SSI-COV algorithm has been successfully applied to the monitoring of road and railway bridges, utilizing minimal sensor configurations. The algorithm’s output was further refined through stabilization diagrams, where stable poles representing true physical modes were distinguished from spurious poles based on frequency, damping ratio, and mode shape consistency, by using the procedure described in [
25,
26].
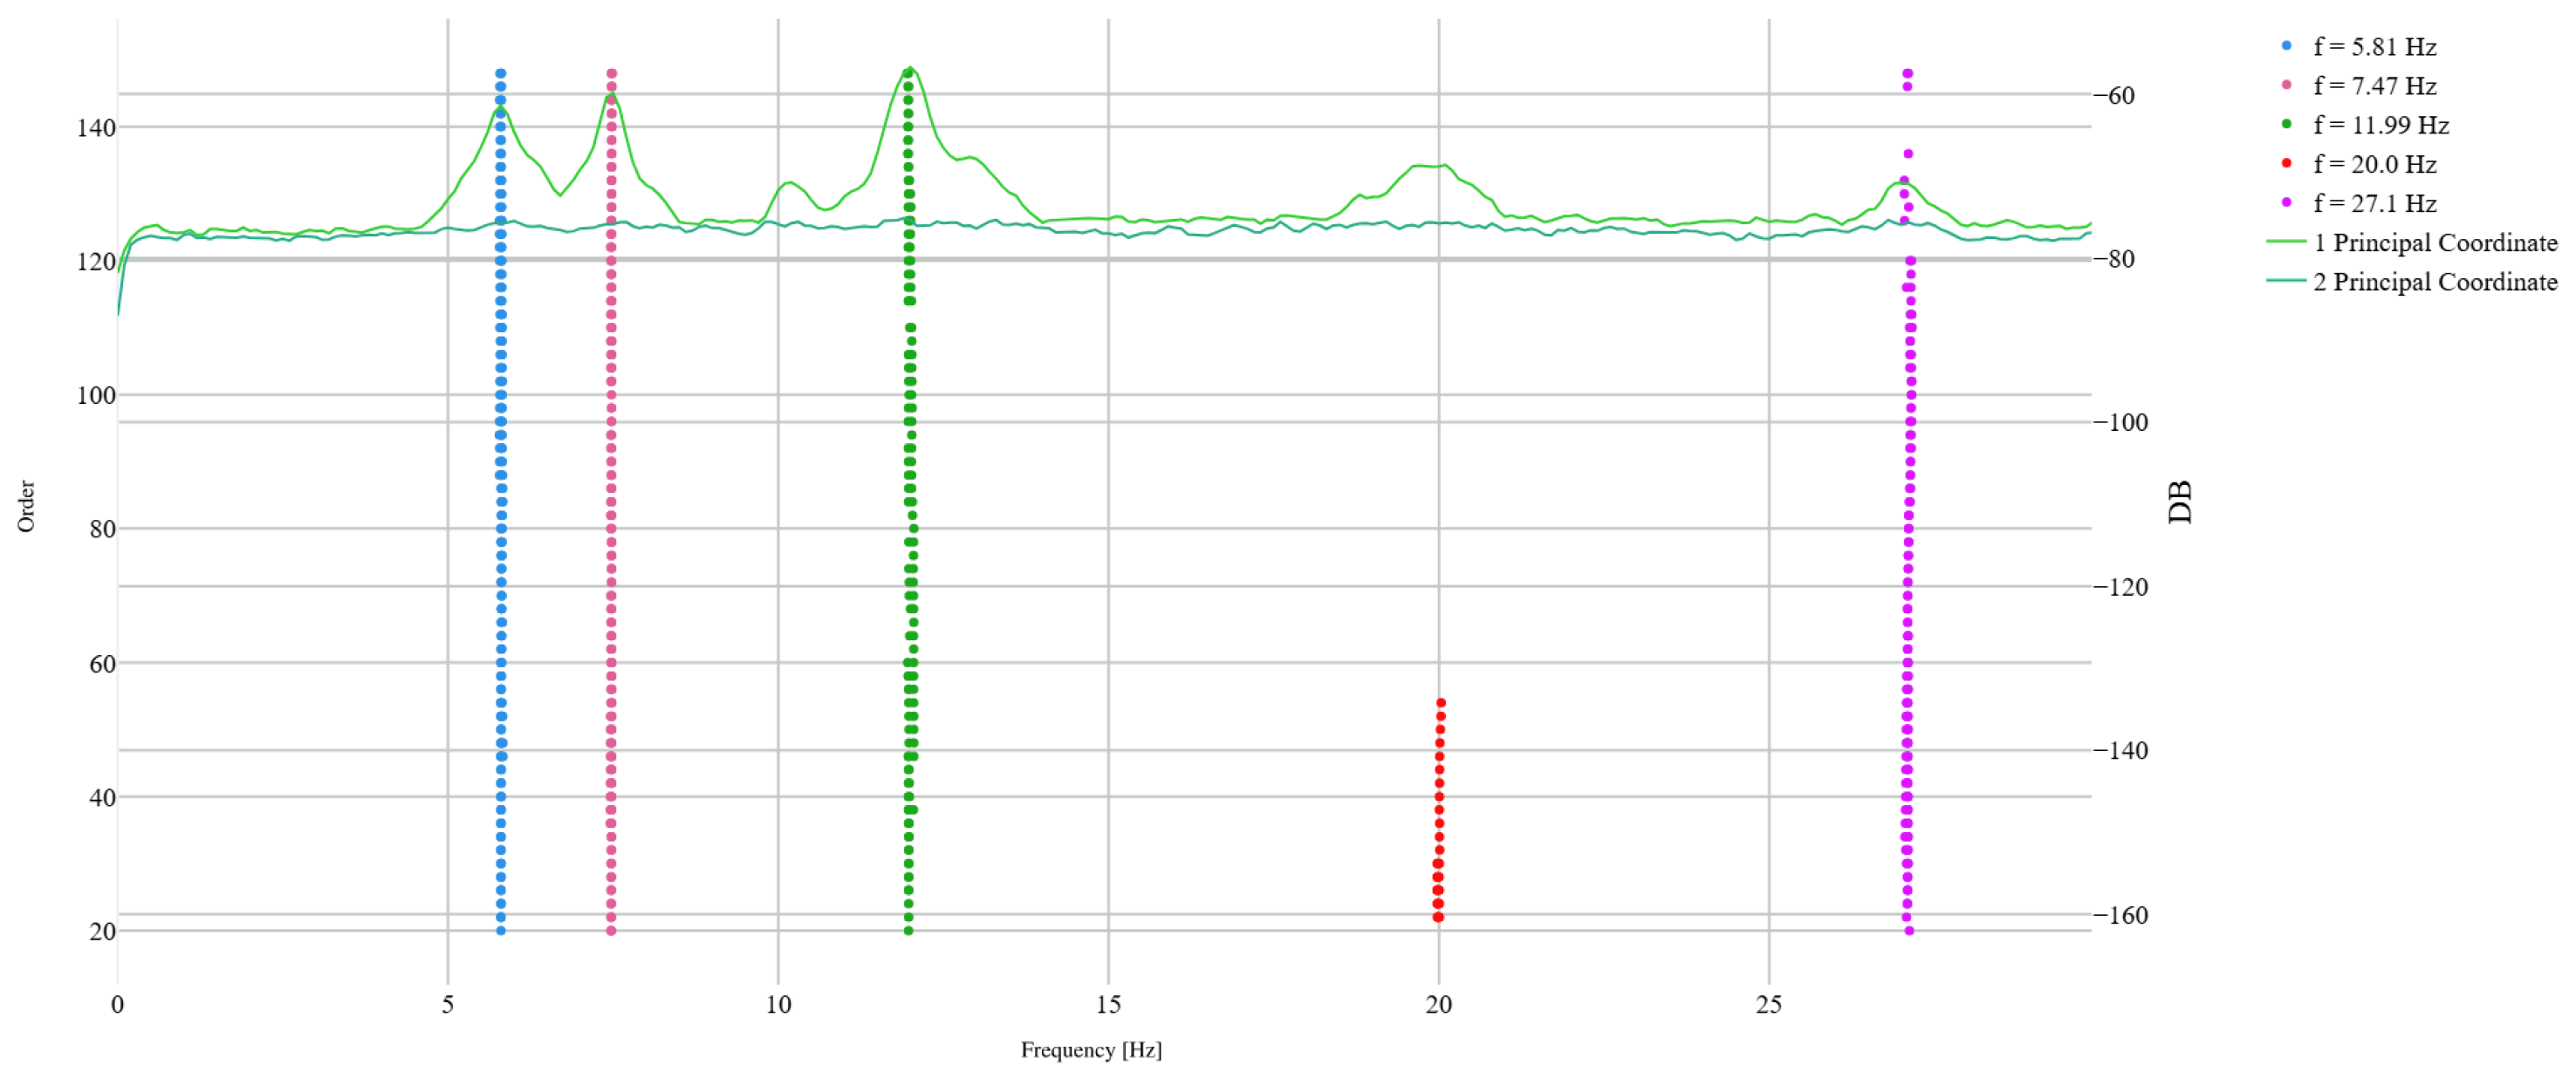
For the bridge under consideration, 100 Hz acquisition of 30 minutes for the six acceloremeters during the first acquisition day is considered for the SSI-COV analysis. Specifically, all sensors are treated as biaxial, disregarding the direction parallel to the longitudinal axis of the bridge. In this case, the parameter
n range from 20 to 150, increasing by a step of 2, while
i values ranges from 20 to 60, with step of 10. The resulting stability diagram, after removing non-physical poles and clustering the remaining ones, is shown in
Figure 5.
Additionally, in
Figure 5, the first two principal components of the Frequency Domain Decomposition (FDD) [
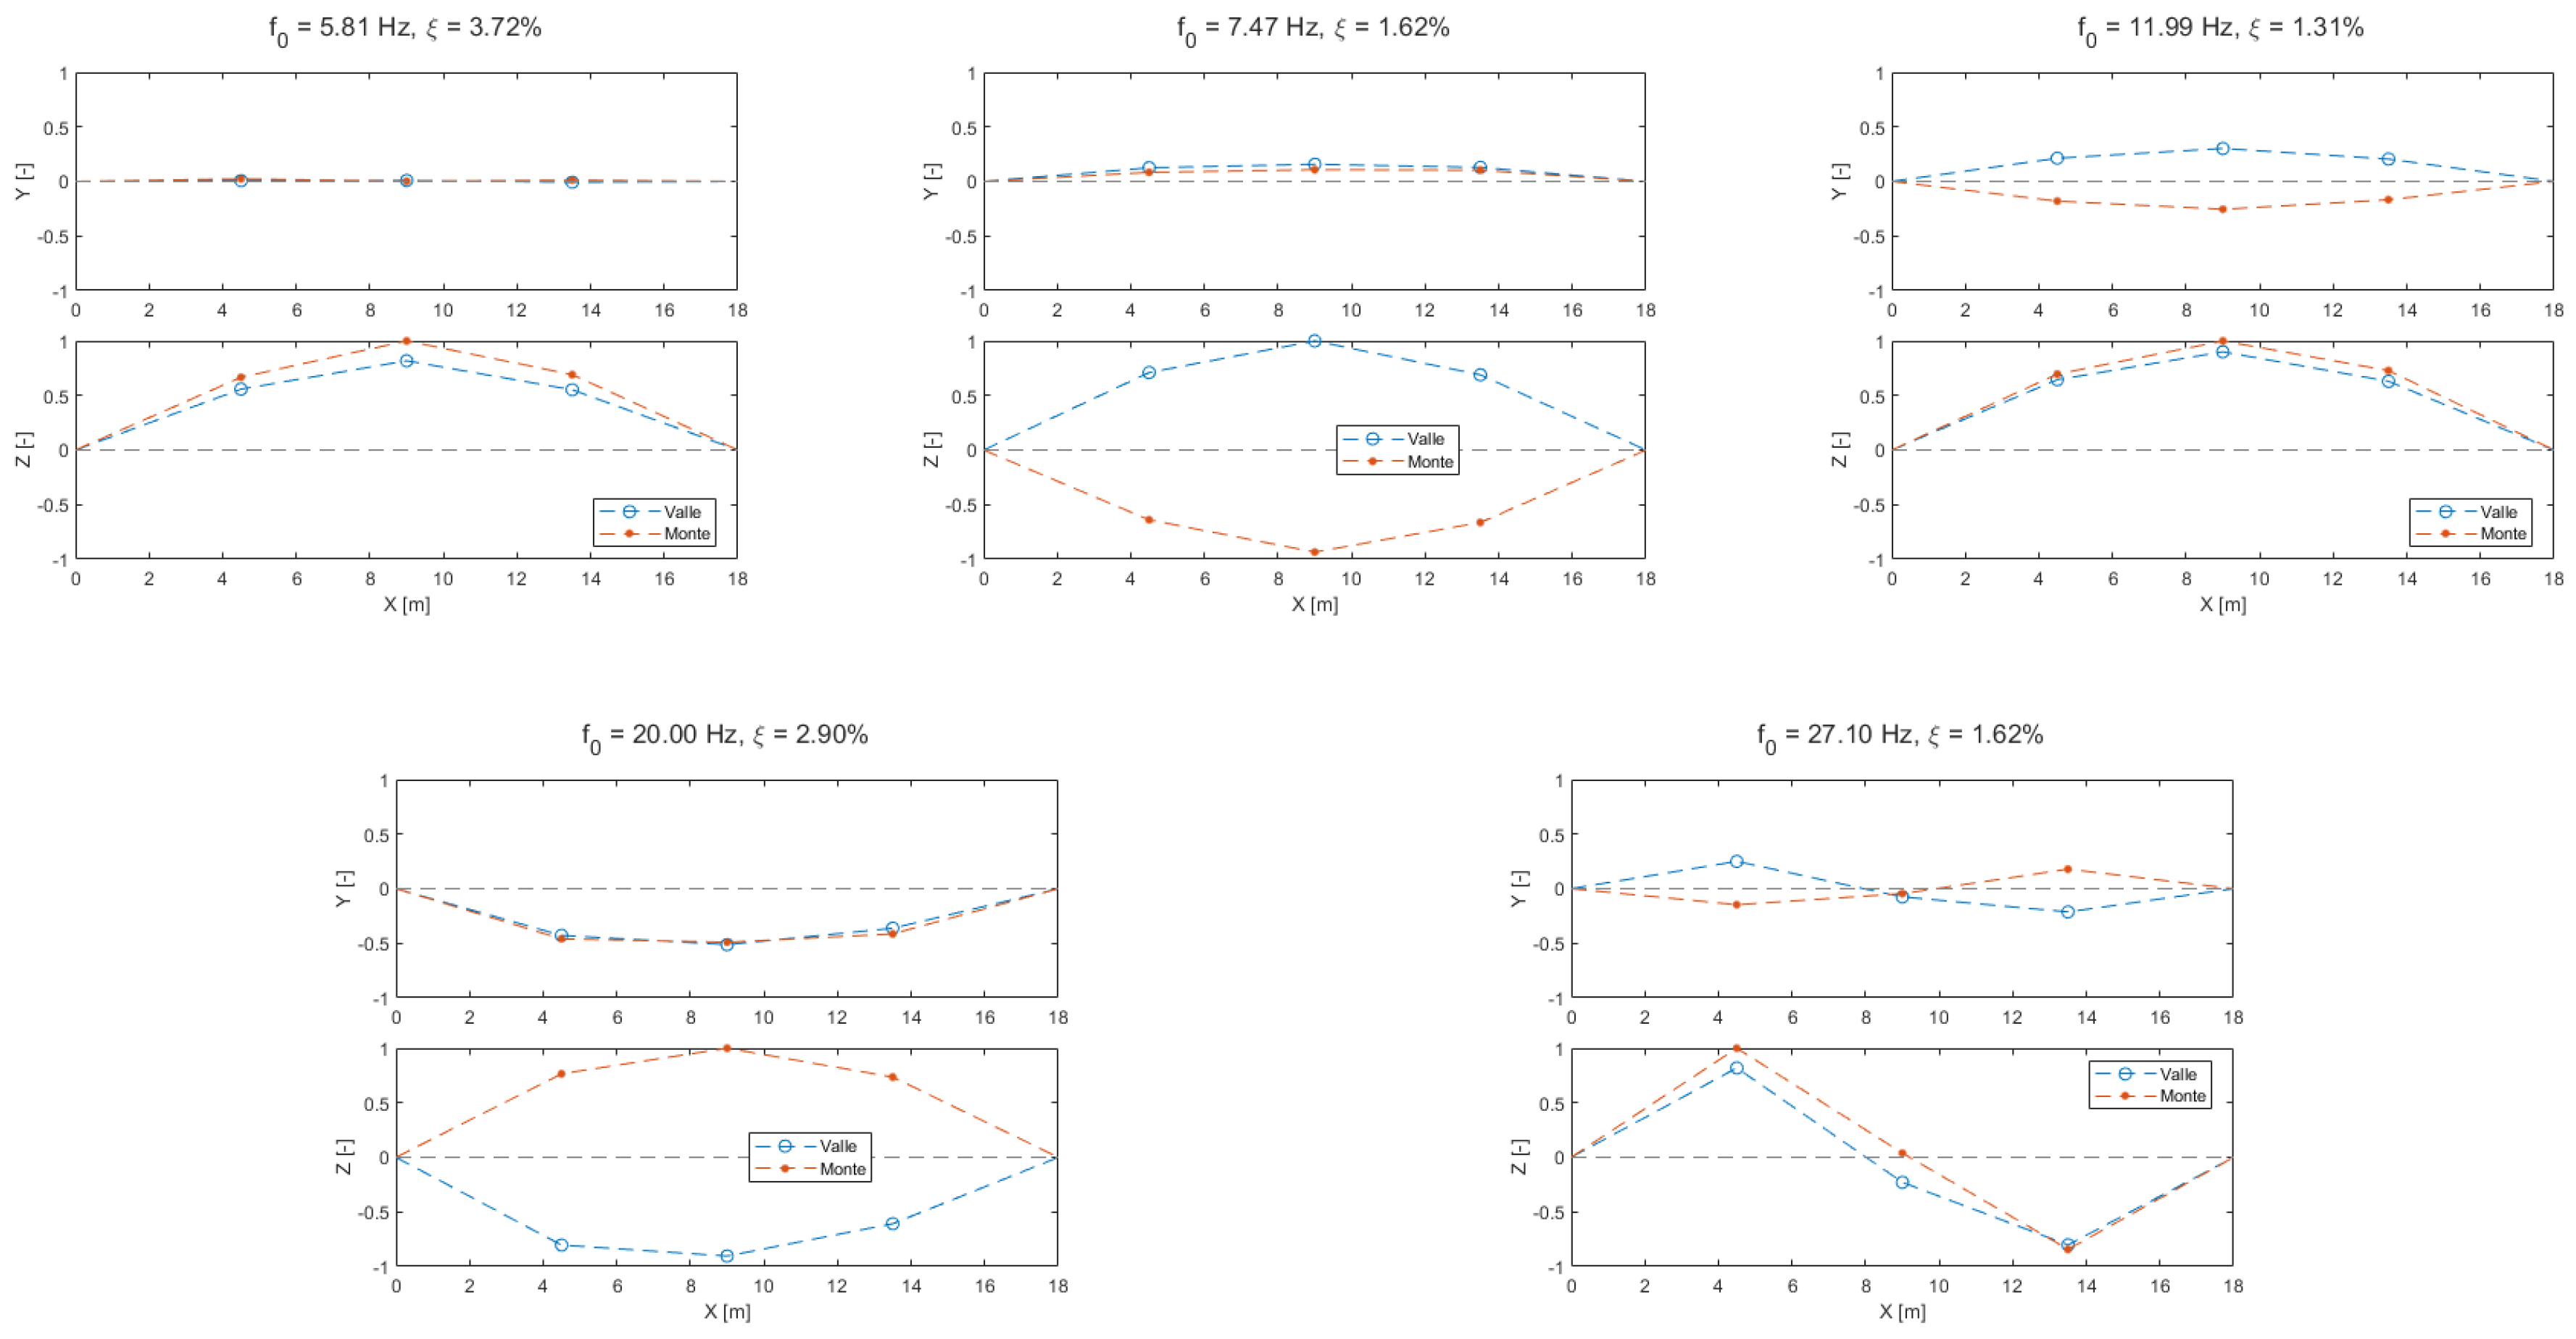
27] are represented to check the correctness of the SSI-COV estimation. In
Figure 6, the resulting mode shapes are represented.
6. Conclusions
This study demonstrates the development and validation of an MQTT-enabled, solar-powered wireless accelerometer network tailored for SHM of bridges. By addressing key challenges such as power autonomy, data synchronization, and sensor accuracy, the system offers a robust and sustainable alternative to traditional wired solutions. Laboratory tests highlighted the energy efficiency and precision of the proposed sensor nodes, while field deployment on an actual bridge confirmed their practical applicability and reliability.
The integration of advanced MEMS accelerometers, GNSS synchronization, and energy-efficient data transmission protocols underpins the system’s ability to deliver accurate and real-time structural insights. The successful field validation illustrates its potential to revolutionize SHM, offering a scalable, cost-effective, and environmentally friendly solution for long-term infrastructure monitoring. furthermore, the deployment successfully demonstrated the application of the SSICOV algorithm to extract natural frequencies, damping ratios, and mode shapes of the monitored structure. This validation underscores the system’s capability to not only gather high-quality data but also support advanced analytical techniques for in-depth structural assessments. This approach is particularly suited for bridges in high-traffic areas, where minimizing downtime during installation is critical. The successful installation not only highlights the benefits of wireless accelerometers but also sets a precedent for future applications in civil infrastructure monitoring.
Future work could explore broader applications in different infrastructure types, paving the way for smarter and more resilient civil infrastructure.
Author Contributions
Conceptualization, F.M.B., A.P. and L.R.; methodology, F.M.B., A.P. and F.C.D.; software, F.M.B.; validation, L.R., A.P., L.B. and F.C.D.; formal analysis, S.C., L.B. and M.B.; investigation, A.P., F.M.B.; resources, L.R., L.B., S.C., M.B.; data curation, A.P., L.R.; writing—original draft preparation, F.M.B. and A.P.; writing—review and editing,F.M.B. and A.P.; visualization, L.R. and L.B.; supervision, M.B, S.C., F.C.D.; project administration, L.R., F.M.B. and L.B.; funding acquisition, L.B. All authors have read and agreed to the published version of the manuscript.
Funding
This research was funded by Displaid s.r.l. Società Benefit.
Institutional Review Board Statement
Not applicable.
Informed Consent Statement
Not applicable.
Data Availability Statement
Data are unavailable due to privacy.
Conflicts of Interest
The authors declare no conflict of interest.
Abbreviations
The following abbreviations are used in this manuscript:
| WSN |
Wireless Sensors Network |
| MQTT |
Message Queuing Telemetry Transport |
| OMA |
Operational Modal Analysis |
| GNSS |
Global Navigation Satellite System |
| PCB |
Printed Circuit Board |
| SSI-COV |
Covariance-Driven Stochastic Subspace Identification |
| FDD |
Frequency Domain Decomposition |
References
- Román, Á.F.G.; Khan, M.S.A.; Kabir, G.; Billah, M.; Dutta, S. Evaluation of interaction between bridge infrastructure resilience factors against seismic hazard. Sustainability 2022, 14, 10277. [Google Scholar] [CrossRef]
- Guettala, A.; Abibsi, A. Corrosion degradation and repair of a concrete bridge. Materials and structures 2006, 39, 471–478. [Google Scholar] [CrossRef]
- Biondini, F.; Frangopol, D.M. Life-Cycle Performance of Deteriorating Structural Systems under Uncertainty: Review. Journal of Structural Engineering 2016, 142, F4016001. [Google Scholar] [CrossRef]
- Zhang, G.; Liu, Y.; Liu, J.; Lan, S.; Yang, J. Causes and statistical characteristics of bridge failures: A review. Journal of traffic and transportation engineering (English edition) 2022. [Google Scholar] [CrossRef]
- Nasr, A.; Björnsson, I.; Honfi, D.; Ivanov, O.L.; Johansson, J.; Kjellström, E. A review of the potential impacts of climate change on the safety and performance of bridges. Sustainable and Resilient Infrastructure 2021, 6, 192–212. [Google Scholar] [CrossRef]
- Malomo, D.; Scattarreggia, N.; Orgnoni, A.; Pinho, R.; Moratti, M.; Calvi, G.M. Numerical study on the collapse of the Morandi bridge. Journal of performance of constructed facilities 2020, 34, 04020044. [Google Scholar] [CrossRef]
- Bono, F.M.; Radicioni, L.; Cinquemani, S.; Benedetti, L.; Cazzulani, G.; Somaschini, C.; Belloli, M. A Deep Learning Approach to Detect Failures in Bridges Based on the Coherence of Signals. Future Internet 2023, 15, 119. [Google Scholar] [CrossRef]
- Gentile, C.; Saisi, A. Ambient vibration testing and condition assessment of the Paderno iron arch bridge (1889). Construction and Building Materials 2011, 25, 3709–3720. [Google Scholar] [CrossRef]
- AbdelRaheem, M.; Hassan, M.; Mohammed, U.S.; Nassr, A.A. Design and implementation of a synchronized IoT-based structural health monitoring system. Internet of Things 2022, 20, 100639. [Google Scholar] [CrossRef]
- Yu, X.; Fu, Y.; Li, J.; Mao, J.; Hoang, T.; Wang, H. Recent advances in wireless sensor networks for structural health monitoring of civil infrastructure. Journal of Infrastructure Intelligence and Resilience 2024, 3, 100066. [Google Scholar] [CrossRef]
- Zanelli, F.; Debattisti, N.; Mauri, M.; Argentino, A.; Belloli, M. Development and Field Validation of Wireless Sensors for Railway Bridge Modal Identification. Applied Sciences 2023, 13, 3620. [Google Scholar] [CrossRef]
- Zhang, G.; Moutinho, C.; Magalhães, F. Continuous dynamic monitoring of a large-span arch bridge with wireless nodes based on MEMS accelerometers. Structural Control and Health Monitoring 2022, 29, e2963. [Google Scholar] [CrossRef]
- Kustiana, W.A.A.; Trilaksono, B.R.; Riyansyah, M.; Putra, S.A.; Caesarendra, W.; Królczyk, G.; Sulowicz, M. Bridge Damage Detection with Support Vector Machine in Accelerometer-Based Wireless Sensor Network. Journal of Vibration Engineering & Technologies 2024, 1–20. [Google Scholar]
- Pineda, J.; Torres, R.; Torres, H. Design of a low power consumption wireless sensor network for structural monitoring of bridges. IOP Conference Series: Earth and Environmental Science 2024, 1370, 012004. [Google Scholar] [CrossRef]
- Hasani, H.; Freddi, F.; Piazza, R.; Ceruffi, F. A Wireless Data Acquisition System Based on MEMS Accelerometers for Operational Modal Analysis of Bridges. Sensors 2024, 24, 2121. [Google Scholar] [CrossRef] [PubMed]
- Evans, J.; Allen, R.M.; Chung, A.; Cochran, E.; Guy, R.; Hellweg, M.; Lawrence, J. Performance of several low-cost accelerometers. Seismological Research Letters 2014, 85, 147–158. [Google Scholar] [CrossRef]
- Cigada, A.; Lurati, M.; Redaelli, M.; Vanali, M. Evaluation of the metrological performances of MEMS accelerometers to the aim of their application in Structural Health Monitoring. Proceedings of the Conference and Exposition on Structural Dynamics 2008. [Google Scholar]
- Ehlali, S.; Sayah, A. Towards improved lifespan for wireless sensor networks: a review of energy harvesting technologies and strategies. European Journal of Electrical Engineering and Computer Science 2022, 6, 32–38. [Google Scholar] [CrossRef]
- Shaikh, F.K.; Zeadally, S. Energy harvesting in wireless sensor networks: A comprehensive review. Renewable and Sustainable Energy Reviews 2016, 55, 1041–1054. [Google Scholar] [CrossRef]
- Navia, M.; Campelo, J.; Bonastre, A.; Ors, R.; Capella, J. Drift clock analysis on distributed embedded systems for IoT applications. In Proceedings of the Workshop on Innovation on Information and Communication Technologies (ITACA-WIICT 2016), Valencia, Spain, 2016; pp. 42–49. [Google Scholar]
- Tirado-Andrés, F.; Araujo, A. Performance of clock sources and their influence on time synchronization in wireless sensor networks. International Journal of Distributed Sensor Networks 2019, 15, 1550147719879372. [Google Scholar] [CrossRef]
- Magalhães, F.; Cunha, A.; Caetano, E. Vibration based structural health monitoring of an arch bridge: From automated OMA to damage detection. Mechanical Systems and Signal Processing 2012, 28, 212–228, Interdisciplinary and Integration Aspects in Structural Health Monitoring. [Google Scholar] [CrossRef]
- Magalhães, F.; Cunha, Á.; Caetano, E. Online automatic identification of the modal parameters of a long span arch bridge. Mechanical Systems and Signal Processing 2009, 23, 316–329. [Google Scholar] [CrossRef]
- García-Macías, E.; Ubertini, F. MOVA/MOSS: Two integrated software solutions for comprehensive Structural Health Monitoring of structures. Mechanical Systems and Signal Processing 2020, 143, 106830. [Google Scholar] [CrossRef]
- Argentino, A.; Bono, F.M.; Bernardini, L.; Romano, N.; Cazzulani, G.; Somaschini, C.; Belloli, M.; Cinquemani, S. Automated OMA Through SSI-COV Algorithm of a Warren Truss Railway Bridge Exploiting Free Decay Response. In Proceedings of the 10th International Operational Modal Analysis Conference (IOMAC 2024); Rainieri, C., Gentile, C., Aenlle López, M., Eds.; Springer Nature Switzerland: Cham, 2024; pp. 600–608. [Google Scholar]
- Bono, F.M.; Bernardini, L.; Argentino, A.; Anghileri, M.; Capacci, L.; Cazzulani, G.; Somaschini, C.; Biondini, F.; Belloli, M. OMA Applied to a Reinforced Concrete Railway Bridge Through a Reduced Measurement Set-Up. In Proceedings of the 10th International Operational Modal Analysis Conference (IOMAC 2024); Rainieri, C., Gentile, C., Aenlle López, M., Eds.; Springer Nature Switzerland: Cham, 2024; pp. 548–559. [Google Scholar]
- Brincker, R.; Zhang, L.; Andersen, P. Modal identification of output-only systems using frequency domain decomposition. Smart materials and structures 2001, 10, 441. [Google Scholar] [CrossRef]
|
Disclaimer/Publisher’s Note: The statements, opinions and data contained in all publications are solely those of the individual author(s) and contributor(s) and not of MDPI and/or the editor(s). MDPI and/or the editor(s) disclaim responsibility for any injury to people or property resulting from any ideas, methods, instructions or products referred to in the content. |
© 2024 by the authors. Licensee MDPI, Basel, Switzerland. This article is an open access article distributed under the terms and conditions of the Creative Commons Attribution (CC BY) license (http://creativecommons.org/licenses/by/4.0/).
