Submitted:
09 December 2024
Posted:
09 December 2024
You are already at the latest version
Abstract
Keywords:
1. Introduction
1.3. Research Aims
2. Materials and Methods
2.1. Research Methodology
- The first conference day's duration is 9:00 a.m. - 10:00 a.m. to 7:00 p.m.
- II. conference day duration: 6 hours - from 10.00 a.m. to 4.00 p.m.
- Total duration of the conference: 15 hours
- I. Conference day: 3-course lunch and dinner with accompanying pickles, two program breaks (duration of breaks: 15 minutes)
- II. conference day: 3-course lunch, two program breaks (duration of breaks: 15 minutes)
2.2. Life Cycle Inventory
- Number of participants
- Travel distance, travel method
- Energy consumption for the organisation and running of the event (2 days – 15 hours duration of electricity consumption, lighting, electricity consumption of IT devices)
- Registration package
- Catering (buffet service twice a day) – tea, orange juice, potato chips, oranges, sugar
- Meals - 1st day: lunch + dinner, 2nd day: only lunch
- Travel methods and kilometres travelled
- Water consumption, paper towel consumption (when using the toilet)
- Amount of municipal solid waste and wastewater generated
- 2-page program booklet (2 pieces of A4 size kraft paper, with black ink cartridge, total: 8 g)
- Globe-shaped stress ball made of eco-rubber, weight: 61 g/pc
- Conference folder: a document folder made of recycled paper with a 20-page notepad, a ballpoint pen covered with recycled paper and self-adhesive marking (post-it) labels
- Paper bag with ribbon flaps made of recycled paper (size: 22x28 + 10 cm)
- Wooden wine cup with glass insert and copper conference logo
2.3. Life Cycle Impact Assessment
- CML 2016/Non-baseline, excluding biogenic carbon
- IPCC AR6 GWP 100, excluding biogenic carbon (version Aug. 2021)
- ISO 14067 GWP 100
2.4. System Boundary
3. Results
3.1. Energy Consumption and Waste Generation for Conference Dishes
3.2. Energy Consumption for Catering Service
3.3. Energy Consumption for Conference Organisation
- classroom lighting in a classroom of 20 students by neon tube 6 times during discussions: 6x1 hour.
- correspondence: 1-2 hours of computer use over 60 working days, total: 60x1.5 hours = 90 hours
- website editing: 5 working days in 8 hours: 40 hours of computer use = 40 h x 0.08 kW = 3.2 kWh
- correspondence: 1.5 h/day x 60 days = 130 hours = 10.4 kWh
- laptop consumption per hour: 0.08 kW (80 W)
- classroom lighting (20 people) per hour, 40 sq.m
- neon tube: 10 pcs
- consumption of 1 neon tube: 36 W/h = 0.036 kWh, 10 360 W/h = 0.36 kWh x 6 times = 2.16 kWh
- total energy consumption: 15.78 kWh = 56.736 MJ
3.4. Energy and water consumption for in-person conference
- Providing technical background during the conference:
- equipment: laptop, projector, lighting
- laptop consumption per hour: 0.08 kWh (80 W)
- for 15 hours: 1.2 kWh
- projector consumption per hour: 0.08 kWh (80 W)
- for 3 p.m.: 1.2 kWh
- 15 hours of lighting in 1 large auditorium (200 people) /conf. day
- consumption of 1 neon tube: 36 W/h = 0.036 kWh
- for 68 neon tubes for 1 hour = 2,448 kWh
- for 68 neon tubes for 15 hours = 36.72 kWh
- for 15 hours: 39.12 kWh = 140,862 MJ
- total electricity consumption: 54.9 kWh = 197.64 MJ
- Bathroom use during the conference:
- 2 sessions/person/day, 400 sessions/day, 800 sessions/conference. Water consumption/occasion: 3 kg/occasion. 2400 kg of water for tank flushing.
- handwashing: 1 l/occasion, i.e. 800 kg of tap water/conference.
- handwashing: 800 times/ 2 paper towels, total: 1600 paper sheets, 11 packs of folded hand towel sheets (1 pack: 150 sheets), 1650 sheets in total, weight of 1 sheet: 1 g, 1650 g/conf., 1.65 kg
- toilet paper: 600 times 1200 pieces of paper, 8 packs of paper, 1200 g, 1.2 kg
- paper waste: 1.2 kg
- 1 g liquid. soap: 1,600 drops/2 days/200 people. 1.6 kg of soap
- waste water: tank flushing + hand washing: 3200 kg for 2 days for 800 people
- paper waste: 1.65 kg
3.5. Energy and water consumption for online conference
- Provision of technical background:
- tools: laptop
- laptop consumption per hour: 0.08 kWh (80 W)
- for 15 hours: 1.2 kWh
- 15 hours of lighting in 1 room by an LED bulb
- consumption of 1 x 60 W LED bulb: 9 W = 0.009 kWh
- for 15 hours: 0.035 kWh = 0.486 MJ
- total electricity consumption: 61,542 MJ
- Toilet use at home:
- 2 sessions/person/day, 400 sessions/day, 800 sessions/conference. Water consumption/occasion: 3 kg/occasion. 2400 kg of water for tank flushing.
- Handwashing: 1 l/occasion, i.e. 800 kg of tap water/conference.
- Hand washing: 800 times/towel used by everyone at home
- toilet paper: 600 times 1200 pieces of paper, 8 packs of paper, 1200 g, 1.2 kg
- paper waste: 1.2 kg
- 1 g liquid. soap: 1,600 drops/2 days/200 people. 1.6 kg of soap
- waste water: tank flushing + hand washing: 3200 kg for 2 days for 800 people
- paper waste: 1.2 kg
3.6. Decarbonisation Results
4. Discussion and Conclusions
Author Contributions
Data Availability Statement
Conflicts of Interest
References
- Data Centres & Networks - IEA Available online: https://www.iea.org/energy-system/buildings/data-centres-and-data-transmission-networks (accessed on 12 October 2024).
- Istrate, R.; Tulus, V.; Grass, R.N.; Vanbever, L.; Stark, W.J.; Guillén-Gosálbez, G. The Environmental Sustainability of Digital Content Consumption. Nat Commun 2024, 15, 3724. [CrossRef]
- Tao, Y.; Steckel, D.; Klemeš, J.J.; You, F. Trend towards Virtual and Hybrid Conferences May Be an Effective Climate Change Mitigation Strategy. Nat Commun 2021, 12, 7324. [CrossRef]
- van Ewijk, S.; Hoekman, P. Emission Reduction Potentials for Academic Conference Travel. J Ind Ecol 2021, 25, 778–788. [CrossRef]
- Neugebauer, S.; Bolz, M.; Mankaa, R.; Traverso, M. How Sustainable Are Sustainability Conferences? – Comprehensive Life Cycle Assessment of an International Conference Series in Europe. J Clean Prod 2020, 242, 118516. [CrossRef]
- Freitag, C.; Berners-Lee, M.; Widdicks, K.; Knowles, B.; Blair, G.S.; Friday, A. The Real Climate and Transformative Impact of ICT: A Critique of Estimates, Trends, and Regulations. Patterns 2021, 2, 100340. [CrossRef]
- Mair, J.; Thompson, K. The UK Association Conference Attendance Decision-Making Process. Tour Manag 2009, 30, 400–409. [CrossRef]
- Pavlukovic, V.; Cimbaljevic, M. Factors Affecting Conference Participation Decision-Making. Journal of the Geographical Institute Jovan Cvijic, SASA 2020, 70, 31–43. [CrossRef]
- Pavluković, V.; Carmer, A.B.; Vujičić, M.D.; Cimbaljević, M.; Stankov, U. Unveiling the Motivational Factors behind Generation Z’s Conference Attendance for Sustaining Future Participation. Sustainability 2023, 15, 13989. [CrossRef]
- Welthagen, L.; Slabbert, E.; Plessis, E. du Conference Tourism Competitiveness: An Applied AHP Framework. Journal of Convention and Event Tourism 2022, 23.
- Wee, H.; Mustapha, N.A.; Anas, M.S. Characteristic of Green Event Practices in MICE Tourism: A Systematic Literature Review. International Journal of Academic Research in Business and Social Sciences 2021, 11. [CrossRef]
- Raven, R.; Hadfield, P.; Butler, B.; Eagleton, J.; Giraud, G.; Jacob, M.; Markard, J.; Schiller, K.; Swilling, M.; Tshangela, M. Transitioning to Sustainable Academic Conferences Needs More Experimentation and Reflection. Global Sustainability 2023, 6, e16. [CrossRef]
- Yao, J.; Wang, L.; Pang, Q.; Fang, M. Coupling Coordination and Spatial Analyses of the MICE and Tourism Industries: Do They Fit Well? Current Issues in Tourism 2024, 27, 2783–2796. [CrossRef]
- Tanford, S.; Jung, S. Festival Attributes and Perceptions: A Meta-Analysis of Relationships with Satisfaction and Loyalty. Tour Manag 2017, 61, 209–220. [CrossRef]
- International Labor Organzation The Future of Work in the Tourism Sector: Sustainable and Safe Recovery and Decent Work in the Context of the COVID-19 Pandemic. Report for the Technical Meeting on COVID-19 and Sustainable Recovery in the Tourism Sector - TMSRTS/2022 2022.
- Martín-Rojo, I.; Gaspar-González, A.I. The Impact of Social Changes on MICE Tourism Management in the Age of Digitalization: A Bibliometric Review. Review of Managerial Science 2024. [CrossRef]
- Grossman, G.M.; Krueger, A.B. Economic Growth and the Environment. Q J Econ 1995, 110, 353–377. [CrossRef]
- Arshinder; Kanda, A.; Deshmukh, S.G. Supply Chain Coordination Issues: An SAP-LAP Framework. Asia Pacific Journal of Marketing and Logistics 2007, 19, 240–264. [CrossRef]
- Vasudavan, H.; Razali, N.F.; Shah, D.A. Event Management Systems (EMS) Innovation Practices among Malaysian Banking View Project Optimization Model for Consumption Taxation in Malaysia View Project Event Management Systems (EMS). Article in Journal of Applied Research and Technology 2023, 7.
- Honey John; Helna Maria Melton; Sreekuttan MB; N Anbarasu; Muhammed Sajal* AI Powered Event Management Platform. International Research Journal of Modernization in Engineering Technology and Science 2024. [CrossRef]
- Wenger, A. Shifting from Academic Air Travel to Sustainable Research Exchange: Examining Networking Efficacy during Virtual Conferences. J Clean Prod 2023, 414, 137577. [CrossRef]
- Raby, C.L.; Madden, J.R. Moving Academic Conferences Online: Aids and Barriers to Delegate Participation. Ecol Evol 2021, 11, 3646–3655. [CrossRef]
- Li, J.; Coca-Stefaniak, J.A.; Nguyen, T.H.H.; Morrison, A.M. Sustainable Tourist Behavior: A Systematic Literature Review and Research Agenda. Sustainable Development 2024, 32, 3356–3374. [CrossRef]
- Liu, J.; He, C.; Si, Y.; Li, B.; Wu, Q.; Ni, J.; Zhao, Y.; Hu, Q.; Du, S.; Lu, Z.; et al. Toward Better and Healthier Air Quality: Global PM 2.5 and O 3 Pollution Status and Risk Assessment Based on the New WHO Air Quality Guidelines for 2021. Global Challenges 2024, 8. [CrossRef]
- Southerland, V.A.; Brauer, M.; Mohegh, A.; Hammer, M.S.; van Donkelaar, A.; Martin, R. V; Apte, J.S.; Anenberg, S.C. Global Urban Temporal Trends in Fine Particulate Matter (PM2·5) and Attributable Health Burdens: Estimates from Global Datasets. Lancet Planet Health 2022, 6, e139–e146. [CrossRef]
- ROBINSON, S.; BAUMHAMMER, M.; BEIERMANN, L.; BELTEKI, D.; CHAMBERS, A.C.; GIBBONS, K.; GUIMONT, E.; HEFFNER, K.; HILL, E.-L.; HOUGHTON, J.; et al. Innovation in a Crisis: Rethinking Conferences and Scholarship in a Pandemic and Climate Emergency. The British Journal for the History of Science 2020, 53, 575–590. [CrossRef]
- Nitesh Kushwaha; Akhilesh A.Woo A COMPREHENSIVE REVIEW OF ENERGY CONSUMPTION IN COMPUTER SYSTEMS: CHALLENGES, TRENDS, AND SUSTAINABLE SOLUTIONS. International Research Journal of Modernization in Engineering Technology and Science 2023. [CrossRef]
- Reger, C.; Leitzmann, M.F.; Rohrmann, S.; Kühn, T.; Sedlmeier, A.M.; Jochem, C. Sustainable Diets and Risk of Overweight and Obesity: A Systematic Review and Meta-analysis. Obesity Reviews 2024, 25. [CrossRef]
- Elhoushy, S.; Jang, S. (Shawn) How to Maintain Sustainable Consumer Behaviours: A Systematic Review and Future Research Agenda. Int J Consum Stud 2023, 47, 2181–2211. [CrossRef]
- Baungaard, C.; Lane, K.E.; Richardson, L. Understanding Nutrition Students’ Knowledge, Perceived Barriers and Their Views on the Future Role of Nutritionists Regarding Sustainable Diets. Nutr Bull 2023, 48, 572–586. [CrossRef]
- Steenson, S.; Buttriss, J.L. Healthier and More Sustainable Diets: What Changes Are Needed in High-income Countries? Nutr Bull 2021, 46, 279–309. [CrossRef]
- Avató, J.L.; Mannheim, V. Life Cycle Assessment Model of a Catering Product: Comparing Environmental Impacts for Different End-of-Life Scenarios. Energies (Basel) 2022, 15, 5423. [CrossRef]
- Mannheim, V.; Avató, J.L. Life-Cycle Assessments of Meat-Free and Meat-Containing Diets by Integrating Sustainability and Lean: Meat-Free Dishes Are Sustainable. Sustainability 2023, 15, 12014. [CrossRef]
- Mannheim, V. Perspective: Comparison of End-of-Life Scenarios of Municipal Solid Waste from Viewpoint of Life Cycle Assessment. Front Built Environ 2022, 8. [CrossRef]
- ISO ISO 14040:2006; Environmental Management—Life Cycle Assessment—Principles and Framework; Geneva, Switzerland, 2006.
- ISO 14044:2006; Environmental Management—Life Cycle Assessment—Requirements and Guidelines. ISO: Geneva, Swit-Zerland, 2006. Available Online: Https://Www.Iso.Org/Standard/38498.Html (Accessed on 6 June 2019).


|
Conference Day 1:/Lunch/Course I: Cheddar cheese cream soup Serving weight: 0.385 kg/person |
| Cheddar cheese: 0.15 Pasteurized cream (38-42%): 0.103 Rapeseed oil (Canola): 0.025 Fine wheat flour: 0.006 Salt: 0.001 |
|
Conference Day 1/Lunch/Course II: Vienna Schnitzel with Thai rice Serving weight: 0.433 kg/person |
| Beef (semi-boned): 0.12 Fine wheat flour, eggs and breadcrumbs: 0.0355 Thai rice: 0.25 Orange rings (for decoration): 0.02 Sunflower oil: 0.0882 Salt: 0.001 |
|
Conference Day 1/Lunch/Dessert: Orange cream glass Serving weight: 0.289 kg/person |
| Orange: 0.165 Pasteurized cream (38-42%): 0.0773 Sour cream: 0.045 Sugar: 0.01 |
|
Conference Day 1/Dinner: Gnocchi with cheese sauce Serving weight: 0.414 kg/person |
| Cheese: 0.15 Pasteurized cream (42%): 0.05 Potatoes: 0.167 Wheat flour: 0.0333 Rapeseed oil (Canola): 0.03 Salt: 0.01 |
|
Conference Day 2/Lunch/Course I: Green pea cream soup Serving weight: 0.388 kg/person |
| Green peas: 0.125 Carrot: 0.09 Pasteurized cream (38-42%): 0.05 Rapeseed oil (Canola): 0.02 Fine wheat flour: 0.002 Salt: 0.001 |
|
Conference Day 2/Lunch/Course II: Steamed fish with Thai rice Serving weight: 0.398 kg/person |
| Fish meat: 0.10 Thai rice: 0.25 Orange rings (for decoration): 0.02 Rapeseed oil (Canola): 0.03 |
|
Conference Day 2/Lunch/Salad: Tomato salad Serving weight: 0.250 kg/person |
| Tomato: 0.20 Rapeseed oil (EU): 0.05 |
| Name of impact assessment method | Carbon Footprint [kg CO2 eq.] |
|---|---|
| CML 2001 - Aug. 2016/Non-baseline CML | Global Warming Potential (GWP 100 years) with or without biogenic carbon |
| Impact 2002+ (I02+ v2.1) | Global warming 500yr – Midpoint (kg CO2 eq. to air) |
| EF 3. 0 and EF 3.1 (Environmental Footprint 3.0 and Environmental Footprint 3.1) |
Climate Change – total, biogenic, fossil, and land use and land use change |
| EN 15804 +A2 (based on EF 3.1) | EN 15804+A2 (EF 3.1) Climate Change – total, fossil, biogenic, land use and land use change |
| Impacts ILCD/PEF recom worldsteel mod v1.09 | Climate Change midpoint, including or excluding biogenic carbon (v1.09) |
| IPCC AR6 | IPCC AR6 GWP 20,100, 500 including or excluding biogenic carbon IPCC AR6 GTP 50, 100 including or excluding biogenic carbon |
| ISO 14067 GWP (based on IPCC AR6) | GWP100, Aircraft emissions GWP100, Biogenic GHG emissions GWP100, Biogenic GHG removal GWP100, Emissions from land use change (dLUC) GWP100, Fossil GHG emissions |
| PCF IPCC | IPCC AR5 GWP 100 including biogenic carbon, including Land Use Change, no norm/weight |
| ReCiPe 2016 v1.1 | Climate Change, incl. Land Use Change (LUC): endpoint (H) and midpoint (H), Climate Change, incl. or default, excl. biogenic carbon Endpoint (I)/Midpoint (I) |
| SBK Bepalingsmethode - Jan. 2021 (NMD 3.3) | Climate change (GWP 100) Climate change (GWP 100), incl long-term emissions |
| TfS (Together for Sustainability) | TfS 1 – GWP total, inc. biogenic carbon TfS 2 - GWP total, excl. biogenic carbon TfS 3 – GWP fossil |
| TRACI 2.1 | Global Warming Air, excl biogenic carbon, incl LUC, no norm/weight Global Warming Air, incl biogenic carbon, incl LUC, no norm/weight Global Warming Air, LUC only, no norm/weight Global Warming Air, including or excluding biogenic carbon |
| Cheddar cheese cream soup (Course I), serving weight: 0.385 kg | |||
| Inputs | Water [kg] | Natural gas [kg] | Electricity [MJ] |
| In-person | 4.50 tap water mix from EU for washing and cooking (of which the cooking water: 0.1) |
0.0063 natural gas from EU |
0.85 electricity grid mix (Hungary): |
| Online | 4.50 | 0.0308 | 2.01 |
| Outputs | Food waste from all life cycle stages [kg/portion] | Waste water generated from preparation-cooking-consumption stages [kg/portion] |
Amount of other waste [kg/portion] |
| In-person | 0.058 (remaining consumption: 15%) |
4.40 | - |
| Online | 0.0193 (remaining consumption: 5%) |
4.40 | - |
| Vienna Schnitzel with Thai rice (Course II), serving weight: 0.433 kg | |||
| Inputs | Water [kg] | Natural gas [kg] | Electricity [MJ] |
| In-person | 6.71 tap water mix from EU (of which the cooking water for rice: 1.14) |
0.0283 natural gas from EU |
1.87 electricity grid mix (Hungary): |
| Online | 8.10 | 0.201 | 0.373 |
| Outputs | Food waste from all life cycle stages [kg/portion] | Waste water generated from preparation-cooking-consumption stages [kg/portion] |
Amount of other waste [kg/portion] |
| In-person | 0.11526 (orange peel from decoration: 0.001, peel: 0.018, consumption residue: 0.11246 - 26%) |
5.57 | 0.0794 (used cooking oil) |
| Online | 0.098 (orange peel: 0.001, peel: 0.018, consumption residue: 0.09516 - 22%) |
6.99 | 0.0794 (used cooking oil) |
| Orange cream glass (Dessert), serving weight: 0.289 kg | |||
| Inputs | Water [kg] | Natural gas [kg] | Electricity [MJ] |
| In-person | 3.45 tap water mix from EU for washing |
- |
1.70 electricity grid mix (Hungary): |
| Online | 3.45 | 0.0107 | 0.805 |
| Outputs | Food waste from all life cycle stages [kg/portion] | Waste water generated from preparation-cooking-consumption stages [kg/portion] |
Amount of other waste [kg/portion] |
| In-person | 0.0227 (orange peel: 0.0825, consumption residue: 0.01445 – 5%) |
3.45 | - |
| Online | 0.0227 (orange peel: 0.0825, consumption residue: 0.01445 – 5%) |
3.45 | - |
| Green pea cream soup (Course I), serving weight: 0.388 kg | |||
| Inputs | Water [kg] | Natural gas [kg] | Electricity [MJ] |
| In-person | 4.50 tap water mix from EU for washing and cooking (of which the cooking water: 0.1) |
0.0063 natural gas from EU |
0.85 electricity grid mix (Hungary): |
| Online | 5.00 (of which the cooking water: 0.1) |
0.0595 | 2.01 |
| Outputs | Food waste from all life cycle stages [kg/portion] | Waste water generated from preparation-cooking-consumption stages [kg/portion] |
Amount of other waste [kg/portion] |
| In-person | 0.0682 (carrot peel: 0.01, consumption residue: 0.0582 – 15%) |
4.40 | - |
| Online | 0.0294 (carrot peel: 0.01, consumption residue: 0.0194 – 5%) |
4.90 | - |
| Steamed fish with Thai rice (Course II), serving weight: 0.398 kg | |||
| Inputs | Water [kg] | Natural gas [kg] | Electricity [MJ] |
| In-person | 6.31 tap water mix from EU |
0.043 natural gas from EU |
1.21 electricity grid mix (Hungary): |
| Online | 6.31 | 0.195 | 0.33 |
| Outputs | Food waste from all life cycle stages [kg/portion] | Waste water generated from preparation-cooking-consumption stages [kg/portion] |
Amount of other waste [kg/portion] |
| In-person | 0.0621 (orange peel from decoration: 0.01, consumption residue: 0.05963 – 15%) |
5.20 | - |
| Online | 0.0621 (orange peel: 0.01, consumption residue: 0.05963 – 15%) |
5.20 | - |
| Tomato salad (salad), serving weight: 0.250 kg | |||
| Inputs | Water [kg] | Natural gas [kg] | Electricity [MJ] |
| In-person | 0.7 tap water mix from EU for washing and preparing |
- |
- electricity grid mix (Hungary): |
| Online | 0.70 | - | - |
| Outputs | Food waste from all life cycle stages [kg/portion] | Waste water generated from preparation-cooking-consumption stages [kg/portion] |
Amount of other waste [kg/portion] |
| In-person | 0.0125 (consumption residue) |
0.70 | - |
| Online | 0.0125 (consumption residue) |
0.70 | - |
| Gnocchi with cheese sauce (main course), serving weight: 0.414 | |||
| Inputs | Water [kg] | Natural gas [kg] | Electricity [MJ] |
| In-person | 10.60 tap water mix from EU (of which the added cooking water: 0.1 kg) |
0.036 natural gas from EU |
1.35 electricity grid mix (Hungary): |
| Online | 10.60 | 0.0615 | 2.01 |
| Outputs | Food waste from all life cycle stages [kg/portion] | Waste water generated from preparation-cooking-consumption stages [kg/portion] |
Amount of other waste [kg/portion] |
| In-person | 0.0788 (potato peel: 0.0166, consumption residue: 0.06214 – 15%) |
10.60 | - |
| Online | 0.0788 (potato peel: 0.0166, consumption residue: 0.06214 – 15%) |
10.60 | - |
|
Tea with orange, orange juice and Cassava chips Functional Unit: consumption/1 person/1 hour | |||
| Water [kg] | Natural gas [kg] | Electricity [MJ] | |
| 0.80 tap water mix from EU ((use of water to make tea) |
- |
0.0576 electricity grid mix (Hungary) CASO HW 550 hot water dispenser |
|
| Weight of raw materials [kg] | Black tea: 0.0112 Sliced orange (for flavoring): 0.02 Potato chips (Cassava): 1.20 Orange juice: 0.96 Crystal sugar: 0.024 |
||
|
Tea with orange, orange juice and Cassava chips Functional Unit: consumption/200 person/1 hour | |||
| Water [kg] | Natural gas [kg] | Electricity [MJ] | |
| 160 tap water mix from EU ((use of water to make tea) |
- |
11.50 electricity grid mix (Hungary) CASO HW 550 hot water dispenser |
|
| Weight of raw materials [kg] | Black tea: 2.24 Sliced orange (for flavoring): 4.0 Potato chips (Cassava): 240 Orange juice: 192 Crystal sugar: 4.8 |
||
|
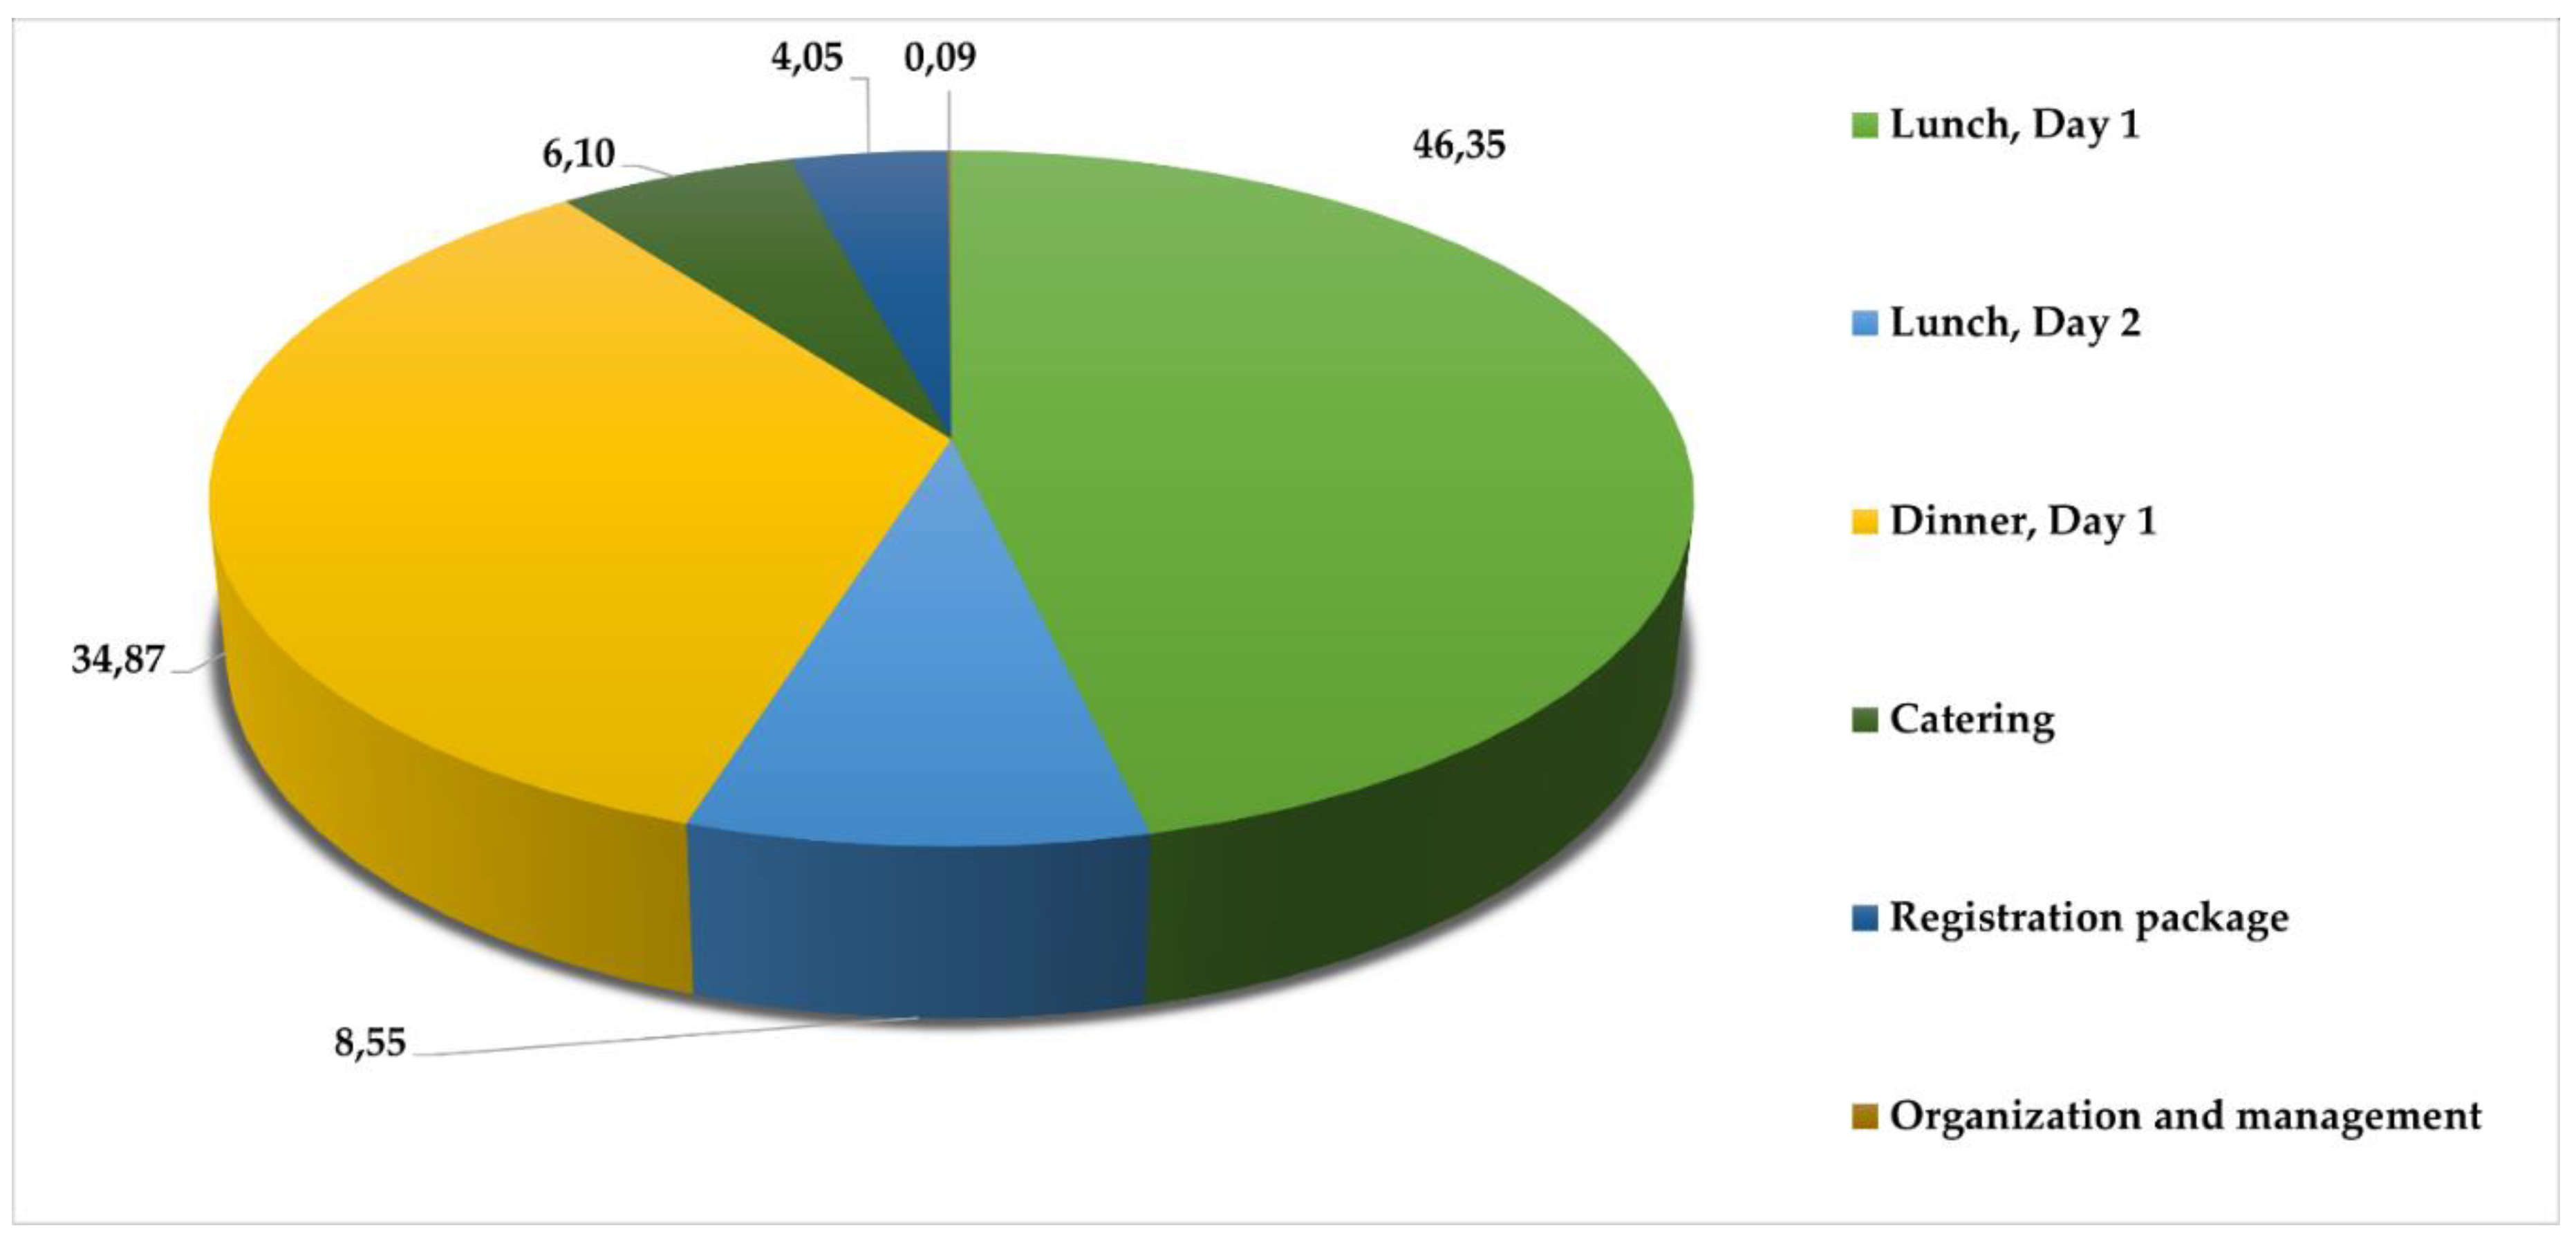
Carbon footprint for the in-person conference Functional unit: 1 person/1 hour |
||||
| CML 2016 excl. biogenic carbon [kg CO2 eq.] |
IPCC AR6 GWP 100, excl. biogenic CO2 (version Aug. 2021) [kg CO2 eq.] |
ISO 14067 GWP 100 [kg CO2 eq.] |
||
| Lunch, Day 1 | 4.068 | 4.213 | 2.612 | |
| Lunch, Day 2 | 0.7504 | 0.7711 | 0.5893 | |
| Dinner, Day 1 | 3.06 | 3.17 | 1.85 | |
| Catering | 0.535 | 0.551 | 0.286 | |
| Registration gift package | 0.355 | 0.357 | 0.24 | |
| Organization and Management | 0.0077 | 0.00774 | 0.0042 | |
| Total | 8.7761 | 9.06984 | 5.5815 | |
| Trip | 11.912 | |||
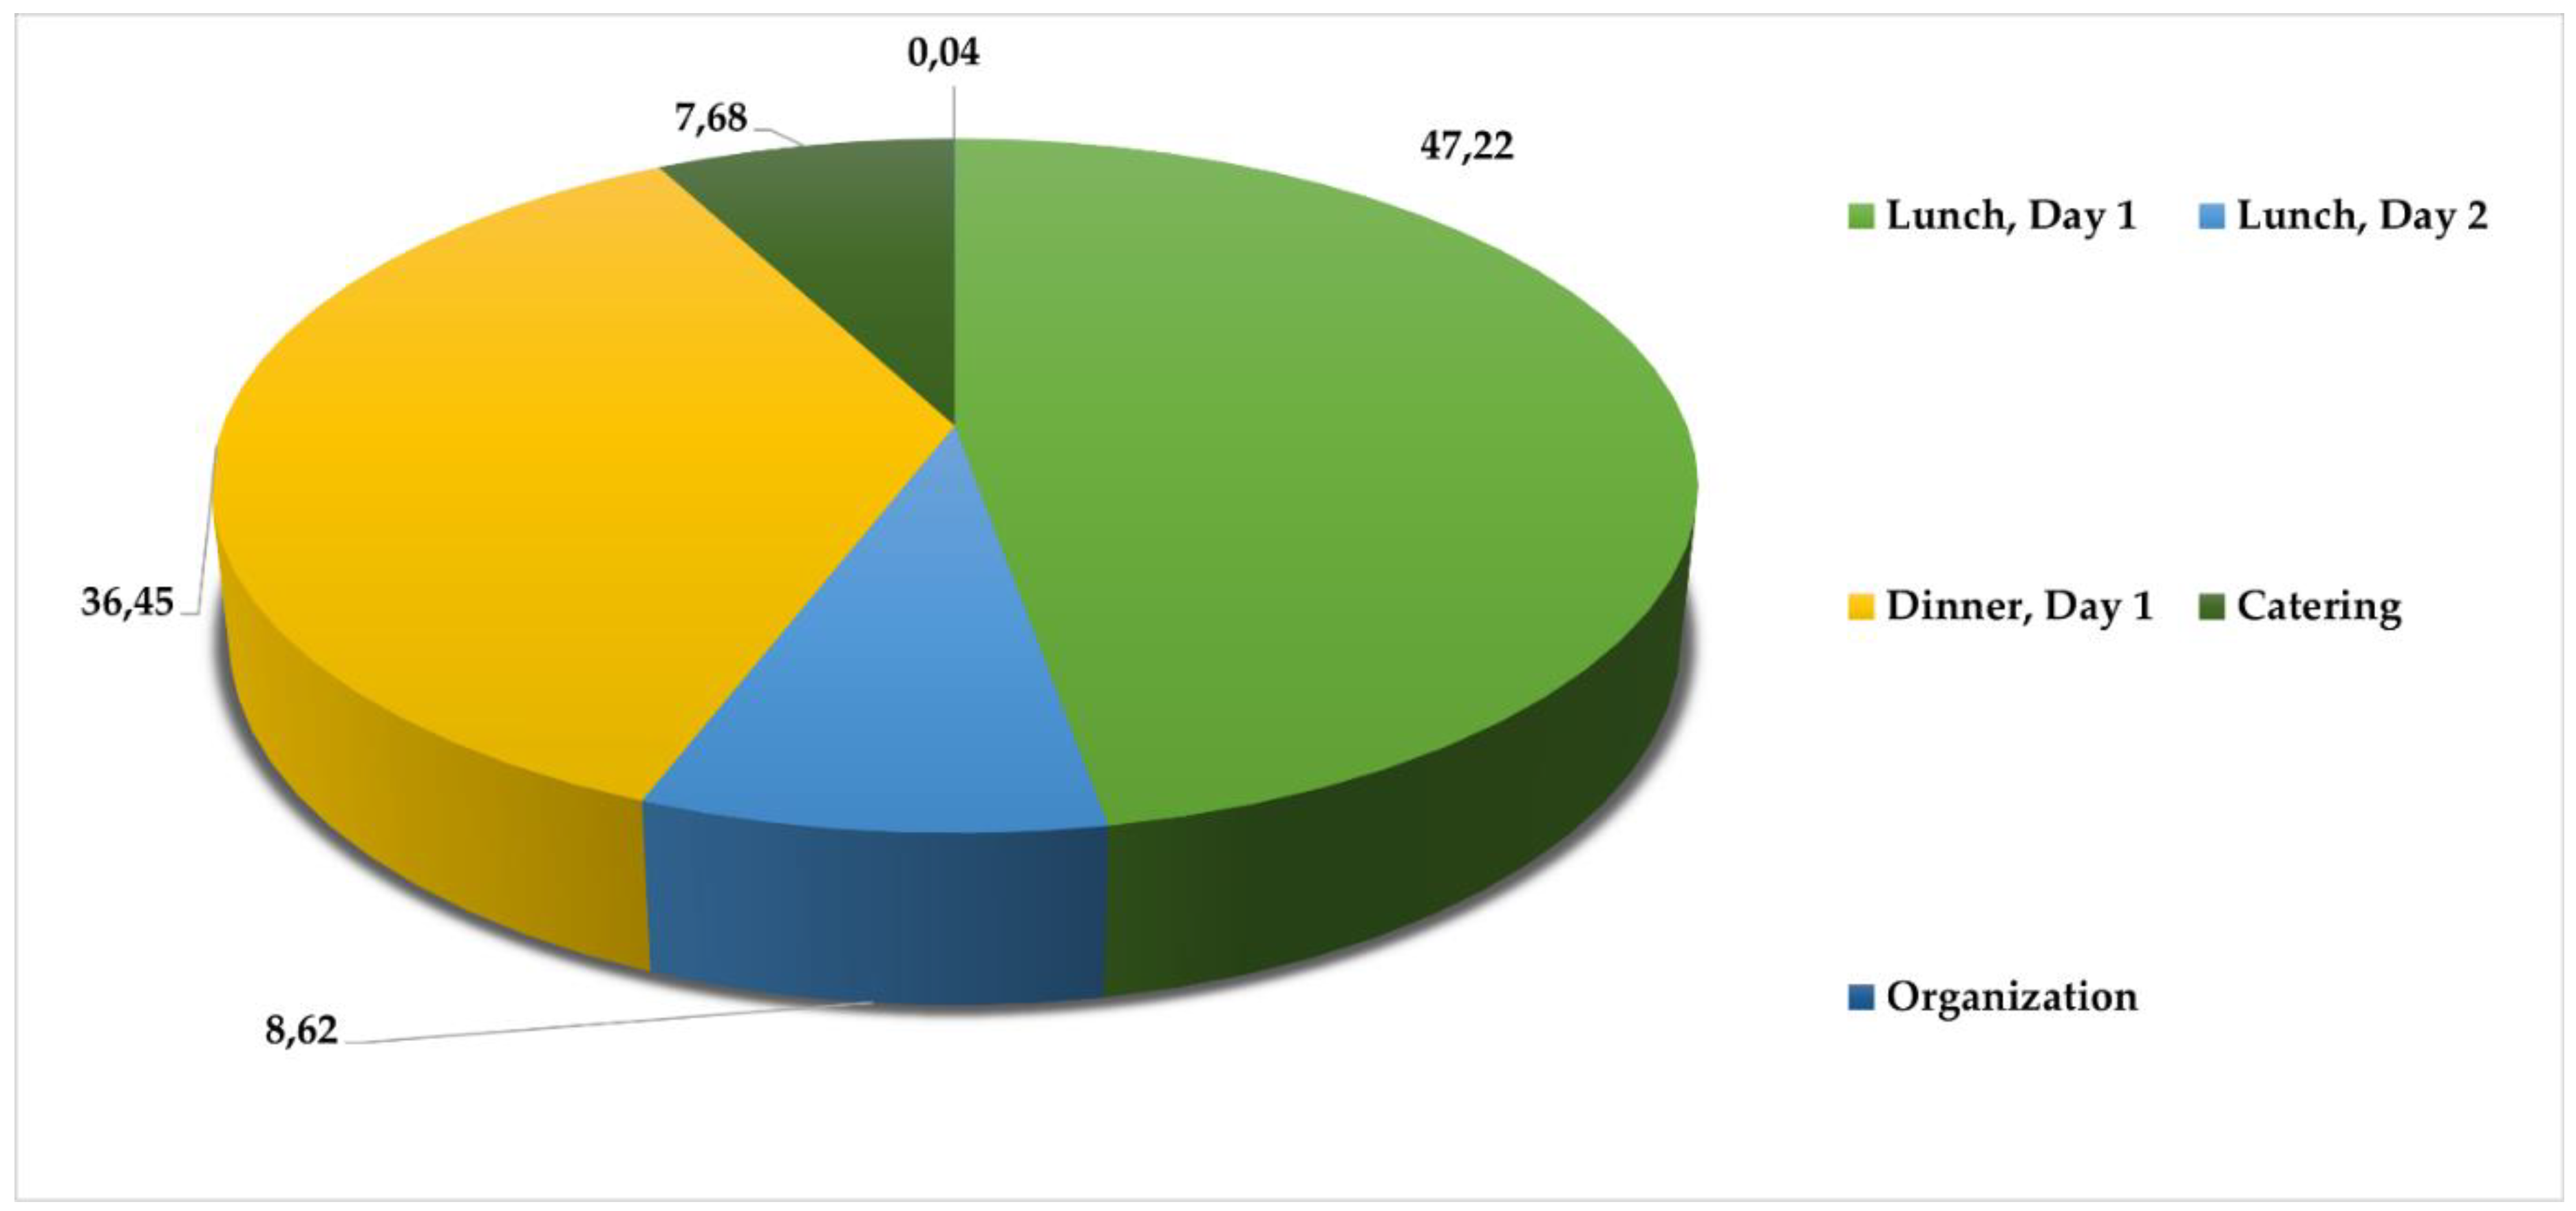
| Carbon footprint for the online conference Functional unit: 1 person/1 hour |
||||
|---|---|---|---|---|
| CML 2016 excl. biogenic carbon [kg CO2 eq.] | IPCC AR6 GWP 100, excl. biogenic CO2 (version Aug. 2021) [kg CO2 eq.] |
ISO 14067 GWP 100 [kg CO2 eq.] |
||
| Lunch, Day 1 | 4.041 | 4.187 | 2.55 | |
| Lunch, Day 2 | 0.7374 | 0.7551 | 0.4815 | |
| Dinner, Day 1 | 3.12 | 3.23 | 1.86 | |
| Catering | 0.657 | 0.673 | 0.324 | |
| Organization | 0.00321 | 0.00323 | 0.00208 | |
| Total | 8.55861 | 8.84833 | 5.21758 | |
Disclaimer/Publisher’s Note: The statements, opinions and data contained in all publications are solely those of the individual author(s) and contributor(s) and not of MDPI and/or the editor(s). MDPI and/or the editor(s) disclaim responsibility for any injury to people or property resulting from any ideas, methods, instructions or products referred to in the content. |
© 2024 by the authors. Licensee MDPI, Basel, Switzerland. This article is an open access article distributed under the terms and conditions of the Creative Commons Attribution (CC BY) license (http://creativecommons.org/licenses/by/4.0/).


