1. Introduction
Home to more than 60% of the Congo Basin's forests [
1,
2,
3], the Democratic Republic of the Congo (DRC) contains 99 million hectares of dense moist forest, with around 63 million hectares of intact forest landscapes [
4,
5]. These forests hold significant ecological integrity and biodiversity and plays an important role in provision of global ecosystem services, including regulation of the climate and water cycle, carbon sequestration and biodiversity conservation [
4,
6,
7,
8,
9]. Despite their global importance, the DRC's forests face numerous pressions including climate change, anthropogenic pressures and other combined factors[
10,
11]. Since 2001, the DRC has lost over one million hectares of forest cover annually [
10], including 450,000 hectares of primary forest [
1,
9], mainly due to forest clearance by smallholders for agriculture and charcoal production [
10,
12,
13] . They often move into forests to escape conflict and insecurity [
14,
15,
16].
The DRC's terrestrial protected areas (PA) cover around 324,289.7 km² (approximately 13.8% of the country’s territory) [
17,
18] and are crucial for conserving tropical biodiversity and mitigating climate change by reducing deforestation and degradation [
19,
20,
21,
22,
23,
24]. Despite their importance, protected areas face intense anthropogenic pressures, [
5,
17,
21,
25] which are compounded by high population density (exceeding 100 inhabitants per km²) in the eastern region [
5,
23] and widespread poverty (human development index of 0.479, United Nations Development Program, 2022). The Kahuzi-Biega National Park (KBNP), one of the most important PA for the conservation of Grauer's gorilla (
Gorilla beringei graueri) in the DRC, faces severe threats primarily due to insecurity which impedes the conservation and restoration of its integrity [
26,
27,
28]
Straddling the Albertine Rift and the Congo Basin, the KBNP covers around 6,700 km² of tropical forest, ranging from carbon-rich afro-montane forests to mid-altitude equatorial rainforests [
26]. It is the second most important site in the Albertine Rift in terms of species richness, endemism, and threatened [
26,
29,
30,
31,
32]. The park is renowned for its extensive tracts of primary and secondary forest, with about 60% of the total area comprising intact forest landscapes with high ecological integrity [
33]. These forests host a vast array of flora and fauna, with thousands of species documented (Spira et al., 2018; Plumptre et al., 2007). Despite its importance, the KBNP is one of those in the DRC where forest losses and degradation are severe [
29,
32].
KBNP is in one of the DRC's most densely populated regions, with a population density of about 400 inhabitants per km², much higher than the national average[
34]. The park faces significant challenges from human activities, such as bushmeat hunting, firewood collection, charcoal production, bushfires, and the establishment of villages. Additional threats include encroachment from agriculture, mining, and the spread of the invasive vine
Sericostachys scandens [
28,
29,
30,
34,
35,
36]. Although the KBNP was inscribed on the UNESCO World Heritage List in 1980 under criterion (x), the threats have increased, particularly after the mass eviction of people from the park during its enlargement in 1975 and the civil wars of 1996-1997 and 1998-2003, leading to conflicts over land between indigenous Pygmy peoples and non-indigenous groups [
37,
38]. Consequently, KBNP has been on the UNESCO list of World Heritage in Danger since [
26,
37,
39,
40]. Analyzing the impact of anthropization on the park's forest dynamics is crucial for understanding and guiding conservation efforts.
Remote sensing is essential for monitoring tropical moist forest ecosystems, which are often inaccessible and expansive [
41,
42]. This study utilizes Landsat archives, machine learning tools, and satellite image processing to analyze the KBNP landscape from 1990 to 2022. This analysis supports conservation efforts in the DRC, offering insights into deforestation and degradation (DFD) to ensure the long-term survival of Kahuzi-Biega's intact forest. Previous studies have highlighted drivers of DFD in the DRC without focusing on protected areas [
12,
14,
43], while global studies using remote sensing have examined general threats to protected areas [
44,
45,
46]. Local analyses are necessary to understand the specific issues of forest loss in the context of each protected area.
This study hypothesizes that Kahuzi-Biega National Park, a Category II protected area (as defined by UICN and national categorization)[
47], experiences a lower rate of tropical moist forest (TMF) loss compared to its unprotected surroundings. Without well-defined buffer zones[
40], the park faces increasing centripetal pressures. The inner zone is less exposed to forest loss than the peripheral and outer zones, which are more vulnerable. Several studies have shown that protected areas, despite various pressures, play a significant role in mitigating DFD compared to unprotected environments [
15,
19,
23,
48]. Fire, used for agriculture, charcoal production, hunting, and savannah regeneration, is expected to be the main driver of TMF loss in the KBNP landscape [
49,
50,
51]. In this study, we define a driver as any human activity that directly affects TMF cover and biomass [
52,
53,
54]. As supported by [
52], the term driver is more appropriate as an adjunct to discuss factors that are typical causes of land or environmental change, where there is evidence of a causal relationship, but not enough to establish causal effects and explain the causal mechanisms of a particular phenomenon. It is used here as a synonym for 'direct cause of deforestation and degradation [
11,
53] of TMF. TMF dynamics here includes any TMF disturbance that leads to TMF degradation and/or deforestation[
9].
2. Materials and Methods
2.1. Study Area
Covering 6,700 km² [
29,
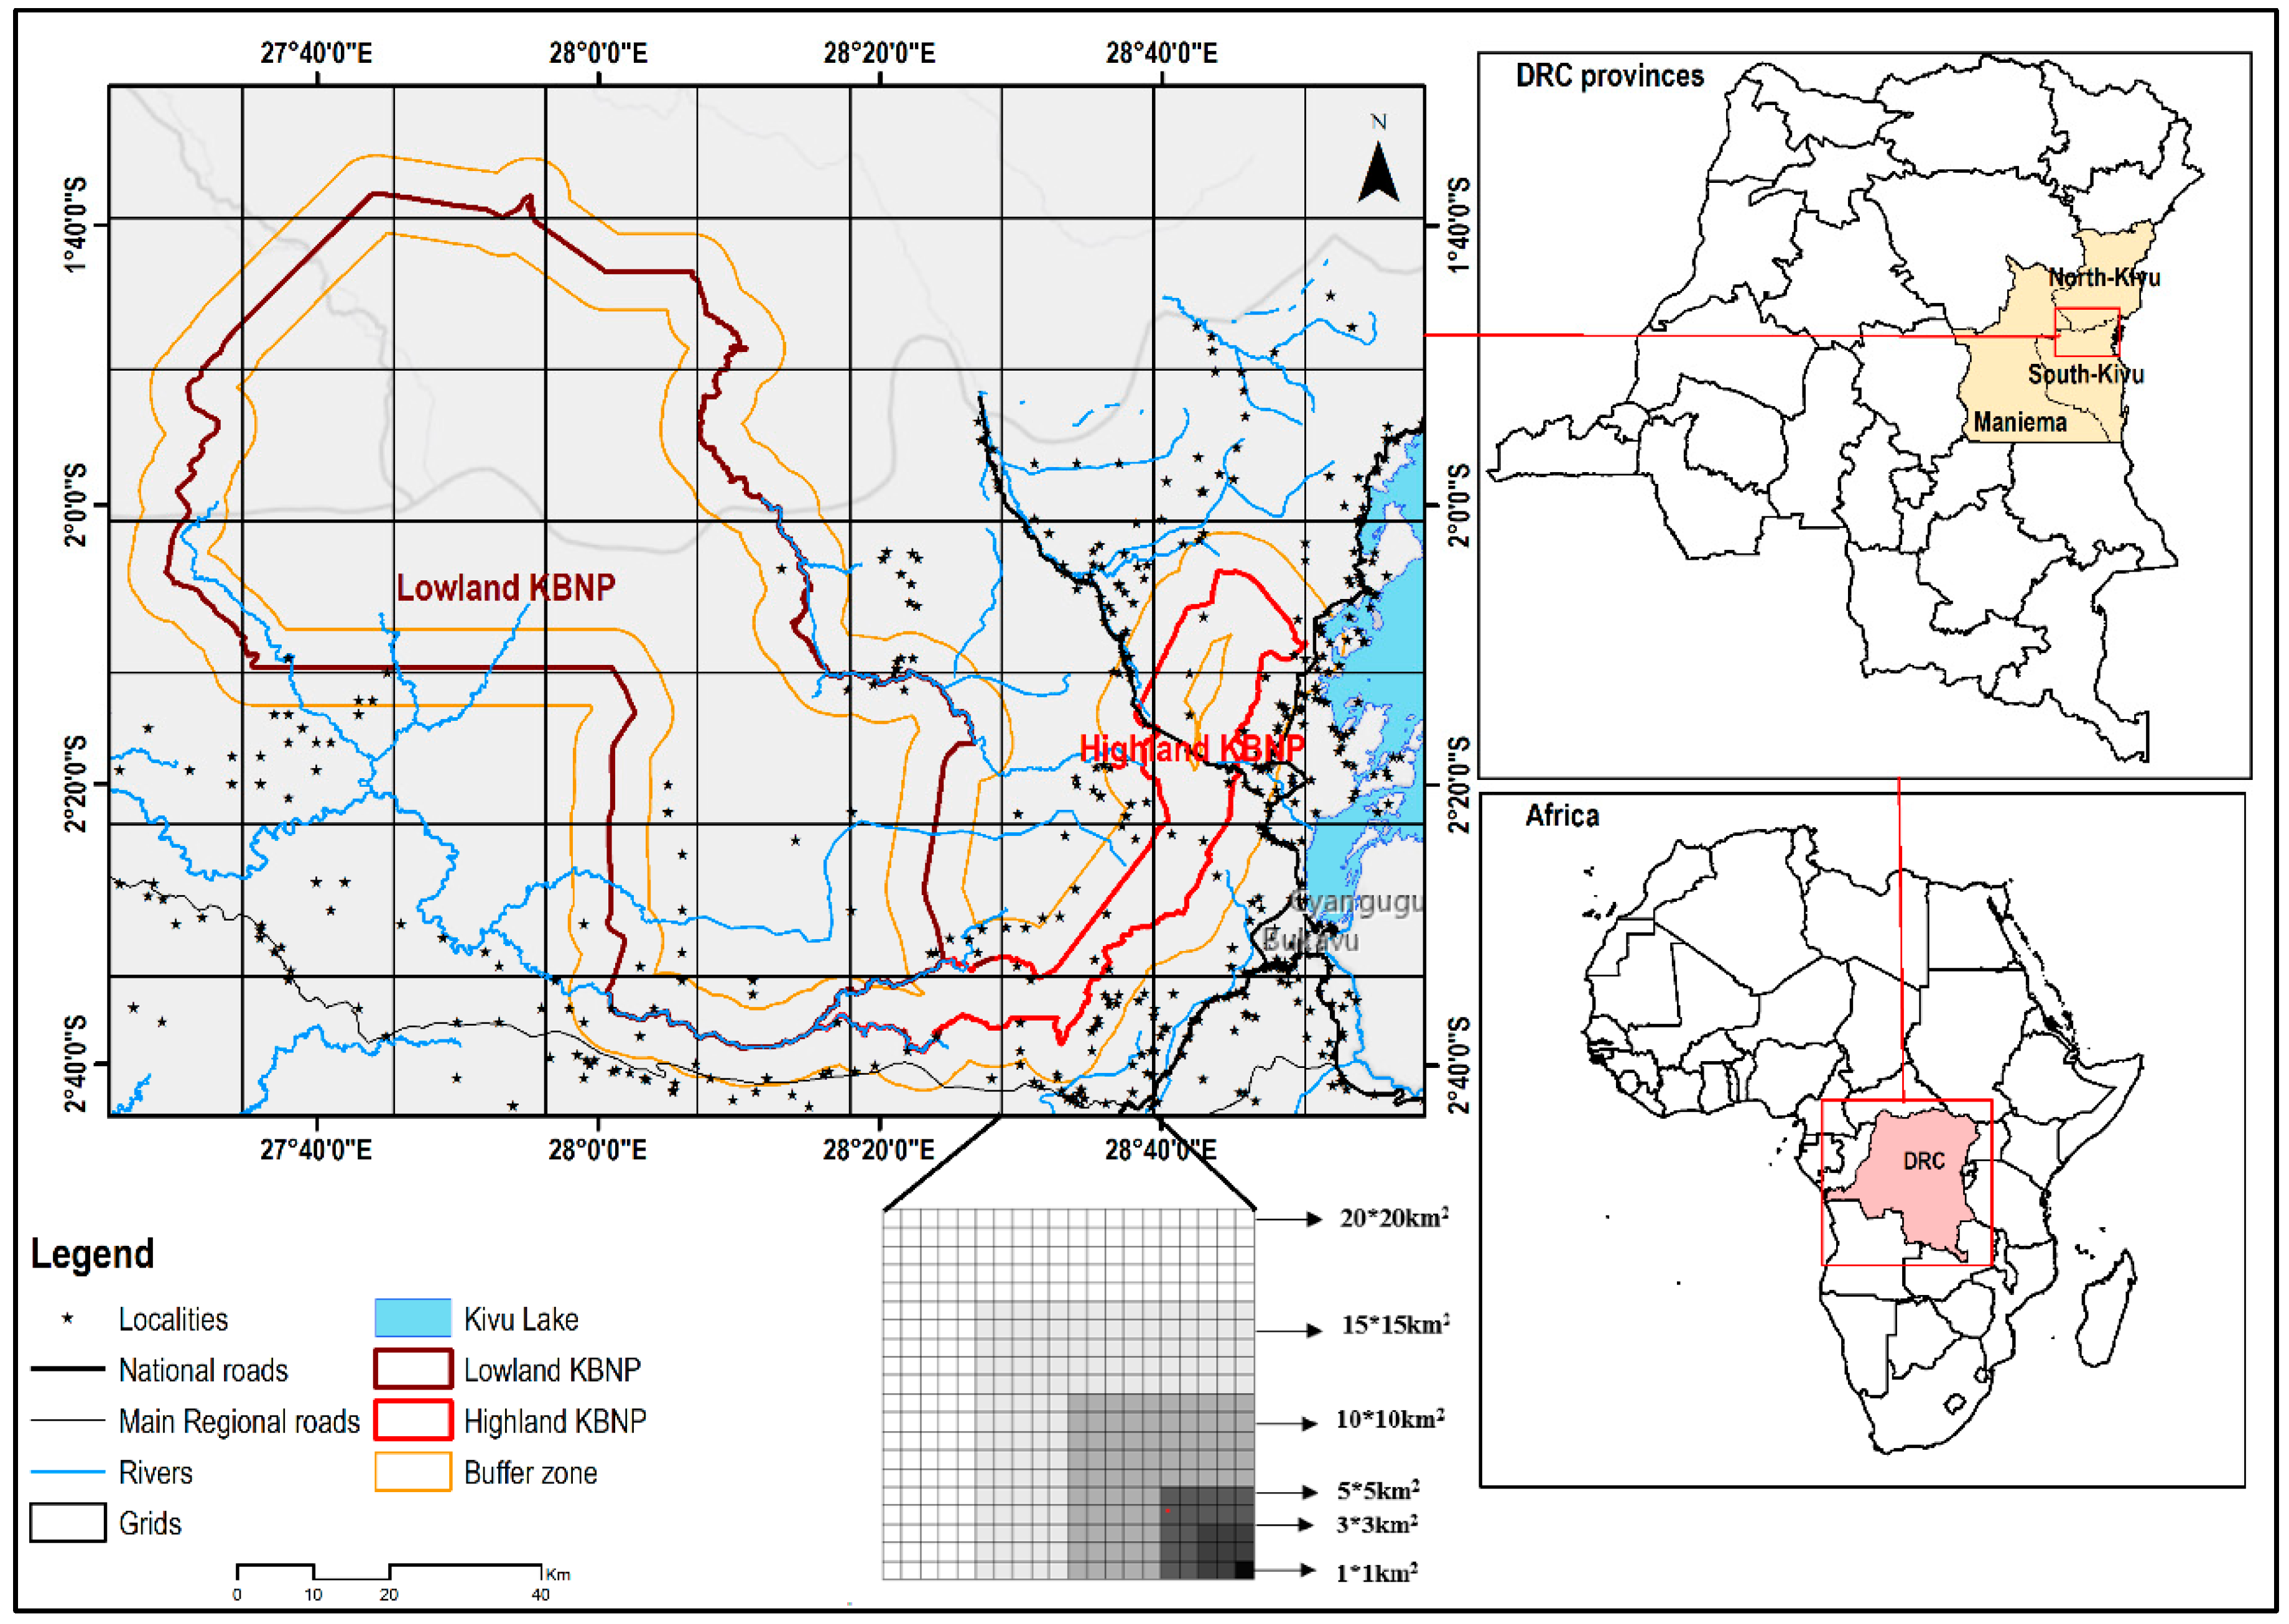
55], KBNP is located in central Africa, eastern DRC, spanning South Kivu, North Kivu, and Maniema provinces (
Figure 1). The park stretches from the Congo River basin near Itebero-Utu to its western border northwest of Bukavu, between 1°36'-2°37' south latitude and 27°33'-28°46' east longitude. comprises two distinct zones: the high-altitude and the low-altitude regions, connected by a narrow ecological corridor[
26,
40,
56] The high-altitude zone features an ombrophilous forest, reaching its highest point at Mount Kahuzi (3,308 m), and experiences an Afroalpine climate with occasional night frosts on the peaks of Kahuzi and Biega. This region receives an average annual rainfall of up to 1900 mm, with a long dry season from June to August and a short dry season in February. In contrast, the low-altitude zone consists of the Guineo-Congolian ombrophilous forest, located between 700 and 1,700 m above sea level. This region enjoys a uniformly warm climate during the day and throughout the year, with an annual average temperature of 20.5°C and very high rainfall [
26,
40,
56,
57,
58,
59]. The park is interspersed with numerous watercourses and is traversed by National Road 2 in the highlands [
40].
KBNP is home to 136 mammal species, including the eastern lowland gorilla (Gorilla beringei graueri) and other endangered species such as Pan troglodytes, Piliocolobus badius, Cercopithecus lhoesti, and Loxodonta africana cyclotis [
26,
28,
29]. The park also hosts eight small ungulate species, including six duikers. In 1994, the IUCN and WWF recognized KBNP as a center of plant diversity, with at least 1,178 species recorded in the highland zone alone. The KBNP encompasses all forest vegetation stages from 600m to over 2,600m [
26,
28,
60]. However, human activities such as mining operations, artisanal traps, tracks, and crop fields are present in some areas of the park [
34,
57].
The KBNP landscape considered includes the park and a 15 km surrounding area, based on research suggesting that protected areas should be studied with their surroundings for better understanding [
44,
48,
61,
62]. To better analyse the dynamics of TMF in the KBNP landscape, the landscape was subdivided into 3 main zones: the inner zone (consisting of the interior of the park minus the buffer zone), an edge zone (including inner buffer and outer buffer with a total width of 10km) and the outer zone (located outside de KBNP and the buffer zone. The width of the edge zone was determined based on literature [
62,
63] estimating how far communities can travel in search of forest products (timber and non-timber).
2.2. Dataset
The data analysed were obtained from several sources (
Table 1). The tropical moist forest data provided by [
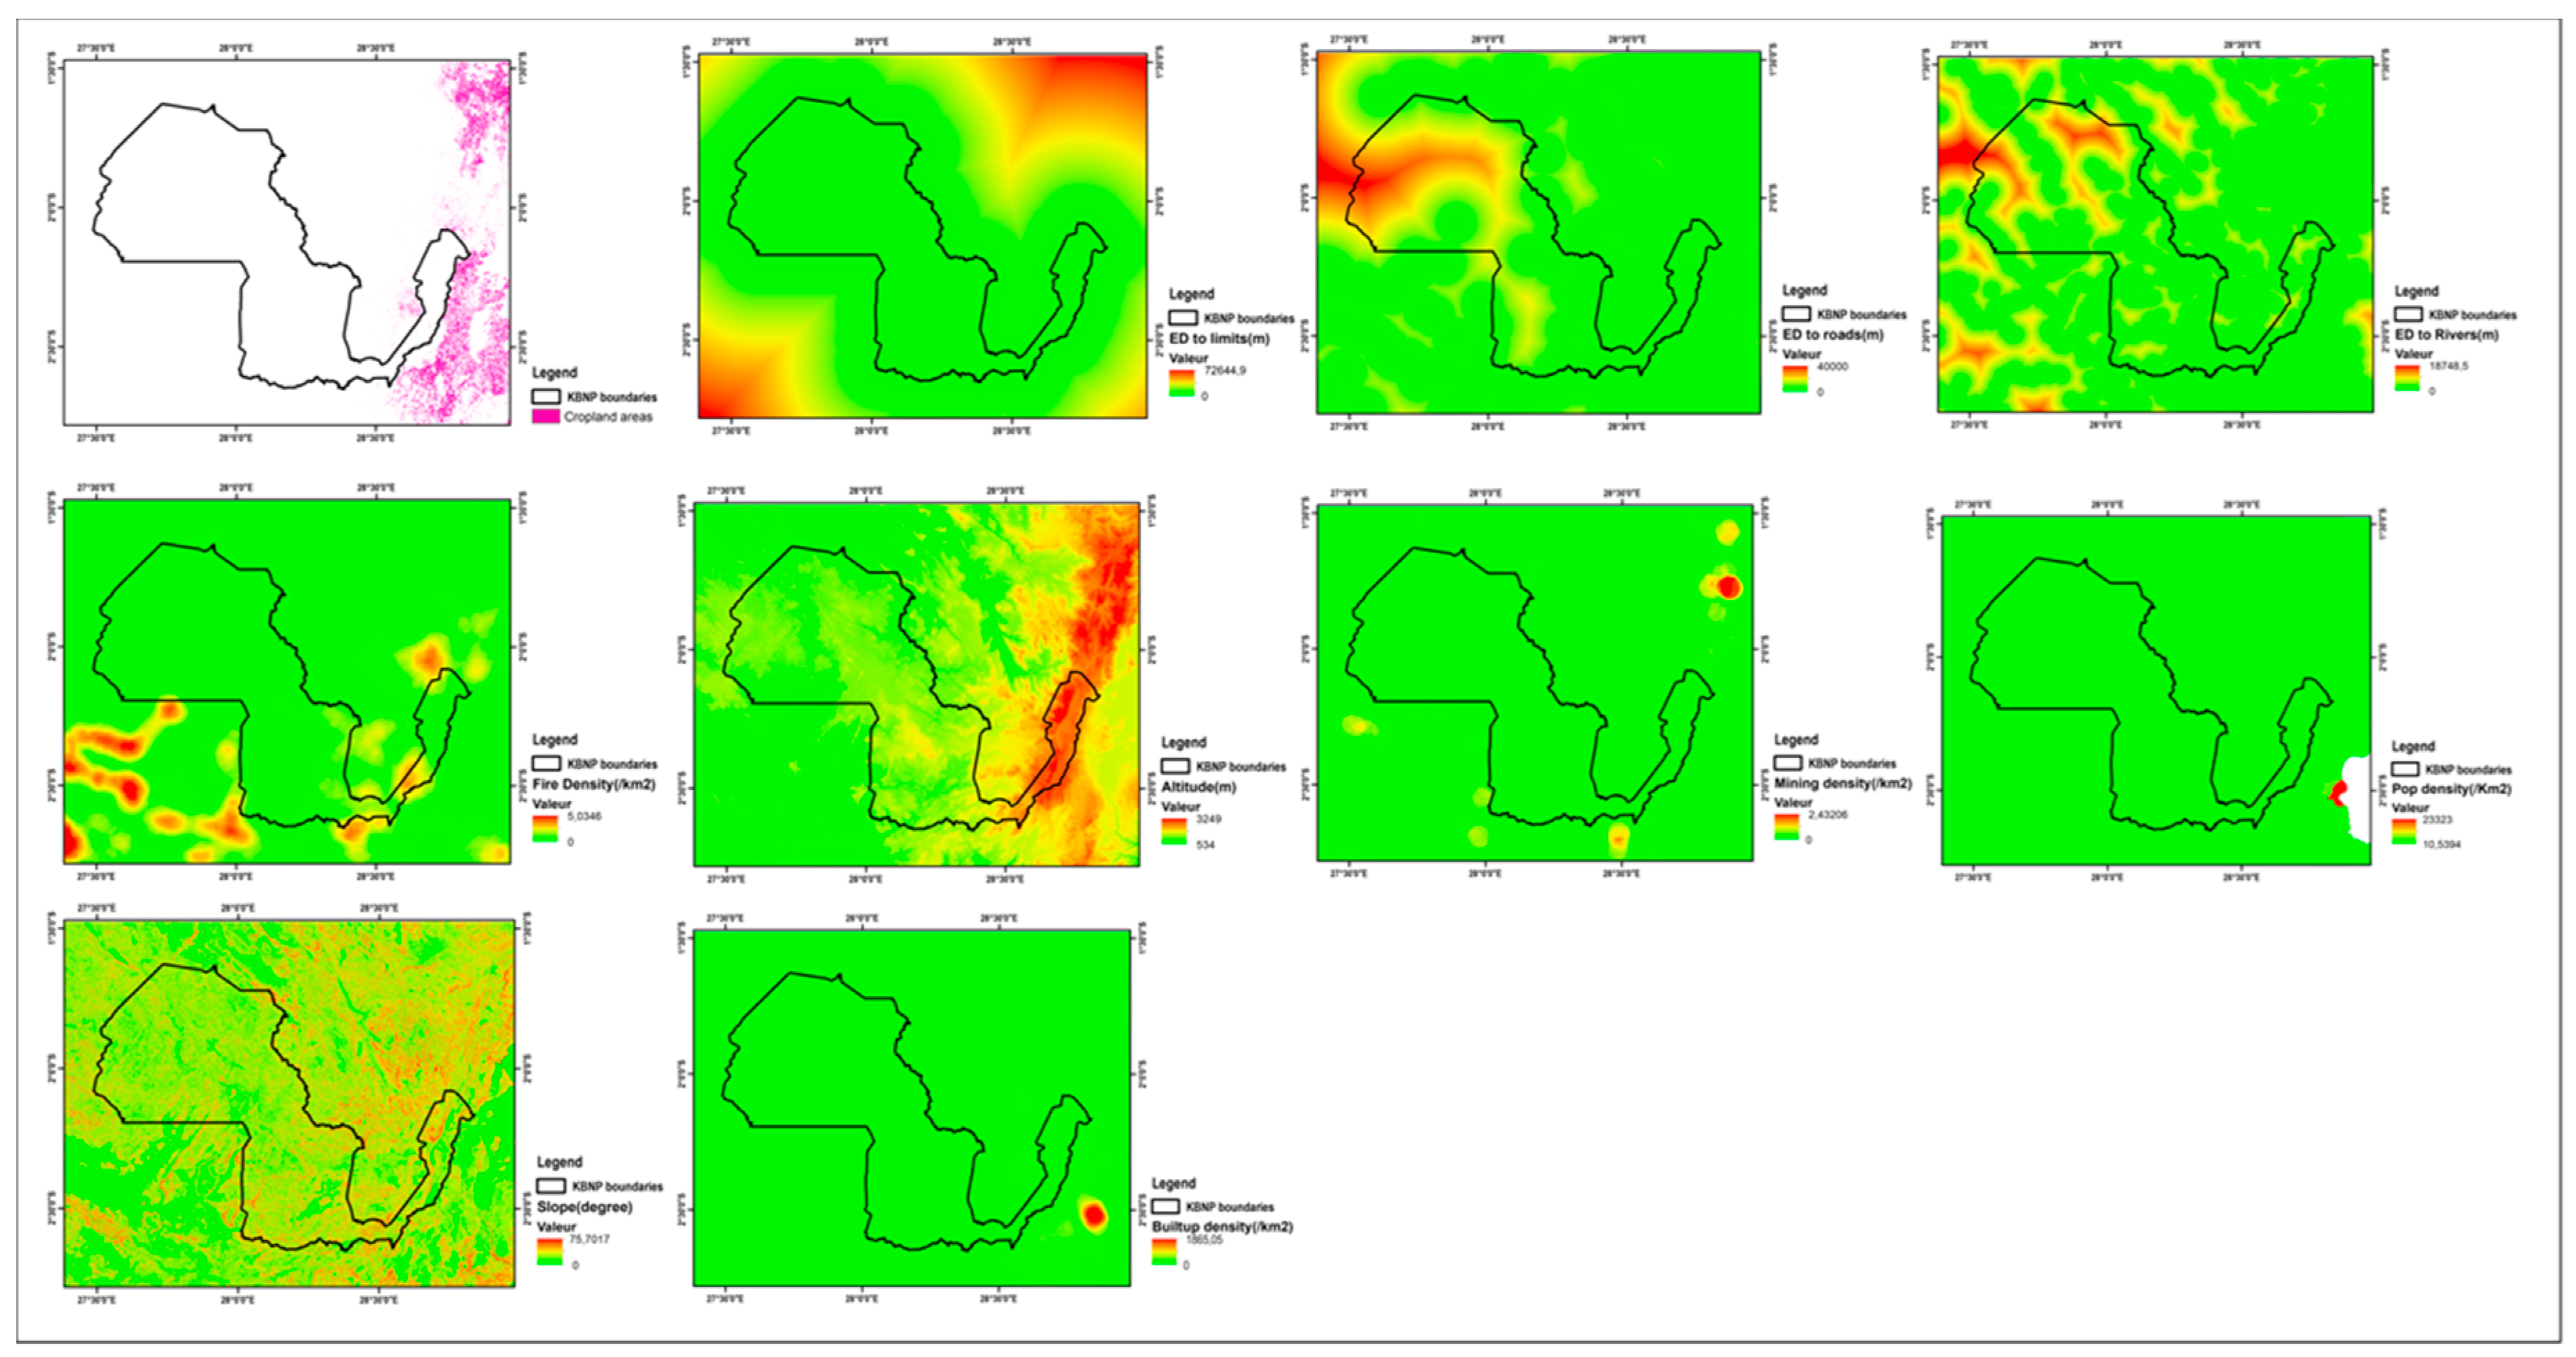
9] were used as the response variable and relevant deforestation/degradation factors, referred to here as drivers, as explanatory variables. The drivers considered (
Figure A1) in the models were selected based on the literature on the main drivers of forest disturbance in the Congo Basin [
12,
14,
64,
65,
66] and locally [
28,
29,
30,
34,
35,
36] but also on the availability of spatial data. The data set lacks consideration of factors such as logging density, and the underlying causes of deforestation and degradation as described by[
53].
2.3. Data Analysis
2.3.1. Image Quality and Adaptability Assessment
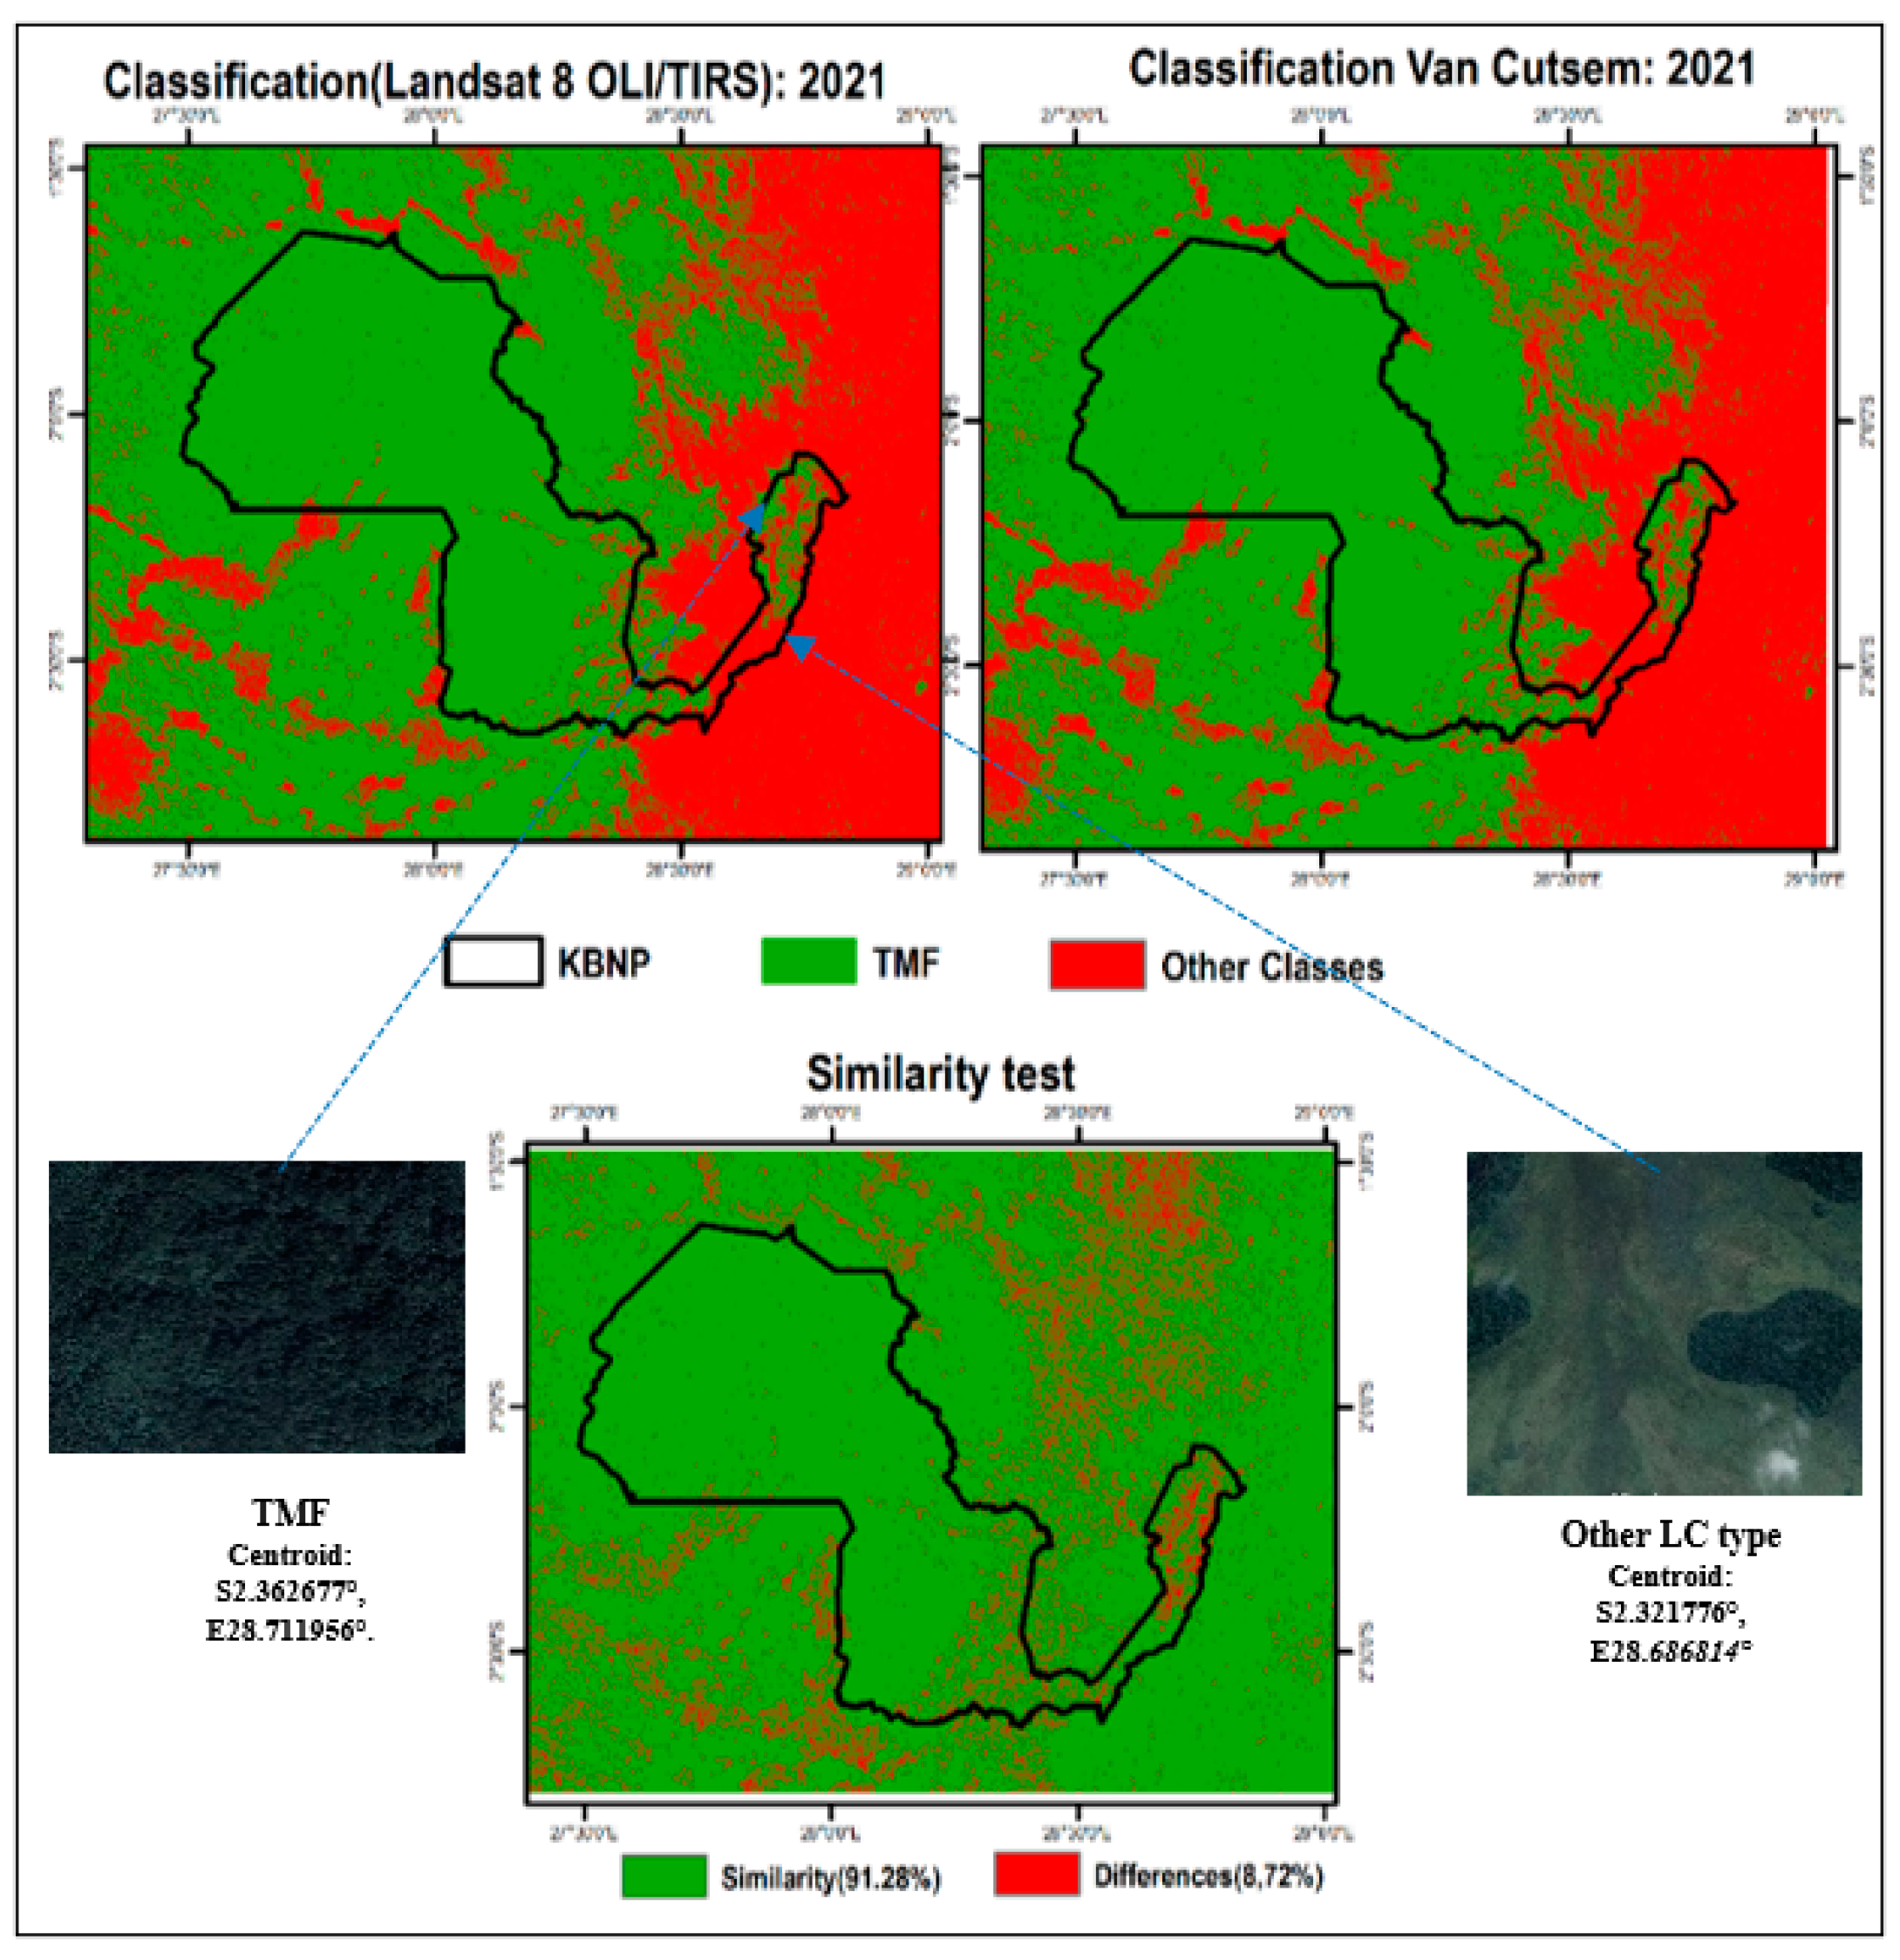
Following the acquisition and extraction of annual classified images from Vancutsem et al (2021) covering 1990 to 2022, we tested their effectiveness in analyzing TMF dynamics in Kahuzi-Biega National Park. The images were chosen for their annual availability, quality (absence of cloud cover), high estimate accuracy (91.40%), and high similarity rate (91.28%) with a Landsat 8 OLI/TIRS surface reflectance (2021) image classification using Google Earth Engine and Zurqani et al (2018) methodology.
Figure A2 shows the similarity test between the two images. This test involved extracting differences between the images and assessing their ratio to the total surface area using the Raster Calculator tool in ArcMap 10.8.1.
2.3.2. Model and Variable Selection
To assess the impact of spatial grain selection on TMF dynamics, we quantified deforestation in square grids of varying sizes (1 km², 9 km², 25 km², 100 km², 225 km², and 400 km²) as tested by [
69]. Given the study area size, we focused on the smallest grid sizes (1 km², 9 km², 25 km²). Variable selection for different grid sizes reduced the original set of variables based on Pearson correlation tests and principal component analyses using corrplot [
70] and FactoMineR [
71] in R 4.2.2. Highly correlated variables forming an acute angle on the correlation circle retained only the highest expression rate variable. After testing models at different scales, one scale was chosen to analyze zoning effects on our landscape. The choice was guided by [
72]) principle of fine scales for local disturbances and the model's ability to explain most variables used [
73]. To better understand the dynamics of TMF) in the Kahuzi-Biega National Park landscape, three groups of grids were considered for the three previously defined zones: interior grids, edge grids, and exterior grids. Grids located entirely within the park (excluding the buffer zone) were classified as interior grids. Grids that were entirely or predominantly within the buffer zone were classified as edge grids, while those located outside both the buffer zone, and the park were classified as exterior grids. The variables for the different zones were selected using the same methodology.
2.3.3. Model Construction
At the first level, we developed TMF dynamics models across selected spatial scales using multiple linear regressions. Model validity was assessed with normality tests for residuals [
74] and Durbin-Watson tests for autocorrelations [
75], informing model quality. Analysis of variance determined scale-dependent TMF variation based on studied parameters. All variables were centered and normalized to assess their individual impacts. Results were visualized using dot-whisker plots [
76]. Once the optimal scale for KBNP TMF dynamics was established, we analyzed different predefined zones. Initially, we computed TMF variation statistics across all years (1990-2022) and developed multiple linear regression models for the variation of TMF (∆f) as per earlier methods. Relative importance analysis, employing Lindemann, Merenda, and Gold's method (lmg) with bootstrapping for estimate variability [
77], was conducted using the relaimpo package in R 4.2.2.
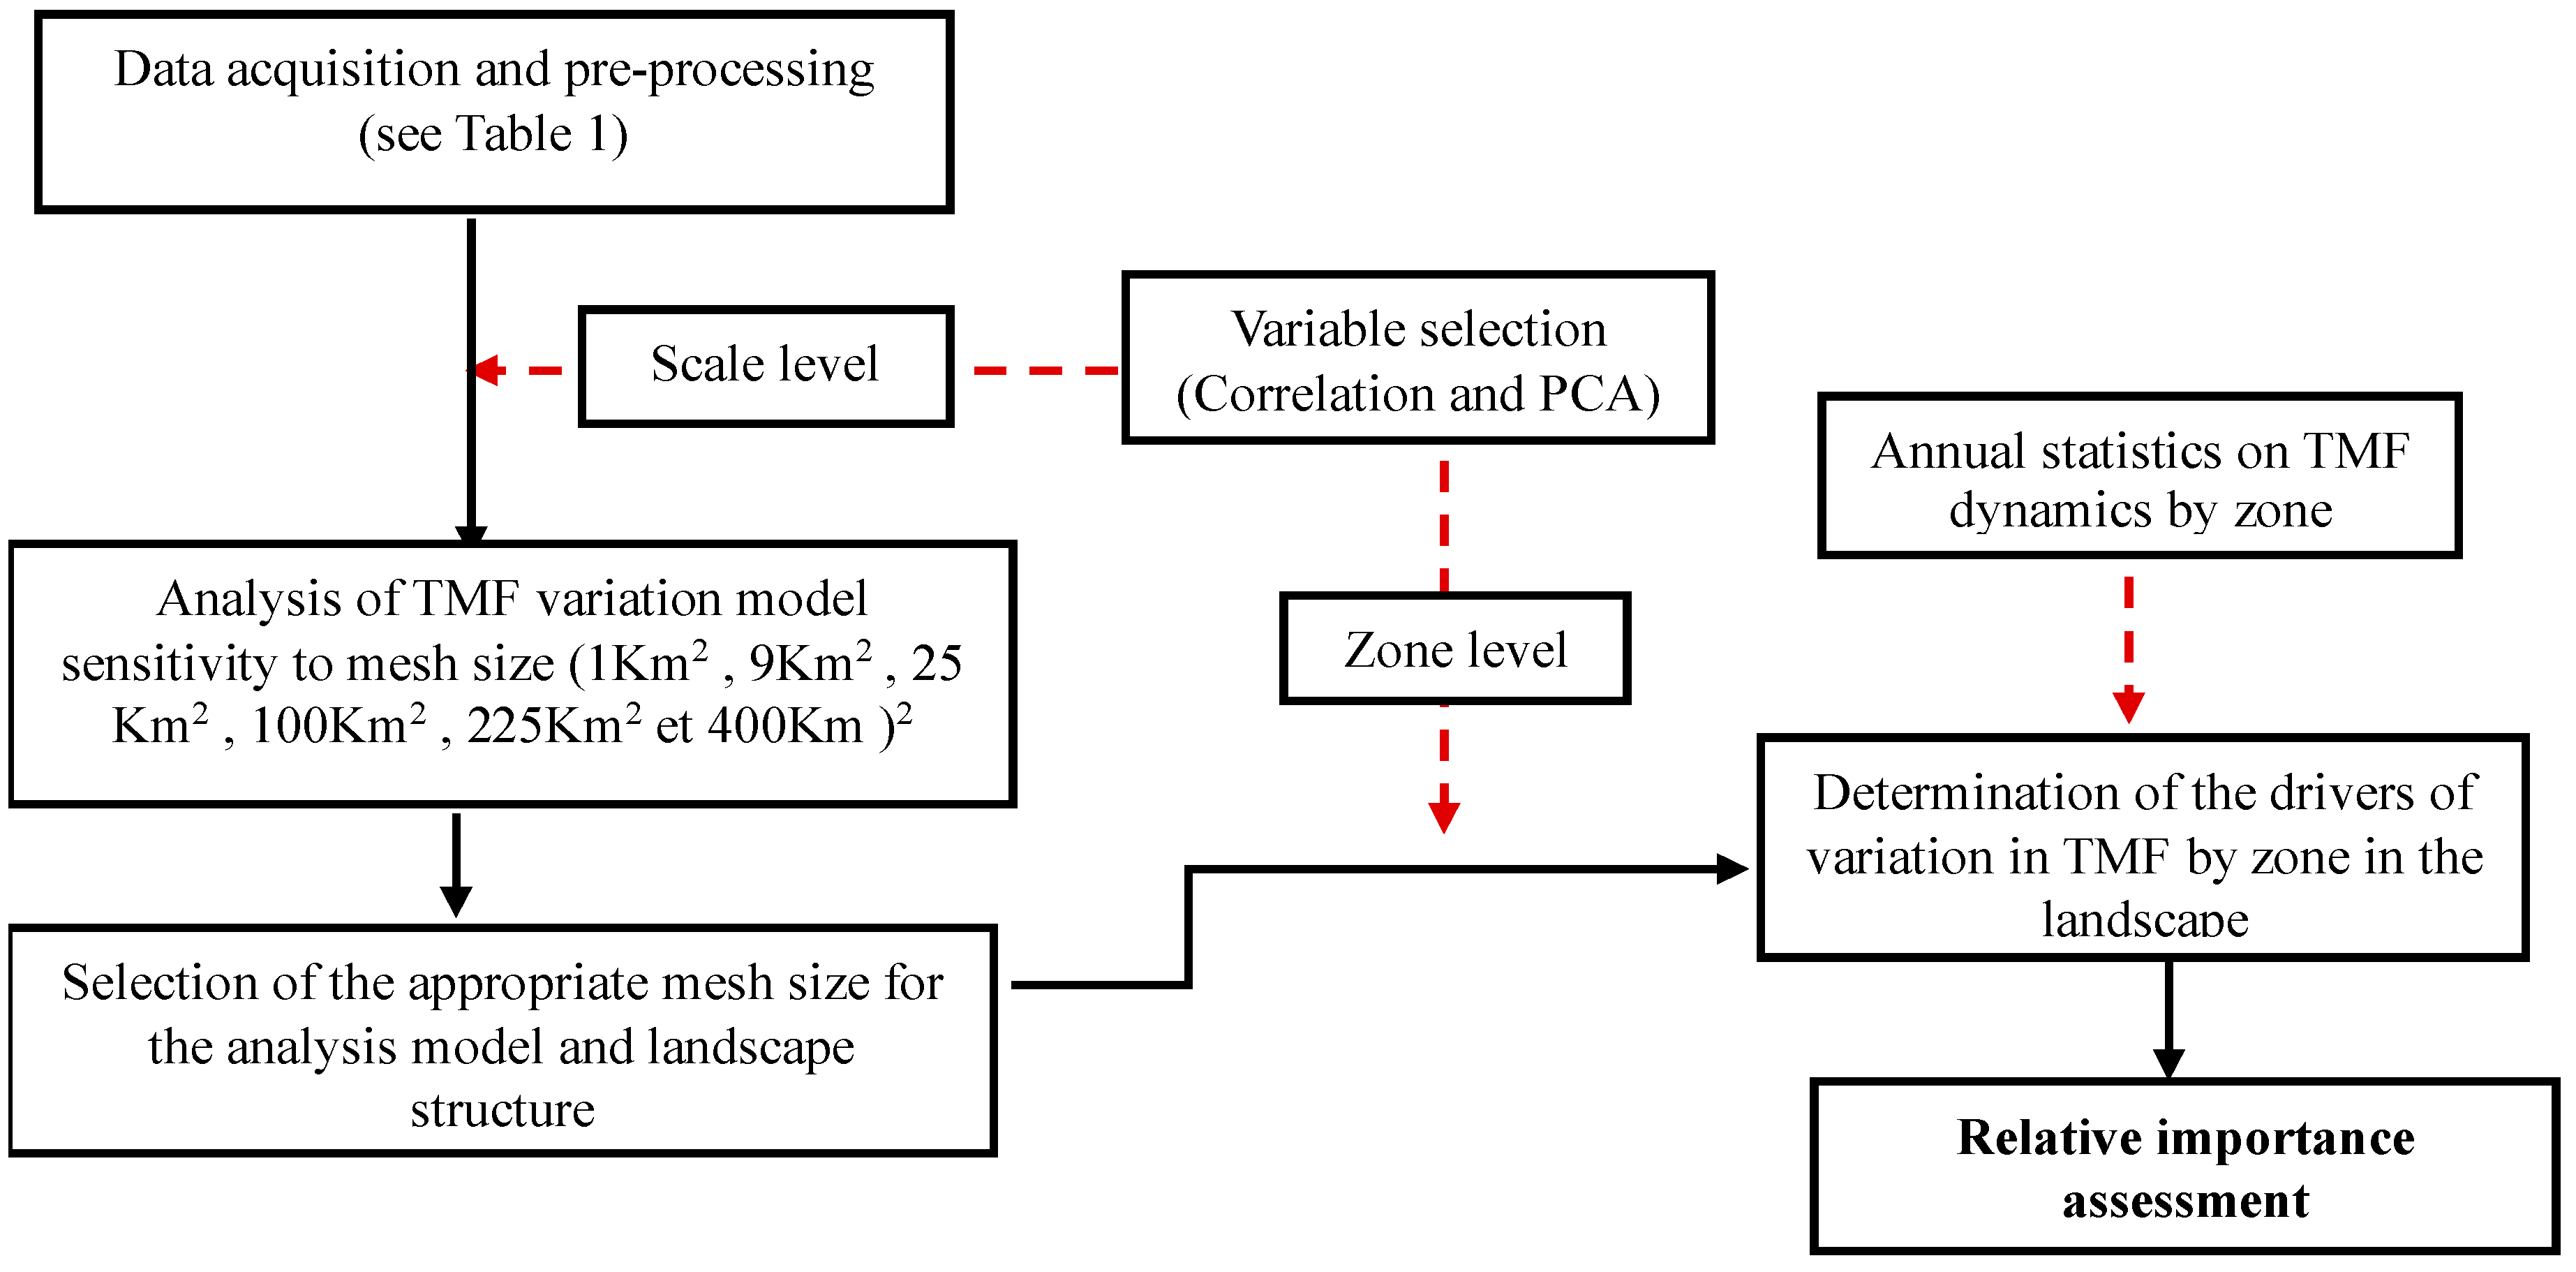
Figure 2 depicts the methodological workflow.
3. Results
3.1. Analysis of Model Sensitivity to Mesh Size
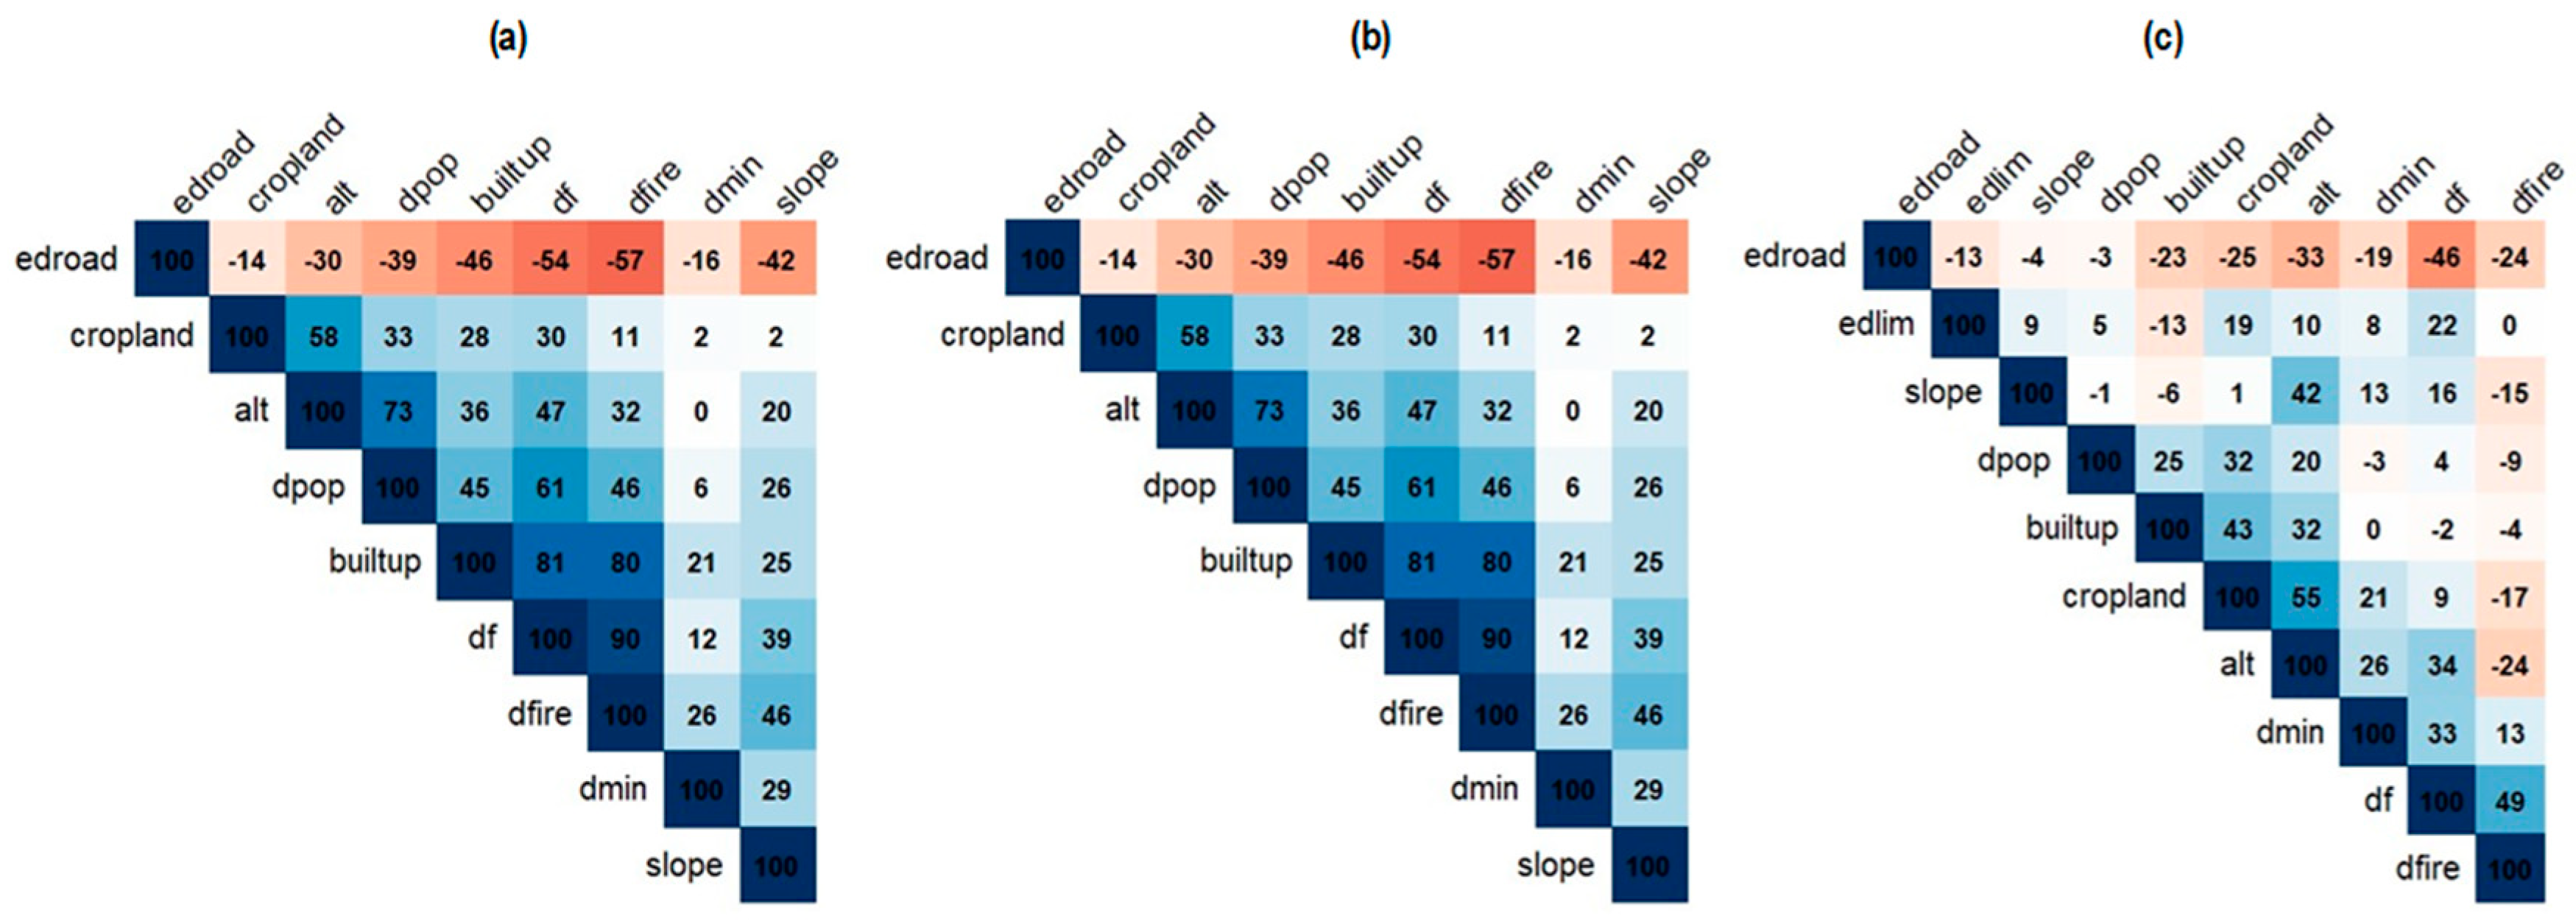
Figure 3 and
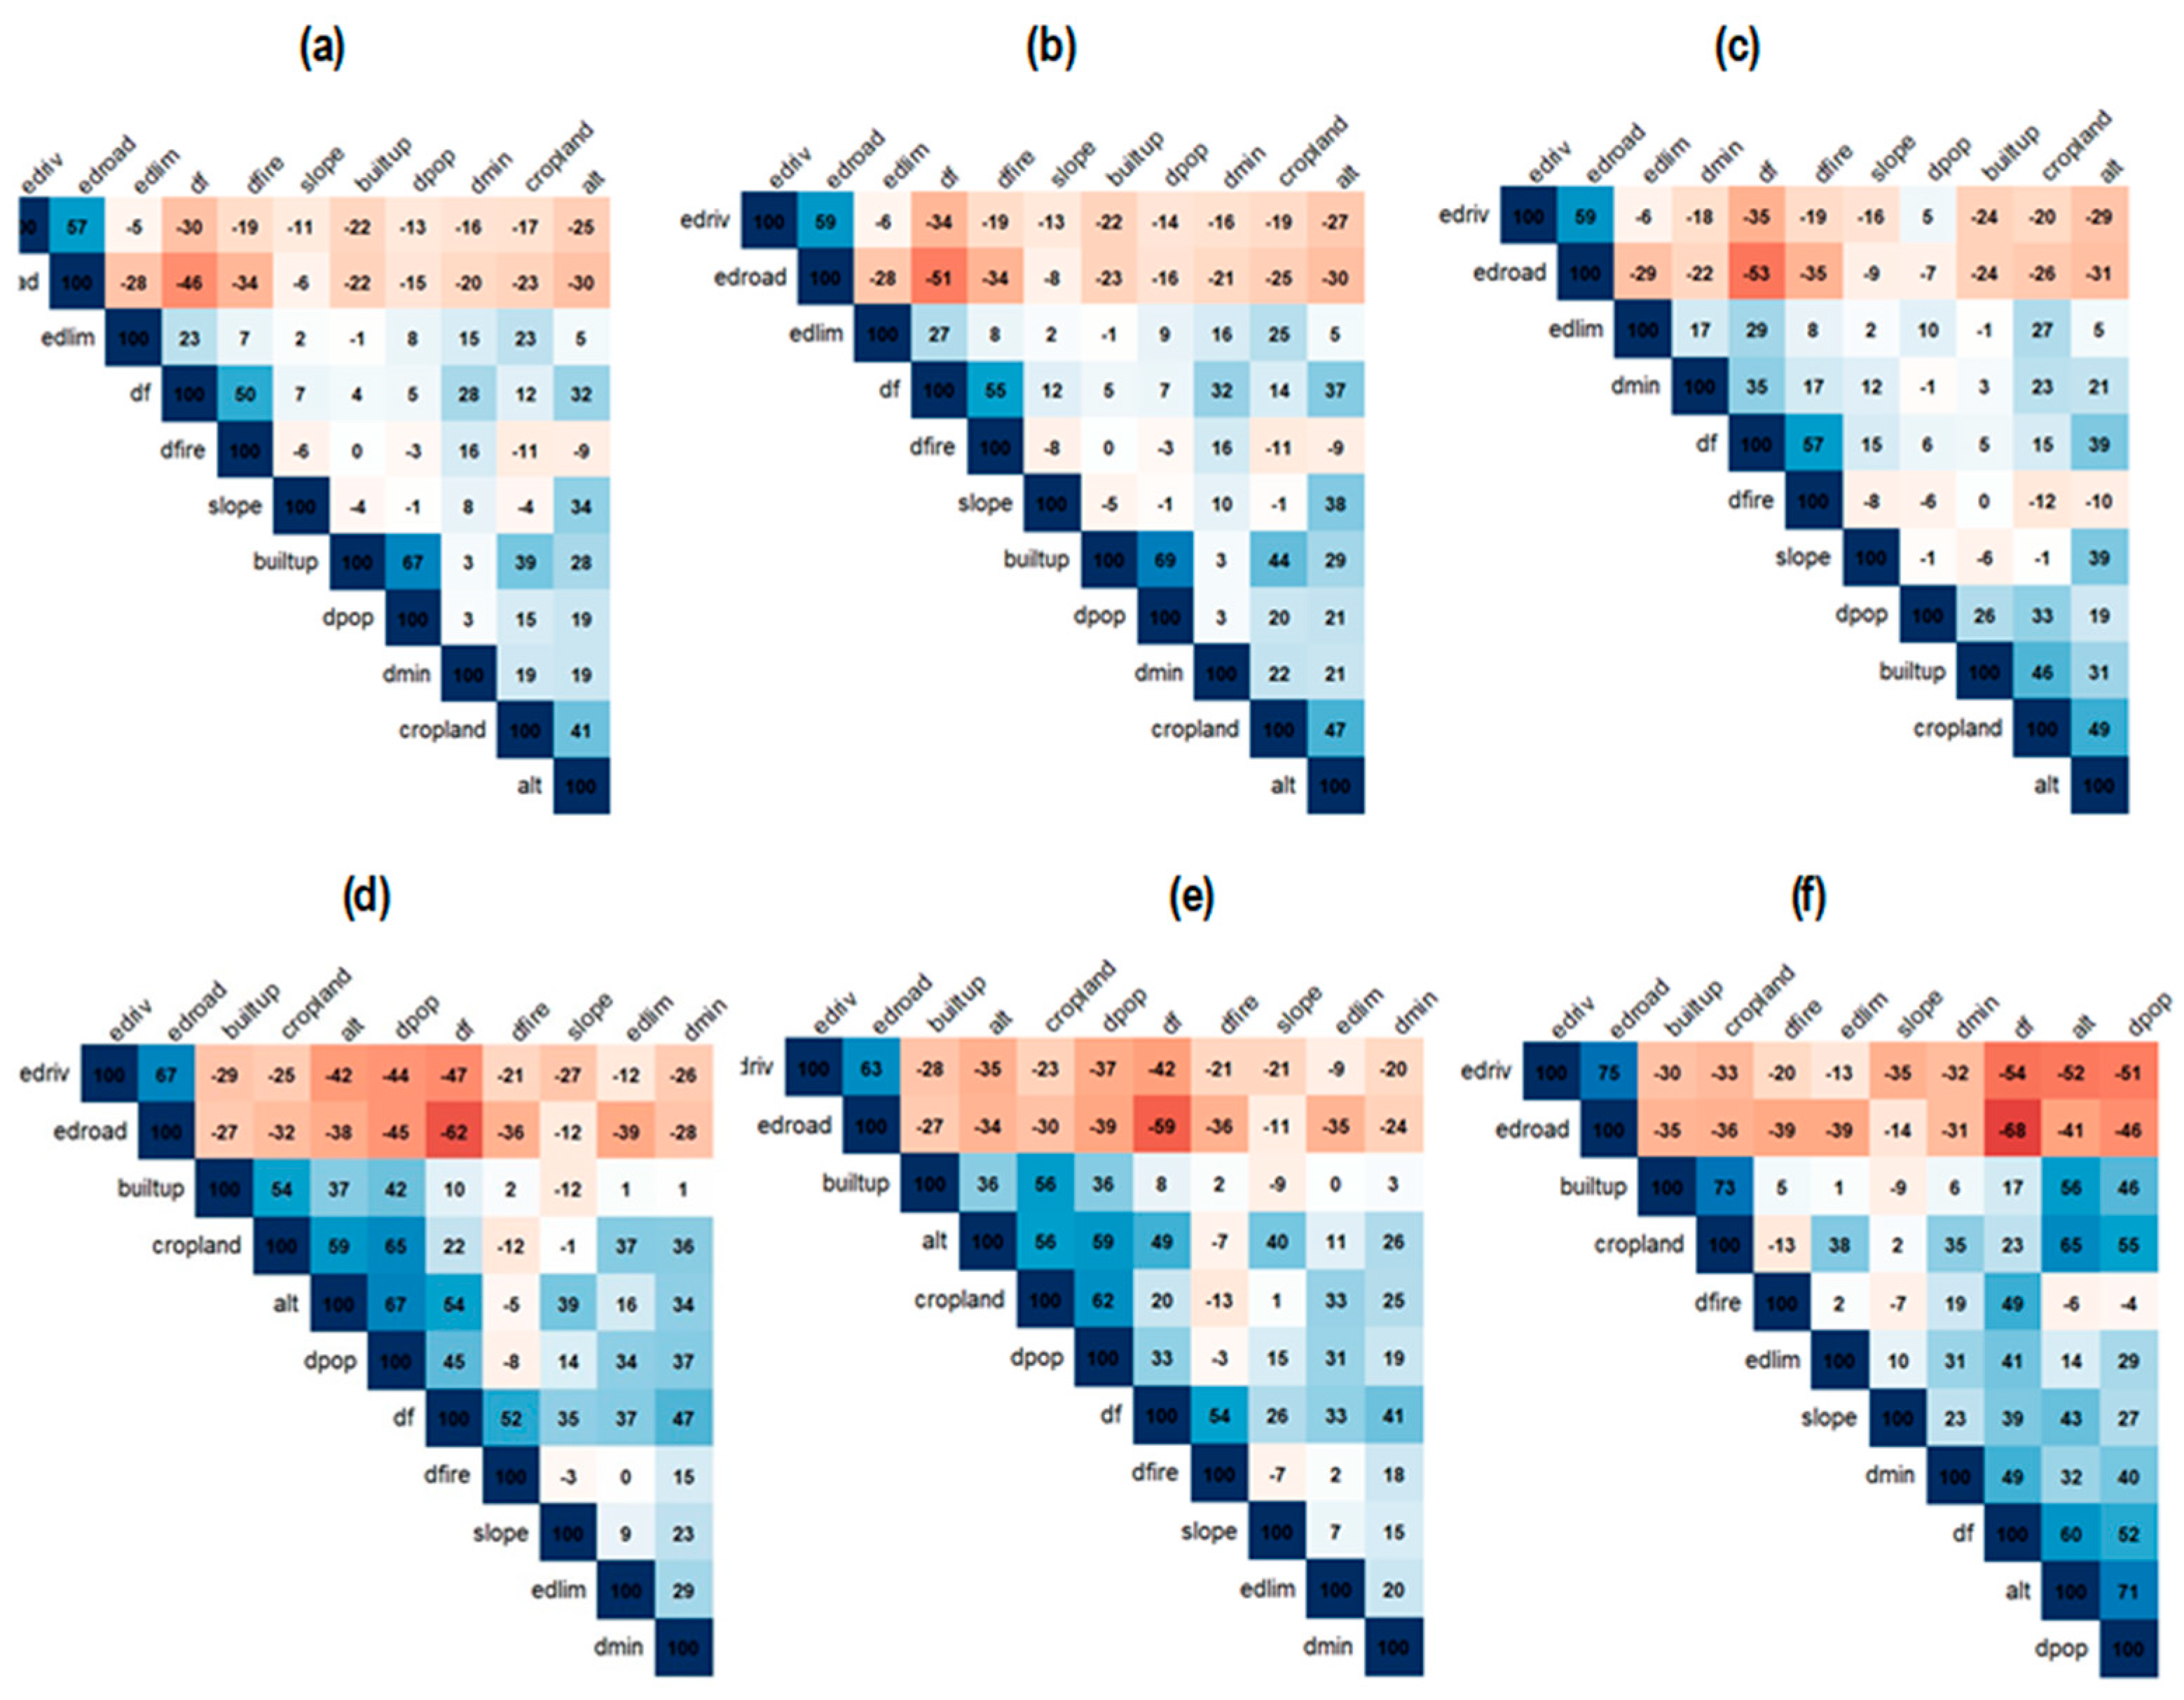
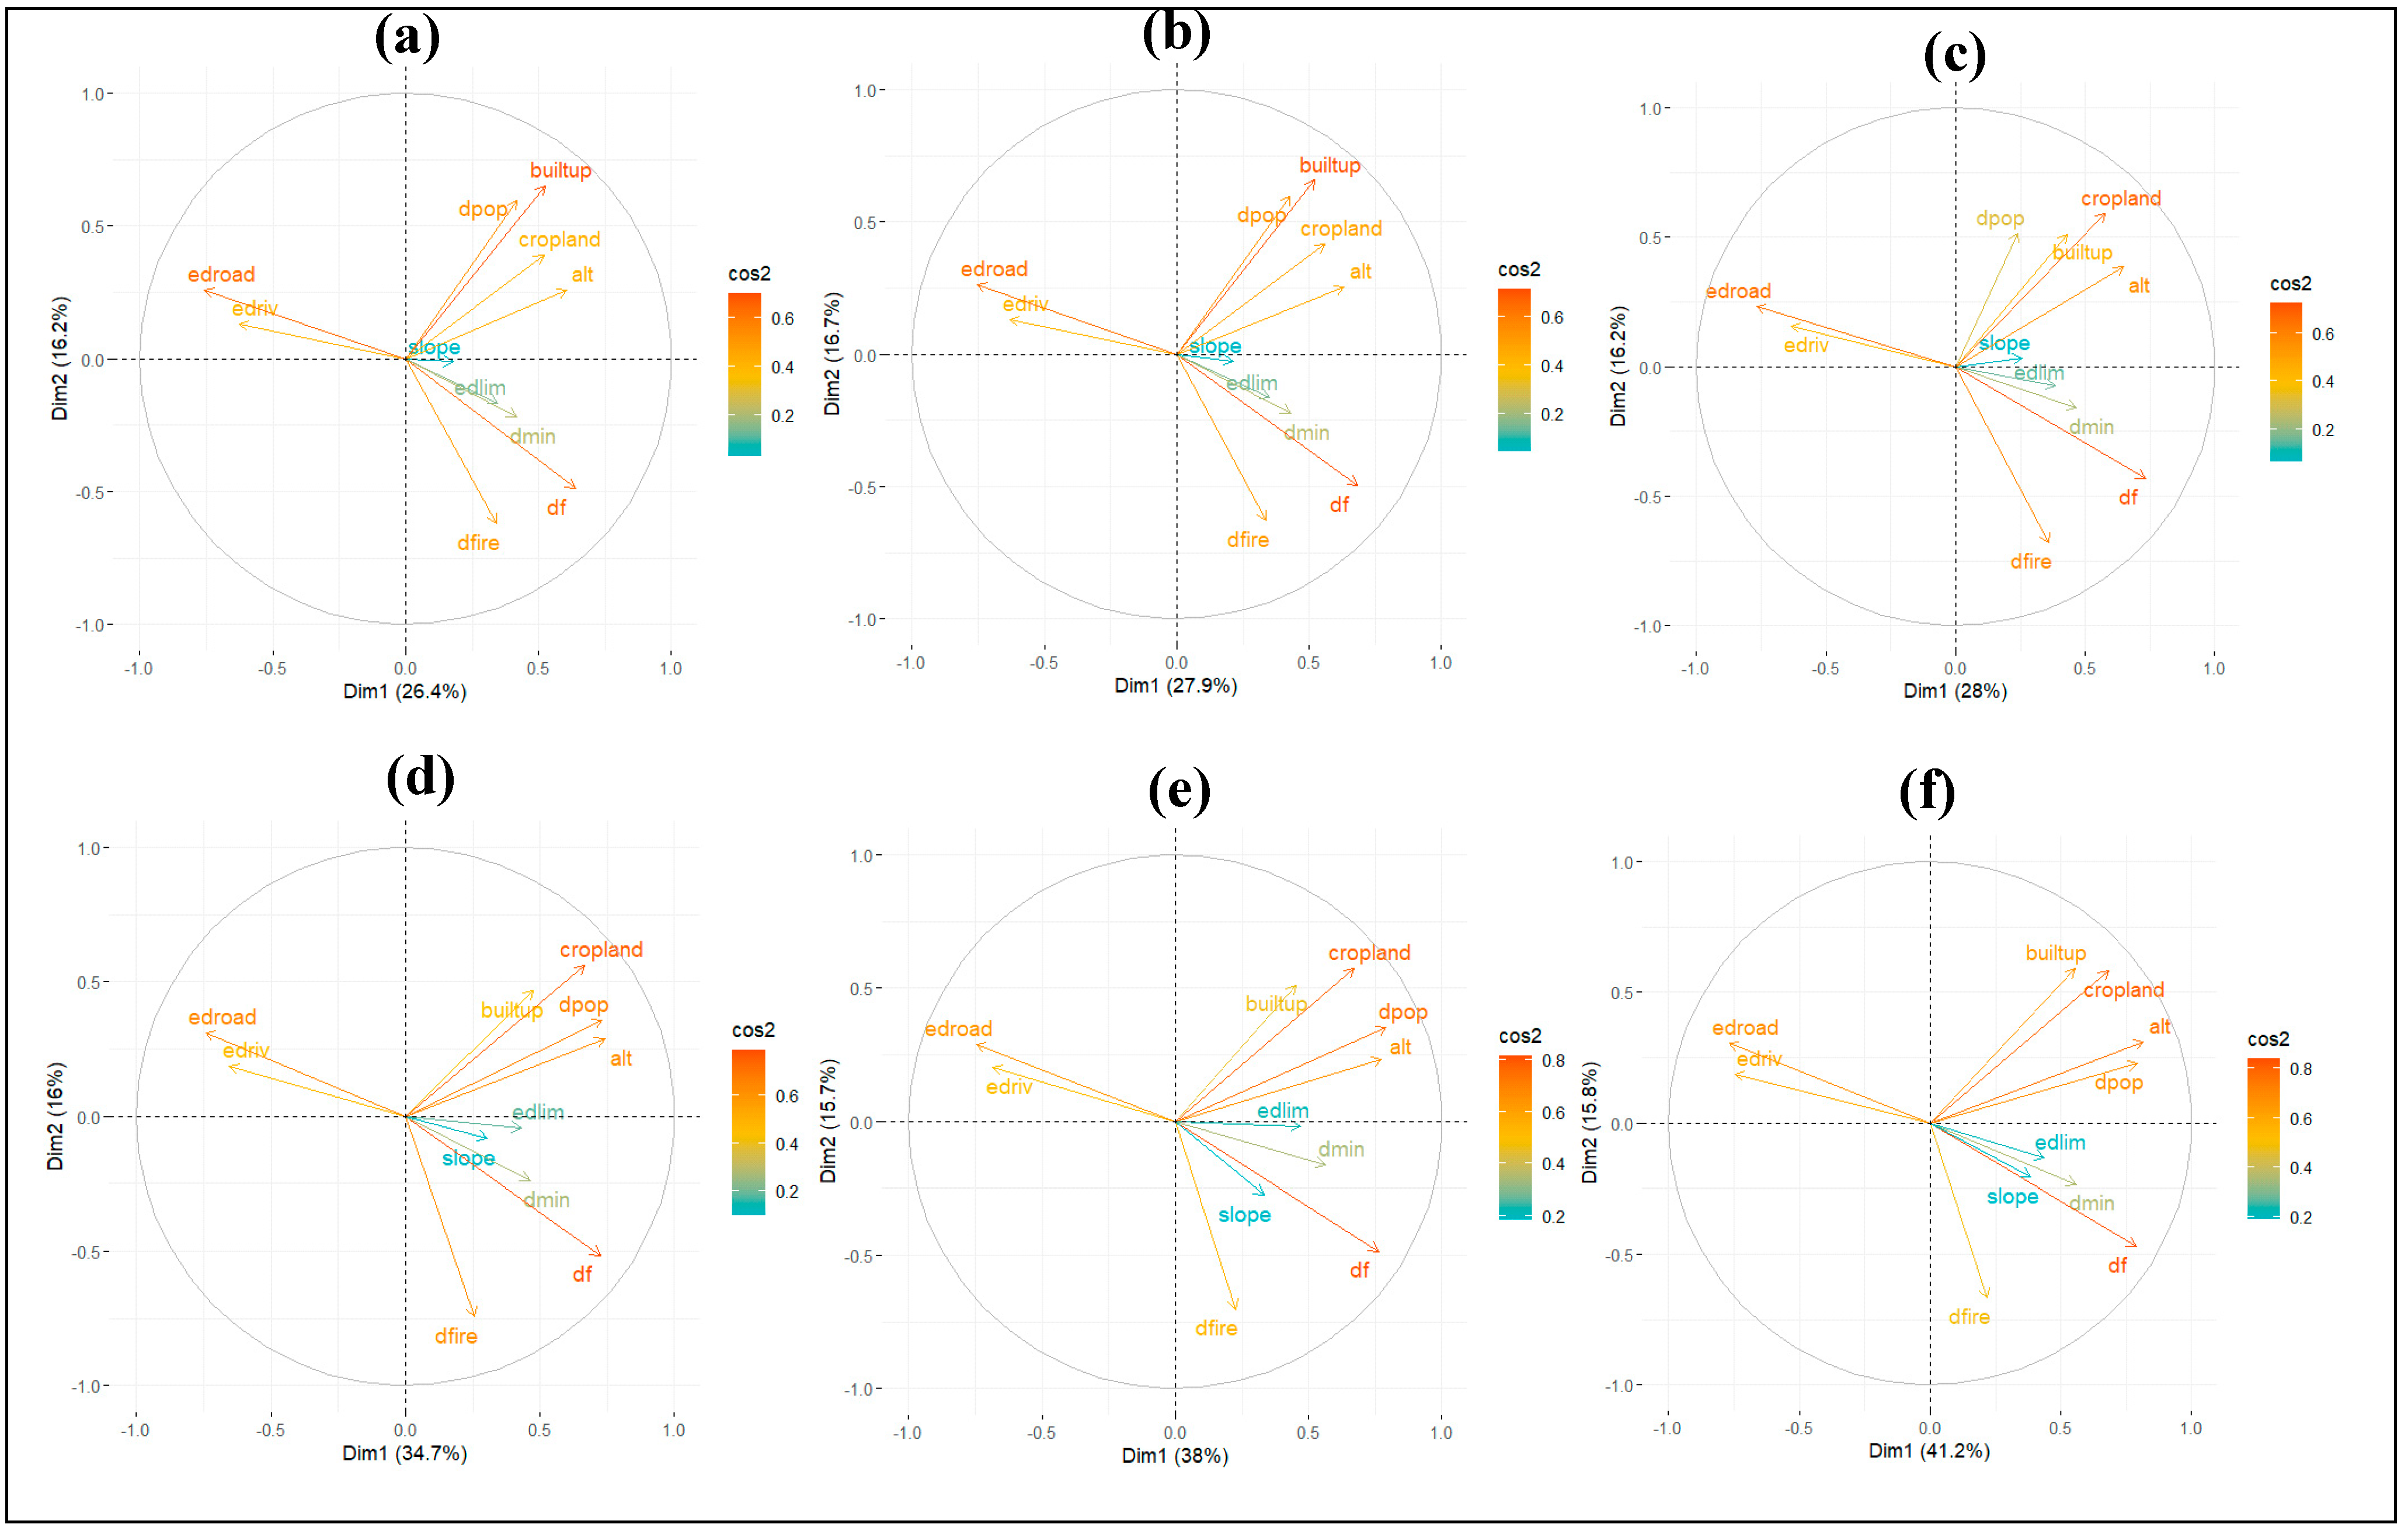
Figure A3 depict variable relationships in the model for moist forest variation in KBNP. While the first two principal components explain <75% variance, correlation circles show relationships between original variables and components. Relationships were tested across scales (1 km² (a), 9 km² (b), 25 km² (c), 100 km² (d), 225 km² (e), 400 km² (f)). Variables like Euclidean distance to roads and rivers are highly correlated across scales. However, rivers' Euclidean distance won't be considered due to its low Cos2 compared to roads. Its information is assumed included in the latter. Other variables show scale-dependent relationships significant for model construction.
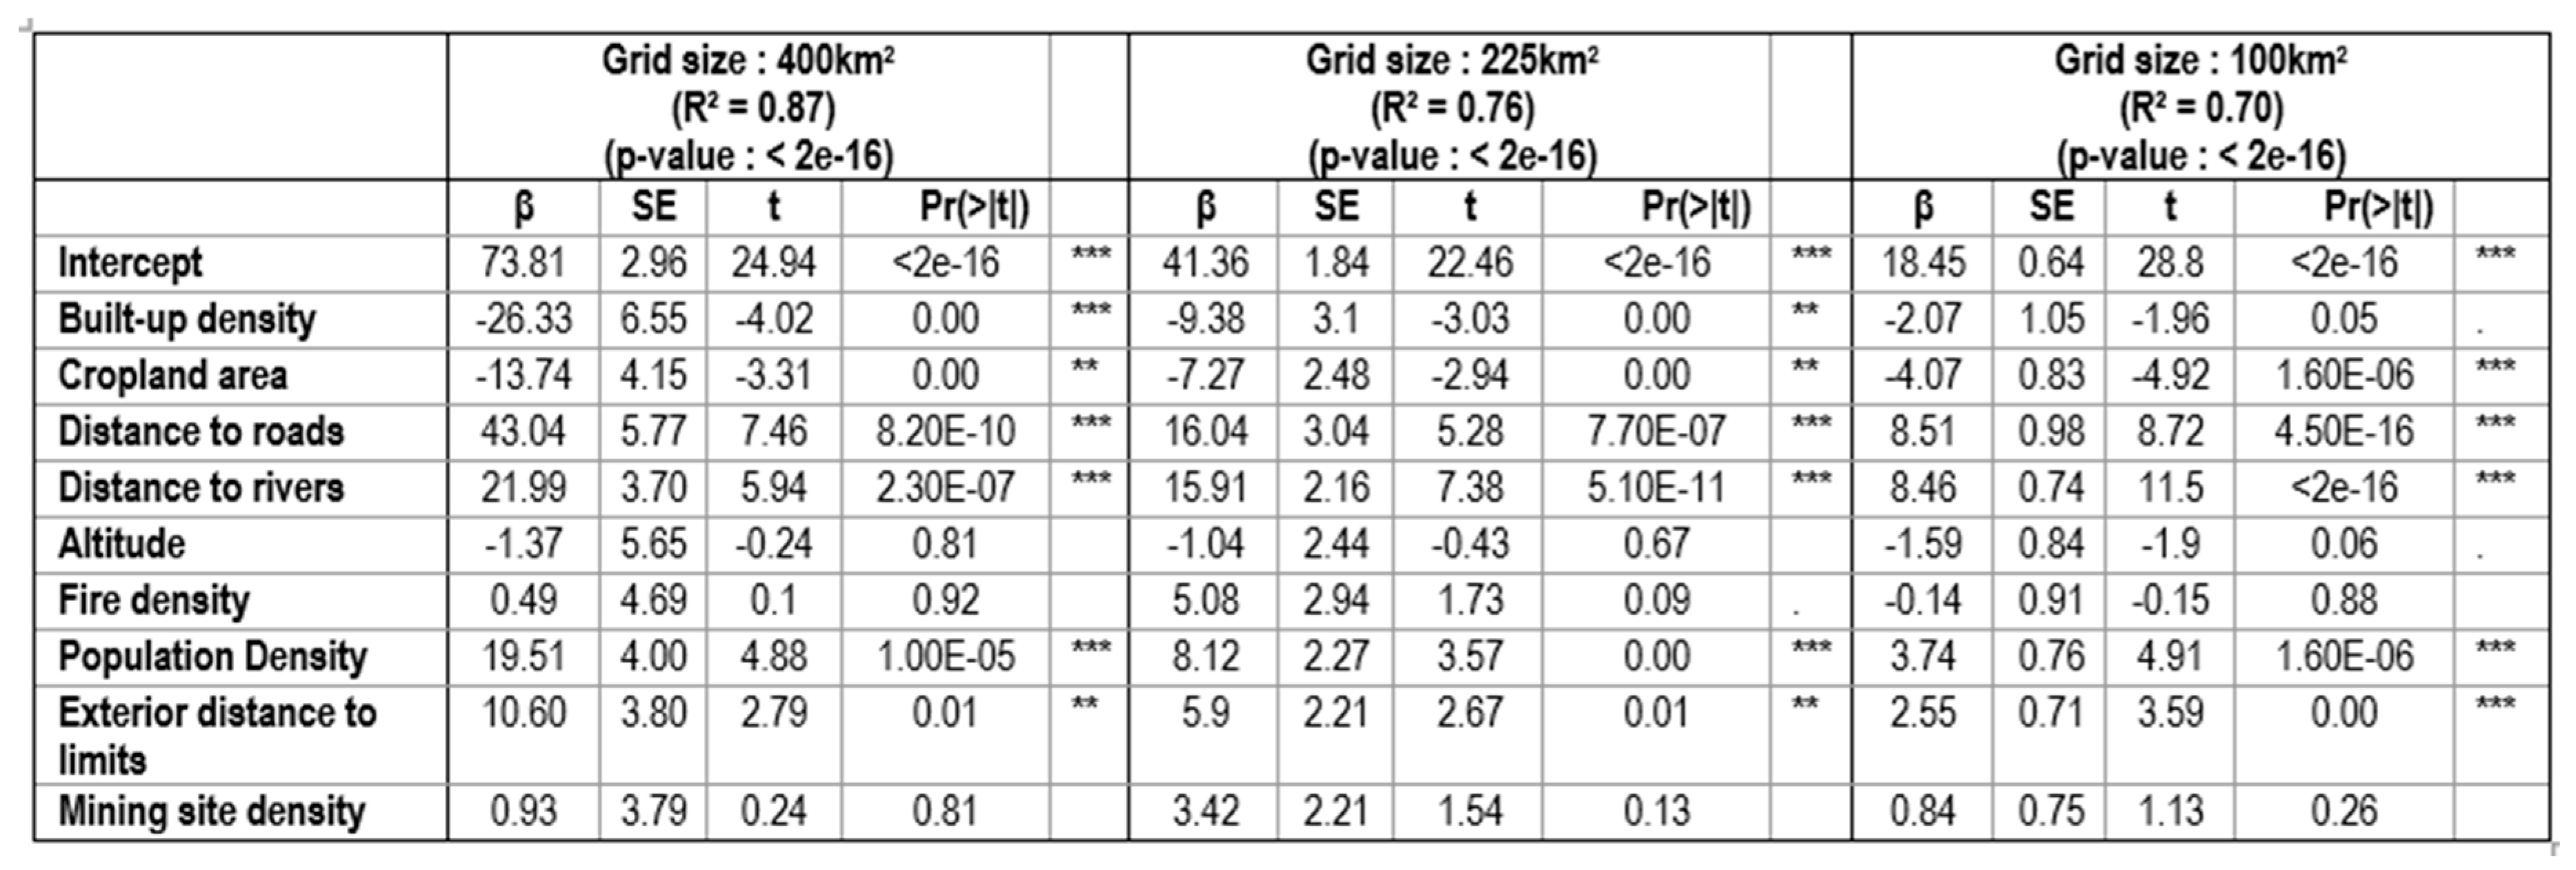
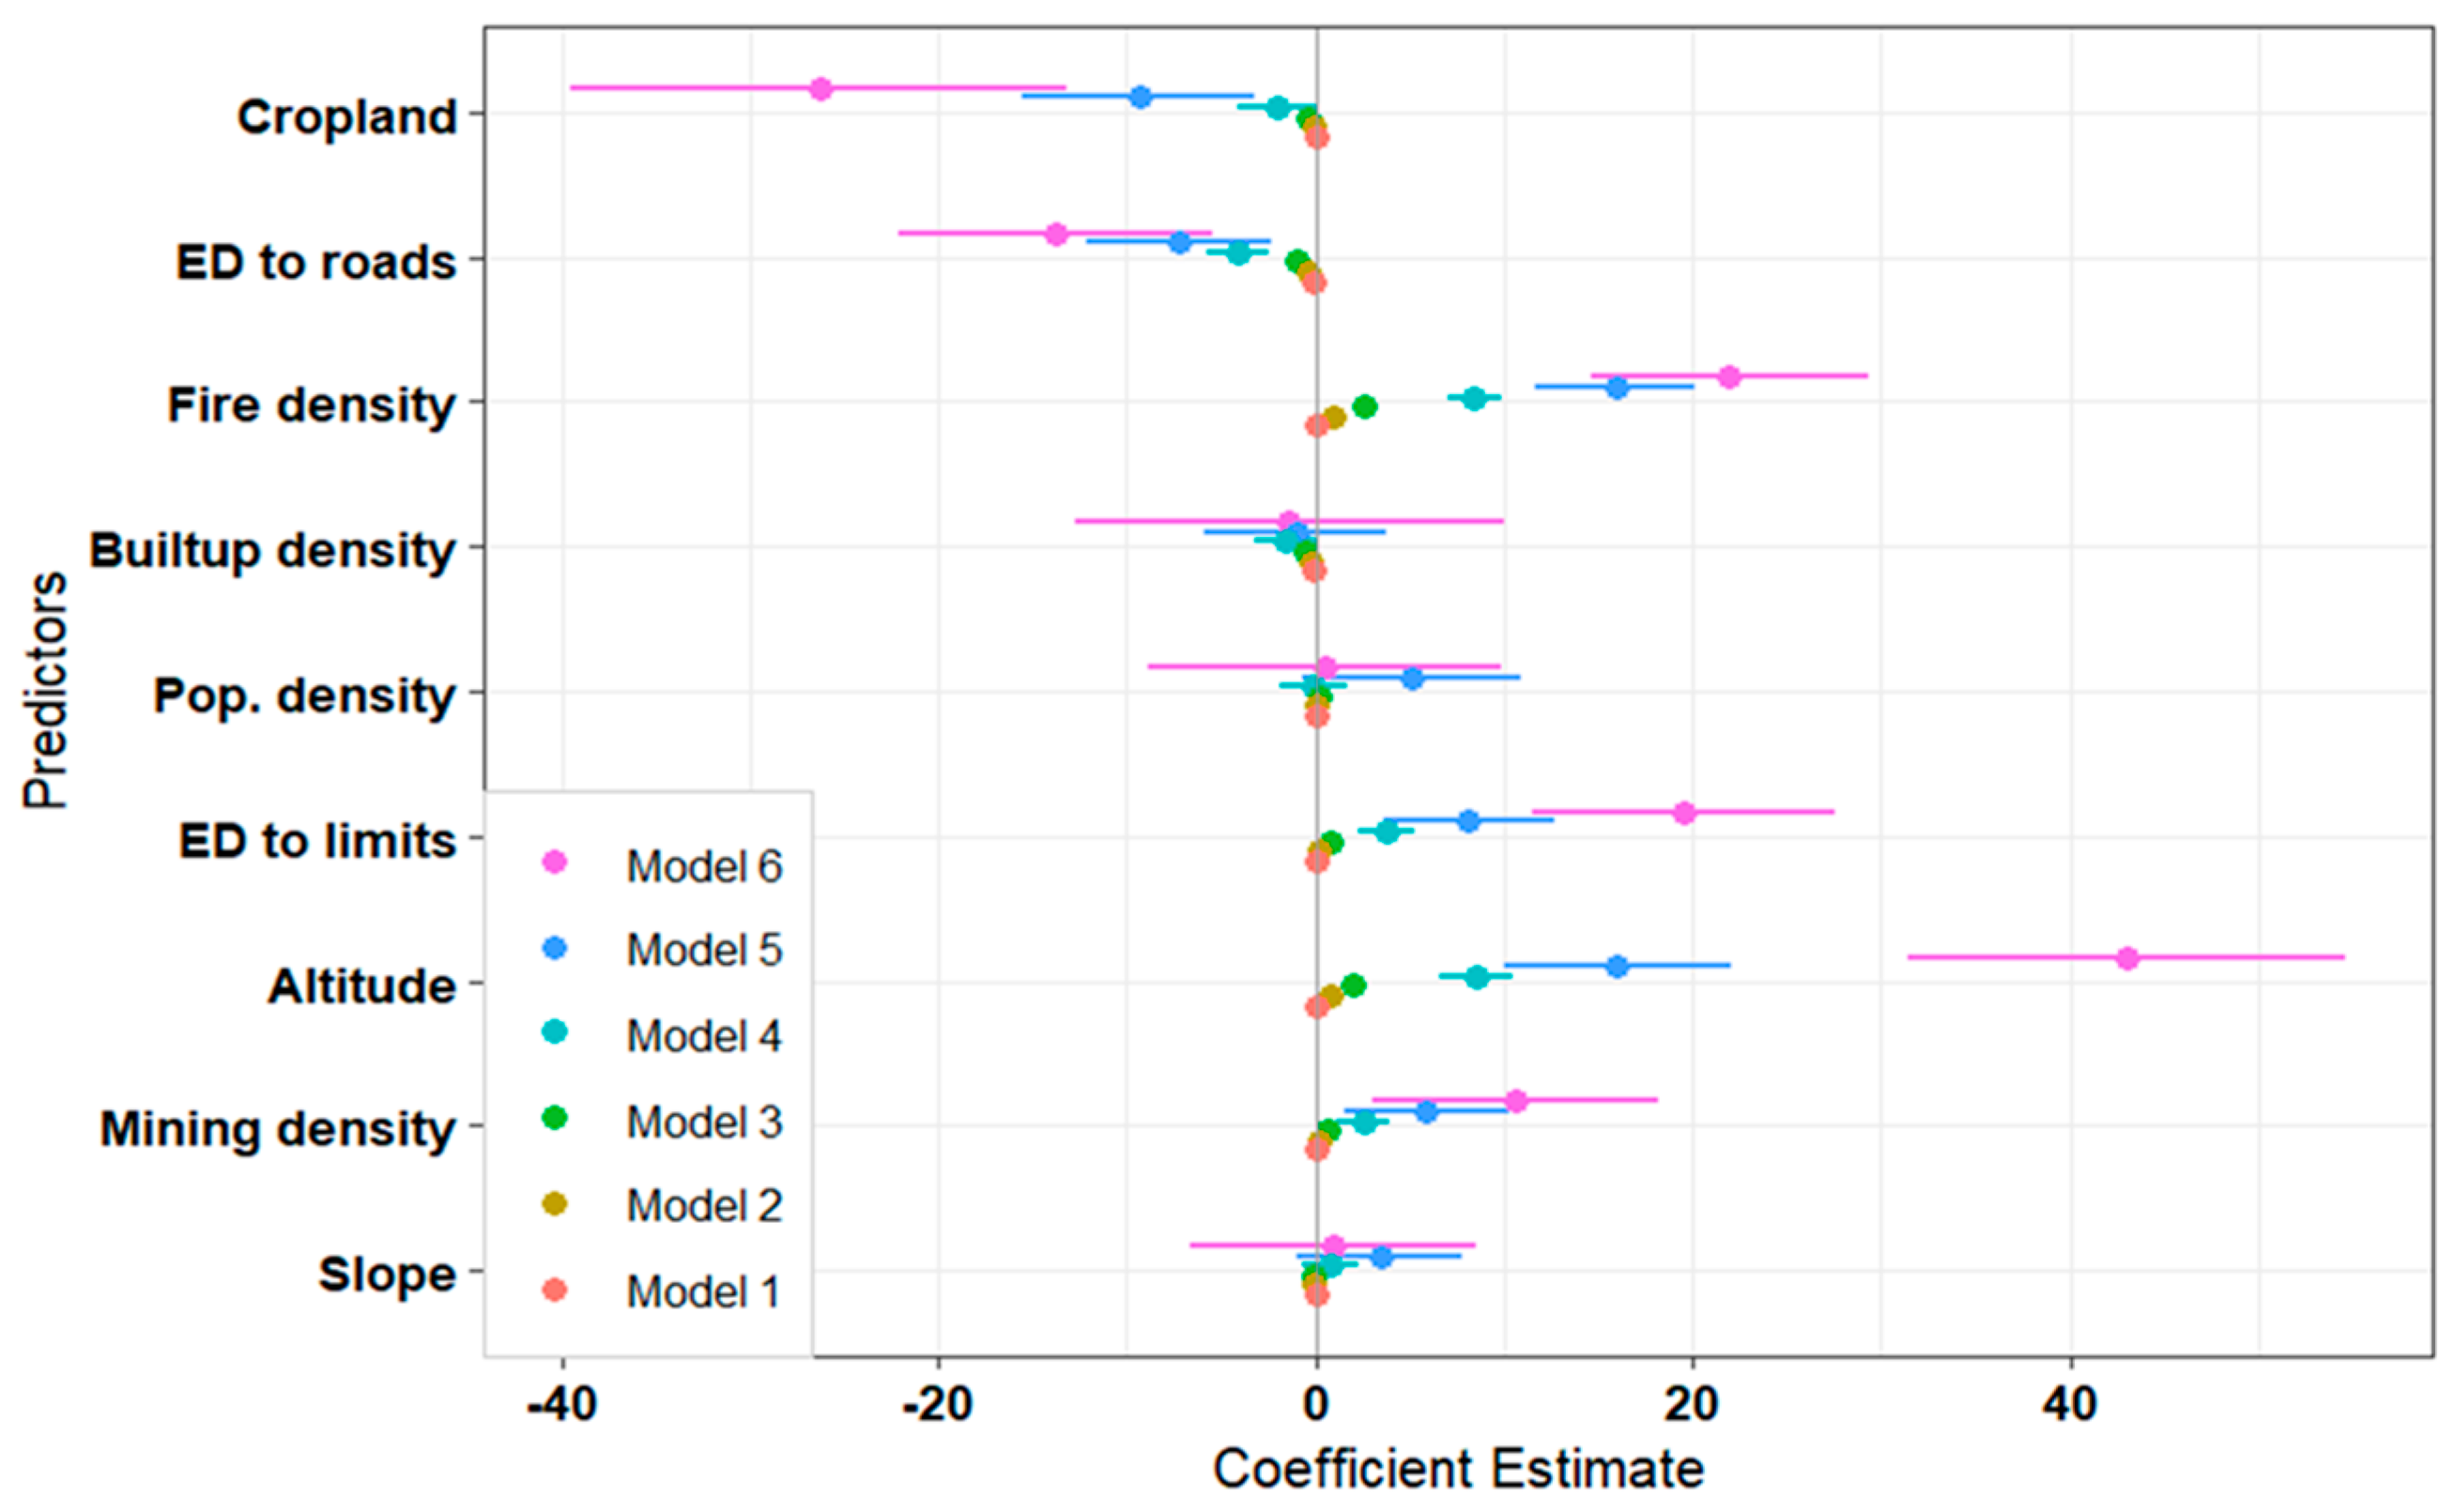
Figure 4 displays standardized estimate coefficients (β) with standard errors on the x-axis and predictors (variables) on the y-axis. Results indicate increasing coefficient variance with grid size, and R² values rose across models: 0.44, 0.57, 0.62, 0.70, 0.76, and 0.87 for models 1 to 6 (see Tables
A4 et
A5). However, variance analysis found no significant difference (p=0.67) in grid size impact on TMF variation in KBNP. Therefore, the 25 km² grid size was deemed optimal for zoning effect analysis on the landscape.
3.2. Assessing Zoning Effect on TMF Variation
Figure 5 and
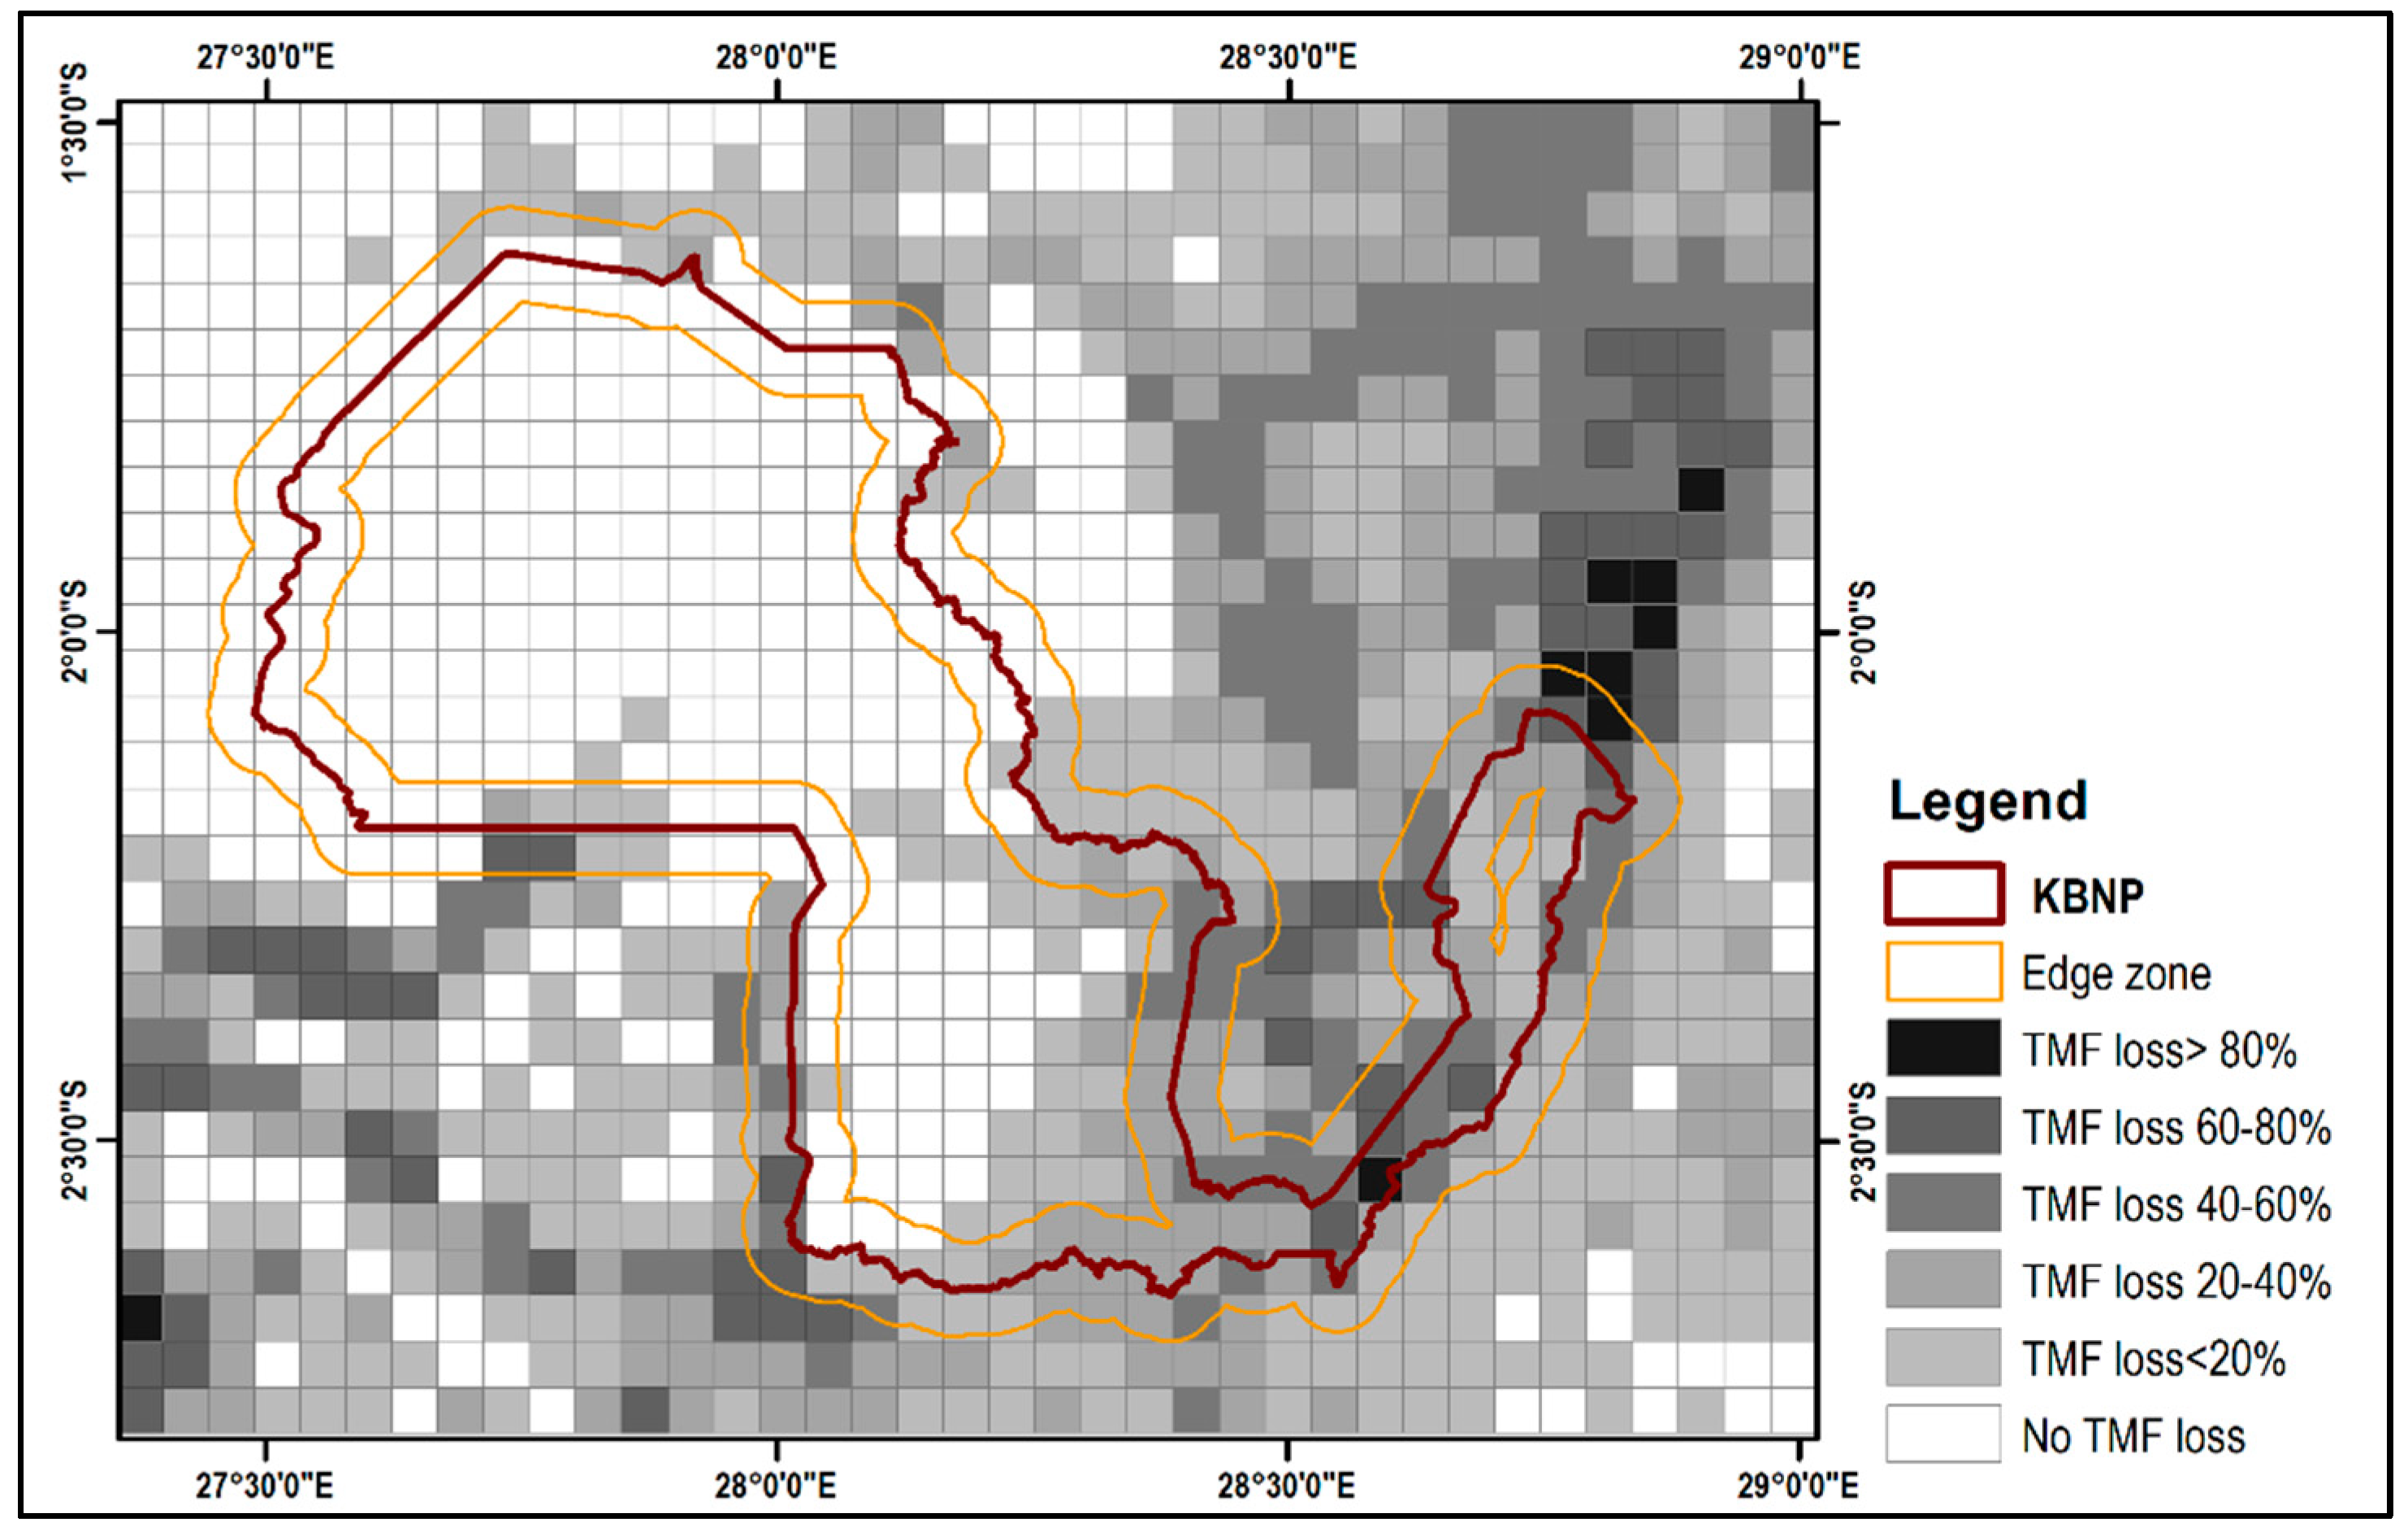
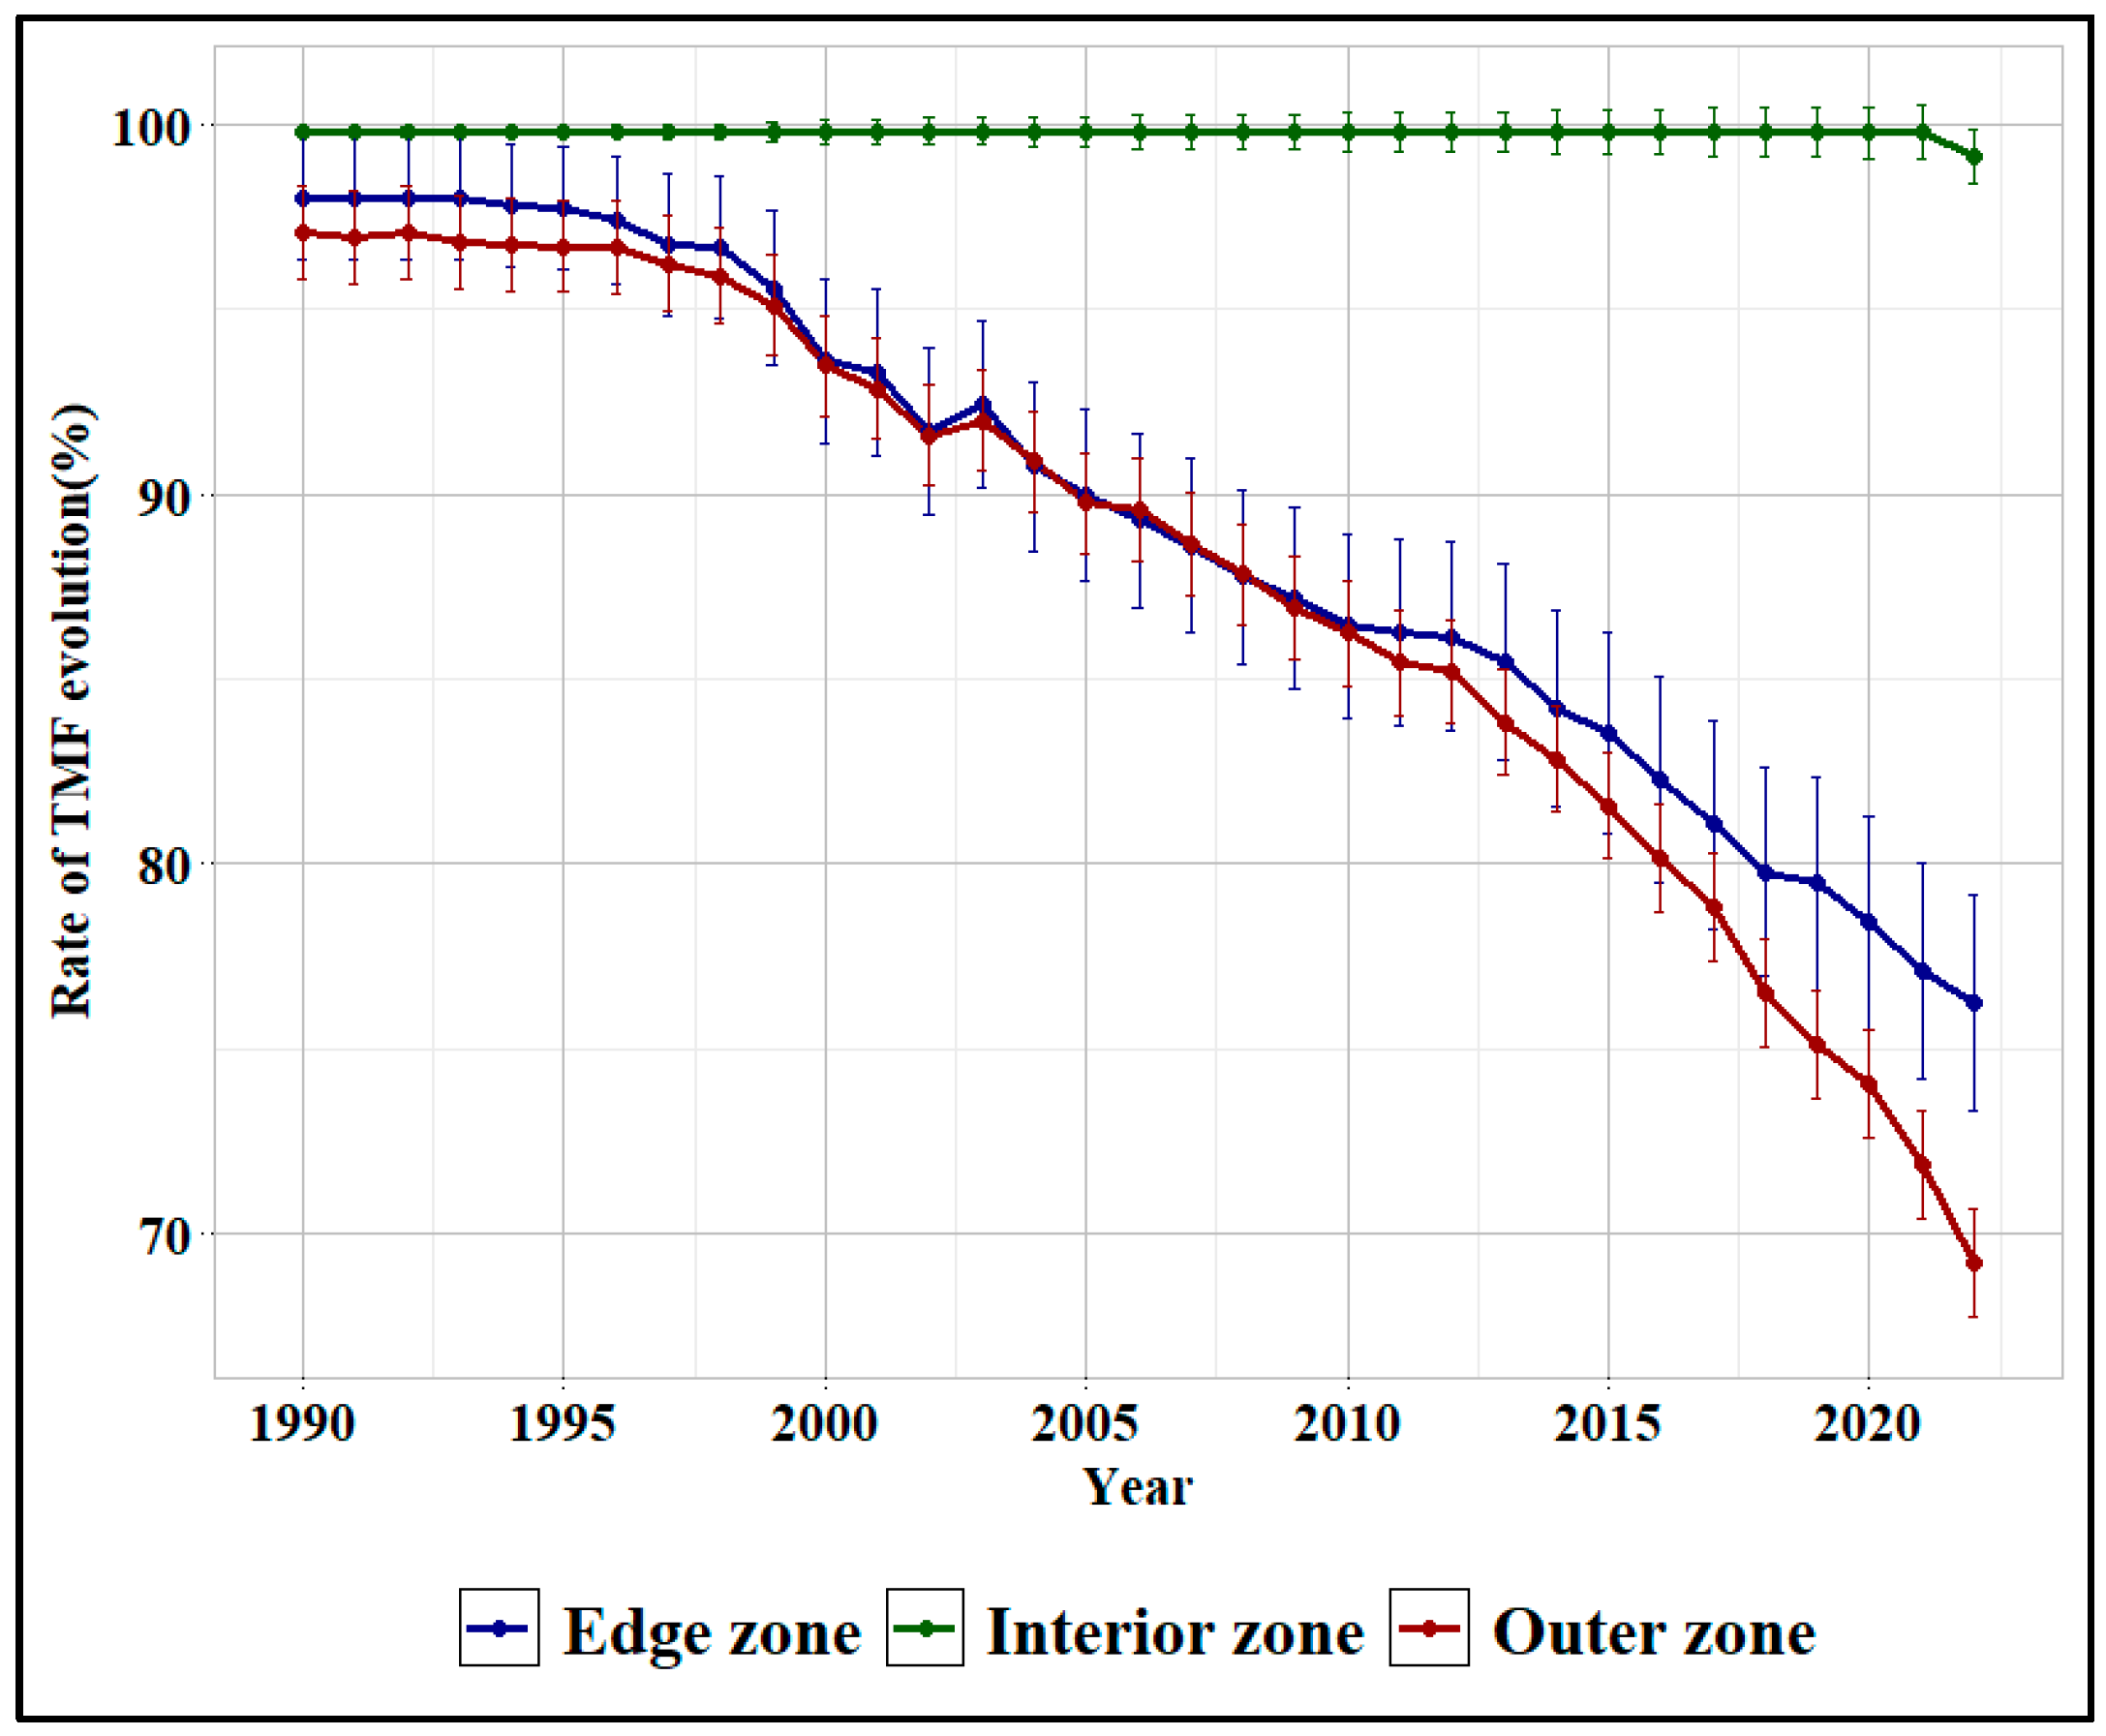
Figure 6 depict spatial variation of TMF (∆f) and TMF change statistics by sub-zone in KBNP from 1990 to 2022. Results reveal significant TMF regression in the outer and edge zones compared to the less dynamic inner zone. The median proportion of dense moist forest in inner patches remained stable around 100% from 1990 to 2022, while in the edge zone it decreased from approximately 98% to 76%, and in the outer zone from 98% to about 72% (
Figure 6).
Figure 6 highlights significant TMF variations, particularly outside the park (losses > 40%) and in the highlands.
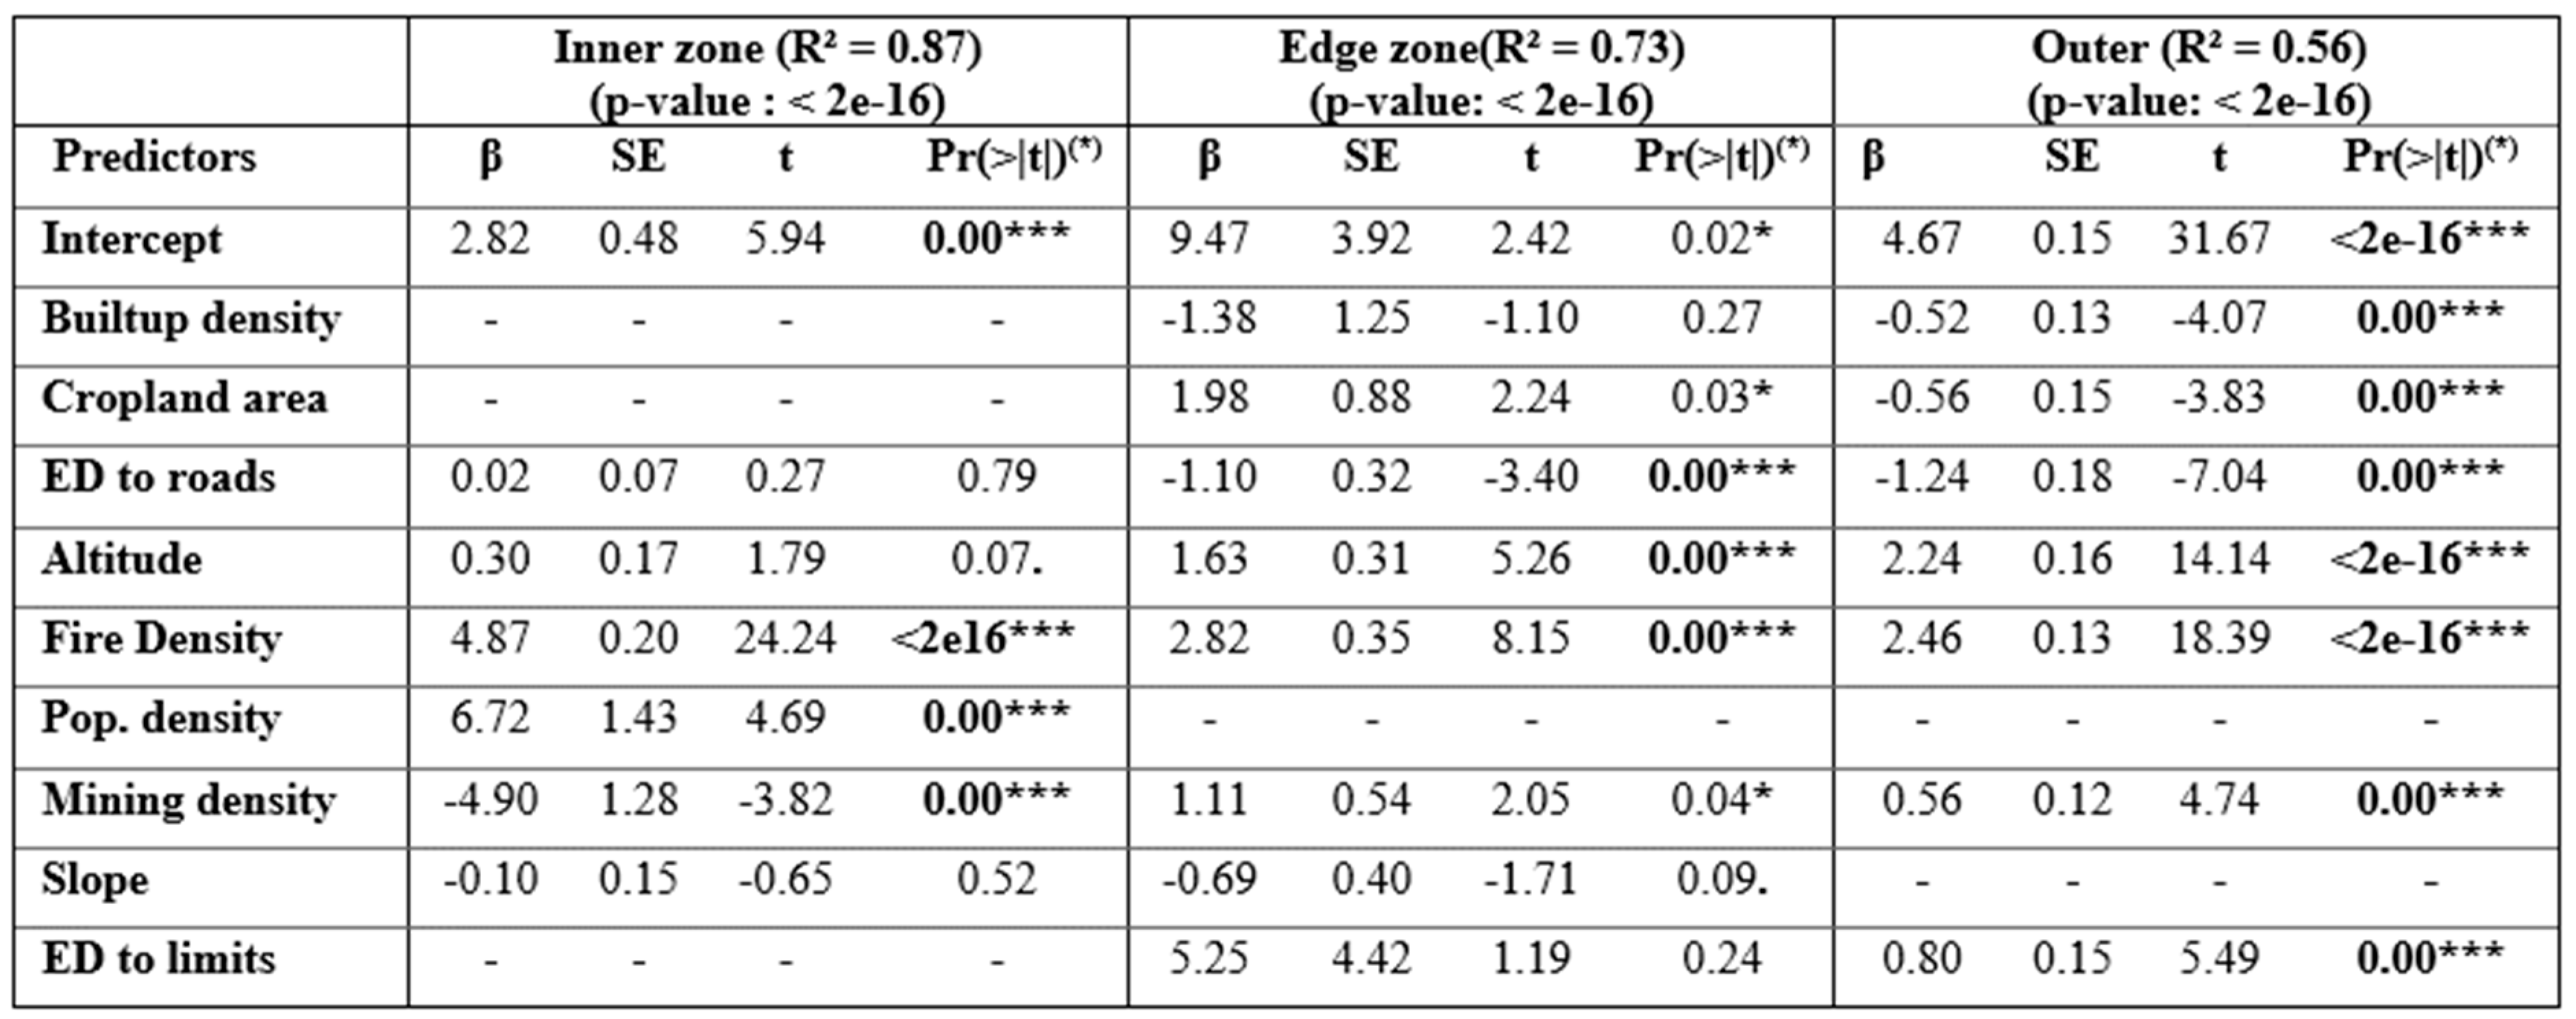
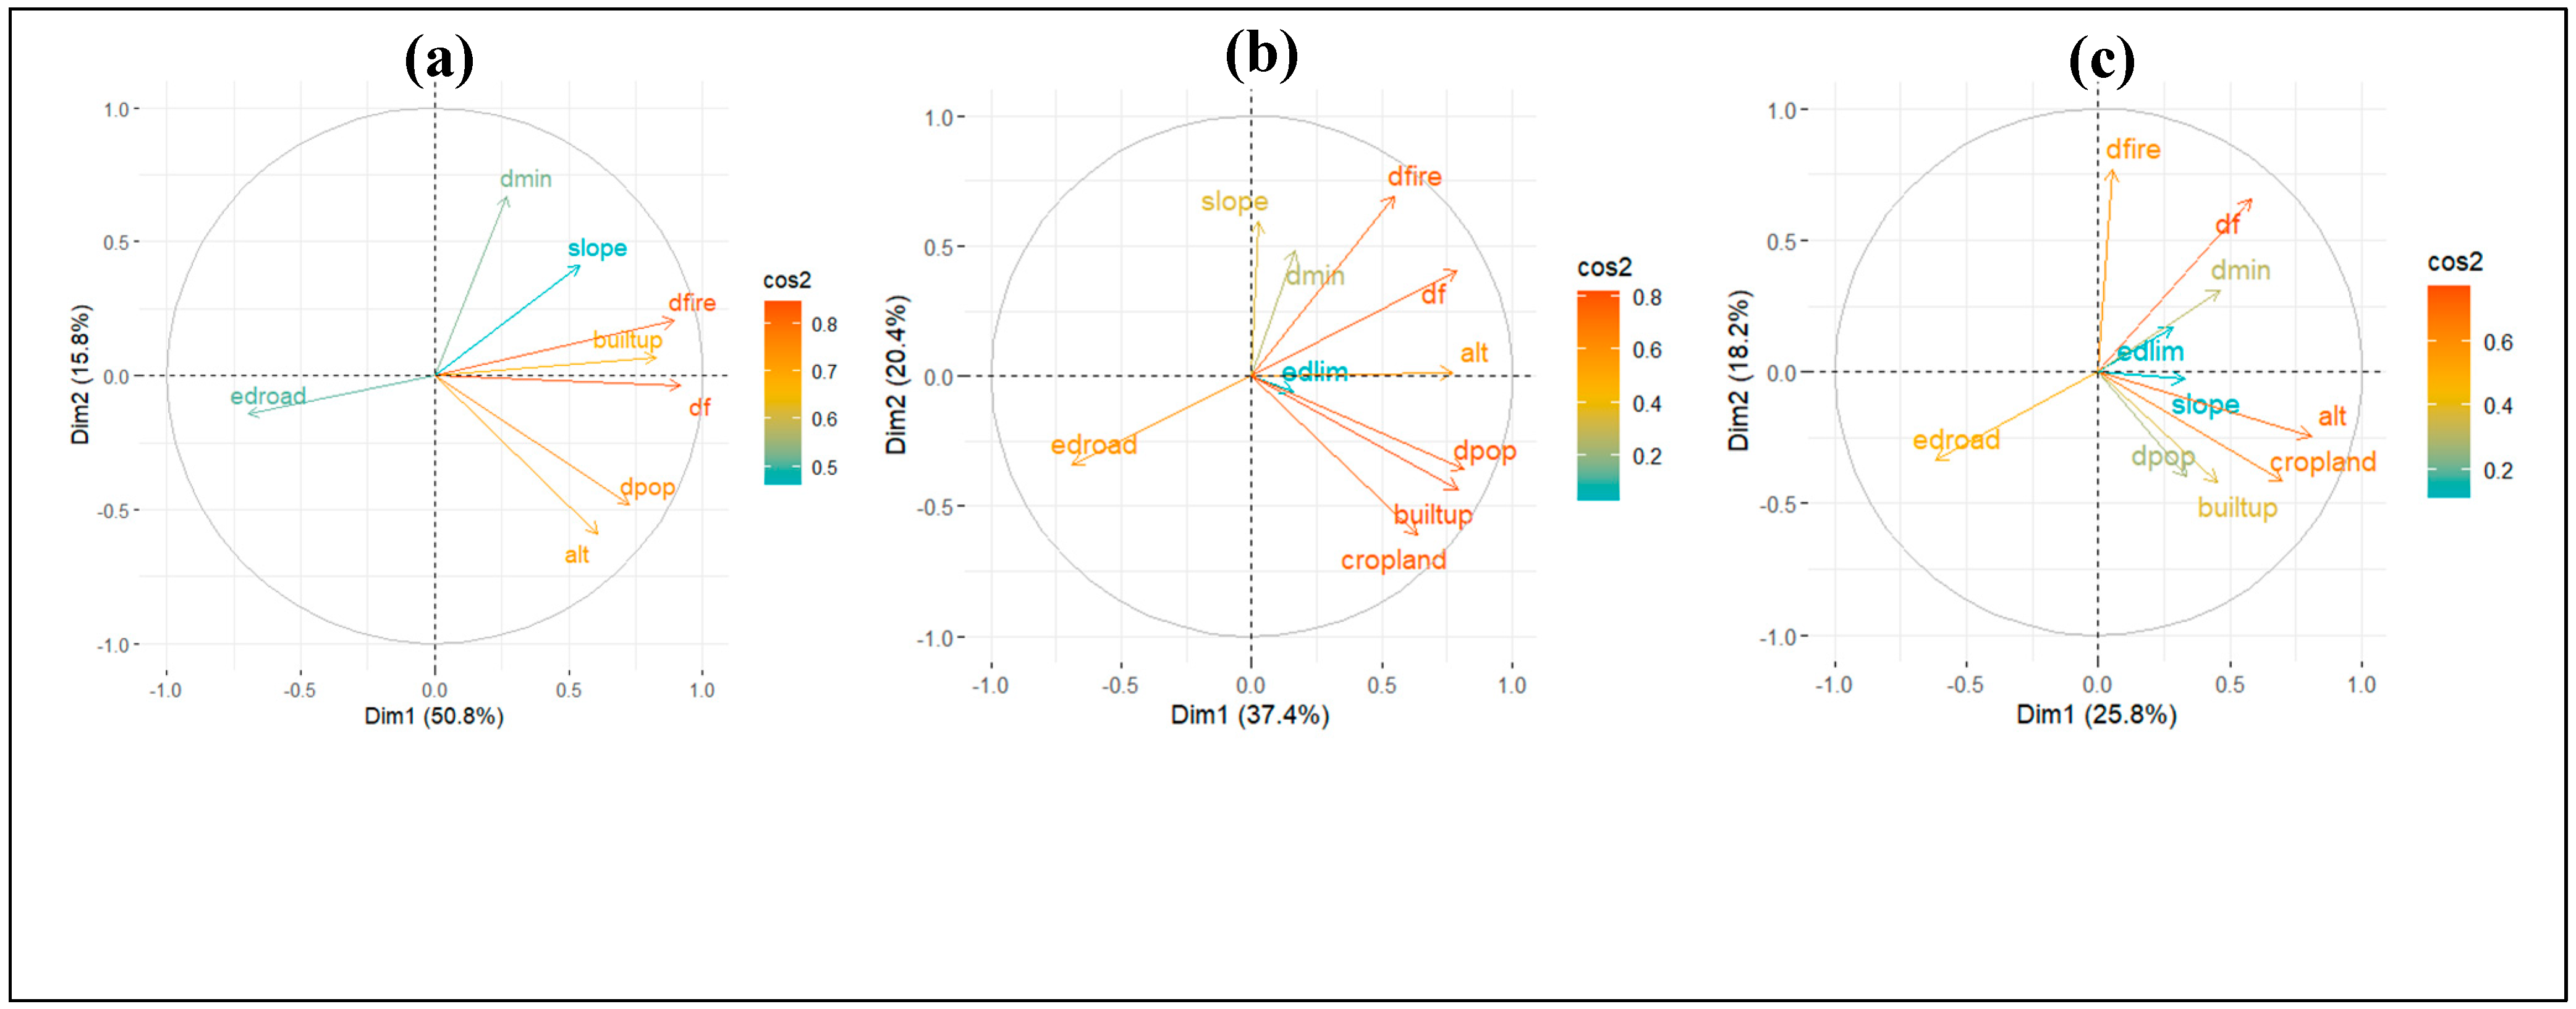
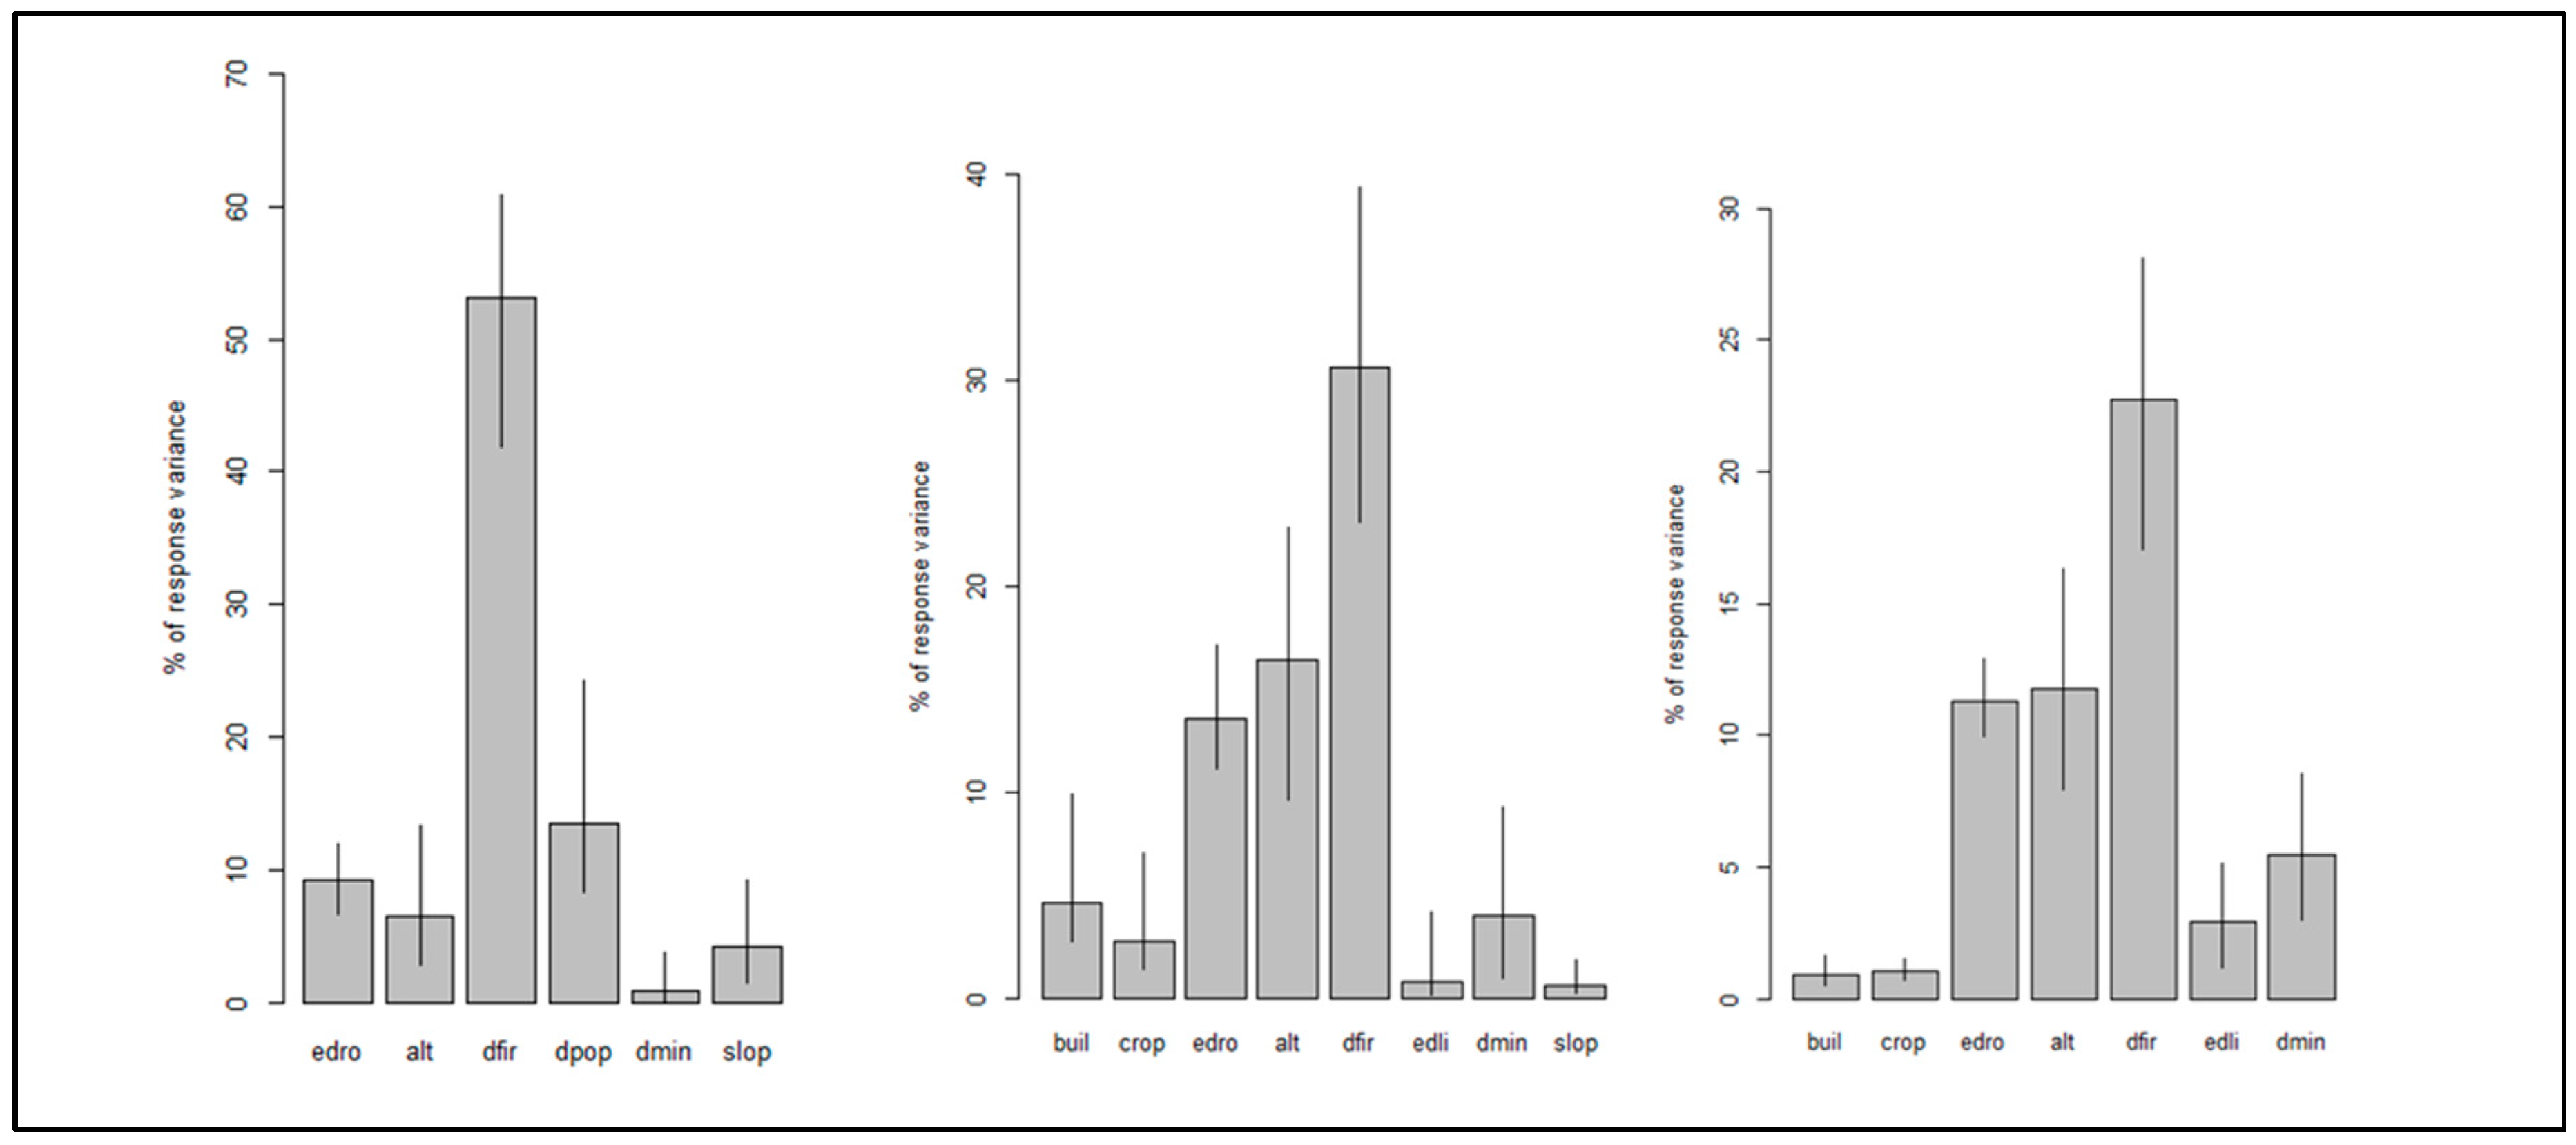
Figure 7a,b,c assess the relative importance of drivers on TMF variation in KBNP: fire is predominant across all zones (RI approximately 55%, 30%, and 23% respectively). In the inner zone, population density (~15%), road ED (~9%), and altitude (~7%) follow. In the edge zone, altitude (~17%), road ED (~15%), and built-up density (~10%) are influential. Altitude (~12%), road ED (~11%), and mining density (~7%) are significant in the outer zone, where mining sites increasingly impact TMF variation as distance from the protected area increases.
Table 2.
Multiple linear regression between tropical moist forest loss and the drivers analysed as a function of the zones making up the landscape of Kahuzi-Biega National Park. Legend: β : Coefficient estimate, SE : Standard Error, t= t value, Pr= p-value, ED : Euclidean distance.
Table 2.
Multiple linear regression between tropical moist forest loss and the drivers analysed as a function of the zones making up the landscape of Kahuzi-Biega National Park. Legend: β : Coefficient estimate, SE : Standard Error, t= t value, Pr= p-value, ED : Euclidean distance.
4. Discussion
4.1. Data, Methods, and Limits of the Study
Human-induced habitat change profoundly impacts on biodiversity, including forest degradation and loss [
78]. This study examines tropical moist forest dynamics in Kahuzi-Biega National Park from 1990 to 2022. The typological methodology used assesses the relative importance of contributing drivers. The IUCN mission in 2017, evaluating the park's UNESCO World Heritage status, noted gaps in forest dynamics and deforestation submissions. This observation prompted further reflection. Indeed, the intact forest block represents the third conservation objective of the park [
40] but monitoring has been hindered by persistent cloud cover, especially from 1980-2000. Leveraging advancements in remote sensing and machine learning [
16,
42,
67], we sourced global tropical moist forest dynamics data [
9]. This dataset distinguishes disturbances over three decades, revealing extents of undisturbed primary and secondary forests [
9]. A 15km outer zone around KBNP enhances assessment of park effectiveness in mitigating disturbance as highlighted by other studies [
21,
44,
79]. Drivers analyzed include global, regional [
12,
21,
23,
64,
65,
66,
80,
81,
82], and local-scale literature [
30,
34,
35,
38]. We could not use the global data on the human footprint on biodiversity conservation by Venter et al. [
66] due to its low spatial resolution (1 km²), lack of updates, and numerous gaps in the study area. Our analysis includes a broader range of drivers than those considered in Venter et al.'s study, which focused solely on infrastructure, land cover, and human access to natural areas.
The study's primary limitation is the sparse and uneven spatial distribution of available data on the variables analyzed (e.g., population data limited to health zone scales), preventing a comprehensive multi-temporal analysis. To mitigate this challenge, a mesh method for multi-spatial analysis aggregated variables spatially within the landscape [
83]. This approach facilitated assessing each variable's contribution and constructing analytical models by statistically comparing values across cells. Adopting a zoning approach, uncommon in such studies, addressed dynamics near boundaries by isolating and treating them separately as an 'edge zone'. This isolation may introduce biases beyond control but likely does not alter overall trends. Variable selection combined PCA with Pearson correlation tests, focusing on variables explaining less than 70% variance [
71]. Linear regression models commonly used for spatial phenomena face spatial autocorrelation in residuals, indicating specification errors [
84]. Thus, conclusions relied on relative importance analysis over probability values, employing bootstrap resampling to address these challenges [
77]
4.2. TMF Dynamics and the Influence of Deforestation and Degradation Drivers
Given that ecological processes operate across diverse spatial and temporal scales [
85], we tested how aggregation scale affects moist forest dynamics in KBNP landscape. Analysis found no significant differences across scales (p=0.67, α=0.05), aligning with Qi and Wu (1996) on biomass scale independence. Regression coefficients rose from 0.44 to 0.87 from 1km² to 400km², reflecting reduced unit variation and increased within-unit variance at larger scales [
85]. Yet, this scale increase doesn’t guarantee better modelling, as finer scales better capture local disturbances [
72]. Among 1km², 9km², and 25km² scales tested, 25km² was optimal (R²=0.62), with seven of nine variables significant. At 25km², detailed sub-zone analysis from 1990-2022 showed varying TMF reductions across inner, edge, and outer zones.
Among the three zones analyzed, the inner zone showed less tropical moist forest (TMF) loss from 1990 to 2022. However, fire use, human presence, distance from roads, and altitude influenced its dynamics. Consistent with other studies [
12,
16,
48,
49,87–90], forest loss correlated positively with higher fire and population densities and greater accessibility (distance to roads and slope). It is generally perceived that the exploitation of fragmented forests and forest edges is a more straightforward process than that of dense tropical forests[91]. Interestingly, TMF loss in the inner zone contrasts with larger-scale analyses, possibly due to limited, artisanal mining activities in remote park areas, mainly exploiting gold and coltan on non-forested sites like rocks [92]. Historical factors, including park boundary expansions in 1975 without community consultation (Busane et al 2021, Spira et al 2019), followed by armed conflicts from 1996 to 2004 [
15,
39], exacerbated cultural conflicts and led to widespread illegal activities like logging, fires, and mining, significantly impacting TMF regression in this once-intact landscape [
34,
37,
40,
62]. By analysing the dynamics of TMF in the edge zone and the outer zone, it can be observed that the greatest losses occur during the periods in which wars are reported to have begun and during which there were major civil invasions in and around the KBNP [
26,
37,
39,
40]. This confirms the results already found by other authors [93,94] who have reported significant impacts of population movements on forest conservation, notably the increased need for agricultural land, firewood and building materials. The impact of altitude noted for both zones can be attributed to the fact that the high-altitude zones of the park are more susceptible to human influence due to their high population density[
34,
40]. Conversely, the low-lying areas are less dynamic, largely due to their isolation and limited accessibility.
Compared to the interior zone, both the edge zone and exterior zone have experienced more significant dynamics due to various deforestation and degradation drivers, making them more susceptible to external pressures. In these zones, TMF loss rates are nearly identical, reflecting the vulnerability of areas near the park boundaries, which lack a well-defined buffer zone recognized by the KBNP. Studies in protected areas [
46,
79,95,96] underscore the role of buffer zones in alleviating pressure on interior forests. For example, [
48] observed significantly higher forest losses (up to four times greater) in buffer zones surrounding protected areas in the DRC compared to the interior zones where losses were well below the national average.
The edge zone of Kahuzi-Biega National Park is particularly affected by fire use, altitude, and distance from roads, as well as built-up density, mining density, and agriculture. These relationships align with findings from previous studies mentioned above. Furthermore, the study conducted by [97] in eastern DR Congo revealed that agriculture and urban expansion contribute significantly (25 times greater) to deforestation than artisanal mining. Interestingly, built-up density shows a negative correlation with TMF loss, indicating that deforestation occurs farther away from urban areas characterized by densification rather than expansion. As population density rises, so does demand for forest resources, leading communities to penetrate deeper into the forest for survival needs. The study, conducted by [
63] in Falgore Game Reserve (Nigeria), revealed that communities are willing to travel up to 10.25 km from their villages to the forest in search of forest products. The edge zone, covering significant highlands of the park, faces intense human pressure exacerbated by local poverty, driving activities such as logging, charcoal production, non-timber forest product collection, slash-and-burn agriculture, and small-scale livestock farming [
29,
40,92]). Proximity to National Road No. 2 within the park's internal boundaries further amplifies these effects. In the outer zone of Kahuzi-Biega National Park, TMF variation is influenced by analyzed drivers, particularly fire, altitude, distance from roads, mining density, and proximity to the park boundary. These trends echo findings from previous studies [
12,98,99], highlighting them as primary drivers of deforestation and degradation in the DRC, albeit at varying rates compared to this study. For instance, small-scale agriculture, driven by population growth and recent conflicts, is a major factor according to [
12]. Comparing contributions of factors between outer and edge zones reveals distinct patterns; mining site density plays a more significant role in the outer zone, while built-up areas and agricultural land have a lesser impact. These observations underscore how despite similarities, these regions face differing pressures.
5. Conclusions and Implications for Conservation
The use of novel remote sensing approaches and multi-scale analysis enabled us to analyze the drivers of deforestation and degradation (DFD) influencing tropical moist forest (TMF) dynamics in KBNP. These methods mitigated data scarcity, enhancing our understanding of TMF dynamics in this understudied landscape. Results confirmed that fire significantly affects TMF loss, with varying impact across zones. Fire's relative importance was highest in the inner (55%), followed by the edge (30%) and outer zones (23%). Population density, altitude, and distance from roads also emerged as significant factors, their impacts varying by zone.
Overall, KBNP mitigates DFD compared to surrounding areas, which face substantial anthropogenic pressures. Centripetal pressures threaten park integrity, necessitating strategies to promote sustainable land use practices like agroforestry and restoration. Sustainable conflict management and livelihood diversification are crucial, given historical injustices and ongoing land conflicts exacerbated by population growth and poverty. Establishing and recognizing a buffer zone around KBNP could safeguard its resources and surrounding areas.
Future research should focus on characterizing fires and their uses. Identified as a major driver of TMF loss in the landscape, analysing deeply fire dynamics is critical for understanding TMF loss dynamics. Assessing the ecological implications of TMF loss will guide conservation efforts in KBNP, informing management decisions crucial for this unique forest landscape.
Author Contributions
Conceptualization, N.C.C, J-F.B., J.B; methodology, N.C.C., Y.M. and J-F.B.;.; validation, Y.S.U., R.S.L, J-F.B. K.K and J.B.; formal analysis, N.C.C. and Y.M; data curation, N.C.C., Y.M. ; writing—original draft preparation, N.C.C.; writing—review and editing, N.C.C., Y.S.U., R.S.L., J-F.B., K.K and J.B.; visualization, N.C.C., Y.S.U., R.S.L., J-F.B., K.K and J.B., supervision, R.S.L. and J.B.;
Funding
This study received funding from ENABEL (Agence Belge de Développement) in the Democratic Republic of Congo: PhD Grant trough PRECOB (Programme de Renforcement des Capacités par l’Octroi des Bourse) program. The PhD funder played no role in the study design, data collection and analysis, preparation of the manuscript, or decision to publish.
Data Availability Statement
The data used for this study are available from the corresponding author on reasonable request.
Acknowledgments
The authors thank all the stakeholders who graciously participated in this study.
Conflicts of Interest
The authors declare no conflicts of interest.”
Appendix A1
Figure A1.
Drivers considered for explaining Tropical moist forest loss in Kahuzi-Biega National Park, eastern Democratic Republic of Congo from 1990 to 2022.
Figure A1.
Drivers considered for explaining Tropical moist forest loss in Kahuzi-Biega National Park, eastern Democratic Republic of Congo from 1990 to 2022.
Appendix A2
Figure A2.
Test of the adaptability of images used to analyse tropical moist forest(TMF) dynamic: Comparison of Van cutsem et al (2021) classification from Landsat image and our own classification using Landsat image (2021), collected training points from google earth and supervised classification using Random Forest algorithm in the landscape of Kahuzi-Biega National Park. The classification considers 2 classes including the undisturbed TMF and the other landcover types (Other LC) including deforestation and degradation.
Appendix A3
Figure A3.
Plots of correlations at different grid sizes (1Km2 (a), 9 Km2 (b), 25Km2 (c), 100Km2 (d), 225Km2 (e) and 400Km2 (f) tested for analysis of variation in Tropical moist forest in the Kahuzi Biega National Park landscape from 1990 to 2022.
Figure A3.
Plots of correlations at different grid sizes (1Km2 (a), 9 Km2 (b), 25Km2 (c), 100Km2 (d), 225Km2 (e) and 400Km2 (f) tested for analysis of variation in Tropical moist forest in the Kahuzi Biega National Park landscape from 1990 to 2022.
Appendix A4
Figure A4.
Multiple linear regression between the loss of tropical rainforest and the drivers analysed at scales of 400km2 , 225 km2 and 100 km2 in the Kahuzi-Biega National Park landscape.
Figure A4.
Multiple linear regression between the loss of tropical rainforest and the drivers analysed at scales of 400km2 , 225 km2 and 100 km2 in the Kahuzi-Biega National Park landscape.
Appendix A5
Figure A5.
Multiple linear regression between the loss of tropical rainforest and the drivers analysed at scales of 25km2 , 9 km2 and 1 km2 in the Kahuzi-Biega National Park landscape.
Figure A5.
Multiple linear regression between the loss of tropical rainforest and the drivers analysed at scales of 25km2 , 9 km2 and 1 km2 in the Kahuzi-Biega National Park landscape.
Appendix A6
Figure A6.
Plots of correlations between different variables at the scale of zones (interior (a), edge (b) and exterior (c)) within the KBNP landscape from 1990 to 2022.
Figure A6.
Plots of correlations between different variables at the scale of zones (interior (a), edge (b) and exterior (c)) within the KBNP landscape from 1990 to 2022.
References
- Karsenty, A. Géopolitique Des Forêts d’Afrique Centrale. Herodote(La Decouverte) 2020, 179, 108–129. [Google Scholar] [CrossRef]
- Tchatchou, B.; Sonwa, D.J.; Tiani, A.M. Deforestation and Forest Degradation in the Congo Basin State of Knowledge, Current Causes and Perspectives; 2015.
- Mayaux, P.; Pekel, J.F.; Desclée, B.; Donnay, F.; Lupi, A.; Achard, F.; Clerici, M.; Bodart, C.; Brink, A.; Nasi, R.; et al. State and Evolution of the African Rainforests between 1990 and 2010. Philosophical Transactions of the Royal Society B: Biological Sciences 2013, 368. [Google Scholar] [CrossRef] [PubMed]
- Grantham, H.S.; Shapiro, A.; Bonfils, D.; Gond, V.; Goldman, E.; Maisels, F.; Plumptre, A.J.; Rayden, T.; Robinson, J.G.; Strindberg, S.; et al. Spatial Priorities for Conserving the Most Intact Biodiverse Forests within Central Africa. Environmental Research Letters 2020, 15. [Google Scholar] [CrossRef]
- Eba’a Atyi, R.; Bayol, N. Les Forêts de La République Démocratique Du Congo En 2008. Les Forêts du Bassin du Congo – Etat des Forêts 2008 2009, 115–128.
- Hill, S.L.L.; Arnell, A.; Maney, C.; Butchart, S.H.M.; Hilton-Taylor, C.; Ciciarelli, C.; Davis, C.; Dinerstein, E.; Purvis, A.; Burgess, N.D. Measuring Forest Biodiversity Status and Changes Globally. Frontiers in Forests and Global Change 2019, 2. [Google Scholar] [CrossRef]
- Thies, C.; Rosoman, G.; Cotter, J.; Frigne, J. Les Paysages de Forêts Intactes Pourquoi Il Est Essentiel de Préserver Ces Forêts de Toute Exploitation Industrielle; Amsterdam, 2011.
- Maxwell, S.L.; Evans, T.; Watson, J.E.M.; Morel, A.; Grantham, H.; Duncan, A.; Harris, N.; Potapov, P.; Runting, R.K.; Venter, O.; et al. Degradation and Forgone Removals Increase the Carbon Impact of Intact Forest Loss by 626%; 2019.
- Vancutsem, C.; Achard, F.; Pekel, J.-F.; Vieilledent, G.; Carboni, S.; Simonetti, D.; Gallego, J.; Aragão, L.E.O.C.; Nasi, R. Long-Term (1990-2019) Monitoring of Forest Cover Changes in the Humid Tropics; 2021; Vol. 7.
- Eba’a Atyi, R.; Hiol Hiol, F.; Lescuyer, G.; Mayaux, P.; Defourny, P.; Bayol, N.; Saracco, F.; Pokem, D.; Sufo Kankeu, R.; Nasi, R. Les Forêts Du Bassin Du Congo : État Des Forêts 2021; Center for International Forestry Research (CIFOR), 2022. Forêts Du Bassin Du Congo .
- Shapiro, A.; d’Annunzio, R.; Desclée, B.; Jungers, Q.; Kondjo, H.K.; Iyanga, J.M.; Gangyo, F.I.; Nana, T.; Obame, C.V.; Milandou, C.; et al. Small Scale Agriculture Continues to Drive Deforestation and Degradation in Fragmented Forests in the Congo Basin (2015–2020). Land use policy 2023, 134, 106922. [Google Scholar] [CrossRef]
- Tyukavina, A.; Hansen, M.C.; Potapov, P.; Parker, D.; Okpa, C.; Stehman, S. V.; Kommareddy, I.; Turubanova, S. Congo Basin Forest Loss Dominated by Increasing Smallholder Clearing. Sci Adv 2018, 4. [Google Scholar] [CrossRef]
- Ickowitz, A.; Slayback, D.; Asanzi, P.; Nasi, R. Agriculture and Deforestation in the Democratic Republic of the Congo: A Synthesis of the Current State of Knowledge; Center for International Forestry Research (CIFOR), 2015.
- Turubanova, S.; Potapov, P. V.; Tyukavina, A.; Hansen, M.C. Ongoing Primary Forest Loss in Brazil, Democratic Republic of the Congo, and Indonesia. Environmental Research Letters 2018, 13. [Google Scholar] [CrossRef]
- Butsic, V.; Baumann, M.; Shortland, A.; Walker, S.; Kuemmerle, T. Conservation and Conflict in the Democratic Republic of Congo: The Impacts of Warfare, Mining, and Protected Areas on Deforestation. Biol Conserv 2015, 191, 266–273. [Google Scholar] [CrossRef]
- Nackoney, J.; Molinario, G.; Potapov, P.; Turubanova, S.; Hansen, M.C.; Furuichi, T. Impacts of Civil Conflict on Primary Forest Habitat in Northern Democratic Republic of the Congo, 1990-2010. Biol Conserv 2014, 170, 321–328. [Google Scholar] [CrossRef]
- WWF-PARAP Le Réseau Des Aires Protégées de La République Démocratique Du Congo. Available online: https://www.wwf.de/fileadmin/fm-wwf/Publikationen-PDF/Afrika/WWF-Parap-Poster-French.pdf (accessed on 6 December 2023).
- UNDP; SCBD Aichi Biodiversity Target 11 Country Dossier: Congo (Democratic Republic Of); 2021.
- Bruner, A.G.; Gullison, R.E.; Rice, R.E.; da Fonseca, G.A.B. Effectiveness of Parks in Protecting Tropical Biodiversity. Science (1979) 2001, 291, 125–128. [Google Scholar] [CrossRef] [PubMed]
- Gibson, L.; Lee, T.M.; Koh, L.P.; Brook, B.W.; Gardner, T.A.; Barlow, J.; Peres, C.A.; Bradshaw, C.J.A.; Laurance, W.F.; Lovejoy, T.E.; et al. Primary Forests Are Irreplaceable for Sustaining Tropical Biodiversity. Nature 2011, 478, 378–381. [Google Scholar] [CrossRef]
- Damnyag, L.; Saastamoinen, O.; Blay, D.; Dwomoh, F.K.; Anglaaere, L.C.N.; Pappinen, A. Sustaining Protected Areas: Identifying and Controlling Deforestation and Forest Degradation Drivers in the Ankasa Conservation Area, Ghana. Biol Conserv 2013, 165, 86–94. [Google Scholar] [CrossRef]
- UNEP-WCMC; IUCN; NGS Protected Planet Report 2018 : Tracking Progress towards Global Targets for Protected Areas.; Cambridge UK.; Gland, Switezerland and Wahsington, 2018; ISBN 9789280737219.
- Jones, K.R.; Venter, O.; Fuller, R.A.; Allan, J.R.; Maxwell, S.L.; Negret, P.J.; Watson, J.E.M. One-Third of Global Protected Land Is under Intense Human Pressure. Science (1979) 2018, 360, 788–791. [Google Scholar] [CrossRef] [PubMed]
- Watson, J.E.M.; Iwamura, T.; Butt, N. Mapping Vulnerability and Conservation Adaptation Strategies under Climate Change. Nat Clim Chang 2013, 3, 989–994. [Google Scholar] [CrossRef]
- Ngabinzeke, J.S.; Linchant, J.; Quevauvillers, S.; Muhongya, J.K.; Lejeune, P. La Détection Des Activités Humaines Illégales Dans Les Aires Protégées En République Démocratique Du Congo. 2016, 159, 151–159.
- UICN Rapport de La Mission Conjointe de Suivi Réactif Centre Du Patrimoine Mondial/UICN Au Parc National de Kahuzi-Biega; 2017.
- Misser, F. Les Aires Protégées En République Démocratique Du Congo: Menaces et Défis. L’action de l’Union Européenne; 2013.
- Plumptre, A.J.; Behangana, M.; Davenport, T.; Kahindo, C.; Kityo, E.; Ndomba, E.; Nkuutu, D.; Owiunji, I.; Ssegawa, P.; Eilu, G. Albertine Rift Biodiversity; WCS. 2003. [Google Scholar]
- Spira, C.; Mitamba, G.; Kirkby, A.; Katembo, J.; Kiyani Kambale, C.; Musikami, P.; Dumbo, P.; Byaombe, D.; Plumptre, A.J.; Maisels, F. Inventaire de La Biodiversité Dans Le Parc National de Kahuzi-Biega, République Démocratique Du Congo; 2018.
- Plumptre, A.J.; Nixon, S.; Kujirakwinja, D.K.; Vieilledent, G.; Critchlow, R.; Williamson, E.A.; Nishuli, R.; Kirkby, A.E.; Hall, J.S. Catastrophic Decline of World’s Largest Primate: 80% Loss of Grauer’s Gorilla (Gorilla Beringei Graueri) Population Justifies Critically Endangered Status. PLoS One 2016, 11. [Google Scholar] [CrossRef] [PubMed]
- UNEP Africa Mountains Atlas; Nairobi, 2014.
- Plumptre, A.J.; Davenport, T.R.B.; Behangana, M.; Kityo, R.; Eilu, G.; Ssegawa, P.; Ewango, C.; Meirte, D.; Kahindo, C.; Herremans, M.; et al. The Biodiversity of the Albertine Rift. Biol Conserv 2007, 134, 178–194. [Google Scholar] [CrossRef]
- Potapov, P.; Hansen, M.C.; Laestadius, L.; Turubanova, S.; Yaroshenko, A.; Thies, C.; Smith, W.; Zhuravleva, I.; Komarova, A.; Minnemeyer, S.; et al. The Last Frontiers of Wilderness: Tracking Loss of Intact Forest Landscapes from 2000 to 2013; 2017. T: Last Frontiers of Wilderness.
- Spira, C.; Kirkby, A.; Kujirakwinja, D.; Plumptre, A.J. The Socio-Economics of Artisanal Mining and Bushmeat Hunting around Protected Areas: Kahuzi-Biega National Park and Itombwe Nature Reserve, Eastern Democratic Republic of Congo. ORYX 2019, 53, 136–144. [Google Scholar] [CrossRef]
- Hart, J.A.; Hall, J.S. Status of Eastern Zaire’s Forest Parks and Reserves; 1996; Vol. 10;
- Scholte, P. International Conference on the Impact of Sericostachys Scandens on the Conservation of Nyungwe National Park, Rwanda; 2008.
- Mudinga, M.E.; Ngendakumana, S.; Ansoms, A. Analyse Critique Du Processus de Cogestion Du Parc National de Kahuzi-Biega En République Démocratique Du Congo. La revue électronique en sciences de l’environnement 2013, 17. [Google Scholar]
- Iyomi, B. Fact Sheet PNKB. Fact Sheet PNKB No1, mars 2005, SYGIAP ICCN 2005, p. 2.
- Busane, R.M.; Kaganda, M.; Sheria, N.; Mushagalusa, J.-P.; Mugoli, M.N.; Maramuke, B.J. Clément Mutewa Wakandwa. Analyses Des Dynamiques Des Conflits Autour Du PNKB; 2021.
- ICCN-PNKB Plan Général de Gestion 2009-2019: Parc National de Kahuzi-Biega; 2010.
- Dupuis, C.; Lejeune, P.; Michez, A.; Fayolle, A. How Can Remote Sensing Help Monitor Tropical Moist Forest Degradation?—A Systematic Review. Remote Sens (Basel) 2020, 12, 1087. [Google Scholar] [CrossRef]
- Bullock, E.L.; Woodcock, C.E.; Olofsson, P. Monitoring Tropical Forest Degradation Using Spectral Unmixing and Landsat Time Series Analysis. Remote Sens Environ 2020, 238. [Google Scholar] [CrossRef]
- Zhuravleva, I.; Turubanova, S.; Potapov, P.; Hansen, M.; Tyukavina, A.; Minnemeyer, S.; Laporte, N.; Goetz, S.; Verbelen, F.; Thies, C. Satellite-Based Primary Forest Degradation Assessment in the Democratic Republic of the Congo, 2000–2010. Environmental Research Letters 2013, 8, 024034. [Google Scholar] [CrossRef]
- Allan, J.R.; Venter, O.; Maxwell, S.; Bertzky, B.; Jones, K.; Shi, Y.; Watson, J.E.M. Recent Increases in Human Pressure and Forest Loss Threaten Many Natural World Heritage Sites. Biol Conserv 2017, 206, 47–55. [Google Scholar] [CrossRef]
- Heino, M.; Kummu, M.; Makkonen, M.; Mulligan, M.; Verburg, P.H.; Jalava, M.; Räsänen, T.A. Forest Loss in Protected Areas and Intact Forest Landscapes: A Global Analysis. PLoS One 2015, 10. [Google Scholar] [CrossRef] [PubMed]
- Laurance, W.F.; Carolina Useche, D.; Rendeiro, J.; Kalka, M.; Bradshaw, C.J.A.; Sloan, S.P.; Laurance, S.G.; Campbell, M.; Abernethy, K.; Alvarez, P.; et al. Averting Biodiversity Collapse in Tropical Forest Protected Areas. Nature 2012, 489, 290–294. [Google Scholar] [CrossRef] [PubMed]
- Dudley, N. Lignes Directrices Pour l’application Des Catégories de Gestion Aux Aires Protégées; Gland, 2008.
- Potapov, P. V.; Turubanova, S.A.; Hansen, M.C.; Adusei, B.; Broich, M.; Altstatt, A.; Mane, L.; Justice, C.O. Quantifying Forest Cover Loss in Democratic Republic of the Congo, 2000–2010, with Landsat ETM+ Data. Remote Sens Environ 2012, 122, 106–116. [Google Scholar] [CrossRef]
- Tyukavina, A.; Potapov, P.; Hansen, M.C.; Pickens, A.H.; Stehman, S. V.; Turubanova, S.; Parker, D.; Zalles, V.; Lima, A.; Kommareddy, I.; et al. Global Trends of Forest Loss Due to Fire From 2001 to 2019. Frontiers in Remote Sensing 2022, 3. [Google Scholar] [CrossRef]
- WWF Les Fronts de Déforestation: Moteurs et Réponses Dans Un Monde En Mutation; Gland, 2020.
- Eva, H.; Lambin, E.F. Fires and Land-Cover Change in the Tropics: A Remote Sensing Analysis at the Landscape Scale; 2000; Vol. 27.
- Meyfroidt, P. Approaches and Terminology for Causal Analysis in Land Systems Science. J Land Use Sci 2016, 11, 501–522. [Google Scholar] [CrossRef]
- Geist, H.J.; Lambin, F.E. Proximate Causes and Underlying Driving Forces of Tropical Deforestation. Bioscience 2002, 52, 143–150. [Google Scholar] [CrossRef]
- Shapiro, A.C.; Grantham, H.S.; Aguilar-Amuchastegui, N.; Murray, N.J.; Gond, V.; Bonfils, D.; Rickenbach, O. Forest Condition in the Congo Basin for the Assessment of Ecosystem Conservation Status. Ecol Indic 2021, 122. [Google Scholar] [CrossRef]
- Hall, L.S.; Krausman, P.R.; Morrison, M.L. Plea for Standard Terminology: The Habitat Concept and a Plea for Standard Terminology Key Words Peer Refereed; Wildlife Society Bulletin, 1997; Vol. 325.
- Aveling, C. Le Patrimoine Mondial Dans Le Bassin Du Congo; Unesco.; 2010.
- Balezi, A.Z. Taxonomie et Écologie Des Hymenochaetales Dans Les Forêts de Montagne de l’Est de La République Démocratique Du Congo. Le Cas Du Parc National de Kahuzi-Biega. Thèse de doctorat, Université Catholique de Louvain: Louvain, 2012.
- Masumbuko, N. Ecologie de Sericostachys Scandens, Liane Envahissante Dans Les Forêts de Montagne Du Parc National De Kahuzi-Biega, République Démocratique Du Congo, Université Libre de Bruxelles, 2010.
- Fischer, E.; Dieterlen, F.; Hinkel, H.; Klug, U.; Schnurr, J.; Steinhauer-Burkart, B. Die Vegetation Des Parc National de Kahuzi-Biega, Sud-Kivu, Zaire Mit Beiträgen Von; 1993.
- UICN/PACO Parcs et Réserves de La République Démocratique Du Congo: Evaluation de l’efficacité de La Gestion Des Aires Protégées Programme Aires Protégées d’Afrique Du Centre et de l’Ouest (PAPACO); Ouagadougou, 2010.
- Cizungu, N.C.; Tshibasu, E.; Lutete, E.; Mushagalusa, C.A.; Mugumaarhahama, Y.; Ganza, D.; Karume, K.; Michel, B.; Lumbuenamo, R.; Bogaert, J. Fire Risk Assessment, Spatiotemporal Clustering and Hotspot Analysis in the Luki Biosphere Reserve Region, Western DR Congo. Trees, Forests and People 2021, 5. [Google Scholar] [CrossRef]
- Contino, F. Rapport Sur l’observation de La Zone Tampon Du PNKB; 1996.
- Suleiman, M.S.; Wasonga, V.O.; Mbau, J.S.; Suleiman, A.; Elhadi, Y.A. Non-Timber Forest Products and Their Contribution to Households Income around Falgore Game Reserve in Kano, Nigeria. Ecol Process 2017, 6. [Google Scholar] [CrossRef]
- Hosonuma, N.; Herold, M.; De Sy, V.; De Fries, R.S.; Brockhaus, M.; Verchot, L.; Angelsen, A.; Romijn, E. An Assessment of Deforestation and Forest Degradation Drivers in Developing Countries. Environmental Research Letters 2012, 7. [Google Scholar] [CrossRef]
- Curtis, P.G.; Slay, C.M.; Harris, N.L.; Tyukavina, A.; Hansen, M.C. Classifying Drivers of Global Forest Loss. Science (1979) 2018, 361, 1108–1111. [Google Scholar] [CrossRef] [PubMed]
- Venter, O.; Sanderson, E.W.; Magrach, A.; Allan, J.R.; Beher, J.; Jones, K.R.; Possingham, H.P.; Laurance, W.F.; Wood, P.; Fekete, B.M.; et al. Sixteen Years of Change in the Global Terrestrial Human Footprint and Implications for Biodiversity Conservation. Nat Commun 2016, 7. [Google Scholar] [CrossRef]
- Zurqani, H.A.; Post, C.J.; Mikhailova, E.A.; Schlautman, M.A.; Sharp, J.L. Geospatial Analysis of Land Use Change in the Savannah River Basin Using Google Earth Engine. International Journal of Applied Earth Observation and Geoinformation 2018, 69, 175–185. [Google Scholar] [CrossRef]
- Zanaga, D.; Van De Kerchove, R.; Daems, D.; De Keersmaecker, W.; Brockmann, C.; Kirches, G.; Wevers, J.; Cartus, O.; Santoro, M.; Fritz, S.; et al. ESA WorldCover 10 m 2021 V200 (Version V200) [Data Set]. 2022.
- Jaffé, R.; Nunes, S.; Dos Santos, J.F.; Gastauer, M.; Giannini, T.C.; Nascimento, W.; Sales, M.; Souza, C.M.; Souza-Filho, P.W.; Fletcher, R.J. Forecasting Deforestation in the Brazilian Amazon to Prioritize Conservation Efforts. Environmental Research Letters 2021, 16. [Google Scholar] [CrossRef]
- Taiyun Wei, M.; Taiyun Wei cre, A.; Simko aut, V.; Levy ctb, M.; Xie ctb, Y.; Jin ctb, Y.; Zemla ctb, J.; Freidank ctb, M.; Cai ctb, J.; Protivinsky ctb, T. Package “Corrplot”: Visualization of a Correlation Matrix; 2022.
- Kenett, R.S.; Longford, N.T.; Piegorsch, W.W.; Ruggeri, F. Principal Component Analysis; Major Reference Works; 1st ed.; John Wiley, 2014; ISBN 9781118445112.
- Delcourt, H.R.; Delcourt, P.A. Quaternary Landscape Ecology: Relevant Scales in Space and Time; SPB Academic Publishing, 1988; Vol. 2.
- Benítez-López, A.; Viñuela, J.; Mougeot, F.; García, J.T. A Multi-Scale Approach for Identifying Conservation Needs of Two Threatened Sympatric Steppe Birds. Biodivers Conserv 2017, 26, 63–83. [Google Scholar] [CrossRef]
- Khaliq, Y.; Dwyer Jr., G. P. Tests of Normality for Time Series Data. Econ Lett 2005, 89, 83–88. [Google Scholar] [CrossRef]
- Farebrother, R.W. The Durbin-Watson Test for Serial Correlation When There Is No Intercept in the Regression. Econometrica 1980, 48, 1553–1563. [Google Scholar] [CrossRef]
- Wickham, H. Ggplot2: Elegant Graphics for Data Analysis; Springer International Publishing: Cham, 2016; ISBN 978-3-319-24275-0. [Google Scholar]
- Groemping, U. Relative Importance for Linear Regression in R: The Package Relaimpo. J Stat Softw 2006, 17, 1–27. [Google Scholar] [CrossRef]
- Mestre, F.; Silva, B. Lconnect R Package: A Versatile Tool for Evaluating Landscape Connectivity and Prioritizing Habitat Patches in Conservation Research. Ecol Modell 2023, 484. [Google Scholar] [CrossRef]
- Campbell, A.; Clark, S.; Coad, L.; Miles, L.; Bolt, K.; Roe, D. Protecting the Future: Carbon, Forests, Protected Areas and Local Livelihoods. Biodiversity 2008, 9, 117–121. [Google Scholar] [CrossRef]
- Houghton, R.A. Carbon Emissions and the Drivers of Deforestation and Forest Degradation in the Tropics. Curr Opin Environ Sustain 2012, 4, 597–603. [Google Scholar] [CrossRef]
- Evans, T.B.; Seymour, F. Intact Tropical Forests: Log Them or Lose Them? Ending Tropical Deforestation: A Stock-Take of Progress and Challenges; 2018.
- Ouattara, B.; Sanou, L.; Koala, J.; Hien, M. Perceptions Locales de La Dégradation Des Ressources Naturelles Du Corridor Forestier de La Boucle Du Mouhoun Au Burkina Faso. 2022. [CrossRef]
- Bagan, H.; Yamagata, Y. Land-Cover Change Analysis in 50 Global Cities by Using a Combination of Landsat Data and Analysis of Grid Cells. Environmental Research Letters 2014, 9, 064015. [Google Scholar] [CrossRef]
- Thayn, J.B.; Simanis, J.M. Accounting for Spatial Autocorrelation in Linear Regression Models Using Spatial Filtering with Eigenvectors. Annals of the Association of American Geographers 2013, 103, 47–66. [Google Scholar] [CrossRef]
- Fürst, C.; Avirmed, B.; Clerici, N.; Khoroshev, A.; Kofi Nyarko, B.; Prishchepov, A.; Scheller, R.M.; Silbernagel Balster, J.; Watanabe, T. Principles and Methods in Landscape Ecology; © Springer Nature.; Switzerland, 2022; Vol. 3.
- Qi, Y.; Wu, J. Effects of Changing Spatial Resolution on the Results of Landscape Pattern Analysis Using Spatial Autocorrelation Indices; SPB Academic Publishing by, 1996.
- Molinario, G.; Hansen, M.; Potapov, P.; Tyukavina, A.; Stehman, S. Contextualizing Landscape-Scale Forest Cover Loss in the Democratic Republic of Congo (DRC) between 2000 and 2015. Land (Basel) 2020, 9. [Google Scholar] [CrossRef]
- Cirezi, N.C.; Bastin, J.F.; Tshibasu, E.; Lonpi, E.T.; Chuma, G.B.; Mugumaarhahama, Y.; Sambieni, K.R.; Karume, K.C.; Lumbuenamo, R.S.; Bogaert, J. Contribution of ‘Human Induced Fires’ to Forest and Savanna Land Conversion Dynamics in the Luki Biosphere Reserve Landscape, Western Democratic Republic of Congo. Int J Remote Sens 2022, 43, 6406–6429. [Google Scholar] [CrossRef]
- van Wees, D.; van der Werf, G.R.; Randerson, J.T.; Andela, N.; Chen, Y.; Morton, D.C. The Role of Fire in Global Forest Loss Dynamics. Glob Chang Biol 2021, 27, 2377–2391. [Google Scholar] [CrossRef] [PubMed]
- Harris, N.L.; Goldman, E.; Gabris, C.; Nordling, J.; Minnemeyer, S.; Ansari, S.; Lippmann, M.; Bennett, L.; Raad, M.; Hansen, M.; et al. Using Spatial Statistics to Identify Emerging Hot Spots of Forest Loss. Environmental Research Letters 2017, 12, 024012. [Google Scholar] [CrossRef]
- Alignier, A.; Deconchat, M. Patterns of Forest Vegetation Responses to Edge Effect as Revealed by a Continuous Approach. Ann For Sci 2013, 70, 601–609. [Google Scholar] [CrossRef]
- Kabonyi, C.; Salmon, M.; Roche, E. Le Parc National de Kahuzi - Biega (R. D. Congo), Patrimoine En Péril? Le Secteur «Haute Altitude», Situation et Perspectives. Geo Eco Trop 2011, 35, 1–8. [Google Scholar]
- Arakwiye, B.; Rogan, J.; Eastman, J.R. Thirty Years of Forest-Cover Change in Western Rwanda during Periods of Wars and Environmental Policy Shifts. Reg Environ Change 2021, 21, 27. [Google Scholar] [CrossRef]
- Butsic, V.; Baumann, M.; Shortland, A.; Walker, S.; Kuemmerle, T. Conservation and Conflict in the Democratic Republic of Congo: The Impacts of Warfare, Mining, and Protected Areas on Deforestation. Biol Conserv 2015, 191, 266–273. [Google Scholar] [CrossRef]
- Jusys, T. Quantifying Avoided Deforestation in Pará: Protected Areas, Buffer Zones and Edge Effects. J Nat Conserv 2016, 33, 10–17. [Google Scholar] [CrossRef]
- Watson, J.E.M.; Dudley, N.; Segan, D.B.; Hockings, M. The Performance and Potential of Protected Areas. Nature 2014, 515, 67–73. [Google Scholar] [CrossRef] [PubMed]
- Ladewig, M.; Angelsen, A.; Masolele, R.N.; Chervier, C. Deforestation Triggered by Artisanal Mining in Eastern Democratic Republic of the Congo. Nat Sustain 2024. [Google Scholar] [CrossRef]
- Harris, I.; Osborn, T.J.; Jones, P.; Lister, D. Version 4 of the CRU TS Monthly High-Resolution Gridded Multivariate Climate Dataset. Sci Data 2020, 7. [Google Scholar] [CrossRef] [PubMed]
- Molinario, G.; Hansen, M.C.; Potapov, P. V Forest Cover Dynamics of Shifting Cultivation in the Democratic Republic of Congo: A Remote Sensing-Based Assessment for 2000–2010. Environmental Research Letters 2015, 10, 094009. [Google Scholar] [CrossRef]
Figure 1.
Study area: Landscape of the Kahuzi-Biega National Park (KBNP) with a 15 km outer zone. The park is located in central Africa, eastern Democratic Républic of Congo(DRC) between 3 provinces (North Kivu, South Kivu, and Maniema).
Figure 1.
Study area: Landscape of the Kahuzi-Biega National Park (KBNP) with a 15 km outer zone. The park is located in central Africa, eastern Democratic Républic of Congo(DRC) between 3 provinces (North Kivu, South Kivu, and Maniema).
Figure 2.
Methodology workflow used to assess tropical moist forest loss and quantify the contribution of factors explaining this loss in the landscape of Kahuzi Biega National Park, eastern Democratic Republic of Congo, from 1990 to 2022.
Figure 2.
Methodology workflow used to assess tropical moist forest loss and quantify the contribution of factors explaining this loss in the landscape of Kahuzi Biega National Park, eastern Democratic Republic of Congo, from 1990 to 2022.
Figure 3.
Correlation circles from different grid sizes (1Km2 (a), 9 Km2 (b), 25Km2 (c), 100Km2 (d), 225Km2 (e) and 400Km2 (f)) tested for assessing tropical moist forest dynamic(∆f) as a function of the factors analysed including, edroad: euclidean distance to roads, edriv: euclidean distance to rivers, cropland: cropland area, builtup: builtup density, dpop: population density, edlim: Euclidean distance to limits ,dmin: mining sites densisty, ,df: TMF loss, dfire: fire.
Figure 4.
Tropical moist forest loss prediction: Summary results of the linear regressions carried out to analyze the contribution of the variables studied to the variation in tropical moist forest (∆f) in the KBNP landscape at different scales (Model 1 :1Km2 , Model 2 : 9Km2 , Model 3 :25 Km2 , Model 4 :100Km2 , Model 5 : 225Km2 , Model 6 :400Km2 ) and considering drivers analyzed (cropland, ED to roads: Euclidean Distance to roads, fire density, Built-up density, pop density: population density, ED to limits: Euclidean distance to limits, Altitude, Mining sites density and slope).
Figure 5.
Change in tropical moist forest from 1990 to 2022 in the considered sub-zones (inner zone, edge zone and outer zone) of the Kahuzi-Biega National Park landscape.
Figure 5.
Change in tropical moist forest from 1990 to 2022 in the considered sub-zones (inner zone, edge zone and outer zone) of the Kahuzi-Biega National Park landscape.
Figure 6.
Rate of tropical moist forest (TMF) evolution( (median associated to standard errors) from 1990 to 2022 at the scale of 25 km2 grids in the landscape of the Kahuzi-Biega National Park.
Figure 6.
Rate of tropical moist forest (TMF) evolution( (median associated to standard errors) from 1990 to 2022 at the scale of 25 km2 grids in the landscape of the Kahuzi-Biega National Park.
Figure 7.
Correlation circles for different sub-zones(a): Inner zone, (b): Edge zone and (c): Outer zone. Legend: edroad : euclidean distance to roads, cropland: cropland area, builtup: builtup density, dpop: population density, edlim: Euclidean distance to limits, ,dmin: mining sites densisty, ,df: TMF loss, dfire: fire density.
Figure 8.
Drivers relative importance assessment for forest variation with 95% bootstrap confidence intervals, method LMG (Lindemann, Merenda and Gold) in the Kahuzi-Biega Landscape from 1990 to 2022 (a): Inner zone, (b): Edge Zone and (c): Outer zone. Legend: buil: built up density, crop: cropland area, edro: euclidean distance to roads, alt: altitude(elevation), dpop: population density,dfir: fire density, edli: distance to park limits, dmin:mining sites density.
Table 1.
Description, source, and pre-processing steps applied to data used for explaining variation of TMF loss in the KBNP landscape from 1990 to 2022.
Table 1.
Description, source, and pre-processing steps applied to data used for explaining variation of TMF loss in the KBNP landscape from 1990 to 2022.
| Id |
Data |
Description |
Source |
Pre-processing |
| 1 |
Collection of annual changes in land use (1990-2022) |
- Landsat images classified into 6 classes (undisturbed TMF, degraded TMF, TMF regrowth, deforested land, ongoing deforestation and degradation, water, other landcover including afforestation). -Spatial resolution (29.90m)
- Acquisition: Google Earth Engine:
Asset ID: projects/JRC/TMF/v1_2022/AnnualChanges |
Forest Observations (europa.eu) [9] |
- Reclassification (2 classes: TMF and other classes)
- Calculation of the annual proportion of forest for each grid.
- Calculation of the change in the TMF (∆f) from the reference year (1990) to the final year (2022) at all scales
|
| 2 |
Landsat image (2021) |
Landsat 8 OLI/TIRS surface reflectance: USGS Landsat 8 Level 2, Collection 2, Tier 1, cloud cover<1%. |
Google Earth Engine (GEE): https://code.earthengine.google.com/ |
Supervised classification via GEE using the Random Forest algorithm (2 classes: TMF and other classes) [67] |
| 3 |
Built-up areas |
Buildings provided by Open Street Map |
Geofabrik Download Server |
Calculation of the density of buildings/km2 for each grid at different scales |
| 4 |
Roads |
Road and waterway data
Provided by Open Street Map |
Geofabrik Download Server |
Calculation of the average Euclidean distance to roads in km for each grid at different scales |
| 5 |
Rivers |
Watercourse data
Provided by Open Street Map |
Geofabrik Download Server |
Calculation of the average Euclidean distance to rivers in km for each grid at different scales |
| 6 |
Altitude and Slope |
Digital terrain model with 30 m resolution |
OpenTopography - Shuttle Radar Topography Mission (SRTM GL1) |
Calculation of the average altitude (m) of each grid at different scales |
| 7 |
Population data |
Population at health zone level |
Humanitarian Data Exchange (humdata.org) |
Calculation of population density/km2 for each grid at different scales |
| 8 |
Agricultural areas |
Land cover map for 2021 at 10 m resolution based on Sentinel-1 and Sentinel-2 data. |
https://esa-worldcover.org/en [68] |
Determination of the agricultural area (km2) in each grid at different scales |
| 9 |
Lights |
Active fires and hot spots derived from the MODIS collection 6.1. |
https://firms.modaps.eosdis.nasa.gov/ |
Calculation of the average density of fires/km2 for each grid at different scales |
| 10 |
Mining areas |
Small-scale artisanal mining sites |
IPIS - Opendata (shinyapps.io) |
Calculation of the average density of mining sites/km2 for each grid at different scales |
| 11 |
Distance from park boundaries |
Euclidean distance of the boundaries of the KBNP in the study landscape |
Analyses in Arc Map 10.8.1 |
Determination of the Euclidean distance of the park boundaries in km2
|
|
Disclaimer/Publisher’s Note: The statements, opinions and data contained in all publications are solely those of the individual author(s) and contributor(s) and not of MDPI and/or the editor(s). MDPI and/or the editor(s) disclaim responsibility for any injury to people or property resulting from any ideas, methods, instructions or products referred to in the content. |
© 2024 by the authors. Licensee MDPI, Basel, Switzerland. This article is an open access article distributed under the terms and conditions of the Creative Commons Attribution (CC BY) license (http://creativecommons.org/licenses/by/4.0/).
