Preprint
Article

Compositional Analysis and Numerical Simulation of Slagging Process on a Water-Cooled Wall of an MSW Incinerator

Altmetrics

Downloads

7

Views

14

Comments

0

Submitted:

25 November 2024

Posted:

09 December 2024

You are already at the latest version

Alerts
Abstract
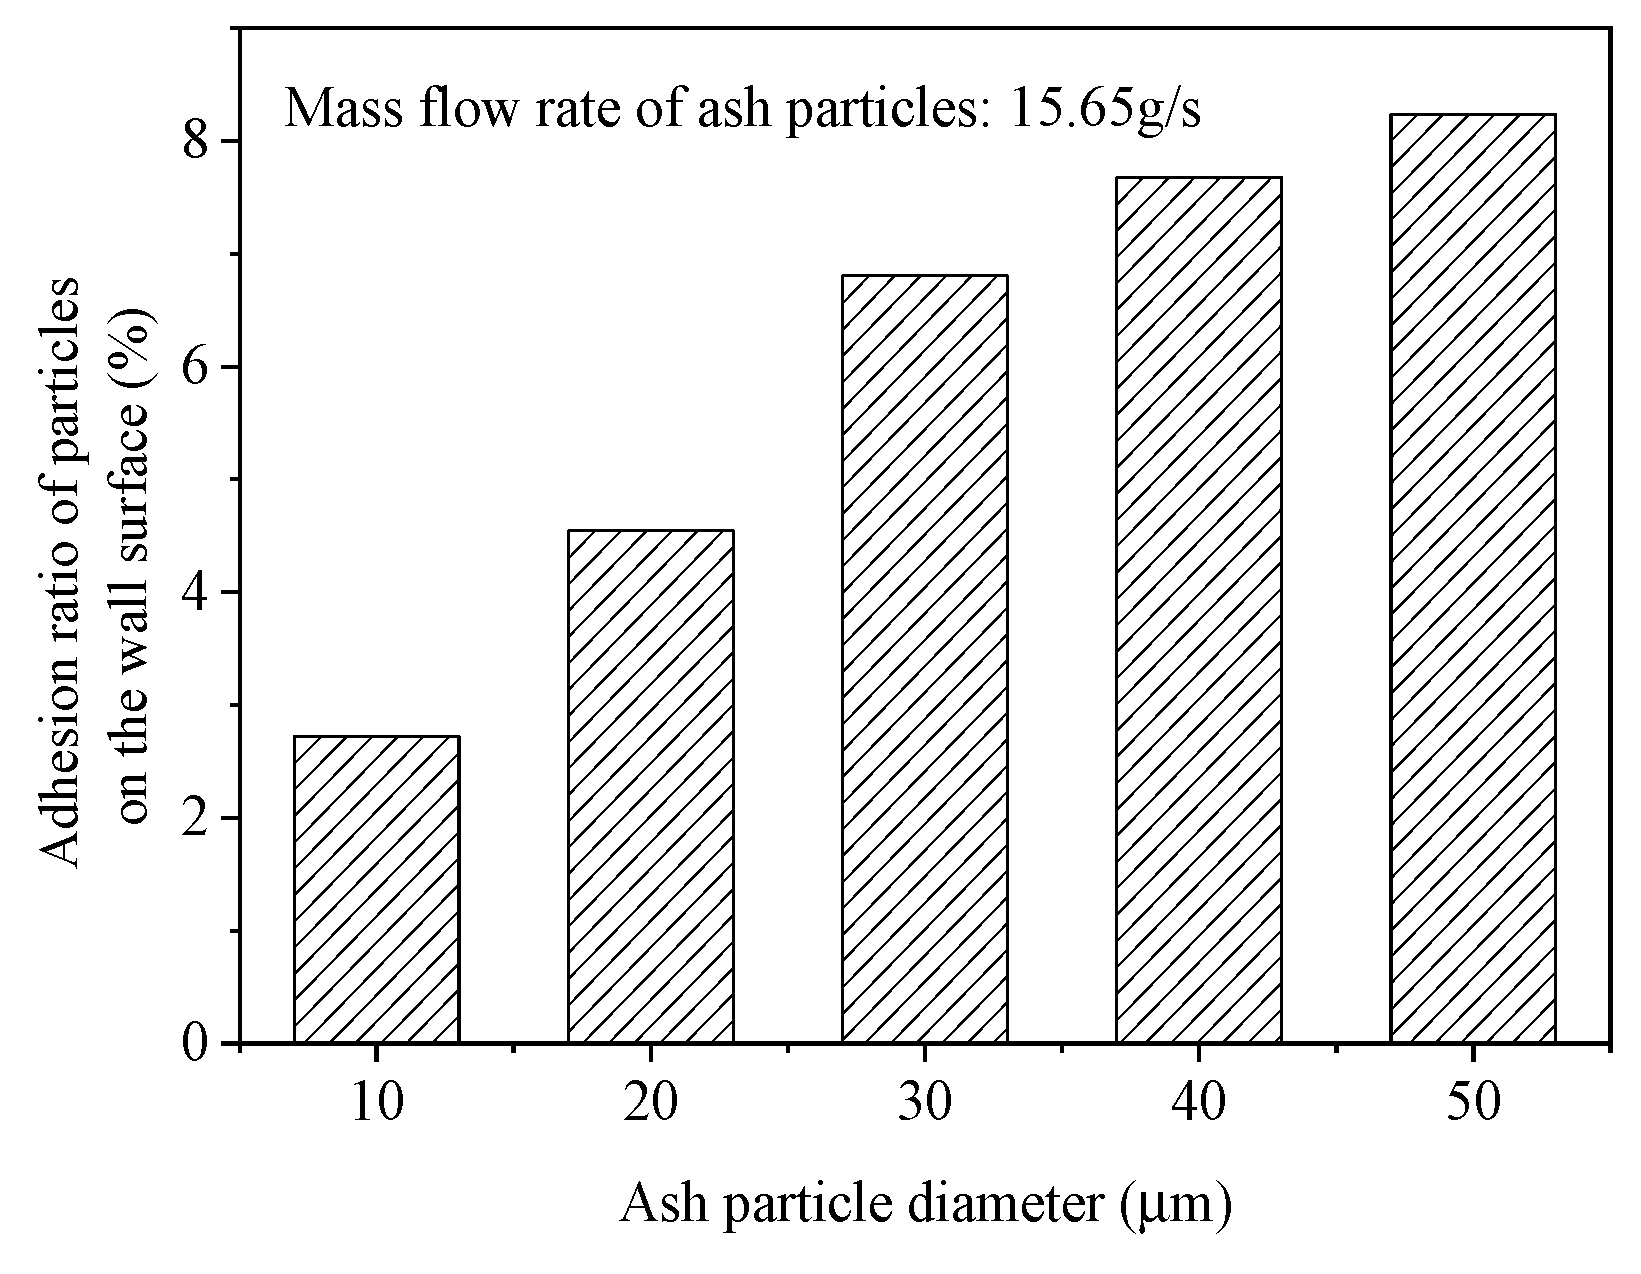
The mechanism of slagging in municipal solid waste incinerators is complex, and the slagging process is simultaneously affected by the composition, temperature, and flue gas flow. In this study, slag samples on a water-cooled wall were first analysed, and the key components and fusion temperatures were measured. Second, a gas-phase combustion model of the incinerator was established, and the temperature and velocity distributions of the flue gas inside the incinerator were calculated. Based on the incineration process coupled with the Discrete Phase Model, a numerical simulation model of the slagging process on the water-cooled wall of the incinerator was constructed, considering the transport and adhesion processes of ash particles. The influence of parameters such as the ash particle size and concentration on the degree of slagging on the water-cooled wall was analysed. Smaller ash particles were less likely to adhere to water-cooled walls, with approximately 2.72% of ash particles with a particle size of 10 um adhering to water-cooled walls. The proportion of ash particles with a particle size of 50 um adhering to water-cooled walls was approximately 3.0 times that of those with a particle size of 10 um. As the concentration of ash particles increased, the number of ash particles adhering to the water-cooled wall increased, and the adhesion ratio decreased. These results are of great significance for optimising the operation of incinerators and reducing slagging rates.
Keywords: 
Subject: Environmental and Earth Sciences  -   Waste Management and Disposal

1. Introduction

Incineration is one of the main methods used for the harmless disposal of municipal solid waste (MSW). Japan has been incinerating MSW since the 1960s, and by the end of 2017, Japan had built 1103 waste incineration treatment facilities with a total processing capacity of 1.8 × 10⁵ tonnes/day [1]. The earliest MSW incineration plant in Europe was constructed in Denmark in 1903. In 1999, the European Union introduced strict regulations on landfill disposal, which sparked a wave of power generation through waste incineration in Europe. From 2009 to 2014, Europe’s investment in the construction of power generation through MSW incineration accounted for 60% of the world’s total, whereas Asia, led by China and Japan, accounted for 30% during this period [2]. In 2022, waste incineration in China accounted for 79.78% of the country’s total harmless MSW disposal methods [3]. MSW commonly contains significant quantities of alkali and alkaline earth metals, chlorine, silicon, and various other elements. During incineration, these constituents readily form compounds or eutectics with low melting points, thereby decreasing the ash melting point of MSW [4]. This makes the heating surface prone to slagging, which then worsens the combustion and heat transfer performance of the furnace [5]. As the disposal capacity of MSW incinerators has increased, coupled with economic development and shifts in residents’ lifestyles, the composition and calorific value of waste materials entering these incinerators have changed significantly. Consequently, MSW incinerators commonly encounter challenges, such as heightened coking, increased ash accumulation, and the frequent need for coke cleaning and shutdowns.
The slagging mechanism in MSW incinerators is complex. During on-site operations, it is difficult to monitor the slagging process online in real time. The current research mostly speculated about the cause of slagging through the analysis of slag samples after shutdown. Based on the varying deposition patterns of ash particles on wall surfaces, two distinct processes exist: slagging and ash accumulation [6]. Ash particles are in a molten or semi-molten state when their temperature is higher than the ash melting point. When molten or semi-molten ash particles meet a heat exchange surface, they gradually condense and then slowly accumulate to form slag blocks. This is the slagging process that mainly occurs on the heat exchange surface inside a furnace, such as a water-cooled wall. Ash particles typically solidify when the temperature is lower than the melting point of ash. When solid ash particles pass through the heat exchange surface, they are deposited on the surface, which is called the ash deposition process. The ash deposition process mainly occurs on convective heating surfaces, such as superheaters and reheaters [7]. Slag deposition generally includes the formation of ash particles, the movement of ash particles, and collision and adhesion between ash particles and heat exchange surfaces. Based on the characteristics of the slag deposition process, during actual operation, slag deposition is often prevented by controlling the flue gas temperature. In MSW incinerators, it is generally required that the flue gas temperature at the outlet of the first flue gas is not greater than 1050 ℃.
The slagging process is related to factors such as the flue gas temperature and flow and the melting point of slag. Numerical simulations can provide a deeper understanding of the characteristics of the slagging and ash accumulation processes. During the construction of a slagging model, Walsh et al. [8] found that the ash particle adhesion rate is generally affected by the collision between viscous or non-viscous particles and viscous or non-viscous walls based on the results of research on the slagging process in a coal powder furnace. Ash particle motion models have undergone gradual improvement from one dimension to three dimensions. Chen et al. [9] extended the one-dimensional slagging model to the two-dimensional wall of a combustion chamber and obtained the spatial distribution of ash particle deposition. Ni et al. [10] established a multiphase and multilayer ash flow and phase transition model using the volume of fluid (VOF) model and predicted a two-dimensional ash flow process. Chen et al. [11] established a three-dimensional ash flow model based on the VOF model and discrete-phase model (DPM) and described the three-dimensional characteristics of ash deposition, ash flow, and heat transfer in the ash layer. Wang et al. [12] divided the process of slag formation into the formation of coal ash, the movement of ash particles in the flow field, the collision between particles and the wall, and the adhesion of particles to the wall. They provided a numerical simulation model for ash deposition during coal powder combustion. Li Wenyan [13] established a mathematical model for the fuzzy comprehensive evaluation of slagging based on the theory of fuzzy mathematics and studied the influence of fuel characteristics and operating conditions on slagging during coal powder combustion. Pintana et al. [14] simulated the slagging process of a 2400 MW coal-fired boiler and predicted the slagging situation inside the furnace. Garcia et al. [15] studied the effect of lateral spacing between heat transfer tube bundles on inter-tube ash accumulation and heat transfer using dynamic grids. Tang et al. [16] analysed the deposition of ash under different conditions of pipe spacing, form, and arrangement through numerical simulations. Fu et al. [17] predicted the collision, adhesion, and rebound processes of ash particles on the surface of flue gas heat exchangers and analysed the influence of geometric parameters on the scaling rate.
Compared with the slagging process in coal powder furnaces, MSW has complex components, a high ash content, and a low ash melting temperature. Based on a study of the coal powder slagging process, Wang et al. [18] used the ash softening temperature to describe the critical temperature of ash particles and predicted the combustion and ash deposition characteristics during the coal–wood co-incineration process. Because the movement trajectory of the ash particles is carried by the airflow, the flow field and temperature of the flue gas are key factors affecting the slagging process. By simulating the temperature field inside an incinerator and combining the viscosity–temperature characteristics of slag samples with a mature fly ash particle adhesion model, Wang [19] predicted the behaviour of collision and adhesion between ash particles and the incinerator wall. Klasen et al. [20] predicted key slagging areas through simulation calculations and particle tracking of the gas-phase flow field inside a garbage incinerator. In addition, the particle size, composition, and melting characteristics of ash particles can affect their movement and adhesion.
Thus, the current predictions of the slagging process in MSW incinerators are mostly based on simulating the temperature field, velocity field, and particle trajectory inside an incinerator, ignoring the processes of collision and adhesion between ash particles and the wall surface. Alternatively, the movement trajectory of ash particles and their adhesion and growth process on the wall can be tracked without considering the influence of the temperature and velocity fields of the flue gas in the incinerator on the particle movement and adhesion process. Slagging and ash accumulation in the flue are the results of the combined action of the melting characteristics of ash particles, the incineration state of materials, and the flow of flue gas. Therefore, it is necessary to analyse and predict the formation and slagging processes of ash particles by coupling the incineration and flue gas flow processes in an incinerator.
In this study, by comprehensively considering the combustion process of the gas phase in the incinerator, the flow process of flue gas, the movement process of ash particles, and the adhesion process of ash particles, slagging and combustion models were coupled to track the movement trajectory of ash particles during incineration. The influence of factors such as the ash particle size and concentration on the degree of slagging on a water-cooled wall in an incinerator was studied. These results provide a theoretical basis for the development of coking control technologies for MSW incinerators.

2. Sample Testing

2.1. Experimental Methods

The morphology and microstructure of the slag were analysed using field-emission high-resolution scanning electron microscopy (SEM; Tescan Mira 3 XH). The elemental composition and crystalline structure of the slag were analysed using X-ray fluorescence (XRF; Zetium-Ultimate edition, PANalytical B.V., Almelo, Netherlands) and X-ray diffraction (XRD; Rigaku Ultima IV, Japan), respectively. XRD patterns were measured on an X-ray diffractometer (Cu Kα, λ = 1.54056 Å) using the standard 2θ-θ mode, with 2θ ranging from 20° to 100°, at a scan speed of 2°/min with steps of 0.02° under the conditions of 40 kV (voltage) and 30 mA (current). The ash fusion temperature was measured using an ash fusion analyser (SDAF4000).

2.2. Test Results

Figure 1 shows a slag sample obtained from a water-cooled wall. The slag sample was in the form of large blocks with a rough surface, dense structure, and high hardness. Figure 2 shows the SEM images at different magnifications. The SEM images revealed various morphologies, including clusters, stripes, and needles. These different shapes suggest that the slag comprised multiple components. The surface of the slag was dotted with small irregular particles.
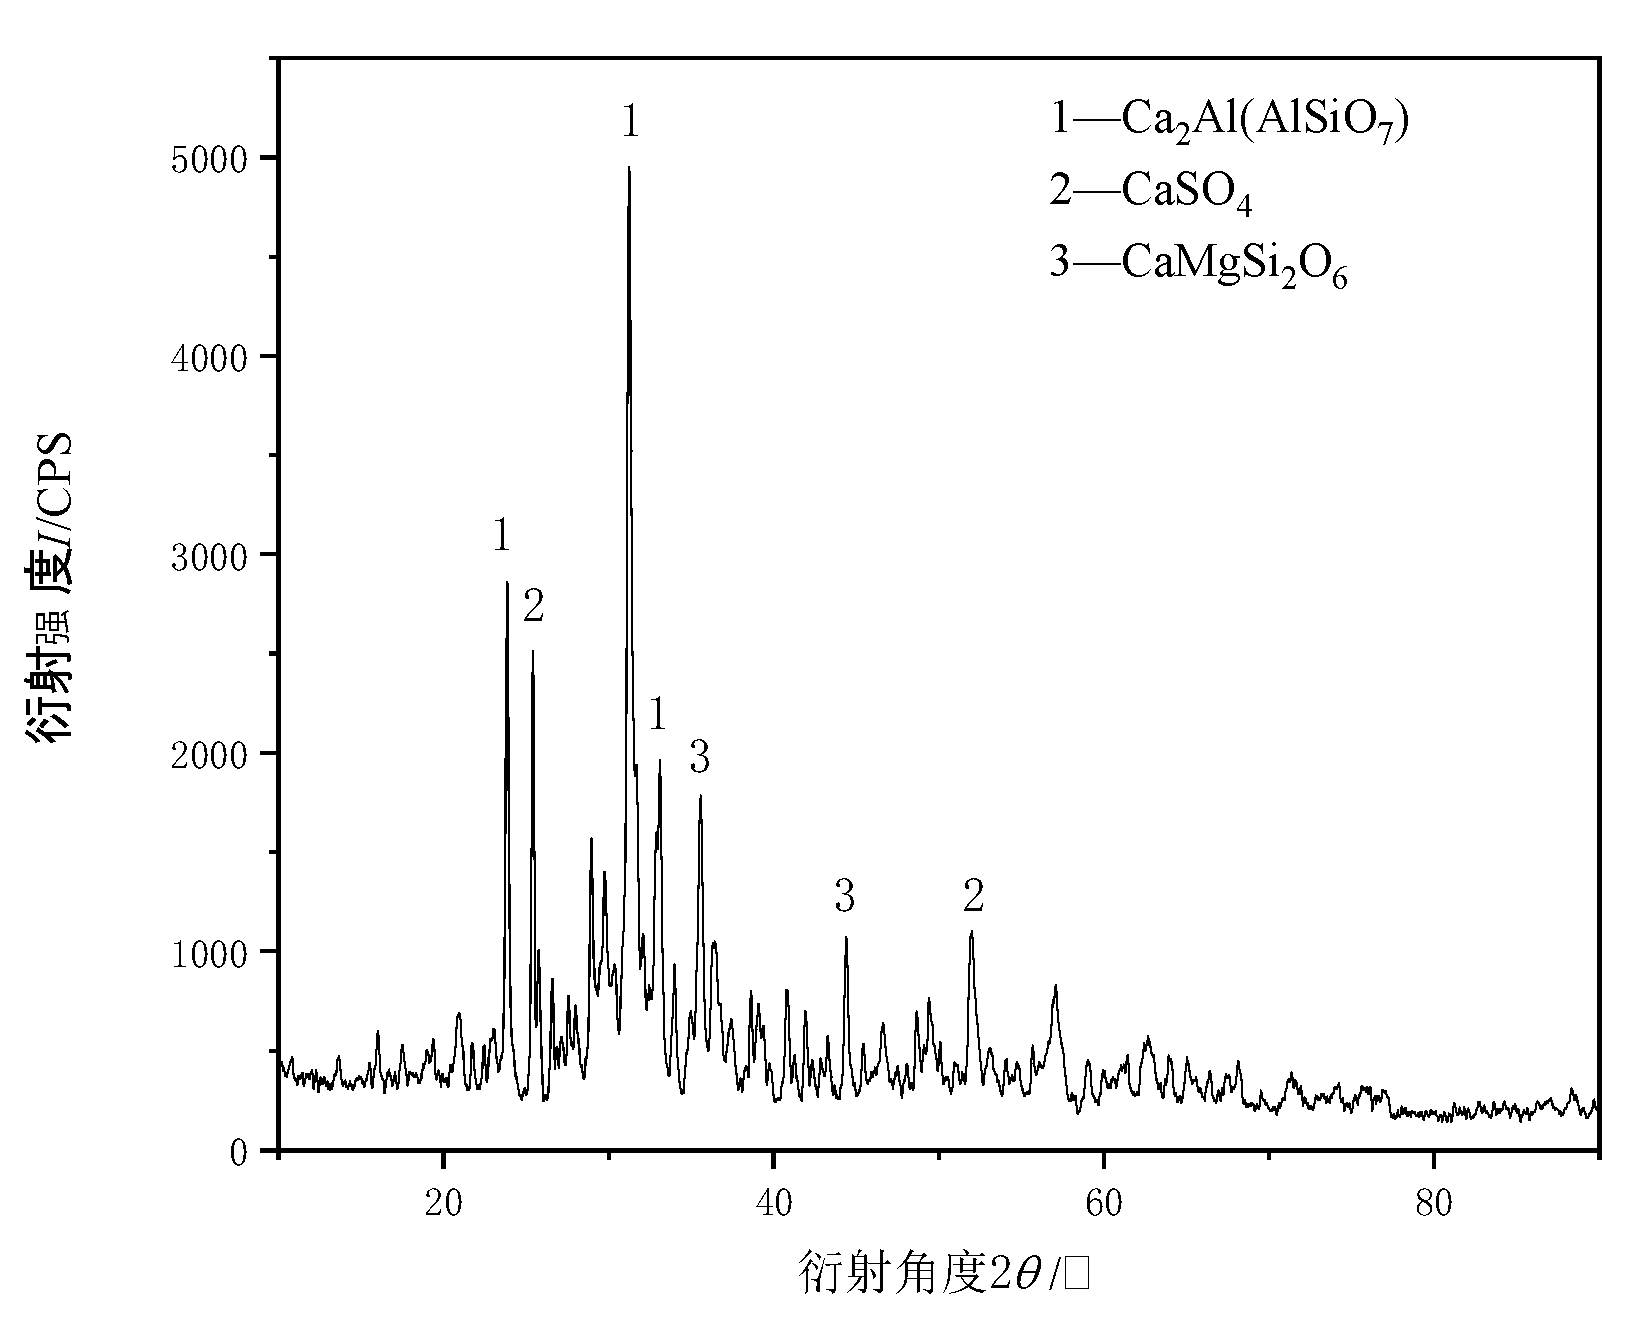
Based on the XRD test results, the phase composition of the slag sample was analysed using the Jade software, as shown in Figure 3. The phase composition of the slag samples suggested a complex mixture of calcium-, aluminium-, silicon-, magnesium-, and sulphur-bearing minerals. Ca2Al(AlSiO7), CaSO4, and CaMgSi2O6 were the main crystal phases of the slag sample. Calcium aluminosilicates are common in slag and play a significant role in determining its physical and chemical properties.
The elemental distributions of the slag samples tested using XRF are presented in Table 1. The silicon, aluminium, and iron contents in the slag blocks are relatively high. Alkali and alkaline earth metals undergo sulphur fixation reactions in flue gas to generate sulphates, which have a strong adhesion ability and form a molten film on the surface of the particles, serving as a binder between particles and promoting slagging.
Table 2 lists the deformation, softening, hemispherical, and flow temperatures of the slag samples. The softening temperature is approximately 1113 ℃. The low ash melting point is the main reason for coking in MSW incinerators. When the melting point of the ash is low, it tends to soften and adhere to the heat exchange surface at relatively low temperatures, thereby reducing the efficiency of the incinerator.

3. Numerical Simulation Method

3.1. Calculation Model of Incineration

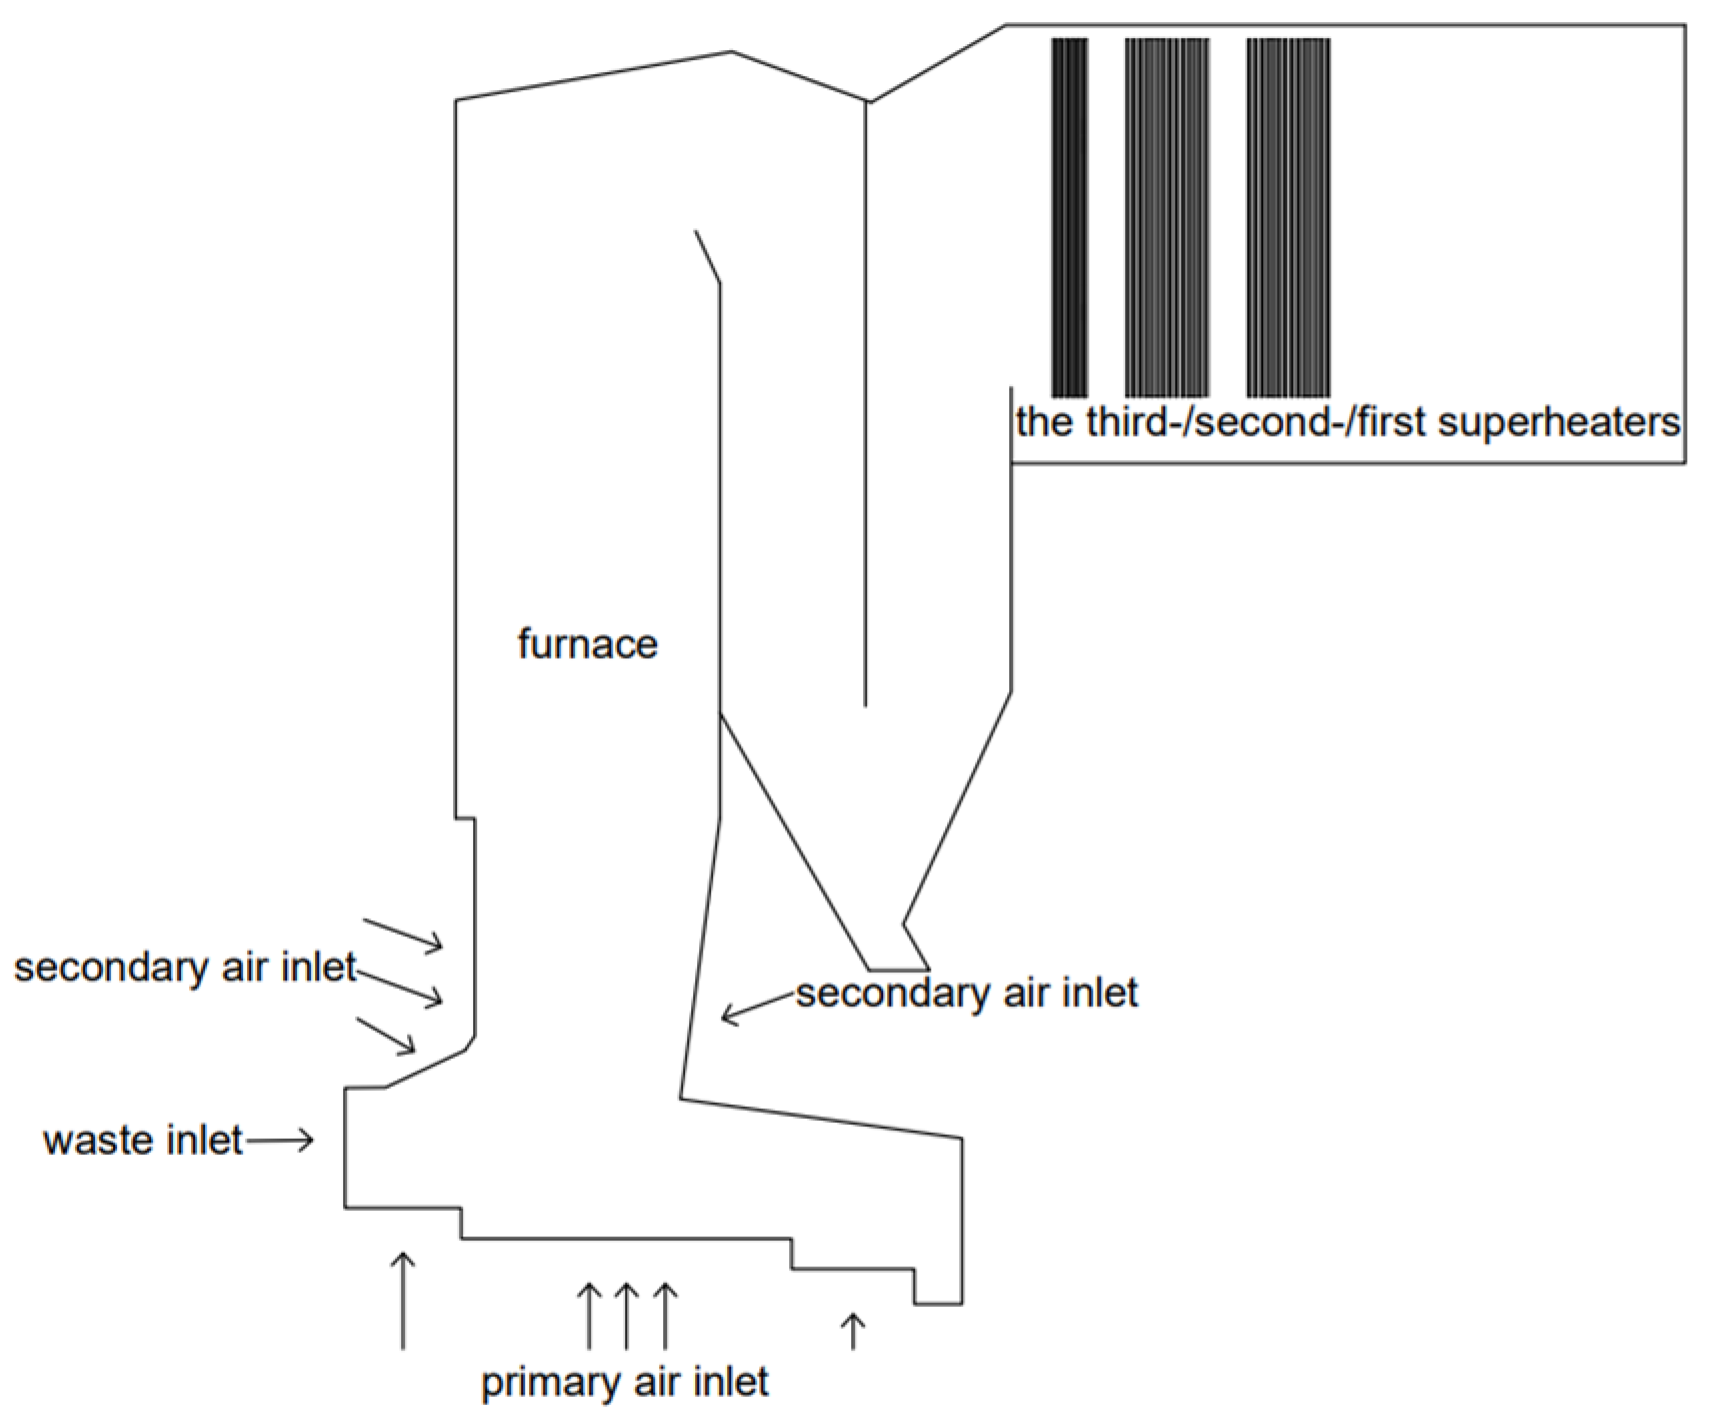
The research object was a 500 t/d grate-type MSW incinerator in Shanghai, as shown in Figure 4, with a furnace height of 25.3 m and a grate length of 11.34 m. The total primary air volume was 70,000 Nm3/h at 493 K, the total secondary air volume was 13,300 Nm3/h at 300 K, and the circulating air volume was 15,600 Nm3/h at 428 K.
During the calculation process, the incineration process within the incinerator was first calculated, and detailed calculations are outlined in reference [21]. Subsequently, the gas composition, velocity, and temperature above the material layer on the grate were used as the inlet boundary conditions. The motion trajectories of the ash particles were traced by coupling with a discrete-phase model (DPM) to obtain the gas-phase velocity field, temperature field, and ash particle concentration distribution within the incinerator.

3.2. Calculation Model of Ash Particles

The ash particles primarily moved in the main direction of the flue gas. During their motion, fluctuations in gas velocity caused by gas-phase turbulence exerted forces on the particles, causing them to deviate from the main flow direction. These particles then passed through the boundary layer, reached the wall surface, and collided with it. Therefore, the SSF was employed to simulate the transport process of ash particles [22,23,24]. During the calculation, it was assumed that the velocity fluctuations were isotropic. The velocity fluctuations were calculated by sampling the PDF containing the standard deviation equation proposed by Gauss: (2k/3)0.5. The motions of the simulated particles were obtained by solving the transient momentum equation for the particle phase [25].
The Gunn model was used to calculate the heat transfer between the gas and particles. The formula for calculating the viscosity of the ash particles is as follows:
μ = A T e x p ( B / R T )
where A and B are parameters related to the chemical composition of the particles, and R is the gas constant. The critical viscosity was used as a criterion to calculate the probability of particle adhesion. When the viscosity of the ash particles is lower than the critical viscosity, the probability of the ash particles adhering to the wall is 1; when the viscosity of fly ash particles is higher than the critical viscosity, the adhesion probability is the ratio of the critical viscosity to the actual viscosity of the particles, and the calculation formula is
P i T p s = μ r e f μ ,   μ > μ r e f
P i T p s = 1 ,   μ < μ r e f
where P i represents the probability of particle group i with an average viscosity μ adhering to the wall, and T p s represents the temperature of particle group i.
To simplify the calculation process, the ash particles were uniformly fed into the throat after the gas-phase combustion in the furnace reached stability. It was assumed that the ash particles were spherical and maintained a constant diameter during motion. The primary parameters of the ash particles are listed in Table 3. According to previous experimental tests, the ash particles that form slag on the water-cooled wall of the first flue are C a 3 F e 2 S i 3 O 12 , M g O C a 2 O 2 S i 2 O 4 , and C a A l 2 S i 2 O 8 [26]. The concentration of the ash particles in the first flue was 2500 mg/Nm3, and the incident particle mass flow rate was taken as 15.65 g/s.

4. Results and Analysis

4.1. Calculation Results and Analysis of Gas-Phase Combustion

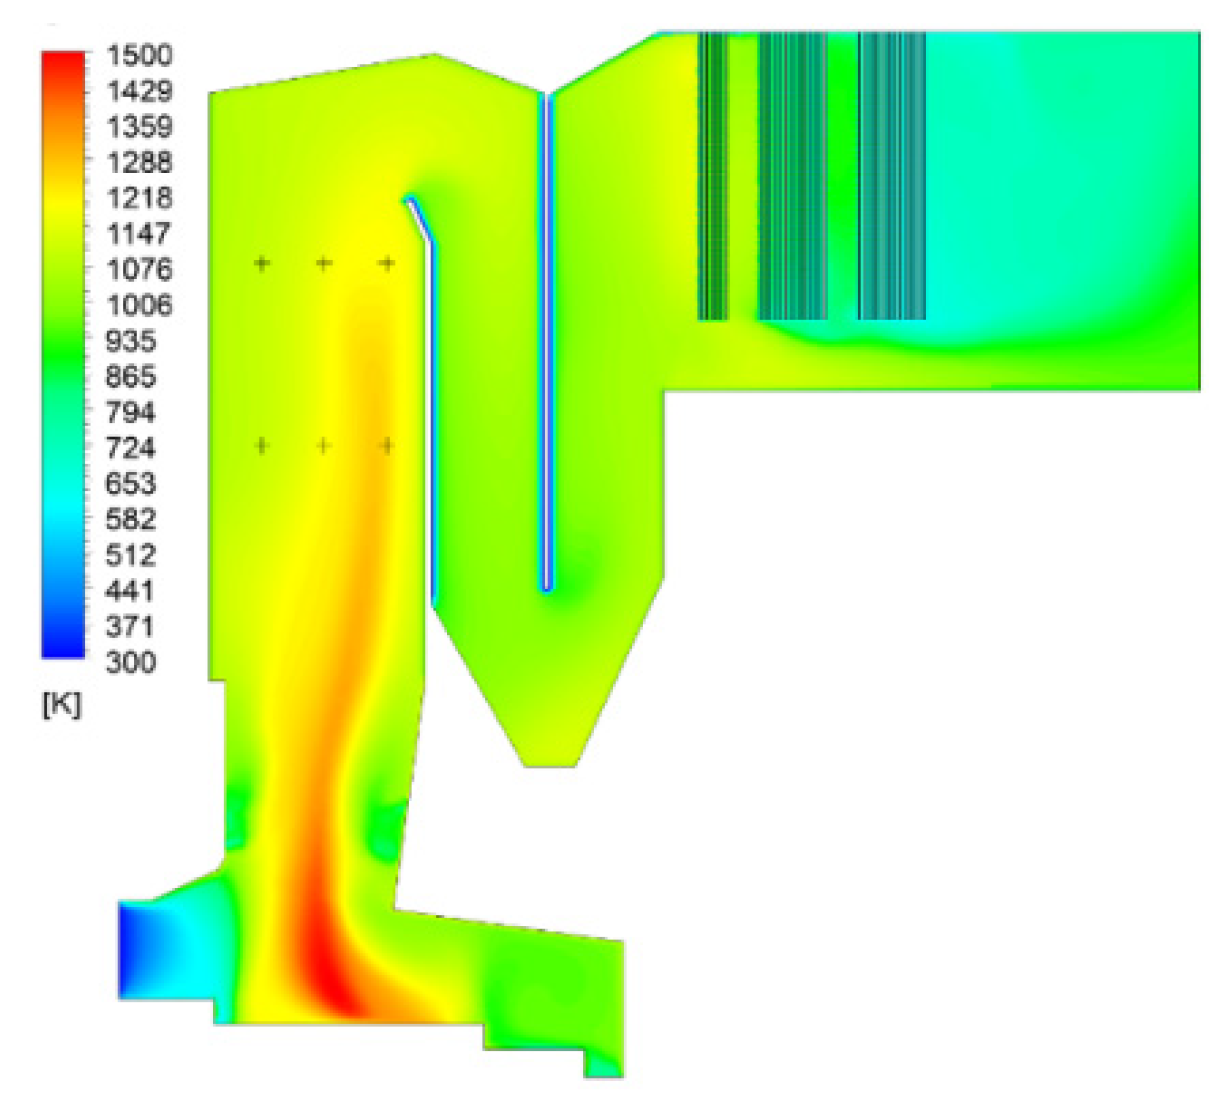
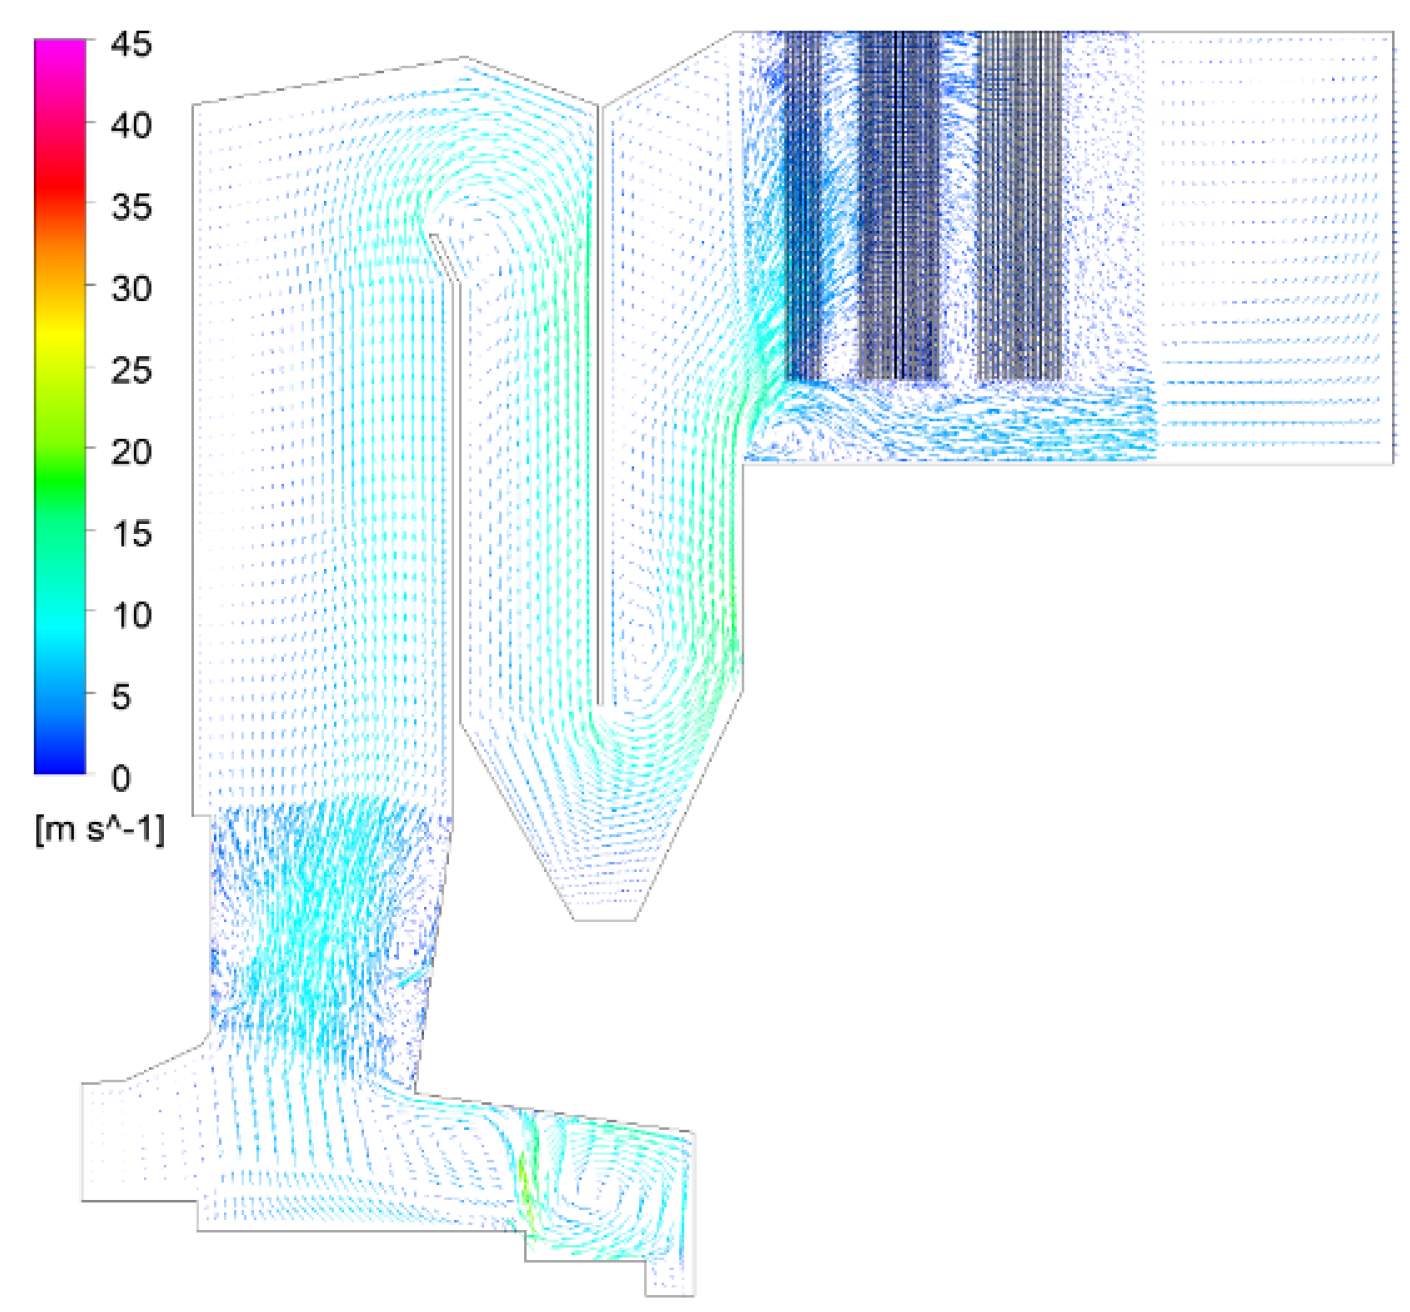
Figure 5 shows the temperature distribution inside the incinerator. Figure 6 shows the velocity field of the flue gas inside the incinerator. With the combustion of volatiles, the high-temperature flue gas enters the first flue through the throat, exchanges heat with the water-cooled wall, passes through the third and second flues, and exchanges heat with the third-, second-, and first-stage superheaters. As the flue gas flowed, the temperature gradually decreased. The average temperature of the flue gas outside the first flue was approximately 1200 K, and the average velocity of the flue gas in the first flue was approximately 4.45 m/s.
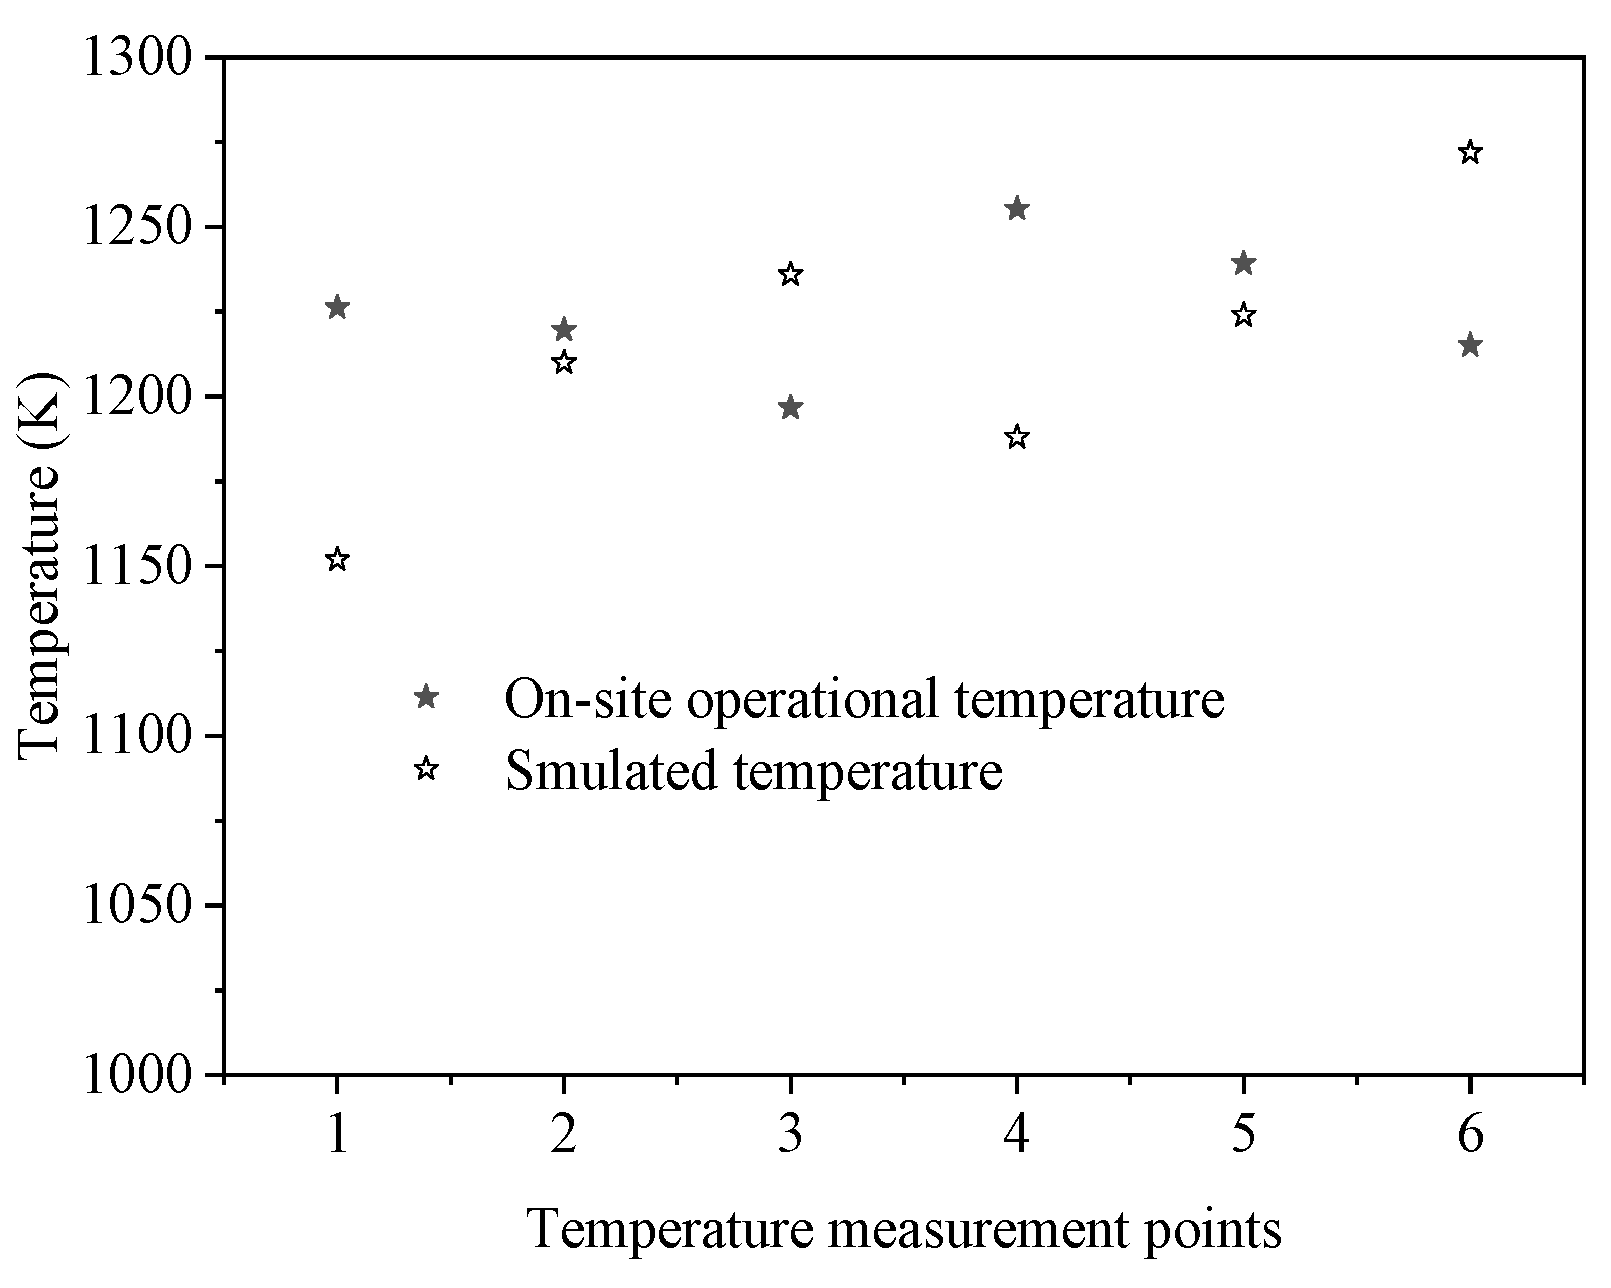
During actual operation, the flames inside the furnace exhibited an S-shaped oscillation as the grate moved. In this study, the incineration process of MSW in an incinerator was calculated to simplify the calculation model for the slagging process of water-cooled walls. First, the movement of the grate and the reaction process of solid materials were considered. Subsequently, the temperature, composition, and velocity parameters of the gas phase above the material layer were considered as the inlet parameters for the combustion process calculation, and the temperature distribution inside the incinerator was obtained. Figure 7 shows a comparison between the average temperature of the six measuring points in the upper part of the first flue during on-site operation over a 3-month period and the temperature calculated in the numerical simulation. The high-temperature area calculated in the simulation was biased to the right, and the average temperature was not significantly different from the temperature measured on site, indicating that the temperature in the first flue calculated in the simulation was consistent with the temperature in the first flue during actual operation.

4.2. The motion Trajectory of Ash Particles

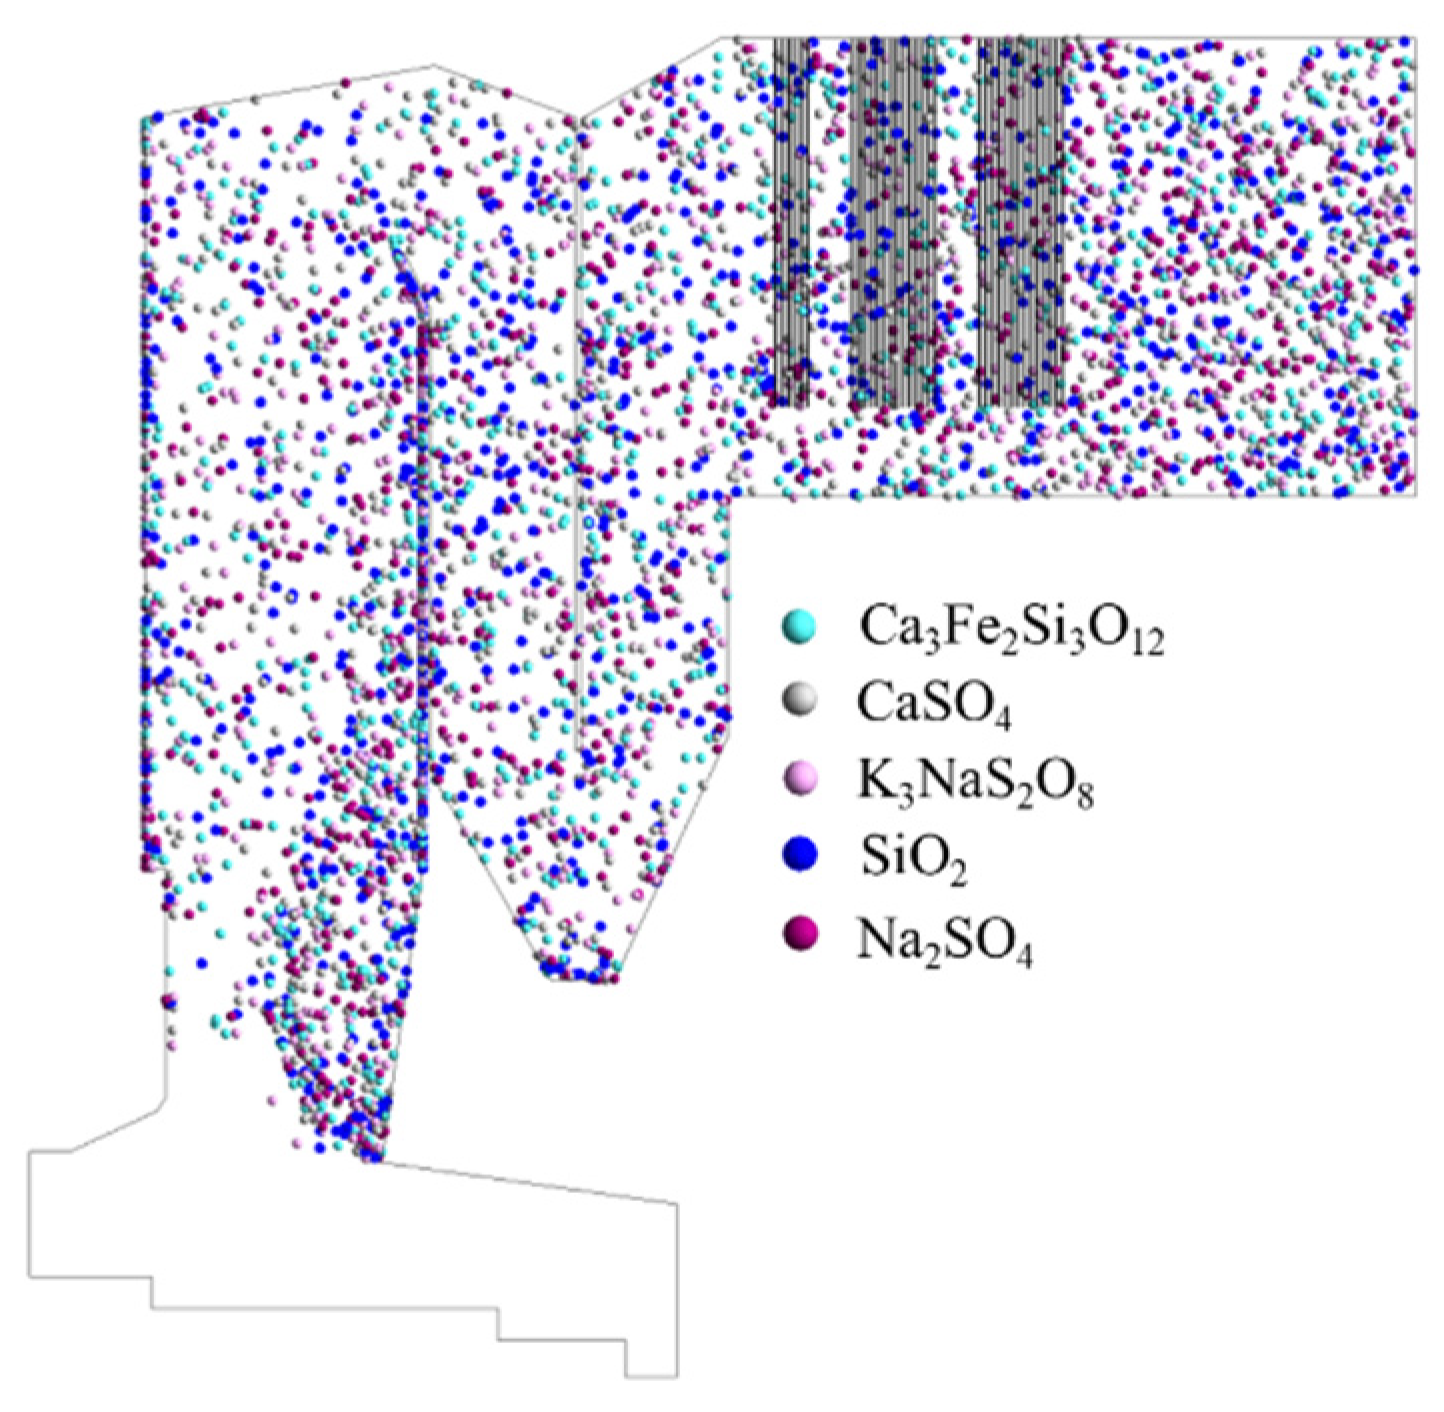
Figure 8 shows the distribution of the particles in the flue after 20 s, and Figure 9 shows the corresponding particle trajectories. At 20 s, the particles spread throughout the flue and heat exchanger area, and the particles basically moved towards the outlet with the flue gas. Some particle trajectories stopped on the water-cooled wall, indicating that particles adhered to the wall surface.
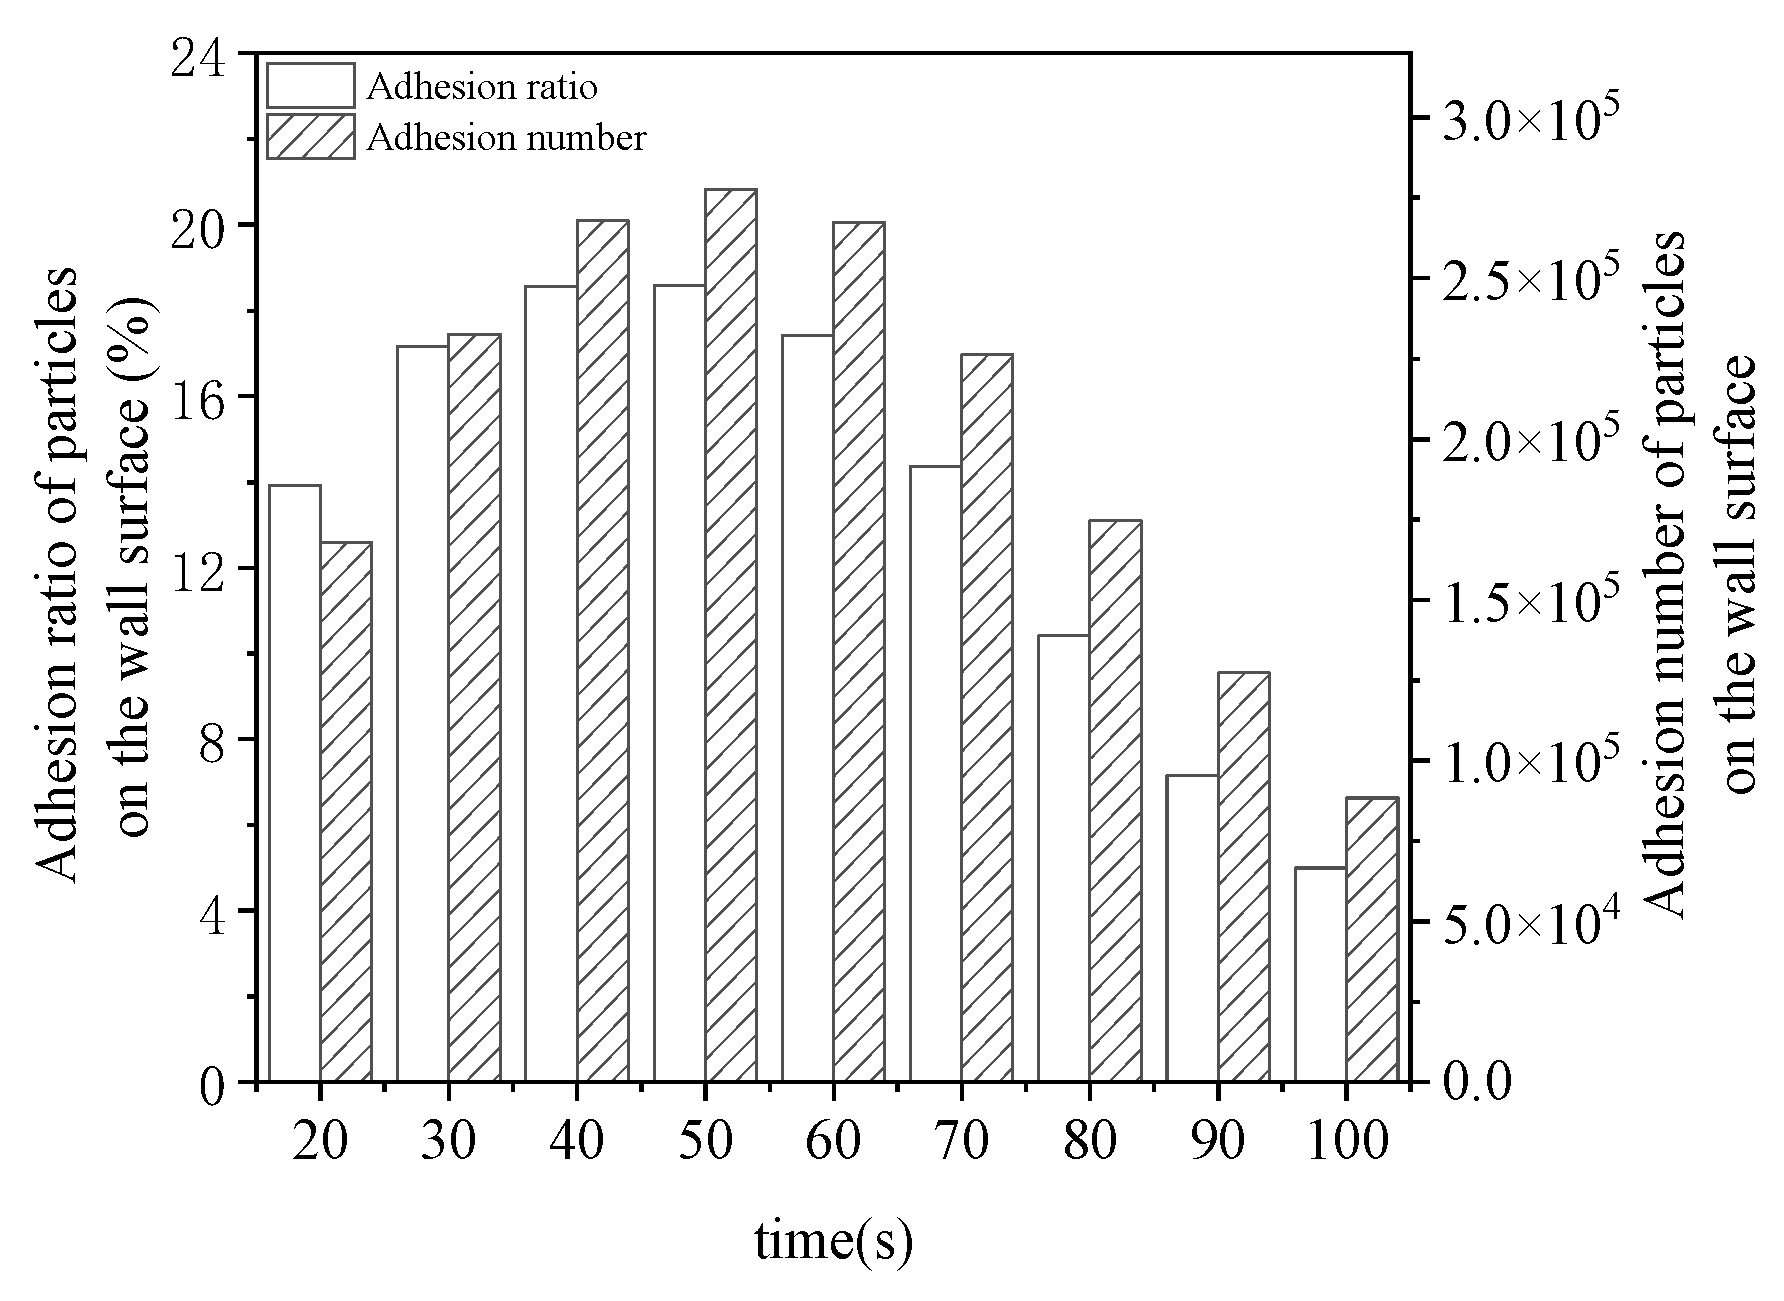
To analyse the adhesion of particles on the water-cooled wall during the flow of flue gas, data were collected every 10 s starting from 20 s after particle entry into the flue. The statistical results are shown in Figure 10, where the adhesion ratio refers to the ratio of particles adhering to the wall within 10 s of entering the flue. The adhesion ratio of ash particles gradually increased before 50 s, and the highest adhesion ratio of ash particles reached 18.59% within 40–50 s. The adhesion ratio of ash particles gradually decreased within 50–100 s, reaching 4.99% within 90–100 s. This is because, as the concentration of particles in the flue increases, the probability of these particles hitting the wall also increases. Because of the low velocity of the flue gas near the wall, the velocity of the particles located near the wall was low, which resulted in a reduced movement speed for the particles near the wall. Over time, the incoming ash particles were influenced by previously deposited particles, which led to a decrease in the probability of encountering the wall. Consequently, the probability of ash particles adhering to the water-cooled wall decreased.

4.3. The Influence of Ash Particle Size

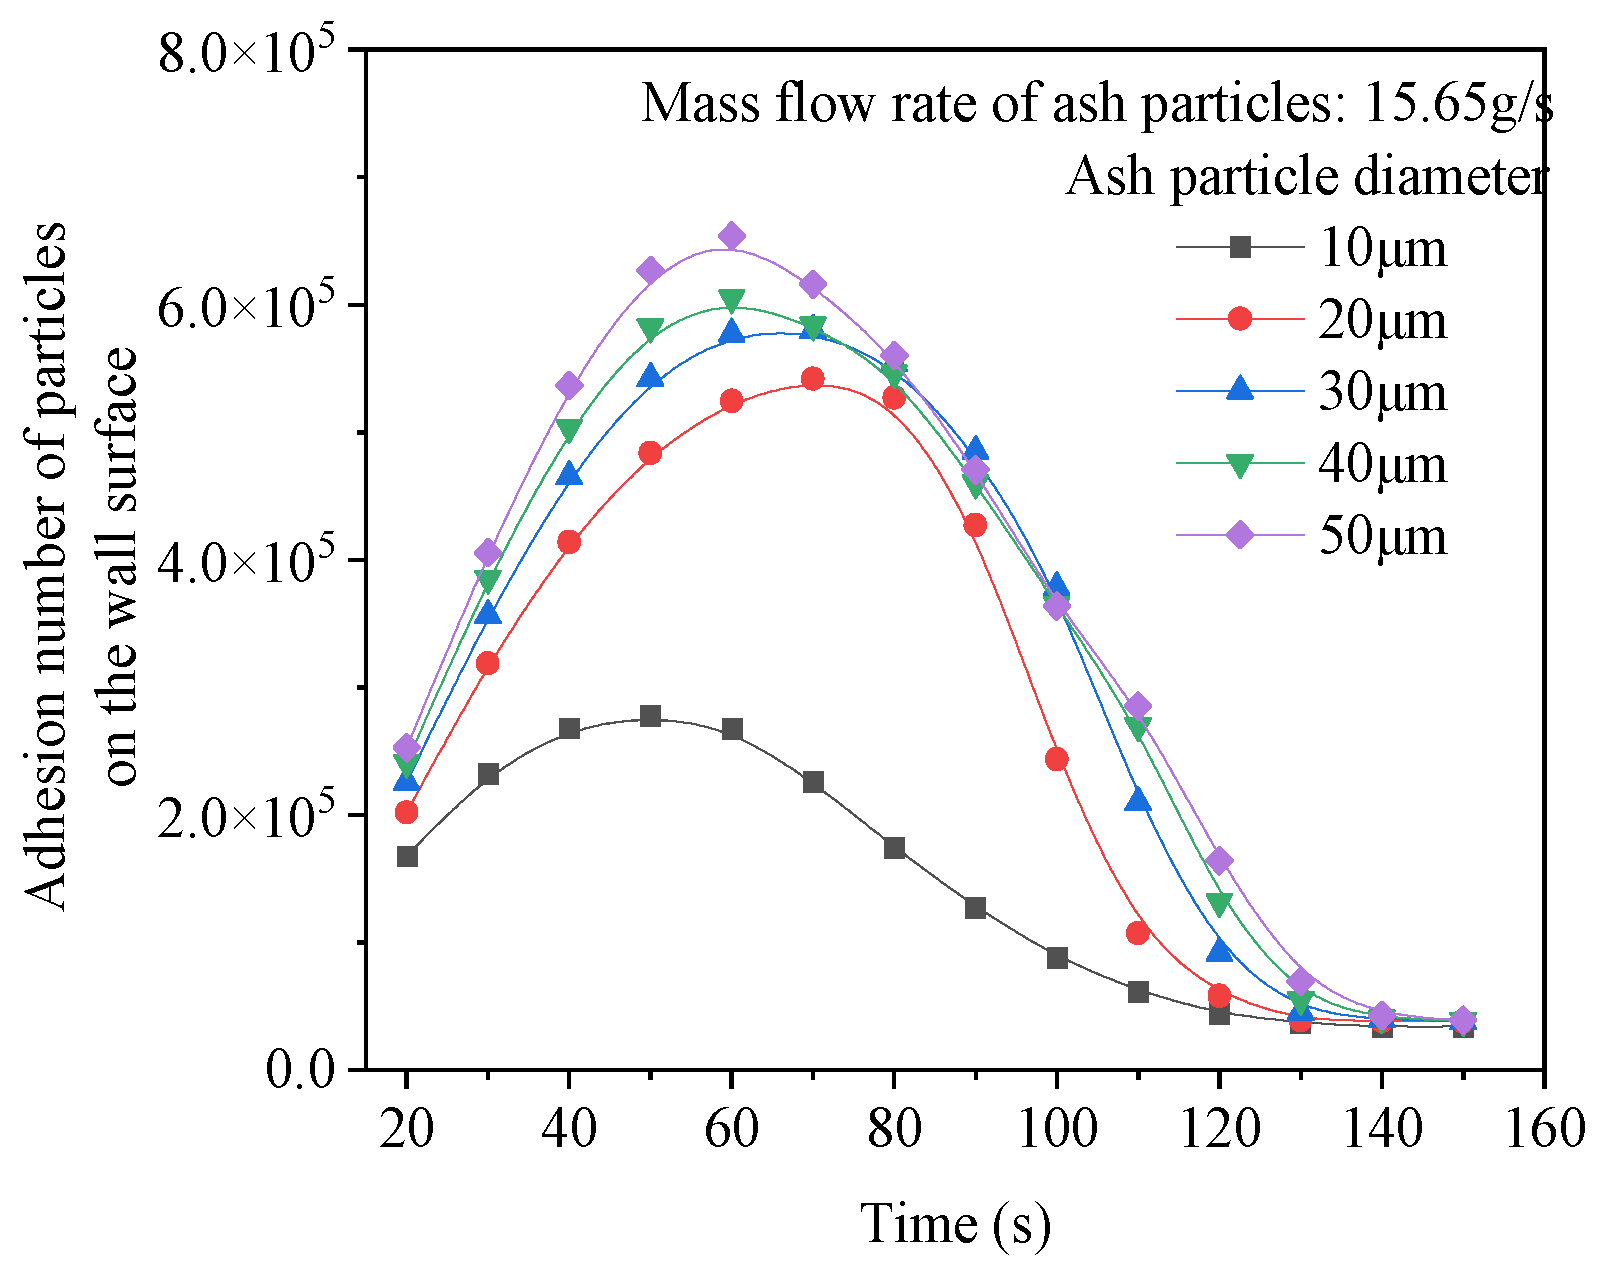
In actual operations, the diameter of ash particles varies, and particles of different sizes are subjected to different drag forces from the flue gas. To analyse the influence of the ash particle diameter on the adhesion ratio on the water-cooled wall surface, the number of adhesions of ash particles with diameters ranging from 10 μm to 50 μm on the water-cooled wall surface was calculated while maintaining the total ash content (Figure 11). At approximately 50–70 s, the adhesion of ash particles on the surface of the water-cooled wall reached its maximum value. At the same mass flow rate, although there were more ash particles of smaller sizes, the number of particles adhering to the water-cooled wall was not high. Over time, the difference in the number of ash particles of different sizes that adhered to the surface of the water-cooled wall gradually decreased.
Due to the gradual stabilisation of particle adhesion on the water-cooled wall over time, data from 100 to 150 s were taken to calculate the effect of particle size on the adhesion rate. Figure 12 shows the effect of particle size on the adhesion ratio. Smaller particles were more easily transported by flue gas. This is because their smaller size allows them to disperse and flow better with the flue gas. The temperature of smaller particles was also more susceptible to changes influenced by the temperature of the surrounding flue gas. As the particle size decreased, the likelihood of the particles forming slag on the surface of the water-cooled wall also decreased. When the particle size was 10 mm, the adhesion ratio was approximately 2.72%. This means that 2.72% of the 10 mm particles adhered to the wall, whereas the remaining 97.28% continued to flow with the flue gas or were removed by other mechanisms. When the particle size increased to 50 mm, the adhesion ratio increased to approximately 8.24%. This indicates that larger particles are more likely to stick to the wall because of their increased momentum and surface area. When small particles enter the tail heat exchange surface, they accumulate as dust on the surface of the heat exchanger. This can lead to a reduction in the heat transfer efficiency over time. The remaining small particles are captured and removed by a dust collector, which is an essential component for maintaining clean and efficient operation.

4.4. The Influence of Ash Particle Concentration

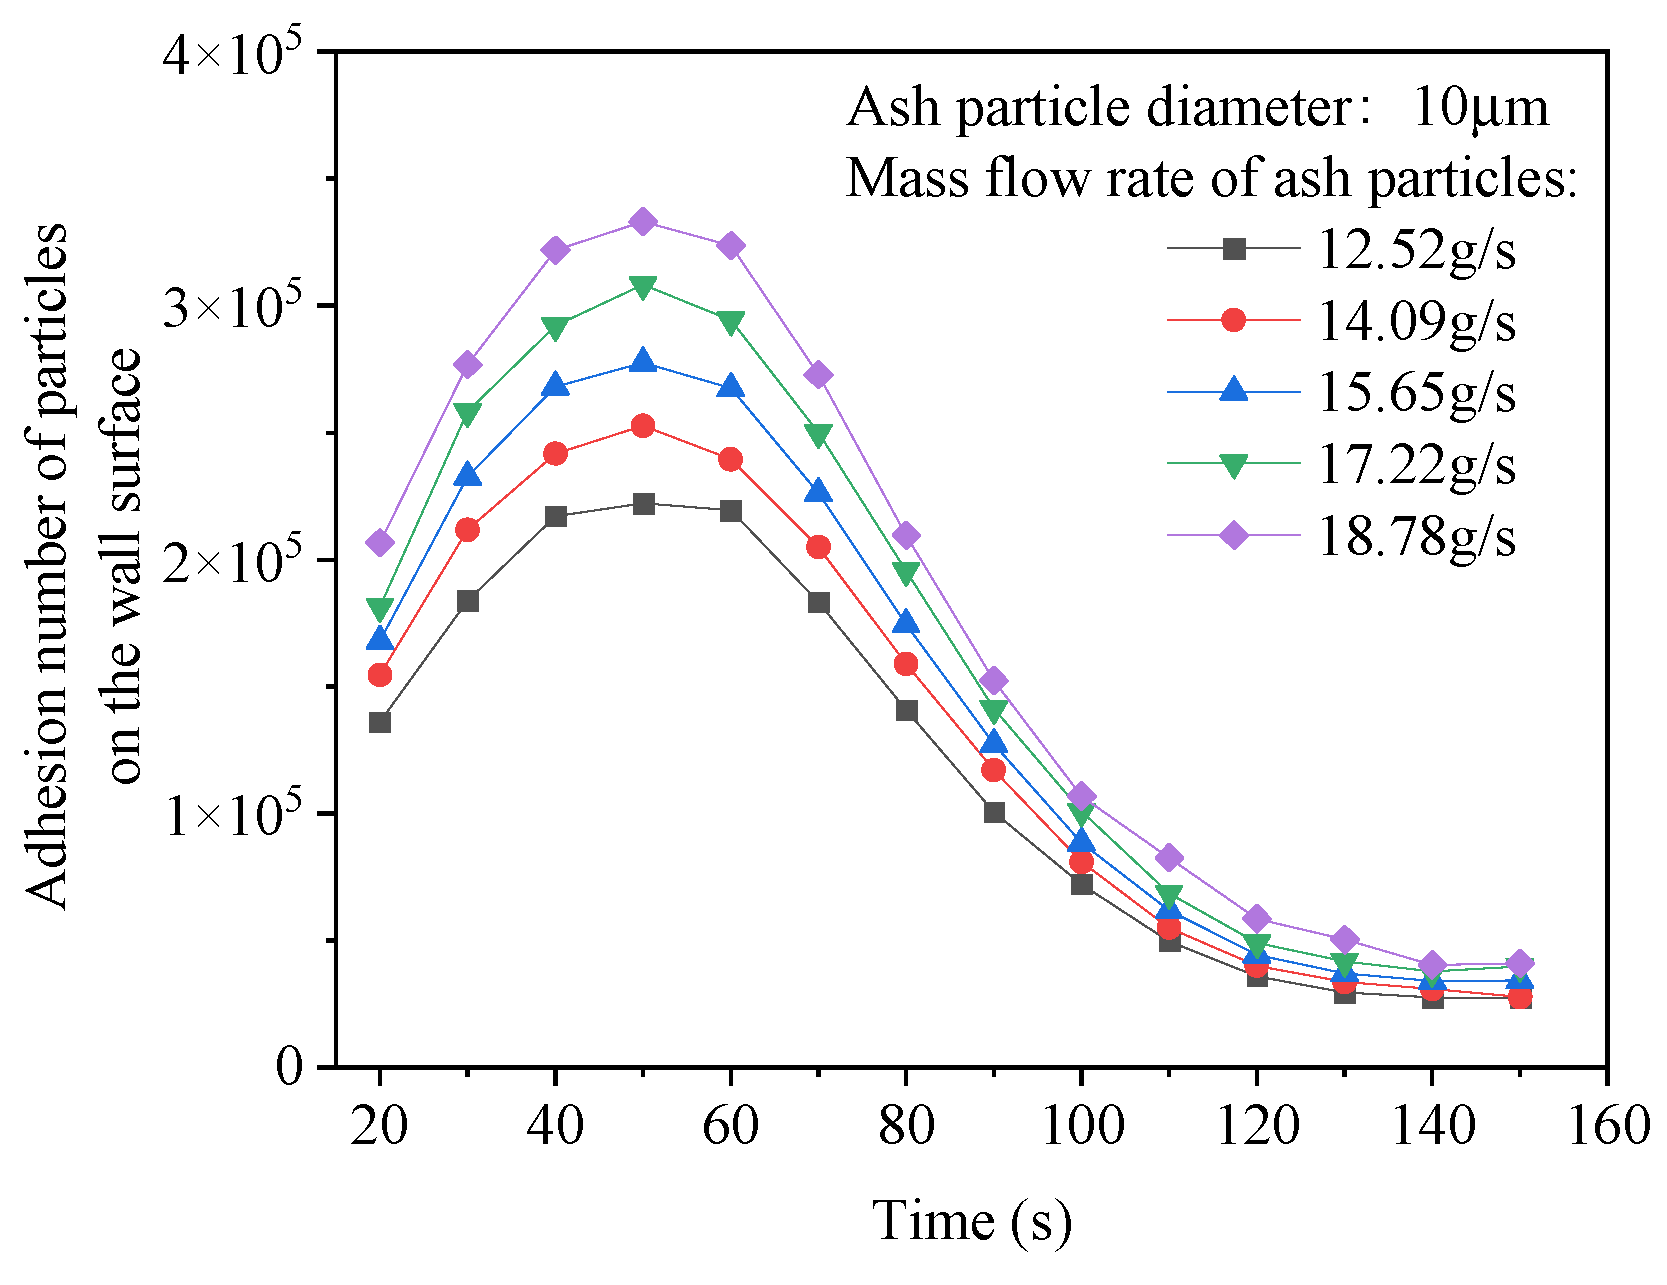
During incinerator operation, the grate serves as a platform for the combustion of waste materials. As the grate advances or flips, it agitates the material, thereby causing more ash particles to rise and become suspended. When the primary air volume passing through the material layer on the grate increases, more air flows through the material layer. The increased airflow has the capacity to carry more ash particles, thereby increasing the concentration of ash particles in the flue gas. Figure 13 shows the variation in the adhesion number of the ash particles on the water-cooled wall surface when the particle size was 10 mm. As the concentration of ash particles increased, the number of ash particles adhering to the water-cooled wall increased, and the maximum amount of adhesion occurred at approximately 50 s for different concentrations of ash particles. As time progressed, the difference in the adhesion numbers at different concentrations of ash particles decreased, and the number of adhesions per unit time tended to stabilise.
Figure 14 shows the influence of the ash particle concentration on the adhesion ratio. Because of the impact of particle collisions, as the particle concentration increased, although the number of particles adhering to the water-cooled wall increased, the adhesion ratio gradually decreased. When the mass flow rate of ash particles entering the first flue was 12.52 g/s, the proportion of ash particles adhering to the water-cooled wall was 2.87%. When the mass flow rate of ash particles entering the first flue was 18.78 g/s, the proportion of ash particles adhering to the water-cooled wall decreased to 2.45%.

5. Conclusions

To optimise the operation of incinerators and reduce the slagging rate, this study took a 500 t/d household waste incinerator as the research object. First, the composition and melting characteristics of slag samples on the water-cooled wall of the incinerator were analysed. The composition of the slag on the water-cooled wall of the incinerator was mainly Ca2Al(AlSiO7), CaSO4, and CaMgSi2O6, with a softening temperature of approximately 1113 ℃. Second, a gas-phase combustion model of the incinerator was established, and the temperature and velocity distributions of the flue gas inside the incinerator were calculated. The temperature at the outlet of the first flue was approximately 1200 K, which was consistent with the average temperature at the outlet of the first flue during the actual operation of the incinerator. Subsequently, based on the incineration process and DPM, a numerical calculation model for the slagging process of water-cooled walls in incinerators was constructed, and it considered the transport and adhesion processes of ash particles. The motion trajectory of the ash particles was tracked, and the influence of parameters such as ash particle size and concentration on the degree of slagging on water-cooled walls was analysed. Smaller ash particles were less likely to adhere to water-cooled walls, with approximately 2.72% of ash particles with a particle size of 10 mm adhering to them. The proportion of ash particles with a particle size of 50 mm adhering to water-cooled walls was approximately three times that of those with a particle size of 10 mm. As the concentration of ash particles increased, the number of ash particles adhering to the water-cooled wall increased, and the adhesion ratio decreased.

Acknowledgments

This work was supported by the Natural Science Foundation of Shanghai Municipality (Grant No. 22ZR1465900) and the Program of Shanghai Academic/Technology Research Leader (Grant No. 21XD1434000).

References

  1. Cheng W, Ju A L. Current Situation and Enlightenment on Incineration Treatment of Domestic Waste in Japan. Environmental Sanitation Engineering, 2019, 27(06): 57-60.
  2. Zhou D. Rapid development of waste-to-energy incineration in Europe. Chinese and Foreign Energy, 2018, 23(07): 38.
  3. National Bureau of Statistics. (2024). Retrieved from https://data.stats.gov.cn.
  4. Zhong D, Zeng K, Li J, et al. Characteristics and evolution of heavy components in bio-oil from the pyrolysis of cellulose, hemicellulose and lignin. Renewable and Sustainable Energy Reviews, 2022, 157: 111989.
  5. Wang R Q, Bo Rong B, Ma S. et al. Prediction of ash fusion temperatures of municipal solid waste incinerator. Journal of the Energy Institute, 2023,111: 101438.
  6. Jiang X G, Meng X F, Liu G J. Research status of deposition growth on heat exchange surface of waste incineration system and countermeasures for deposition control. Chemical Industry and Engineering Progress, 2021, 40(S1): 375-385.
  7. Ma W C, Zhou H, Zhang J K, et al. Behaviour of slagging deposits during coal and biomass co-combustion in a 300 kW down-fired furnace. Energy & Fuels, 2018, 32(4): 4399-4409.
  8. Walsh P M, Sayre A N, Loehden D O, et al. Deposition of bituminous coal ash on an isolated heat exchanger tube: Effects of coal properties on deposit growth. Progress in Energy and Combustion Science, 1990, 16(4): 327-345.
  9. Chen L, Yong S Z, Ghoniem A F. Modelling the slag behaviour in three dimensional CFD simulation of a vertically-oriented oxy-coal combustor. Fuel Processing Technology, 2013, 112: 106-117.
  10. Ni J, Zhou Z, Yu G, et al. Molten slag flow and phase transformation behaviors in a slagging entrained-flow coal gasifier. Industrial & Engineering Chemistry Research, 2010, 49(23): 12302-12310.
  11. Chen L, Ghoniem A F. Development of a three-dimensional computational slag flow model for coal combustion and gasification. Fuel, 2013, 113: 357-366.
  12. Wang X H. A review on numerical modeling of ash deposition during the process of pulverized coal combustion. ADVANCES IN MECHANICS, 2005(03): 417-426.
  13. Li W Y. The Numerical Simulation of Coal Powder Combustion Process and Slagging in Utility Boiler. North China Electric Power University (Beijing), 2003.
  14. Pintana P, Tippxayawong N. Prediction of Slag Occurrence in a Lignite-Fired Utility Boiler. WSEAS Transactions on Environment and Development, 2014, 10: 202-210.
  15. Pérez M G, Vakkilainen E, Hyppänen T. 2D dynamic mesh model for deposit shape prediction in boiler banks of recovery boilers with different tube spacing arrangements. Fuel, 2015, 158: 139-151.
  16. Tang S Z, He Y L, Wang F L, et al. Parametric study on fouling mechanism and heat transfer characteristics of tube bundle heat exchangers for reducing fouling considering the deposition and removal mechanisms. Fuel, 2018, 211: 301-311.
  17. Fu L, Liu P, Li G. Numerical investigation on ash fouling characteristics of flue gas heat exchanger. Applied Thermal Engineering, 2017, 123: 891-900.
  18. Wang X H, Zhao D Q, Jiang L Q, et al. The deposition and burning characteristics during slagging co-firing coal and wood: modeling and numerical simulation. Combustion Science and Technology, 2009, 181(5): 710-728.
  19. Wang J J. Research on Optimization of Slagging Prevention Structure of Municipal Solid Waste Incinerator Based on CFD Numerical Simulation. Zhejiang University, 2022.
  20. Klasen T, Görner K. The use of CFD for the prediction of problem areas inside a waste incinerator with regard to slagging, fouling and corrosion.
  21. Ma T, Zhou H Q, Xu F, Chen D Z, et al. Numerical Simulation and Intelligent Prediction of a 500t/d Municipal Solid Waste Incinerator. Energy, 2024, 312: 133646.
  22. Shuen J S, Solomon A S P, Zhang Q F, et al. Structure of particle-laden jets-Measurements and predictions. AIAA Journal, 1985, 23(3): 396-404.
  23. Lee F C C, Lockwood F C. Modeling ash deposition in pulverized coal-fired applications. Progress in Energy and Combust Science, 1999, 25(2): 117-132.
  24. Costen P G, Lockwood F C, Siddique M M. Mathematical modeling of ash deposition in pulverized fuel-fired combustors. Proceedings of the Combustion Institute, 2000, 28(2): 2243-2250.
  25. Richards G H, Slater P N, Harb J N. Simulation of ash deposit growth in a pulverized coal-fired pilot scale reactor. Energy and Fuels, 1993, 7(6): 774-781.
  26. Jia T Y, Chen S P, Teng L L, et al. Characteristics and mechanism of slagging in a 500 t/d MSW incinerator, Journal of the Energy Institute, 2024, 114: 101585.
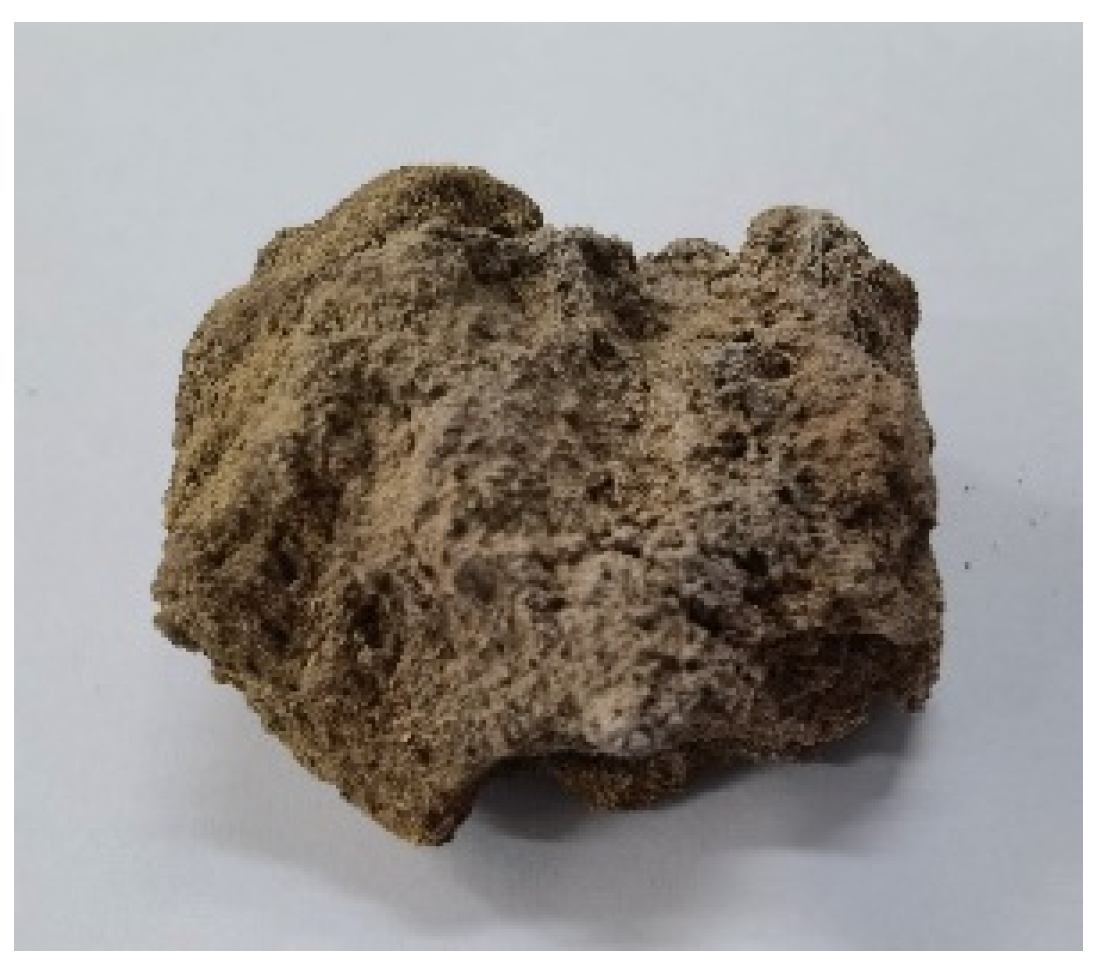
Figure 1. Slag sample from the water-cooled wall.
Preprints 140707 g001
Figure 2. SEM images of the slag sample at different magnifications.
Preprints 140707 g002
Figure 3. XRD results.
Preprints 140707 g003
Figure 4. Calculation model.
Preprints 140707 g004
Figure 5. Temperature distribution.
Preprints 140707 g005
Figure 6. Velocity field.
Preprints 140707 g006
Figure 7. Comparison between the on-site operational temperature and the simulated temperature.
Preprints 140707 g007
Figure 8. Particle distribution.
Preprints 140707 g008
Figure 9. Particle trajectory.
Preprints 140707 g009
Figure 10. The number and ratio of particles that adhered to the wall surface over time.
Preprints 140707 g010
Figure 11. The influence of particle size on the adhesion number.
Preprints 140707 g011
Figure 12. The influence of particle size on the adhesion ratio.
Preprints 140707 g012
Figure 13. The influence of particle concentration on the adhesion number.
Preprints 140707 g013
Figure 14. The influence of particle concentration on the adhesion ratio.
Preprints 140707 g014
Table 1. Elemental composition (%).
CaO SiO2 SO3 Fe2O3 Al2O3 Na2O K2O
25.008 17.506 14.588 13.305 7.161 7.064 4.214
P2O5 TiO2 MgO ZnO Cl Cr2O3 MnO
2.519 2.486 2.403 2.146 0.656 0.283 0.254
CuO PbO NiO SrO Sb2O3 ZrO2 Br
0.094 0.084 0.07 0.05 0.042 0.041 0.016
Table 2. Fusion temperature (℃).
Deformation temperature (℃) Softening temperature (℃) Hemispherical temperature (℃) Flow temperature (℃)
1111 1113 1116 1128
Table 3. The main parameters of ash particles.
Parameter Value
Diameter (m) 10−5
Temperature (K) 1090
Mass flow rate (g/s) 15.65
Velocity (m/s) 6.22
Disclaimer/Publisher’s Note: The statements, opinions and data contained in all publications are solely those of the individual author(s) and contributor(s) and not of MDPI and/or the editor(s). MDPI and/or the editor(s) disclaim responsibility for any injury to people or property resulting from any ideas, methods, instructions or products referred to in the content.
Copyright: This open access article is published under a Creative Commons CC BY 4.0 license, which permit the free download, distribution, and reuse, provided that the author and preprint are cited in any reuse.
Prerpints.org logo

Preprints.org is a free preprint server supported by MDPI in Basel, Switzerland.

Subscribe

© 2024 MDPI (Basel, Switzerland) unless otherwise stated