
Submitted:
09 December 2024
Posted:
10 December 2024
You are already at the latest version
Abstract
Lysosomes are important organelles of eukaryotic cells required for autophagy, endocytosis, protection against pathogens, maintenance of metabolic balance and cell signaling. A model of ion homeostasis and synchronised, interdependent operation of ion transporters in the lysosome allows one to predict the response to external influences and to design and interpret experiments correctly. Especially, with the advent of organelle rhodopsin optogenetics, there is a great need to predict cellular outcomes after light-driven specific ion transport in lysosomes and other organelles. At present, there are no models of lysosomal ion balance that fully match the current experimental data and allow simulation the organelle’s response to stress. Here we present an interactive model that provides near-lysosomal ion concentrations and adequate stress responses. The model is stable to lysosome maturation, transient organelle swelling, membrane permeabilization, deacidification by vATPase inhibition or additional proton efflux, accumulation of weakly basic, “proton sponge”-like cationic amphiphilic drug (CAD) in the lysosome. The model shows that at least one of the functions of lysosomal calcium could be attributed to the stress signal of organelle deacidification. As a major advance, our simulation provides the possibility to have the lysosome under mixed stress conditions. In addition to suggesting the dynamics of the stress response, the model also allows to study of purely selective effects, which can be experimentally induced using optogenetics. Understanding the mechanisms of stable, stress-resistant functioning of the lysosome provides ideas for the invention of anti-disease and anti-aging interventions.
Keywords:
lysosome
; model
; ions
; pH
; calcium
; stress response
; optogenetics
1. Introduction
Lysosomes are an important organelles of eukaryotic cells that digest nutrients, metabolites and internal cellular components. Lysosomes are also involved in signaling and protection against pathogens [1]. Lysosomal diseases, including proteinopathies, neurodegenerative diseases and others, are severe diseases that shorten the average life expectancy of humans [2,3].
Persistent pH elevation and ionic imbalance of lysosomes are characteristic of patients with neurodegenerative diseases [4,5,6], type II diabetes [7], infectious and rare genetic diseases [8]. Therefore, in the search for ways to prevent these pathologies, it is necessary to elucidate the mechanisms of maintaining stable functioning of lysosomes.
Current knowledge about the functioning of various ion transporters and enzymes in the lysosome is incomplete [9]. It is known, that an acidic environment is maintained in the lumen of the lysosome for the optimal functioning of the degradative enzymes. In addition to catalysing degradation, the low pH (~4.5) and high proton gradient across lysosome membrane provide capability for the transport of other ions, such as chloride [10]. This coupling between acidification and ion transport is essential. Indeed, mice have a severe disease phenotype due to reduced chloride influx, despite low lysosomal pH, after mutation in ClC7 [11] or ClC-5 [12], which rest anion transport but shut down chloride-to-proton exchange.
The high acidity of lysosomes is maintained by the action of several transmembrane transporters. First, the H+-vacuolar type ATPase (vATPase) produces an ATP-dependent proton pumping into the lysosomal lumen. Second, Cl−/H+ antiporter (ClC7) [13] pumps out chloride and pumps in protons, thereby promoting acidification [14,15]. At a positive lysosomal lumen potential, ClC7 can reverse the direction of the exchange and, by pumping out the proton, pump in two Cl- as a counterions. Compensation of the positive membrane potential by anion influx allows bulk acidification by electrogenic vATPase [16]. One of the most recent pieces of evidence in favour of Cl- as a counterion is the fact that chloride increased the acidification on isolated synaptic vesicles [17].
The role of decreasing the membrane potential caused by protons is also claimed by the cations K+, Na+ [18], which flow out of the lysosome through leak-like channels or through K+-selective TMEM175 [19] or Na+-selective Two-Pore Channel 1 (TPC1) [15]. The Na+/K+ cation counterflux allows protons to enter more rapidly, especially in the cases when ATP resources are limited [19,20]. The release of sodium/potassium cations in exchange for protons is also more desirable for stability than the injection of chloride ions in parallel with protons, since an increase in the intralysosomal concentration of ions should increase the osmotic pressure and lead to the entry of water, swelling of the lysosomes [21]. Furthermore, in lysosomes isolated from macrophages, only the possibility of pumping out from of the lysosomes has been demonstrated for cations, while the influx of chloride into such lysosomes has been practically not observed [15]. In general, the identification of the actual counterion/counterflux that enables high lysosomal acidification remains an open task [9].
Another unanswered question in lysosomal ion homeostasis is the mechanism for maintaining Na+, K+ ion concentrations at experimentally defined levels [18]. The problem for the lysosome to maintain stable low potassium and high sodium concentrations is that cytosol has high [K+] and low [Na+]. First, lysosomes fuse with endosomes so that near-extracellular, low [K+] and high [Na+] ion concentrations can be achieved. Second, NHEs (Na+ or K+/H+ exchangers) could, in principle, increase lumen [Na+] by dissipating the proton gradient. Third, removal of potassium and addition of sodium ions could be achieved by Na+/K+-ATPase. Fourth, some transporters such as TRPMLs and P2X4 could provide K+ efflux [22].
Stress response is one of the central roles of the lysosome, because it knows about nutrient supply (endocytosis), garbage accumulation (autophagy), enemy attack (phagocytosis, ROS sensing) and has proteins on the membrane that could give signals to other proteins or modulate expression pattern [23,24]. Lysosomes frequently experience stresses such as maturation [25], reactive oxygen species attack [26], osmotic swelling [27], cycles of activated-inhibited vATPase as an adjustment to catabolic-anabolic metabolic modes [28,29], permeabilisation-membrane repair [30], functioning under starvation conditions [20], accumulation of protein aggregates or weakly basic, “proton sponge”-like cationic amphiphilic drugs (CAD) (substances with proton-accepting groups that accumulate in protonated form in cellular acidic membrane compartments) [31,32], involvement in calcium stress signaling [6]. It is therefore necessary to study stress tolerance to such extreme conditions [33] and to predict biomarkers of cellular adaptation.
With the advent of organelle rhodopsin optogenetics [34], it has become possible to study the mechanisms of lysosomal ion regulation directly, i.e. using light-driven selective proton, chloride, sodium, potassium pumps or channels directly in living cells, in situ. First, one could study how will the lysosome responds to the release of protons. This is possible using the inward proton pump NsXeR [35], which is already integrated into the lysosome [36]. It is possible that deacidification leads to calcium release, as has been shown indirectly by vATPase inhibition [37] or the use of bafilomycin A1 [38]. Second, the counterion/counterflux problem could possibly be solved by lysosome-embedded sodium pump KR2 [39], potassium channel KCR [40], chloride pumps (e.g. SyHR [41], NpHR [42]). However, in order to design such experiments and interpret their results correctly, it is necessary to develop theoretical ideas about the consequences of such narrowly targeted changes.
The value of modelling lysosomal pH regulation lies not only in consolidating fundamental concepts of the mechanisms of organelle ion homeostasis, but also in providing predictive capabilities for experimental design. Therefore, a theoretical model is needed, while current model implementations have drawbacks (Table S1).
Our model is based on the experience of previous physics-mathematics models of lysosomal ion homeostasis [14,43,44]. Our simulator has been designed to model ion fluxes using the Goldman-Hodgkin-Kanz current equation, supplemented by selective and lysosome-specific ion transporters, and ion/water leak-like fluxes. Our model allows testing different modes of lysosomal operation, stress effects and predicting the consequences of interventions to improve the stability of key organelle parameters. The model presented here is stable to parameter variation, equilibrates to near-lysosomal ion concentrations and is efficient for biologically important tasks. One can even mix multiple stresses simultaneously in the easy-to-use LysoModel.exe application.
2. Materials and Methods
2.1. Model description
Our model is based on a system of ordinary differential equations, constants from works [14,43,44]. A detailed description of the model is given in Supplementary Note 2, the initial values of parameters presented in Table S2.
The calculation of ionic passive fluxes (by Goldman-Hodgkin-Kanz current equation [45]) remains the same as in previous models:
where Pion is the permeability for a specific ion, S is the lysosomal membrane area, [ion]e\i is the cytosolic/lumenal ion concentration (Equations S2, S3), U is the reduced membrane potential, NA is Avogadro’s number (6.02214076×10²³ particles/mol). Reduced membrane potential is defined as
where F is the Faraday constant, R is the universal gas constant, temperature T = 298K, RT/F = 25.69 mV, Δψ is the potential defined by the luminal ions (Equation S7).
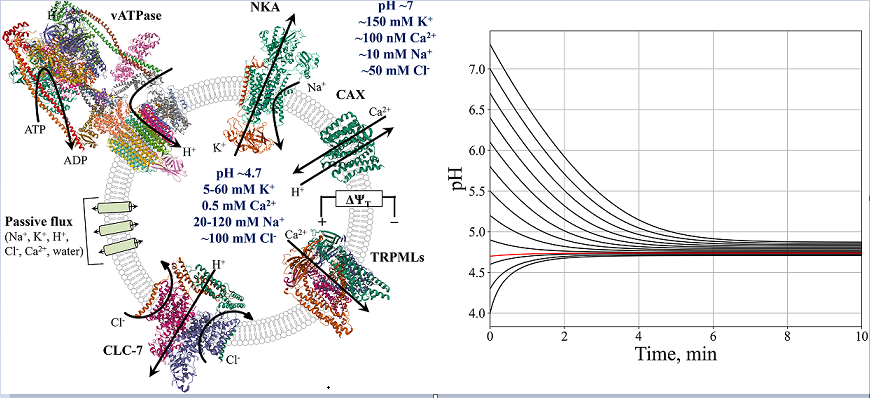
The equations describing the transporters activities were taken from previous models [14,43,44]. The model used here includes vATPase (producing proton influx), NKA (sodium/potassium-transporting ATPase, 3Na+ influx/2K+ efflux), CAX (3H+ efflux/Ca2+ influx exchanger), TRPML1 (calcium efflux), ClC7 (H+/2Cl- exchanger), potential-independent leak-like passive ion fluxes across the membrane and the water flux determined by the osmotic pressure in the lysosome (Figure 1A).
The potassium transporter TMEM175 and the sodium transporter TPC1 were not included in our model due to the lack of experimental data on a functional dependence of TMEM175/TPC1 ion flux on the potassium/sodium concentration and transmembrane potential difference [15,19]. Other important proteins that duplicate the function of ion transport of sodium or potassium (NHEs, Na+ or K+/H+ exchangers, known to limit endosome hyperacidification in non-cancerous cells [53]), chloride (CLN7, etc.), calcium (P2X4, BK, TPC2, etc.) [9] were also not used in the model.
Compared to previous works, two changes were made in the modelling of the normal lysosome.
First, a sodium/potassium-transporting ATPase (NKA) was used in the lysosome to maintain non-cytosolic sodium and potassium concentrations. This modification allows the maintenance of a sufficient, experimentally confirmed difference between the lysosomal and cytosolic cations concentrations [18]. The existence of NKA is known for the endosomal membrane [54], but lysosomes could rest NKA for some extent (proteomic study, ATP1A1, α1 subunit of Na+/K+-ATPase [55]). The efficiency of the Na+/K+-ATPases was set to 13 000 units in lysosomes (and 40 000 in late endosomes), so that the equilibrium lysosomal cations concentrations ([K+] = 60 mM, [Na+] = 20 mM [18]) were reached. Performance surface of NKA is shown in Figure S1A.
Notably, the use of electrogenic NKA (3Na+:2K+ exchange) in the model increased steady-state lysosomal pH, so we increased the number of vATPases from 300 to 550 compared to original model [14]. To some extent, the presence of NKA in the model could be replaced, first, by NHE, which transports sodium ions into the lysosomal lumen, to increase lysosomal [Na+], and, second, by some unknown source of potassium efflux to decrease lysosomal [K+].
Second, the equation describing the performance surface for vATPase was modified to approximate the experimental dependence of vATPase activity on lysosomal pH and potential [43]:
where - polynomials describing the numerical surface, obtained by fitting of surface slices, is the lysosomal pH, is the number of vATPase proteins. Thus, the numerical surface from the original work [43] has been replaced by polynomials to make modelling more convenient. The performance surface of vATPase is shown in Figure S1B.
The amount of vATPase in the previous model was 300 proteins with an activity of each ~100 H+/s each [14]. However, recent data on lysosomes in human cells indicate that there are on average 1.47 vATPase complexes per lysosome, 2-6 complexes per lysosome closest to the nucleus and 1.1 complexes per peripheral lysosome [56]. Similarly, published data on synaptic vesicles indicate that only one H+-ATPase is present in 80% of vesicles [17,57]. Therefore, we scaled the maximum number of vATPases from 550 to 6 proteins, while increasing their activity to match the experimental pH values. We therefore used the activity of a single vATPase activity as ~10 000 H+/s. This value is currently not clearly known, as existing reports estimate the activity of single vATPases to be ~100 H+/s [58], or ~1170 H+/s [59]. For ATP synthase it is estimated to be 1000 H+/s [60,61].
In order to model the stress conditions, the initial values of the parameters listed in Table S2 were changed or the model equations (Supplementary Note 2) were supplemented with new functions or dependencies, which are summarized in Table 1 and will be described in the relevant sections.
2.2. Model stability
We investigated the stability of the steady-state values of the system with respect to changes in the main input parameters (Supplementary Note 3). vATPase activity, lumen potential Δψ and lysosomal radius kinetics were investigated after starting the simulation from different physiological initial pH values. They were found to stabilise at near-conventional values with discrepancies of 7, 18 and 3%, respectively (Figure S2A-C). Concentrations of potassium, sodium and chloride ions stabilised near the conventional values after changing their own initial values in the physiological range (Figure S2D-F).
We then tested the stability of [H+], pH, [K+], [Na+], [Cl-], [Ca2+], lysosomal radius and transmembrane potential Δψ to 10% changes in other key model parameters (Figure S3). The pH is exceptionally insensitive to changes in the system, confirming its performance as a model of pH homeostasis in the lysosome (Figure 1B). The concentrations of lysosomal potassium, sodium and chloride ions are stable, i.e. they change by less than 10% after any change in input parameters. Calcium concentration is sensitive to changes in initial cytosolic pH, probably due to CAX H+/Ca2+ antiporter activity. The lysosomal radius is extremely stable to all changes. The Δψ potential remains stable to all changes except the change in the initial radius of the lysosome. Although it seems paradoxical that the unstable parameter is the proton concentration in the lysosome, this is due to the fact that pH is logarithmic and the lumen solution has a buffer capacity, which is expressed in the equations (Supplementary Note 2, Equation S8).
The most influential parameters for the intralysosomal equilibrium (i.e. pHL, R, , lumen ions concentrations) are cytosolic [K+], [Cl-] (main players in the dissipation of vATPase-generated potential), initial lysosomal pH, transmembrane potential .
2.3. Model software
The model was implemented in Python, the numerical solution of the differential equations was performed using the methods of the Scipy library [62] the scipy.integrate.odeint. The absolute and relative tolerances of the solution are 1.49012e-8.
Jupyter notebooks for all single stresses and model stability checks can be found at https://github.com/Nsf03/LysoModel/ and in the Supplement.
For simplicity, the model was implemented in an executable file (Supplementary LysoModel.exe). The visualization was done using the Dash library, executable file was created using the Pyinstaller library.
The software allows the user to change the initial lysosomal pH, [K+], [Na+], [Cl-] and to watch the time response of pH, membrane potential, [K+], [Na+], [Cl-], water flux and organelle radius, vATPase activity. Such monitoring could be performed in normal or stress conditions, switched on in a short time interval from 300s to 350s: swelling (increased water influx), permeabilization, vATPase number decrease, proton efflux, described in Table 1. The condition of accumulation of cationic amphiphilic drugs CAD (proton sponge) is applied from the beginning of the simulation. Not only one stress could be applied.
The software allows the user to scale, save plots, work without internet connection and pre-installed Python environments.
A detailed description for users is available in ReadMe file on github https://github.com/Nsf03/LysoModel.
3. Results
3.1. Endosome/Lysosome maturation
In the final stage of maturation, endosomes have significant similarities to the lysosome, possessing its various ion transporters [25]. Therefore, we can use our model to simulate endosome stabilization of ion concentrations, a decrease in pH. The number of H+-vATPases was gradually increased with a concomitant decrease in the activity of Na+/K+-ATPases, with a characteristic maturation time of 1.5 h (Figure 2A) [25]. The initial pH = 5.8 [63], concentrations [Cl-] = 60 mM [63], [K+] = 40 mM, [Na+] = 50 mM [10,18].
In the process of endosomal acidification, a high initial pH activates vATPase, causing a pH drop (Figure 2B). Due to the buffering capacity of the lysosomal lumen, a pH decrease of 1 unit is only possible after an influx of about 40 mM protons (Figure 2C) (while pH shift from 5.8 to 4.7 means change in free protons concentration only from 1.6 uM to 20 uM). Membrane potential increases (Equation S7) (Figure 2B). It should be emphasised that in all plots in this paper Δψ is shown as the potential, determined by the concentrations of ions inside the lysosome, without adding of the constant value of - 50mV (Equation S6).
Increasing the membrane potential also leads to a decrease in sodium and an increase in chloride lumen concentrations (Figure 2C). Potassium concentration increases due to high cytosolic [K+].
The stabilization of ions concentrations occurs in three steps.
First, a rapid increase in ions concentrations to [Cl-] = 73 mM, [K+] = 48 mM, [Na+] = 66 mM is due to equilibration of the system. This increase in ionic concentrations causes a rapid, short-term increase in lysosome radius (Figure 2D). Although the model is stable after reaching steady state, the system may be unstable when simulations are run from different initial values. This is due to the fact that values such as potential, transporters activities and fluxes are calculated during the simulation and can change abruptly in the first steps, causing a change in the behaviour of the rest of the system. This process is a consequence of the discreteness of the modelling.
Second, as NKA efficiency decreases, sodium concentration decreases and potassium concentration increases according to their cytosolic distribution. Potassium influx is less pronounced due to the positive membrane potential. Third, as vATPase activity increases and pH decreases, chloride ions flow into lysosomal lumen (Figure 2C), decreasing rate of membrane potential increase (Figure 2B), which could explain the increase in K+ influx after 15 min of simulation (Figure 2C). As a consequence, the decrease of the net ions content in the lumen (-7mM) leads to a slight decrease of the lysosome radius (Figure 2D). The change in ions concentrations leads to a stabilization of the system (Figure 2B-D), so that the final fluxes of ions and water are zero.
Our model predicts pH stabilization at a lysosome-specific level (pH≈4.74), a 10% increase of membrane potential from late endosomes to lysosomes (Figure 2A) consistent with 50% increase from Voltair sensor assessments [51].
Steady-state Δψ of ~65mV, giving total lysosome membrane potential of ~15mV, is consistent with previous experimental measurements [51,52,64].
We also see a 3% decrease in organelle volume, which is consistent with previous estimates of a volume decrease of less than 15% [65]. Reduced membrane tension due to volume decrease could provide an opportunity for the lysosome to perform some specific functions, such as autophagic lysosome reformation [66].
Thus, we could conclude that the simulation of lysosome maturation from late endosomes occurs appropriately, as activation of vATPase acidifies the lumen, leading to an increase in transmembrane potential, ion concentrations come to near-lysosomal levels.
3.2. Lysosomal Membrane Permeabilization (LMP)
To model short-term lysosomal membrane permeabilization (LMP), we temporarily increased ion and water permeabilities by 100 times (see 10-fold increase results in Figure S4). As expected, a pH increase of ~1 unit was observed with a return to the initial steady-state level, with a concomitant reversible potential drop of 10 mV (Figure 3A). The total membrane potential is quite low during LMP (6mV, Figure 3A), consistent with the expectation of membrane rapture. Thus, our LMP modelling as a 100-fold increase in permeabilities is quite sufficient.
Potassium ions entered the lysosome due to their high concentration in the cytosol and low concentration in the lysosome, and also due to the decrease in organelle membrane potential. Sodium and chloride ions also exited by diffusion (Figure 3B).
It is also important to note that calcium exits during LMP (Figure 3B), which is in agreement with the experiment [30].
There was also a slight swelling of the lysosome (volume increase by 4%) by water influx (Figure 3C), consistent with an increase in osmotic pressure.
At the same time, vATPase was activated by ~10% in an attempt to compensate for the proton leaks (Figure 3D).
Thus, according to the model, the temporary permeabilization of the lysosomal membrane does not lead to a catastrophe. The lysosomal physiological parameters return to their original values once the ion permeabilities are restored to normal.
3.3. Short-term vATPase “knockout” or lysosome enlargement stresses
Next, we give two examples of “fast” perturbations of 50 seconds duration.
The first influence is temporal “knockout” of vATPase (complete shutdown of vATPase proton flux for 50 seconds) as a crude model of the circadian rhythms that accompany the metabolic shift from catabolism (autophagy, inhibited mTOR, active TFEB, high vATPase activity) to anabolism (proliferation, mTOR activation, suppression of TFEB, vATPase) [67,68]. During the shutdown period, the lysosomal lumen is deacidified by ΔpH=0.41, which causes a 4% decrease in the lysosomal membrane potential (Figure 4A), cations/chloride concentrations increase/decrease (Figure 4B) and no volume change (Figure 4C). After the vATPase reactivation, relaxation to the normal state takes a few minutes.
As a second example of short-term stress, we chose a simulation of lysosome swelling (Figure 4D-F), which occurs, for example, during hypotonic stress or the fusion of lysosomes with endosomes or autophagosomes. The water flow was increased for 50 seconds and then turned off. This resulted in transient increase in volume by 8% (Figure 4D) and a slight increase in pH (ΔpH=0.01) (Figure 4E). Potassium, sodium and chloride enter the lysosome, but to different extents (Figure S5). Different ions permeabilities (1.2×10⁻⁵, 9.6×10⁻⁷, 7.1×10⁻⁷ ion×cm/s for Cl-, Na+, K+, respectively) and high cytosolic [K+] lead to approximately 5-fold greater potassium, chloride than sodium uptake. However, no change in ions concentrations was observed (Figure 4F) due to, possibly, volume increase. Potential also shows no change (Figure 4E). After disturbance, the system returned to normal.
Comparison of these two cases shows that a some pH increase does not change lysosome volume. Conversely, 8% lysosome enlargement by water could not cause significant changes in pH and ions concentrations.
Thus, the model is stable to short-term stresses, such as vATPase shutdown, swelling (hypotonic stress), lysosome parameters recover to conventional values. This means that the model fulfils the requirements of a working model that adequately describes a biological system.
3.4. Calcium efflux as response to pH increase: deacidification, even without vATPase inactivation, could lead to calcium release from lysosomes
There are a number of experimental studies that have shown a relationship between the pH of lysosomes and the release of calcium from them. The presence of bafilomycin A1, a known vATPase inhibitor [69], resulted in the release of calcium into the cytosol [70]. However, bafilomycin A1 can be a potassium carrier [71] and cause the release of calcium from the mitochondria, endoplasmatic reticulum [72]. That is, the possible non-selectivity of bafilomycin may result in calcium release that is not due to vATPase blockade and the subsequent increase in lysosomal pH. More specifically, blockade of vATPase activity by misfolding of the Voa1 subunit [37] has been shown to release calcium from lysosomes via TRPML1. However, it remains unclear whether inhibition of vATPase or an increase in pH leads to calcium release.
The model reproduced initial conditions such as vATPase inhibition or direct additional proton efflux and tested for calcium release from lysosomes. vATPase inhibition was implemented by reducing the number of active vATPase from 6 to 1 (6-fold decrease) (Figure 5). Such vATPase quantities are shown for lysosomes in peri-niuclear and peripheral cellular locations, respectively [56]. After changing the number of vATPases, the system reached a steady state.
Deacidification without vATPase inhibition was reproduced by introducing an additional constant term reflecting the efflux of hydrogen ions from the lysosomal lumen (Figure 6). We were particularly interested in this case because of the existence of the lysosome-targeted NsXeR proton pump, which is able to specifically deacidify the organelle, just by illumination [35,36]. Thus, the in silico study design is suitable to describe the consequences of a possible optogenetic lysosome pH increase by NsXeR.
Both simulations yielded very similar results (Figure 5A, Figure 6A). Deacidification of the lumen and decrease in potential (Figure 5B, Figure 6B) resulted in inhibition of the calcium channel CAX, which pumps calcium into lysosomes. Under normal conditions, its activity was 2200 ions/sec, whereas with vATPase inhibition and direct proton efflux it was 898 ions/sec and 895 ions/sec, respectively (Figure 5C, Figure 6C). Calcium concentration decreased ~2-fold in both cases as a result of CAX blockade (Figure 5D, Figure 6D).
Although the modelling results are consistent with the data on calcium release from the lysosomal lumen into the cytosol, we did not observe hyperactivation of the TRPLM1 ion channel in the model, but a significant change in calcium pumping was observed for CAX.
In conclusion, an increase in pH, even without vATPase inhibition, can lead to calcium release from lysosomes.
3.5. Cationic amphiphilic drugs (CAD) as a model for lysosomal storage disease (LSD) and hypotonic stress
Protein aggregates, the cause of proteinopathies [73], accumulated in the compromised lysosome, could increase its pH by acting as a weakly basic, “proton sponge”-like cationic amphiphilic drug (CAD). According to the “proton sponge” hypothesis [74] and the mechanism of accumulation of CAD [75,76], the entry of substances with a sufficiently high pKa into the lysosomal lumen causes free H+ ions to bind to the protonophilic groups of “proton sponges” (weakly basic, ionisable amine functional groups), making them unable to escape the lysosome.
As a result, in the first stage, the lysosomal pH rises while the potential is maintained (positive and negative charges in balance). In the second stage, vATPase is hyperactivated and the pH decreases. The excess of positive charge, due to the presence of both protons and protonated “proton sponges” (SpH), and the increase in potential cause an influx of counterions, mainly, as it is widely accepted, Cl- ions. As a result, the total concentration of ions in the lysosome increases, and the osmotic equilibrium of the lysosome-cytosol is disturbed. As a result, in the third stage, water enters the lysosomal lumen to compensate for the excess ions, causing swelling and possibly rupture of the lysosome. Previously, mathematical modelling of a “proton sponge” was described [77] with results consistent with the three stages described above.
Despite the existence of such a clear theory for lysosomes, the presence of a similar swelling of mitochondria [78], there are doubts about the action of weakly basic lysosomotropic drugs as “proton sponges” [79]. For example, for polyethylenimine (PEI), a well-known transfection reagent, whose mechanism of action is thought to be based on a “proton sponge” effect, has not been observed in recent experimental work [80], contrary to [81].
In the model, the addition of H+ ions to “proton sponges” was designed as a reversible second-order reaction, the rate of which is determined by the concentrations of unprotonated “proton sponges” (Sp), protonated “proton sponges” (HSp) and lysosomal pH:
where and are “sponge” protonation and deprotonation rates, respectively; and are reaction rate constants, [Sp], [HSp] are concentrations of unprotonated proton and protonated “proton sponges”, respectively.
The reaction rate constants and initial concentrations of “proton sponges” are chosen to visualize the model operation and can be optimized based on experimental data (according to the characteristics of specific substances). Our assumption of rate constants values for the protonation reaction (Table S2) gives an equilibrium [Sp]:[HSp] ≈ 40:60 (Figure 7B). This corresponds to a pKa = 7.17, which is consistent with a weakly basic, somehow effective CAD (for chloroquine [82]).
In the model, the function describing the water flux is
where is the water permeability, is the lysosomal concentration of the selected ion, is the osmotic coefficient, and is the osmolar parameter, adjusted in such a way that the model is launched from the initial osmotic equilibrium. The function was written based on a previously published model [14], with an additional ion HSp, a protonated “sponge”.
As a result of this stress, the lysosomal membrane is stretched, leading to swelling and, in the extreme cases, membrane rupture and destruction of the lysosome [27] (Figure 7A).
Entrance of “proton sponges” and their protonation (Figure 7B), leads to lumen deacidification (Figure 7C). Re-acidification via hyperactivation of vATPase is unable to return the lumen pH to the equilibrium value of 4.7 with the chosen model parameters. The pH remains higher, equal to 4.8, and the potential is also slightly higher than in the absence of “proton sponges” (Figure 7C). There is a 40% increase in volume due to the entry of water (Figure 7D).
However, it should be emphasized that the lysosome radius, volume can be increased without changing the surface area, if we assume that the membrane was not initially stretched like a sphere, i.e. in the case of reduced membrane tension. The modelling results are consistent with the idea that “proton sponges” or CAD, such as chloroquine, are somehow a disrupt of lysosome function [53,83,84,85].
As a result, the dynamics of the process obtained on the basis of the model were in agreement with previous simulations [77], with the exception that the third stage, osmotic swelling, does not follow the first two stages, but runs parallel to them.
The simulation showed that, when the lysosome is filled with a weakly basic, “proton sponge”-like cationic amphiphilic drug (CAD), acting as proton acceptor, the lysosomal lumen is partially deacidifies and the lysosome enlarges. The CAD-induced increase in osmotic pressure is a model prediction in full agreement with experimental data [86].
3.6. Lysosome under mixed stress conditions
It is necessary to consider the state of the lysosome under not single, but multiple synchronous stress conditions, as they occur in real life. At the level of the human body, multimorbidity is a common scenario for the ageing person [87]. At the cellular level, different stresses could occur in real life, e.g. under drugs treatment. Doxorubicin therapy has several molecular consequences [88] (drug-induced ROS production, acting on TRPML1 [26], doxorubicin accumulation in the lysosome as a “proton sponge” [89], etc.).
To address this need, we have implemented the possibility of applying several stresses, observed in this work, simultaneously. This awkward situation may be generated under different initial ions concentrations.
3.6.1. “Proton sponge” followed by decrease in the number of vATPase
In the real lysosome, vATPase inhibition could occur simultaneously with “proton sponges” storage, e.g. when protein aggregates accumulate and temporary ATP depletion occurs.
Under double stress, i.e. implementation of transient vATPase number decrease in the presence of “proton sponge”, we observed much lower pH increase (0.25 pH units vs. 0.45 on Figure 8C and A top panels, respectively) due to pre-deacidification by means of “proton sponge” on one hand (4.87 vs 4.74 pH units), and pre-trained single vATPase, having 2% more activity in the “proton sponge” case (Figure 8C and A bottom panels, respectively). Thus, a «hermetic»-like effect takes place [90].
3.6.2. Proton efflux with vATPase inhibition
There are many studies measuring vATPase activity as the rate of lysosome re-acidification after its transient deacidification (e.g. [18,29,36,91]).
Proton efflux applied as a single stress (Figure 9A) causes a pH increase of 0.26 pH units. Coupled with a decrease in vATPases number (Figure 9B), it leads to a much higher deacidification (0.77 pH units) and, after removal of both stresses, the relaxation rate to pH=4.7 is k≈0.011 pH/s (94 seconds for pH e-fold decrease (in 2.73 times)). For proton efflux without vATPase inhibition, re-acidification is faster with a rate constant k≈0.014 pH/s (71 seconds for pH e-fold decrease). Thus, even transient vATPase inhibition has an effect in slowing the rate of re-acidification.
Thus, the model provides the possibility to have the lysosome under mixed stress conditions. First, application of vATPases number decrease under accumulated CAD stress produces not so high pH increase due to pre-trained, increased activity of each vATPase. Second, proton efflux under reduced vATPase number produces higher deacidification with longer relaxation to stable pH.
4. Discussion
The experimental basis for studying lysosomal ionic balance has expanded in recent decades. Quantitative measurements of both lysosomal pH and the membrane potential, so necessary for the construction of model of lysosomal pH regulation [14], became possible even in situ as a result of the development of Voltair [51], FRET dyes [52] or VSFP sensors [92] on membrane potential, as a complement to the various fluorescent pH sensors (such as pHluorin, mKeima and their derivatives and analogues [93,94]).
Models describing the role of cytosolic pH have been shown to be effective in predicting the response of cancer cell, i.e. changes in its basic vital parameters to changes in ionic balance [95]. For lysosomes, the model has already been applied to pathological ClC7 function [44].
The aim of this work was to investigate the mechanisms of stress resistance of lysosomal homeostasis. The lysosome acts as a spy that knows of extracellular and intracellular conditions and is able to inform the cell for adaptation and stress response [33]. Therefore, it is essential for the modelling of lysosome function to have an organelle that is open to external influences.
We have shown that the model presented here correctly describes the dynamics of ions concentrations, lysosome membrane potential, organelle volume, water flux, activities of ion transporters in numerical simulation of change of initial values, increase/decrease in vATPases number, increase in ion permeabilities, change in water or proton fluxes.
A comparison of current and previous models of lysosomal ion homeostasis shows their advantages and disadvantages in simulating of biological system (Table S1). Our model yields near-lysosomal rather than cytosolic ions concentrations in the lysosome. It is not as dependent on the number of H+/Cl- exchange transporter ClC7 as the original model [14]. The model is stable to variations of cytosolic pH. The most influential parameters for intralysosomal equilibrium (i.e. for pHL, R, , ions concentrations) are cytosolic [K+], [Cl-], initial lysosomal pH, number of vATPases and sodium-potassium exchangers, transmembrane potential.
The complexity of considering of the lysosome-external influences open system allows one to approach the physiological situation and increase the reliability of the model predictions. Stress applications in the current model show following results.
First, the in silico maturation of lysosomes from endosomes is adequate, as the activation of vATPase acidifies the lumen, leading to an increase in the transmembrane potential, and ion concentrations are brought to near-lysosomal levels with the help of Na+/K+-ATPase.
Second, according to the modelling, a temporal, reversible lysosomal membrane permeabilization (LMP) is sustainably tolerated by the lysosome. It turns out that it is important for the lysosome to retain all of its membrane proteins, even when the lumenal content contains ion at near-cytosolic concentrations. This means that de novo formation of the lysosome, its repair after LMP is possible in the model and in real life.
Third, the model was shown to be stable to short-term stresses, such as temporary vATPase “knockout” and lysosome swelling by additional water influx (hypotonic stress simulation). Lysosome parameters recover to convenient values. A short deacidification did not cause swelling, nor did a short water influx cause a pH increase. This means that the model stable and fulfils the requirements of a working model that adequately describes a biological system.
Fourth, the model shows that calcium release from the lysosome is possible as result of its deacidification via additional proton efflux even without inhibition of vATPase. Thus, optogenetic deacidification via lyso-NsXeR [36] could lead to calcium stress signaling.
Notebly, calcium efflux was demonstrated in all cases of lysosomal deacidification: LMP modelling (Figure 3), vATPase inhibition (Figure 5), addition of proton efflux (Figure 6). Thus, according to our model, at least one of the functions of lysosomal calcium could be attributed to the stress signal of organelle deacidification, as previously shown experimentally [30,37,38].
Fifth, simulation of lysosome adaptation to accumulation of weakly basic, “proton sponge”-like cationic amphiphilic drug (CAD) in the lumen showed partial deacidification and enlargement, in agreement with experiment [54]. However, the increase in lysosome radius in the model was only 40%, which is much less than in experiments with chloroquine (R from ~1um in norm to ~5um with CAD) [86]. To suit with experiment, infinite accumulation of CAD should be implemented. Biological reasons should also be taken into account [89], i.e. those caused by an increase in the number of lysosomes and their fusion.
Sixth, the modelling of mixed stress conditions gave an advanced view on stress applications. Application of vATPase inhibition under accumulated weakly basic, “proton sponge”-like cationic amphiphilic drug (CAD) produces not so high pH increase (Figure 8) due to pre-trained, increased each vATPase activity. In addition, proton efflux at reduced vATPases quantity produces higher deacidification with longer relaxation to a stable pH.
In general, lysosomal stability lies in the redundancy, the existence of several different pH maintenance mechanisms. Cations and anions help to maintain lysosomal acidification, while calcium efflux signals the insufficiency of the lysosomal safety margin and triggers the cellular stress response.
By taking lysosomal dysfunction into account, we will be able to understand the cause of disease and ageing, allowing us to scale up the model results for translation into experiments and medical applications. Targeting the lysosomal pH has multiple consequences and broad applications in diseases treatment, anti-aging interventions [2]. By analogy with polypharmacology [96], an organelle-centered approach could have a much greater impact than selective but sole action on specific protein targets.
The question of how the lysosome responds to hyperacidification, i.e. an increase in the transmembrane potential, is also worthy of further investigation. This can be done optogenetically using the proton pump rhodopsin Arch3 [97]. Hyperacidification and hyperpolarization under ATP deficient conditions could potentially force vATPase to synthesise ATP, as observed in Thermus thermophiles [98]. This is in principle possible due to the structural similarity of vATPase to ATP synthase [99]. Arch3 rhodopsin in lysosomes сould also be a model for the organelle hyperacidification of cancer cells shown in some cases [53,100,101].
More generally, optogenetics could now be used to alter pH in the cytosol [102,103] and cellular compartments, providing new data to prove mechanisms of pH maintenance in the cell. Reconstitution of new rhodopsins [39,104,105] into cellular membranes may help with lysosomal counterion/counterflux and other dilemmas.
Supplementary Materials
The following supporting information can be downloaded at the website of this paper posted on Preprints.org.
Author Contributions
SFN and VA contributed equally. SFN performed all coding, computational experiments, data analysis, images creation and figures design. VA offered optogenetics-like experiments, lysosomal perturbations. VP made interface for the model visualization. SVN did comparison of lysosome and mitochondria. FT provided interpretations for patch clamp experiments from the literature. AB did editing on osmosis and proton sponge chapters. AM consulted on Hodgkin–Huxley model. PB reviewed literature data and edited interpretation. VG did project conceptualisation. NI performed study design, data analysis, manuscript preparation, pictures assembly, and literature data analysis. All the authors have read and approved to the published version of the manuscript.
Data availability
LysoModel files are available at Supplementary materials and via https://github.com/Nsf03/LysoModel
Acknowledgments
Study was supported by Russian Science Foundation (RSF) Project 24-24-00504, https://rscf.ru/en/project/24-24-00504/.
Declaration of competing interest
The authors declare that they have no known competing financial interests or personal relationships that could have appeared to influence the work reported in this paper.
Abbreviations
LMP: lysosomal membrane permeabilization; LSD: lysosomal storage diseases; vATPase: H+-vacuolar type ATPase; ATP: adenosine triphosphate; CAX: H+/Ca2+ exchanger; TRPML1: Transient receptor potential mucolipin 1; ClC7: chloride channel 7, H+/Cl- exchange transporter 7; TPC1: two-pore channel, transporting mainly sodium; TMEM175: endosomal/lysosomal proton channel, transporting mainly potassium; VSFP: voltage sensitive fluorescent proteins; CAD: cationic amphiphilic drug; NKA: Na+/K+-ATPase, sodium/potassium-transporting ATPase; NHE: Na+ or K+/H+ exchangers; Sp: “proton sponges”; SpH: protonated “proton sponges”; FRET: Förster resonance energy transfer.
References
- R.M. Perera, R. Zoncu, The Lysosome as a Regulatory Hub, Annu. Rev. Cell Dev. Biol. 32 (2016) 223–253. [CrossRef]
- S.R. Bonam, F. Wang, S. Muller, Lysosomes as a therapeutic target, Nat. Rev. Drug Discov. 2019 1812 18 (2019) 923–948. [CrossRef]
- D. Carmona-Gutierrez, A.L. Hughes, F. Madeo, C. Ruckenstuhl, The crucial impact of lysosomes in aging and longevity, Ageing Res. Rev. 32 (2016) 2–12. [CrossRef]
- T. Wyss-Coray, Ageing, neurodegeneration and brain rejuvenation, Nature 539 (2016) 180–186. [CrossRef]
- J.H. Lee, D.S. Yang, C.N. Goulbourne, E. Im, P. Stavrides, A. Pensalfini, H. Chan, C. Bouchet-Marquis, C. Bleiwas, M.J. Berg, C. Huo, J. Peddy, M. Pawlik, E. Levy, M. Rao, M. Staufenbiel, R.A. Nixon, Faulty autolysosome acidification in Alzheimer’s disease mouse models induces autophagic build-up of Aβ in neurons, yielding senile plaques, Nat. Neurosci. 25 (2022) 688–701. [CrossRef]
- X. Yan, Protein mishandling and impaired lysosomal proteolysis generated through calcium dysregulation in Alzheimer’s disease, Proc. Natl. Acad. Sci. (2017) 2017. [CrossRef]
- U. Ozcan, Q. Cao, E. Yilmaz, A.-H. Lee, N.N. Iwakoshi, E. Ozdelen, G. Tuncman, C. Gorgun, L.H. Glimcher, G.S. Hotamisligil, Endoplasmic reticulum stress links obesity, insulin action, and type 2 diabetes, Science (80-. ). 306 (2004) 457–461. [CrossRef]
- D.J. Sillence, Glucosylceramide modulates endolysosomal pH in Gaucher disease, Mol. Genet. Metab. 109 (2013) 194–200. [CrossRef]
- E. Riederer, C. Cang, D. Ren, Lysosomal Ion Channels: What Are They Good For and Are They Druggable Targets?, Annu. Rev. Pharmacol. Toxicol. 63 (2023) 19–41. [CrossRef]
- C.C. Scott, J. Gruenberg, Ion flux and the function of endosomes and lysosomes: PH is just the start: The flux of ions across endosomal membranes influences endosome function not only through regulation of the luminal pH, BioEssays 33 (2011) 103–110. [CrossRef]
- S. Weinert, S. Jabs, C. Supanchart, M. Schweizer, N. Gimber, M. Richter, J. Rademann, T. Stauber, U. Kornak, T.J. Jentsch, Lysosomal pathology and osteopetrosis upon loss of H+-driven lysosomal Cl- accumulation, Science (80-. ). 328 (2010) 1401–1403. [CrossRef]
- T.J.J. Gaia Novarino, Stefanie Weinert, Gesa Rickheit, Endosomal Chloride-Proton Exchange Rather Than Chloride Conductance Is Crucial for Renal Endocytosis, (2010) 1398–1401. [CrossRef]
- A.R. Graves, P.K. Curran, C.L. Smith, J.A. Mindell, The Cl-/H+ antiporter ClC-7 is the primary chloride permeation pathway in lysosomes, Nature 453 (2008) 788–792. [CrossRef]
- Y. Ishida, S. Nayak, J.A. Mindell, M. Grabe, A model of lysosomal pH regulation, J. Gen. Physiol. 141 (2013) 705–720. [CrossRef]
- C. Cang, B. Bekele, D. Ren, The voltage-gated sodium channel TPC1 confers endolysosomal excitability, Nat. Chem. Biol. 10 (2014) 463–469. [CrossRef]
- R. Fuchs, S. Schmid, I. Mellman, A possible role for Na+,K+-ATPase in regulating ATP-dependent endosome acidification, Proc. Natl. Acad. Sci. U. S. A. 86 (1989) 539–543. [CrossRef]
- E. Kosmidis, C.G. Shuttle, J. Preobraschenski, M. Ganzella, P.J. Johnson, S. Veshaguri, J. Holmkvist, M.P. Møller, O. Marantos, F. Marcoline, M. Grabe, J.L. Pedersen, R. Jahn, D. Stamou, Regulation of the mammalian-brain V-ATPase through ultraslow mode-switching, Nature 611 (2022) 827–834. [CrossRef]
- B.E. Steinberg, K.K. Huynh, A. Brodovitch, S. Jabs, T. Stauber, T.J. Jentsch, S. Grinstein, A cation counterflux supports lysosomal acidification, J. Cell Biol. 189 (2010) 1171–1186. [CrossRef]
- C. Cang, K. Aranda, Y. Seo, B. Gasnier, C. Cang, K. Aranda, Y. Seo, B. Gasnier, D. Ren, TMEM175 Is an Organelle K + Channel Regulating Lysosomal Function, Cell 162 (2015) 1101–1112. [CrossRef]
- C. Cang, Y. Zhou, B. Navarro, Y.J. Seo, K. Aranda, L. Shi, S. Battaglia-Hsu, I. Nissim, D.E. Clapham, D. Ren, mTOR regulates lysosomal ATP-sensitive two-pore Na+ channels to adapt to metabolic state, Cell 152 (2013) 778–790. [CrossRef]
- B.E. Steinberg, N. Touret, M. Vargas-Caballero, S. Grinstein, In situ measurement of the electrical potential across the phagosomal membrane using FRET and its contribution to the proton-motive force, Proc. Natl. Acad. Sci. U. S. A. 104 (2007) 9523–9528. [CrossRef]
- J. Xiong, M.X. Zhu, Regulation of lysosomal ion homeostasis by channels and transporters, Sci. China Life Sci. 59 (2016) 777–791. [CrossRef]
- A. Ballabio, J.S. Bonifacino, Lysosomes as dynamic regulators of cell and organismal homeostasis, Nat. Rev. Mol. Cell Biol. 21 (2020) 101–118. [CrossRef]
- R.E. Lawrence, R. Zoncu, The lysosome as a cellular centre for signalling, metabolism and quality control, Nat. Cell Biol. 21 (2019) 133–142. [CrossRef]
- J. Huotari, A. Helenius, Endosome maturation, EMBO J. 30 (2011) 3481–3500. [CrossRef]
- X. Zhang, X. Cheng, L. Yu, J. Yang, R. Calvo, S. Patnaik, X. Hu, Q. Gao, M. Yang, M. Lawas, M. Delling, J. Marugan, M. Ferrer, H. Xu, MCOLN1 is a ROS sensor in lysosomes that regulates autophagy, Nat. Commun. 7 (2016). [CrossRef]
- M. Hu, N. Zhou, W. Cai, H. Xu, Lysosomal solute and water transport, J. Cell Biol. 221 (2022) 1–14. [CrossRef]
- Z.E. Walton, C.H. Patel, R.C. Brooks, Y. Yu, A. Ibrahim-Hashim, M. Riddle, A. Porcu, T. Jiang, B.L. Ecker, F. Tameire, C. Koumenis, A.T. Weeraratna, D.K. Welsh, R. Gillies, J.C. Alwine, L. Zhang, J.D. Powell, C. V. Dang, Acid Suspends the Circadian Clock in Hypoxia through Inhibition of mTOR, Cell 174 (2018) 72-87.e32. [CrossRef]
- Z. Zi, Z. Zhang, Q. Feng, C. Kim, X.D. Wang, P.E. Scherer, J. Gao, B. Levine, Y. Yu, Quantitative phosphoproteomic analyses identify STK11IP as a lysosome-specific substrate of mTORC1 that regulates lysosomal acidification, Nat. Commun. 13 (2022) 1–12. [CrossRef]
- M.L. Skowyra, P.H. Schlesinger, T. V. Naismith, P.I. Hanson, Triggered recruitment of ESCRT machinery promotes endolysosomal repair, Science (80-. ). 360 (2018). [CrossRef]
- N.S. Ilyinsky, S. V. Nesterov, E.I. Shestoperova, A. V. Fonin, V.N. Uversky, V.I. Gordeliy, On the Role of Normal Aging Processes in the Onset and Pathogenesis of Diseases Associated with the Abnormal Accumulation of Protein Aggregates, Biochem. 86 (2021) 275–289. [CrossRef]
- R.L. Kendall, A. Holian, The role of lysosomal ion channels in lysosome dysfunction, Inhal. Toxicol. 33 (2021) 41–54. [CrossRef]
- P. Saftig, R. Puertollano, How Lysosomes Sense, Integrate, and Cope with Stress, Trends Biochem. Sci. 46 (2021) 97–112. [CrossRef]
- A.D. Vlasova, S.M. Bukhalovich, D.F. Bagaeva, A.P. Polyakova, N.S. Ilyinsky, S. V. Nesterov, F.M. Tsybrov, A.O. Bogorodskiy, E. V. Zinovev, A.E. Mikhailov, A. V Vlasov, A.I. Kuklin, V.I. Borshchevskiy, E. Bamberg, V.N. Uversky, V.I. Gordeliy, Intracellular microbial rhodopsin-based optogenetics to control metabolism and cell signaling, Chem. Soc. Rev. (2024). [CrossRef]
- V. Shevchenko, T. Mager, K. Kovalev, V. Polovinkin, A. Alekseev, J. Juettner, I. Chizhov, C. Bamann, C. Vavourakis, R. Ghai, I. Gushchin, V. Borshchevskiy, A. Rogachev, I. Melnikov, A. Popov, T. Balandin, F. Rodriguez-Valera, D.J. Manstein, G. Bueldt, E. Bamberg, V. Gordeliy, Inward H+ pump xenorhodopsin: Mechanism and alternative optogenetic approach, Sci. Adv. 3 (2017) 1–11. [CrossRef]
- N.S. Ilyinsky, S.M. Bukhalovich, D.F. Bagaeva, S. V. Nesterov, A.A. Alekseev, F.M. Tsybrov, A.O. Bogorodskiy, V.A. Alekhin, S.F. Nazarova, O. V. Moiseeva, A.D. Vlasova, K. V. Kovalev, A.E. Mikhailov, A. V. Rogachev, E. Bamberg, V.I. Borshchevskiy, V.I. Gordeliy, Optogenetic control of lysosome function, BioRxiv (2023) 2023.08.02.551716. [CrossRef]
- J.H. Lee, M.K. McBrayer, D.M. Wolfe, L.J. Haslett, A. Kumar, Y. Sato, P.P.Y. Lie, P. Mohan, E.E. Coffey, U. Kompella, C.H. Mitchell, E. Lloyd-Evans, R.A. Nixon, Presenilin 1 Maintains Lysosomal Ca2+ Homeostasis via TRPML1 by Regulating vATPase-Mediated Lysosome Acidification, Cell Rep. 12 (2015) 1430–1444. [CrossRef]
- K.A. Christensen, J.T. Myers, J.A. Swanson, pH-dependent regulation of lysosomal calcium in macrophages, J. Cell Sci. 115 (2002) 599–607. [CrossRef]
- N. Maliar, K. Kovalev, C. Baeken, T. Balandin, R. Astashkin, M. Rulev, A. Alekseev, N. Ilyinsky, A. Rogachev, V. Chupin, D. Dolgikh, M. Kirpichnikov, V. Gordeliy, Crystal structure of the N112A mutant of the light-driven sodium pump KR2, Crystals 10 (2020) 1–15. [CrossRef]
- E.G. Govorunova, Y. Gou, O.A. Sineshchekov, H. Li, X. Lu, Y. Wang, L.S. Brown, F. St-Pierre, M. Xue, J.L. Spudich, Kalium channelrhodopsins are natural light-gated potassium channels that mediate optogenetic inhibition, Nat. Neurosci. 25 (2022) 967–974. [CrossRef]
- R. Astashkin, K. Kovalev, S. Bukhdruker, S. Vaganova, A. Kuzmin, A. Alekseev, T. Balandin, D. Zabelskii, I. Gushchin, A. Royant, D. Volkov, G. Bourenkov, E. Koonin, M. Engelhard, E. Bamberg, V. Gordeliy, Structural insights into light-driven anion pumping in cyanobacteria, Nat. Commun. 13 (2022) 1–13. [CrossRef]
- V. Gradinaru, K.R. Thompson, K. Deisseroth, eNpHR: a Natronomonas halorhodopsin enhanced for optogenetic applications, Brain Cell Biol. 36 (2008) 129–139. [CrossRef]
- M. Grabe, G. Oster, Regulation of organelle acidity, J. Gen. Physiol. 117 (2001) 329–343. [CrossRef]
- R. Astaburuaga, O.D.Q. Haro, T. Stauber, A. Relógio, A mathematical model of lysosomal ion homeostasis points to differential effects of Cl− transport in Ca2+ dynamics, Cells 8 (2019). [CrossRef]
- B. Hille, Ionic channels of excitable membranes, 2nd ed., Sinauer Associates, Inc., Sunderland, MA, 1992. [CrossRef]
- J. Zhao, S. Benlekbir, J.L. Rubinstein, Electron cryomicroscopy observation of rotational states in a eukaryotic V-ATPase, Nature 521 (2015) 241–245. [CrossRef]
- Y. Guo, Y. Zhang, R. Yan, B. Huang, F. Ye, L. Wu, X. Chi, Y. shi, Q. Zhou, Cryo-EM structures of recombinant human sodium-potassium pump determined in three different states, Nat. Commun. 13 (2022) 1–9. [CrossRef]
- T. Nishizawa, S. Kita, A.D. Maturana, N. Furuya, K. Hirata, G. Kasuya, S. Ogasawara, N. Dohmae, T. Iwamoto, R. Ishitani, Structural basis for the counter-transport mechanism of a H+/Ca2+ exchanger, Science (80-. ). 341 (2013) 168–172.
- M. Hirschi, M.A. Herzik Jr, J. Wie, Y. Suo, W.F. Borschel, D. Ren, G.C. Lander, S.-Y. Lee, Cryo-electron microscopy structure of the lysosomal calcium-permeable channel TRPML3, Nature 550 (2017) 411–414.
- M. Schrecker, J. Korobenko, R.K. Hite, Cryo-EM structure of the lysosomal chloride-proton exchanger CLC-7 in complex with OSTM1, Elife 9 (2020) e59555.
- A. Saminathan, J. Devany, A.T. Veetil, B. Suresh, K.S. Pillai, M. Schwake, Y. Krishnan, A DNA-based voltmeter for organelles, Nat. Nanotechnol. 16 (2021) 96–103. [CrossRef]
- M. Koivusalo, B.E. Steinberg, D. Mason, S. Grinstein, In situ measurement of the electrical potential across the lysosomal membrane using FRET, Traffic 12 (2011) 972–982. [CrossRef]
- F. Lucien, P.P. Pelletier, R.R. Lavoie, J.M. Lacroix, S. Roy, J.L. Parent, D. Arsenault, K. Harper, C.M. Dubois, Hypoxia-induced mobilization of NHE6 to the plasma membrane triggers endosome hyperacidification and chemoresistance, Nat. Commun. 8 (2017). [CrossRef]
- C.C. Cain, D.M. Sipe, R.F. Murphy, Regulation of endocytic pH by the Na+,K+-ATPase in living cells, Proc. Natl. Acad. Sci. U. S. A. 86 (1989) 544–548. [CrossRef]
- Y. Lin-Moshier, M. V. Keebler, R. Hooper, M.J. Boulware, X. Liu, D. Churamani, M.E. Abood, T.F. Walseth, E. Brailoiu, S. Patel, J.S. Marchant, The Two-pore channel (TPC) interactome unmasks isoform-specific roles for TPCs in endolysosomal morphology and cell pigmentation, Proc. Natl. Acad. Sci. U. S. A. 111 (2014) 13087–13092. [CrossRef]
- M.E. Maxson, Y.M. Abbas, J.Z. Wu, J.D. Plumb, S. Grinstein, J.L. Rubinstein, Detection and quantification of the vacuolar H+ATPase using the Legionella effector protein SidK, J. Cell Biol. 221 (2022). [CrossRef]
- S. Takamori, M. Holt, K. Stenius, E.A. Lemke, M. Grønborg, D. Riedel, H. Urlaub, S. Schenck, B. Brügger, P. Ringler, S.A. Müller, B. Rammner, F. Gräter, J.S. Hub, B.L. De Groot, G. Mieskes, Y. Moriyama, J. Klingauf, H. Grubmüller, J. Heuser, F. Wieland, R. Jahn, Molecular Anatomy of a Trafficking Organelle, Cell 127 (2006) 831–846. [CrossRef]
- M. Grabe, H. Wang, G. Oster, The mechanochemistry of V-ATPase proton pumps, Biophys. J. 78 (2000) 2798–2813. [CrossRef]
- T. Iida, Y. Minagawa, H. Ueno, F. Kawai, T. Murata, R. Iino, Single-molecule analysis reveals rotational substeps and chemo-mechanical coupling scheme of Enterococcus hirae V1-ATPase, J. Biol. Chem. 294 (2019) 17017–17030. [CrossRef]
- B.A. Feniouk, M.A. Kozlova, D.A. Knorre, D.A. Cherepanov, A.Y. Mulkidjanian, W. Junge, The proton-driven rotor of ATP synthase: Ohmic conductance (10 fS), and absence of voltage gating, Biophys. J. 86 (2004) 4094–4109. [CrossRef]
- W. Junge, N. Nelson, ATP synthase, Annu. Rev. Biochem. 84 (2015) 631–657. [CrossRef]
- P. Virtanen, R. Gommers, T.E. Oliphant, M. Haberland, T. Reddy, D. Cournapeau, E. Burovski, P. Peterson, W. Weckesser, J. Bright, SciPy 1.0: fundamental algorithms for scientific computing in Python, Nat. Methods 17 (2020) 261–272.
- V. Faundez, H.C. Hartzell, Intracellular chloride channels: determinants of function in the endosomal pathway., Sci. STKE 2004 (2004) 1–8. [CrossRef]
- P. Li, M. Gu, H. Xu, Lysosomal Ion Channels as Decoders of Cellular Signals, Trends Biochem. Sci. 44 (2019) 110–124. [CrossRef]
- L.B. Shi, K. Fushimi, H.R. Bae, A.S. Verkman, Heterogeneity in ATP-dependent acidification in endocytic vesicles from kidney proximal tubule. Measurement of pH in individual endocytic vesicles in a cell-free system, Biophys. J. 59 (1991) 1208–1217. [CrossRef]
- L. Yu, C.K. McPhee, L. Zheng, G.A. Mardones, Y. Rong, J. Peng, N. Mi, Y. Zhao, Z. Liu, F. Wan, D.W. Hailey, V. Oorschot, J. Klumperman, E.H. Baehrecke, M.J. Lenardo, Termination of autophagy and reformation of lysosomes regulated by mTOR, Nature 465 (2010) 942–946. [CrossRef]
- C. López-Otín, M.A. Blasco, L. Partridge, M. Serrano, G. Kroemer, Hallmarks of aging: An expanding universe., Cell (2022). [CrossRef]
- V.D. Manyilov, N.S. Ilyinsky, S. V. Nesterov, B.M.G.A. Saqr, G.W. Dayhoff, E. V. Zinovev, S.S. Matrenok, A. V. Fonin, I.M. Kuznetsova, K.K. Turoverov, V. Ivanovich, V.N. Uversky, Chaotic aging: intrinsically disordered proteins in aging-related processes, 2023. [CrossRef]
- T. Yoshimori, A. Yamamoto, Y. Moriyama, M. Futai, Y. Tashiro, Bafilomycin A1, a specific inhibitor of vacuolar-type H+-ATPase, inhibits acidification and protein degradation in lysosomes of cultured cells, J. Biol. Chem. 266 (1991) 17707–17712. [CrossRef]
- A.J. Morgan, L.C. Davis, A. Galione, Imaging approaches to measuring lysosomal calcium, Elsevier Ltd, 2015. [CrossRef]
- V. V. Teplova, A.A. Tonshin, P.A. Grigoriev, N.E.L. Saris, M.S. Salkinoja-Salonen, Bafilomycin A1 is a potassium ionophore that impairs mitochondrial functions, J. Bioenerg. Biomembr. 39 (2007) 321–329. [CrossRef]
- A. V. Zhdanov, R.I. Dmitriev, D.B. Papkovsky, Bafilomycin A1 activates respiration of neuronal cells via uncoupling associated with flickering depolarization of mitochondria, Cell. Mol. Life Sci. 68 (2011) 903–917. [CrossRef]
- S. Kaushik, A.M. Cuervo, Proteostasis and aging, Nat. Med. 21 (2015) 1406–1415. [CrossRef]
- D.W. Pack, A.S. Hoffman, S. Pun, P.S. Stayton, Design and development of polymers for gene delivery, Nat. Rev. Drug Discov. 4 (2005) 581–593.
- M. Cao, X. Luo, K. Wu, X. He, Targeting lysosomes in human disease: from basic research to clinical applications, Signal Transduct. Target. Ther. 6 (2021). [CrossRef]
- F. Marceau, M.T. Bawolak, R. Lodge, J. Bouthillier, A. Gagné-Henley, R. C.-Gaudreault, G. Morissette, Cation trapping by cellular acidic compartments: Beyond the concept of lysosomotropic drugs, Toxicol. Appl. Pharmacol. 259 (2012) 1–12. [CrossRef]
- E.C. Freeman, L.M. Weiland, W.S. Meng, Modeling the proton sponge hypothesis: examining proton sponge effectiveness for enhancing intracellular gene delivery through multiscale modeling, J. Biomater. Sci. Polym. Ed. 24 (2013) 398–416.
- A. Kaasik, D. Safiulina, A. Zharkovsky, V. Veksler, Regulation of mitochondrial matrix volume, Am. J. Physiol. Physiol. 292 (2007) C157–C163.
- L.M.P. Vermeulen, S.C. De Smedt, K. Remaut, K. Braeckmans, The proton sponge hypothesis: Fable or fact?, Eur. J. Pharm. Biopharm. 129 (2018) 184–190.
- J.J. Rennick, C.J. Nowell, C.W. Pouton, A.P.R. Johnston, Resolving subcellular pH with a quantitative fluorescent lifetime biosensor, Nat. Commun. 13 (2022). [CrossRef]
- M. Wojnilowicz, A. Glab, A. Bertucci, F. Caruso, F. Cavalieri, Super-resolution Imaging of Proton Sponge-Triggered Rupture of Endosomes and Cytosolic Release of Small Interfering RNA, ACS Nano 13 (2019) 187–202. [CrossRef]
- A.A. Al-Bari, Chloroquine analogues in drug discovery: New directions of uses, mechanisms of actions and toxic manifestations from malaria to multifarious diseases, J. Antimicrob. Chemother. 70 (2014) 1608–1621. [CrossRef]
- A. Jorge, C. Ung, L.H. Young, R.B. Melles, H.K. Choi, Hydroxychloroquine retinopathy — implications of research advances for rheumatology care, Nat. Rev. Rheumatol. 14 (2018) 693–703. [CrossRef]
- L. Laraia, G. Garivet, D.J. Foley, N. Kaiser, S. Müller, S. Zinken, T. Pinkert, J. Wilke, D. Corkery, A. Pahl, S. Sievers, P. Janning, C. Arenz, Y. Wu, R. Rodriguez, H. Waldmann, Image-Based Morphological Profiling Identifies a Lysosomotropic, Iron-Sequestering Autophagy Inhibitor, Angew. Chemie - Int. Ed. 59 (2020) 5721–5729. [CrossRef]
- M. Mauthe, I. Orhon, C. Rocchi, X. Zhou, M. Luhr, K.J. Hijlkema, R.P. Coppes, N. Engedal, M. Mari, F. Reggiori, Chloroquine inhibits autophagic flux by decreasing autophagosome-lysosome fusion, Autophagy 14 (2018) 1435–1455. [CrossRef]
- M. Sakurai, T. Kuwahara, Two methods to analyze LRRK2 functions under lysosomal stress: The measurements of cathepsin release and lysosomal enlargement, in: Exp. Model. Park. Dis., Springer, 2021: pp. 63–72.
- E. Fabbri, M. Zoli, M. Gonzalez-Freire, M.E. Salive, S.A. Studenski, L. Ferrucci, Aging and Multimorbidity: New Tasks, Priorities, and Frontiers for Integrated Gerontological and Clinical Research, J. Am. Med. Dir. Assoc. 16 (2015) 640–647. [CrossRef]
- O. Tacar, P. Sriamornsak, C.R. Dass, Doxorubicin: An update on anticancer molecular action, toxicity and novel drug delivery systems, J. Pharm. Pharmacol. 65 (2013) 157–170. [CrossRef]
- B. Zhitomirsky, Y.G. Assaraf, Lysosomal sequestration of hydrophobic weak base chemotherapeutics triggers lysosomal biogenesis and lysosomedependent cancer multidrug resistance, Oncotarget 6 (2015) 1143–1156. [CrossRef]
- S. Schmeisser, K. Schmeisser, S. Weimer, M. Groth, S. Priebe, E. Fazius, D. Kuhlow, D. Pick, J.W. Einax, R. Guthke, M. Platzer, K. Zarse, M. Ristow, Mitochondrial hormesis links low-dose arsenite exposure to lifespan extension, Aging Cell 12 (2013) 508–517. [CrossRef]
- D.L. Li, Z. V. Wang, G. Ding, W. Tan, X. Luo, A. Criollo, M. Xie, N. Jiang, H. May, V. Kyrychenko, J.W. Schneider, T.G. Gillette, J.A. Hill, Doxorubicin Blocks Cardiomyocyte Autophagic Flux by Inhibiting Lysosome Acidification, Circulation 133 (2016) 1668–1687. [CrossRef]
- B.J. Baker, H. Mutoh, D. Dimitrov, W. Akemann, A. Perron, Y. Iwamoto, L. Jin, L.B. Cohen, E.Y. Isacoff, V.A. Pieribone, T. Hughes, T. Knöpfel, Genetically encoded fluorescent sensors of membrane potential, Brain Cell Biol. 36 (2008) 53–67. [CrossRef]
- Y. Shen, M. Rosendale, R.E. Campbell, D. Perrais, pHuji, a pH-sensitive red fluorescent protein for imaging of exo- and endocytosis, J. Cell Biol. 207 (2014) 419–432. [CrossRef]
- Y. Shen, Y. Wen, S. Sposini, A.A. Vishwanath, A.S. Abdelfattah, E.R. Schreiter, M.J. Lemieux, J. de Juan-Sanz, D. Perrais, R.E. Campbell, Rational Engineering of an Improved Genetically Encoded pH Sensor Based on Superecliptic pHluorin, ACS Sensors 8 (2023) 3014–3022. [CrossRef]
- E. Persi, M. Duran-Frigola, M. Damaghi, W.R. Roush, P. Aloy, J.L. Cleveland, R.J. Gillies, E. Ruppin, Systems analysis of intracellular pH vulnerabilities for cancer therapy, Nat. Commun. 9 (2018). [CrossRef]
- A. Kabir, A. Muth, Polypharmacology: The science of multi-targeting molecules, Pharmacol. Res. 176 (2022) 106055. [CrossRef]
- B.R. Rost, F. Schneider, M.K. Grauel, C. Wozny, C. G Bentz, A. Blessing, T. Rosenmund, T.J. Jentsch, D. Schmitz, P. Hegemann, C. Rosenmund, Optogenetic acidification of synaptic vesicles and lysosomes, Nat. Neurosci. 18 (2015) 1845–1852. [CrossRef]
- K. Yokoyama, E. Muneyuki, T. Amano, S. Mizutani, M. Yoshida, M. Ishida, S. Ohkuma, V-ATPase of Thermus thermophilus is inactivated during ATP hydrolysis but can synthesize ATP, J. Biol. Chem. 273 (1998) 20504–20510. [CrossRef]
- A. V. Vlasov, S.D. Osipov, N.A. Bondarev, V.N. Uversky, V.I. Borshchevskiy, M.F. Yanyushin, I. V. Manukhov, A. V. Rogachev, A.D. Vlasova, N.S. Ilyinsky, A.I. Kuklin, N.A. Dencher, V.I. Gordeliy, ATP synthase FOF1 structure, function, and structure-based drug design, 2022. [CrossRef]
- B.A. Webb, F.M. Aloisio, R.A. Charafeddine, J. Cook, T. Wittmann, D.L. Barber, pHLARE: A new biosensor reveals decreased lysosome pH in cancer cells, Mol. Biol. Cell 32 (2021) 131–142. [CrossRef]
- B. Liu, J. Palmfeldt, L. Lin, A. Colaço, K.K.B. Clemmensen, J. Huang, F. Xu, X. Liu, K. Maeda, Y. Luo, M. Jäättelä, STAT3 associates with vacuolar H+-ATPase and regulates cytosolic and lysosomal pH, Cell Res. 28 (2018) 996–1012. [CrossRef]
- A. Vlasova, A. Polyakova, A. Gromova, S. Dolotova, S. Bukhalovich, D. Bagaeva, N. Bondarev, F. Tsybrov, K. Kovalev, A. Mikhailov, Optogenetic cytosol acidification of mammalian cells using an inward proton-pumping rhodopsin, Int. J. Biol. Macromol. 242 (2023) 124949.
- C.E.T. Donahue, M.D. Siroky, K.A. White, An Optogenetic Tool to Raise Intracellular pH in Single Cells and Drive Localized Membrane Dynamics, J. Am. Chem. Soc. 143 (2021) 18877–18887. [CrossRef]
- I.S. Okhrimenko, K. Kovalev, L.E. Petrovskaya, N.S. Ilyinsky, A.A. Alekseev, E. Marin, T.I. Rokitskaya, Y.N. Antonenko, S.A. Siletsky, P.A. Popov, Y.A. Zagryadskaya, D. V. Soloviov, I. V. Chizhov, D. V. Zabelskii, Y.L. Ryzhykau, A. V. Vlasov, A.I. Kuklin, A.O. Bogorodskiy, A.E. Mikhailov, D. V. Sidorov, S. Bukhalovich, F. Tsybrov, S. Bukhdruker, A.D. Vlasova, V.I. Borshchevskiy, D.A. Dolgikh, M.P. Kirpichnikov, E. Bamberg, V.I. Gordeliy, Mirror proteorhodopsins, Commun. Chem. 6 (2023) 1–16. [CrossRef]
- K. Kovalev, F. Tsybrov, A. Alekseev, V. Shevchenko, D. Soloviov, S. Siletsky, G. Bourenkov, M. Agthe, M. Nikolova, D. von Stetten, R. Astashkin, S. Bukhdruker, I. Chizhov, A. Royant, A. Kuzmin, I. Gushchin, R. Rosselli, F. Rodriguez-Valera, N. Ilyinskiy, A. Rogachev, V. Borshchevskiy, T.R. Schneider, E. Bamberg, V. Gordeliy, Mechanisms of inward transmembrane proton translocation, Nat. Struct. Mol. Biol. 30 (2023) 970–979. [CrossRef]
Figure 1.
Representation of the model. A. Schematic representation of the ion transporters and passive ions/water fluxes implemented in the model. vATPase structure from PDB ID 3J9T [46], NKA (7E1Z [47]), CAX (4KPP [48]), TRPLM3 (5W3S [49]), ClC7 (7JM7 [50]). The ions conduction paths are shown schematically. The main ions fluxes for the each protein are shown, but there are also other conductances (e.g. Fe2+, Na+, Zn2+ fluxes for TRPMLs). Cytosolic and lysosomal ion concentrations [9] are shown outside and inside the membrane boundary, respectively. The total lysosomal membrane potential ΔψT is the sum of the potential of Donnan particles, other lumenal anions (Δψ) and the transmembrane potential difference (ψout-ψin= -50mV [14]) and is equal to 10-100mV, lumen positive [51,52]. B. Stability of the equilibrium pH after initiation model from different initial pH values.
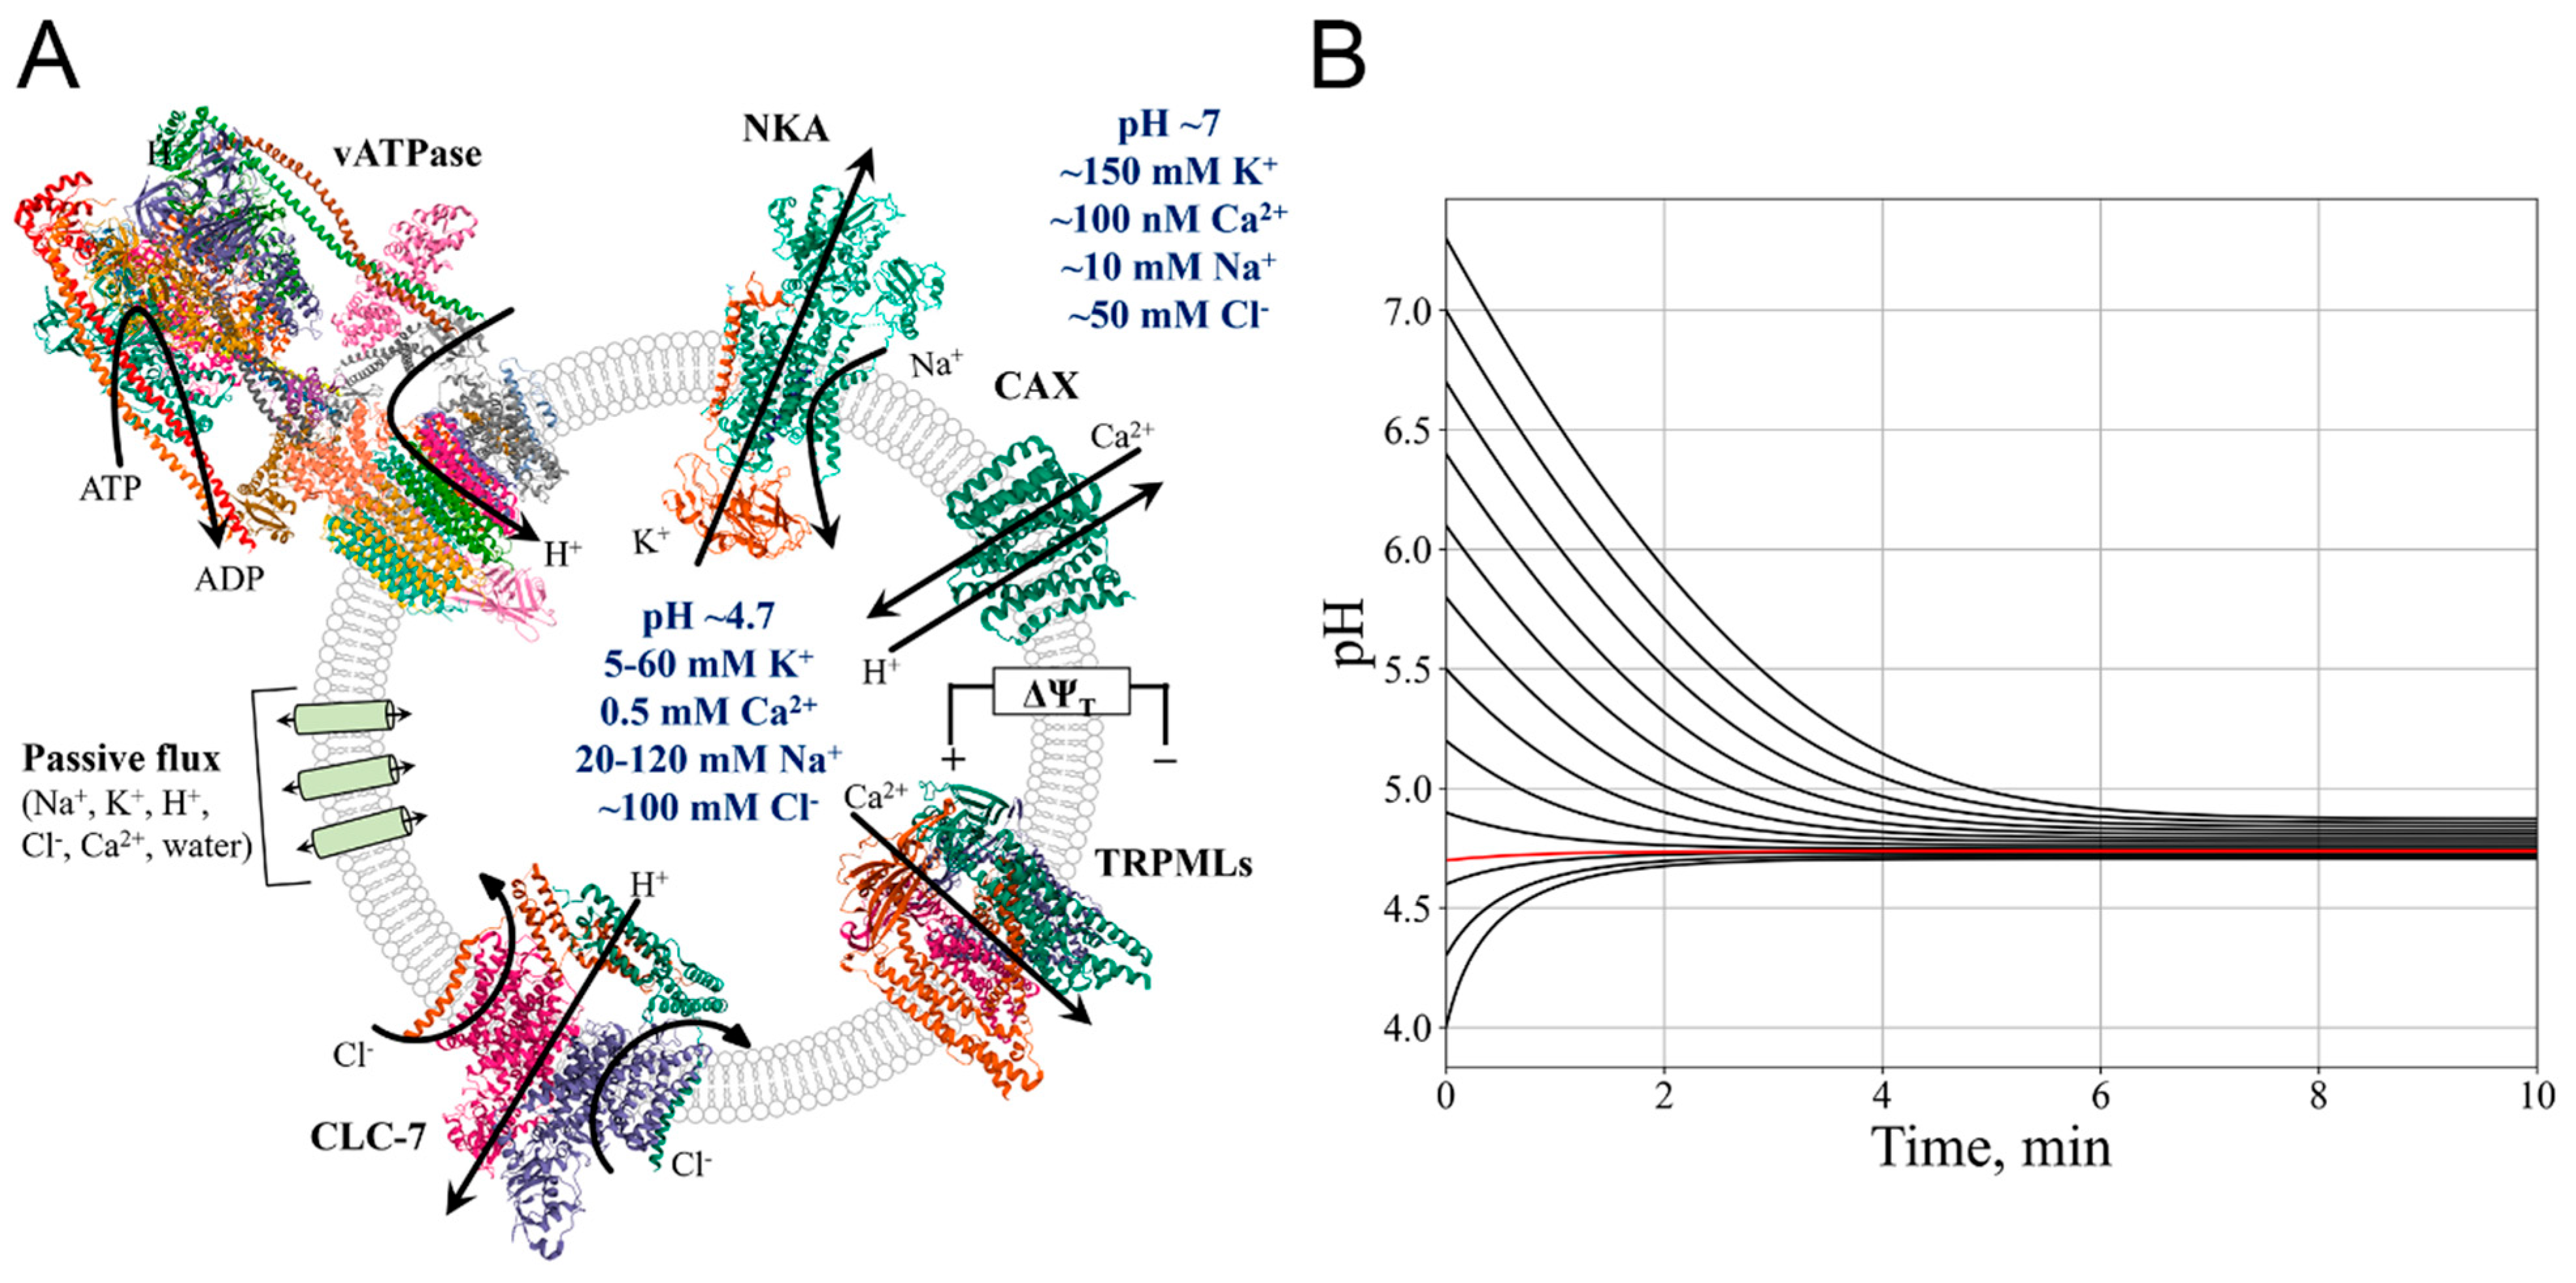
Figure 2.
Modelling of lysosome maturation. A. vATPase number increases and NKA number decreases during lysosome maturation. B. Shift of pH and membrane potential of endosomes to the near-lysosomal levels. C. Kinetics of ion concentrations adjustment in the endosome during maturation. D. Decrease in the volume and water flux into the organelle during endosome maturation.
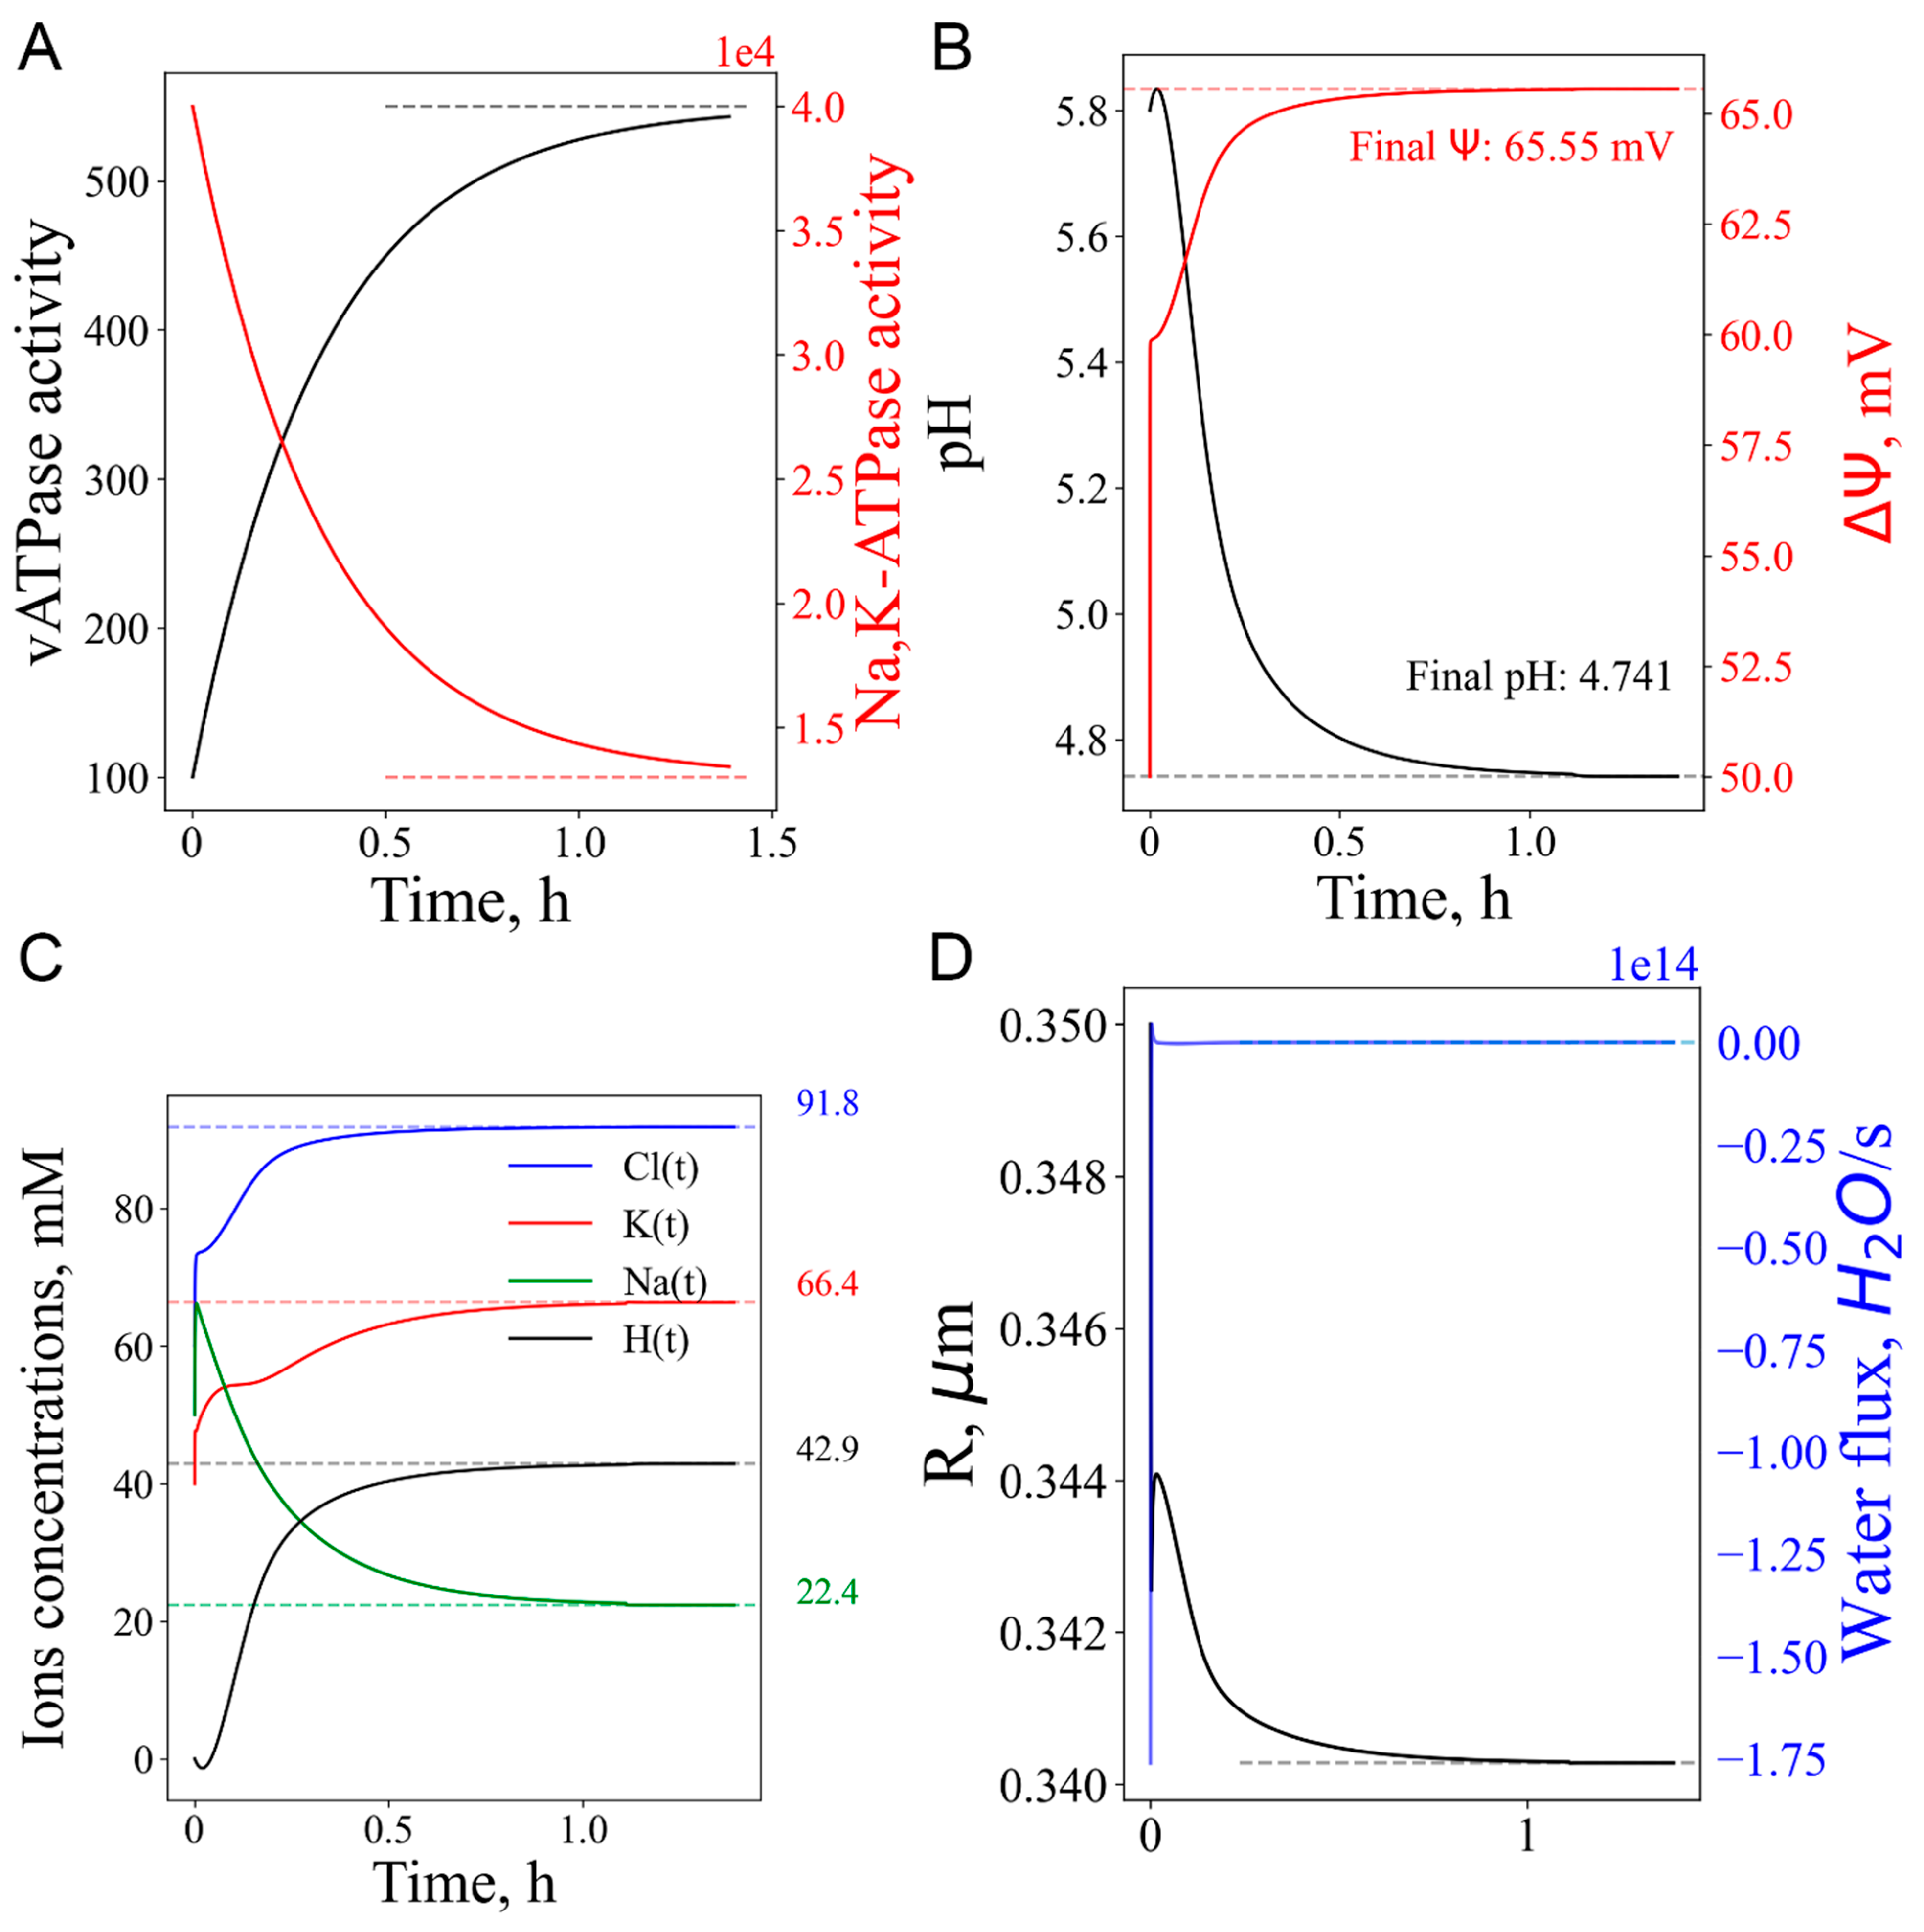
Figure 3.
Consequences of the transient LMP modelled as a 100-fold increase in permeabilities. A. Increase in pH, decrease in potential. B. Adjustments of K+, Na+, Cl- ions concentrations. Colored numbers are concentrations in mM. C. Increase in radius and water uptake. D. vATPase activity increases, resulting in a return to the initial state. Orange dashed rectangles mark the time period of stress application.
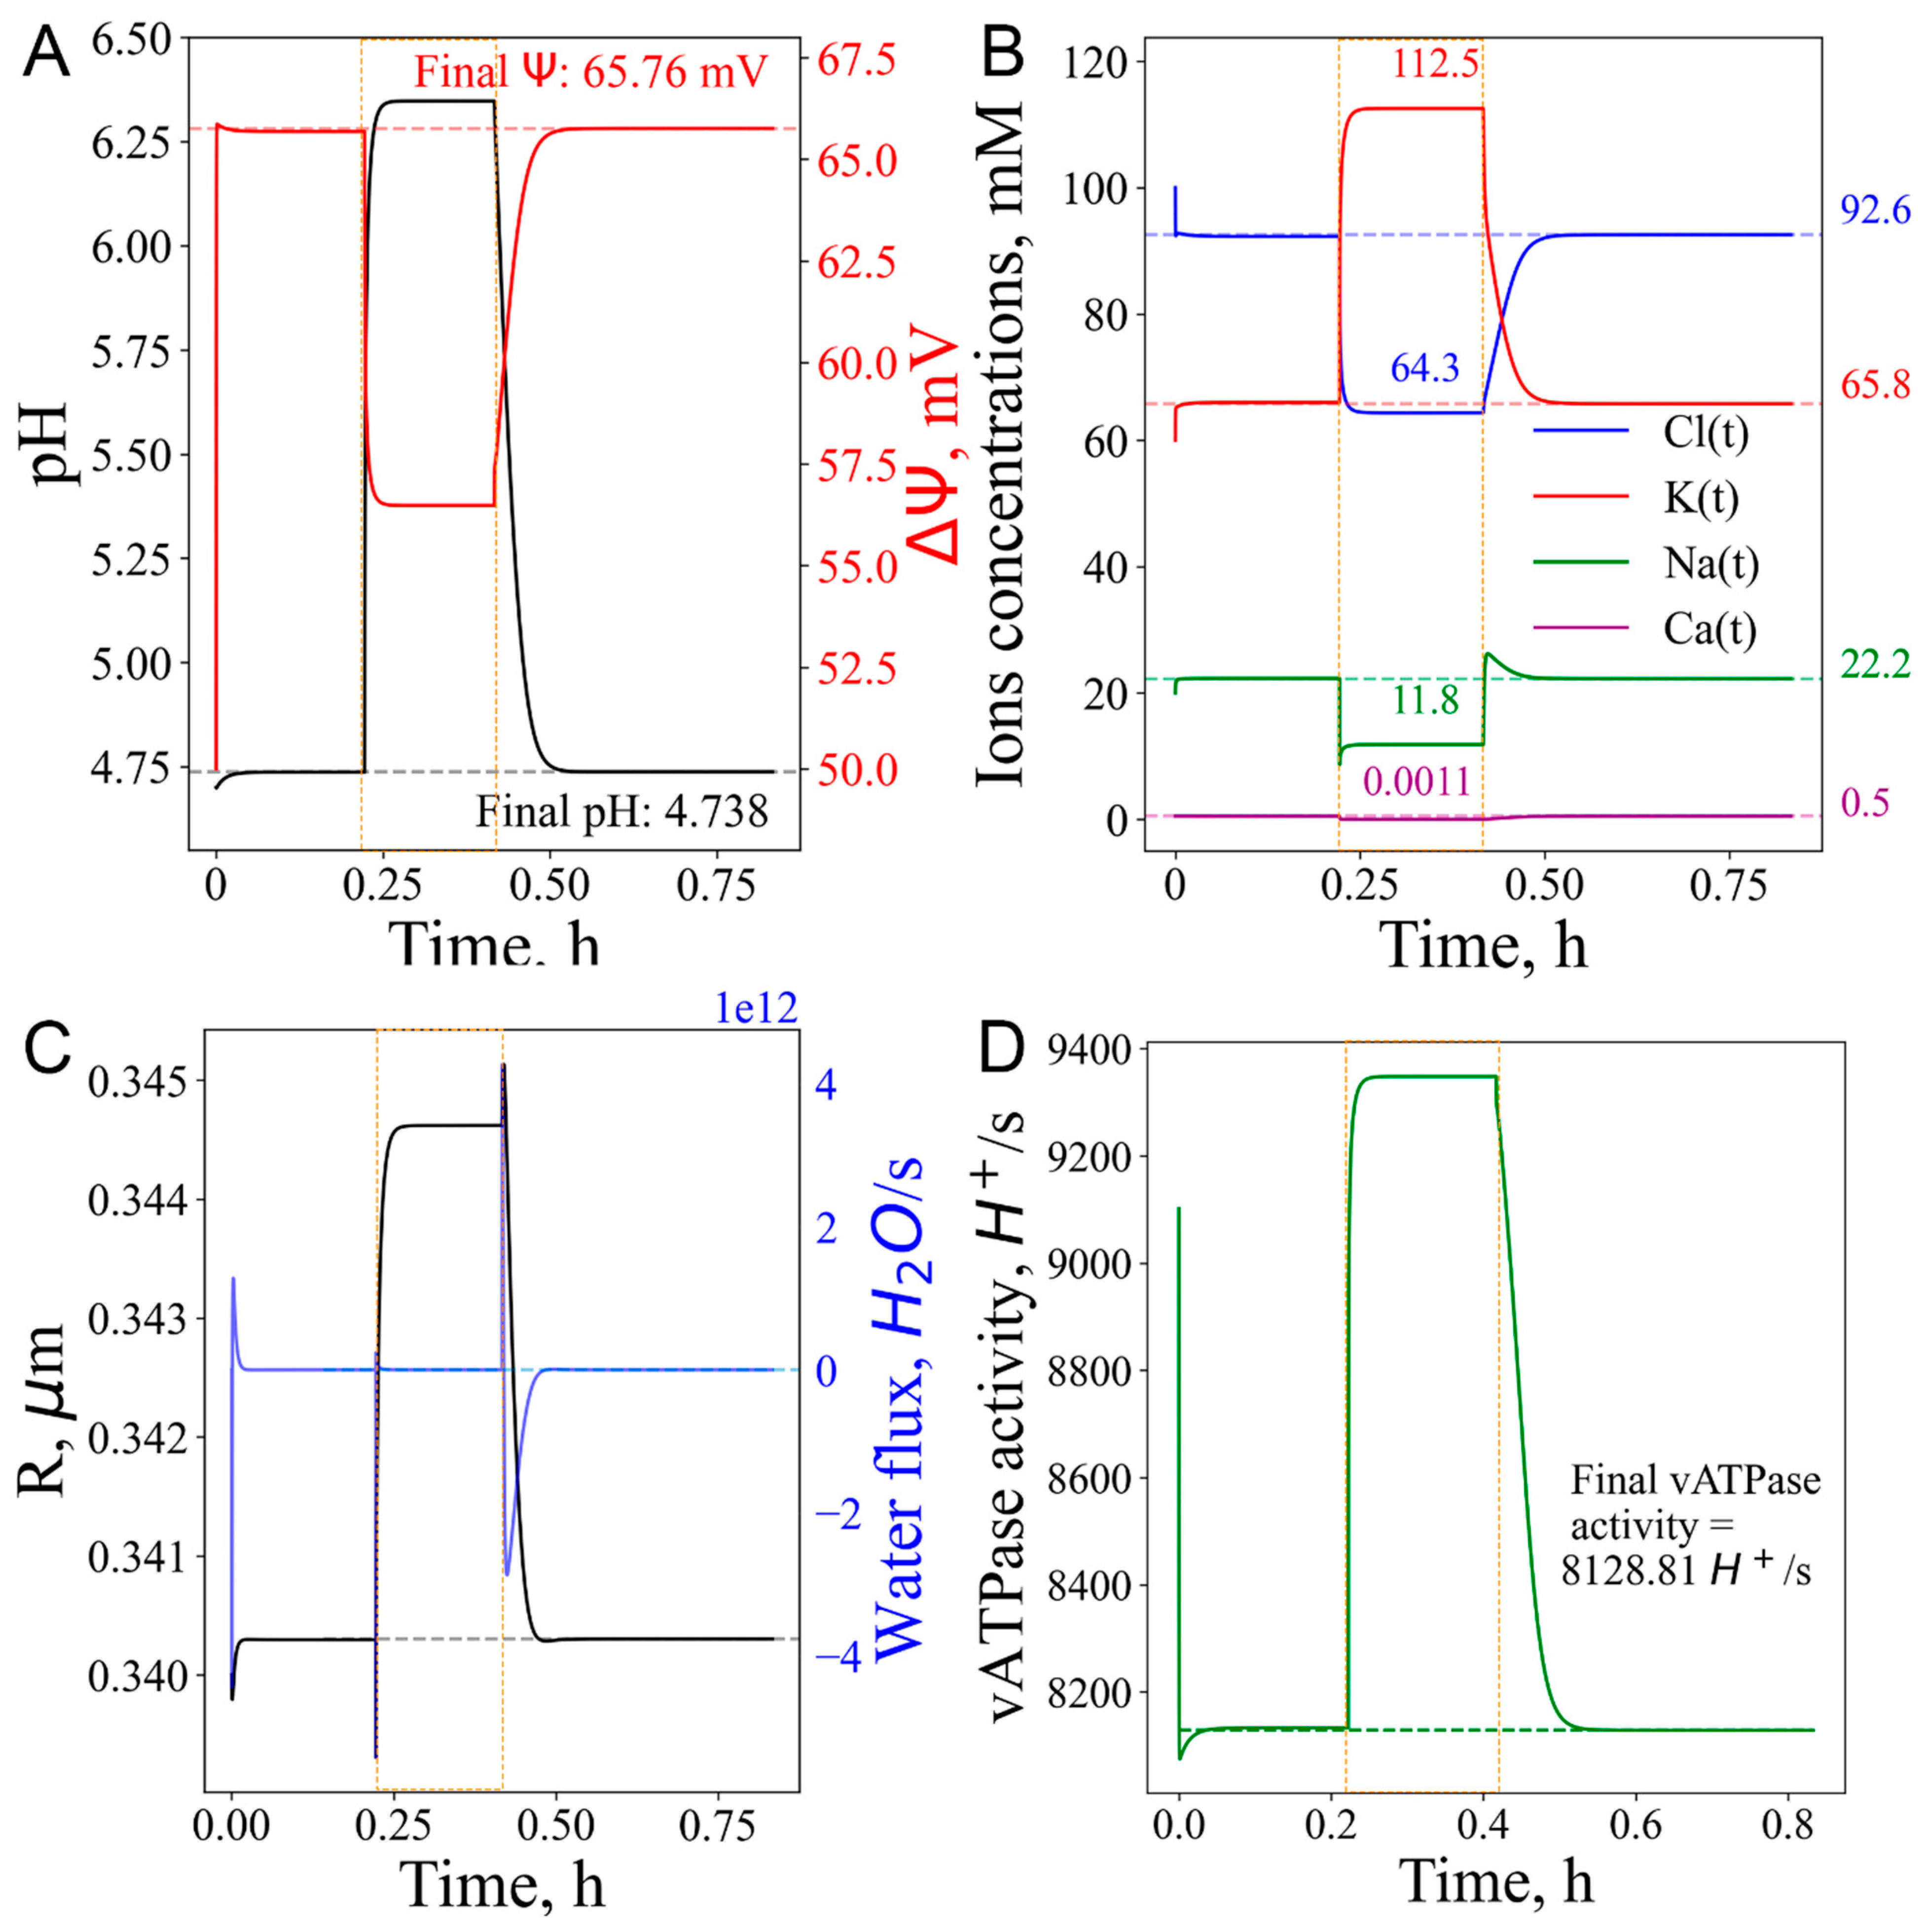
Figure 4.
Short-term stresses. A-C. vATPase “knockout” as a representative result of a metabolic switch from catabolism to anabolism. A. Increase in pH and decrease in potential. B. Cation efflux and Cl- influx. C. Absence of volume increase. D-F. Lysosome swelling. D. Organelle enlargement due to additional water influx. E. Deacidification and slight potential decrease. F. Disturbance of ions concentrations. Orange dashed rectangles mark the period of stress application.
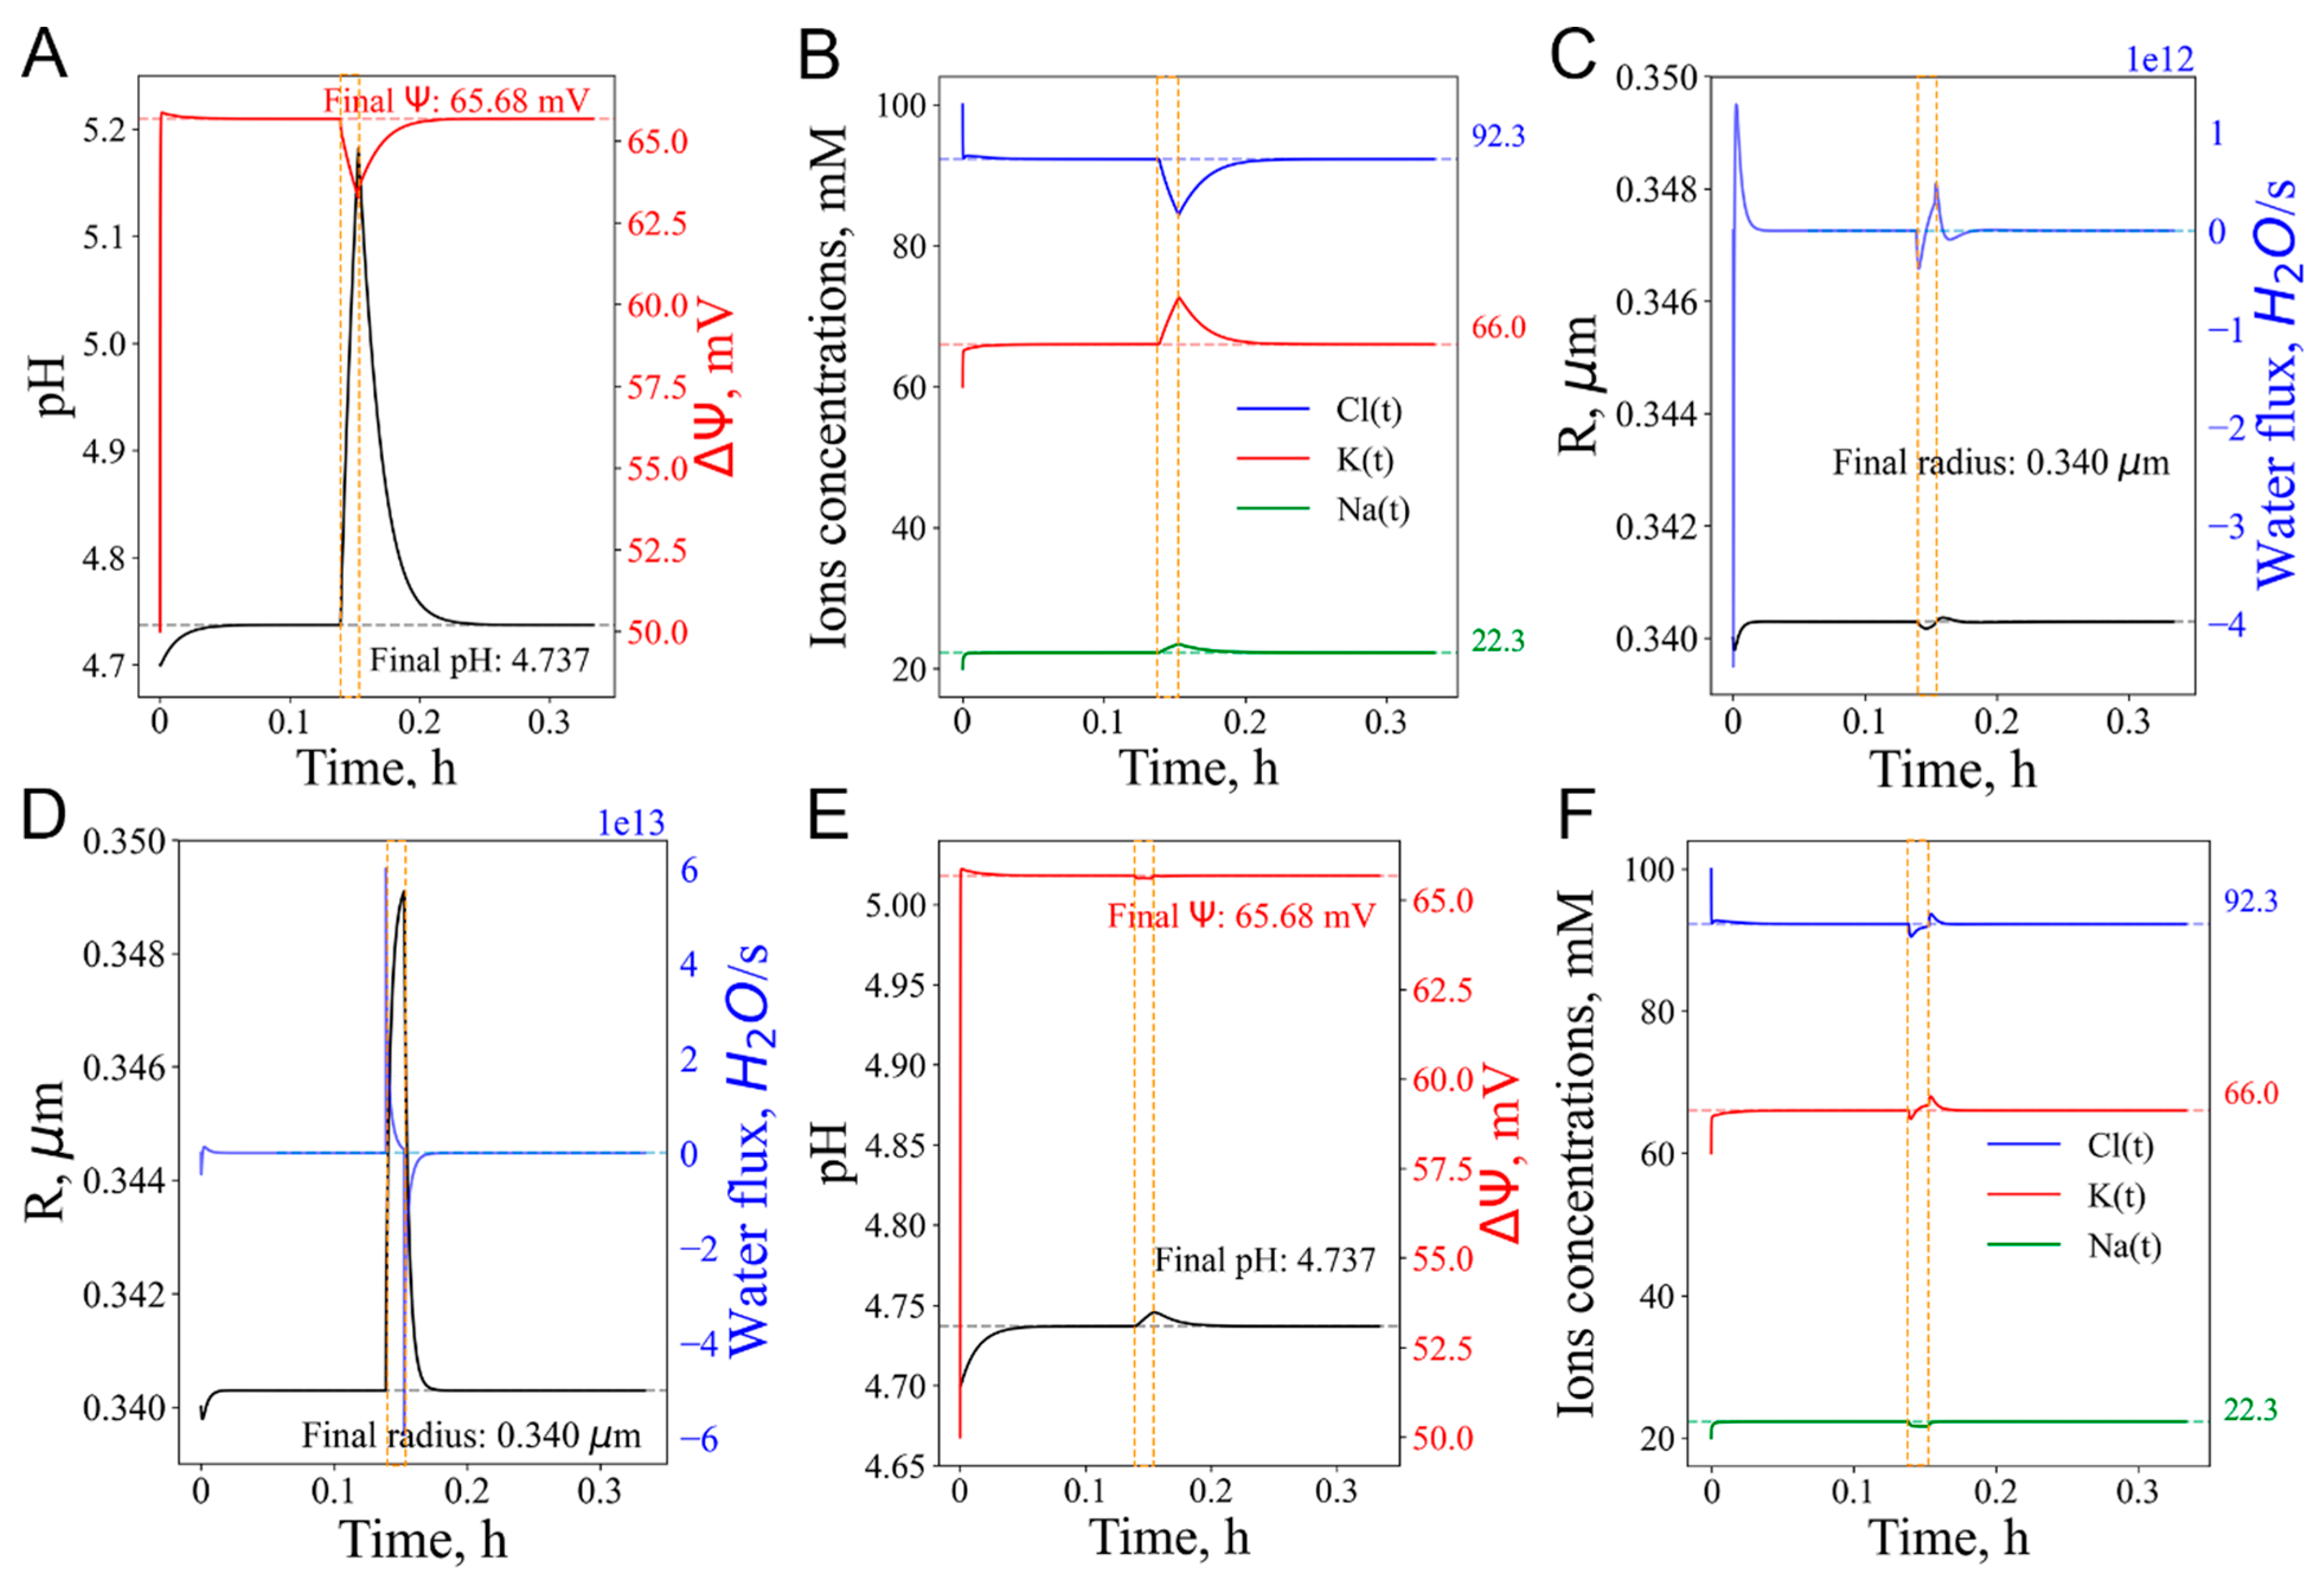
Figure 5.
Calcium efflux from the lysosome after vATPase inhibition. A. In silico experiment setup. Schematic description of the lysosomal response to vATPase inhibition. The resulting changes in CAX activity and [Ca2+] are shown. B. Increase in pH and decrease in potential. C. Decreased activity of the CAX transporter. D. Ca2+ release from the lysosome. Orange dashed lines correspond to the shift from norm to stress.
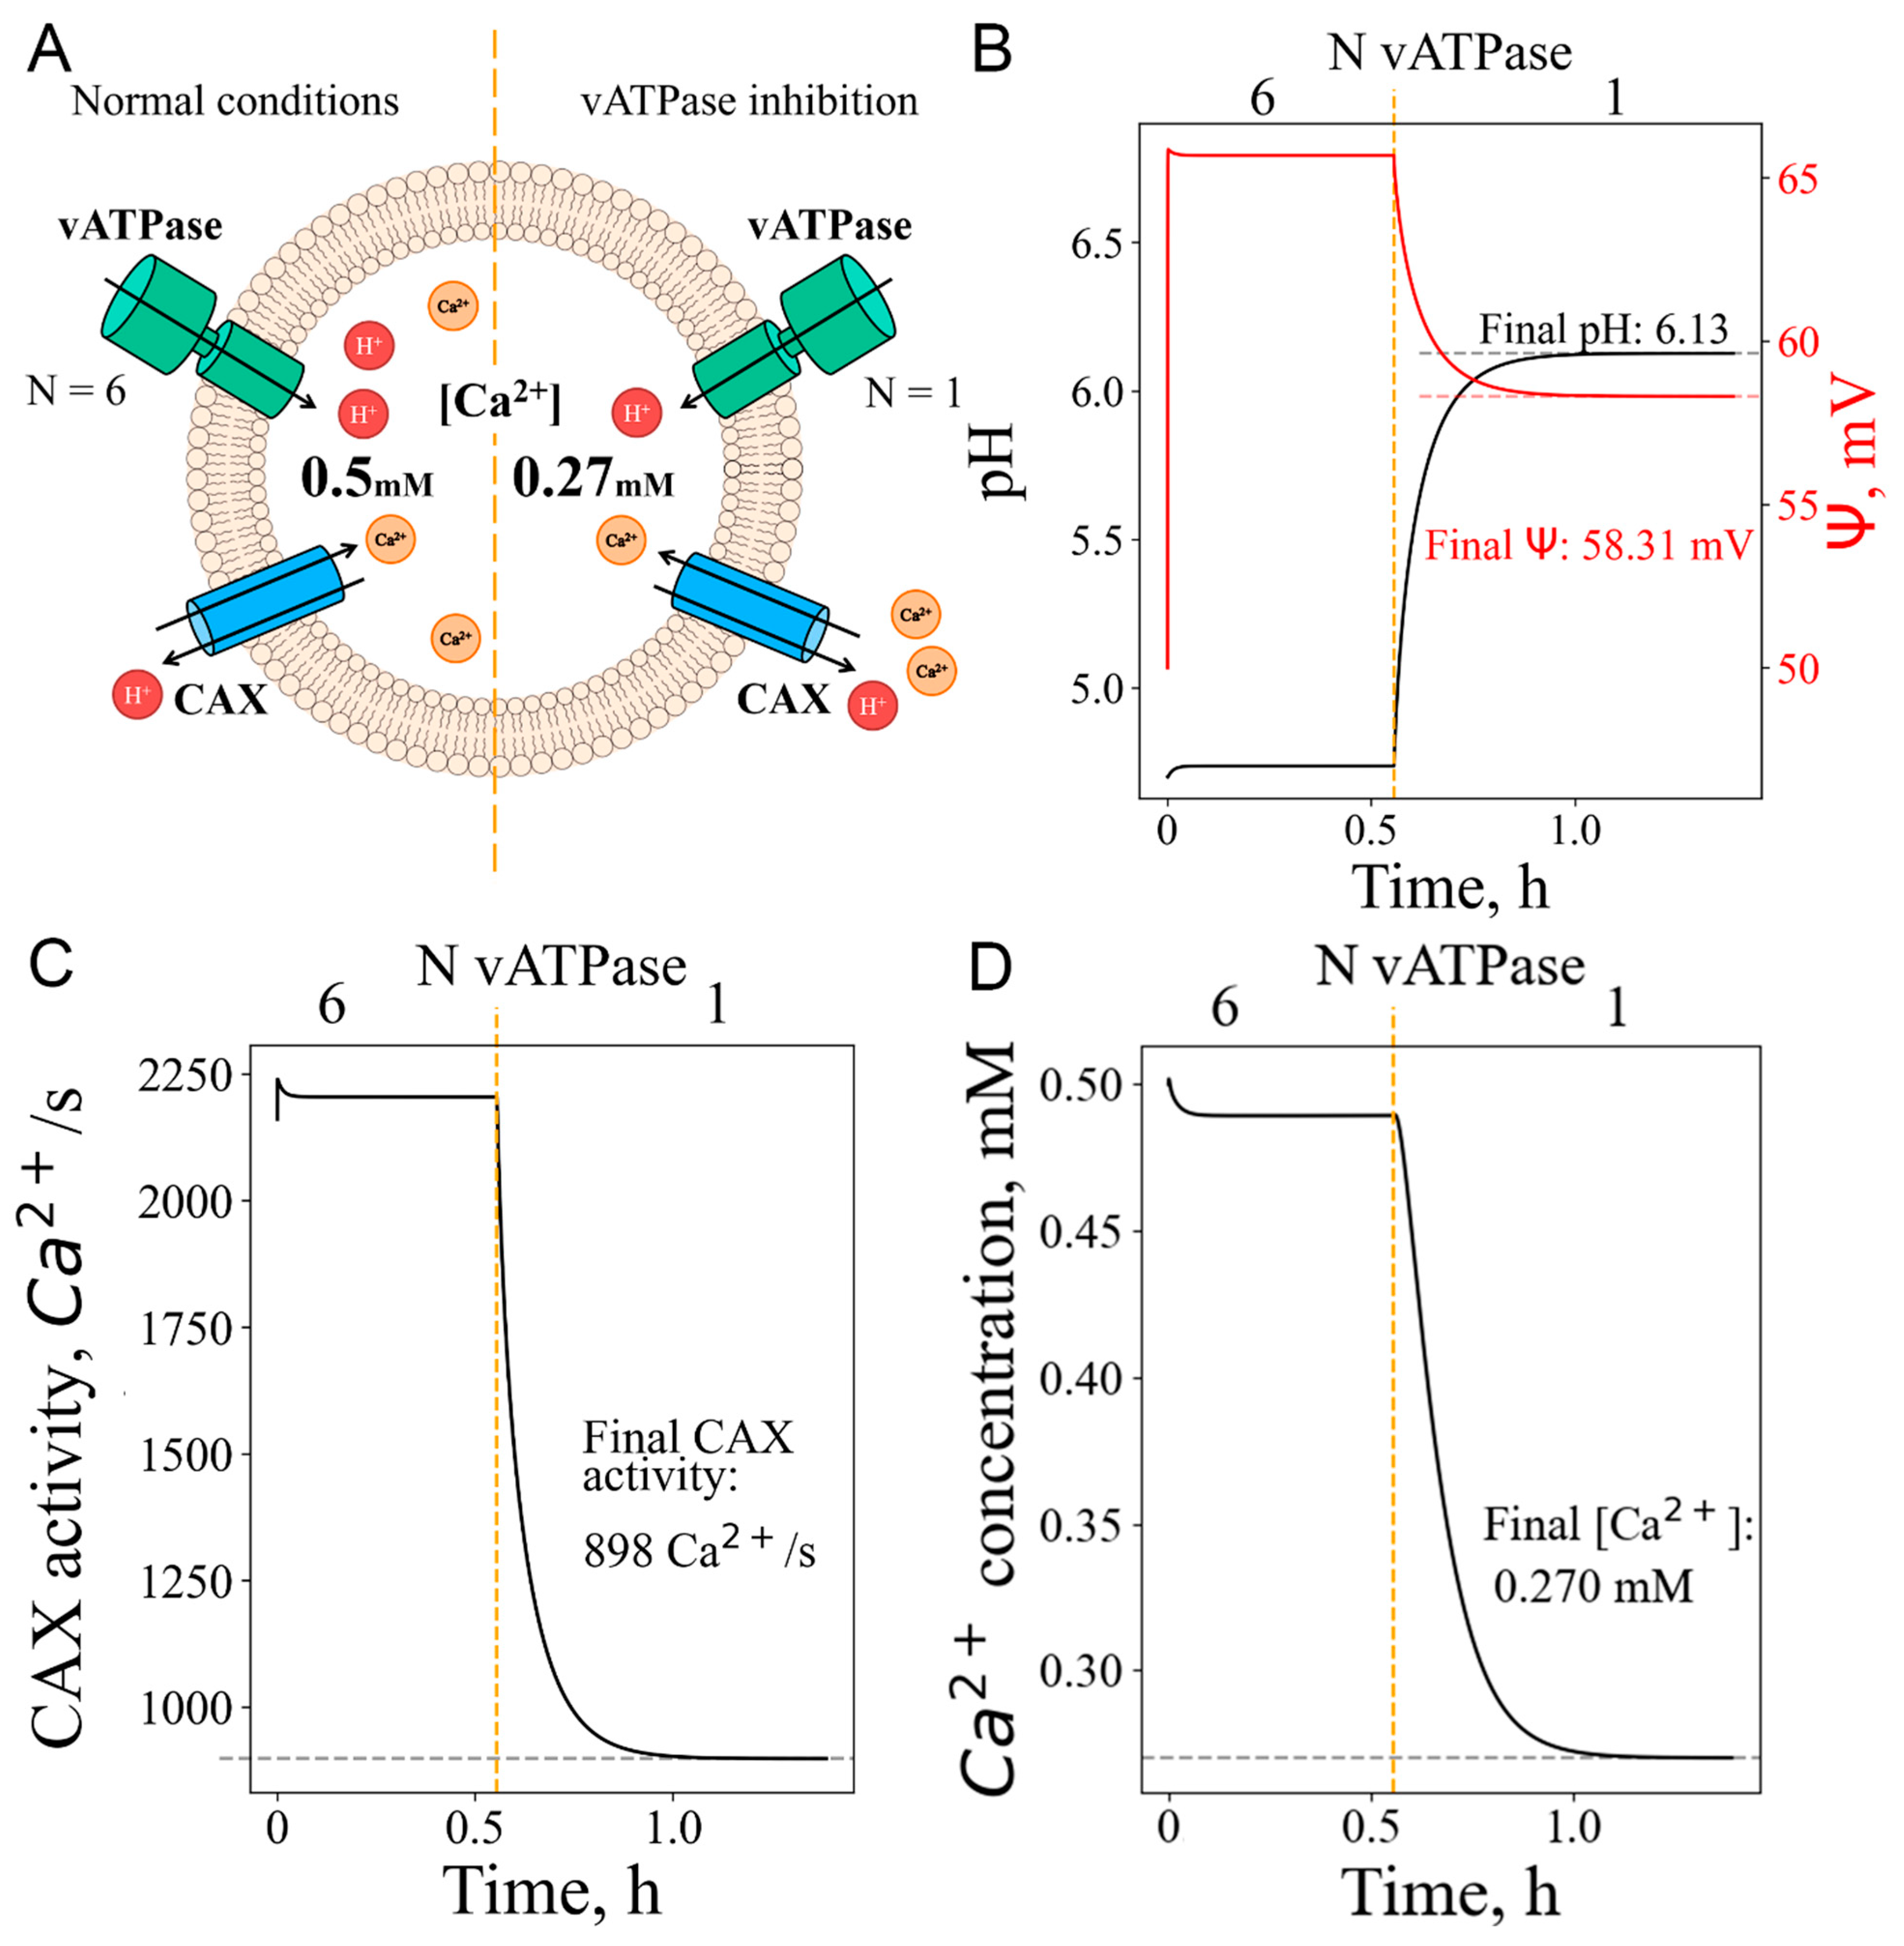
Figure 6.
Calcium efflux from the lysosome after deacidification by additional proton efflux. A. In silico experiment setup. Schematic description of the lysosomal response to direct proton efflux. B. Changes in pH and transmembrane potential. C. CAX activity before and after proton efflux. D. Changes in calcium concentration. Orange dashed lines correspond to the shift from norm to stress.
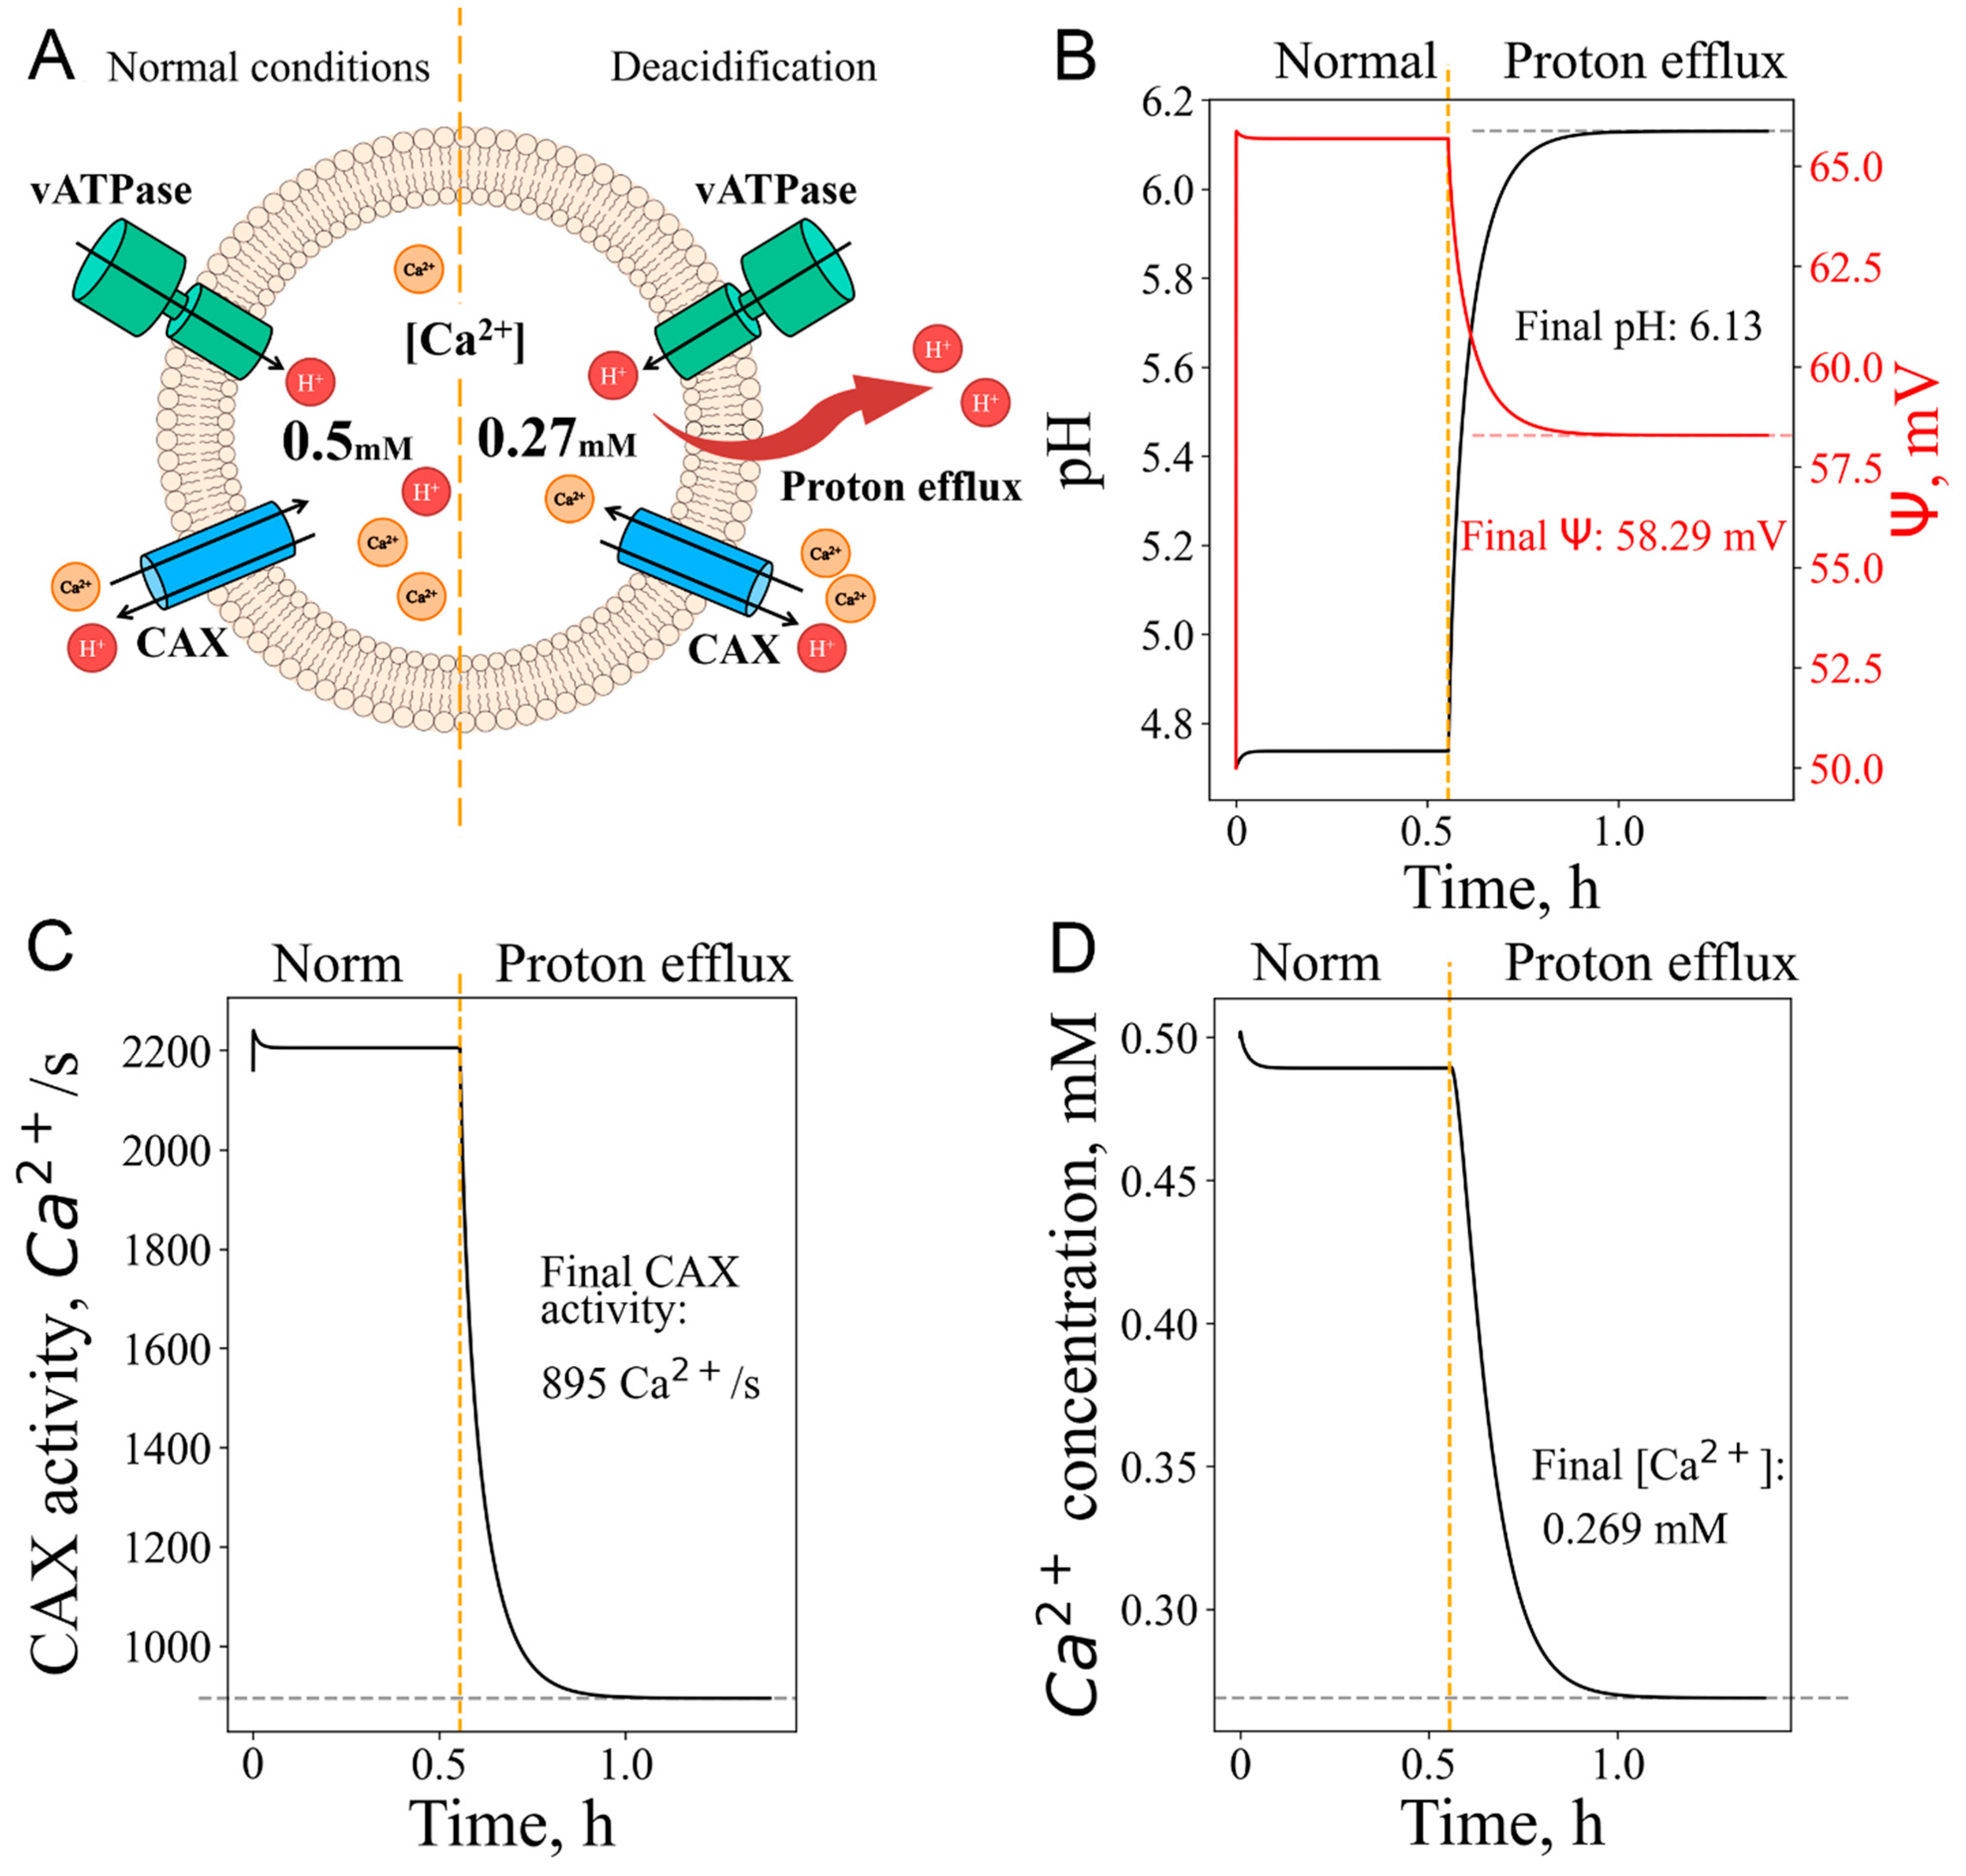
Figure 7.
Accumulation of weakly basic, “proton sponge”-like cationic amphiphilic drug (CAD). A. Schematic representation of the increase in osmotic pressure and swelling of lysosomes due to the accumulation of “proton sponges”. The figure shows the relationship between the binding of protons with “proton sponges” and the increase in water influx. B. Concentration of protonated and unprotonated “proton sponges” over time. Initially all “sponges” are unprotonated. C. Lysosomal pH increases as “proton sponges” enter the lysosomes and gradually decreases to a level above normal (4.8 pH units instead of 4.7). D. The time dependence of the lysosome radius (black) and the water flux into the lysosome (blue); the graph shows a sharp increase in the size of the lysosome when the “proton sponges” enter the lysosome, gradually reaching an elevated stable level.
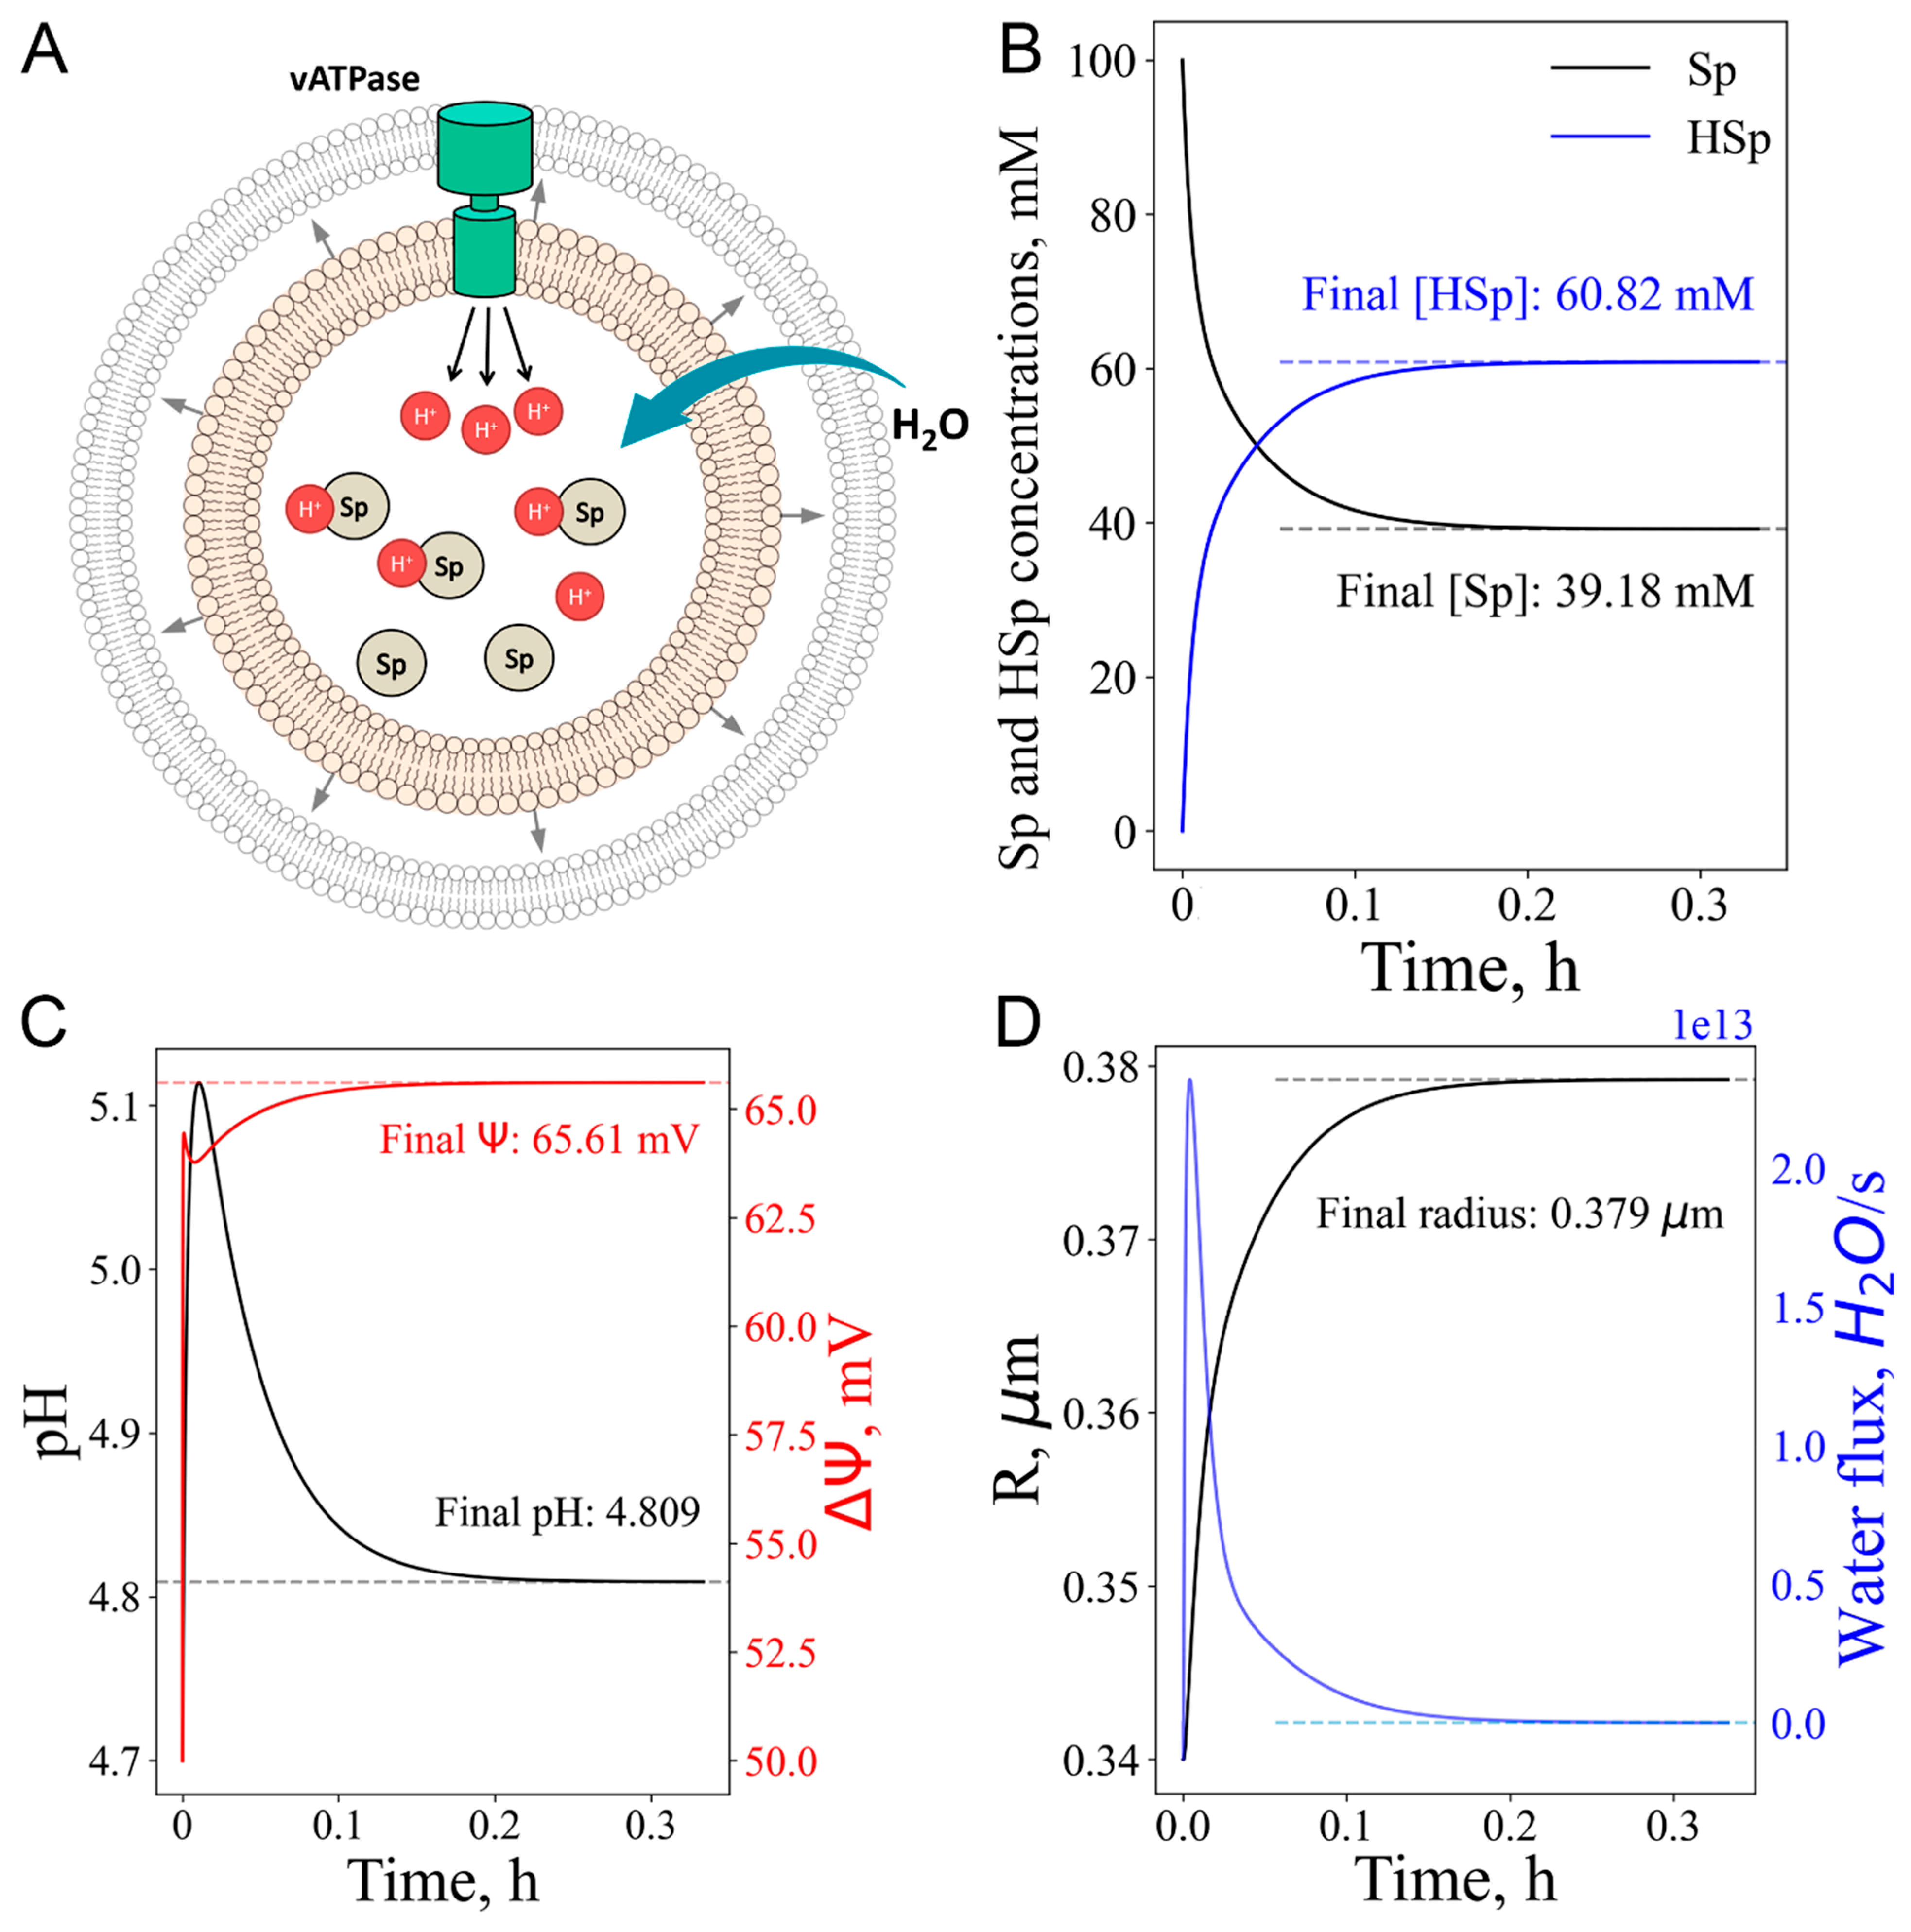
Figure 8.
CAD accumulation or/and vATPase inhibition. Changes in pH (top) and single vATPase activity (bottom) in the cases of single stress. A. vATPase inhibition; B. CAD accumulation; or simultaneous stresses. C. vATPase inhibition in the case of CAD accumulation; Plots from the LysoModel.exe application provided in the Supplementary materials.
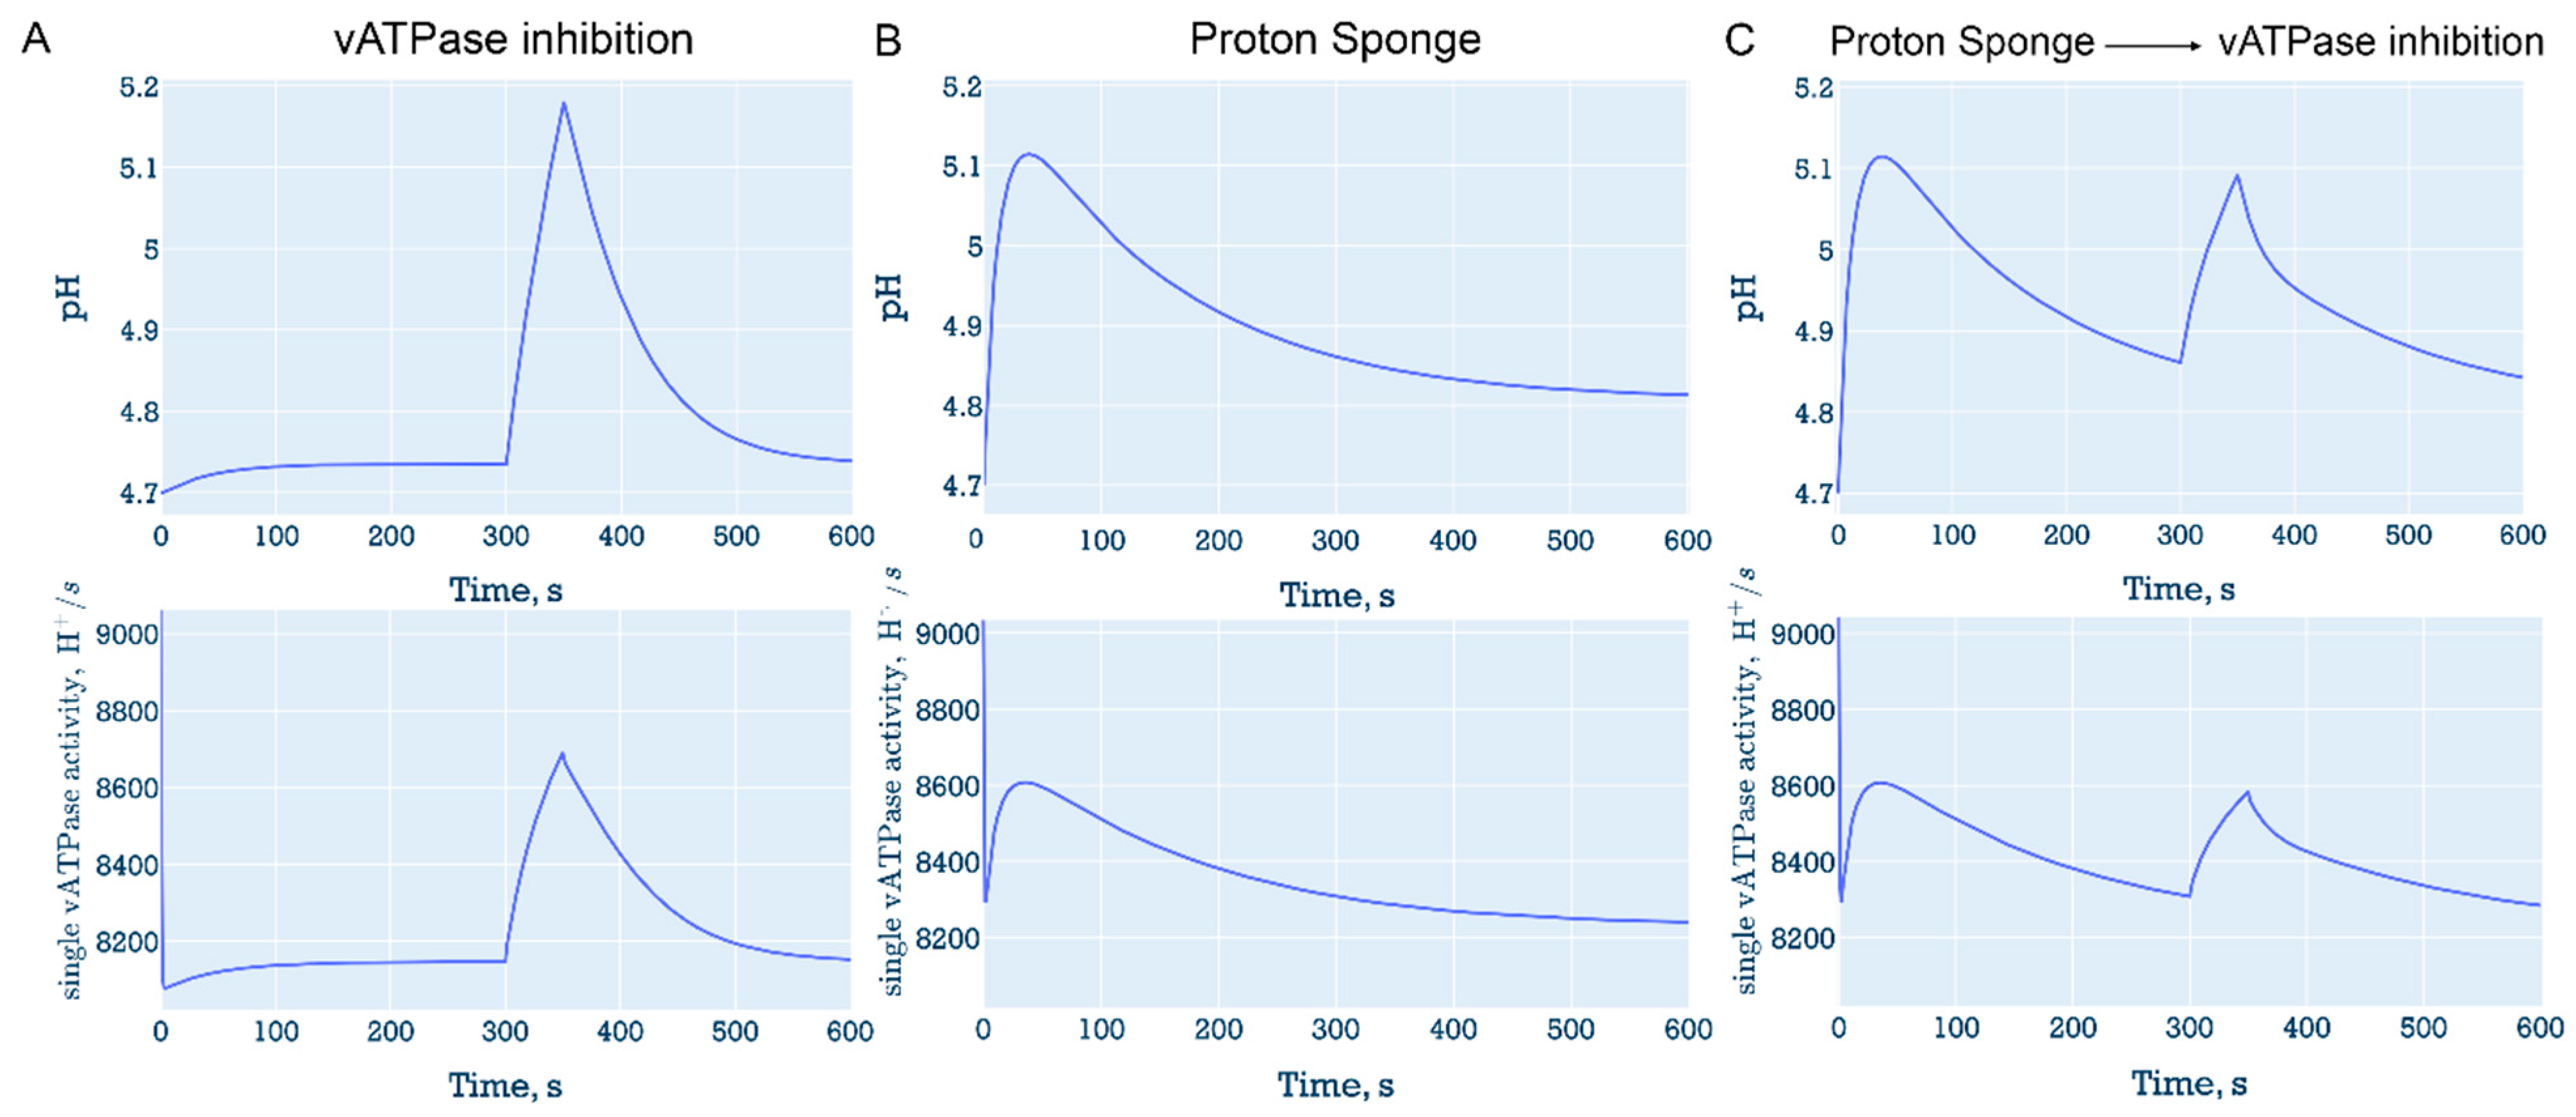
Figure 9.
Proton efflux with/without decrease in vATPases number. Changes in pH for A. Proton efflux. B. Proton efflux with temporal decrease in vATPases number. Plots from the LysoModel.exe application provided in the Supplementary materials.
Figure 9.
Proton efflux with/without decrease in vATPases number. Changes in pH for A. Proton efflux. B. Proton efflux with temporal decrease in vATPases number. Plots from the LysoModel.exe application provided in the Supplementary materials.
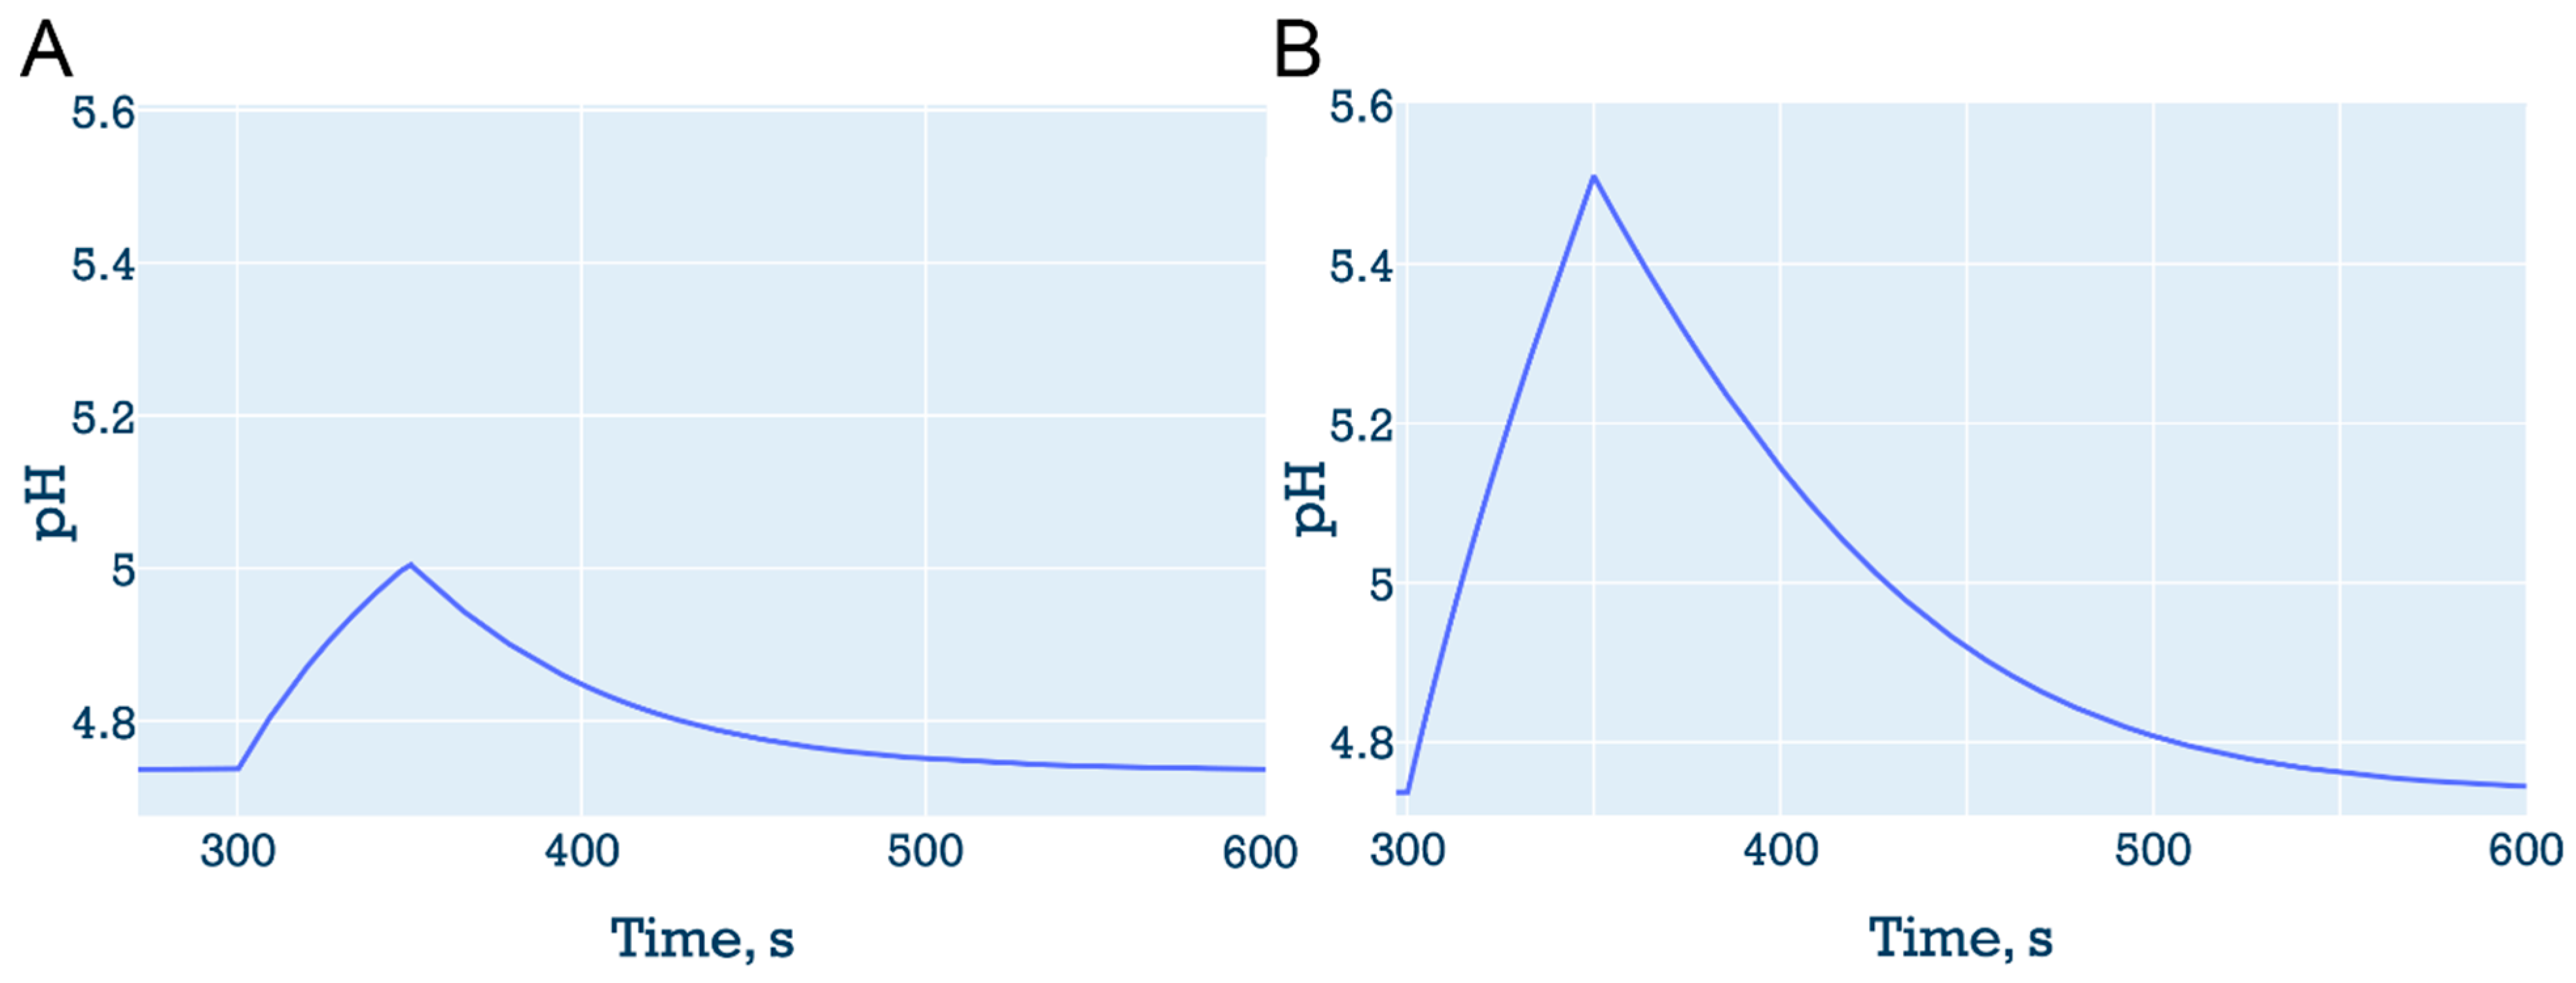

Table 1.
Stress conditions.
| Type of stress/impact | Description | Mathematical description |
| Lysosome maturation | Changes in initial ion concentrations corresponding to their values in the late endosome. All ion transporters function as in the lysosomal norm model except vATPase and NKA, which gradually increase/decrease in activity. | Initial [Cl-] = 58 mM [K+] = 40 mM [Na+] = 50 mM pH = 5.8 Δψ = 50 mV |
| Short-term lysosome membrane permeabilization | Increased permeability to all ions and water for ~12 minutes |
by 100- or 10-fold increase |
| Short-term vATPase “knockout” | Short-term (50 seconds) shutdown of vATPase |
Temporarily |
| Short-term volume enlargement | Short-term (50 seconds) increase in water flux into the lysosome, causing it to swell |
Temporarily |
| Ca signaling as response to vATPase inhibition | Inhibition of vATPase activity and monitoring of changes in calcium concentration and its channel activity | |
| Ca signaling as response to proton efflux | Adding a constant value to the proton flux | |
| Cationic amphiphilic drugs (CAD) as Lysosomal storage diseases (LSD) model | Modelling of “proton sponge” accumulation in the lysosome leading to lumen deacidification | Water influx increased due to “proton sponge” presence. Description in the main part of the work |
Mod – modified parameter or function under stress condition, L – lysosomal, JvATPase – proton flux due to vATPase work, Jw – water flux, NvATPase - number of the vATPases, NH+ - number of protons in the lumen, Δψ – lumen potential, determined by the concentrations of ions inside the lysosome.
Disclaimer/Publisher’s Note: The statements, opinions and data contained in all publications are solely those of the individual author(s) and contributor(s) and not of MDPI and/or the editor(s). MDPI and/or the editor(s) disclaim responsibility for any injury to people or property resulting from any ideas, methods, instructions or products referred to in the content. |
© 2024 by the authors. Licensee MDPI, Basel, Switzerland. This article is an open access article distributed under the terms and conditions of the Creative Commons Attribution (CC BY) license (http://creativecommons.org/licenses/by/4.0/).
Copyright: This open access article is published under a Creative Commons CC BY 4.0 license, which permit the free download, distribution, and reuse, provided that the author and preprint are cited in any reuse.


