
Submitted:
09 December 2024
Posted:
10 December 2024
You are already at the latest version
Abstract
Strawberries are valued globally for their nutritional, aesthetic, and economic benefits. Optimizing blue-to-red LED ratios and nitrogen levels is essential for sustainable indoor strawberry cultivation. This factorial study investigated the effects of blue and red LED combination ratios (L1; 1:3, L2; 1:4, and L3; 1:6) and nitrogen levels (N1; 100 and N2; 200 mg/L) on the physiology and performance of strawberry in plant factory. The results revealed that the interaction of L3 coupled and N2 max-imized the vegetative growth of strawberry plants, whereas L2 and N2 produced the greatest biomass, while L2 interacted with N1 to expedite flowering. Photosynthesis and transpiration were enhanced by L3, particularly with 100 mg/L of nitrogen. Also, the highest fruit yield and total soluble solids were obtained at the interaction of L3 and N1. Leaf nutrient analysis showed the highest nitrogen concentration at L1, while potassium increased with higher red LED ratios. The 100 mg/L nitrogen treatment resulted in higher leaf potassium concentrations than the 200 mg/L. These findings emphasize that LED spectra and nitrogen levels interact to optimize the physiology, vegetative and reproductive growth, maximizing fruit yield and quality in indoor strawberry cul-tivation. The study also concludes that the application of blue and red LED in the ratio of 1:6 with 100 mg/L nitrogen can improve indoor strawberry performance.
Keywords:
LED
; spectra
; light
; nitrogen
; Praratchatan 80
; strawberry
1. Introduction
Garden strawberry (Fragaria x ananassa Duch.) is an important horticultural crop globally, owing to its high market and nutritional value. In 2021, the global production of strawberries reached 9,175,385.43 tons from 389,665 ha of farms [1]. Consumers favor strawberries due to their vibrant color, sweetness, and health benefits. The fruits are rich in bioactive compounds, including polyphenols, organic acids, and vitamin C, which possess antioxidant properties that may reduce oxidative stress and prevent chronic diseases [2,3]. Studies have associated strawberry consumption with the prevention of inflammatory disorders, reduction of obesity-related conditions, and cancer protection [2,4]. The demand for year-round production has led to advanced cultivation systems, such as plant factories with controlled environments (PFCE) that precisely regulate light and nutrients. Despite advancements in LED technology and nutrient optimization, the interaction between these factors in strawberry plants grown under PFCE conditions remains unclear.
In Thailand, strawberries are highly valued and are primarily grown in the cool mountainous regions of Chiang Mai and Chiang Rai, areas suitable for floral differentiation owing to cool temperatures at some times of the year [5]. The ‘Praratchatan 80’ cultivar, developed to suit local conditions, is notable for its disease resistance, large, sweet fruit, and popularity among fresh fruit consumers. This cultivar was obtained from a four-year breeding program using the Japanese Royal Queen cultivar developed by the Thai Royal Project Foundation [6].
Year-round strawberry cultivation in Thailand requires controlled-environment horticultural systems like plant factories for off-season urban production. These systems ensure a consistent supply, minimize logistical challenges, and reduce post-harvest losses caused by long-distance transport. Plant factories produce high-quality, pest- and disease-free strawberries that appeal to consumers and command premium prices. Controlled environments extend the growing season, increase yield and quality, and enable multiple annual harvests. Additionally, plant factories reduce the need for pesticides and herbicides, resulting in cleaner, safer produce that aligns with organic and sustainable practices. Urban plant factories optimize land use through vertical farming, addressing land scarcity and cutting transportation costs to markets and consumption centers. They also allow for the cultivation of special strawberry varieties that are unsuitable for conventional farming due to their susceptibility to disease or harsh weather conditions. These innovations position Thailand as a leader in sustainable, high-tech fruit production.
Light energy is essential for photosynthesis and is often supplied artificially during controlled crop production, unlike sunlight in conventional cultivation. LEDs offer advantages over traditional light sources, including small size, long lifespan, high photoelectric conversion efficiency, and adjustable light spectrum for plant growth [7]. LED lighting enhances photosynthesis, vegetative development, seed germination, and chlorophyll content of plants in controlled environments [8]. High-irradiance LED supplemental lighting is effective for high-yield strawberry cultivation, promoting growth and increasing fruit weight, number, and marketable yield [9]. Red-to-blue LED ratios are said to affect plant growth, with 20-30% blue light optimizing photosynthesis, whereas high blue light proportions can inhibit growth and reduce biomass [10,11,12,13,14]. Therefore, uncovering the optimum combination ratio of these two LED spectra can be game-changing in controlled environment strawberry cultivation.
Nitrogen is the most critical plant nutrient and is essential throughout the plant lifecycle from germination to senescence [15]. It also positively affects vegetative and reproductive traits of strawberry plants [16,17,18]. Different strawberry cultivars respond differently to different nitrogen levels, with some responding better to higher doses [17]. Nitrogen application increases plant height, number of leaves, canopy spread, flower and fruit number, yield, and total soluble solid (TSS) content [17,18]. The timing and amount of nitrogen application significantly influence growth, flowering time, and flower production [16,19]. However, excessive nitrogen application can lead to more vegetative growth at the expense of strawberry flowering and fruiting [20]. Thus, nitrogen optimization is key to resource-conscious and sustainable strawberry production.
While previous studies have explored the individual effects of LED spectra and nitrogen levels on strawberry growth, the interactive effects of these variables on the ‘Praratchatan 80’ cultivar, particularly in plant factory settings, have not been previously examined. Optimizing yield in controlled environment agriculture (CEA) is crucial. We hypothesized that the optimal combination of red and blue LED lights and nitrogen levels could improve the performance of strawberry under controlled environment systems. Thus, the current study investigated the combined effects of LED spectra and nitrogen levels on physiological changes and yield of strawberry in a plant factory setting. The results of this experiment will provide invaluable insights into the optimization of sustainable, controlled environment strawberry production through evidence-based allocation of light and nitrogen inputs. It will also provide empirical data that will support future research in this domain and aid the development of tailored LED systems specifically for strawberry cultivation.
2. Results
2.1. Growth Indices of Strawberry Plants
Number of Leaves, Plant Height, Crown Growth and Biomass Accumulation
The LED spectra significantly (p < 0.05) influenced the parameters evaluated (Table 1). Among the treatments, L3 had the highest number of leaves (x̄ = 29.85), plant height (x̄ = 44.00 cm), and crowns per plant (x̄ = 3.55). Conversely, L1 exhibited the lowest values for these parameters, particularly the number of leaves (x̄ = 17.20) and plant height (x̄ = 37.56 cm).
Nitrogen levels significantly affected the number of leaves and plant height (p < 0.05), whereas their effects on crowns per plant were not statistically significant (Table 2). Plants supplied with 200 mg/L nitrogen (N2) exhibited a greater number of leaves (x̄ = 24.13) and greater height (x̄ = 41.80 cm) than those treated with 100 mg/L nitrogen (N1).
Significant (p < 0.05) interactions between LED spectra and nitrogen levels were also observed (Figure 1). Notably, the combination of L3 and N2 yielded the highest number of leaves (x̄ = 32.70), plant height (x̄ = 45.14 cm), and number of crowns per plant (x̄ = 3.70). In contrast, the L1*N2 combination resulted in the lowest number of leaves (x̄ = 15.80) and crowns per plant (x̄ = 2.30).
The LED spectra significantly (p < 0.05) influenced both the total fresh and dry weights of strawberry plants (Table 1). Among the treatments, L2 yielded the highest fresh weight (x̄ = 241.50 g) and dry weight (x̄ = 48.40 g), followed by L3, which exhibited average weights of 206.93 g and 41.45 g for fresh and dry weight, respectively. The L1 treatment resulted in the lowest biomass production, with mean fresh and dry weights of 129.40 g and 25.88 g, respectively.
Nitrogen levels also significantly (p < 0.05) affected biomass accumulation (Table 1). Plants subjected to 200 mg/L nitrogen demonstrated greater fresh weight (x̄ = 200.51 g) and dry weight (x̄ = 40.11 g) than those exposed to 100 mg/L nitrogen, with mean fresh and dry weights of 184.76 g and 37.05 g, respectively.
Moreover, significant (p < 0.05) interactions between LED spectra and nitrogen levels were observed for both fresh and dry weights (Table 1). The combination of L2 and N2 produced the highest biomass, with fresh weight attaining a mean of 261.80 g and dry weight of 52.40 g. However, the L1*N1 interaction resulted in the lowest biomass production, with fresh and dry weights of 127.56 g and 25.45 g, respectively.
2.2. Physiological Responses of Strawberry to LED Color Combinations and Nitrogen Levels
2.2.1. Leaf Chlorophyll Index
The LED spectral combinations and nitrogen levels exhibited no significant (p < 0.05) differences in the SPAD readings. However, significant (p < 0.05) interactions between the LED spectra and nitrogen levels were observed for SPAD. The SPAD value was highest in L3*N1 (x̄ = 47.23) and at par with other combinations, indicating slight variations in chlorophyll content across treatments.
2.2.2. Leaf Gas Exchange Attributes
Table 2 shows that LED spectral combinations significantly (p < 0.05) affected all measured photosynthesis parameters, including the net photosynthetic or carbon assimilation rate (Pn), transpiration rate (E), stomatal conductance (Gs), and intercellular CO₂ concentration (Ci). The highest Pn (x̄ = 4.9579 µmol m⁻² s⁻¹) and E (x̄ = 1.5007 mol m⁻² s⁻¹) occurred under the L3 treatment, while the highest Ci (x̄ = 251.74 µmol mol⁻¹) was recorded in the L2 treatment. The L1 treatment resulted in the lowest Ci (x̄ = 232.89 µmol mol⁻¹) and Pn (x̄ = 2.6086 µmol m⁻² s⁻¹), indicating suboptimal performance compared to other spectral combinations.
Nitrogen levels significantly (p < 0.05) affected only Ci, with higher values in plants treated with 200 mg/L nitrogen (x̄ = 246.46 µmol mol⁻¹) compared to 100 mg/L (x̄ = 238.49 µmol mol⁻¹). No significant (p < 0.05) differences in Pn, E, or Gs were found among the nitrogen treatments (Table 2).
Significant (p < 0.05) interactions between LED spectra and nitrogen levels were observed for Pn, E, and Gs (Table 3). The L3 and N1 combinations yielded the highest Pn (x̄ = 6.2971 µmol m⁻² s⁻¹) and E (x̄ = 1.6914 mol m⁻² s⁻¹), while the L2*N1 combination resulted in the lowest E (x̄ = 0.9929 mol m⁻² s⁻¹).
2.3. Flower and Fruit Quality Characteristics
2.3.1. Flowering Characteristics
LED spectral combinations significantly (p < 0.05) influenced all flowering attributes of strawberry plants, including days to first bloom, inflorescences per plant, flowers per plant, and florets per inflorescence (Table 3). The L3 treatment led to the shortest time to the first bloom (x̄ = 38.90 days), while L2 resulted in the longest (41.45 days). L1 produced the most inflorescences (x̄ = 2.20) and flowers per plant (x̄ = 17.35), whereas L2 and L3 had fewer inflorescences (x̄ = 1.60 and 1.55, respectively). The highest number of florets per inflorescence (x̄ = 10.95) was found in L2, and the lowest (x̄ = 8.23) occurred in L1.
Nitrogen levels significantly (p < 0.05) affected the days to first bloom and florets per inflorescence but not inflorescences and flowers per plant (Table 3). Plants receiving 100 mg/L nitrogen bloomed earlier (x̄ = 37.40 days) than those given 200 mg/L (x̄ = 42.70 days). N1 resulted in more florets per inflorescence (x̄ = 10.58) than N2 (x̄ = 8.59).
Significant (p < 0.05) interactions between LED spectra and nitrogen levels were observed for all flowering attributes (Table 3). The L2 and N1 combination led to the shortest time to bloom (x̄ = 34.70 days) and the highest number of florets per inflorescence (x̄ = 12.85). Conversely, the L2*N2 combination delayed blooming the most (x̄ = 48.20 days). The L1*N2 combination resulted in the highest number of flowers per plant (x̄ = 20.90), whereas the L3*N2 combination produced the lowest (x̄ = 10.60).
2.3.2. Fruiting Characteristics
The LED spectral combinations significantly (p < 0.05) influenced all measured fruit attributes, including fruit number, weight, dimensions, shape index, total soluble solids (TSS), and firmness (Table 4).
Plants exposed to L2 produced the highest number of fruits per plant (x̄ = 9.40), whereas plants exposed to L1 and L3 yielded significantly fewer fruits (x̄ = 8.70). L2 and L3 equally improved the fruit yield by 71.28 g and 76.92 g, respectively, compared to L1. The largest fruits, as indicated by weight (x̄ = 8.52 g) and dimensions (length: 30.22 mm, width: 27.07 mm), were observed under L3. Conversely, the smallest fruits (x̄ = 5.57 g, 25.89 mm length, and 23.16 mm width) were associated with L1. The L3 treatment resulted in the highest TSS (x̄ = 8.84 °Brix) and moderate firmness (4.55 N). In contrast, L1 fruits exhibited the highest firmness (x̄ = 4.62 N) but the lowest TSS content (x̄ = 6.93 °Brix). The shape index (x̄ = 1.13) was consistent across L1 and L3, but slightly lower in L2 (x̄ = 0.98).
Nitrogen levels significantly (p < 0.05) affected strawberry fruiting traits (Table 4). Plants that received 100 mg/L nitrogen produced more fruits per plant (x̄ = 10.80) and higher fruit yield (x̄ = 83.46 g) with greater weight (x̄ = 7.55 g) and dimensions (length: 28.85 mm, width: 27.30 mm) than those treated with 200 mg/L nitrogen (x̄ = 7.07 fruits per plant, 6.89 g, 25.13 mm, and 23.47 mm, respectively). Additionally, fruits from N1 plants demonstrated higher TSS (x̄ = 8.14 °Brix) and firmness (x̄ = 4.68 N) than those from N2 plants (x̄ = 7.30 °Brix, 4.14 N).
Furthermore, significant (p < 0.05) interactions between LED spectra and nitrogen levels were observed for all fruit traits (Table 4). The L3*N1 combination resulted in the highest fruit yield (x̄ = 11.80 fruits per plant), yield per plant (x̄ = 110.62 g), and single fruit weight (Figure 2), whereas the L2*N2 combination produced the fewest fruits (x̄ = 7.20) with the smallest size (x̄ = 21.58 mm length and 22.37 mm width). Moreover, the L3*N1 treatment achieved the highest TSS (x̄ = 9.11 °Brix, Figure 2), whereas the L2*N2 treatment yielded the lowest (x̄ = 6.58 °Brix). Firmness was highest under L2-N1 (x̄ = 4.87 N) and lowest under L2*N2 (x̄ = 3.26 N).
2.4. Leaf Nutrient Contents
Total Nitrogen and Potassium Concentrations
The LED spectral combinations significantly (p < 0.05) influenced the total leaf nitrogen (%) and potassium (%) concentrations in the leaves and roots of ‘Praratchatan 80” strawberry plants (Table 5).
The highest leaf nitrogen concentration (x̄ = 2.79%) was recorded in L1, followed by L2 (x̄ = 2.72%) and L3 (x̄ =2.53%). As for total potassium, L2 and L3 produced the highest potassium concentrations (x̄ = 2.73% and 2.70%, respectively), whereas L1 had a significantly lower concentration (x̄ = 2.53%).
Nitrogen levels significantly (p < 0.05) affected both nitrogen and potassium concentrations (Table 5). Strawberry plants treated with 100 mg/L nitrogen had higher total nitrogen (x̄ = 2.76%) and potassium (x̄ = 2.76%) concentrations than those treated with 200 mg/L nitrogen (x̄ =2.60% and 2.54%, respectively).
The interaction between the LED spectra and nitrogen levels significantly (p < 0.05) influenced the total nitrogen concentration (Table 5), while the interaction effect was not significant for the total potassium concentration. The L1*N1 and L2*N1 combinations resulted in the highest nitrogen concentrations (x̄ = 2.83%), whereas the L3*N2 combination yielded the lowest concentration (x̄ = 2.45%). Although not statistically significant, the highest potassium concentration (x̄ = 2.91%) was observed under L2*N1 and the lowest (x̄ = 2.40%) was recorded for L1*N2.
3. Discussion
This investigation examined the interactive effects of three blue (400 – 500nm) and red (600 – 700 nm) LED spectra (ratios of 1:3, 1:4, and 1:6) and two nitrogen levels (100 and 200 mg/L) on the growth, photosynthesis, flowering, fruiting, and nutrient dynamics of strawberry cv. ‘Praratchatan 80’ cultivated in a plant factory. The findings demonstrate that LED light quality and nitrogen levels independently and synergistically (Figure 3) influence strawberry performance, elucidating the potential to optimize these variables for high-quality, sustainable strawberry production. The study’s results provide valuable insights for developing precise management strategies in plant factories, potentially leading to more efficient and sustainable strawberry cultivation systems.
3.1. Growth Performance of Strawberry Plants
The combination of a 1:6 blue-to-red LED light ratio with 200 mg/L nitrogen yielded the most substantial vegetative growth, as evidenced by increased plant height, leaf number, and crown count. These findings corroborate previous studies that reported that red light promotes elongation and biomass accumulation, whereas blue light regulates leaf development and chloroplast structure [11,12].
The 1:4 blue-to-red LED ratio resulted in the highest fresh and dry biomasses, emphasizing the significance of red light in facilitating photosynthesis and energy storage. Red light enhances the activity of photosystem II and ATP synthesis, whereas blue light improves the chloroplast structure, creating a complementary effect [21,22]. These results are due to the fact that red and blue light spectra are crucial for photosynthesis, which directly influences plant growth and biomass production. Studies have shown that a combination of red and blue light (e.g., a 4:1 ratio) significantly increases biomass and nutrient accumulation in plants like lettuce [23,24,25]. Specifically, red light enhances photosynthetic efficiency and biomass accumulation, while blue light supports stomatal development and photosynthetic performance [13,25]. The combination of red and blue light also improves the uptake of essential nutrients such as nitrogen, phosphorus, potassium, calcium, and magnesium, which are vital for plant growth and development 2 4 6 [24,25,26].
Nitrogen supplementation further augmented biomass accumulation at a dose of 200 mg/L, yielding results superior to 100 mg/L. However, this occurred at the expense of reproductive traits, consistent with the findings of Andriolo, Erpen [20], who observed that excessive nitrogen directs resources towards vegetative structures.
The observed enhancement in vegetative growth under higher nitrogen levels aligns with established research demonstrating that nitrogen promotes vegetative parameters such as leaf number and plant height by increasing the chlorophyll content and enzymatic activity for photosynthesis [27]. Nitrogen is a critical nutrient that supports various physiological processes, including protein synthesis and chlorophyll production. High nitrogen levels have been shown to increase plant growth and yield significantly. For instance, increasing nitrogen supply through foliar application resulted in a 38% increase in lettuce yield [28]. However, excessive Nitrogen may favor vegetative growth over reproductive growth, as observed in the present study. This phenomenon likely arises because high nitrogen availability stimulates cytokinin synthesis and promotes cell division and expansion but delays the transition to reproductive stages [29].
Synergistic effects of LED spectral combinations and nitrogen levels exist. In this research, combining blue and red LED ratio 1:6 with 100 mg/L nitrogen promoted growth. However, when the LED ratio was reduced to 1:4 and the nitrogen to 200 mg/L, strawberry plant biomass was increased by 21.5% and 21.3% fresh and dry weights, respectively. Thus, when combined with optimal LED light spectra, high nitrogen levels further enhance plant growth. It was previously reported in multiple studies on lettuce that a combination of red and blue light with high nitrogen levels leads to higher biomass production [24,26,28]. This synergy can be explained by the physiological, biochemical and molecular processes enhanced by both blue and red LED and nitrogen. Red and blue light significantly enhance photosynthetic efficiency and plant growth. Red light promotes shoot growth and leaf area, while blue light enhances root development and stomatal conductance, which improves water and nutrient uptake [30,31,32,33,34,35]. This combination leads to increased biomass. Red and blue light increase chlorophyll content, which is crucial for photosynthesis. This results in higher photosynthetic rates and better growth [22,30,32,36]. The combination of red and blue light upregulates genes related to photosynthesis, carbon and nitrogen metabolism, and secondary metabolite biosynthesis. This includes genes involved in chlorophyll synthesis, photosystem components, and enzymes for nitrogen assimilation [30,32,36,37]. Specific transcription factors such as MYB, bHLH, and WRKY are activated under red and blue light, which regulate various growth and stress response pathways [30,32,38]. Also, high nitrogen availability enhances the effects of red and blue light by increasing the activity of nitrogen assimilation enzymes. This leads to higher nitrogen uptake and incorporation into amino acids and proteins, which are essential for growth [31,32,33,36]. Thus, the combination of high red-to-blue LED spectra and high nitrogen levels synergistically enhances plant growth by improving photosynthesis, nutrient uptake through complex physiological, molecular, and biochemical processes.
3.2. Photosynthesis
However, strawberry plants exposed to a 1:6 blue-to-red ratio exhibited the highest photosynthetic and transpiration rates despite demonstration lower biomass accumulation. This might be due enhanced sinking of metabolites to fruit zone, hence the fruits under this treatment were the heaviest. Red light drives photosynthesis by stimulating carbon fixation, whereas blue light enhances stomatal conductance, chloroplast orientation and photomorphogenesis, thereby improving gas exchange [11,39]. The combination of red and blue light has been shown to significantly increase photosynthetic efficiency in various plants, including strawberry [22,40,41,42]. The red/blue LED combination also positively affects gas exchange parameters such as stomatal conductance, transpiration rate, and internal CO₂ concentration. This combination enhances water-use efficiency and overall photosynthetic performance, which are critical for optimal plant growth under controlled environments [42,43,44].
The interaction of 100 mg/L nitrogen with a 1:6 blue-to-red LED ratio was particularly efficacious, suggesting that 100 mg/L equated to the optimal nitrogen level for strawberry and augmented the benefits of light quality on the photosynthetic efficiency. Elevated nitrogen levels may promote Calvin cycle enzyme activity and reduce photorespiratory losses, further enhancing net photosynthesis [45]. Nitrogen is significant in influencing chlorophyll content and photosynthesis. Optimal nitrogen levels enhance plant health and efficiency by improving photosynthetic rates and overall plant performance [46,47]. Optimal nitrogen application also complements the effects of red and blue light by improving the biochemical capacity of photosynthesis, being a key component of chlorophyll and other photosynthetic proteins. Thus, its adequate supply ensures efficient photosynthesis [48]. Studies have shown that red and blue light spectra are particularly effective in promoting nitrogen absorption, which in turn boosts plant growth and photosynthetic rates [28,49,50,51]. Red and blue light also influence the expression of genes related to photosynthesis. For instance, genes involved in light reactions, plant hormone signal transduction, and carbohydrate metabolism are differentially expressed under these light conditions [52]. Plants use photoreceptors to perceive red and blue light, which then trigger signaling pathways that regulate photosynthetic activity and growth. The phytochrome A (phyA) photoreceptor, for example, plays a significant role in these processes, as seen in tomato plants [39]. There is, therefore, a mutualistic relationship between LED light spectra and nitrogen that leads to their synergistic effects on photosynthesis. The red-to-blue LED combination, particularly the 1:6 ratio, enhances photosynthetic efficiency by combining red light’s stimulation of carbon fixation with blue light’s promotion of stomatal conductance and photomorphogenesis. Simultaneously, optimum nitrogen increases chlorophyll synthesis and Calvin cycle enzyme activity, amplifying the benefits of LED spectra.
3.3. Flowering and Fruiting Characteristics
A blue-to-red LED ratio of 1:6 accelerated flowering but reduced the number of inflorescences and florets. The 1:6 blue-to-red LED ratio and 100 mg/L nitrogen concentration resulted in the heaviest fruits and total soluble solids, emphasizing the significance of red light in enhancing sugar synthesis and nutrient allocation to fruits [22]. These findings are consistent with those of Liu, Lian [53], who demonstrated that red light improved the fruit size and quality of strawberry plants. Lower nitrogen levels promote fruiting by ensuring that resources are allocated to reproductive structures rather than vegetative growth.
These findings contrast with those of Kadowaki, Yano [54], who reported that blue light alone accelerated flowering. A higher proportion of blue light has been found to enhance early flowering in various plants. For instance, a 1:3 red-to-blue light ratio promoted early flowering in hippeastrum and blueberries [55,56]. The synergistic combination of blue and red light likely enhances both photoperiodic signaling and carbohydrate availability, which are crucial for flower bud differentiation and development [57]. Specific light spectra can induce the expression of flowering genes such as FT, which promotes earlier flowering and better fruit sets [58,59]. This is crucial for optimizing the timing of flowering and fruiting in horticultural plants. Optimal light conditions can also influence nutrient uptake. For instance, red and blue light treatments have been shown to increase the absorption of essential nutrients such as nitrogen, potassium, magnesium, and iron, which are vital for plant growth and development [60,61,62].
The application of 100 mg/L nitrogen enhanced flowering attributes, presumably by balancing vegetative and reproductive demands. High nitrogen levels (200 mg/L) may delay flowering owing to increased vegetative growth, which is consistent with the observations of Iatrou and Papadopoulos [29]. There is an optimal concentration of nitrogen that facilitates flowering. Nitrogen significantly influences flowering time in plants through complex interactions with various factors such as nutrients, the circadian clock, photosynthesis, and hormones. The relationship between nitrogen levels and flowering time is intricate and can vary depending on the concentration of nitrogen available. Low nitrogen generally promotes early flowering. This is supported by findings in Arabidopsis thaliana, where low nitrogen conditions were shown to promote early flowering [63]. However, high nitrogen levels have been observed to delay the first flowering day in various species, including rice and alpine meadow plants [64,65,66]. Similar to high nitrogen, nitrogen starvation can also delay flowering [63]. Thus, low and high nitrogen levels are not suitable for optimum flowering time, which exhibits a U-shaped response to nitrogen (especially nitrate) availability, with optimal concentrations facilitating flowering, while concentrations above or below this optimal range delay it [67]. Genes and pathways, including nitrate-responsive elements and transcription factors like NLP7 and NLP6, regulate nitrogen-mediated flowering control [68,69]. However, different plant species exhibit varying flowering responses to nitrogen addition. For example, graminoid species tend to delay flowering with nitrogen addition, while some forb species may advance their flowering time [64,70].
More so, nitrogen is essential for fruit development, influencing size, quality, and yield. Adequate nitrogen levels improve leaf development, photosynthetic capacity, and the formation of sugars and carbohydrates necessary for fruit growth [67,68]. Nitrogen also affects fruit size, color, sugar content, and acidity [18,71,72]. Optimal nitrogen levels improve fruit sweetness, firmness, and overall nutritional value, while both deficiency and excess can negatively impact these characteristics [18,71,72]. However, excessive nitrogen can lead to reduced fruit firmness and increased susceptibility to diseases [71,73]. Thus, nitrogen’s vital role in photosynthesis [18,74,75], leaf and root development[71,75], carbohydrate and protein metabolism [74,76], secondary metabolite biosynthesis[77,78], and regulating enzymes like NR, NiR, and GS involved in nitrogen assimilation [74,75], enhancing fruit yield and quality.
There is, therefore, mutualism and complementarity between blue and red LED spectral combination and nitrogen levels in optimizing flowering and fruit yield in strawberry plants. A 1:6 blue-to-red LED ratio, in conjunction with 100 mg/L nitrogen, enhances flowering time, producing the heaviest fruits with the highest total soluble solids due to red light’s role in sugar synthesis and nutrient allocation [22,53]. While blue light accelerates flowering via photoperiodic signaling and carbohydrate availability [55,57], red light synergizes by enhancing nutrient uptake and flowering gene expression [58,59,60,61,62]. Optimal nitrogen levels balance vegetative and reproductive growth, with 100 mg/L nitrogen facilitating flowering and fruit development, whereas higher levels delay flowering by promoting vegetative growth [29,63,64,65,66,67]. Nitrogen also enhances fruit quality by improving photosynthesis, sugar metabolism, and secondary metabolite synthesis, which are all crucial for yield and quality [49,71,72,74,75,76,78].
3.4. Nutrient Concentrations
Our findings indicate that the highest leaf nitrogen concentration was observed under the 1:3 LED ratio, whereas the combination of 100 mg/L nitrogen and a 1:6 ratio yielded the lowest concentration. This suggests that red light enhances nitrogen utilization by promoting biomass accumulation and reducing leaf nitrogen concentrations. Additionally, nitrogen assimilation is enhanced by blue light, which stimulates nitrate reductase activity and facilitates efficient nitrate-to-ammonium conversion for protein synthesis [79].
Potassium concentration increased with a higher red-light ratio, demonstrating its essential role in photosynthesis and enzyme activation. Red light facilitates stomatal conductance and carbohydrate metabolism, thereby indirectly increasing potassium demand [80]. Lower nitrogen levels (100 mg/L) resulted in higher leaf potassium concentrations than higher nitrogen levels (200 mg/L), likely because of the antagonistic relationship between nitrogen and potassium uptake in plants.
The observed synergy between low nitrogen levels and potassium suggests a prioritization mechanism wherein potassium supports osmotic balance and photosynthetic efficiency under nitrogen-limited conditions. The combined blue and red LED light spectrum enhances the absorption of essential nutrients, including nitrogen and potassium, leading to improved plant health and yield [49].
Nitrogen metabolism is enhanced by blue light exposure, which stimulates the activity and gene expression of crucial nitrogen-related enzymes [33,81,82]. Consequently, plants experience increased nitrogen assimilation and improved overall nitrogen content. In contrast, red light alone tends to reduce the total nitrogen content and activities of nitrogen-metabolizing enzymes compared to blue light or a combination of red and blue light [81,82]. Therefore, the combination of red and blue light significantly enhances nitrogen assimilation and enzyme activity, thereby promoting nitrogen absorption and conversion into soluble proteins [81,82].
While the specific effects of blue and red light on potassium concentration are less directly discussed in the available literature, it has been noted that optimal light quality, including the right balance of red and blue light, can enhance overall nutrient uptake, including potassium [83]. This indicates that the light quality plays a crucial role in nutrient absorption.
In the present study, higher nitrogen application (200 mg/L) reduced both nitrogen and potassium concentrations in the leaves. This is contrary to the previous finding that higher nitrogen levels generally increase the nitrogen content in plants. For instance, higher nitrogen rates (e.g., 10 mM N) combined with blue light significantly increased shoot nitrogen concentration and nitrogen nutrition index [33,84]. The interaction between light quality and nitrogen supply modulates dry mass and nitrogen allocation between shoots and roots. Blue light, especially under high nitrogen conditions, enhances nitrogen metabolism and allocation to shoots [33,84]. Higher nitrogen levels (200 mg/L) might lead to a different allocation pattern within the plant. Nitrogen could be more evenly distributed or stored in other plant parts rather than being concentrated in the leaves.
Adjusting nitrogen levels in conjunction with optimal light spectra can maximize nutrient concentrations and plant growth. Higher nitrogen levels combined with blue light or a balanced red-blue light ratio are particularly effective [33,84].
The interaction of blue and red LED ratios with nitrogen levels significantly influenced the nutrient concentrations in plants. Blue light enhances nitrogen metabolism, whereas a combination of red and blue light optimizes nitrogen assimilation and overall nutrient uptake. A combination of blue and red LEDs in a ratio of 1:4 coupled with 100 mg/L nitrogen enhanced nitrogen and potassium concentrations in strawberry leaves. Thus, adjusting both the light quality and nitrogen levels can maximize strawberry growth and nutrient concentrations, particularly those of nitrogen and potassium.
4. Materials and Methods
4.1. Experimental Design and Setup
4.1.1. Treatments
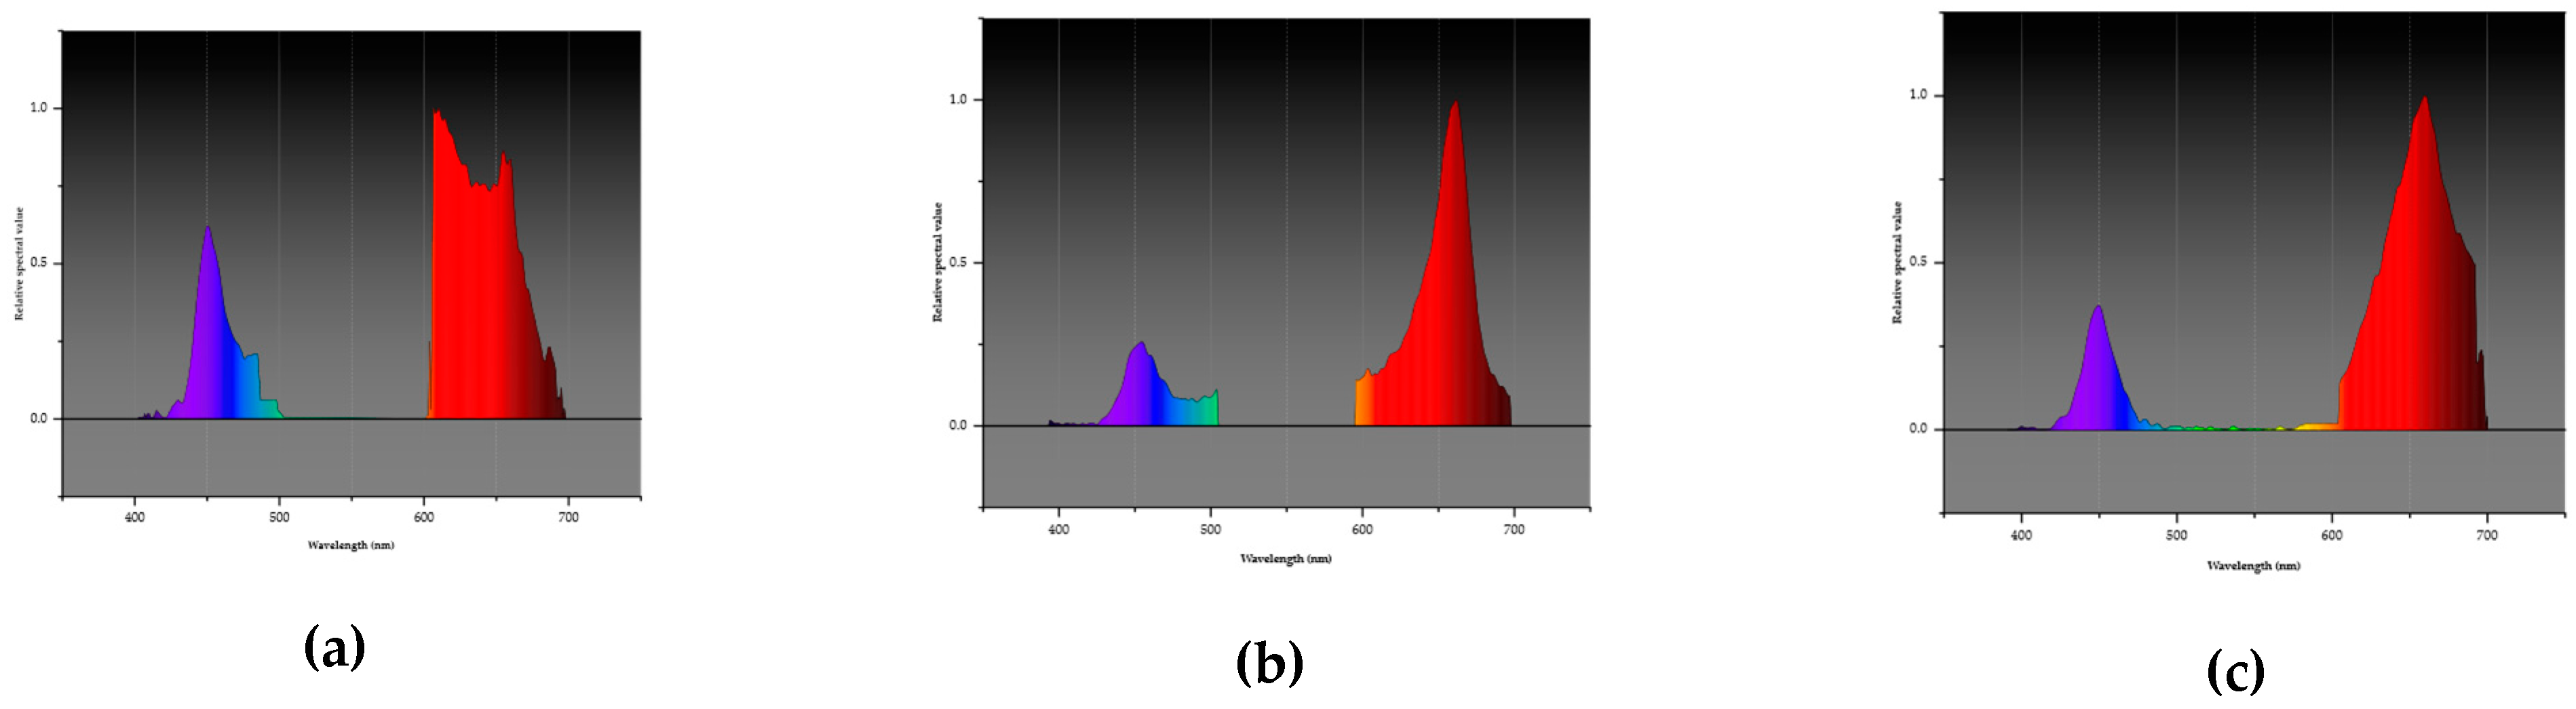
The experiment was conducted at the King’s Initiative Centre for Flower and Fruit Propagation, Chiang Mai, Thailand (18 ° 42’ 50.148″” N, 98 ° 55’ 15.06''″ E) between 15 November 2023 and 15 February 2024. The trial followed a 3 × 2 factorial design in a completely randomized layout, with ten (10) replications (plants) per treatment. The LED spectra factor comprised three ratios of blue (B; 400 – 500 nm) and red (R; 600 – 700 nm) spectra: L1, B:R (1:3), L2, B:R (1:4), and L3, B:R (1:6). The nitrogen (N) factor consisted of two levels of 100 and 200 mg/L N (Table 6), initially applied in 50 ml and gradually increased to 250 ml nutrient solution per plant per day, with all other essential nutrients supplied equally. The nutrient solution was maintained at a pH of 6.00 and an EC of 1.5 dS/m. The experiment, focusing on flowering and fruiting, subjected the plants to nine hours of LED treatments daily throughout their growth period to induce a short-day condition.
4.1.2. Plant Growth Conditions
Strawberry cv. ‘Praratchatan 80’ daughter, plants of the same age and size (at the three-leaf stage), were sourced from the Strawberry Multiplication Unit, Mae Hia Agricultural Training and Research Centre, Chiang Mai University. They were immediately moved to a cold chamber for vernalization at 5°C for 14 days, as recommended by Thammasophon, Pusadee [6]. The plants were later transplanted into 7-inch plastic pots containing peat moss, perlite, and rice husks at a ratio of 2:1:0.5 and moved into the plant factory. Strawberry plants were cultivated under the following conditions: temperature, 25 ± 2°C; relative humidity (RH) = 70-80%; carbon dioxide (CO2) concentration = 700-1000 ppm, and photosynthetic photon flux density (PPFD), ≈ 275 µmol m-2 s-1. In addition, all the emerging stolons were promptly removed.
Figure 4.
LED spectrum graphs displaying wavelengths corresponding to blue (B; 400 – 500 nm) and red (R; 600 – 700 nm) LED combinations used in the experiment. a: L1 combination of blue and red light at a ratio of 1:3 (25% blue, 75% red); b: L2, a combination at a ratio of 1:4 blue and red (20% blue and 80% red); and c: L3 combination of blue and red colors at a ratio of 1:6 (14% blue, 86% red).
4.2. Growth, Yield, and Gas Exchange Determination
Growth, flowering, and yield metrics, such as fruit count per plant, fresh fruit mass, total soluble solids (TSS) measured with a PAL-1® refractometer (Atago, Japan), and plant fresh and dry weights at harvest, were documented. The net photosynthetic rate (Pn), stomatal conductance (Gs), leaf transpiration rate (E) via the LCPro-SD® portable photosynthesis system, and leaf SPAD values were recorded using a Minolta ® SPAD-502 chlorophyll meter.
4.3. Nitrogen and Potassium Determination
The total nitrogen (%) and potassium (%) concentrations in strawberry leaf tissues were determined at the Soil Science Laboratory, Department of Plant and Soil Sciences, Faculty of Agriculture, Chiang Mai University, Thailand. Nitrogen concentration was determined using Duma’s combustion procedures, as modernized by the Association of Official Analytical Chemists (AOAC) [85]. Total potassium was analyzed by atomic absorption spectrophotometry (AAS) as described by Mizukoshi, Nishiwaki [86].
4.4. Statistical Analyses
The collected data were analyzed using ANOVA, utilizing SciPy 1.0 [87] and supplementary libraries within the Python programming environment. Fisher’s Least Significant Difference (LSD) test was applied to identify significant differences among the treatment means at a 95% confidence level.
5. Conclusions
The present study investigated the interactive effects of LED spectra and nitrogen levels on physiological changes and yield of ‘Praratchatan 80’ strawberry under plant factory conditions. Findings from the study demonstrated that optimizing blue-to-red LED ratios and nitrogen levels can significantly enhance strawberry growth, photosynthesis, fruiting, and leaf nutrient concentrations. The findings indicated that a 1:6 blue-to-red LED ratio, in conjunction with 100 mg/L nitrogen, achieves an optimal balance between vegetative and reproductive growth, thereby maximizing fruit yield and quality. For controlled environment agriculture, these insights provide empirical information for refining LED light and nitrogen conditions to achieve sustainable, high-quality strawberry production. Further research is warranted to elucidate the molecular mechanisms underlying light-nutrient interactions and to investigate their applicability across diverse strawberry cultivars and environmental conditions.
Author Contributions
Conceptualization, SR, TS, NO and KP; methodology, SR, CI, and KP; software, SSJ; validation, SR, CI, and KP; formal analysis, TS, KP and SSJ; investigation, SSJ; resources, SR; data curation, SSJ; writing—original draft preparation, SSJ; writing—review and editing, SR, CI, NO, TS and KP; visualization, SSJ; supervision, SR, CI and KP; project administration, SR; funding acquisition, SR. All the authors have read and agreed to the published version of the manuscript.
Funding
This research received no external funding.
Data Availability Statement
All data upon which the conclusions of this study are based will be made available upon request. Requests should be directed to the corresponding author.
Acknowledgments
We acknowledge and thank Chiang Mai University for sponsoring the first author to study for a PhD. Horticulture, under the CMU Presidential Scholarship at the Faculty of Agriculture, Chiang Mai University, Chiang Mai, 50200, Thailand. We also acknowledge the support provided by the H. M. The King’s Initiative Centre for Flower and Fruit Propagation, Ban Rai, Chiang Mai, for making facilities and personnel available to support this experiment. Finally, we are thankful to Mr. Chockchai Thanamatee and his team for their engineering work and consistent support throughout the experiment.
Conflicts of Interest
The authors declare no conflict of interest.
References
- FAO, FAOSTAT, in Crops and livestock products. 2023, FAO. https://www.fao.org/faostat/en/#data/QCL.
- Cianciosi, D.; et al. The preventive effect of strawberries against the onset of common human diseases induced by oxidative stress. Acta Horticulturae 2021, 1309, 917–924. [Google Scholar] [CrossRef]
- Taesuwan, S.; et al. Unexplored Opportunities of Utilizing Food Waste in Food Product Development for Cardiovascular Health. Current Nutrition Reports 2024, 13, 896–913. [Google Scholar] [CrossRef] [PubMed]
- Oviedo-Solís, C.I.; et al. Strawberry polyphenols reduce oxidative stress in chronic diseases. Gaceta Medica de Mexico 2018, 154, 80–86. [Google Scholar] [CrossRef] [PubMed]
- Pipattanawong, N. Strawberry Production and the Royal Project Foundation, Thailand. Journal of Developments in Sustainable Agriculture 2015, 10, 15–18. https://doi.org/https://www.jstage.jst.go.jp/article/jdsa/10/1/10_15/_article/-char/ja/.
- Thammasophon, T.; et al. Effects of Vernalization on Off–Season Flowering and Gene Expression in Sub-Tropical Strawberry cv. Pharachatan 80. Horticulturae 2023, 9, 87. [Google Scholar] [CrossRef]
- Bian, Z.; et al. Uncovering LED light effects on plant growth: New angles and perspectives – LED light for improving plant growth, nutrition and energy-use efficiency. Acta Horticulturae 2018, 1227, 491–498. [Google Scholar] [CrossRef]
- Simatupang, H.K. , et al. Investigating the response of green and red spinach microgreen yield and chlorophyll content in varied light-emitting diode and plant nutrients. in IOP Conference Series: Earth and Environmental Science. 2023. Institute of Physics. [CrossRef]
- Hidaka, K.; et al. Effect of supplemental lighting from different light sources on growth and yield of strawberry. Environmental Control in Biology 2013, 51, 41–47. [Google Scholar] [CrossRef]
- Carotti, L. , et al. Growth analysis of lettuce seedlings adding green or far-red to an optimized red and blue LED light spectrum. in Acta Horticulturae. 2023. International Society for Horticultural Science. [CrossRef]
- Fraszczak, B. , The effect of different doses of blue light on the biometric traits and photosynthesis of dill plants. Notulae Botanicae Horti Agrobotanici Cluj-Napoca 2016, 44, 34–40. [Google Scholar] [CrossRef]
- Kang, W.H.; et al. Leaf photosynthetic rate, growth, and morphology of lettuce under different fractions of red, blue, and green light from light-emitting diodes (LEDs). Horticulture Environment and Biotechnology 2016, 57, 573–579. [Google Scholar] [CrossRef]
- Karimi, M.; Ahmadi, N.; Ebrahimi, M. Red LED light promotes biomass, flowering and secondary metabolites accumulation in hydroponically grown Hypericum perforatum L. (cv. Topas). Industrial Crops and Products. [CrossRef]
- Yudina, L.; et al. Ratio of Intensities of Blue and Red Light at Cultivation Influences Photosynthetic Light Reactions, Respiration, Growth, and Reflectance Indices in Lettuce. Biology 2022, 11. [Google Scholar] [CrossRef]
- Ruamrungsri, S.; et al. Nitrogen in Flowers. 2021: IntechOpen. https://www.intechopen.com/chapters/undefined/state.item.id.
- Hykkerud, A.L.; et al. Effect of nitrogen fertilization on flowering of strawberry (Fragaria × ananassa ‘Sonata’). Acta Horticulturae 2023, 1381, 271–275. [Google Scholar] [CrossRef]
- Katel, S.; et al. Assessing the impact of varied nitrogen dosages on the vegetative and reproductive parameters of ‘Sweet Sensation’ and ‘Rubygem’ strawberry in Morang, Nepal. Heliyon 2023, 9. [Google Scholar] [CrossRef] [PubMed]
- Marcellini, M.; et al. Growth and Yield of Strawberry Cultivars under Low Nitrogen Supply in Italy. Horticulturae 2023, 9. [Google Scholar] [CrossRef]
- Agehara, S. Characterizing early-season nitrogen fertilization rate effects on growth, yield, and quality of strawberry. Agronomy 2021, 11. [Google Scholar] [CrossRef]
- Andriolo, J.L.; et al. Nitrogen levels in the cultivation of strawberries in soilless culture. Horticultura Brasileira 2011, 29, 516–519. [Google Scholar] [CrossRef]
- Nguyen, T.A.H.; Do, T.K.; Bui, T.V. The Effects of Blue and Red Light on the Hill Reaction of isolated Chloroplasts, Photosynthesis and Saponin Accumulation in Fenugreek Leaves (Trigonella foenum-graecum L.). Research Journal of Biotechnology 2023, 18, 74–81. [Google Scholar] [CrossRef]
- Roosta, H.R.; Bikdeloo, M.; Ghorbanpour, M. The growth, nutrient uptake and fruit quality in four strawberry cultivars under different Spectra of LED supplemental light. BMC Plant Biology 2024, 24. [Google Scholar] [CrossRef]
- Shao, M.J.; et al. Effects of High Light Duration and Frequencies on Growth and Nutrient Element Contents of Hydroponic Lettuce Cultivated Under LED Red and Blue Light. Guang Pu Xue Yu Guang Pu Fen Xi/Spectroscopy and Spectral Analysis 2021, 41, 2853–2858. [Google Scholar] [CrossRef]
- Soufi, H.R.; et al. Spectral composition of LED light differentially affects biomass, photosynthesis, nutrient profile, and foliar nitrate accumulation of lettuce grown under various replacement methods of nutrient solution. Food Science and Nutrition 2023, 11, 8143–8162. [Google Scholar] [CrossRef]
- Bian, Z.H.; et al. Continuous light from red, blue, and green light-emitting diodes reduces nitrate content and enhances phytochemical concentrations and antioxidant capacity in lettuce. Journal of the American Society for Horticultural Science 2016, 141, 186–195. [Google Scholar] [CrossRef]
- Soufi, H.R.; et al. Manipulation of light spectrum is an effective tool to regulate biochemical traits and gene expression in lettuce under different replacement methods of nutrient solution. Scientific Reports 2023, 13. [Google Scholar] [CrossRef] [PubMed]
- Chandramohan Reddy, G.; Goyal, R.K. Growth, yield and quality of strawberry as affected by fertilizer N rate and biofertilizers inoculation under greenhouse conditions. Journal of Plant Nutrition 2020, 44, 46–58. [Google Scholar] [CrossRef]
- Anuar, N.; Ibrahim, N.; Awang, Y. Different combinations of light spectrum of LED and nitrogen affect the growth and yield of lettuce (Lactuca sativa). in Acta Horticulturae. 2017. International Society for Horticultural Science. [CrossRef]
- Iatrou, M.; Papadopoulos, A. Influence of nitrogen nutrition on yield and growth of an everbearing strawberry cultivar (cv. Evie II). Journal of Plant Nutrition 2016, 39, 1499–1505. [Google Scholar] [CrossRef]
- Dong, T.; et al. Integrated transcriptome and metabolome analysis reveals the physiological and molecular mechanisms of grape seedlings in response to red, green, blue, and white LED light qualities. Environmental and Experimental Botany 2023, 213. [Google Scholar] [CrossRef]
- Ren, M.; et al. Simultaneous Application of Red and Blue Light Regulate Carbon and Nitrogen Metabolism, Induces Antioxidant Defense System and Promote Growth in Rice Seedlings under Low Light Stress. International Journal of Molecular Sciences 2023, 24. [Google Scholar] [CrossRef]
- Li, Z.; et al. Analyses of the photosynthetic characteristics, chloroplast ultrastructure, and transcriptome of apple (Malus domestica) grown under red and blue lights. BMC Plant Biology 2021, 21. [Google Scholar] [CrossRef]
- Liang, Y.; et al. The Interaction Between Nitrogen Supply and Light Quality Modulates Plant Growth and Resource Allocation. Frontiers in Plant Science 2022, 13. [Google Scholar] [CrossRef]
- Clavijo-Herrera, J.; Van Santen, E.; Gómez, C. Growth, water-use efficiency, stomatal conductance, and nitrogen uptake of two lettuce cultivars grown under different percentages of blue and red light. Horticulturae 2018, 4. [Google Scholar] [CrossRef]
- Wang, J.; et al. Leaf morphology, photosynthetic performance, chlorophyll fluorescence, stomatal development of lettuce (Lactuca sativa L.) exposed to different ratios of red light to blue light. Frontiers in Plant Science 2016, 7. [Google Scholar] [CrossRef]
- Di, Q.; et al. Combination of Red and Blue Lights Improved the Growth and Development of Eggplant (Solanum melongena L.) Seedlings by Regulating Photosynthesis. Journal of Plant Growth Regulation 2021, 40, 1477–1492. [Google Scholar] [CrossRef]
- Li, P.; et al. Changes in Phytohormones and Transcriptomic Reprogramming in Strawberry Leaves under Different Light Qualities. International Journal of Molecular Sciences 2024, 25. [Google Scholar] [CrossRef] [PubMed]
- Zhang, T.; et al. Transcriptome and targeted metabolome analysis revealed the effects of combined red and blue light on the growth and secondary metabolism of Scutellaria baicalensis Georgi. Industrial Crops and Products 2022, 188. [Google Scholar] [CrossRef]
- Kharshiing, E.; Sinha, S.P. Deficiency in phytochrome A alters photosynthetic activity, leaf starch metabolism and shoot biomass production in tomato. Journal of Photochemistry and Photobiology B: Biology 2016, 165, 157–162. [Google Scholar] [CrossRef] [PubMed]
- Malekzadeh, M.R.; et al. Improving strawberry plant resilience to salinity and alkalinity through the use of diverse spectra of supplemental lighting. BMC Plant Biology 2024, 24. [Google Scholar] [CrossRef] [PubMed]
- Malekzadeh, M.R.; Roosta, H.R.; Kalaji, H.M. Enhancing strawberry resilience to saline, alkaline, and combined stresses with light spectra: impacts on growth, enzymatic activity, nutrient uptake, and osmotic regulation. BMC Plant Biology 2024, 24. [Google Scholar] [CrossRef]
- Pennisi, G.; et al. Resource use efficiency of indoor lettuce (Lactuca sativa L.) cultivation as affected by red:blue ratio provided by LED lighting. Scientific Reports, 2019; 9. [Google Scholar] [CrossRef]
- Avendaño-Abarca, V.H.; et al. Response of Strawberry to the Substitution of Blue Light by Green Light in an Indoor Vertical Farming System. Agronomy 2023, 13. [Google Scholar] [CrossRef]
- Tosti, G.; et al. Growing lettuce under multispectral light-emitting diodes lamps with adjustable light intensity. Italian Journal of Agronomy 2018, 13, 57–62. [Google Scholar] [CrossRef]
- Zhang, X.C.; Yu, X.F.; Ma, Y.F. Effect of nitrogen application and elevated CO2 on photosynthetic gas exchange and electron transport in wheat leaves. Photosynthetica 2013, 51, 593–602. [Google Scholar] [CrossRef]
- Koning, L.A.; et al. Effects of nitrogen and phosphate fertilization on leaf nutrient content, photosynthesis, and growth of the novel bioenergy crop Fallopia sachalinensis cv. ‘Igniscum Candy’. Journal of Applied Botany and Food Quality 2015, 88, 22–28. [Google Scholar] [CrossRef]
- Liao, Z.; et al. Effects of plant density, nitrogen rate and supplemental irrigation on photosynthesis, root growth, seed yield and water-nitrogen use efficiency of soybean under ridge-furrow plastic mulching. Agricultural Water Management 2022, 268. [Google Scholar] [CrossRef]
- García-López, J.V.; et al. Exploring through the use of physiological and isotopic techniques the potential of a PGPR-based biofertilizer to improve nitrogen fertilization practices efficiency in strawberry cultivation. Frontiers in Plant Science 2023, 14. [Google Scholar] [CrossRef] [PubMed]
- Liu, W.K.; Zhang, Y.B.; Zha, L.Y. Effect of LED Red and Blue Continuous Lighting before Harvest on Growth and Nutrient Absorption of Hydroponic Lettuce Cultivated under Different Nitrogen Forms and Light Qualities. Guang Pu Xue Yu Guang Pu Fen Xi/Spectroscopy and Spectral Analysis 2020, 40, 2215–2221. [Google Scholar] [CrossRef]
- Fan, L.; et al. Removal of Nitrogen and Phosphorus in Low Polluted Wastewater by Aquatic Plants: Impact of Monochromatic Light Radiation. Water 2024, 16. [Google Scholar] [CrossRef]
- Soufi, H.R.; Roosta, H.R.; Hamidpour, M. The plant growth, water and electricity consumption, and nutrients uptake are influenced by different light spectra and nutrition of lettuce. Scientific Reports 2023, 13. [Google Scholar] [CrossRef] [PubMed]
- Tang, Z.; et al. Physiological and growth response of pepper (Capsicum annum L.) seedlings to supplementary red/blue light revealed through transcriptomic analysis. Agronomy, 2019; 9. [Google Scholar] [CrossRef]
- Liu, Q.; et al. Effects of different LED light qualities on photosynthetic characteristics, fruit production and quality of strawberry. Chinese Journal of Applied Ecology 2015, 26, 1743–1750. [Google Scholar]
- Kadowaki, M.; et al. Effects of Greenhouse Photovoltaic Array Shading on Welsh Onion Growth. Biosystems Engineering 2012. [Google Scholar] [CrossRef]
- Wang, S.; et al. The red/blue light ratios from light-emitting diodes affect growth and flower quality of Hippeastrum hybridum’ Red Lion’. Frontiers in Plant Science 2022, 13. [Google Scholar] [CrossRef]
- Wang, J.; et al. Effects of LED supplemental light on the growth and development of blueberry in greenhouse. Acta Horticulturae Sinica 2020, 47, 1183–1193. [Google Scholar] [CrossRef]
- Meng, Q.; Runkle, E.S. Low-intensity blue light in night-interruption lighting does not influence flowering of herbaceous ornamentals. Scientia Horticulturae 2015, 186, 230–238. [Google Scholar] [CrossRef]
- Park, Y.G.; Jeong, B.R. Night interruption light quality changes morphogenesis, flowering, and gene expression in Dendranthema grandiflorum. Horticulture Environment and Biotechnology 2019, 60, 167–173. [Google Scholar] [CrossRef]
- Song, Y.H.; et al. Molecular basis of flowering under natural long-day conditions in Arabidopsis. Nature Plants 2018, 4, 824–835. [Google Scholar] [CrossRef] [PubMed]
- Xu, J.; et al. Light regulation of horticultural crop nutrient uptake and utilization. Horticultural Plant Journal 2021, 7, 367–379. [Google Scholar] [CrossRef]
- Trivellini, A.; et al. The Role of Blue and Red Light in the Orchestration of Secondary Metabolites, Nutrient Transport and Plant Quality. Plants 2023, 12. [Google Scholar] [CrossRef] [PubMed]
- Sakuraba, Y.; Yanagisawa, S. Light signalling-induced regulation of nutrient acquisition and utilization in plants. Seminars in Cell and Developmental Biology 2018, 83, 123–132. [Google Scholar] [CrossRef] [PubMed]
- Weber, K.; Burow, M. Nitrogen – essential macronutrient and signal controlling flowering time. Physiologia Plantarum 2018, 162, 251–260. [Google Scholar] [CrossRef]
- Zhang, Z.; et al. Response of plant first flowering and biomass allocation to nitrogen addition in an alpine meadow. Pratacultural Science 2023, 40, 916–924. [Google Scholar] [CrossRef]
- Zhang, S.; et al. Nitrogen Mediates Flowering Time and Nitrogen Use Efficiency via Floral Regulators in Rice. Current Biology 2021, 31, 671–683.e5. [Google Scholar] [CrossRef]
- Liu, X.; Zhang, Z.; Du, G. Response of dominant and common species flowering phenology to nitrogen addition in an alpine meadow. Pratacultural Science 2021, 38, 1240–1249. [Google Scholar] [CrossRef]
- Lin, Y.L.; Tsay, Y.F. Influence of differing nitrate and nitrogen availability on flowering control in Arabidopsis. Journal of Experimental Botany 2017, 68, 2603–2609. [Google Scholar] [CrossRef]
- Olas, J.J.; et al. Nitrate acts at the Arabidopsis thaliana shoot apical meristem to regulate flowering time. New Phytologist 2019, 223, 814–827. [Google Scholar] [CrossRef]
- Zhou, Y.H.; et al. Nitrogen regulates CRY1 phosphorylation and circadian clock input pathways. Plant signaling & behavior 2016, 11, e1219830. [Google Scholar] [CrossRef]
- Zhang, Z.; et al. Linking flowering and reproductive allocation in response to nitrogen addition in an alpine meadow. Journal of Plant Ecology 2014, 7, 231–239. [Google Scholar] [CrossRef]
- Chawla, R.; Sharma, S.K. Nitrogen fertilization of stone fruits: a comprehensive review. Journal of Plant Nutrition 2024. [Google Scholar] [CrossRef]
- Locascio, S.J.; et al. Fruit and vegetable quality as affected by nitrogen nutrition, in Nitrogen in Crop Production. 2015, wiley. p. 617-626. 10.2134/1990.nitrogenincropproduction.c42.
- Chen, Q.; et al. Effects of different nitrogen application rates on 15N-urea absorption, utilization, loss and fruit yield and quality of dwarf apple. Chinese Journal of Applied Ecology 2017, 28, 2247–2253. [Google Scholar] [CrossRef]
- Bashir, S.S.; et al. Physio-biochemical, agronomical, and gene expression analysis reveals different responsive approach to low nitrogen in contrasting rice cultivars for nitrogen use efficiency. Molecular Biology Reports 2023, 50, 1575–1593. [Google Scholar] [CrossRef]
- Zhao, L.; et al. Physiological and Transcriptional Characteristics of Banana Seedlings in Response to Nitrogen Deficiency Stress. Horticulturae 2024, 10. [Google Scholar] [CrossRef]
- Cao, X.; et al. New Insights into MdSPS4-Mediated Sucrose Accumulation under Different Nitrogen Levels Revealed by Physiological and Transcriptomic Analysis. International Journal of Molecular Sciences 2022, 23. [Google Scholar] [CrossRef]
- Zhang, Y.; et al. Transcriptome and Metabolome Studies on Pre-Harvest Nitrogen Impact on Fruit Yield and Quality of Peach (Prunus persica L.). Metabolites 2022, 12. [CrossRef]
- Zhang, Y.; et al. Integrated Physiological, Transcriptomic, and Metabolomic Analyses of the Response of Peach to Nitrogen Levels during Different Growth Stages. International Journal of Molecular Sciences 2022, 23. [Google Scholar] [CrossRef]
- Maevskaya, S.N.; Bukhov, N.G. Effect of light quality on nitrogen metabolism of radish plants. Russian Journal of Plant Physiology 2005, 52, 304–310. [Google Scholar] [CrossRef]
- Son, K.H.; Oh, M.M. Leaf shape, growth, and antioxidant phenolic compounds of two lettuce cultivars grown under various combinations of blue and red light-emitting diodes. HortScience 2013, 48, 988–995. [Google Scholar] [CrossRef]
- Liwei, W.; et al. Effects of Red and Blue Light Quality on Nitrogen Levels, Activities and Gene Expression of Key Enzymes Involved in Nitrogen Metabolism from Leaves of Tomato Seedlings. Acta Horticulturae Sinica 2017, 44, 768–777. [Google Scholar] [CrossRef]
- Li, J.; et al. Effect of LED Spectrum on the Quality and Nitrogen Metabolism of Lettuce Under Recycled Hydroponics. Frontiers in Plant Science 2021, 12. [Google Scholar] [CrossRef] [PubMed]
- Almansa, E.M.; et al. Nutritional response of seedling tomato plants under different lighting treatments. Journal of Plant Nutrition 2017, 40, 467–475. [Google Scholar] [CrossRef]
- Sahin, S.; Seckin, S.D. Effects of different LED light and nitrogen application on growth of lettuce plants and leaf nitrate content. Journal of Plant Nutrition 2022, 45, 2523–2533. [Google Scholar] [CrossRef]
- Association of Official Analytical Chemists (AOAC), Official Methods of Analysis. 15 ed. Method 968.06: Combustion (Dumas) Nitrogen Determination Method. 1990, Arlington, VA, USA.: AOAC International.
- Mizukoshi, K.; et al. Determination of tungstate concentration in plant materials by HNO3-HC1O4 digestion and colorimetric method using thiocyanate. Bulletin of the Faculty of Agriculture-Niigata University (Japan), 1994.
- Virtanen, P.; et al. SciPy 1.0: fundamental algorithms for scientific computing in Python. Nature Methods 2020, 17, 261–272. [Google Scholar] [CrossRef]
Figure 1.
Combined effects of blue (B; 400 – 500 nm) and red (R; 600 – 700 nm) LED combinations and nitrogen levels on growth of ‘Praratchatan 80’ strawberry under plant factory settings. (a) number of leaves per plant, (b) plant height, (c) number of crowns. L1, L2 and L3; B:R LED ratio of 1:3, 1:4 and 1:6, respectively, N; 100 mg/L nitrogen and N2; 200 mg/L nitrogen, L1N1, .......L3N2; interaction of respective blue and red LED ratios and nitrogen levels.
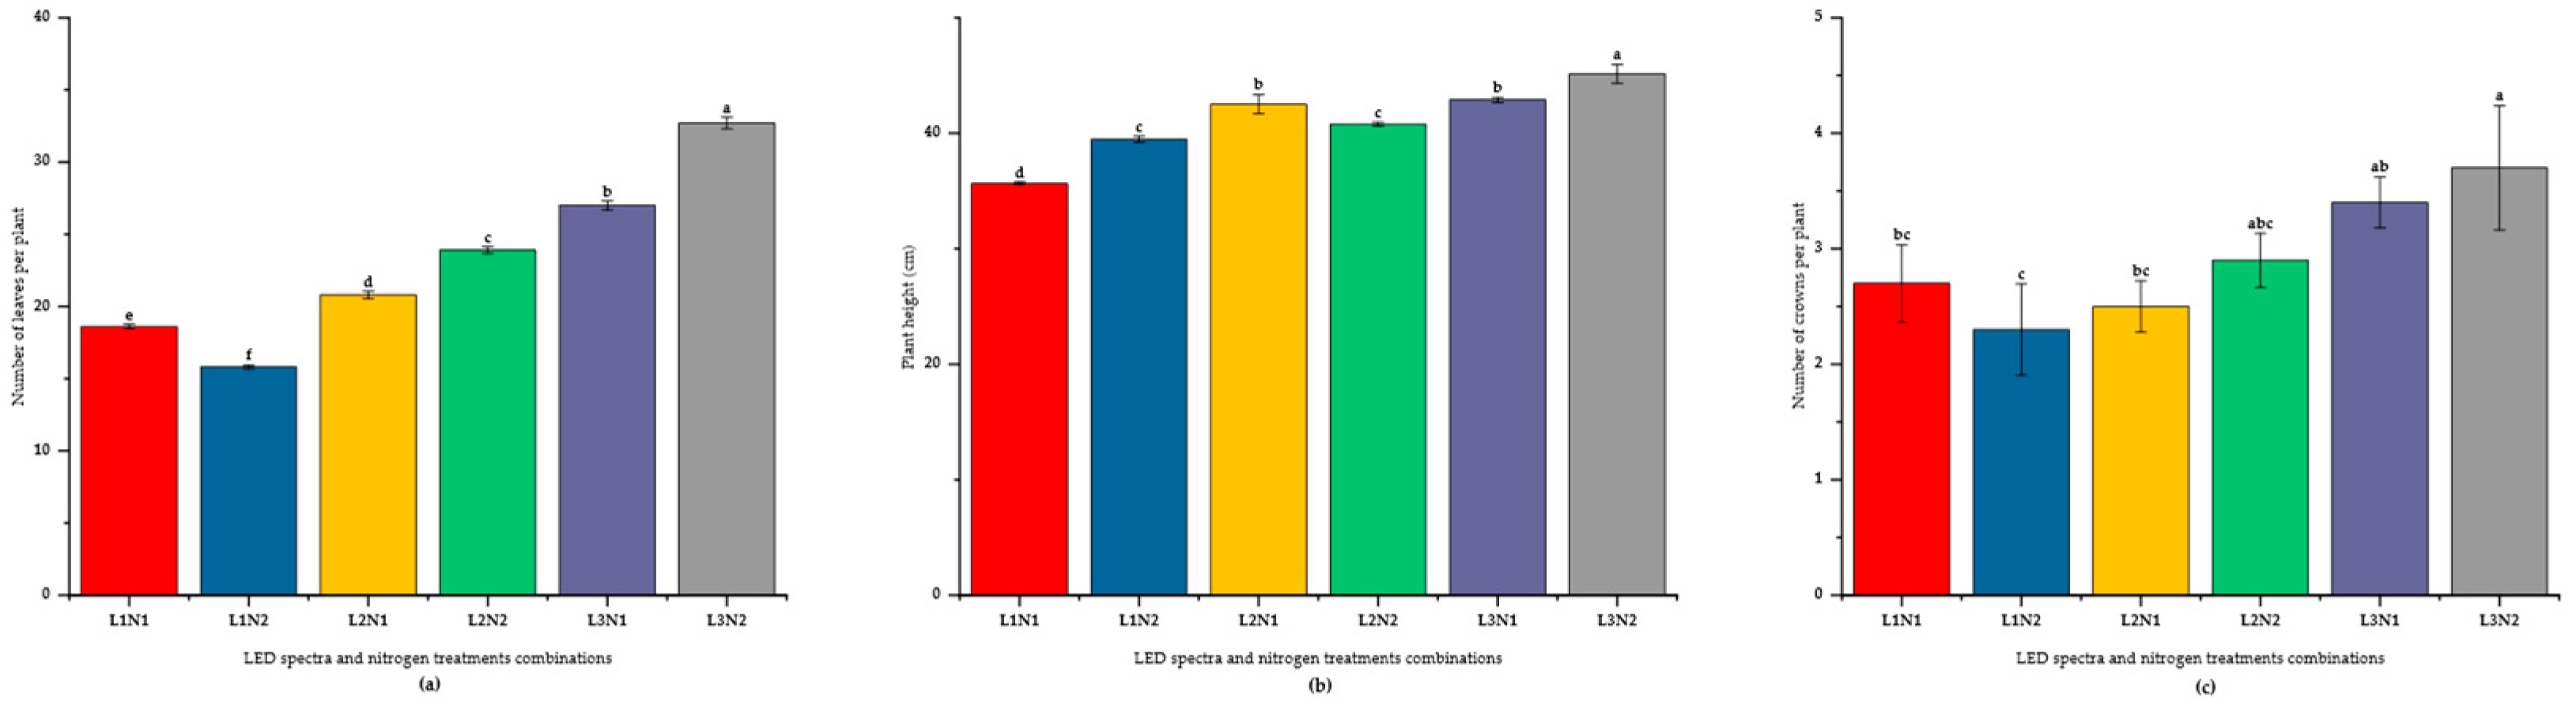
Figure 2.
Interactive effects of blue (B; 400 – 500 nm) and red (R; 600 – 700 nm) LED combinations and nitrogen levels on fruiting of ‘Praratchatan 80’ strawberry under plant factory settings. (a) fruit yield of strawberry per plant, (b) total soluble solids content (Brix) in strawberry fruits. L1, L2 and L3; B:R LED ratio of 1:3, 1:4 and 1:6, respectively, N; 100 mg/L nitrogen and N2; 200 mg/L nitrogen, L1N1, .......L3N2; interaction of respective blue and red LED ratios and nitrogen levels.
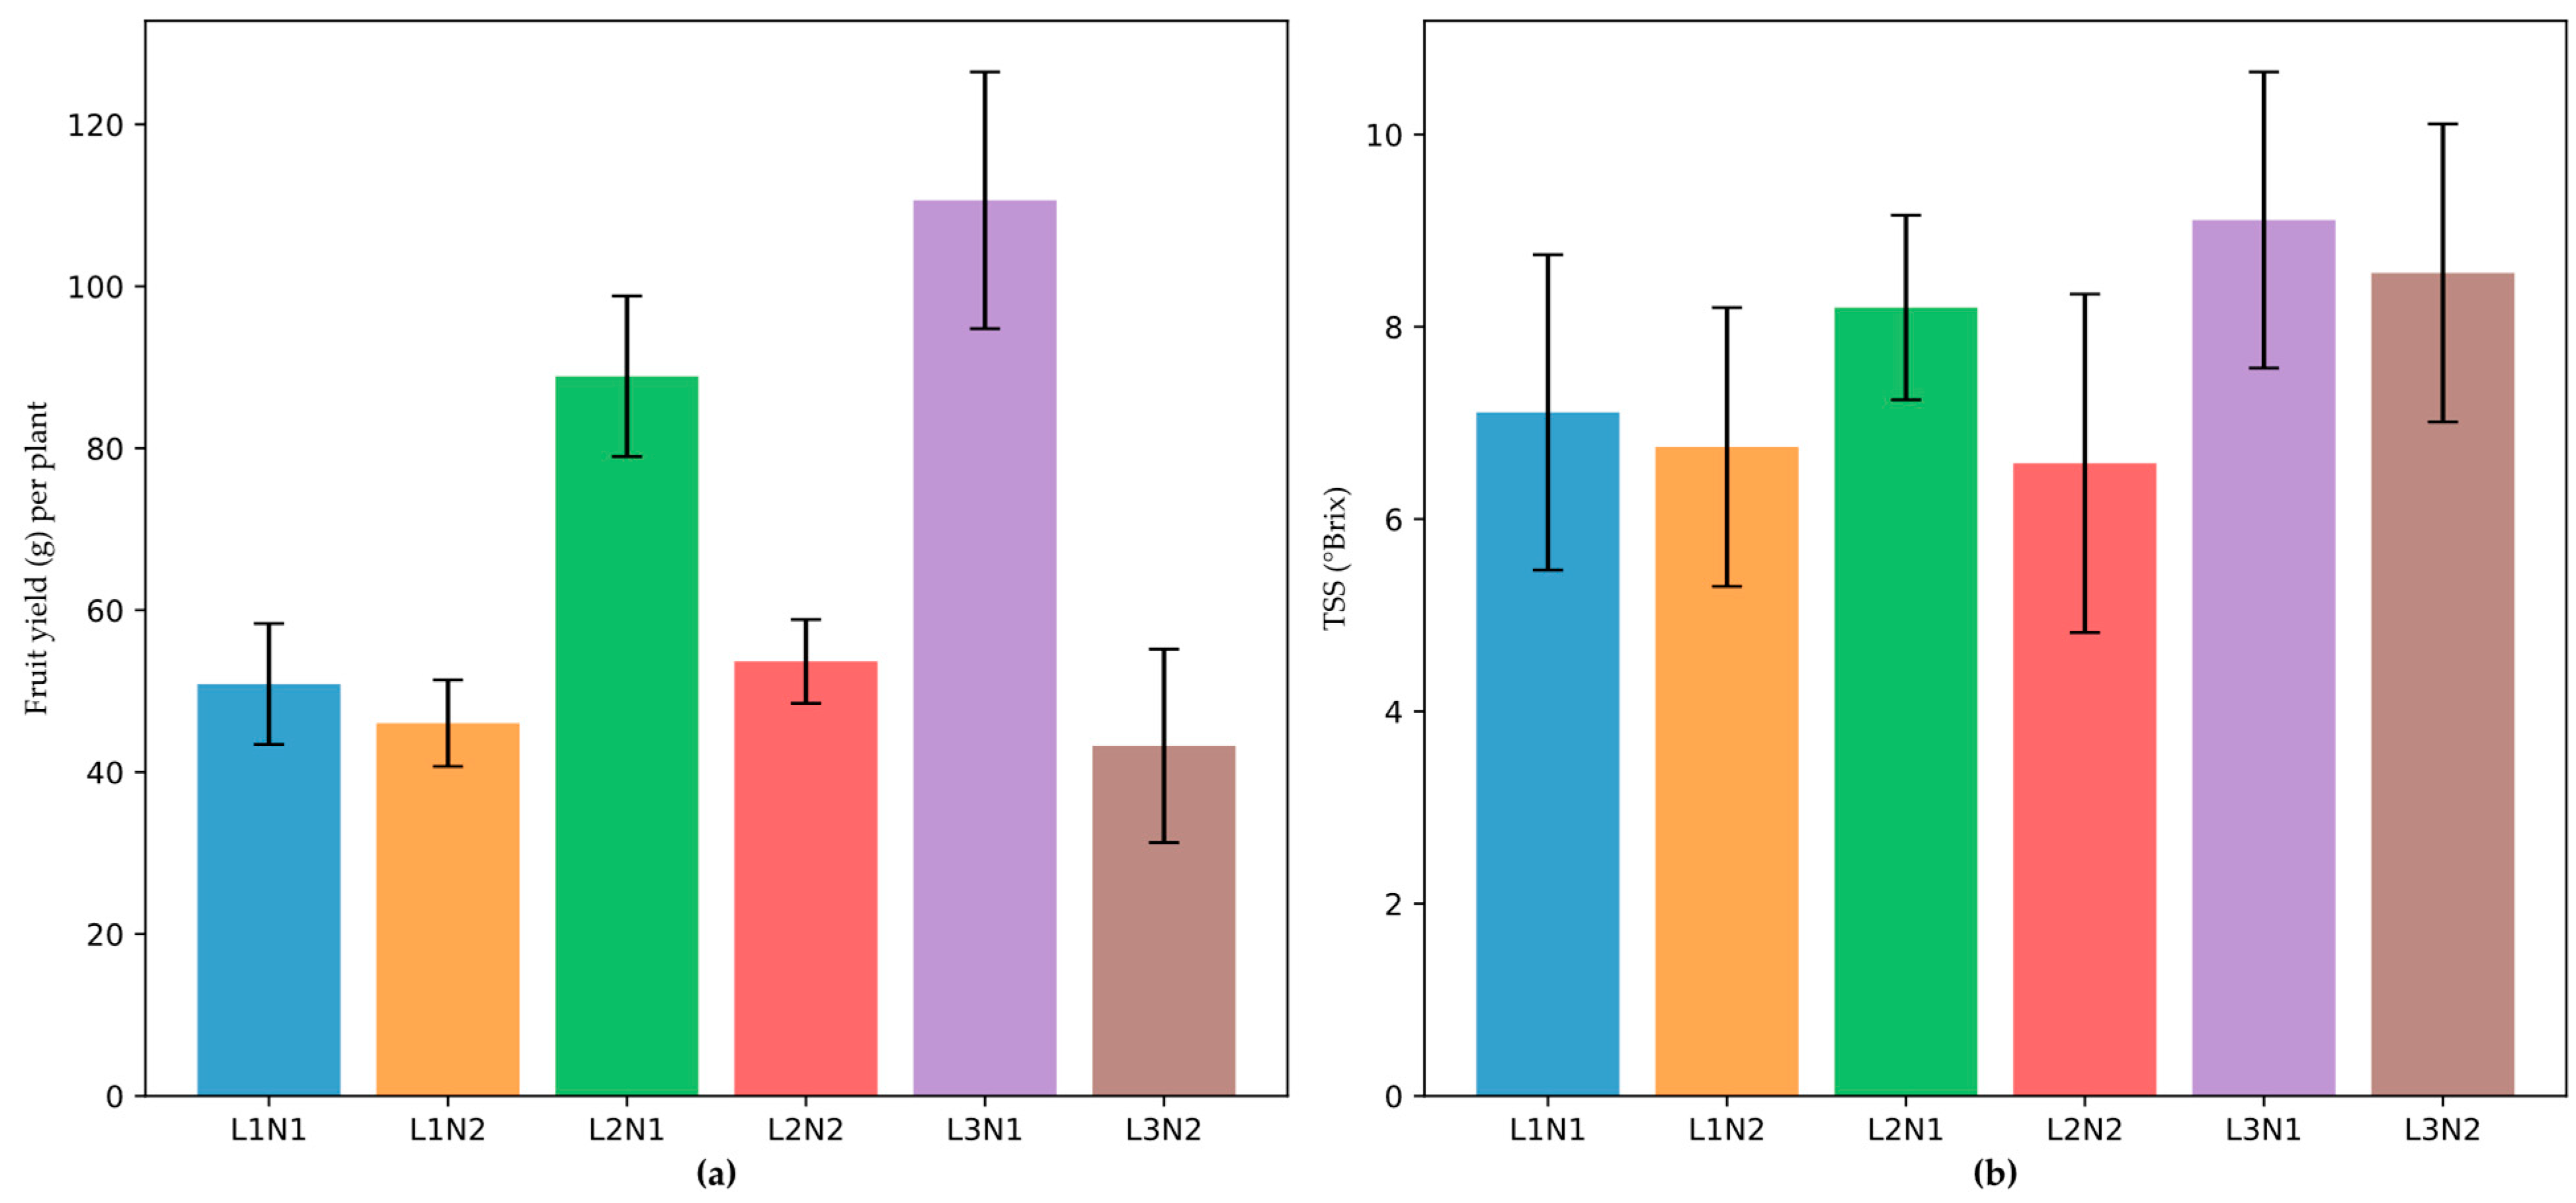
Figure 3.
Radar chart summarizing the effects of the 1:6 blue-to-red LED light ratio combined with 100 mg/L nitrogen on plant performance parameters in strawberry (Fragaria × ananassa cv. ‘Praratchatan 80’). The parameters include plant height (PH), leaf number (LF), photosynthesis rate (Pn), fruit yield (FY), total soluble solids (TSS), and crown number (CN). Values were normalized to the maximum observed values for each parameter.
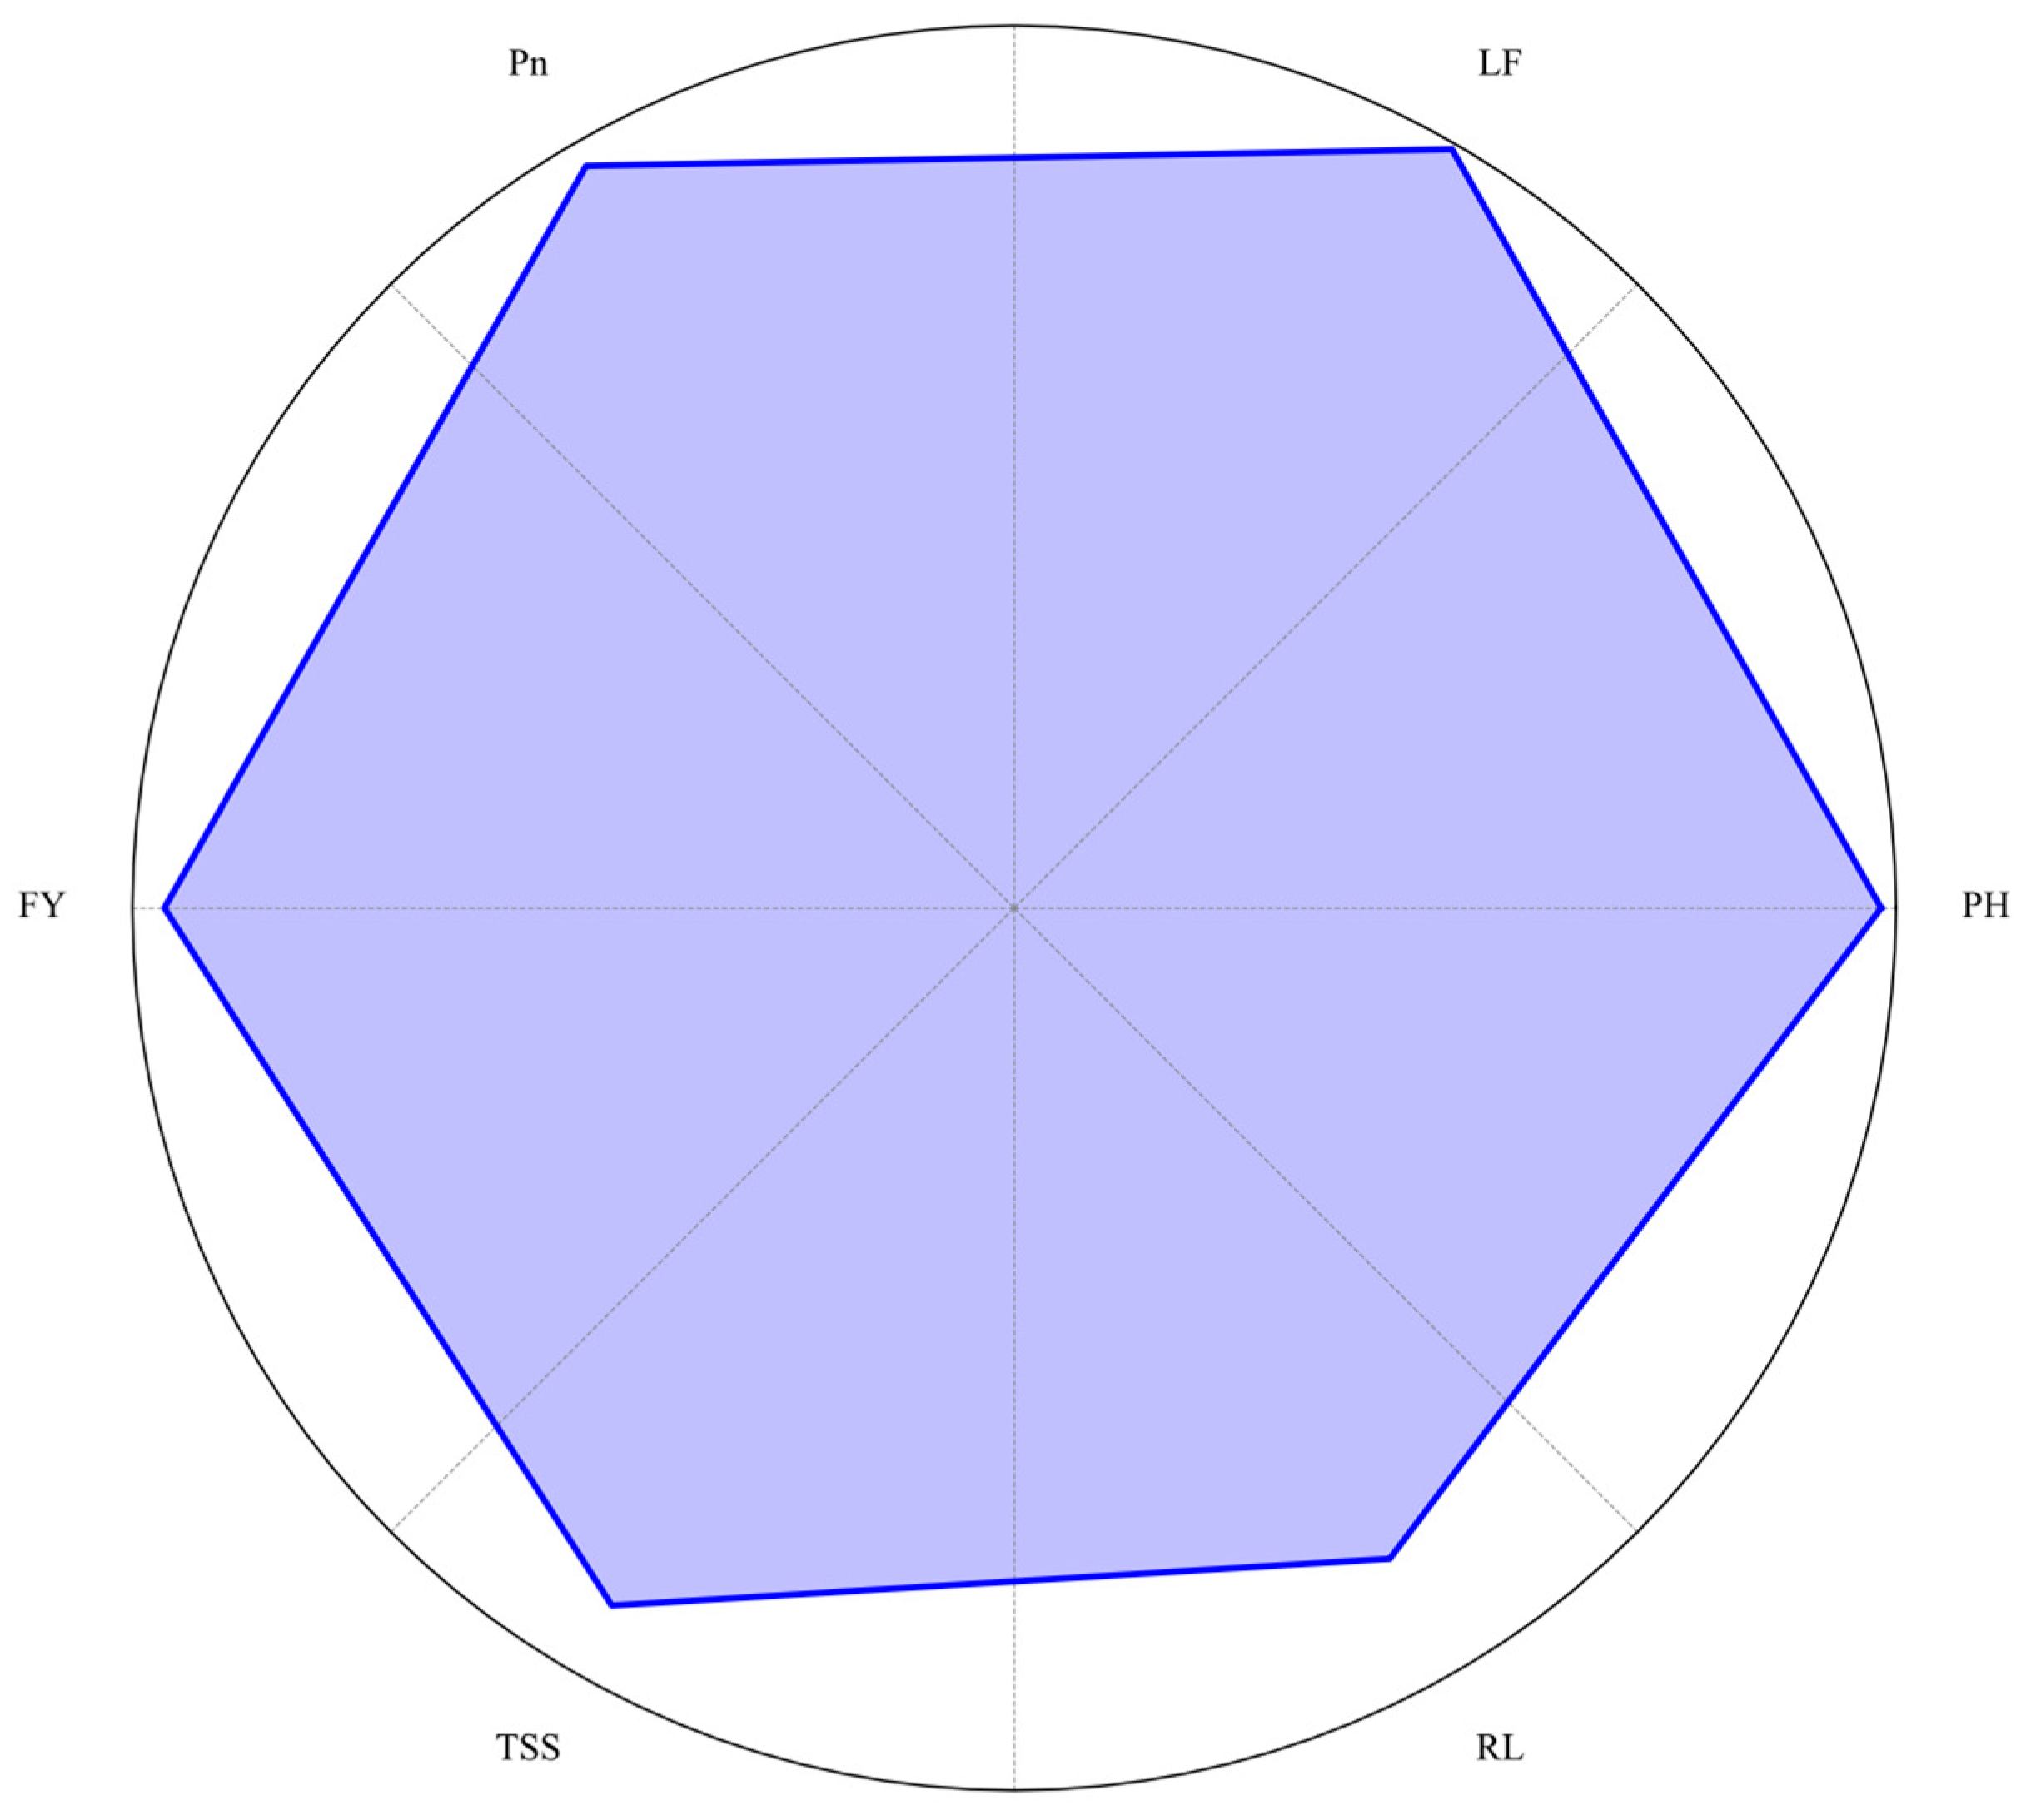

Table 1.
LED spectra and nitrogen effects on ‘Praratchatan 80’ strawberry growth (90 DAP).
| Factors | Number of leaves | Height (cm) | Crowns per plant | Fresh weight (g) | Dry weight (g) |
| LED spectra | |||||
| L1 | 17.20c | 37.56c | 2.50b | 129.40c | 25.88c |
| L2 | 22.35b | 41.65b | 2.70b | 241.50a | 48.40a |
| L3 | 29.85a | 44.00a | 3.55a | 206.93b | 41.45b |
| Sig. (p<0.05) | * | * | * | * | * |
| LSD | 0.52 | 1.01 | 0.300 | 3.01 | 1.75 |
| N Levels | |||||
| 100 mg/L (N1) | 22.13b | 40.33b | 2.87 | 184.76b | 37.05b |
| 200 mg/L (N2) | 24.13a | 41.80a | 2.97 | 200.51a | 40.11a |
| Sig. (p<0.05) | * | * | ns | * | * |
| LSD | 0.43 | 0.82 | 0.25 | 2.45 | 1.43 |
| LED * N | |||||
| L1*N1 | 18.60e | 35.64d | 2.70bc | 127.56d | 25.45d |
| L1*N2 | 15.80f | 39.47c | 2.30c | 131.24d | 26.28d |
| L2*N1 | 20.80d | 42.51b | 2.50bc | 221.36b | 44.39b |
| L2*N2 | 23.90c | 40.78c | 2.90b | 261.80a | 52.40a |
| L3*N1 | 27.00b | 42.85b | 3.40a | 205.36c | 41.26c |
| L3*N2 | 32.70a | 45.14a | 3.70a | 208.50c | 41.64c |
| Sig. (p<0.05) | * | * | * | * | * |
| CV (%) | 3.56 | 8.38 | 16.23 | 1.69 | 4.92 |
| LSD | 0.74 | 1.42 | 0.42 | 4.25 | 2.48 |
*, significant (p < 0.05); ns, not significant; WAT, weeks after treatment; abc, means followed by different superscript letters within a column are statistically different based on the LSD test (p < 0.05). DAP: days after planting.
Table 2.
Photosynthetic traits of strawberry under blue-red LED spectra and nitrogen (90 DAP).
| Factors | SPAD | Pn (µmol m⁻² s⁻¹) | E (mol m⁻² s⁻¹) | Gs (mol m⁻² s⁻¹) | Ci (µmol mol⁻¹) |
| LED spectra | |||||
| L1 | 46.20 | 2.6086b | 1.4014a | 0.1543a | 232.89c |
| L2 | 46.00 | 3.7886ab | 1.155b | 0.1071b | 251.74a |
| L3 | 46.72 | 4.9579a | 1.5007a | 0.1236b | 242.80b |
| Sig. (p<0.05) | ns | * | * | * | * |
| LSD | 1.53 | 1.2358 | 0.2003 | 0.0298 | 3.07 |
| N Levels | |||||
| 100 mg/L | 46.34 | 4.1495 | 1.3419 | 0.1214 | 238.49b |
| 200 mg/L | 46.27 | 3.4205 | 1.3629 | 0.1352 | 246.46a |
| Sig. (p<0.05) | ns | ns | ns | ns | * |
| LSD | 1.25 | 1.0090 | 0.1635 | 0.0244 | 2.51 |
| LED * N Levels | |||||
| L1*N1 | 46.90ab | 2.3986b | 1.3414b | 0.1543 | 230.24 |
| L1*N2 | 45.52ab | 2.8186b | 1.4614ab | 0.1543 | 235.53 |
| L2*N1 | 44.93b | 3.7529b | 0.9929c | 0.0843 | 247.80 |
| L2*N2 | 47.07ab | 3.8243b | 1.3171b | 0.1300 | 255.67 |
| L3*N1 | 47.23a | 6.2971a | 1.6914a | 0.1257 | 237.43 |
| L3*N2 | 46.21ab | 3.6186b | 1.3100b | 0.1214 | 248.17 |
| Sig. (p<0.05) | * | * | * | ns | ns |
| CV (%) | 5.22 | 42.5900 | 19.3200 | 30.3400 | 1.65 |
| LSD | 2.17 | 1.7477 | 0.2833 | 0.0422 | 4.34 |
*, significant (p < 0.05); ns, not significant; WAT, weeks after treatment; abc, means followed by different superscript letters within a column are statistically different based on the LSD test (p < 0.05). DAP: days after planting; Pn, net photosynthesis rate; E, transpiration rate; Gs, stomatal conductance; Ci, intercellular CO2.
Table 3.
LED spectra and nitrogen effects on ‘Praratchatan 80’ strawberry flowering (90 DAP).
| Factors | Days to First Bloom | Inflorescence per Plant | Flowers per Plant | Florets per Inflorescence |
| LED spectra | ||||
| L1 | 39.80b | 2.20a | 17.35a | 8.23c |
| L2 | 41.45a | 1.60b | 16.80a | 10.95a |
| L3 | 38.90c | 1.55b | 13.55b | 9.55b |
| Sig. (p<0.05) | * | * | * | * |
| LSD | 0.78 | 0.31 | 0.56 | 2.19 |
| N Levels | ||||
| 100 mg/L | 37.40b | 1.67 | 15.80 | 10.58a |
| 200 mg/L | 42.70a | 1.90 | 16.00 | 8.59b |
| Sig. (p<0.05) | * | ns | ns | * |
| LSD | 0.64 | 0.26 | 0.46 | 0.36 |
| LED * N | ||||
| L1*N1 | 41.10b | 1.80b | 13.80c | 8.20d |
| L1*N2 | 38.50c | 2.60a | 20.90a | 8.31d |
| L2*N1 | 34.70e | 1.50b | 17.10b | 12.85a |
| L2*N2 | 48.20a | 1.70b | 16.50b | 9.05c |
| L3*N1 | 36.40d | 1.70b | 16.50b | 10.70b |
| L3*N2 | 41.10b | 1.40b | 10.60d | 8.40d |
| Sig. (p<0.05) | * | * | * | * |
| CV (%) | 3.07 | 27.62 | 5.60 | 7.24 |
| LSD | 1.10 | 0.44 | 0.80 | 0.62 |
*, significant (p < 0.05); ns, not significant; WAT, weeks after treatment; abc, means followed by different superscript letters within a column are statistically different based on the LSD test (p < 0.05). DAP: days after planting.
Table 4.
Effect of varying LED spectral combinations and nitrogen levels on fruiting of strawberry.
| Factors | Fruits per plant | Weight (g) | Yield/plant (g) | Length (mm) | Width (mm) | TSS (0Brix) | Firmness (N) |
| LED spectra | |||||||
| L1 | 8.70b | 5.57c | 48.46b | 25.89b | 23.16b | 6.93c | 4.62a |
| L2 | 9.40a | 7.57b | 71.28a | 24.86b | 25.93a | 7.34b | 4.07c |
| L3 | 8.70b | 8.52a | 76.93a | 30.22a | 27.07a | 8.84a | 4.55b |
| Sig. (p<0.05) | * | * | * | * | * | * | * |
| LSD | 0.43 | 0.58 | 9.26 | 1.17 | 1.36 | 0.31 | 0.06 |
| N Levels | |||||||
| 100 mg/L | 10.80a | 7.55a | 83.46a | 28.85a | 27.30a | 8.14a | 4.68a |
| 200 mg/L | 7.07b | 6.89b | 47.65b | 25.13b | 23.47b | 7.30b | 4.14b |
| Sig. (p<0.05) | * | * | * | * | * | * | * |
| LSD | 0.35 | 0.48 | 7.56 | 0.95 | 1.11 | 0.65 | 0.05 |
| LED * N | |||||||
| L1*N1 | 9.00b | 5.65c | 50.87c | 28.08b | 24.94c | 7.11c | 4.42c |
| L1*N2 | 8.40b | 5.50c | 46.04c | 23.69c | 21.37d | 6.75cd | 4.83ab |
| L2*N1 | 11.60a | 7.65b | 88.89b | 28.15a | 29.73a | 8.20b | 4.87a |
| L2*N2 | 7.20c | 7.48b | 53.67c | 21.58d | 22.37d | 6.58d | 3.26d |
| L3*N1 | 11.80a | 9.35a | 110.62a | 30.31a | 27.23b | 9.11a | 4.76b |
| L3*N2 | 5.60d | 7.69b | 43.24c | 30.14a | 26.92b | 8.56b | 4.34c |
| Sig. (p<0.05) | * | * | * | * | * | * | * |
| CV (%) | 5.21 | 8.75 | 9.30 | 6.82 | 8.47 | 6.35 | 2.23 |
| LSD | 0.61 | 0.82 | 13.10 | 1.65 | 1.93 | 0.44 | 0.09 |
*, significant (p < 0.05); ns, not significant; WAT, weeks after treatment; abc, means followed by different superscript letters within a column are statistically different based on the LSD test (p < 0.05). DAP: days after planting.
Table 5.
Leaf nitrogen and potassium in ‘Praratchatan 80’ strawberry under LED spectra and nitrogen levels (90 DAP).
Table 5.
Leaf nitrogen and potassium in ‘Praratchatan 80’ strawberry under LED spectra and nitrogen levels (90 DAP).
| Factors | Total nitrogen (%) | Total potassium (%) |
| LED spectra | ||
| L1 | 2.79a | 2.53b |
| L2 | 2.72b | 2.73a |
| L3 | 2.53c | 2.70a |
| Sig. (p<0.05) | * | * |
| LSD | 0.05 | 0.15 |
| N Levels | ||
| 100 mg/L | 2.76a | 2.76a |
| 200 mg/L | 2.60b | 2.54b |
| Sig. (p<0.05) | * | * |
| LSD | 0.04 | 0.12 |
| LED * N | ||
| L1*N1 | 2.83a | 2.67b |
| L1*N2 | 2.75b | 2.40c |
| L2*N1 | 2.83a | 2.91a |
| L2*N2 | 2.60c | 2.56bc |
| L3*N1 | 2.62c | 2.71ab |
| L3*N2 | 2.45d | 2.68b |
| Sig. (p<0.05) | * | ns |
| CV (%) | 1.85 | 5.38 |
| LSD | 0.07 | 0.21 |
*, significant (p < 0.05); ns, not significant; WAT, weeks after treatment; abc, means followed by different superscript letters within a column are statistically different based on the LSD test (p < 0.05). DAP: days after planting.
Table 6.
Nitrogen treatments used in the experiment with a dilution ratio of 1:100.
| Fertilizer material | Concentration (g/L) | |
| N1 | N2 | |
| NH4NO3 | 21.10 | 49.80 |
| KH2PO4 | 44.00 | 44.00 |
| KNO3 | 19.10 | 19.10 |
| CaCl2 | 20.00 | 20.00 |
| MgSO4.7H2O | 120.00 | 120.00 |
| H3BO3 | 3.00 | 3.00 |
| MnSO4.4H2O | 2.00 | 2.00 |
| ZnSO4.7H2O | 0.22 | 0.22 |
| CuSO4.5H2O | 0.05 | 0.05 |
| NaMoO24.2H2O | 0.01 | 0.01 |
| FeEDTA | 1.50 | 1.50 |
N1; 100 mg/L, N2; 200 mg/L.
Disclaimer/Publisher’s Note: The statements, opinions and data contained in all publications are solely those of the individual author(s) and contributor(s) and not of MDPI and/or the editor(s). MDPI and/or the editor(s) disclaim responsibility for any injury to people or property resulting from any ideas, methods, instructions or products referred to in the content. |
© 2024 by the authors. Licensee MDPI, Basel, Switzerland. This article is an open access article distributed under the terms and conditions of the Creative Commons Attribution (CC BY) license (http://creativecommons.org/licenses/by/4.0/).
Copyright: This open access article is published under a Creative Commons CC BY 4.0 license, which permit the free download, distribution, and reuse, provided that the author and preprint are cited in any reuse.


