
Submitted:
09 December 2024
Posted:
11 December 2024
You are already at the latest version
Abstract
It is becoming increasingly clear that microRNAs are key players in gene regulatory networks, by modulating gene expression at post-transcriptional level. Their involvement in almost all cellular processes has anticipated their role in diseases, with several microRNA-based therapeutics currently undergoing clinical testing. Despite their undeniable relevance and the substantial body of literature demonstrating their role in cancer and other pathologies, the identification of functional interactions is still challenging. Several resources have been developed to address this issue, by gathering information from the literature, following different criteria and reliability scores. In the present study, we have built a network of verified microRNA-mRNA interactions by integrating strong-evidence couples from different resources. We have analysed the resulting network and compared cohorts of co-regulated genes. The results clearly show that hub genes are highly enriched of transcription factors and regulatory proteins, strongly suggesting a cross-talk and a combinatorial effect between transcriptional and post-transcriptional gene control. Data analysis also reveals that several microRNAs control multiple targets involved in the same pathway or biological process, likely contributing in coordinating the levels of the proteins.
Keywords:
microRNA
; biocuration
; miRNA interaction network
; gene regulation
; transcription factors
1. Introduction
Over the last 20 years, genome projects have shown that the complexity of the most evolved organisms is not explained when looking at protein-coding genes, as they are highly conserved even in distant species. Large genomic regions are occupied by genes for the so-called non-coding RNAs, which perform their function without being translated into amino acid chains, and that may contribute to modulate the variability among different organisms. Among them, microRNAs have been shown to be involved in regulatory functions since their first discovery in 1993, and to be an essential component of the intricate network that regulates gene expression in many cell processes [1,2]. Their mature form is a very short double strand RNA, composed of a passenger strand that is then misplaced, and a guide strand that identifies the target, commonly through base pairing between bases in positions 2-7 of the microRNA (the seed) and short regions in the mRNA, often located in 3’ UTR of the transcript [3,4]. The peculiar shape of microRNAs has promoted the development of many computational approaches, both to discover them in the genome, and to predict their targets. Currently, more than a hundred target prediction tools are available, based on sequence complementarity and other features, as described in several reviews [5,6]. According to these bioinformatic analyses, almost all mRNAs contain several sequences that are potentially recognised by microRNAs, however, only a small part of them have been proven to function for regulation [6]. The base pairing between each microRNA and the selected mRNA occurs in the miRNA-induced silencing complex (miRISC) and leads to decreased protein expression through translational repression and/or mRNA degradation. Briefly, when the microRNA is loaded onto an Argonaute protein, the passenger strand is released and the guide strand hybridises to the complementary region on the mRNA [3]. TNR6A (also known as GW182), binds to the Argonaute complex and helps to recruit the CCR4-NOT and PAN2-PAN3 deadenylase complexes as well as the decapping complexes [7,8]. Several studies report that microRNAs repress mRNA translation, however it has been suggested that the main mechanism of regulation is mRNA decay [8]. This is supported by the observation that the majority of the studies which demonstrate microRNA-mRNA interaction by luciferase assay [9], also observe an mRNA decreasing upon miRNA mimics transfection. Several RNA binding proteins also contribute to the outcome of the regulation process, by recognising specific sequences or secondary structures on the 3’ UTR of the mRNAs [10]. The binding may mask the seed sequence or may facilitate the microRNA binding. This partially explains the differences between the set of predicted versus real targets.
A growing body of evidence points to the key role of microRNAs in gene regulation, and some of them control multiple genes that are altered in pathological conditions, so that they are under investigation to develop new therapeutic strategies. Therefore, it is crucial to have the most reliable knowledge on the network of the targeted genes, to be able to foresee most of the effects. To this aim, several repositories collect microRNA interaction data, and considerable efforts have been made to standardise annotation vocabularies and RNA identificatives to support data integration [11,12,13]. Nonetheless there is still a significant discrepancy, among different databases, as to which experimental approaches demonstrate “true” interactions, especially for high-throughput assays. Immunoprecipitation of AGO2 in Clip-seq experiments [14] return lists of microRNAs and mRNAs co-immunoprecipitated, and some resources capture these results as interaction couples, while others recognise their value to improve the performance of prediction tools but not as proof of interaction [13]. An adaptation of this technique was proposed to specifically investigate microRNA targets by linking the ends of RNA duplexes before sequencing [15]. In the last years, hundreds of papers have been published, showing the physical binding of a microRNA to its partner by luciferase assay performed on the wild type and on the mutated mRNA. This approach is among the few that are generally accepted to demonstrate the binding between the two RNAs, together with the RNA-Ip which is more rarely utilized [13,16,17]. The UCL functional annotation group [16] and the IntAct database [17] have annotated a collection of such interactions, although the coverage is still limited. MirTarBase [18] and RNAInter [19] have a higher coverage, and it is possible to select the stronger evidence from the other annotations. To investigate the main features of the microRNA mediated regulation, we have built a network with the most reliable interactions and analysed the main characteristics of the post-transcriptional regulatory circuit.
2. Materials and Methods
2.1. Dataset Integration
Human microRNA-mRNA interactions were downloaded from four repositories in Jan 2024: miRTarBase [18] RNAinter [19] QuickGO [16,20], IntAct [17]. Interactions from QuickGO and IntAct are consistent to the International Molecular Exchange consortium common standards (https://www.imexconsortium.org/) [21], while interactions derived from miRTarbase and RNAinter were filtered for low-throughput, strong evidence. More precisely, to assure the physical binding of the microRNA to the mRNA, we selected “luciferase assays” or RNA-IP, and disregarded “western blot” and “qpcr” as these can be the result of a direct or indirect effect (Figure1,[13]) To integrate the data, the Uniprot ID mapping tool (https://www.uniprot.org/id-mapping) [22] was used when necessary. Each interaction was considered once and all duplications were deleted. Cytoscape tool [23] was then used to visualise and analyse the network. The list of DNA-binding transcription factors was retrieved from [24]. To obtain an estimation of the number of genes regulated by each transcription factor we downloaded gene regulation data (TF-TG) from TFlink “small scale dataset” filtering out inferred interactions [25]. This should contain only interactions verified in low throughput experiments. TF regulating zero genes according to this list were deleted.
2.2. Network Analysis
The microRNA-mRNA network was constructed and the number of edges for each node (defined as node degree) was calculated [23]. Degree classes (dc) were calculated based on how many times a certain degree appears (abundance). As an example, if there are two nodes with 94 interactions each one, then degree 94 belongs to the degree class 2. Three datasets were produced, listing the abundance of dc relative to mRNA, and miRNA and for the subclass of transcription factors (see below). To compare the abundance distribution of the datasets, the regression model best fitting each abundance distribution was computed on the basis of several models proposed in the R library ‘sads’ [26]. The best model was selected on AIC basis, and where the abundance distributions converged on the same model, then this was taken as an evidence of similarity. We compared the abundance distribution of transcription factors (TF) with that of all mRNAs. Transcription factors regulated by zero microRNAs were deleted and the others were subtracted from the mRNA dataset, and the two curves were compared by means of the AIC value.
Mutual Information (MI) analysis was applied for the effective estimation of the possible relationship between the number of microRNAs regulating each TF and the number of genes regulated by the same TF, by means of the R library “entropy”[27]. MI can be applied to assess the presence of an unspecified relationship among data sets, when a linear model is not applicable. It measures the amount of information obtained about one variable, when measuring the other [28,29]. MI returns an absolute value, which can be more easily interpreted if expressed as relative MI (rMI), i.e. the ratio between MI and the maximum MI that can be extracted for the dataset [30]. To evaluate confidence intervals (CI) and significance (p), MI and rMI were bootstrapped by means of the R libraries 'simpleboot', 'boot' and 'boot.pval'.
2.3. Gene Ontology and Pathway Enrichment Analysis
Genes interacting with more than 20 microRNAs were analysed for Gene Ontology terms enrichment against the whole genome. To this aim, Gprofiler [31], VLAD [32] (moved to https://www.informatics.jax.org/vlad/) and BinGO [33] were utilised, giving very similar results. The data presented in Figure 3 show the enrichment for molecular function and are obtained with BinGO, the significance was imposed below 0,0005 and the whole genome was considered as benchmarking. Supplementary figure 1 was drawn with VLAD. Pathway enrichment analyses were conducted with Reactome analysis tool [34].
2.4. Other Statistical Analysis
Intersections of common target genes (Figure 5) were calculated with https://bioinformatics.psb.ugent.be/webtools/Venn/.
To correlate 3’ UTR lengths with predicted and verified interactions, data tables were generated as follows: transcript lengths and 3’ UTR lengths were extracted from ensembl (https://www.ensembl.org/index.html) database and refers to the “main” transcript as defined by GIFT tool (https://www.ebi.ac.uk/gifts/). The number of interactions was extracted from the integrated dataset described above. Predictions were calculated with miRDB [35] and miRWalk [36]. miRwalk prediction was calculated on the same Refseq as for the UTR and length measures and filtered at 0.95. Pearson correlation coefficient was calculated using the ggpairs functions from GGally package [37] in R [38].
3. Results
3.1. General Characteristics of the microRNA-mRNA S
Although any gene is a potential target for microRNAs, as suggested from the numerous target prediction methods, low throughput experiments seem to reveal a significant discrepancy among transcripts. In a recent paper, the collection from the literature of microRNAs which regulate genes involved in rare diseases has shown that for the majority of mRNAs no microRNA binding has been demonstrated, while a small number of mRNAs is heavily regulated [13]. In order to gain more insights into the distribution of microRNA targets, we have integrated 4 manually curated datasets [13,16,18,19] and filtered them to only provide strong-evidence, low-throughput results, as described in detail in Figure 1. We used the resulting list of “gold standard” interactions to investigate into post-transcriptional regulatory mechanisms.
According to this dataset, 3842 human genes are regulated by at least one microRNA, which corresponds to 20% of the estimated 19400 human coding genes (www.genenames.org). We calculated the number of edges for each node (defined as node degree, dc). Concerning the mRNA nodes, the smallest class, with dc=1, contains 1964 presences, i.e. more than 1900 mRNAs interact with one microRNA; while the largest class with dc=108 is present once (and corresponds to PTEN phosphatase). The abundance decreases quickly between 5 to 10 degrees, so that a minority of nodes have more than 10 interactors (Figure 2A, Supplementary Table 1). This scenario is consistent with the abundance distribution best fitting a power law, where large values are exponentially less likely, and a large proportion of occurrences is held by a small number of entities (Pareto distribution). Only 2% of the 3842 mRNAs regulated by microRNAs are controlled by more than 20 microRNAs, and we defined them as network hubs for the following analyses.
The miRNA dataset lists 962 microRNA nodes, which have an average higher degree in comparison to mRNAs. The smallest class with dc=1 shows 239 presences and 14% of interacting microRNAs regulate more than 20 genes. Notably, thirteen microRNAs target more than 100 genes each (Figure 2B, Supplementary Table 1), and this number is destined to increase as new data will be published.
3.2. mRNA Highly Regulated Are Regulators
To gain more insights into microRNA-mediated post-transcriptional regulation, we investigated the molecular functions of the highly regulated genes, to estimate if specific typologies of genes have a higher propensity to be controlled by multiple miRNAs. The Gene Ontology is the most used bioinformatic resource to unify and interpret gene functions and attributes for biomedical purposes [39]. We calculated the enrichment in genes performing specific functions among those regulated by more than 20 microRNAs, in respect to the whole set of human genes, using three different tools: Gprofiler [31] VLAD [32] and BinGO [33]. These three methods gave similar results, showing a very high enrichment for genes related to transcription regulatory activity. Figure 3 shows Ontology Terms related to the transcription and transcription regulation, highly enriched among “hub” genes in respect to the others. In Supplementary table 2 all the enriched terms retrieved with BinGO are listed with their frequency in hub genes and in the whole genome. Reactome analysis tool [34] also returns among the top-ranking pathways “Generic Transcription Pathway” and “RNA Polymerase II Transcription” and “Gene Expression”, all with FDR 1,05E-14.
A similar result had been obtained in [40] from the analysis of hub genes predicted with Targetscan [41].
Figure 3.
Transcription regulation function in genes controlled by more than 20 microRNAs.
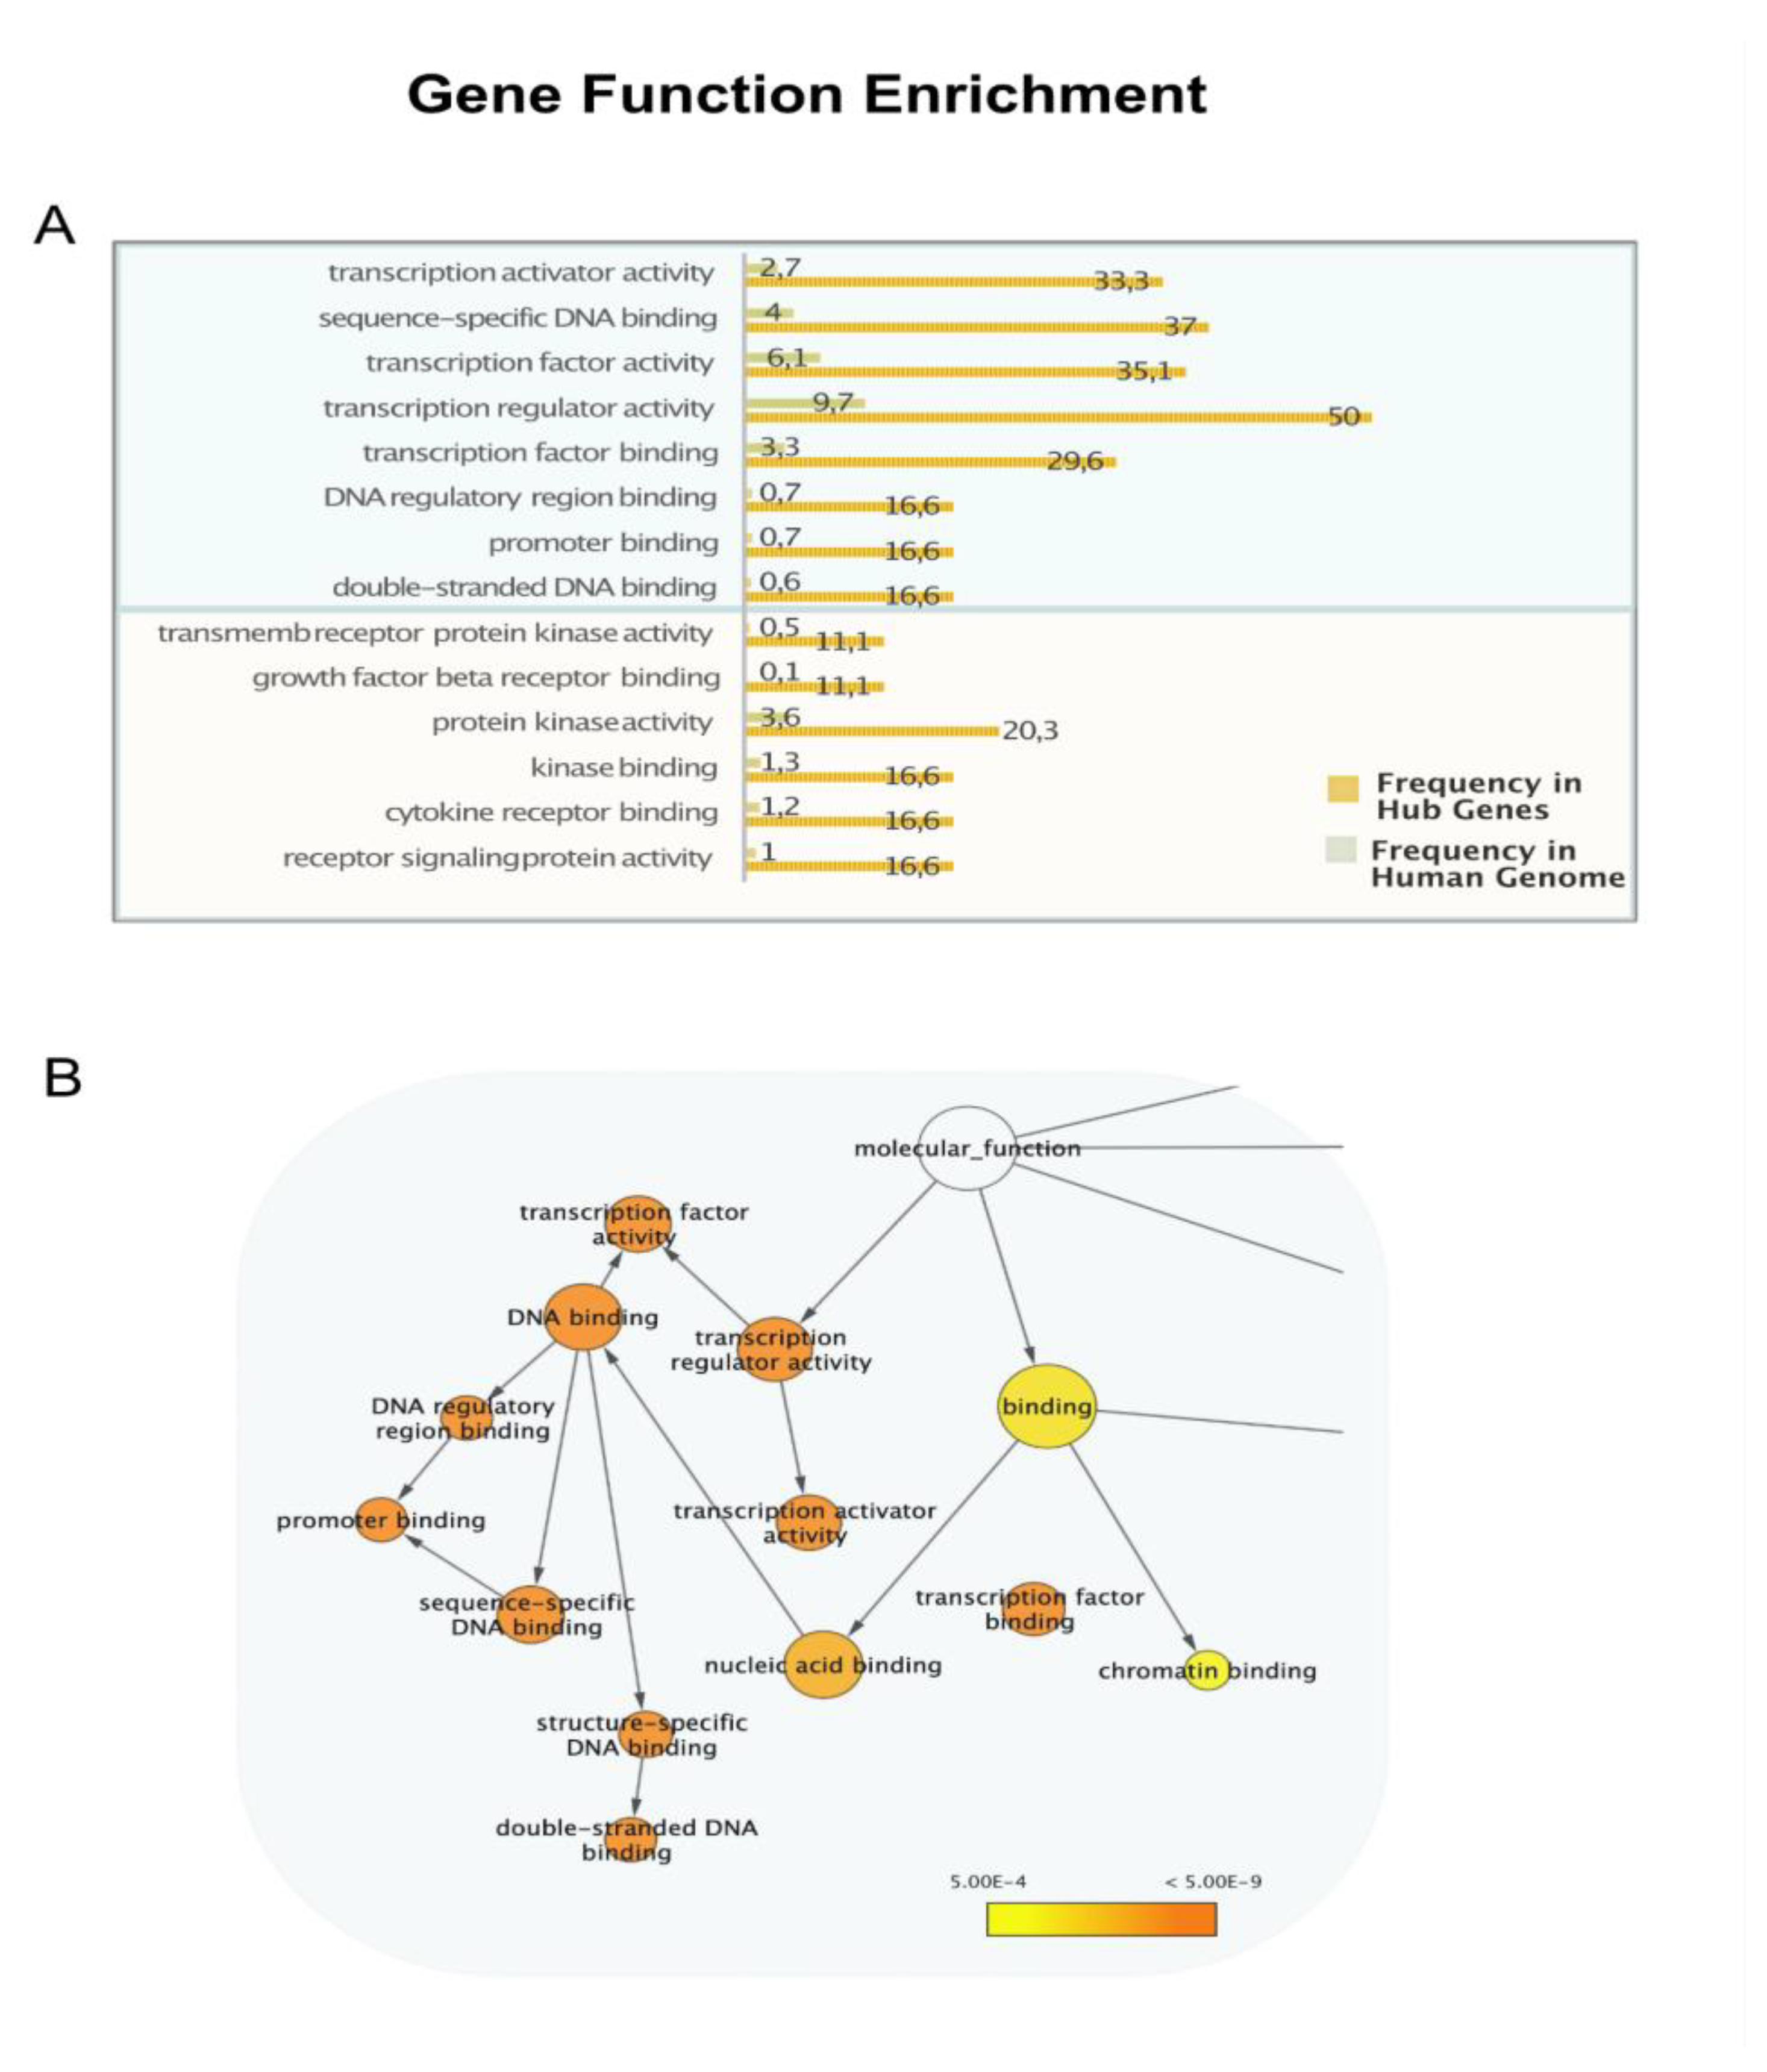
A) The histogram presents the molecular-function GO terms statistically overrepresented (significance level 0,0005) in the hub genes compared to the whole genome, clearly showing an enrichment for genes related to transcription regulation and signal transduction. The complete list of molecular functions enriched in hub genes and their frequencies are listed in Supplementary Table 2. B) Ontology graph drawn with BinGO in Cytoscape [33], showing the GO hierarchy of enriched child terms related to transcription. The area of a node is proportional to the number of genes annotated to the corresponding GO category among the “hubs” and the colours indicate the statistical significance, higher in dark orange nodes.
On the other hand, not all the transcription factors are regulated by microRNAs. In a recent paper, members of the GO Consortium have produced a curated catalogue of 1456 human DNA binding transcription factors [24]. We compared the distribution of the interacting microRNAs of these 1456 genes with the whole set of human mRNAs, and we found a very similar distribution (Figure 4). For 72% of the DNA-binding TF listed in [24] no interacting microRNA has been reported, while 28% have at least one. Only 25 transcription factors are regulated by more than 20 microRNA, corresponding to 1.7%. The rank abundance distribution of microRNAs binding to transcription factors fits a Pareto distribution as for the other mRNAs, with a minimum value of AIC = 174 as compared to AIC= 401 for the other genes, indicating that they are represented by a power law distribution.
To better estimate if there is any relationship between the microRNA regulation and the transcriptional regulation we performed a Mutual Information analysis, considering, for each transcription factor, two variables: the number of interacting microRNAs and the number of genes regulated by. To estimate the number of genes regulated by each transcription factor we referred to TFlink [25]. The MI value (MI=0.1161408) and the rMI value (rMI=0.02567784), both fall in a range within the CIs with a highly significant p-value, indicating a non-random co-occurrence. However, the low rMI value indicates that other variables influence the numbers. From these observations we suggest that, although genes controlled by multiple microRNAs are highly enriched for transcription regulation functions, not all the transcription factors are regulated by microRNAs. As shown in Supplementary Table 3 however, the most interconnected factors are highly controlled by microRNAs.
Genes involved in receptor signalling and kinase binding are also enriched among microRNA regulated genes (Figure 3A), and the proteins they code for are highly interconnected in PPI networks. For example, considering the term “protein kinase activity”, the genes annotated for this term code for the proteins gsk3b cdkn1a cdk6 ccnd1 erbb2 akt1 met tgfbr1 egfr igf1r tgfbr2, all interacting with hundreds of proteins, according to IntAct database [17]. Interestingly, the mRNA which interacts with the highest number of microRNAs, more than one hundred, encodes for the Phosphatase and Tensin Homolog PTEN , a well-known tumour suppressor gene, which inhibits the PI3K/AKT growth signalling. PTEN is downregulated by several “oncogenic” microRNAs (see figure 5) which exert their tumorigenic function through this key phosphatase [42].
3.3. microRNAs Regulate Multiple Targets
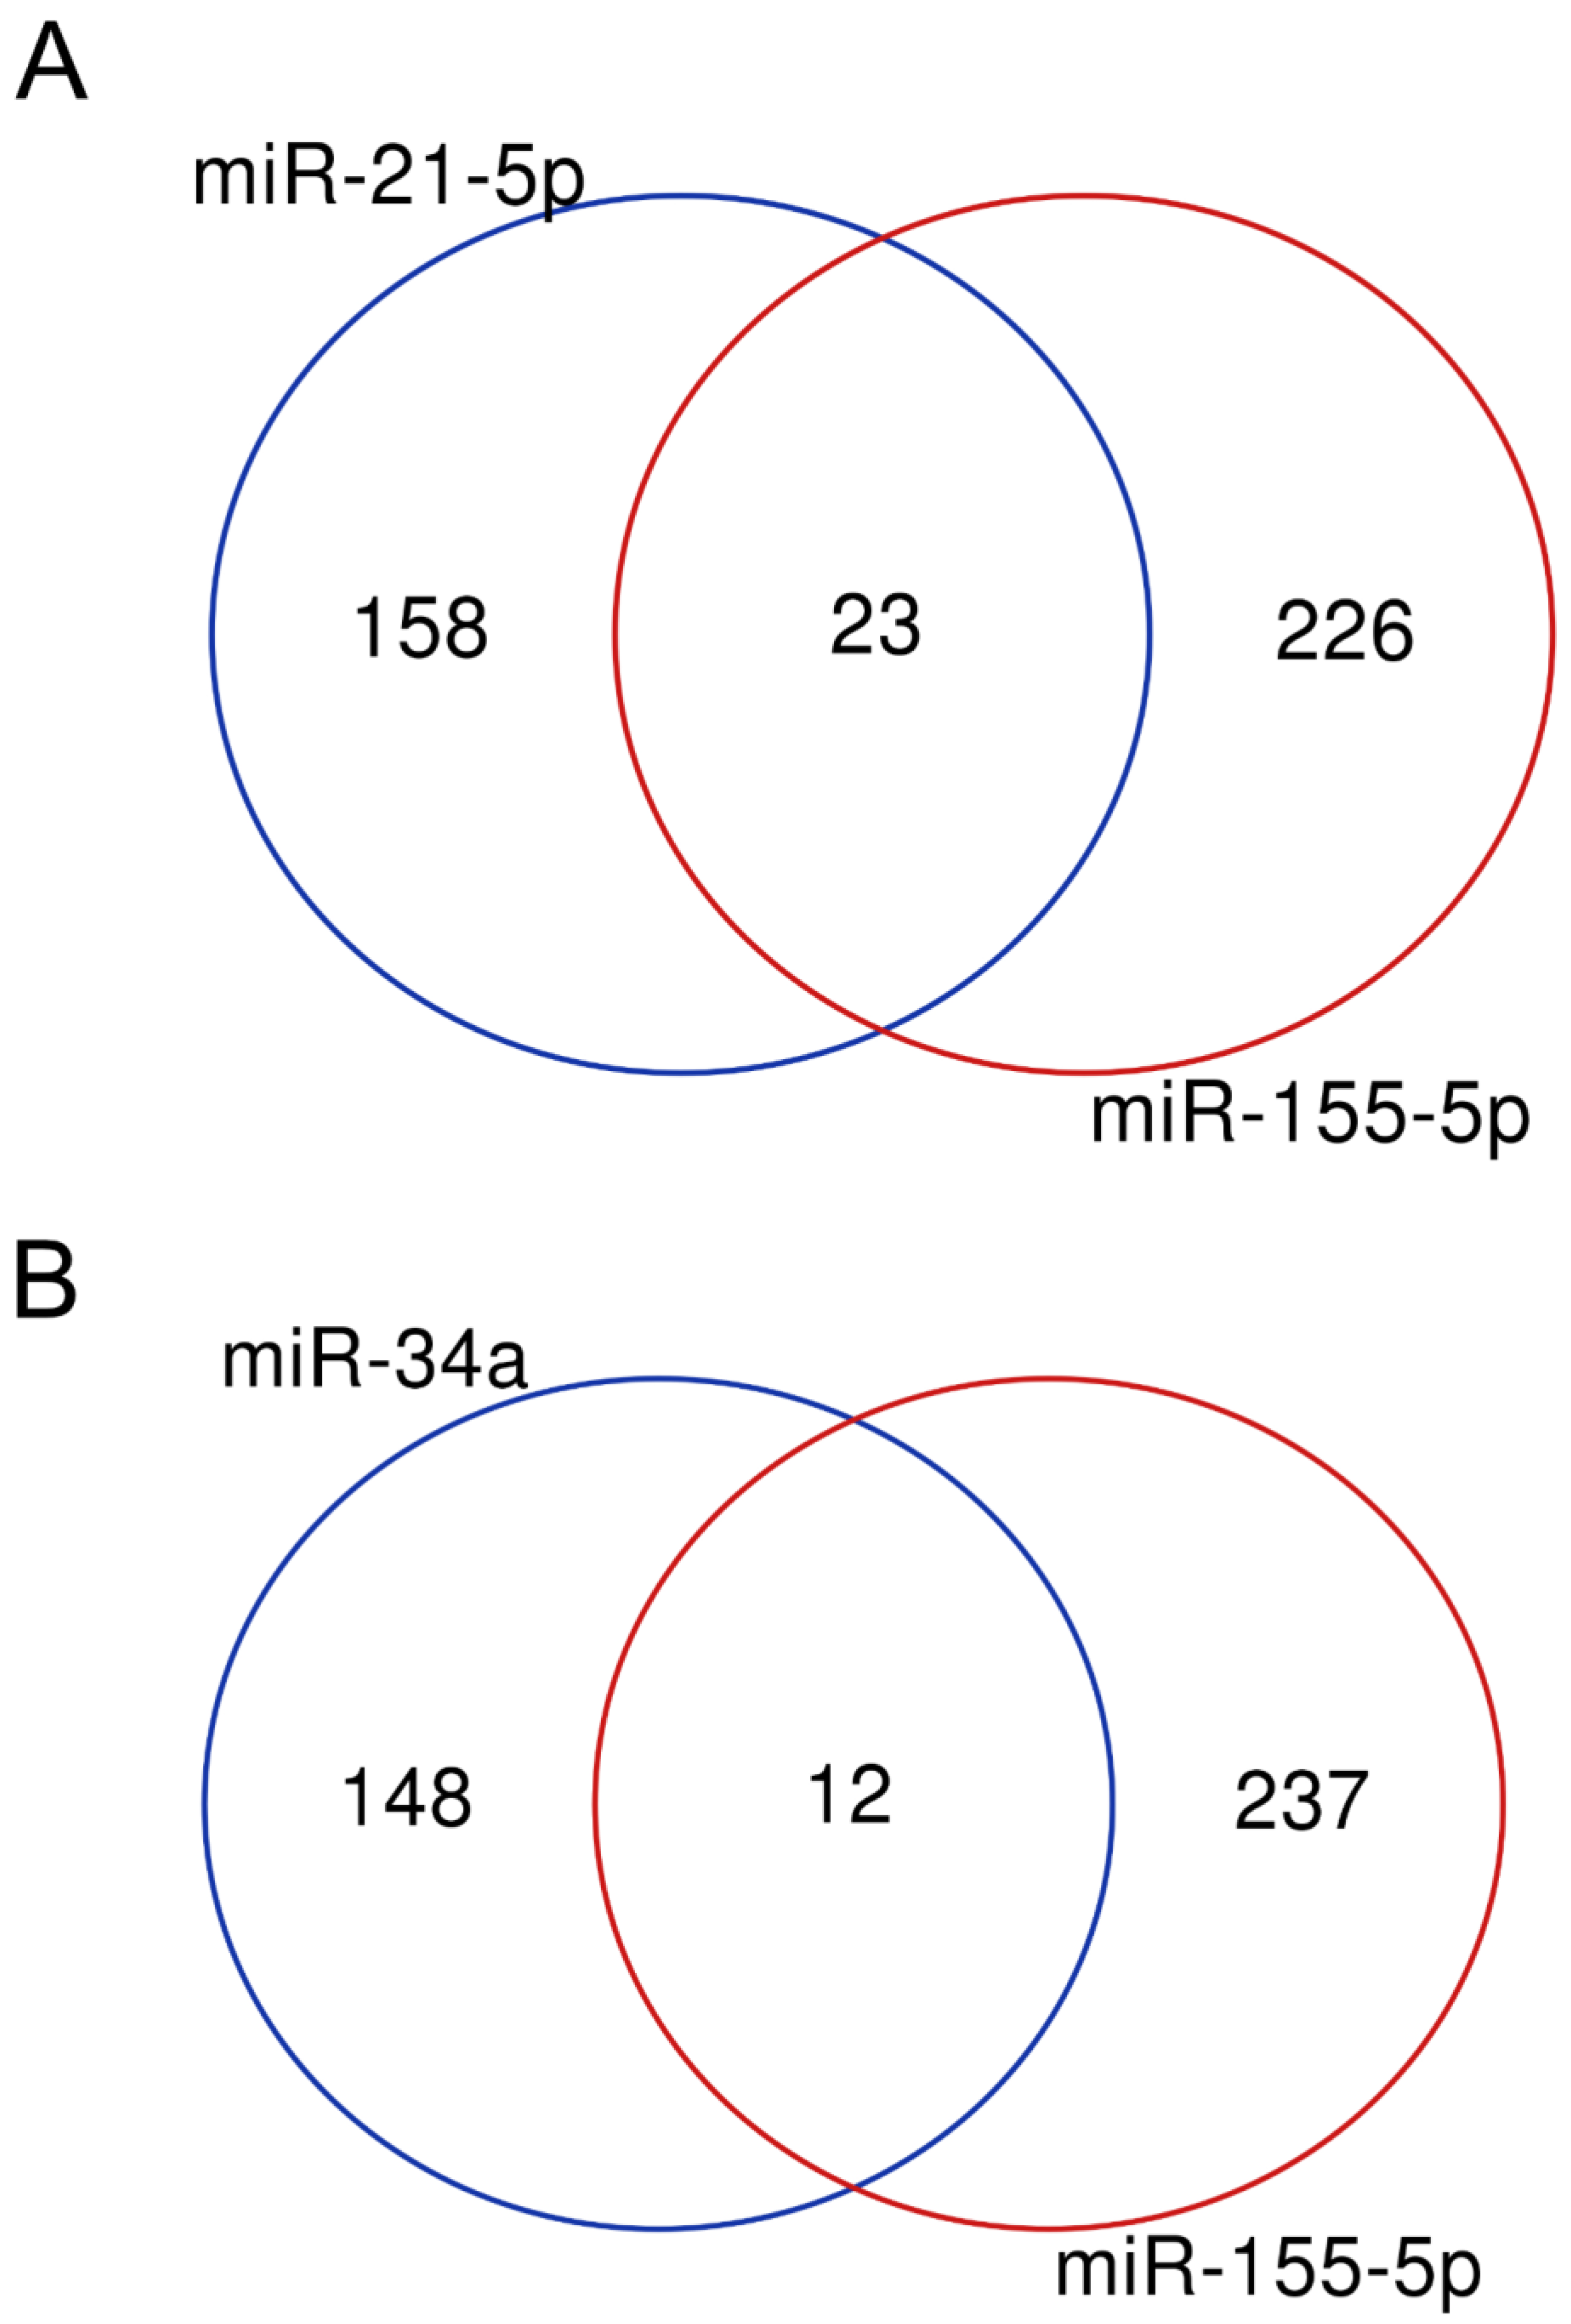
It has been proposed that one of the main functions of microRNAs is to modulate gene expression to finely coordinate the level of proteins involved in the same biological process or pathway. According to the dataset presented in this work, 590 microRNAs control more than 2 targets and 13, listed in Table 1, regulate more than 100 transcripts each (Supplementary Table 1). Many microRNAs are associated with cancer or other pathologies and their expression is deregulated in the affected cells [43]. Table 1 shows that miRNA controlling one hundred or more of genes are “oncomiR” or “tumour suppressor”, which means that they promote or repress cancer phenotype respectively. Despite their opposite effects, these microRNAs have some common targets: the Venn diagram in Figure 5 shows that 23 targets are in common between miR-155 and miR-21 (both described as oncomiR) and 12 genes are regulated by miR-155 (oncomiR) and miR-34a (tumour suppressor).
Figure 5.
OncomiR and suppressor microRNAs share common targets. A) Venn diagram showing the overlapping genes regulated by two oncomiR: miR-155 and miR-21. The 23 common targets are: dock1 pten myd88 nef pik3r1 apaf1 egfr msh6 socs6 smarca4 bcl2 bcl6 thrb cebpb bcl10 icam1 jun foxo1 socs1 vhl msh2 casp3 sox6. B) Venn diagram showing the overlapping genes regulated by the tumour suppressor miR-34a and the oncomiR miR-155. The 12 common targets are: xiap, nfe2l2, myb, spi1, rad51, csf1r, bcl2, agtr1, cebpb, bcl6, myc, ccnd1.
Interestingly, miR-155-5p is the most connected microRNA in the network, and it regulates approximately 260 genes. It is considered an oncomiR as it was found overexpressed in lymphoma, leukaemia and several solid tumours. In normal tissues, it is expressed at a very low level with the exception of hematopoietic cells, lymph nodes and spleen, which suggest its implication in inflammatory response. Indeed, pathway analysis tool on its targets shows that the list of regulated genes is enriched in proteins involved in: Interleukin-4 and Interleukin-13 signalling (15 genes), signalling by Interleukins (33 proteins), Cytokine Signalling in Immune system (39 proteins) and Immune System (68 proteins) (FDR 1.54E-11 , 3.51E-10, 1.66E-7 and 5,5 x E-4 respectively). It is also significantly enriched in both TLR3 and TLR4 cascade with 11 and 13 proteins respectively.
It has been suggested that genes regulated by the same microRNA may be involved in the same pathway to orchestrate the coregulation [48,49]. Consistently, we observed that several microRNAs controlling multiple genes, target more entities of a specific pathway. For example, miR206 regulates 6 genes (out of 15) involved in the Reactome “NFE2L2 regulates pentose phosphate pathway “ (R-HSA-9818028, FDR 6.18E-8), or miR 33a regulates 7 genes involved in Regulation of lipid metabolism by PPARalpha (R-HSA-400206, FDR 5.3E-9) as shown in Figure 6A. Interestingly, miR-105-5p downregulates 3 genes involved in the pathway “Regulation of lipid metabolism by PPARalpha”, while miR-105-3p, transcribed from the complementary strand, downregulates the hub PTEN, involved in the same pathway (Figure 6B).
3.4. The Length of the Untranslated Regions Do Not Correlate with the Abundance of Interactors
Most human protein-coding genes contain regions complementary to seed sequences of the microRNAs, that potentially mediate their binding. The seeds are short nucleotide sequences (approximately 6-7 nucleotides), so the complementary stretches may occur by chance in the transcripts without mirroring any regulative function. For example, 6 nucleotides may occur accidentally every 4096 nucleotides, and the longer is the transcript sequence, the more likely it will contain potential microRNA binders. The number of potential binding sites is even larger due to the fact that the base pairing rarely needs a perfect match in animals but few mismatching are also allowed [6,7]. Interestingly, the average length of UTR has been correlated with species complexity, even within vertebrates [50,51]. Moreover, it has been demonstrated that different transcript isoforms, bearing longer/shorter UTRs, may be differentially regulated by microRNAs [52,53].
We performed a simple test, comparing the 3’ UTR length of a sample of transcripts with the number of interactors experimentally verified and the number of predicted binding sites, to verify if more regulated mRNAs bear longer untranslated regions. The sample included highly connected mRNAs as well as transcripts with no verified interactors (Supplementary Table 4). To estimate the predicted binding sites, we selected two high-performance prediction tools: MiRDB [54] and MirWalk [55], both using additional criteria besides the matching sequence, spanning from deep learning from high-throughput data, or expression profiling data, to energetic considerations.
As expected, the two predictors returned some common as well as some different microRNAs and in both cases we found a significant positive correlation between the UTR lengths and the binding sites predicted (r=0.654 for miRDB and 0.737 for MirWalk). On the contrary, when comparing the length of the UTR regions with the number of microRNAs that were demonstrated to bind them, we found very low correlation (r=0.312) suggesting that the true binding sites are selected and maintained and do not depend on the length of the sequence. Surprisingly, several of the sequences predicted to have hundreds of potential interactors, have not been demonstrated for any of them, generating an unexpected discrepancy between the number of predicted versus verified binders (Supplementary Table 4).
4. Discussion
Since the relevance of the microRNA-mediated, post-transcriptional regulation is supported by evidence from thousands of studies, in normal cells and pathologies, a paradox must be fixed, as the amount of protein or mRNA that decreases in response to the expression of a microRNA is quite limited, and the rate of repression is usually in the range of 2-3 folds, making it difficult to explain the phenotypes observed in microRNA knockdowns [10,56]. This points to the possibility that microRNAs exert their most evident functions regulating key genes such as master transcription factors, and that they may act on more genes involved in the same process or pathway, thus potentiating the final effect. This is consistent with previous observations, obtained on a predicted microRNA-mRNA network, where extensive interactions between microRNAs and transcription factors were highlighted [40]. Notably, feed-forward loops were also shown, with transcription factors regulating microRNAs which downregulate them, or both co-regulating a third protein [57]. For example, Myc activates the expression of the the transcription factor E2F1 and of the miR-17 cluster, composed of six miRNAs, comprising miR-17, miR18a, miR19a, miR20, miR19b, and miR92 [58], which, in turn, control E2F1 level [59]. Genome-wide profiling of the transcriptome will help in elucidating which regulative proteins control microRNA expression, better clarifying the extension of the cross-talk [60]
In this study, the analysis of a collection of trustworthy targets have confirmed that microRNAs finely control driver transcription factors and other key regulatory proteins. In fact, we show a remarkable enrichment of transcription factors among highly regulated mRNAs, yet limited to a defined subgroup of genes, possibly those determining the cell fate. For example, Zeb, Twist1 and Snai1 have been recognised as EMT drivers [61], and all of them are controlled by more than 20 miRNAs (Supplementary Table 3).
Regulatory circuitries are commonly tampered in cancer cells and in other diseases, so they are likely to represent optimal therapeutic targets. Indeed, many cancer associated genetic mutations bear down on genes and DNA regions involved in the transcriptional and post-transcriptional control, as transcription factors, signalling proteins, chromatin modifying enzymes or ncRNAs. Inhibitors of oncogenic transcription factors and oncomiRs have recently entered in clinical trials [45], so that elucidating the interplay between different levels of regulation is crucial to predict the effect of interfering drugs and molecules. The presence of multiple overlapping targets for microRNAs candidated for therapies (Figure 5, Table 2), suggests the urgency of an in-depth understanding of the full picture of relationships.
The purpose to complete a trustworthy microRNA-mRNA interaction network is still far to be achieved: the intersection between low scale luciferase assay network (this study) and the network obtained with a high throughput CLASH approach [16], corresponds to less than 1% of the interactions (data not shown), pointing to incompleteness on both sides, similarly to the first attempts to deciphering PPI networks [62]
On the other hand, information coming from high-throughput experiments and predictions weaken the reliability of the result interpretation [63]. A similar problem, concerning the reliability of protein-protein interactions (PPI), was handled in the last 20 years by the IMEx consortium [21], by defining guidelines as what to consider experimental proof of binding and by adding a score of reliability to each interaction [64], which consider, among the others, how many times it has been described in the literature. In the IntAct database, the same score was applied to evaluate microRNA interactions, but the amount of data concerning microRNAs is still too limited to allow for filtering [13]. Several PPI databases follow common principles in order to offer highly reliable data to the user [21]. On the contrary, ncRNAs are mainly collected in independent resources, following different criteria not always clear to the user [65]. Moreover, the integration of gene regulatory networks (GRN) with post-transcriptional regulation is still at its infancy [66]. As the relevance of this intricate and dynamic interplay which determines the cell fate is clearly emerging, an in-depth understanding of the global and local architecture of the regulatory system is certainly needed.
5. Conclusions
Countless studies have contributed to the elucidation of the effects of microRNAs on specific genes, but very little is still certain about the extent of regulation mediated by microRNAs and how they cooperate with the other layers of regulation. Transcriptional and post-transcriptional effects certainly contribute to the final expression level, but the knowledge in the two fields is still modestly interconnected. Moreover, the excess of potential binding sites, largely exceeding the microRNA abundance, imply that the regulation may be sensitive to microRNA levels [7], which also should be taken into account when drawing models.
Despite the lacking knowledge on the biology of ncRNAs, from the regulation of their expression to their function, and even on their coherent classification, there is no doubt as to these molecules have made a revolution in our understanding of the cell behaviour and must, from now on, be taken in consideration on any perturbation prediction.
Supplementary Materials
The following supporting information can be downloaded at: www.mdpi.com/xxx/s1, Supplementary Figure 1 Diagram showing the relationships among GO terms enriched in genes regulated by more than 25 microRNAs. The diagram was drawn with VLAD tool [32]. Supplementary Table 1 Complete list of nodes of the microRNA-mRNA network with the number of edges (degree value). The degree number was calculated by Cytoscape App [23]. Supplementary Table 2 GO Molecular Function enrichment in hub genes in respect to the whole genome, according to BinGO, (p < 0,0005) [33] . Most significant terms, selected as representative for Figure 3 were highlighted in pale green or yellow. The two sheets contain the results for genes with 25 microRNAs (used in Figure 3) and with 20 microRNAs respectively. The enrichment for the selected classes is confirmed in both. Supplementary Table 3 Comparison between the number of microRNAs regulating each transcription factor and the number of genes regulated by the transcription factor (retrieved from TFlink, “small scale dataset”). The master transcription factors are regulated by multiple microRNAs, while most of the others are not. Supplementary Table 4 3’ UTR lengths of a sample of transcripts, compared with the number of predicted and verified interactors.
Author Contributions
Conceptualization, S.P Methodology, Investigation and Validation SP, RP. Data curation SP. Writing—original draft preparation SP. writing —review and editing, S.P and R.P All authors have read and agreed to the published version of the manuscript.”
Funding
This research was supported by “Fondi di Ateneo” 2022 from Università della Calabria to SP.
Institutional Review Board Statement
Not applicable
Informed Consent Statement
Not applicable
Data Availability Statement
All data are available in public repositories.
Acknowledgments
S.P would like to thank Ruth Lovering for suggestions on gene enrichment tools, and members of the IMEx consortium and participants to COST action CA15205 for fruitful discussion on molecular interaction standards.
Conflicts of Interest
The authors declare no conflicts of interest. The funders had no role in the design of the study; in the collection, analyses, or interpretation of data; in the writing of the manuscript; or in the decision to publish the results.
References
- Lee RC, Feinbaum RL, Ambros V. The C. elegans heterochronic gene lin-4 encodes small RNAs with antisense complementarity to lin-14. Cell. 1993 Dec 3;75(5):843-54. PMID: 8252621. [CrossRef]
- Fire, A., Xu, S., Montgomery, M. et al. Potent and specific genetic interference by double-stranded RNA in Caenorhabditis elegans. Nature 391, 806–811 (1998). [CrossRef]
- Duchaine TF, Fabian MR. Mechanistic Insights into MicroRNA-Mediated Gene Silencing. Cold Spring Harb Perspect Biol. 2019 Mar 1;11(3):a032771. PMID: 29959194; PMCID: PMC6396329. [CrossRef]
- Diener C, Keller A, Meese E. The miRNA-target interactions: An underestimated intricacy. Nucleic Acids Res. 2024 Feb 28;52(4):1544-1557. PMID: 38033323; PMCID: PMC10899768. [CrossRef]
- Schäfer M, Ciaudo C. Prediction of the miRNA interactome - Established methods and upcoming perspectives. Comput Struct Biotechnol J. 2020 Mar 5;18:548-557. PMID: 32211130; PMCID: PMC7082591. [CrossRef]
- Quillet A, Anouar Y, Lecroq T, Dubessy C. Prediction methods for microRNA targets in bilaterian animals: Toward a better understanding by biologists. Comput Struct Biotechnol J. 2021 Oct 18;19:5811-5825. PMID: 34765096; PMCID: PMC8567327. [CrossRef]
- Bartel DP. Metazoan MicroRNAs. Cell. 2018 Mar 22;173(1):20-51. PMID: 29570994; PMCID: PMC6091663. [CrossRef]
- Guo H, Ingolia NT, Weissman JS, Bartel DP. Mammalian microRNAs predominantly act to decrease target mRNA levels. Nature. 2010 Aug 12;466(7308):835-40. PMID: 20703300; PMCID: PMC2990499. [CrossRef]
- Lewis,B.P., Shih I -,H., Jones-Rhoades,M.W. et al. (2003) Prediction of mammalian microRNA targets. Cell, 115,787–798.
- Kakumani PK. AGO-RBP crosstalk on target mRNAs: Implications in miRNA-guided gene silencing and cancer. Transl Oncol. 2022 Jul;21:101434. Epub 2022 Apr 26. PMID: 35477066; PMCID: PMC9136600. [CrossRef]
- RNAcentral Consortium. RNAcentral 2021: secondary structure integration, improved sequence search and new member databases. Nucleic Acids Res. 2021 Jan 8;49(D1):D212-D220. PMID: 33106848; PMCID: PMC7779037. [CrossRef]
- Panni S, Prakash A, Bateman A, Orchard S. The yeast noncoding RNA interaction network. RNA. 2017 Oct;23(10):1479-1492. Epub 2017 Jul 12. PMID: 28701522; PMCID: PMC5602107. [CrossRef]
- Simona Panni, Kalpana Panneerselvam, Pablo Porras, Margaret Duesbury, Livia Perfetto, Luana Licata, Henning Hermjakob, Sandra Orchard, The landscape of microRNA interaction annotation: analysis of three rare disorders as a case study, Database, Volume 2023, 2023, baad066. [CrossRef]
- Huntley RP, Kramarz B, Sawford T, Umrao Z, Kalea A, Acquaah V, Martin MJ, Mayr M, Lovering RC. Expanding the horizons of microRNA bioinformatics. RNA. 2018 Aug;24(8):1005-1017. Epub 2018 Jun 5. PMID: 29871895; PMCID: PMC6049505. [CrossRef]
- Chi SW, Zang JB, Mele A, Darnell RB. Argonaute HITS-CLIP decodes microRNA-mRNA interaction maps. Nature. 2009 Jul 23;460(7254):479-86. Epub 2009 Jun 17. PMID: 19536157; PMCID: PMC2733940. [CrossRef]
- Helwak A, Kudla G, Dudnakova T, Tollervey D. Mapping the human miRNA interactome by CLASH reveals frequent noncanonical binding. Cell. 2013 Apr 25;153(3):654-65. PMID: 23622248; PMCID: PMC3650559. [CrossRef]
- Del Toro N, Shrivastava A, Ragueneau E, Meldal B, Combe C, Barrera E, Perfetto L, How K, Ratan P, Shirodkar G, Lu O, Mészáros B, Watkins X, Pundir S, Licata L, Iannuccelli M, Pellegrini M, Martin MJ, Panni S, Duesbury M, Vallet SD, Rappsilber J, Ricard-Blum S, Cesareni G, Salwinski L, Orchard S, Porras P, Panneerselvam K, Hermjakob H. The IntAct database: efficient access to fine-grained molecular interaction data. Nucleic Acids Res. 2022 Jan.
- Huang HD. miRTarBase update 2022: an informative resource for experimentally validated miRNA-target interactions. Nucleic Acids Res. 2022 Jan 7;50(D1):D222-D230. PMID: 34850920; PMCID: PMC8728135. [CrossRef]
- Zhang Y, Lin J, Cui T, Hu Y, Tan P, Cheng J, Zheng H, Wang D, Su X, Chen W, Huang Y. RNAInter v4.0: RNA interactome repository with redefined confidence scoring system and improved accessibility. Nucleic Acids Res. 2022 Jan 7;50(D1):D326-D332. PMID: 34718726; PMCID: PMC8728132. [CrossRef]
- Binns, D., Dimmer, E., Huntley, D. B., O’Donovan, C., and Apweiler, R. (2009).
- QuickGO: a web-based tool for gene ontology searching. Bioinformatics 25 (22),.
- 3045–3046. [CrossRef]
- Porras P, Barrera E, Bridge A, Del-Toro N, Cesareni G, Duesbury M, Hermjakob H, Iannuccelli M, Jurisica I, Kotlyar M, Licata L, Lovering RC, Lynn DJ, Meldal B, Nanduri B, Paneerselvam K, Panni S, Pastrello C, Pellegrini M, Perfetto L, Rahimzadeh N, Ratan P, Ricard-Blum S, Salwinski L, Shirodkar G, Shrivastava A, Orchard S. Towards a unified open access dataset of molecular interactions. Nat Commun. 2020 Dec 1;11(1):6144. PMID: 33262342; PMCID: PMC7708836. [CrossRef]
- UniProt Consortium. UniProt: the Universal Protein Knowledgebase in 2023. Nucleic Acids Res. 2023 Jan 6;51(D1):D523-D531. PMID: 36408920; PMCID: PMC9825514. [CrossRef]
- Shannon P, Markiel A, Ozier O, Baliga NS, Wang JT, Ramage D, Amin N, Schwikowski B, Ideker T. Cytoscape: a software environment for integrated models of biomolecular interaction networks. Genome Res. 2003 Nov;13(11):2498-504. PMID: 14597658; PMCID: PMC403769. [CrossRef]
- Lovering RC, Gaudet P, Acencio ML, Ignatchenko A, Jolma A, Fornes O, Kuiper M, Kulakovskiy IV, Lægreid A, Martin MJ, Logie C. A GO catalogue of human DNA-binding transcription factors. Biochim Biophys Acta Gene Regul Mech. 2021 Nov-Dec;1864(11-12):194765. Epub 2021 Oct 18. PMID: 34673265. [CrossRef]
- Liska O, Bohár B, Hidas A, Korcsmáros T, Papp B, Fazekas D, Ari E (2022) TFLink: An integrated gateway to access transcription factor - target gene interactions for multiple species. Database, baac083.
- Paulo I Prado, Murilo Dantas Miranda and Andre Chalom (2024) sads: Maximum Likelihood Models for Species Abundance Distributions. R package version 0.6.3 (https://CRAN.R-project.org/package=sads).
- Hausser J and Strimmer K (2009) Entropy Inference and the James-Stein Estimator, with Application to Nonlinear Gene Association Networks. Journal of Machine Learning Research 10 (2009) 1469-1484.
- Zheng, L. 2019. Using mutual information as a cocitation similarity measure . Scientometrics, 119: 1695-1713.
- Jeuken, G. S. & Käll, L. 2024. Pathway analysis through mutual information Bioinformatics, 40: btad776.
- Neeson, T. M. & Mandelik, Y. 2014. Pairwise measures of species co-occurrence for choosing indicator species and quantifying overlap . Ecological Indicators, 45: 721-727.
- Kolberg L, Raudvere U, Kuzmin I, Adler P, Vilo J, Peterson H. g:Profiler-interoperable web service for functional enrichment analysis and gene identifier mapping (2023 update). Nucleic Acids Res. 2023 Jul 5;51(W1):W207-W212. PMID: 37144459; PMCID: PMC10320099. [CrossRef]
- Richardson JE, Bult CJ. Visual annotation display (VLAD): a tool for finding functional themes in lists of genes. Mamm Genome. 2015 Oct;26(9-10):567-73. Epub 2015 Jun 6. PMID: 26047590; PMCID: PMC4602057. [CrossRef]
- Maere,S., Heymans,K. and Kuiper,M. (2005) BiNGO: a Cytoscape plugin to assess overrepresentation of gene ontol-ogy categories in biological networks. Bioinformatics, 21,3448–3449.
- Griss J, Viteri G, Sidiropoulos K, Nguyen V, Fabregat A, Hermjakob H. ReactomeGSA - Efficient Multi-Omics Comparative Pathway Analysis. Mol Cell Proteomics. 2020 Sep 9. PubMed PMID: 32907876. Da studiare ma meglio quello sopra come referenza. [CrossRef]
- Yuhao Chen and Xiaowei Wang (2020) miRDB: an online database for prediction of functional microRNA targets. Nucleic Acids Research. 48(D1):D127-D131.
- Sticht C, De La Torre C, Parveen A, Gretz N. miRWalk: An online resource for prediction of microRNA binding sites. PLoS One. 2018 Oct 18;13(10):e0206239. PMID: 30335862; PMCID: PMC6193719. [CrossRef]
- Schloerke B, Cook D, Larmarange J, Briatte F, Marbach M, Thoen E, Elberg A, Crowley J (2021). _GGally: Extension to 'ggplot2'_. R package version 2.1.2, <https://CRAN.R-project.org/package=GGally>.
- R Core Team (2023). R: A language and environment for statistical computing. R Foundation for Statistical Computing, Vienna, Austria. URL https://www.R-project.org/.
- Ahmed SH, Deng AT, Huntley RP, Campbell NH, Lovering RC. Capturing heart valve development with Gene Ontology. Front Genet. 2023 Oct 17;14:1251902. PMID: 37915827; PMCID: PMC10616796. [CrossRef]
- Shalgi R, Lieber D, Oren M, Pilpel Y. Global and local architecture of the mammalian microRNA-transcription factor regulatory network. PLoS Comput Biol. 2007 Jul;3(7):e131. PMID: 17630826; PMCID: PMC1914371. [CrossRef]
- Vikram Agarwal, George W Bell, Jin-Wu Nam, David P Bartel (2015) Predicting effective microRNA target sites in mammalian mRNAs eLife 4:e05005.
- Ghafouri-Fard S, Abak A, Shoorei H, Mohaqiq M, Majidpoor J, Sayad A, Taheri M. Regulatory role of microRNAs on PTEN signaling. Biomed Pharmacother. 2021 Jan;133:110986. Epub 2020 Nov 7. PMID: 33166764. [CrossRef]
- Kim T, Croce CM. MicroRNA: trends in clinical trials of cancer diagnosis and therapy strategies. Exp Mol Med. 2023 Jul;55(7):1314-1321. Epub 2023 Jul 10. PMID: 37430087; PMCID: PMC10394030. [CrossRef]
- Inoue J, Inazawa J. Cancer-associated miRNAs and their therapeutic potential. J Hum Genet. 2021 Sep;66(9):937-945. Epub 2021 Jun 4. PMID: 34088973.). [CrossRef]
- Rupaimoole R, Slack FJ. MicroRNA therapeutics: towards a new era for the management of cancer and other diseases. Nat Rev Drug Discov. 2017 Mar;16(3):203-222. Epub 2017 Feb 17. PMID: 28209991. [CrossRef]
- He L, Thomson JM, Hemann MT, Hernando-Monge E, Mu D, Goodson S, Powers S, Cordon-Cardo C, Lowe SW, Hannon GJ, Hammond SM. A microRNA polycistron as a potential human oncogene. Nature. 2005 Jun 9;435(7043):828-33. PMID: 15944707; PMCID: PMC4599349. [CrossRef]
- Gambari R, Brognara E, Spandidos DA, Fabbri E. Targeting oncomiRNAs and mimicking tumor suppressor miRNAs: Νew trends in the development of miRNA therapeutic strategies in oncology (Review). Int J Oncol. 2016 Jul;49(1):5-32. Epub 2016 May 4. PMID: 27175518; PMCID: PMC4902075. [CrossRef]
- Kehl T, Kern F, Backes C, Fehlmann T, Stöckel D, Meese E, Lenhof HP, Keller A. miRPathDB 2.0: a novel release of the miRNA Pathway Dictionary Database. Nucleic Acids Res. 2020 Jan 8;48(D1):D142-D147. PMID: 31691816; PMCID: PMC7145528. [CrossRef]
- Kern F, Krammes L, Danz K, Diener C, Kehl T, Küchler O, Fehlmann T, Kahraman M, Rheinheimer S, Aparicio-Puerta E, Wagner S, Ludwig N, Backes C, Lenhof HP, von Briesen H, Hart M, Keller A, Meese E. Validation of human microRNA target pathways enables evaluation of target prediction tools. Nucleic Acids Res. 2021 Jan 11;49(1):127-144. PMID: 33305319; PMCID: PMC7797041. [CrossRef]
- Doran G. The short and the long of UTRs. J RNAi Gene Silencing. 2008 May 27;4(1):264-5. PMID: 19771235; PMCID: PMC2737238.
- Mazumder B, Seshadri V, Fox PL. Translational control by the 3'-UTR: the ends specify the means. Trends Biochem Sci. 2003 Feb;28(2):91-8. PMID: 12575997. [CrossRef]
- Nam JW, Rissland OS, Koppstein D, Abreu-Goodger C, Jan CH, Agarwal V, Yildirim MA, Rodriguez A, Bartel DP. Global analyses of the effect of different cellular contexts on microRNA targeting. Mol Cell. 2014 Mar 20;53(6):1031-1043. Epub 2014 Mar 13. PMID: 24631284; PMCID: PMC4062300. [CrossRef]
- Varendi K, Kumar A, Härma MA, Andressoo JO. miR-1, miR-10b, miR-155, and miR-191 are novel regulators of BDNF. Cell Mol Life Sci. 2014 Nov;71(22):4443-56. Epub 2014 May 8. PMID: 24804980; PMCID: PMC4207943. [CrossRef]
- Chen Y, Wang X. miRDB: an online database for prediction of functional microRNA targets. Nucleic Acids Res. 2020 Jan 8;48(D1):D127-D131. PMID: 31504780; PMCID: PMC6943051. [CrossRef]
- Sticht C, De La Torre C, Parveen A, Gretz N. miRWalk: An online resource for prediction of microRNA binding sites. PLoS One. 2018 Oct 18;13(10):e0206239. PMID: 30335862; PMCID: PMC6193719. [CrossRef]
- Selbach M, Schwanhäusser B, Thierfelder N, Fang Z, Khanin R, Rajewsky N. Widespread changes in protein synthesis induced by microRNAs. Nature. 2008 Sep 4;455(7209):58-63. Epub 2008 Jul 30. PMID: 18668040. [CrossRef]
- Panni S., Corbelli A., Sztuba-Solinska J. (2023) Regulation of non-coding.
- NAs (Book Chapter) Ch06 in “Navigating Non-coding RNA: From Biogenesis to Therapeutic Application” (Elsevier) p209-271.
- O’Donnell, K. A., Wentzel, E. A., Zeller, K. I., Dang, C. v., & Mendell, J. T. (2005). c-Myc-regulated microRNAs modulate E2F1 expression. Nature, 435(7043). [CrossRef]
- Martinez, N. J., & Walhout, A. J. M. (2009). The interplay between transcription factors and microRNAs in genome-scale regulatory networks. BioEssays, 31(4). [CrossRef]
- Alam T, Agrawal S, Severin J, Young RS, Andersson R, Arner E, Hasegawa A, Lizio M, Ramilowski JA, Abugessaisa I, Ishizu Y, Noma S, Tarui H, Taylor MS, Lassmann T, Itoh M, Kasukawa T, Kawaji H, Marchionni L, Sheng G, R R Forrest A, Khachigian LM, Hayashizaki Y, Carninci P, de Hoon MJL. Comparative transcriptomics of primary cells in vertebrates. Genome Res. 2020 Jul;30(7):951-961. Epub 2020 Jul 27. PMID: 32718981; PMCID: PMC7397866. [CrossRef]
- Migault M, Sapkota S, Bracken CP. Transcriptional and post-transcriptional control of epithelial-mesenchymal plasticity: why so many regulators? Cell Mol Life Sci. 2022 Mar 12;79(3):182. PMID: 35278142; PMCID: PMC8918127. [CrossRef]
- Ito T, Chiba T, Ozawa R, Yoshida M, Hattori M, Sakaki Y. A comprehensive two-hybrid analysis to explore the yeast protein interactome. Proc Natl Acad Sci U S A. 2001 Apr 10;98(8):4569-74. Epub 2001 Mar 13. PMID: 11283351; PMCID: PMC31875. [CrossRef]
- Huntley RP, Sitnikov D, Orlic-Milacic M, Balakrishnan R, D'Eustachio P, Gillespie ME, Howe D, Kalea AZ, Maegdefessel L, Osumi-Sutherland D, Petri V, Smith JR, Van Auken K, Wood V, Zampetaki A, Mayr M, Lovering RC. Guidelines for the functional annotation of microRNAs using the Gene Ontology. RNA. 2016 May;22(5):667-76. Epub 2016 Feb 25. PMID: 26917558; PMCID: PMC4836642. [CrossRef]
- Villaveces JM, Jiménez RC, Porras P, Del-Toro N, Duesbury M, Dumousseau M, Orchard S, Choi H, Ping P, Zong NC, Askenazi M, Habermann BH, Hermjakob H. Merging and scoring molecular interactions utilising existing community standards: tools, use-cases and a case study. Database (Oxford). 2015 Feb 4;2015:bau131. PMID: 25652942; PMCID: PMC4316181. [CrossRef]
- Antonazzo G, Gaudet P, Lovering RC, Attrill H. Representation of non-coding RNA-mediated regulation of gene expression using the Gene Ontology. RNA Biol. 2024 Jan;21(1):36-48. Epub 2024 Oct 7. PMID: 39374113; PMCID: PMC11459742. [CrossRef]
- Kuiper M, Bonello J, Fernández-Breis JT, Bucher P, Futschik ME, Gaudet P, Kulakovskiy IV, Licata L, Logie C, Lovering RC, Makeev VJ, Orchard S, Panni S, Perfetto L, Sant D, Schulz S, Vercruysse S, Zerbino DR, Lægreid A; GRECO Consortium. The gene regulation knowledge commons: the action area of GREEKC. Biochim Biophys Acta Gene Regul Mech. 2022 Jan;1865(1):194768. Epub 2021 Oct 30. PMID: 34757206. [CrossRef]
Figure 1.
Quality control pipeline for microRNA-mRNA interaction network. Data were downloaded from IntAct, miRTarBase, QuickGO and RNAinter and filtered for low-throughput experiments which demonstrate the direct binding.
Figure 1.
Quality control pipeline for microRNA-mRNA interaction network. Data were downloaded from IntAct, miRTarBase, QuickGO and RNAinter and filtered for low-throughput experiments which demonstrate the direct binding.
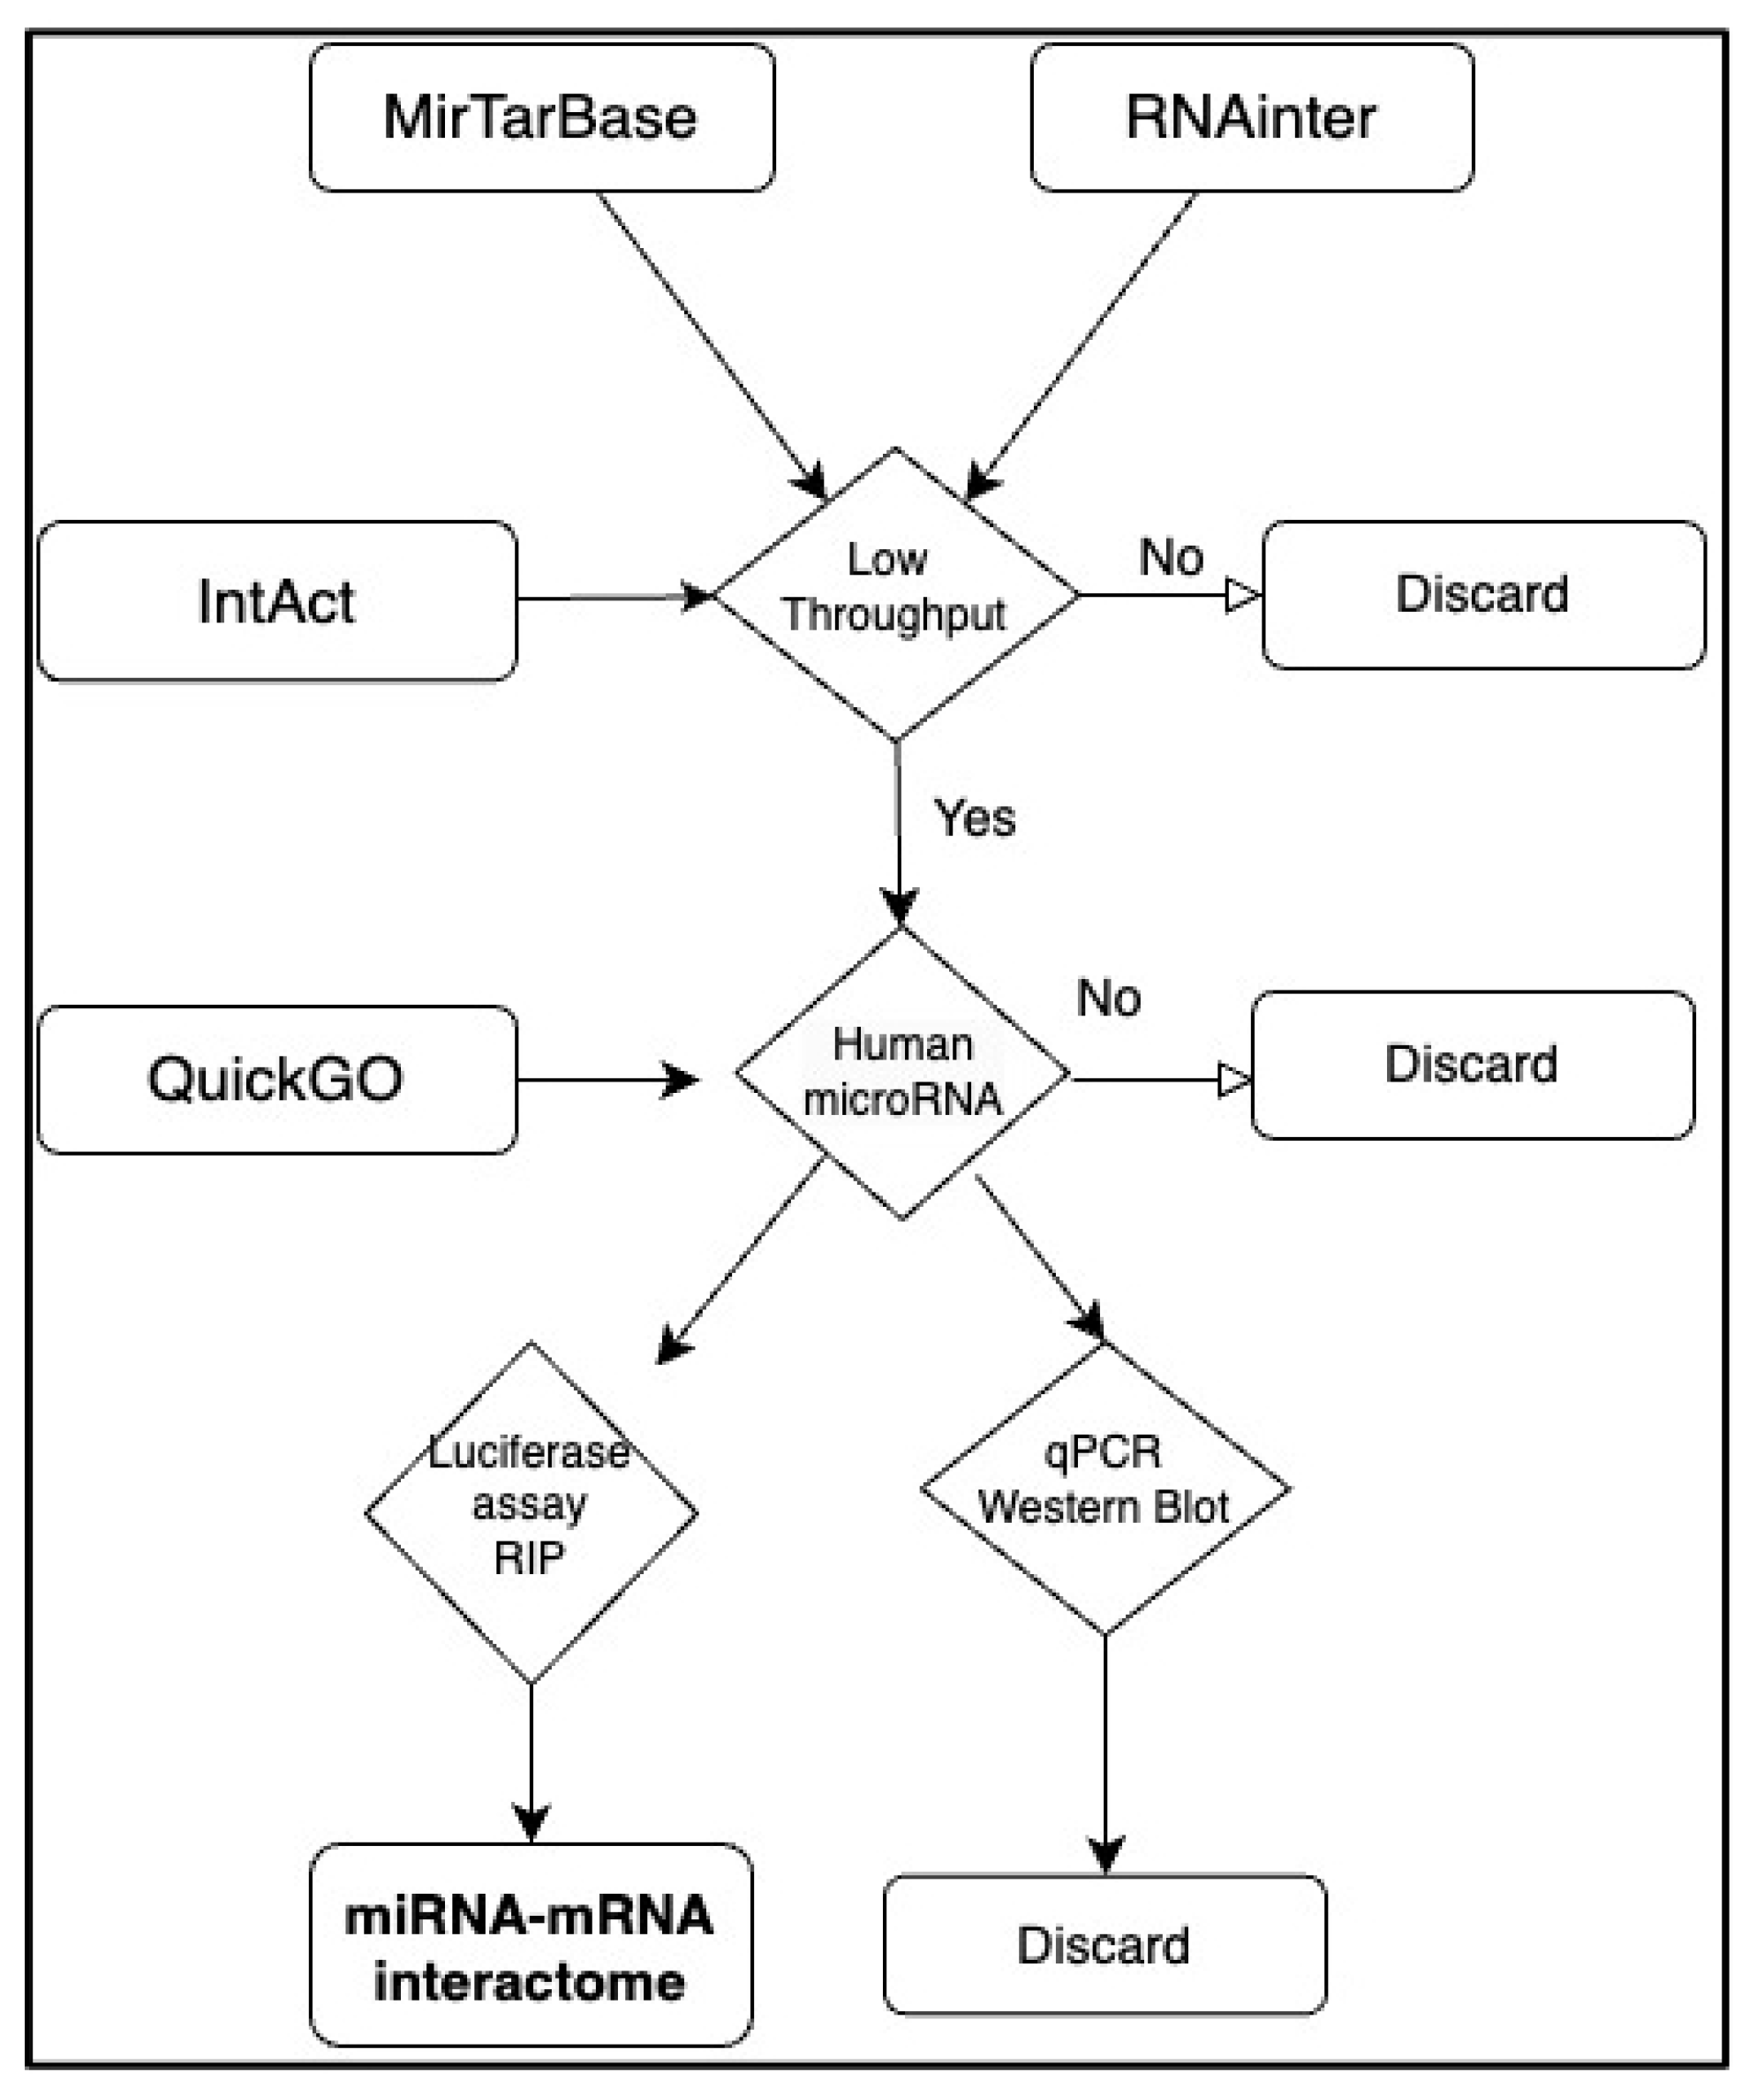
Figure 2.
Properties of the human mRNA-microRNA network. A) mRNA degree distribution fitting a power-law. Degree were divided in classes corresponding to interactor numbers and the rank of each class was plotted against its abundance B) Pie-charts of the mRNA network, showing the frequencies of degree classes in different colours. For convenience classes were grouped as indicated C) microRNA degree distribution, as in A. D) Pie-chart of the microRNA network, as in B.
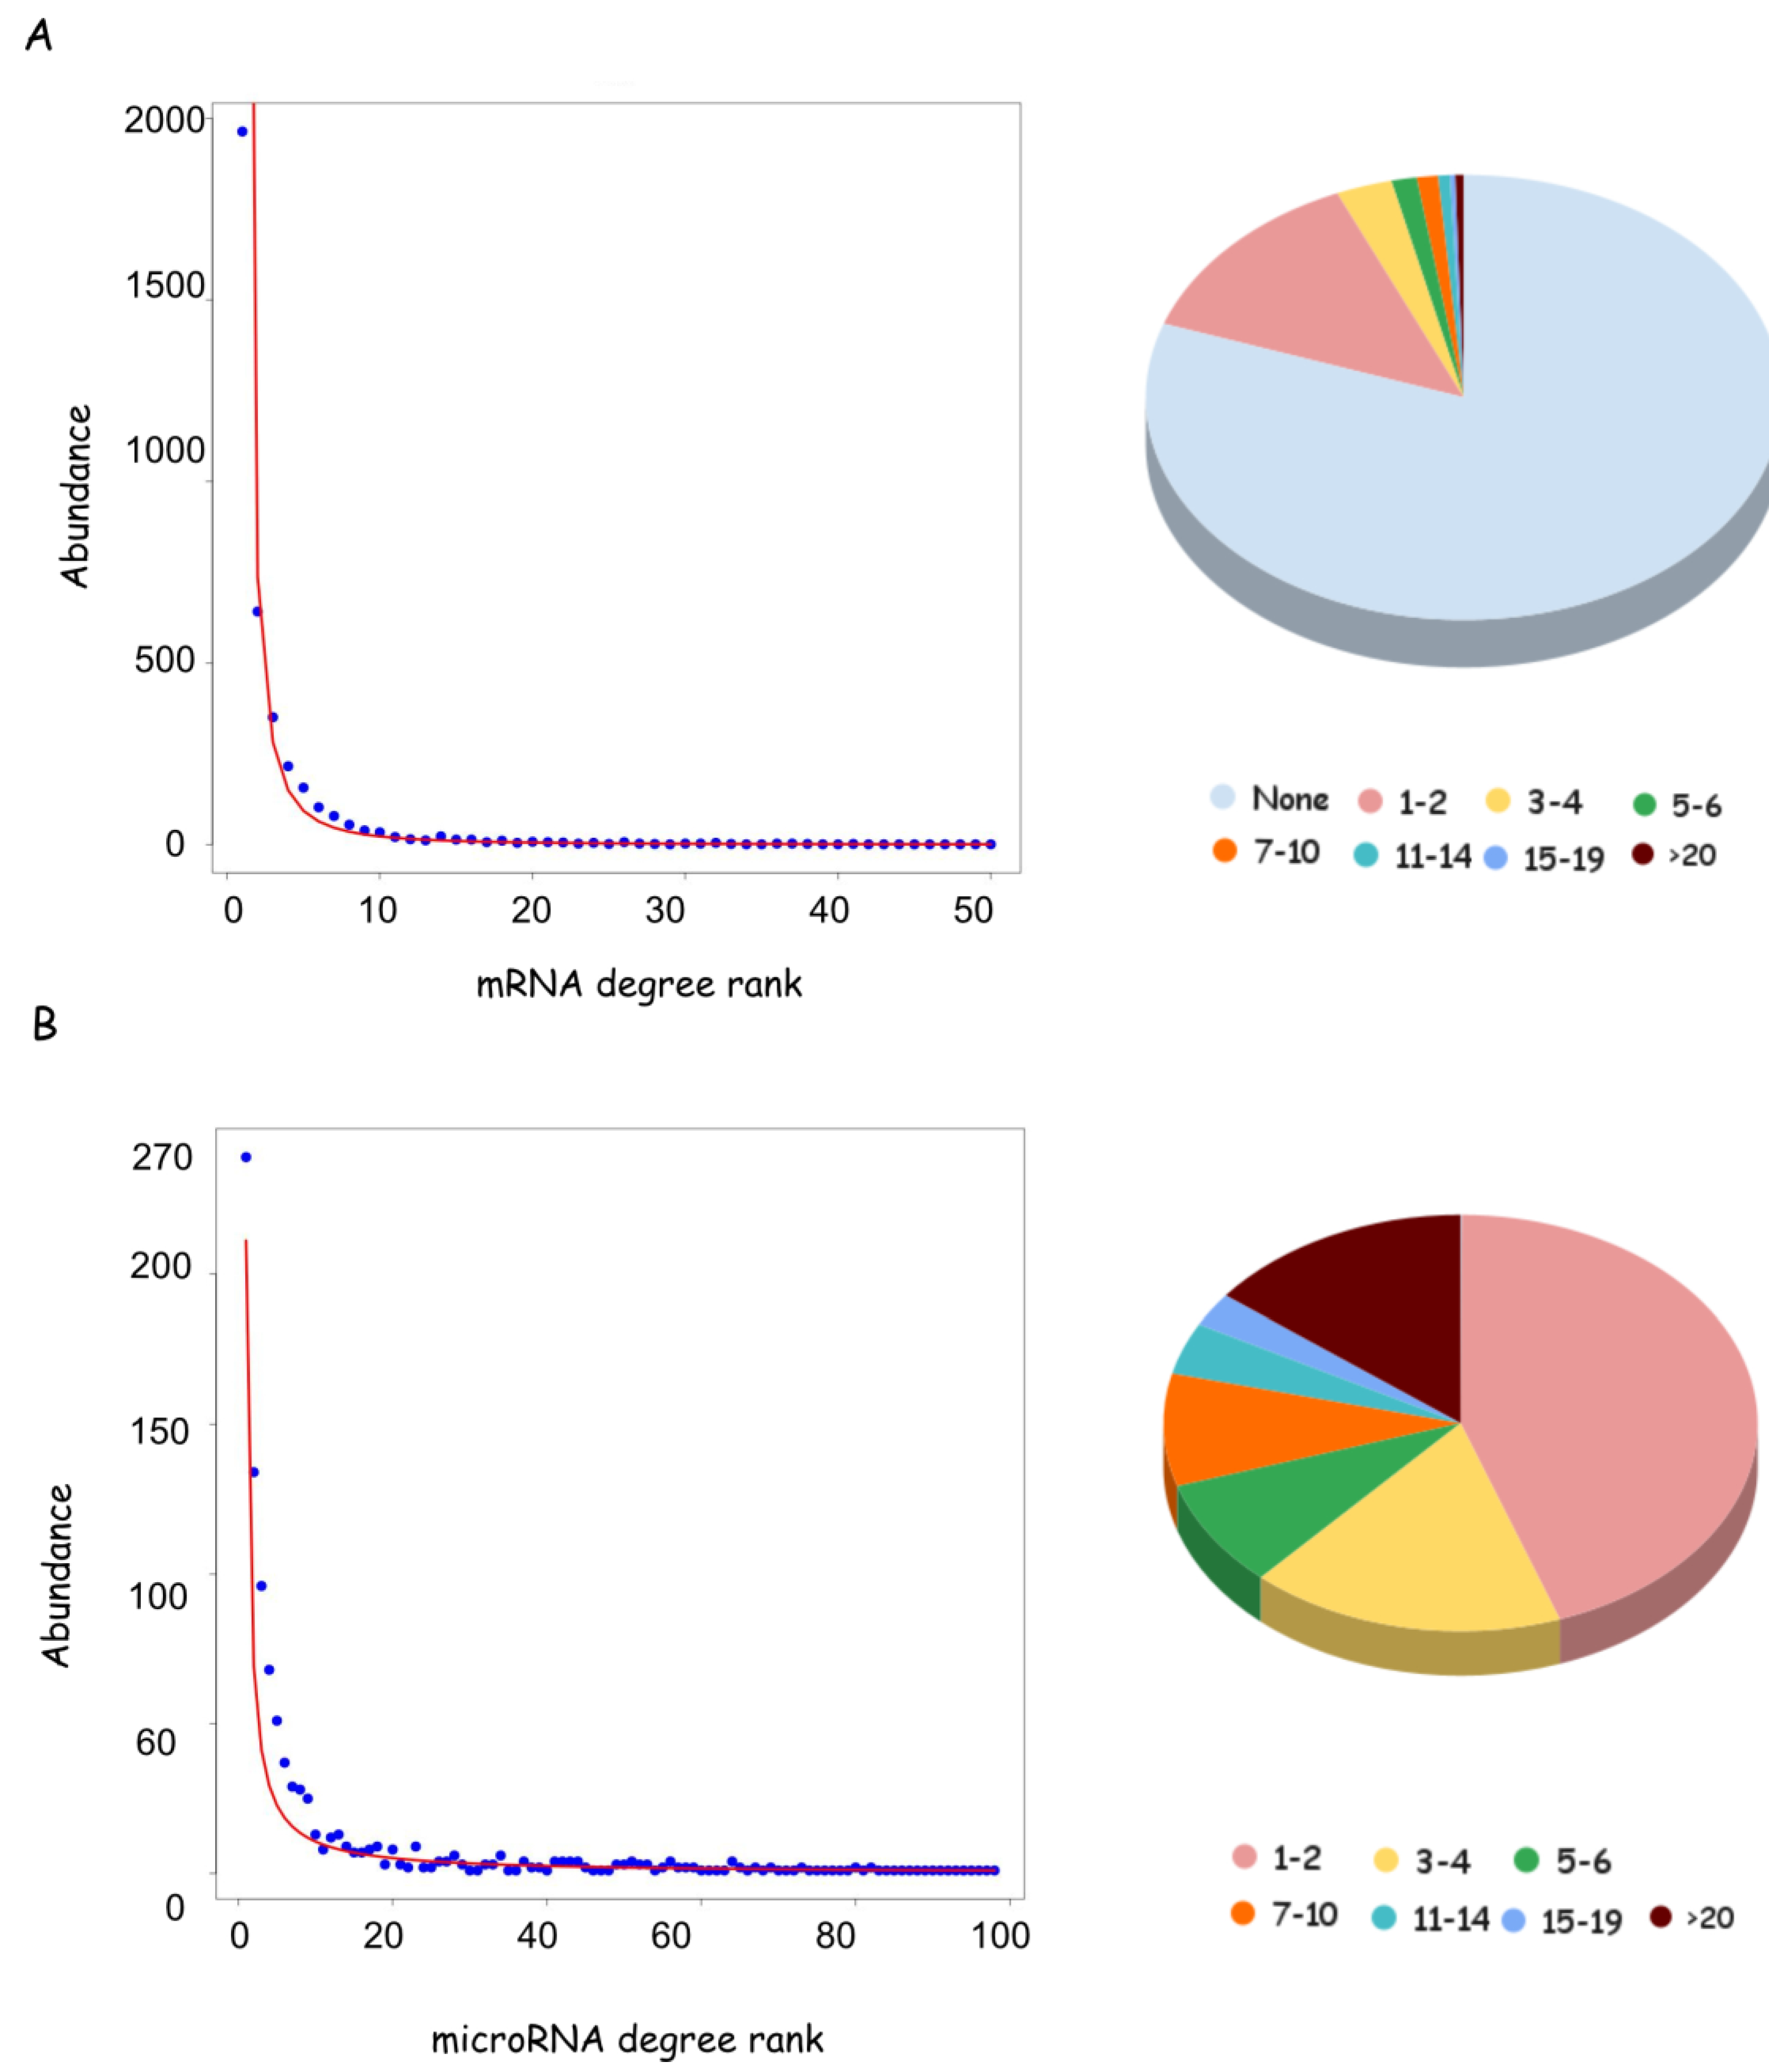
Figure 4.
Number of microRNAs interacting with transcription factors versus all other genes. The degree distribution of the mRNA dataset (except transcription factors) (blue line) is compared with transcription factors dataset (red line). The two dataset are represented by the same model, and the TF dataset has an AIC value of 174 indicating that it is even better represented by the power law curve in respect to the mRNA dataset with AIC = 401.
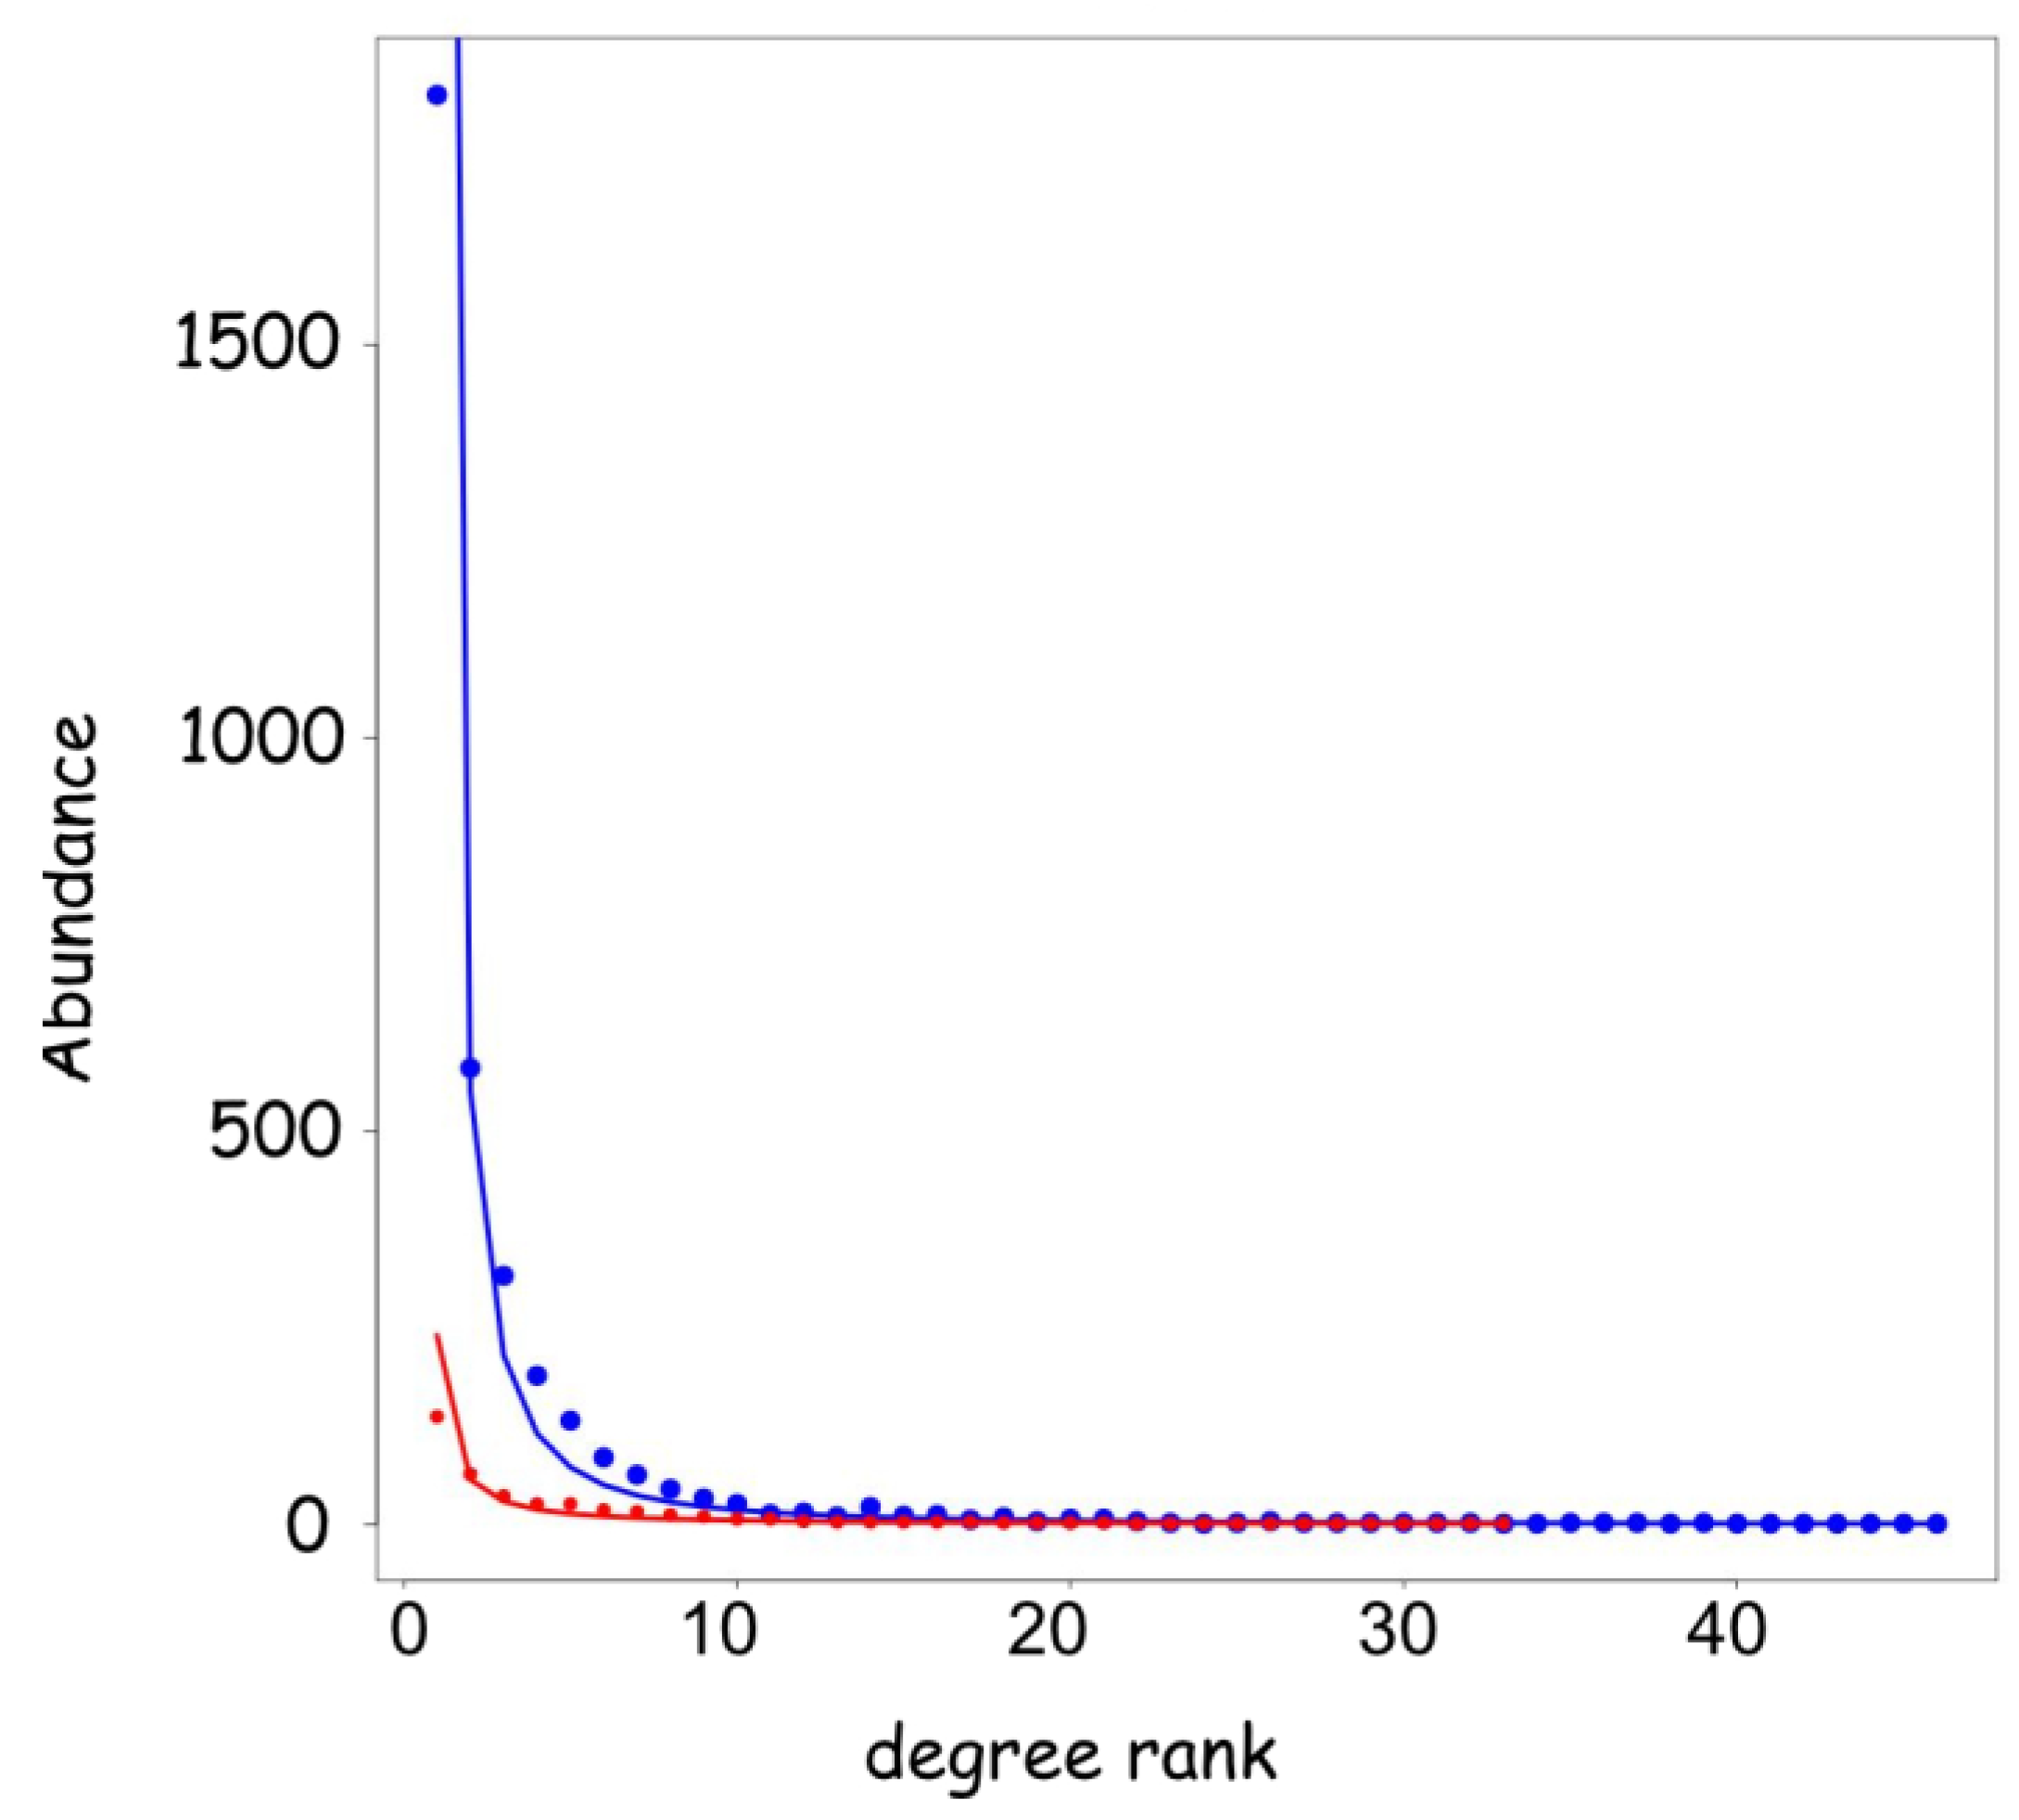
Figure 6.
microRNAs regulate pathways by targeting multiple genes. A) miR-33a regulate seven genes involved in the “NFE2L2 regulates pentose phosphate” pathway R-HSA-9818028 B) miR105 targets four genes in “Regulation of lipid metabolism by PPARalpha”R-HSA-40020.
Figure 6.
microRNAs regulate pathways by targeting multiple genes. A) miR-33a regulate seven genes involved in the “NFE2L2 regulates pentose phosphate” pathway R-HSA-9818028 B) miR105 targets four genes in “Regulation of lipid metabolism by PPARalpha”R-HSA-40020.
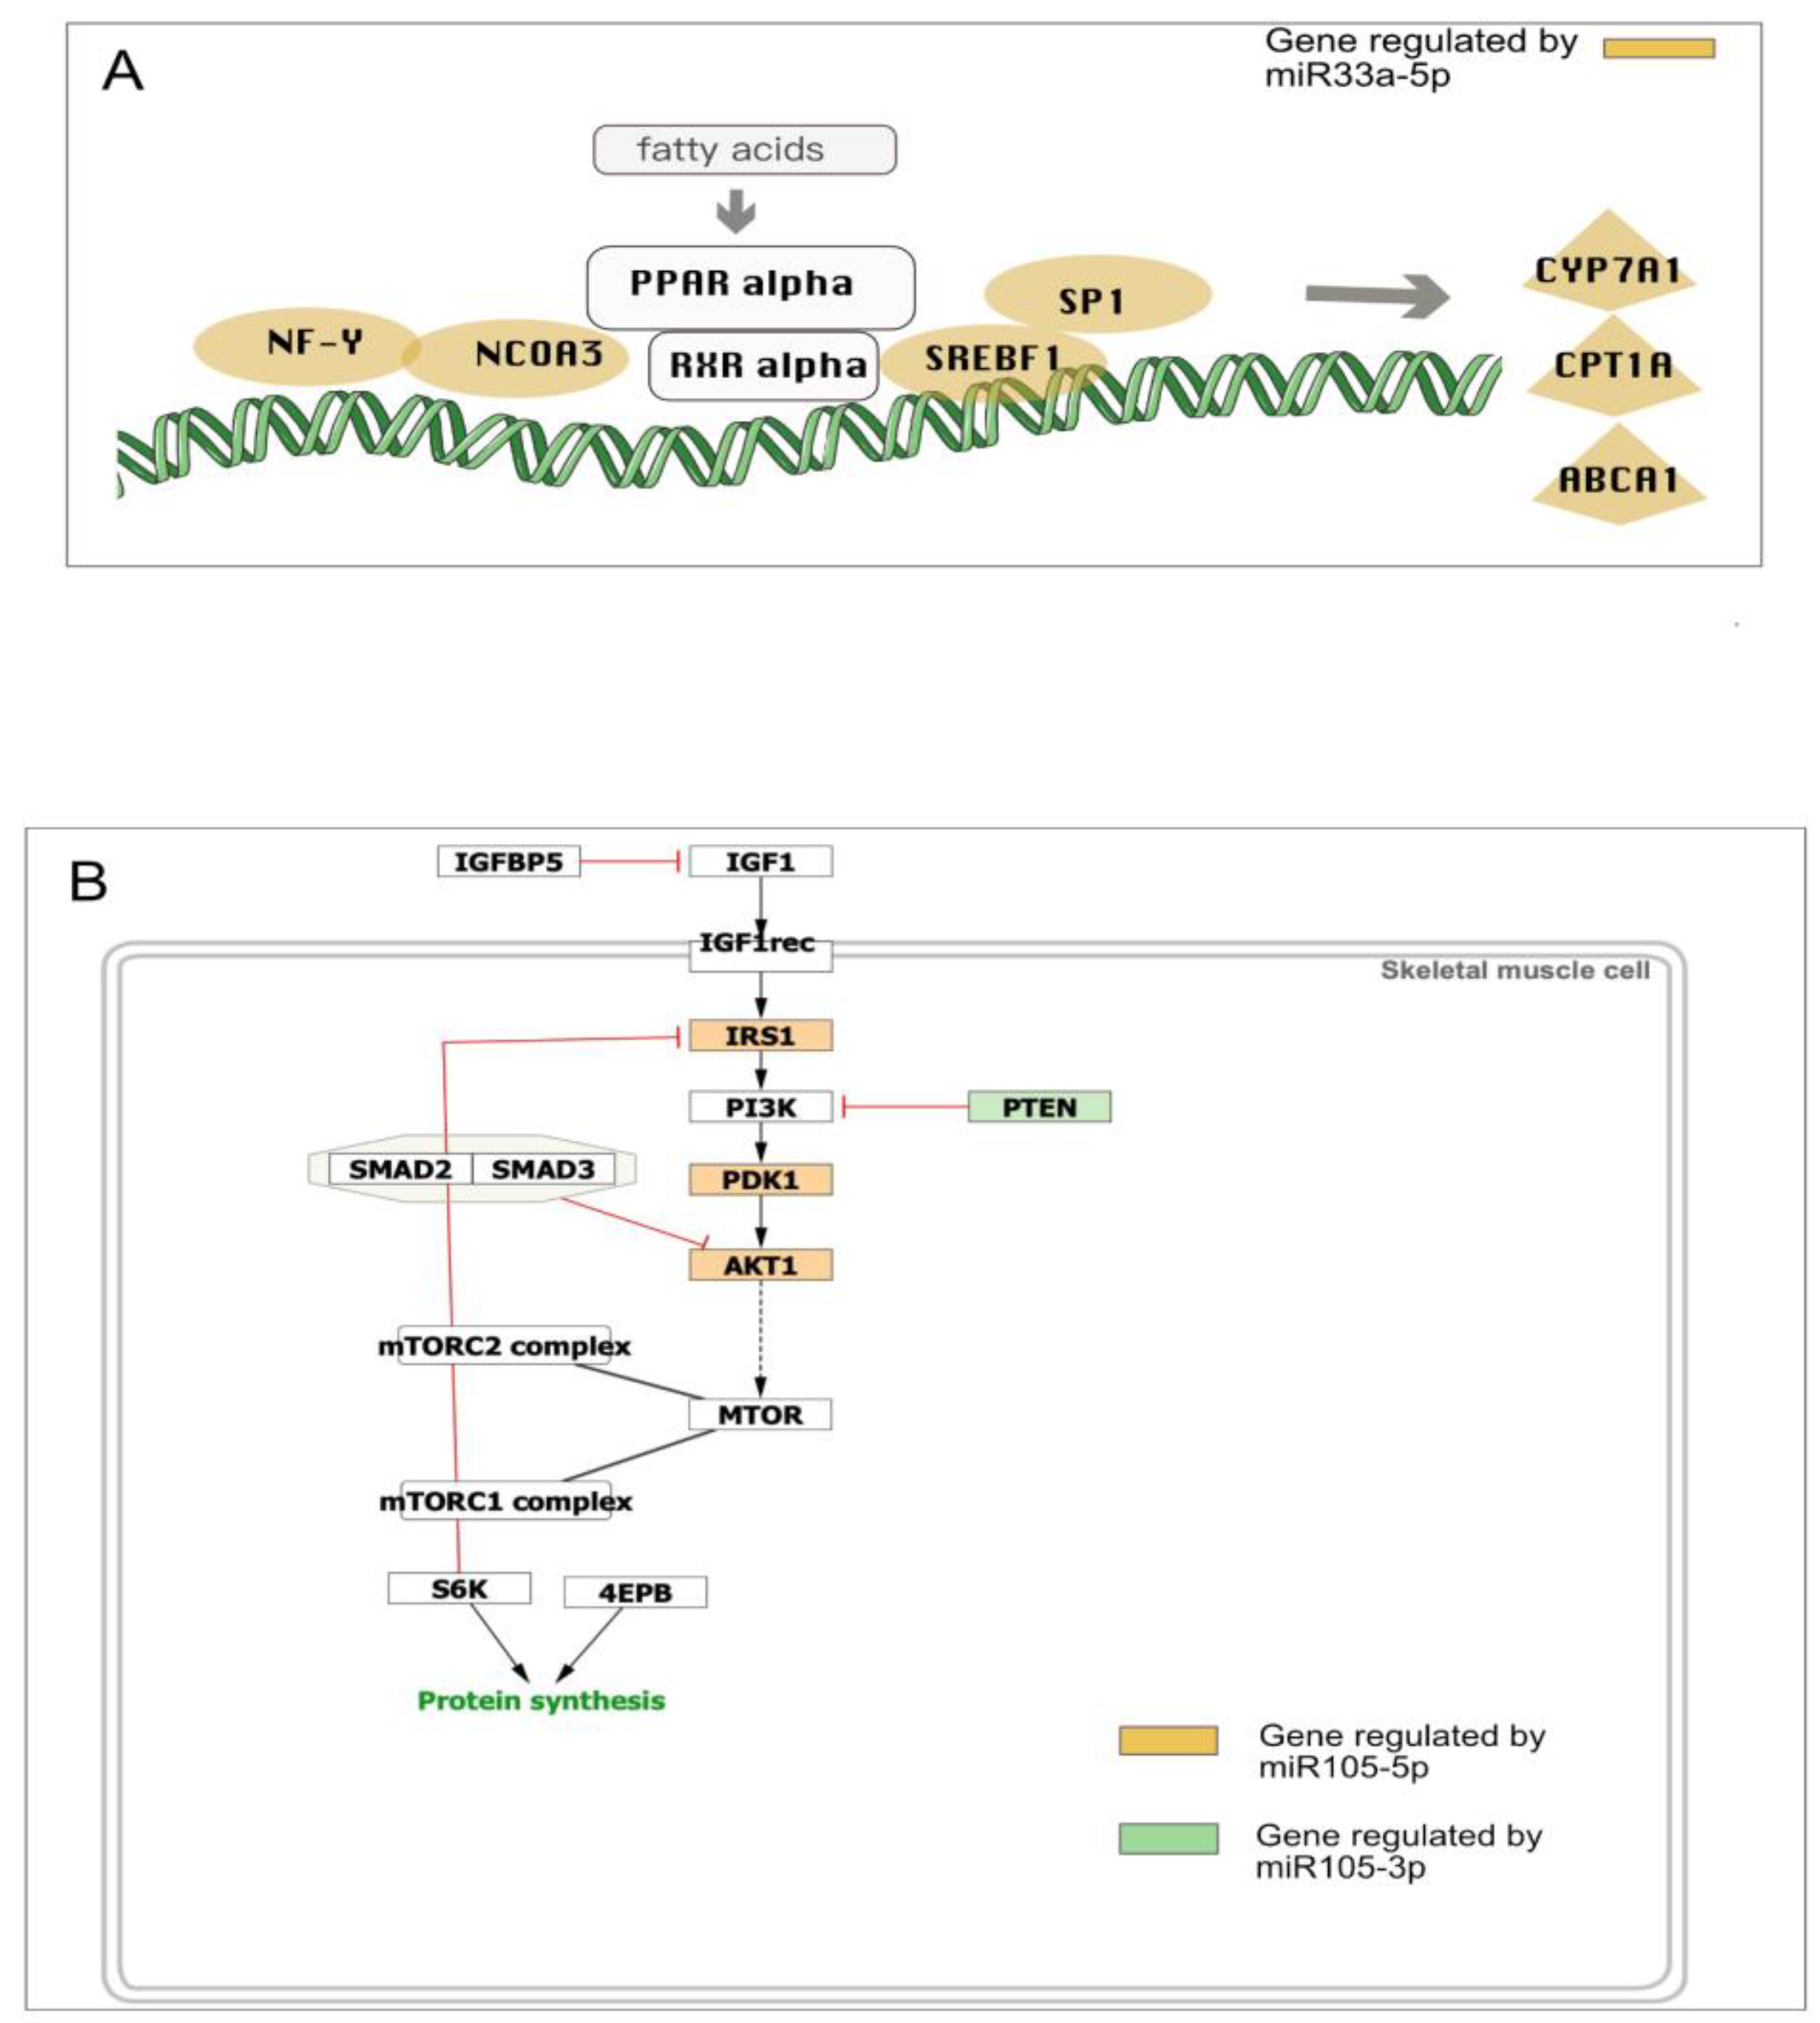
Figure 7.
Correlation analysis showing the relationship between the UTR length and the number of interacting microRNAs. The number indicated in the square is the value of the coefficient of correlation r, which ranges from -1 to +1. Two asterisks indicate p value<0.01, three asterisks p value < 0.001. Red circles highlight the relationship between UTR length and the number of verified interacting miRNAs (0.312), the number of miRNAs predicted with miRDB (0.654) or miRWalk (0.737).
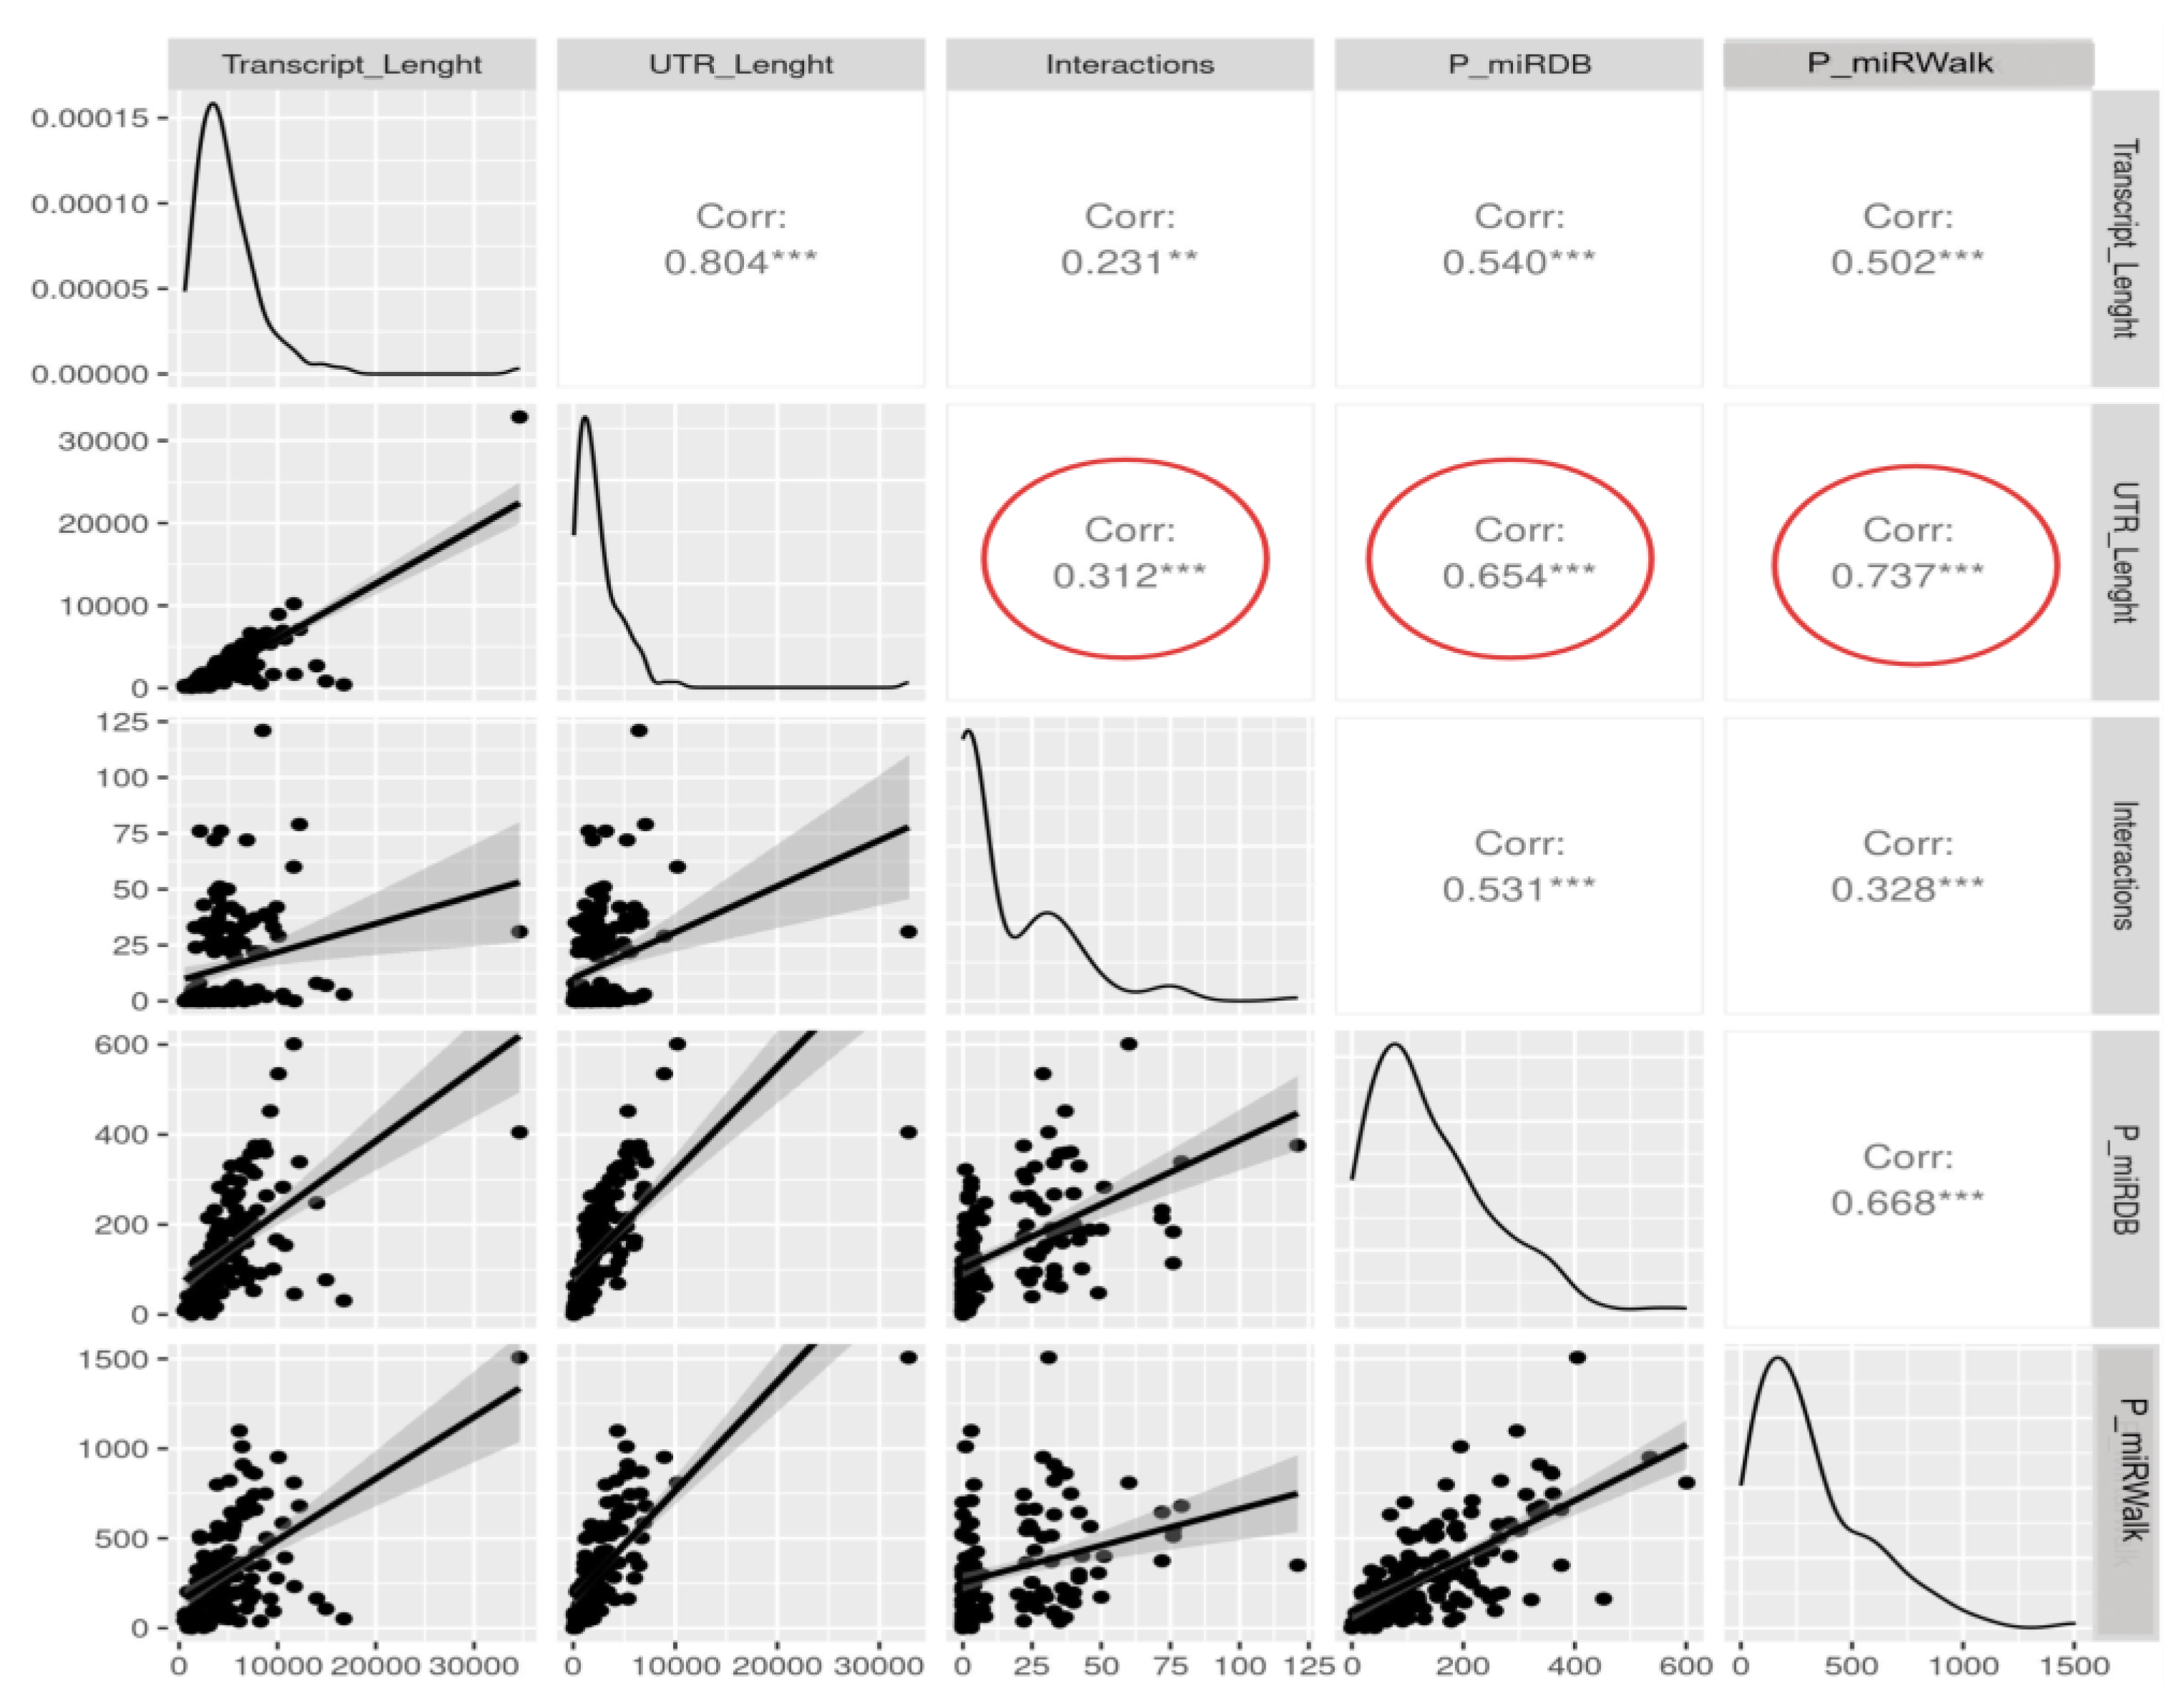

Table 1.
Function of the most interconnected microRNAs in cancer.
| microRNA name | Number of Interactors | Oncogene | Tumour Suppressor | Reference |
| hsa-miR-155-5p | 262 | YES | 43 | |
| hsa-miR-21-5p | 182 | YES | 43, 44 | |
| hsa-miR-145-5p | 171 | YES | 45 | |
| hsa-miR-34a-5p | 156 | YES | 43 | |
| hsa-miR-125b-5p | 141 | YES | 47 | |
| hsa-miR-124-3p | 138 | YES | 47 | |
| hsa-miR-29b-3p | 135 | YES | 47 | |
| hsa-miR-200c-3p | 134 | YES | 45 | |
| hsa-miR-17-5p | 131 | YES | 46 | |
| hsa-miR-29a-3p | 127 | YES | 47 | |
| hsa-miR-1-3p | 110 | YES | 47 | |
| hsa-miR-20a-5p | 107 | YES | 43, 46 | |
| hsa-miR-9-5p | 103 | YES | 38 |
Disclaimer/Publisher’s Note: The statements, opinions and data contained in all publications are solely those of the individual author(s) and contributor(s) and not of MDPI and/or the editor(s). MDPI and/or the editor(s) disclaim responsibility for any injury to people or property resulting from any ideas, methods, instructions or products referred to in the content. |
© 2024 by the authors. Licensee MDPI, Basel, Switzerland. This article is an open access article distributed under the terms and conditions of the Creative Commons Attribution (CC BY) license (http://creativecommons.org/licenses/by/4.0/).
Copyright: This open access article is published under a Creative Commons CC BY 4.0 license, which permit the free download, distribution, and reuse, provided that the author and preprint are cited in any reuse.


