Submitted:
10 December 2024
Posted:
10 December 2024
You are already at the latest version
Abstract
Small, isolated oceanic islands, exemplified by the Azores Archipelago, are especially vulnerable to adverse environmental conditions and human impact. The structure and dynamics of avian communities associated with various land form in an urbanized landscape in one of the nine islands of the Azores Archipelago were subjects of this study. Studies were conducted in the second half of April 2024. The line transect method (43 transects with a total of 37.4 km) has been employed to count all bird species breeding in the study area. The number of breeding species was much higher in green land (n=20) than in built-up lands (n=10-14 species). The number of breeding species were also different in particular subcategories of the built-up lands ranging from 8 to 12, being the lowest in the oldest most densely built-up lands. The number of dominant species (n=5-9), cumulative dominance (>85%) and dominance index were relatively high. Both cumulative dominance and dominance index were much higher in built-up urbanized lands than in green urbanized lands. Two main feeding guilds were distinguished in the study area: granivores and insectivores. The former guild clearly dominated over the later one in all major land categories distinguished. Clearly the proportion of granivores increased with the urbanization. A general trend is recorded: the higher the level of urbanization, the lower the percentage of green land forms, and in consequence, the lower the number of bird species and diversity indices, but the higher the cumulative dominance and dominance index. The overall density of birds remain, however, distinctively similar.
Keywords:
urban ornithology
; island ecology
; community ecology
; population densities
1. Introduction
Small islands (<10,000 km2 and a population <500,000 inhabitants) are highly vulnerable to climate change impacts because of their remoteness, exposure to extreme weather events, limited resources and other factors. Small islands face also environmental degradation related to land use/land cover changes, loss of biodiversity, and proliferation of invasive alien species (Castanho et al. 2021).
The Azores Archipelago situated 1400 km to the nearest continental land is a good example of such islands. It has well-known geological structure, history (4.01 million years), temporary volcanic activity, and relatively diverse habitats with simple structure (Grant 1986, Emerson 2002). The remarkable richness and singularity, make the Azores an excellent area of various ecological studies, especially those on population and community structures (Rodrigues & Tristão de Cunha 2011, Rodrigues et al. 2013; Rodrigues 2014; Talavera et al. 2020).
Since the Azores Archipelago consists isolated small islands, it has comparatively low species diversity (Borges et al. 2010, 2022). For example, only 41 breeding bird species were recorded so far (Barcelos et al. 2015). Some of them are recent invaders (e.g. Streptoplia decaocto, Passer domesticus, Carduelis carduelis, Chloris chloris), while some other belong to endemic subspecies, viz.: Buteo buteo rothschildi, Larus mihachellis atlantis, Columba palumbus azoricus, Motacilla cinerea patriciae, Sylvia atricapilla gularis, Turdus merula azorensis, Regulus regulus azoricus, Regulus r. sanctae-mariae, R. regulus inermis, Sturnus vulgaris granti, Fringilla coelebs moreletti (Rodrigues et al. 2013; Rodrigues & Tristão da Cunha 2011; Barcelos et al. 2015).
Since 1427, São Miquel Island faces continuous land cover changes, which pose a threat to the biodiversity and the ecosystem functioning (Tiengo et al. 2024). On the other hand, the changes may create new habitats, enriching local biodiversity. For instance, in all nine islands in the Azores Archipelago, including the largest one São Miguel Is., a network of cities, towns and villages has been developed, which is especially dense along the coast. This newly created environment has been adopted by a number of bird species living for millions of years in the neighboring natural habitats and by species brought by man to the islands from the mainland Europe since the Portuguese colonization of the islands started at eh beginning of the 15th century.
Three major categories of land cover can be distinguished in the Azores: 40.2% - natural and semi-natural lands (forests, wetlands, water bodies), 54.5% - agricultural lands (arable grounds, pastures, orchards, vineyards), 5.2% - artificial lands (built-up areas, roads, mines, dumps etc.), (Castanho et al. 2021). On the São Miquel Island (745 km2), the land covers in 2018 were as follow: natural and semi-natural lands: 214.0 km2, agricultural lands: 485.4 km2 and artificial lands: 45.5 km2 (including 32.7 km2 of built-up areas, 7.6 km2 industry areas, 2.8 km2 mines etc., 2.4 km2 urban green and sport fields) (Castanho et al. 2021). It is important to emphasize that even in the last few decades, proportions of some of the land covers has dramatically changed, especially such artificial land surfaces as: discontinuous urban fabric, industry areas, and mines and dumps (Castanho et al. 2021; Tiengo et al. 2024). This human-transformed landscape require a sharp, well-defined, and comprehensive planning policy (Castanho et al. 2021). The planning should be supported by studies from various disciplines, including ecological studies addressing issues such as the structure of various populations and communities, interspecies relationships or the effect of invasive species.
The structure and dynamics of avian communities associated with various forms of land use in this urbanized landscape were subjects of this study. It is expected that the structure of avian populations and communities are different in various land forms in this landscape as both environmental and human factors may interchangeably shape them. Better understanding these relationships and impacts, may enable better planning of the city infrastructure to preserve biodiversity from continuing erosion, and sustaining, even enriching it.
2. Materials and Methods
2.1. Study Area
Studies were conducted in Ponta Delgada. It is the biggest city and the capital of Azores Archipelago, north-east Atlantic. It is situated on São Miguel Island at 37°44′28″N 25°40′50″W. The city was founded in 1444, and had 67287 citizens in 2021 in an area of 233 km2.
Ponta Delgada has a Mediterranean climate, with warm dry summers, moderate precipitation, and mild, wet winters. Much like the rest of the Azores, the climate is shaped by the Gulf Stream, and consequently has a narrow temperature variation. Mean temperatures vary between 14.5 °C in the winter to around 22 °C in the summer.
Geomorphologically, Ponta Delgada covers a volcanic area composed of two structures: the Picos Region and Sete Cidades Massif. Along the southern coast is the urbanized core of the old town of Ponta Delgada, which includes the principal civic infrastructures, high-capacity motorways, tourist and culture attractions, as well as the businesses and government services. Immediately around this urban core are the municipal hall, the gates to the city and old customhouse buildings in front of the main roadway that follows the coast (Figure 1A).
The study area is confined in the north and east by the by-pass Segundo Circular (R1-1A) and Rua de Machado in the south-east; by EN1-1A by-and pass (Av. Alberto I and Av. Principes de Monaco) in the west. From the south the city is confined by the ocean. The agricultural land is situated just north-west to this area, in a parish called Arrifes (Figure 1 and Figure 2).
Coastal built-up land (built-up areas along the cost);
Urbanized land (built-up areas with attached gardens and timbered sites);
Rural land (built up streets and large open areas of farmlands attached);
Green land (larger areas timbered with indigenous and exotic tress; parks, gardens, sport fields, leisure areas).
The coastal built-up land along the coast (‘A’ in Figure 1B) is the oldest and most densely built-up part of the city, on both sides of the following streets: Santa Clara, de Braga, Sao Francisco, Soares de Sousa, Santa Lusia, Mercadores, Clerigos, Boa Vista, Boa Nova, EN3-1A.
Due to the largest surface area the urbanized land occupies, eight subcategories were distinguished (Figure 1):
B – suburb residential area, with some agriculture lands;
C – densely-built up city centre, with sparse tree vegetation;
D – densely built-up area city centre, well timbered;
E – suburb residential areas, with some industry lands;
F – residential suburbs with pastures and arable lands;
G – residential suburbs with pastures and timbered lands;
H – industry area.
The agricultural land comprised a triangle confined by three streets: Piedate, Madeiros and Saude.
-Canto botanic garden, 10 ha
-Borges municipal park/botanic garden, 3 ha
-Parkland on the University of Azores campus, c. 6 ha
-XXI Century Park and neighbouring green areas, c. 6ha
2.2. Methods
Studies were conducted in the second half of April 2024. The line transect method has been employed to count all bird species breeding in the study area. Transects were designed along streets. A total of 43 transects were designed with a total length of 37.4 km (Figure 1 and Figure 2).
Counts were conducted once in the morning (5-10 a.m.) on each transect. As recommended, a breeding pair, not an individual, was a census unit (Sutherland 1996, Bibby et al. 2012).
Counts were conducted in the mornings by walking slowly from c. 6 a.m. till c. 11 a.m. and recording all seen and heard birds. For resident birds, a breeding pair was a census unit, while for non-resident species, the census unit was an individual.
The dominance is expressed as the percentage of the total number of pairs of a given species in relation to the total number of all pairs of all species recorded. Dominant species: >5%, subdominant: 2-4.99%.
Linear density is the number of breeding pairs per 1 km of transect. Overall density is a linear density of all breeding pairs of all species per 1 km (=10 ha).
The following guilds were distinguished:
Diet: G – granivorous, I– insectivorous.
Nesting: T – in trees or shrubs, B – in/on buildings.
The following indices were used to characterize the diversity and evenness of the communities:
1) Shannon’s diversity index: H’ = -∑ pi ln pi
where: pi is the proportion of breeding pairs belonging to the ith species. The minimum value of H’ is 0 (it indicates no diversity, i.e. only one species was recorded), and there is no upper limit to H’. The maximum value would occur if all species have the same number of breeding pairs.
2) Simpson’s diversity index: D = ((∑n(n-1))/N(N-1)
where: n – total number of breeding pairs belonging to a given species, N – total number of breeding pairs of all species. D ranges between 0 and 1; 1 represents infinite diversity, while 0 no diversity.
3) Pielou’s evenness index: J’ = (-∑ pi ln pi)/ln S,
where pi is the proportion of breeding pairs belonging to the ith species; S – total number of species. J’ varies between 0 and 1. The less variation between species in a community, the higher J’.
4) Community dominance index: DI = (n1 + n2)/N
where n1, n2 – number of pairs of two most abundant species, N – total number of pairs of all species.
3. Results
A total of 21 species were recorded during the study in Ponta Delgada (App. 1-3). The number of breeding species was much higher in green areas (n=20) than in built-up areas (n=10-14 species). The number of breeding species were also different in particular subcategories of the built-up land forms ranging from 8 to 12, being the lowest in the oldest most densely built land (Table 1).
Although the number of breeding species was low in each urbanized land category, the number of dominant species (n=5-9), cumulative dominance (>85%) and dominance index were relatively high (Table 1). Both cumulative dominance and dominance index were much higher in built-up urbanized lands than in green urbanized lands. In particular subcategories of the built-up land, the number of dominant species ranged from 3 to 8, and averaged 5.5 (sd=1.60). The cumulative dominance and dominance index were very high in each subcategory, ranging from 80% to 97%, and from 034 to 0.67 respectively (Table 2).
Diversity and evenness indices were the lowest in the oldest, most densely built-up land along the coast, higher in the city centre and the highest in the city green lands (Table 2). Within the built-up land subcategories, Shannon’s Diversity Index varied between 1.6 and 2.1, while the Pielou’s dominance Index 0.7-0.9 (Table 2). The more densely built-up land form, the higher the diversity indices.
Two main feeding guilds were distinguished in the study area: granivores and insectivores. The former guild clearly dominated over the later one in all major land categories distinguished (Figure 4). Clearly the proportion of granivores increased with the urbanization.
Also two nesting guilds were distinguished: buildings and trees/shrubs. The former was dominant in all land categories except for the green land were, of cause, tree/shrub nesting guild was more numerous than the building guild (Figure 5). The tree/shrub guild declined with the urbanization (Figure 5 and Figure 6).
Among species, the House Sparrow was by far the most common, in all land categories, except for the green land, where the Blackbirds was the commonest (Table 3). The second most common species was the Collared Dove (in coastal and green lands), and the European Starling (in rural and urbanized lands of the city centre). Other dominant species recorded in most land categories were the Blackbird, Island Canary and Rock Dove (Table 3). Among other species, only the Blackcap was recorded as dominant in two land categories, while the Goldfinch and Greenfinch were dominant only in green land (Table 1).
The House Sparrow and Rock Dove showed an increasing trend with the urbanization of the land, while decreasing trends were shown for species such as the Collared Dove, Blackbird, Island Canary, Greenfinch, Goldfinch and Chaffinch. No trends were recorded for the Blackcap, and Wood Pigeon (Table 2). In built-up areas the House Sparrow nested in much higher population density than in green land, while the reverse was true for the Blackbird, Island Canary, Greenfinch, Goldfinch and Chaffinch.
4. Discussion
The Azores archipelago is a discrete geographical entity with strictly defined boundaries, and somehow an intermediate zone between the Palearctic and the Afrotropical Regions. The number of bird species breeding in the whole urbanized landscape as well as in particular land forms in the city of Ponta Delgada is exceptionally low. For the comparison, in urbanized environment in South Africa, the number was 3-4 times higher (e.g. Kopij 2015, 2019, 2021, 2023a); in Namibia 2-3 times higher in drier areas (Kopij 2021, 2019, 2023a) and as much as 5-6 times higher in more humid areas (Kopij 2020, 2023c). In Central Europe, the number of breeding species was also 3-4 times higher (e.g. Kopij 2004, 2006, 2024). The number of breeding species in Ponta Delgada is similar to the urbanized habitats in towns situated along the Atlantic Coast under desert conditions in south-western Africa (Kopij 2018, 2022b, 2023b). The low number of bird species breeding in urbanized landscape of Ponta Degada is, however, most probably caused, to a larger extent, by the fact that the number of breeding species on the small and remote Island São Miquel (n=41), where the city is located, is also low (Barcelos et al. 2015). The age of urbanized landscape does not play a role in this regard, as towns in southern Africa, including those in the Namib Desert, are much younger than those in the Azores. Also the amount of green spaces does not differ substantially between Azorean and continental towns.
The low number of breeding species in particular land forms of Ponta Delgada as well as in the whole urbanized landscape is compensated by much higher population densities of particular species. Especially population densities of the House Sparrow and Collared Dove are much higher in Ponta Delgada than in Europe (e.g. Kopij 2024, 2022a). It should be emphasized that both species have colonized the Azores Islands only recently; the House Sparrow in the 1960’s, while the Collared Dove in the 2015 (Barcelos et al. 2015, Borges et al. 2015). Among the indigenous species, the Blackbird, Blackcap, European Starling and Island Canary breed in high population densities in most land forms of the city; while the Chaffinch, Robin and Wood Pigeon remain relatively common only in land forms abundant of green spaces.
Within the build-up lands, the number of breeding species (8-12), the number of dominant species (3-8), cumulative dominance (20.7%-85.6%) and dominance indices differed between particular land categories. Especially significant were differences in overall population densities. It appears that the main factor contributing to this variance within the built-up land forms is the amount of green space, especially this with trees and shrubs.
In the urbanized landscape of Ponta Delgada, the green land, especially timbered larger gardens, such as J. Canto and J. Borges gardens, are the richest land forms in terms of the number of breeding species of birds. The number is on the average twice higher than in the old densely built-up lands close to the coastline. The residential and rural land forms appear to be intermediate between the densely built-up land forms along the coast, and the green land forms. A general trend is therefore that the higher the level of urbanization, the lower the percentage of green land forms, and in consequence, the lower the number of bird species and diversity indices, but the higher the cumulative dominance and dominance index. However, the overall density of birds remain distinctively similar.
If compared to the urbanized habitats in continental Europe (e.g. Kopij 2004, 2006, 2024) and beyond (e.g. Kopij 2015, 2019, 2021, 2022, 2023a, 2023b), the proportion of insectivorous and tree/shrub nesting birds is higher in Ponta Delgada. This is because the high population densities of two species, the Blackbird and Blackcap, and rather low overall density of columbids. The granivorous sparrows and doves/pigeons are the main groups of birds in most urbanized environments in the world (Dunn & Weston 2008, Magle et al. 2012, Luniak 2017), while among insectivorous birds, swifts are often the commonest. In Ponta Delgada, and in Azores at large, swifts are absent as breeding birds (Barcelos et al. 2015).
The species recorded on the transects in Ponta Delgada are also breeding residents in most cities in continental Europe. The endemic Island Canary Serinus canarensis is replaced by the Serin Serinus serinus. Population densities and dominance of these species are however different between the Azores and continental Europe (e.g. Kopij 2022a).
In conclusion, the structure of avian communities in an urbanized landscape in a small isolated oceanic island is composed of low number of species. Many of them, however, reach high dominance and high population densities. The structure of avian communities vary markedly in different land forms, depending on the proportions of open and built-up space, amount of trees and shrubs and a proximity to the non-urbanized landscape.
Funding
This research received no external funding.
Acknowledgments
Prof. A. O. Soares from University of Azores is gratefully acknowledged for his logistic support to this study.
Conflicts of Interest
The author declares no conflicts of interest.
Appendix A. Breeding Bird Community in Different Subcategories of Built-Up Lands in the City of Ponta Delgada
Explanations: N- number of breeding pairs, Den – density: pairs per 10 ha (1 km long transect), Dom – dominance. A – old, densely build-up area close to coast with sparce tree vegetation, B – suburb residential area, with some agriculture lands, C – densely-built up city centre, sparse tree vegetation, D – densely built-up area city centre, well timbered, E – suburb residential areas, with some industry lands, F – residential suburbs with pastures and arable lands, G – residential suburbs with pastures and timbered lands, H – industry area.
| Species | A, 500 dm | B, 246 dm | C, 617 dm | D, 412 dm | ||||||||
| N | Den | Dom | N | Den | Dom | N | Den | Dom | N | Den | Dom | |
| Passer domesticus | 181 | 36.2 | 42.3 | 56 | 22.4 | 40.9 | 105 | 16.9 | 42.2 | 136 | 33.2 | 57.1 |
| Streptopelia decaocto | 52 | 10.4 | 12.1 | 28 | 11.2 | 20.4 | 50 | 8.1 | 20.1 | 23 | 5.6 | 9.7 |
| Columba livia | 60 | 12.0 | 14.0 | 11 | 4.4 | 8.0 | 12 | 1.9 | 4.8 | 7 | 1.7 | 2.9 |
| Columba palumbus | 6 | 1.2 | 1.4 | 0 | 0 | 0.0 | 3 | 0.5 | 1.2 | 11 | 2.7 | 4.6 |
| Turdus merula | 25 | 5.0 | 5.8 | 6 | 2.4 | 4.4 | 22 | 3.5 | 8.8 | 16 | 3.9 | 6.7 |
| Sylvia atricapilla | 19 | 3.8 | 4.4 | 7 | 2.8 | 5.1 | 20 | 3.2 | 8.0 | 14 | 3.4 | 5.9 |
| Serinus canarensis | 17 | 3.4 | 4.0 | 4 | 1.6 | 2.9 | 21 | 3.4 | 8.4 | 8 | 2.0 | 3.4 |
| Sturnus vulgaris | 66 | 13.2 | 15.4 | 24 | 9.6 | 17.5 | 11 | 1.8 | 4.4 | 20 | 4.9 | 8.4 |
| Erithacus rubecula | 0 | 0.0 | 0.0 | 0 | 0 | 0.0 | 0 | 0.0 | 0.0 | 0 | 0.0 | 0.0 |
| Chloris chloris | 1 | 0.2 | 0.2 | 1 | 0.4 | 0.7 | 3 | 0.5 | 1.2 | 2 | 0.5 | 0.8 |
| Carduelis carduelis | 1 | 0.2 | 0.2 | 0 | 0 | 0.0 | 1 | 0.2 | 0.4 | 1 | 0.2 | 0.4 |
| Motacilla cinerea | 0 | 0.0 | 0.0 | 0 | 0 | 0.0 | 1 | 0.2 | 0.4 | 0 | 0.0 | 0.0 |
| Coturnix coturnix | 0 | 0.0 | 0.0 | 0 | 0 | 0.0 | 0 | 0.0 | 0.0 | 0 | 0.0 | 0.0 |
| 428 | 85.6 | 100.0 | 137 | 54.8 | 100.0 | 249 | 40.2 | 100.0 | 238 | 58.0 | 100.0 | |
| Species | E, 396 dm | F, 147 dm | G, 423 dm | H, 55 dm | ||||||||
| N | Den | Dom | N | Den | Dom | N | Den | Dom | N | Den | Dom | |
| Passer domesticus | 51 | 12.8 | 38.3 | 6 | 4.0 | 19.4 | 111 | 26.4 | 38.4 | 6 | 10.9 | 18.8 |
| Streptopelia decaocto | 13 | 3.3 | 9.8 | 2 | 1.3 | 6.5 | 21 | 5.0 | 7.3 | 2 | 3.6 | 6.3 |
| Columba livia | 5 | 1.3 | 3.8 | 0 | 0.0 | 0.0 | 19 | 4.5 | 6.6 | 3 | 5.5 | 9.4 |
| Columba palumbus | 5 | 1.3 | 3.8 | 2 | 1.3 | 6.5 | 5 | 1.2 | 1.7 | 4 | 7.3 | 12.5 |
| Turdus merula | 10 | 2.5 | 7.5 | 5 | 3.3 | 16.1 | 26 | 6.2 | 9.0 | 4 | 7.3 | 12.5 |
| Sylvia atricapilla | 11 | 2.8 | 8.3 | 6 | 4.0 | 19.4 | 19 | 4.5 | 6.6 | 5 | 9.1 | 15.6 |
| Serinus canarensis | 7 | 1.8 | 5.3 | 8 | 5.3 | 25.8 | 27 | 6.4 | 9.3 | 5 | 9.1 | 15.6 |
| Sturnus vulgaris | 25 | 6.3 | 18.8 | 1 | 0.7 | 3.2 | 46 | 11.0 | 15.9 | 1 | 1.8 | 3.1 |
| Erithacus rubecula | 1 | 0.3 | 0.8 | 0 | 0.0 | 0.0 | 3 | 0.7 | 1.0 | 0 | 0.0 | 0.0 |
| Chloris chloris | 2 | 0.5 | 1.5 | 1 | 0.7 | 3.2 | 0 | 0.0 | 0.0 | 0 | 0.0 | 0.0 |
| Carduelis carduelis | 3 | 0.8 | 2.3 | 0 | 0.0 | 0.0 | 3 | 0.7 | 1.0 | 2 | 3.6 | 6.3 |
| Motacilla cinerea | 0 | 0.0 | 0.0 | 0 | 0.0 | 0.0 | 1 | 0.2 | 0.3 | 0 | 0.0 | 0.0 |
| Coturnix coturnix | 0 | 0.0 | 0.0 | 0 | 0.0 | 0.0 | 8 | 1.9 | 2.8 | 0 | 0.0 | 0.0 |
| 133 | 33.3 | 100.0 | 31 | 20.7 | 100.0 | 289 | 68.8 | 100.0 | 32 | 58.2 | 100.0 | |
Appendix B. Breeding Bird Community in Green Lands in the City of Ponta Delgada
Explanations: N- number of breeding pairs, Den – density: pairs per 10 ha (1 km long transect), Dom – dominance.
| Species | J. Canto, 10 ha | J. Borges, 3 ha | Univ. Azor., 6 ha | XXI seq., 6ha | Total, 25 ha | ||||||||||
| N | Den | Dom | N | Den | Dom | N | Den | Dom | N | Den | Dom | N | Den | Dom | |
| Turdus merula | 39 | 39.0 | 24.4 | 14 | 46.7 | 15.7 | 16 | 26.7 | 11.4 | 16 | 26.7 | 14.5 | 85 | 34.0 | 17.0 |
| Streptopelia decaocto | 24 | 24.0 | 15.0 | 19 | 63.3 | 21.3 | 13 | 21.7 | 9.3 | 12 | 20.0 | 10.9 | 68 | 27.2 | 13.6 |
| Passer domesticus | 8 | 8.0 | 5.0 | 23 | 76.7 | 25.8 | 25 | 41.7 | 17.9 | 5 | 8.3 | 4.5 | 61 | 24.4 | 12.2 |
| Serinus canarensis | 17 | 17.0 | 10.6 | 7 | 23.3 | 7.9 | 10 | 16.7 | 7.1 | 21 | 35.0 | 19.1 | 55 | 22.0 | 11.0 |
| Sturnus vulgaris | 17 | 17.0 | 10.6 | 6 | 20.0 | 6.7 | 7 | 11.7 | 5.0 | 14 | 23.3 | 12.7 | 44 | 17.6 | 8.8 |
| Sylvia atricapilla | 8 | 8.0 | 5.0 | 2 | 6.7 | 2.2 | 5 | 8.3 | 3.6 | 10 | 16.7 | 9.1 | 25 | 10.0 | 5.0 |
| Chloris chloris | 11 | 11.0 | 6.9 | 4 | 13.3 | 4.5 | 6 | 10.0 | 4.3 | 4 | 6.7 | 3.6 | 25 | 10.0 | 5.0 |
| Columba livia | 1 | 1.0 | 0.6 | 0 | 0.0 | 0.0 | 20 | 33.3 | 14.3 | 7 | 11.7 | 6.4 | 28 | 11.2 | 5.6 |
| Columba palumbus | 5 | 5.0 | 3.1 | 1 | 3.3 | 1.1 | 11 | 18.3 | 7.9 | 4 | 6.7 | 3.6 | 21 | 8.4 | 4.2 |
| Carduelis carduelis | 11 | 11.0 | 6.9 | 4 | 13.3 | 4.5 | 20 | 33.3 | 14.3 | 0 | 0.0 | 0.0 | 35 | 14.0 | 7.0 |
| Erithacus rubecula | 13 | 13.0 | 8.1 | 3 | 10.0 | 3.4 | 2 | 3.3 | 1.4 | 2 | 3.3 | 1.8 | 20 | 8.0 | 4.0 |
| Fringilla coelebs | 2 | 2.0 | 1.3 | 2 | 6.7 | 2.2 | 2 | 3.3 | 1.4 | 8 | 13.3 | 7.3 | 14 | 5.6 | 2.8 |
| Astrilda astrild | 0 | 0.0 | 0.0 | 0 | 0.0 | 0.0 | 0 | 0.0 | 0.0 | 6 | 10.0 | 5.5 | 6 | 2.4 | 1.2 |
| Motacilla cinerea | 1 | 1.0 | 0.6 | 0 | 0.0 | 0.0 | 2 | 3.3 | 1.4 | 1 | 1.7 | 0.9 | 4 | 1.6 | 0.8 |
| Anas platyrhynchos | 0 | 0.0 | 0.0 | 2 | 6.7 | 2.2 | 0 | 0.0 | 0.0 | 0 | 0.0 | 0.0 | 2 | 0.8 | 0.4 |
| Cairina moschata | 0 | 0.0 | 0.0 | 2 | 6.7 | 2.2 | 0 | 0.0 | 0.0 | 0 | 0.0 | 0.0 | 2 | 0.8 | 0.4 |
| Regulus regulus | 1 | 1.0 | 0.6 | 0 | 0.0 | 0.0 | 0 | 0.0 | 0.0 | 0 | 0.0 | 0.0 | 1 | 0.4 | 0.2 |
| Buteo buteo | 1 | 1.0 | 0.6 | 0 | 0.0 | 0.0 | 0 | 0.0 | 0.0 | 0 | 0.0 | 0.0 | 1 | 0.4 | 0.2 |
| Asio otus | 1 | 1.0 | 0.6 | 0 | 0.0 | 0.0 | 0 | 0.0 | 0.0 | 0 | 0.0 | 0.0 | 1 | 0.4 | 0.2 |
| Psittacula krameri | 0 | 0.0 | 0.0 | 0 | 0.0 | 0.0 | 1 | 1.7 | 0.7 | 0 | 0.0 | 0.0 | 1 | 0.4 | 0.2 |
| Total | 160 | 160.0 | 100.0 | 89 | 296.7 | 100.0 | 140 | 233.3 | 100.0 | 110 | 183.3 | 100.0 | 499 | 199.6 | 100.0 |
Appendix C. Breeding Bird Community in Coast and Rural Lands in the City of Ponta Delgada
Explanations: N- number of breeding pairs, Den – density: pairs per 10 ha (1 km long transect), Dom – dominance.
| Species↓ | Coast area | Rural area | ||||||||||
| a | b | c | N | Den | Dom | a | b | c | N | Den | Dom | |
| dm→ | 146 | 150 | 25 | 321 | 120 | 100 | 150 | 370 | ||||
| Passer domesticus | 45 | 69 | 8 | 122 | 38.1 | 49.2 | 19 | 50 | 36 | 105 | 28.4 | 41.2 |
| Streptopelia decaocto | 15 | 5 | 1 | 21 | 6.6 | 8.5 | 2 | 11 | 20 | 33 | 8.9 | 12.9 |
| Columba livia | 10 | 37 | 4 | 51 | 15.9 | 20.6 | 0 | 8 | 11 | 19 | 5.1 | 7.5 |
| Columba palumbus | 0 | 4 | 1 | 5 | 1.6 | 2.0 | 0 | 1 | 0 | 1 | 0.3 | 0.4 |
| Turdus merula | 6 | 11 | 2 | 19 | 5.9 | 7.7 | 23 | 3 | 2 | 28 | 7.6 | 11.0 |
| Sylvia atricapilla | 2 | 2 | 1 | 5 | 1.6 | 2.0 | 1 | 4 | 7 | 12 | 3.2 | 4.7 |
| Serinus canarensis | 10 | 5 | 0 | 15 | 4.7 | 6.0 | 2 | 3 | 7 | 12 | 3.2 | 4.7 |
| Sturnus vulgaris | 3 | 2 | 4 | 9 | 2.8 | 3.6 | 1 | 10 | 23 | 34 | 9.2 | 13.3 |
| Erithacus rubecula | 0 | 0 | 0 | 0 | 0.0 | 0.0 | 8 | 0 | 0 | 8 | 2.2 | 3.1 |
| Chloris chloris | 0 | 0 | 0 | 0 | 0.0 | 0.0 | 0 | 0 | 0 | 0 | 0.0 | 0.0 |
| Carduelis carduelis | 1 | 0 | 0 | 1 | 0.3 | 0.4 | 0 | 0 | 1 | 1 | 0.3 | 0.4 |
| Motacilla cinerea | 0 | 0 | 0 | 122 | 38.1 | 49.2 | 0 | 1 | 0 | 1 | 0.3 | 0.4 |
| Coturnix coturnix | 0 | 0 | 0 | 21 | 6.6 | 8.5 | 0 | 1 | 0 | 1 | 0.3 | 0.4 |
| Total | 92 | 135 | 21 | 248 | 77.5 | 100 | 56 | 92 | 107 | 255 | 68.9 | 100 |
References
- Castanho, R.A.; Naranjo Gómez, J.M.; Couto, G.; Pimentel, P.; Sousa, Á.; Batista, M.D.G. Analyzing the Patterns, Trends and Dynamics of the Land-Use Changes in Azores Region: From 1990 to 2018. Sustainability 2021, 13, 5433. [Google Scholar] [CrossRef]
- Grant, P.R. Evolution on islands. Oxford University Press: Oxford, UK, 1998. [Google Scholar]
- Emerson, B.C. Evolution on oceanic islands: molecular phylogenetic approach es to understanding pattern and process. Mol. Ecol 2002, 11, 951–966. [Google Scholar] [CrossRef] [PubMed]
- Rodrigues, P.; Tristão Da Cunha, R. Azorean birds – a natural heritage. Açoreana, Supl. 2011, 7, 319–330. [Google Scholar]
- Rodrigues, P.; Lopes, R.J.; Drovetski, S.V.; Reis, S.; Ramos, J.A.; Tristão Da Cunha, R. Hylogeography and genetic diversity of the Robin (Erithacus rubecula) in the Azores Islands: Evidence of a recent colonization. J Orn. 2013, 154, 889–900. [Google Scholar] [CrossRef]
- Rodrigues, P. Azores Passeriformes – a model for evolutionary studies. Bol. Núcleo Cult. Horta 2014, 23, 135–155. [Google Scholar]
- Talavera, J.A.; Cunha, L.; Arévalo, J.R.; Talavera, I.P.; Kille, P.; Novo, M. Anthropogenic disturbance and environmental factors drive the diversity and distribution of earthworms in São Miguel Island (Azores, Portugal). Appl. Soil Ecol. 2020, 145, 103301. [Google Scholar] [CrossRef]
- Borges, P.A.V.; Gabriel, R.; Arroz, A.; Costa, A.; Cunha, R.; Silva, L.; Mendonça, E.; Martins, A.M.; Reis, F.; Cardoso, P. The Azorean Biodiversity Portal: An internet database for regional biodiversity outreach. System. & Biodiv 2010, 8, 423434. [Google Scholar] [CrossRef]
- Borges, P.A.V.; Lamelas-Lopez, L.; Andrade, R.; Lhoumeau, S.; Vieira, V.; Soares, A.O.; Borges, I.; Boieiro, M.; Cardoso, P.; Crespo, L.C.F.; Karsholt, O.; Schülke, M.; Serrano, A.R.M.; Quartau, J.A.; Assing, V. An updated checklist of Azorean arthropods (Arthropoda). Biodiv. Data J. 2022, 10, e97682. [Google Scholar] [CrossRef]
- Barcelos, L.; Rodrigues, P.; Bried, J.; Mendonça, E.; Gabriel, R.; Borges, P. Birds from the Azores: An updated list with some comments on species distribution. Biodiv. Data J. 2015, 3, e6604. [Google Scholar] [CrossRef]
- Tiengo, R.; Merino-De-Miguel, S.; Uchôa, J.; Gil, A. A Land Cover Change Detection Approach to Assess the Effectiveness of Conservation Projects: A Study Case on the EU-Funded LIFE Projects in São Miguel Island, Azores (2002–2021). Land 2024, 13, 666. [Google Scholar] [CrossRef]
- Sutherland, W.J. Ecological Census Techniques: a handbook; Cambridge University Press: Cambridge, UK, 1996. [Google Scholar]
- Bibby, C.J.; Burgess, N.D.; Hill, D.A.; Mustoe, S. Bird Census Techniques, 2nd ed.; Academic Press: London, UK, 2012. [Google Scholar]
- Kopij, G. Avian diversity in an urbanized South African grassland. Zool. & Ecol. 2015, 25, 87–100. [Google Scholar] [CrossRef]
- Kopij, G. Population density and structure of birds breeding in an urban habitat dominated by large baobabs (Adansonia digitata), Northern Namibia. Biosyst. Divers 2019, 27, 354–360. [Google Scholar] [CrossRef]
- Kopij, G. Population density and structure of a breeding bird community in a suburban habitat in the Cuvelai drainage system, northern Namibia. Arxius Misc. Zool. 2021, 19, 313–320. [Google Scholar] [CrossRef]
- Kopij, G. Structure of breeding bird assemblages in the city of Windhoek, Namibia. Arxius Misc. Zool. 2023, 21, 19–38. [Google Scholar] [CrossRef]
- Kopij, G. Changes in the structure of avian community along a moisture gradient in an urbanized tropical riparian forest. Pol. J. Ecol. 2020, 68, 251–262. [Google Scholar] [CrossRef]
- Kopij, G. Structures of breeding bird communities in wooded and densely built-up areas in a city centre in SW Poland. Acta Mus. Sil. Sci. Natur. 2024, 73, 1–9. [Google Scholar] [CrossRef]
- Kopij, G. The effect of rainfall on the population densities and community structure of birds in an urbanized Zambezi riparian forest. Diversity 2023, 15, 1126. [Google Scholar] [CrossRef]
- Kopij, G. [Breeding bird community of the residential quarter of Sępolno, Wrocław]. Ptaki Śląska 2004, 15, 121-127. 2004, 15, 121–127. [Google Scholar]
- Kopij, G. [Breeding bird community of the Wrocław city centre]. Acta Sci. Polon., Biol 2006, 5, 3–12. [Google Scholar]
- Kopij, G. Provisional atlas of breeding birds of Hentjes Bay in the coastal Namib Desert. Nam. J. Envir. 2022, 6C: 1-6. https://www.nje.org.na/index.php/nje/article/view/volume6-kopij.
- Kopij, G. Provisional atlas of breeding birds of Swakopmund in the coastal Namib Desert. Lanioturdus 2018, 51, 2–12. [Google Scholar]
- Kopij, G. Provisional atlas of breeding birds of Walvis Bay in the coastal Namib Desert. Biologija 2023, 69, 151–160. [Google Scholar] [CrossRef]
- Kopij, G. Population densities of birds breeding in urban environment dominated by allotment gardens and other ‘green’ areas in a central European city. Acta Mus. Siles. Sci. Natur. 2022, 71, 237–242. [Google Scholar] [CrossRef]
- Dunn, A.M.; Weston, M.A. A Review of Terres trial Bird Atlases of the World and Their Application. Emu 2008, 108, 42–67. [Google Scholar] [CrossRef]
- Magle, S.B.; Hunt, V.M.; Vernon, M.; Crooks, K.R. Urban Wildlife Research: Past, Present, and Future. Biol. Conserv 2012, 155, 23–32. [Google Scholar] [CrossRef]
- Luniak, M. Urban ornithological atlases in Europe: a review. In Ecology and conservation of birds in urban environments; Murgui, E., Hedblom, H., Eds.; Springer: Berlin/Heidelberg, Germany, 2017; pp. 209–223. [Google Scholar]
Figure 1.
A: The satellite image of the study
area (Ponta Delgada); B: spatial distribution of transects. (1-40) and their
grouping: A – coastal built-up area, B –
suburb residential area, with some agriculture lands, C – densely-built up city
centre, with sparse tree vegetation, D – densely built-up area city centre,
well timbered, E – suburb residential areas, with some industry lands, F –
residential suburbs with pastures and arable lands, G – residential suburbs
with pastures and timbered lands, H – industry area.
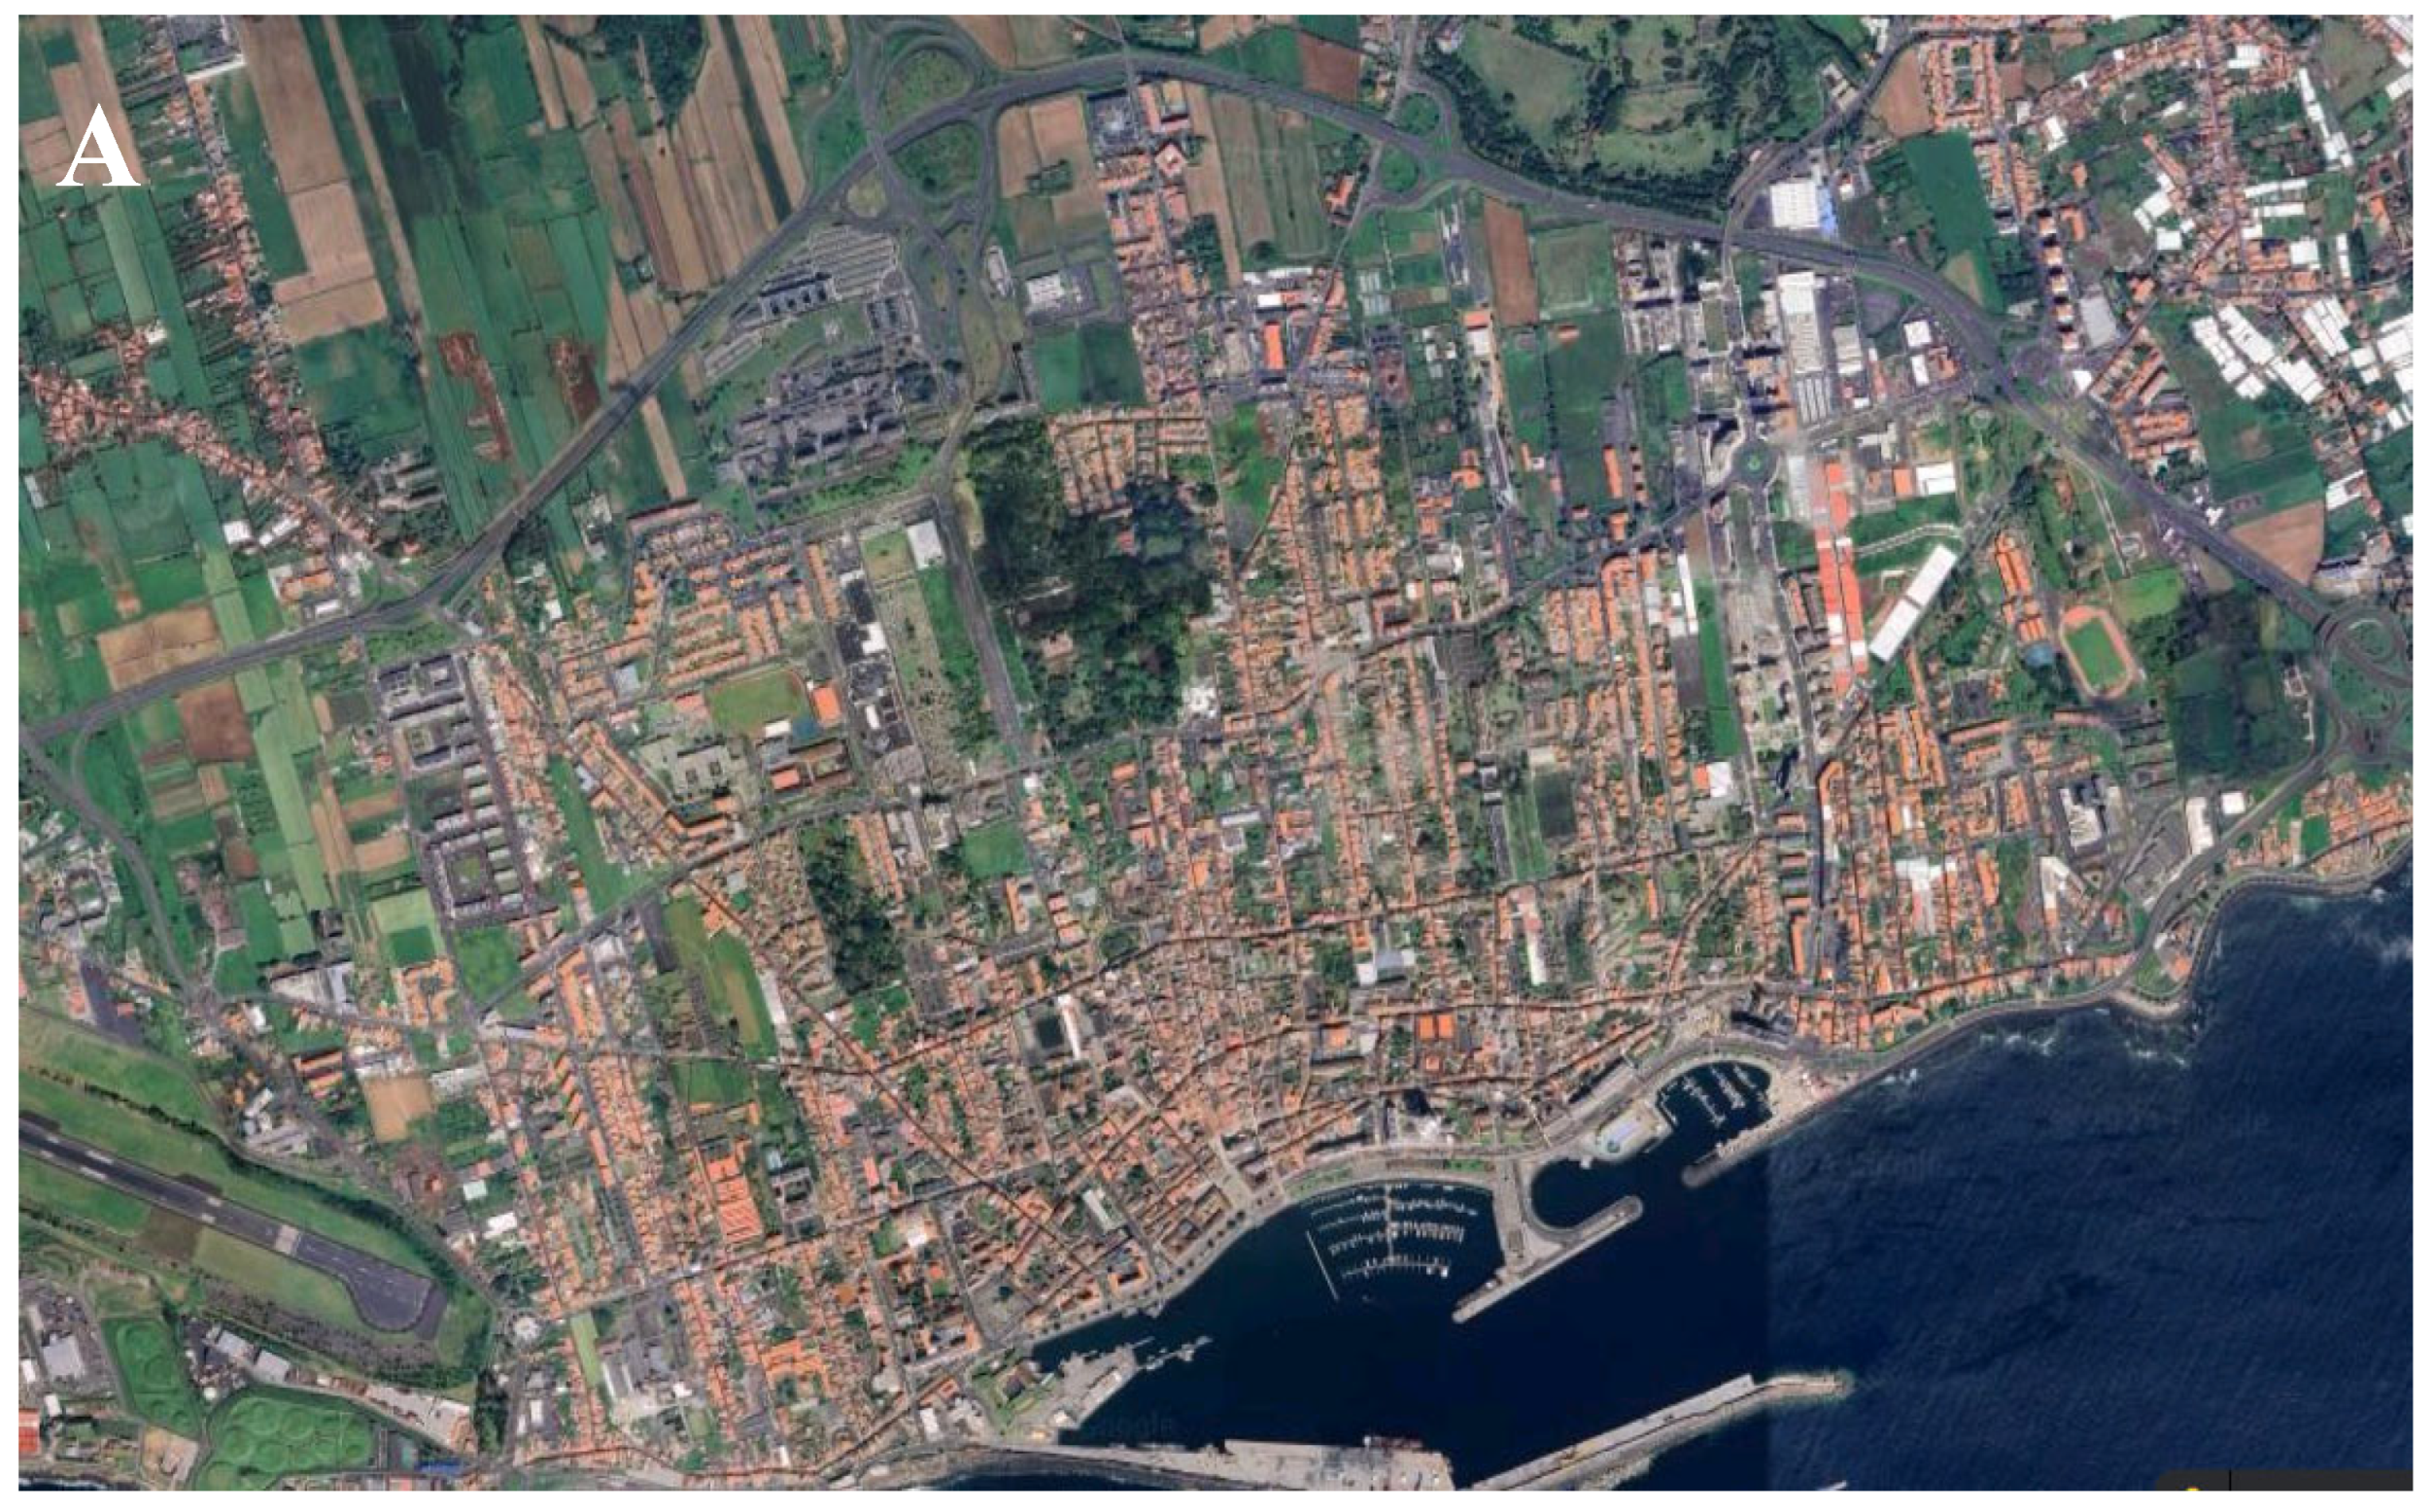
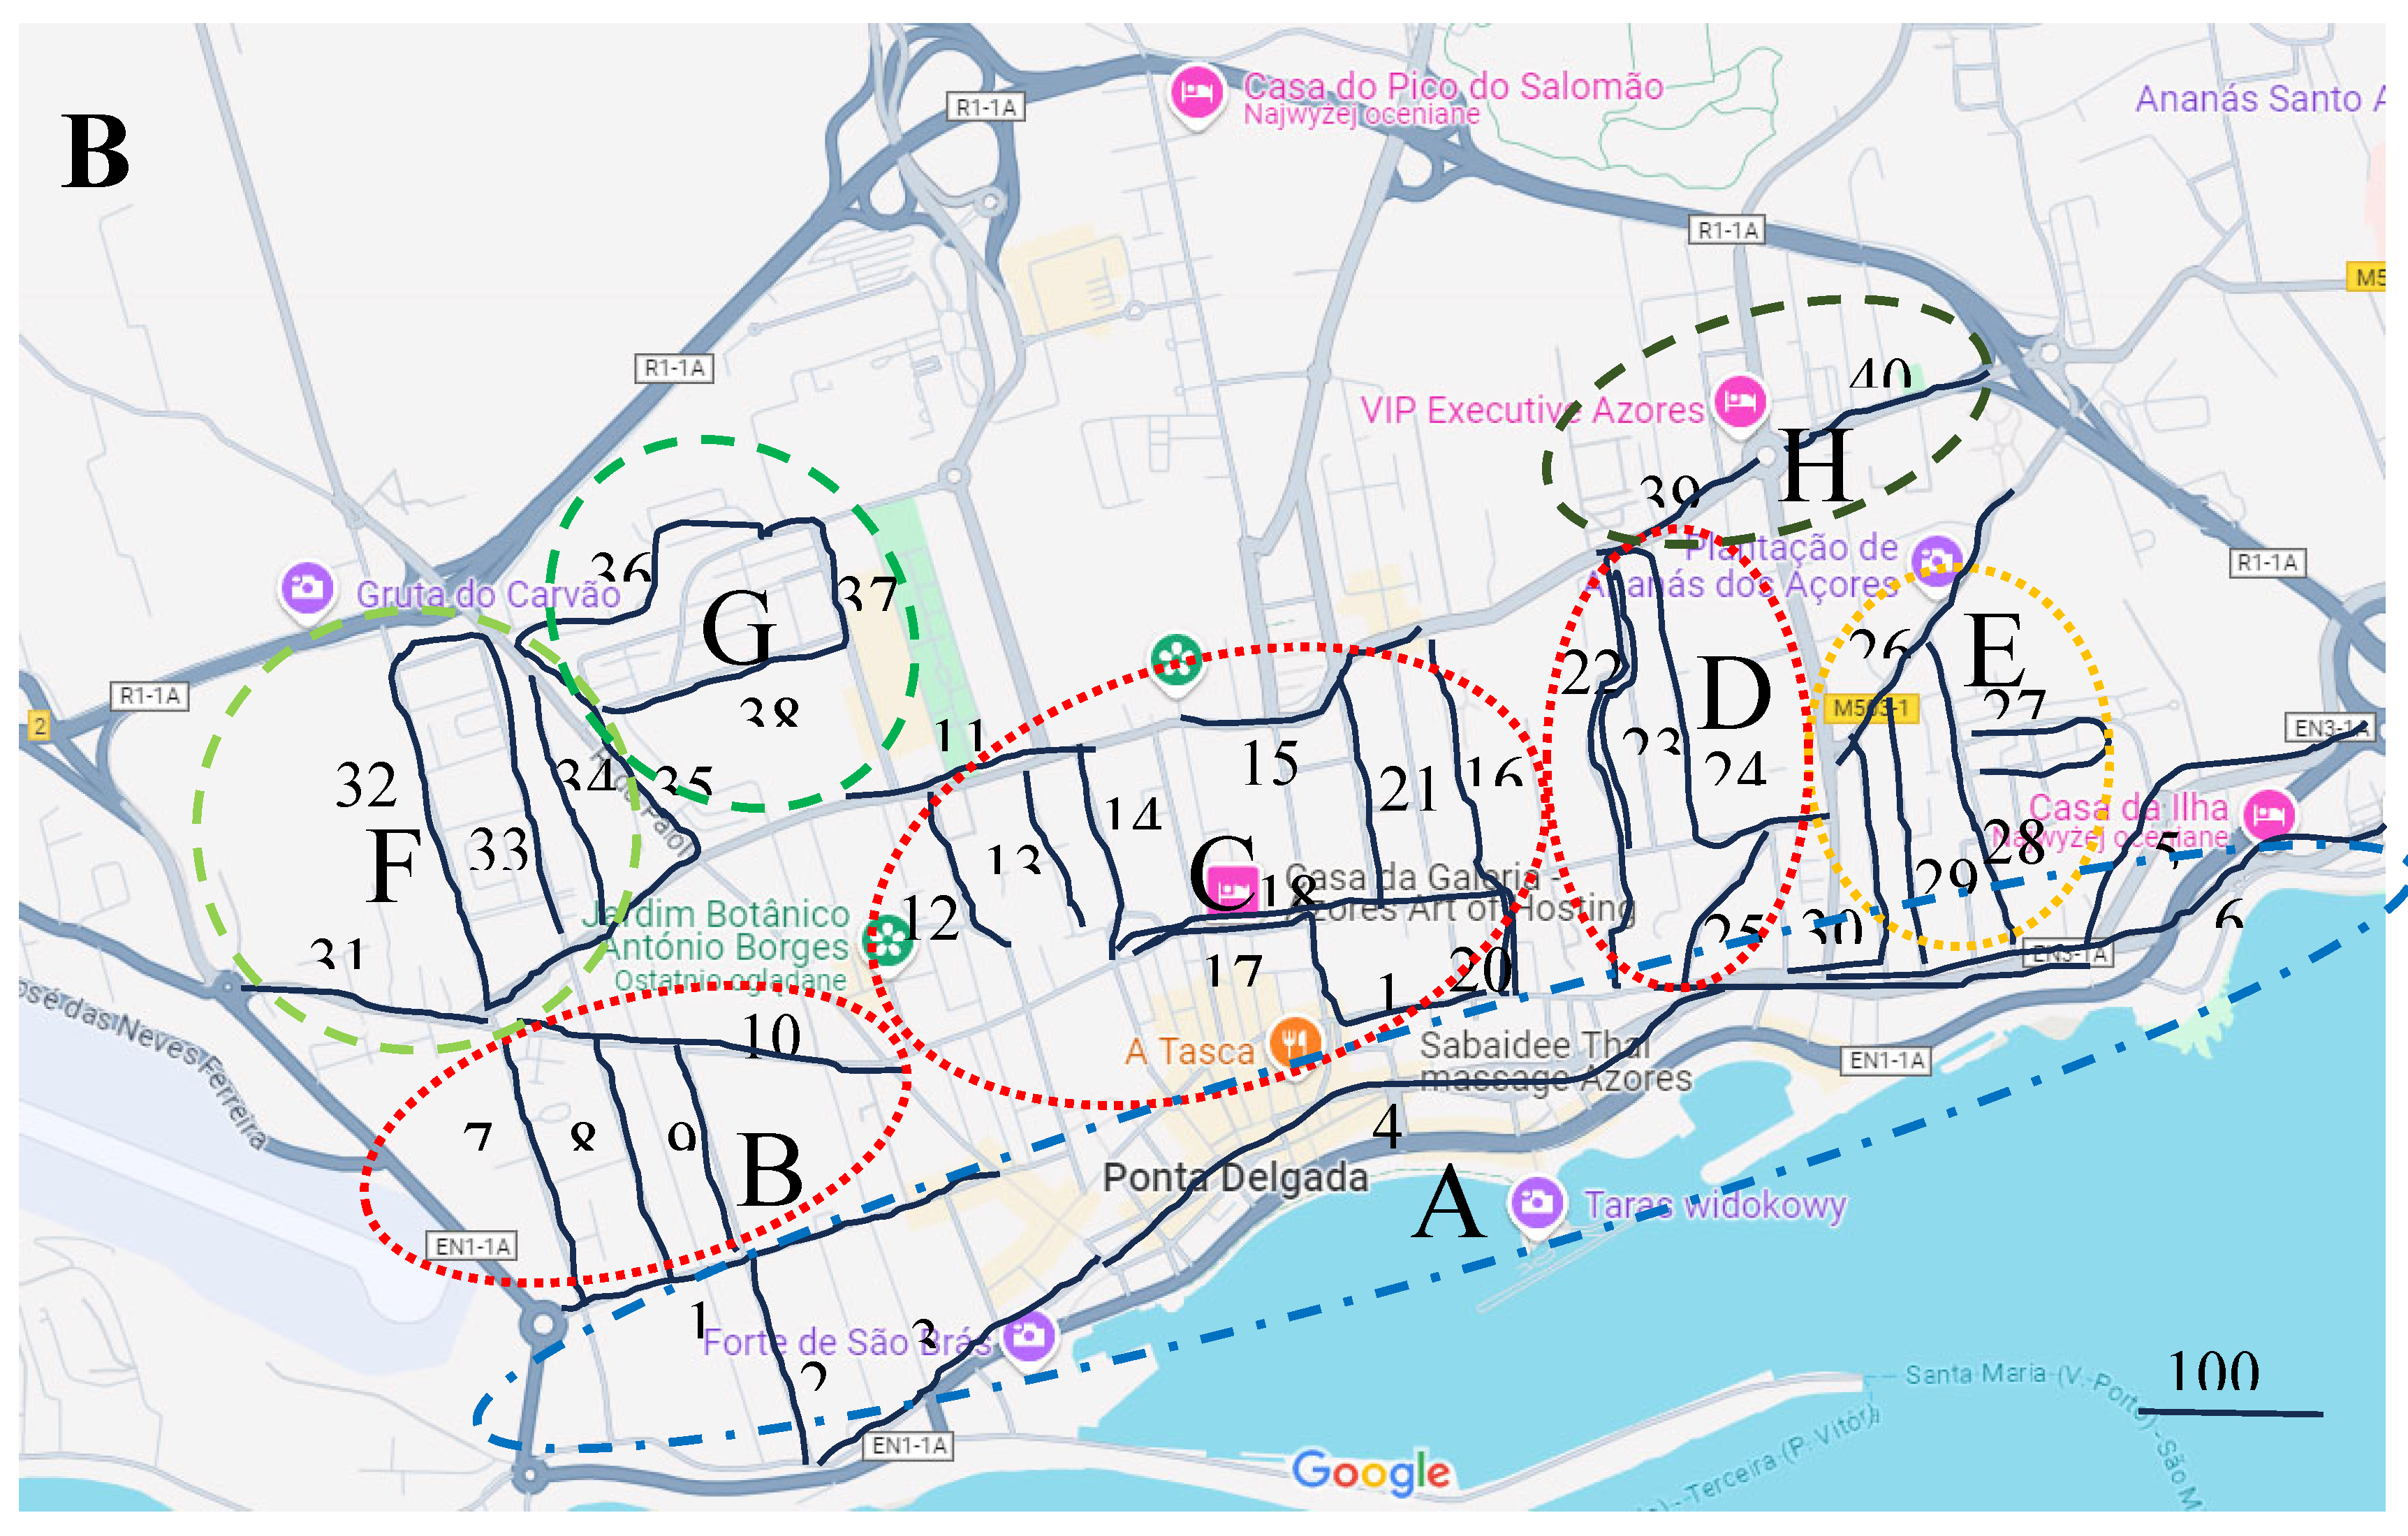
Figure 2.
Different land forms in the urbanized landscape of Ponta Delgada: A: the rural land, B: loosely built-up land, C: green land: Borges municipal garden; D: densely built-up land with rich vegetation; E: green land: Canto botanic garden; F: coastal densely built-up land with poor vegetation.
Figure 2.
Different land forms in the urbanized landscape of Ponta Delgada: A: the rural land, B: loosely built-up land, C: green land: Borges municipal garden; D: densely built-up land with rich vegetation; E: green land: Canto botanic garden; F: coastal densely built-up land with poor vegetation.
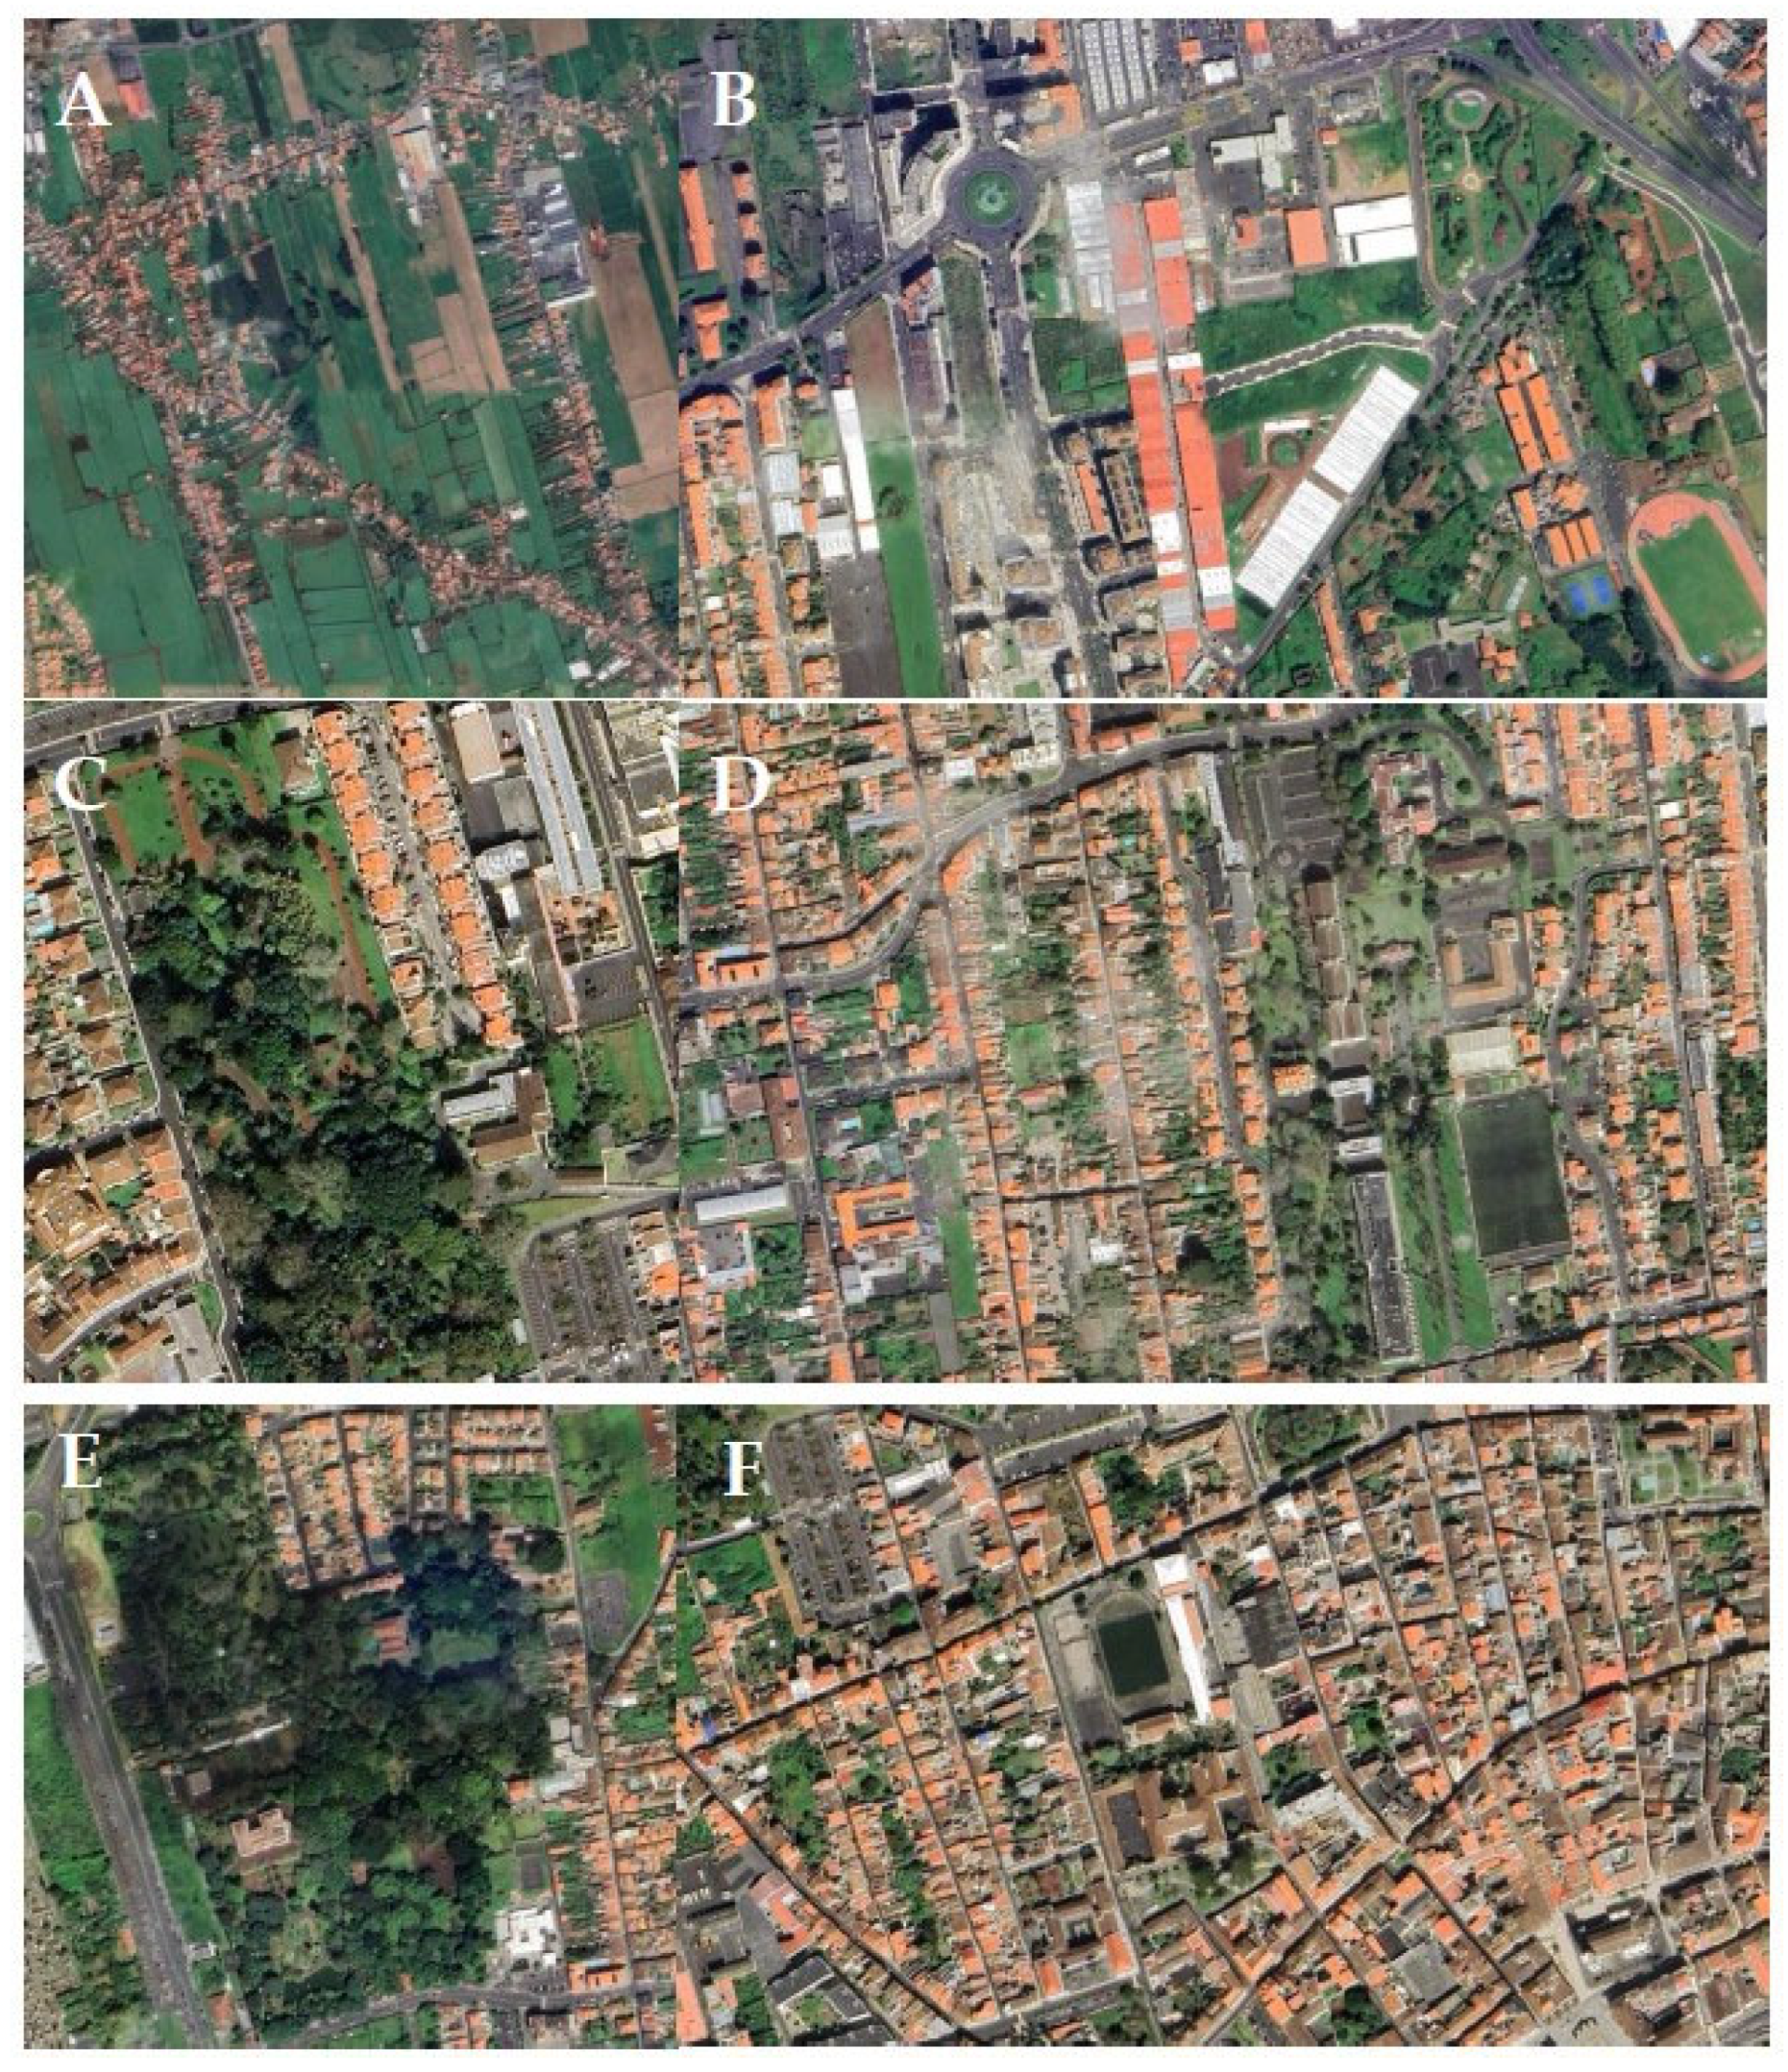
Figure 3.
Distribution of the land forms in Ponta Delgada as shown in Figure 2.
Figure 3.
Distribution of the land forms in Ponta Delgada as shown in Figure 2.
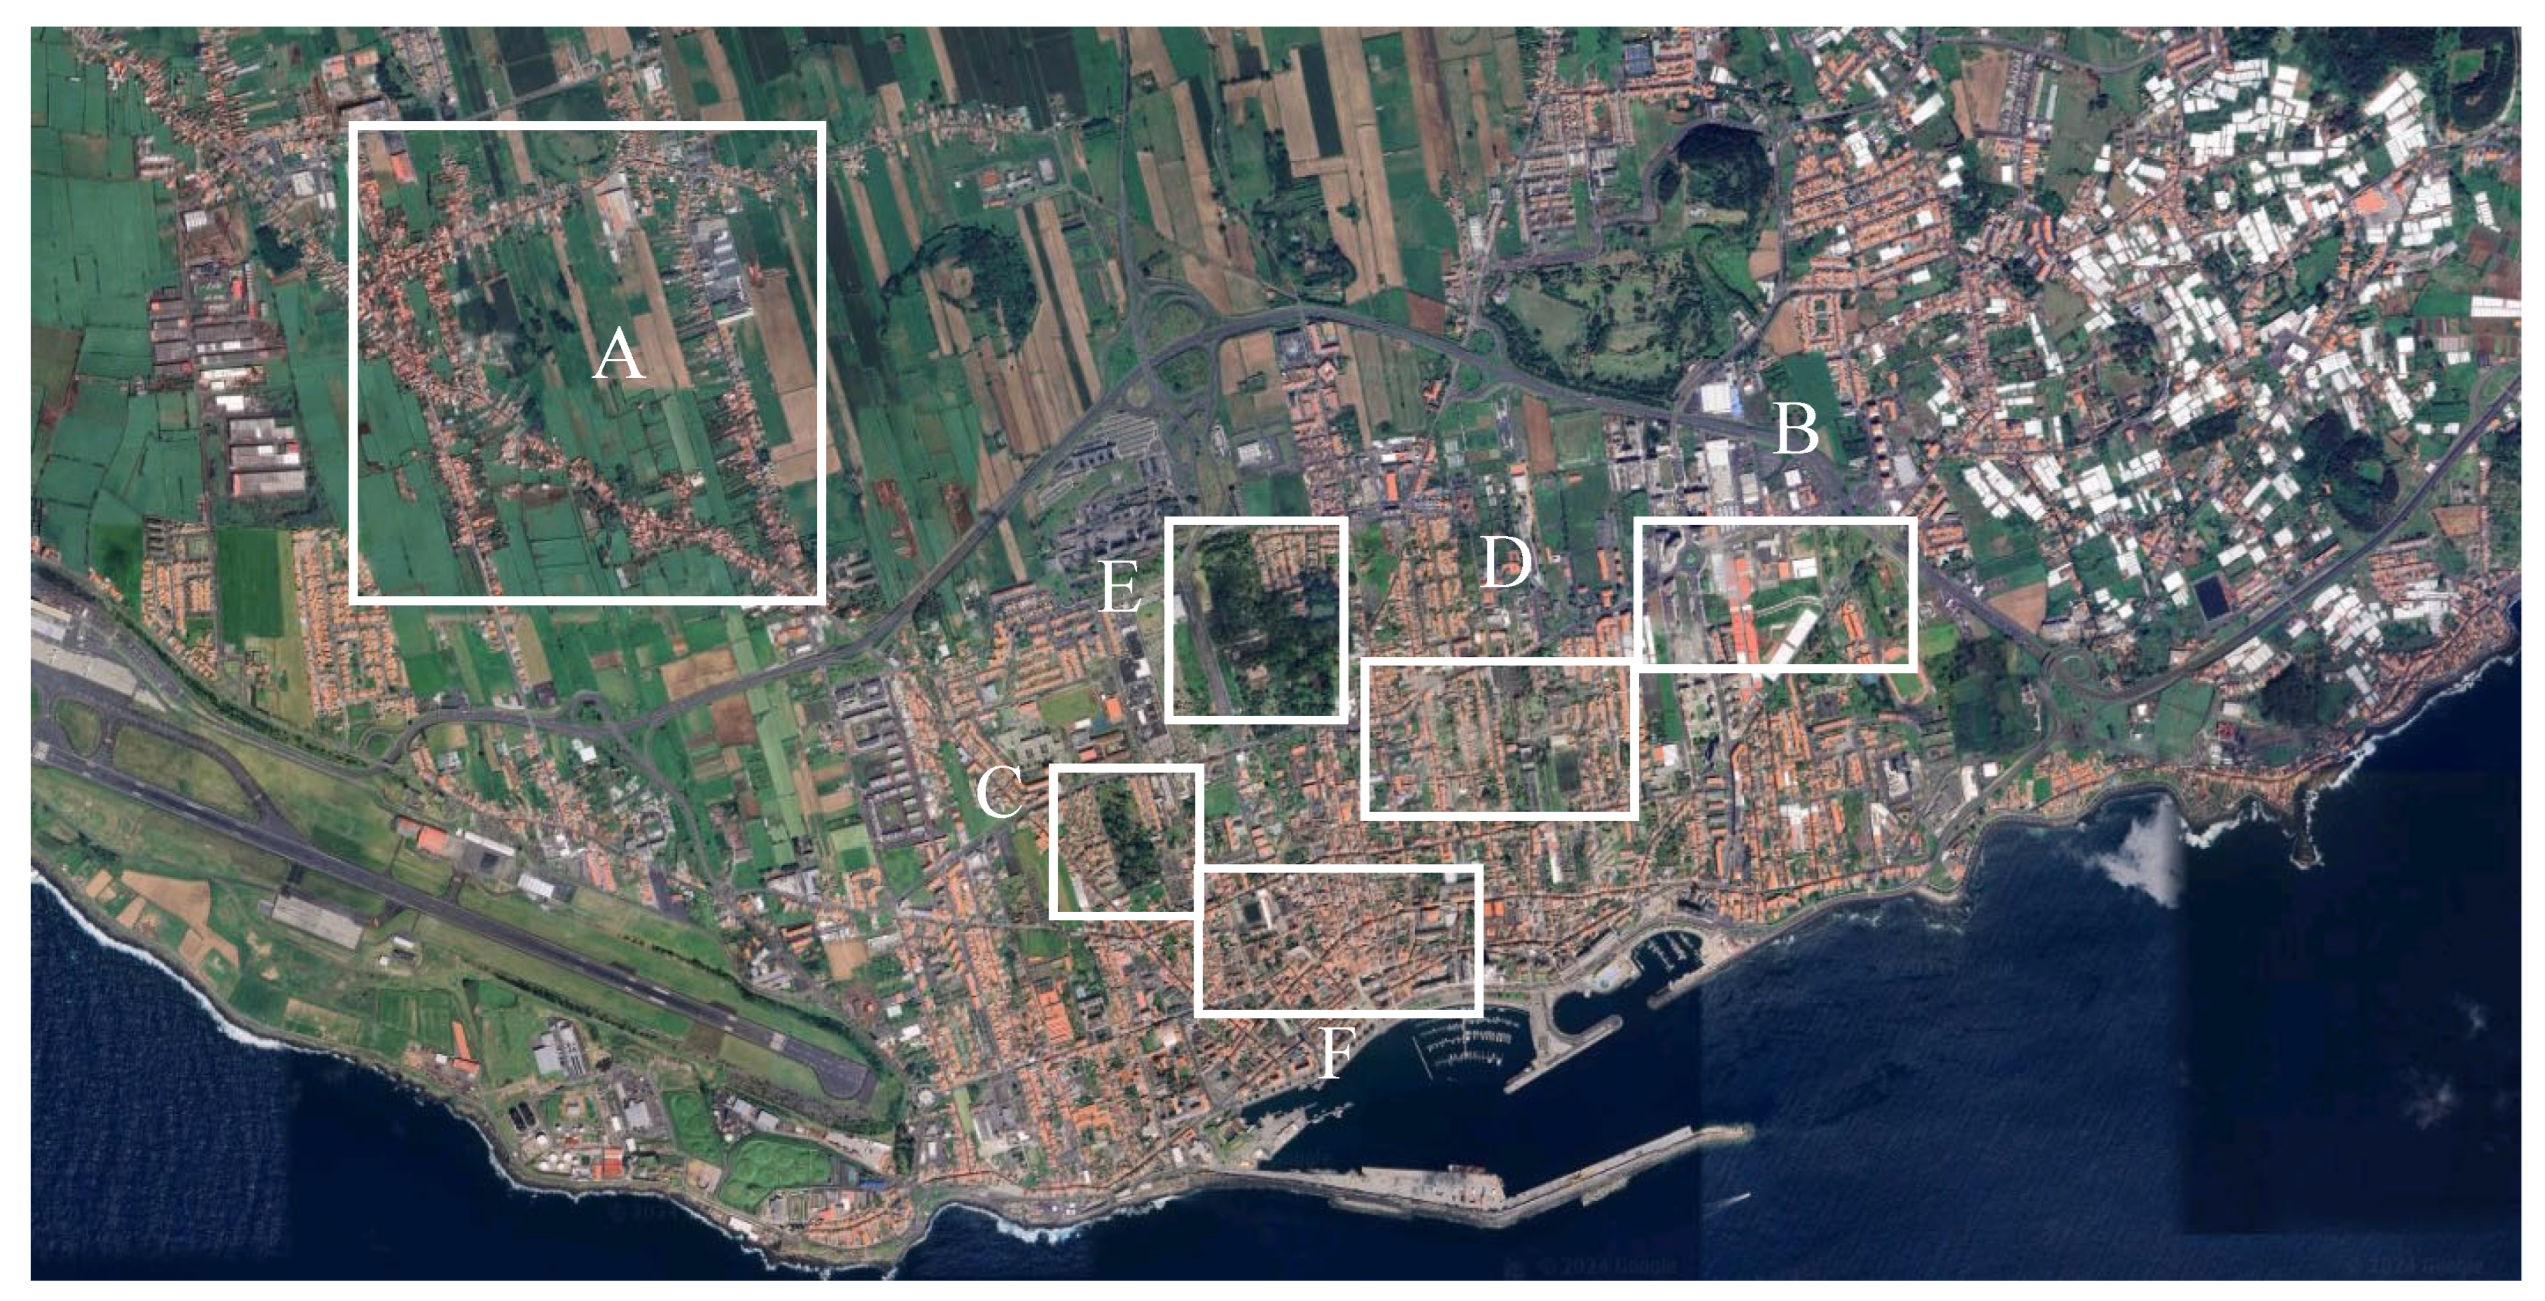
Figure 4.
Proportion of granivorous and insectivorous birds in main land forms in the urbanized landscape of the city Ponta Delgada.
Figure 4.
Proportion of granivorous and insectivorous birds in main land forms in the urbanized landscape of the city Ponta Delgada.
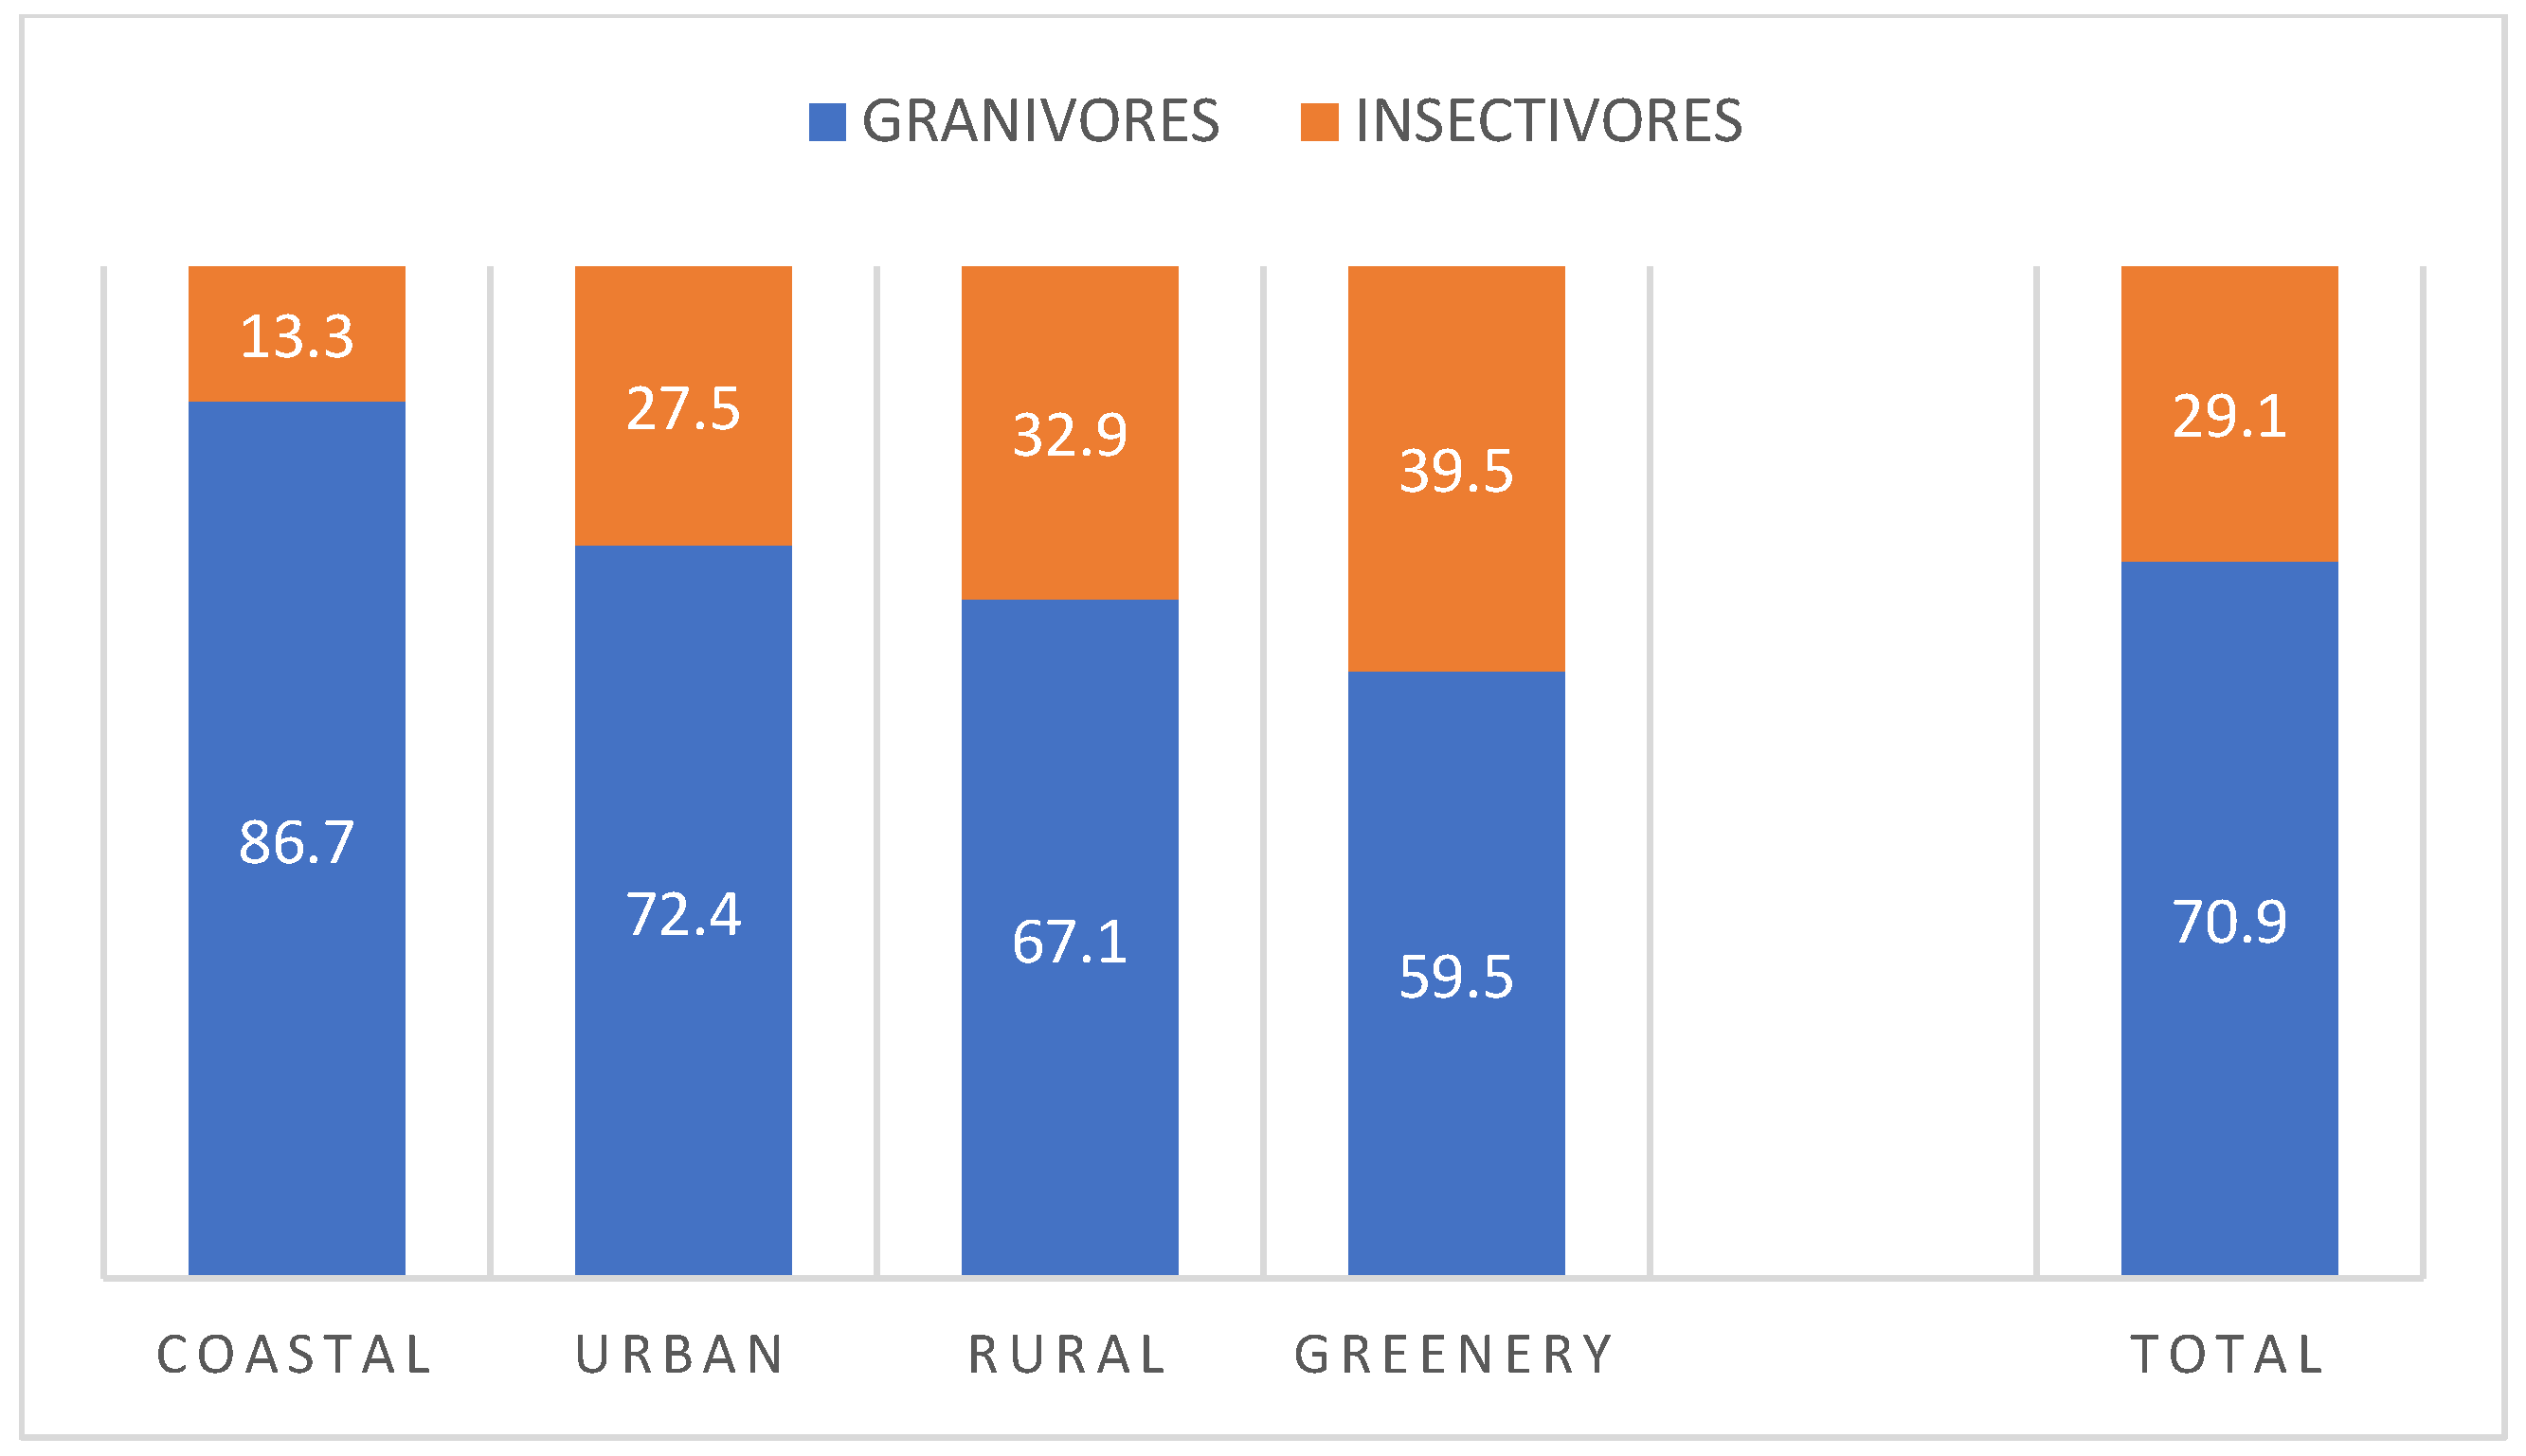
Figure 5.
Proportion of two nesting guilds of birds in the main land forms in the urbanized landscape of the city Ponta Delgada.
Figure 5.
Proportion of two nesting guilds of birds in the main land forms in the urbanized landscape of the city Ponta Delgada.
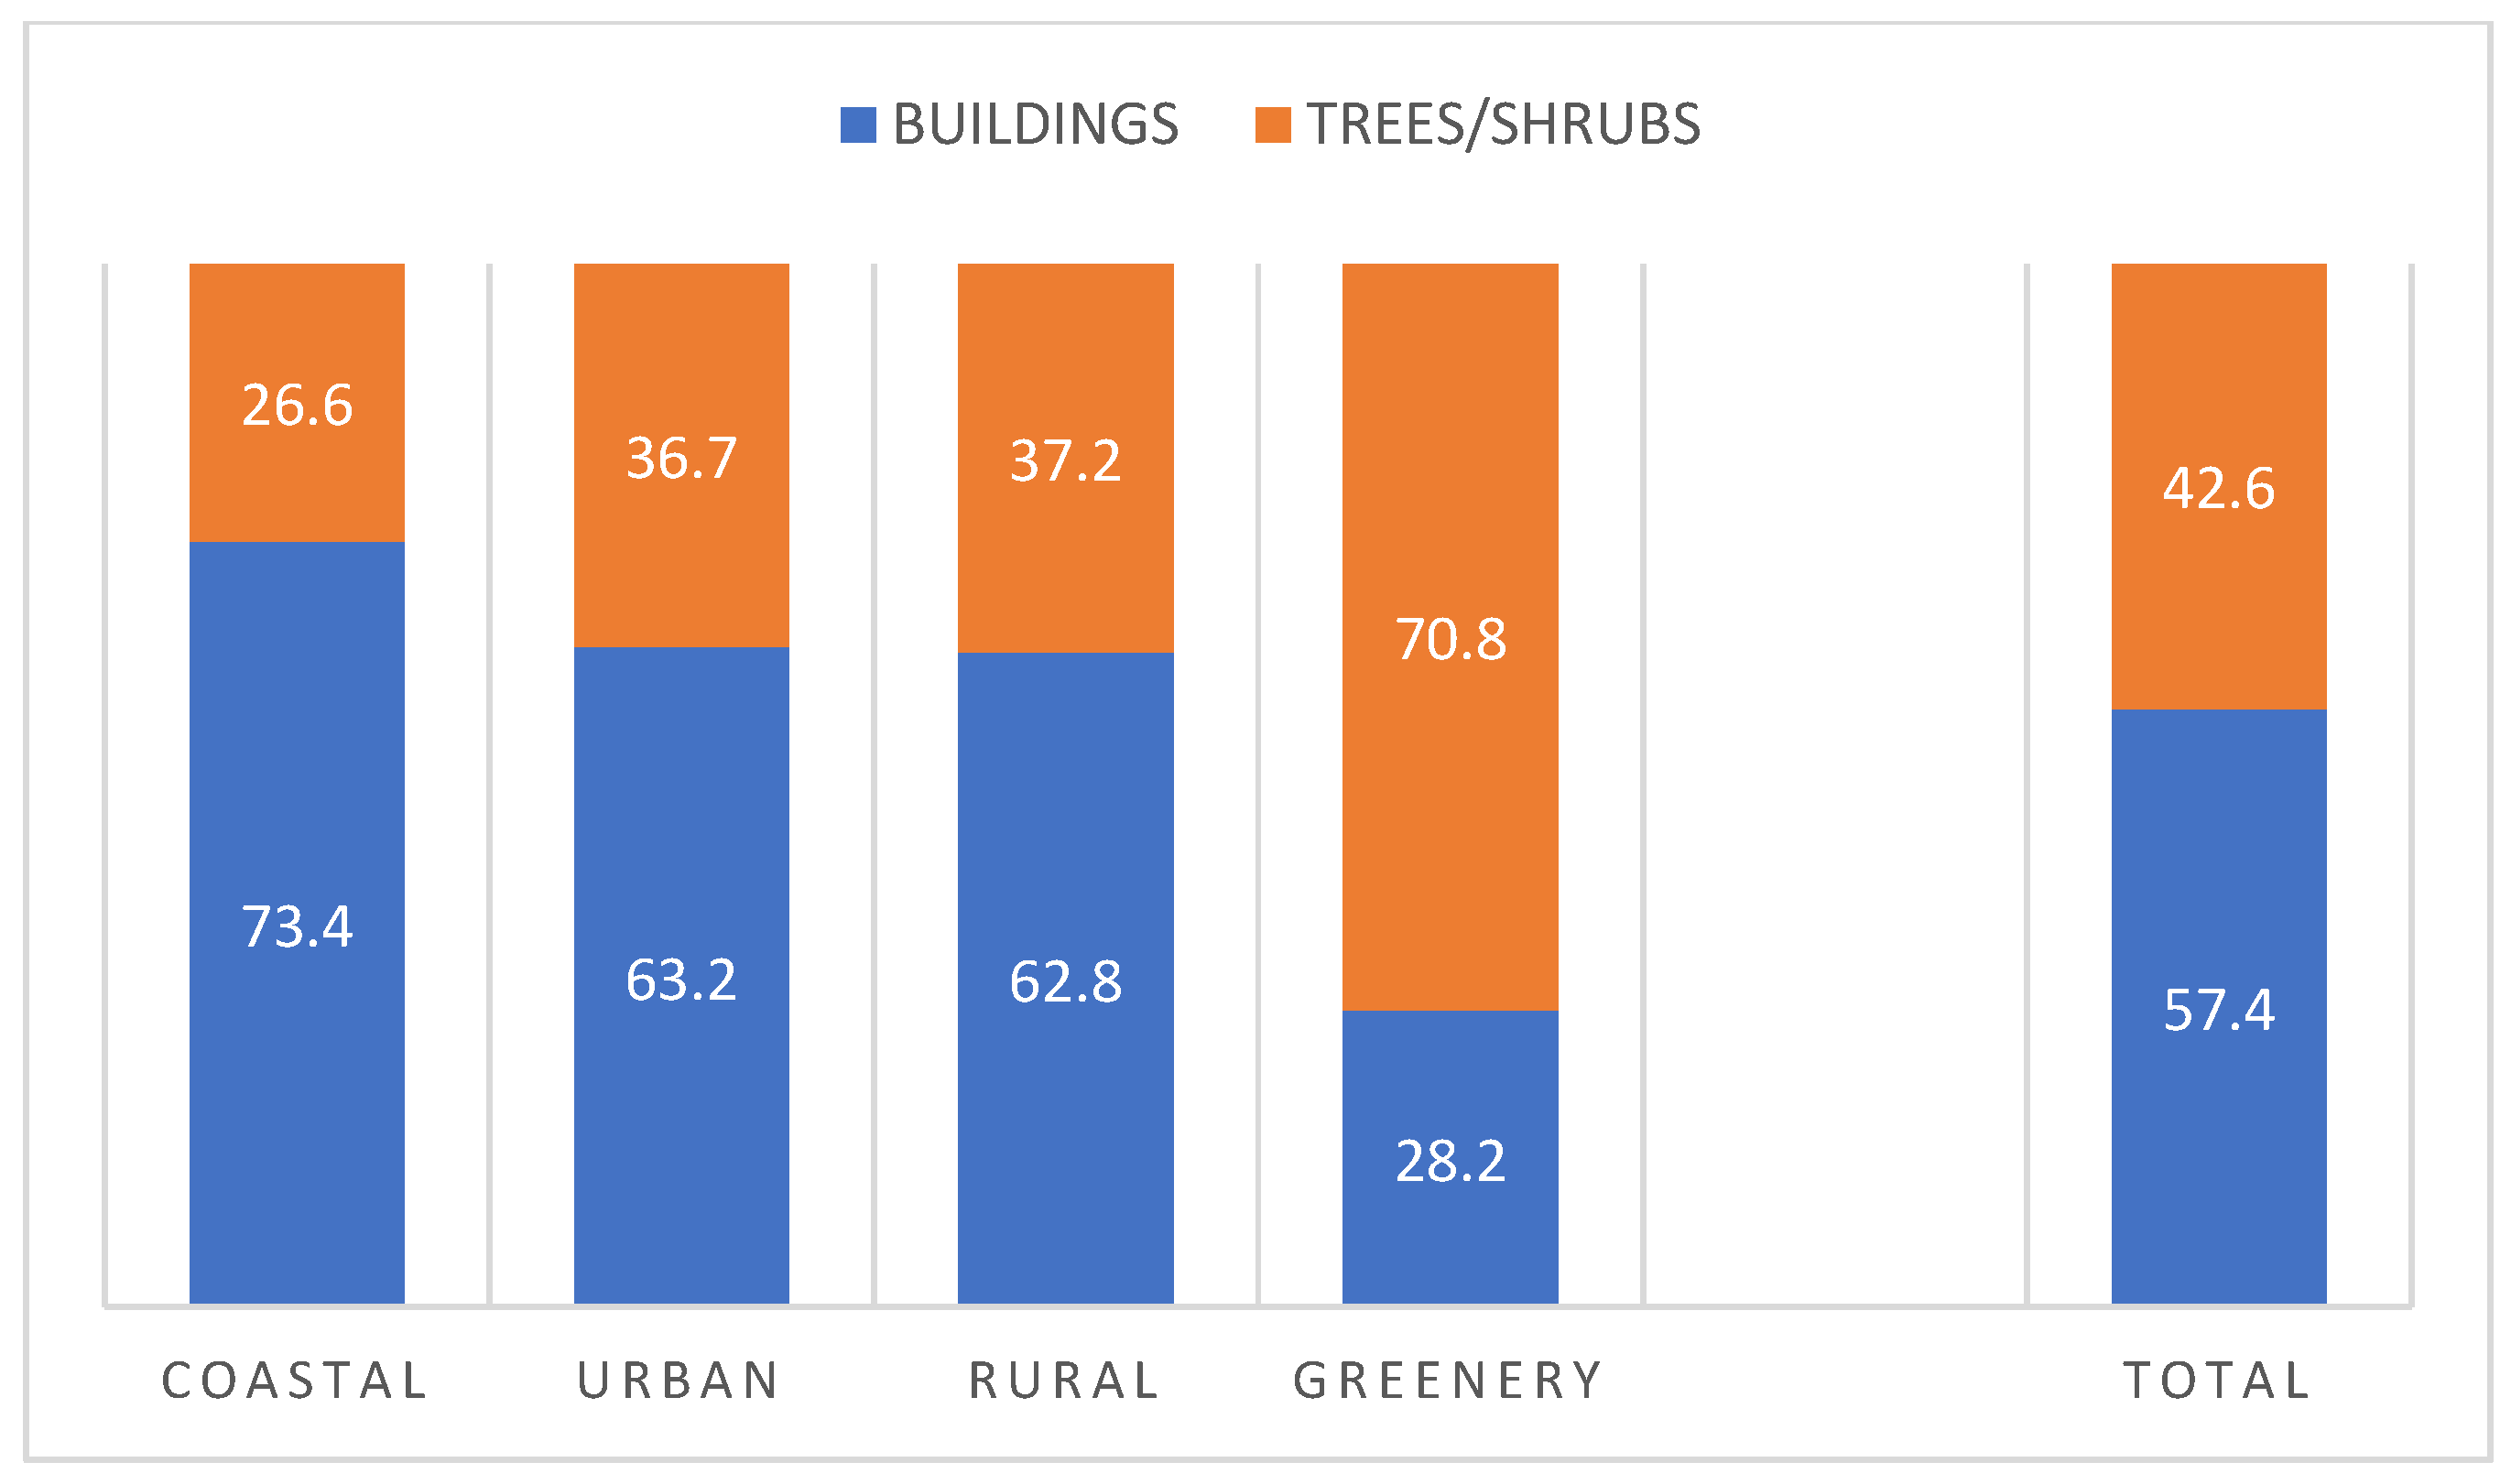
Figure 6.
Proportion of granivorous and insectivorous birds in various subcategories of the built-up lands in the city Ponta Delgada (see Figure 1B).
Figure 6.
Proportion of granivorous and insectivorous birds in various subcategories of the built-up lands in the city Ponta Delgada (see Figure 1B).
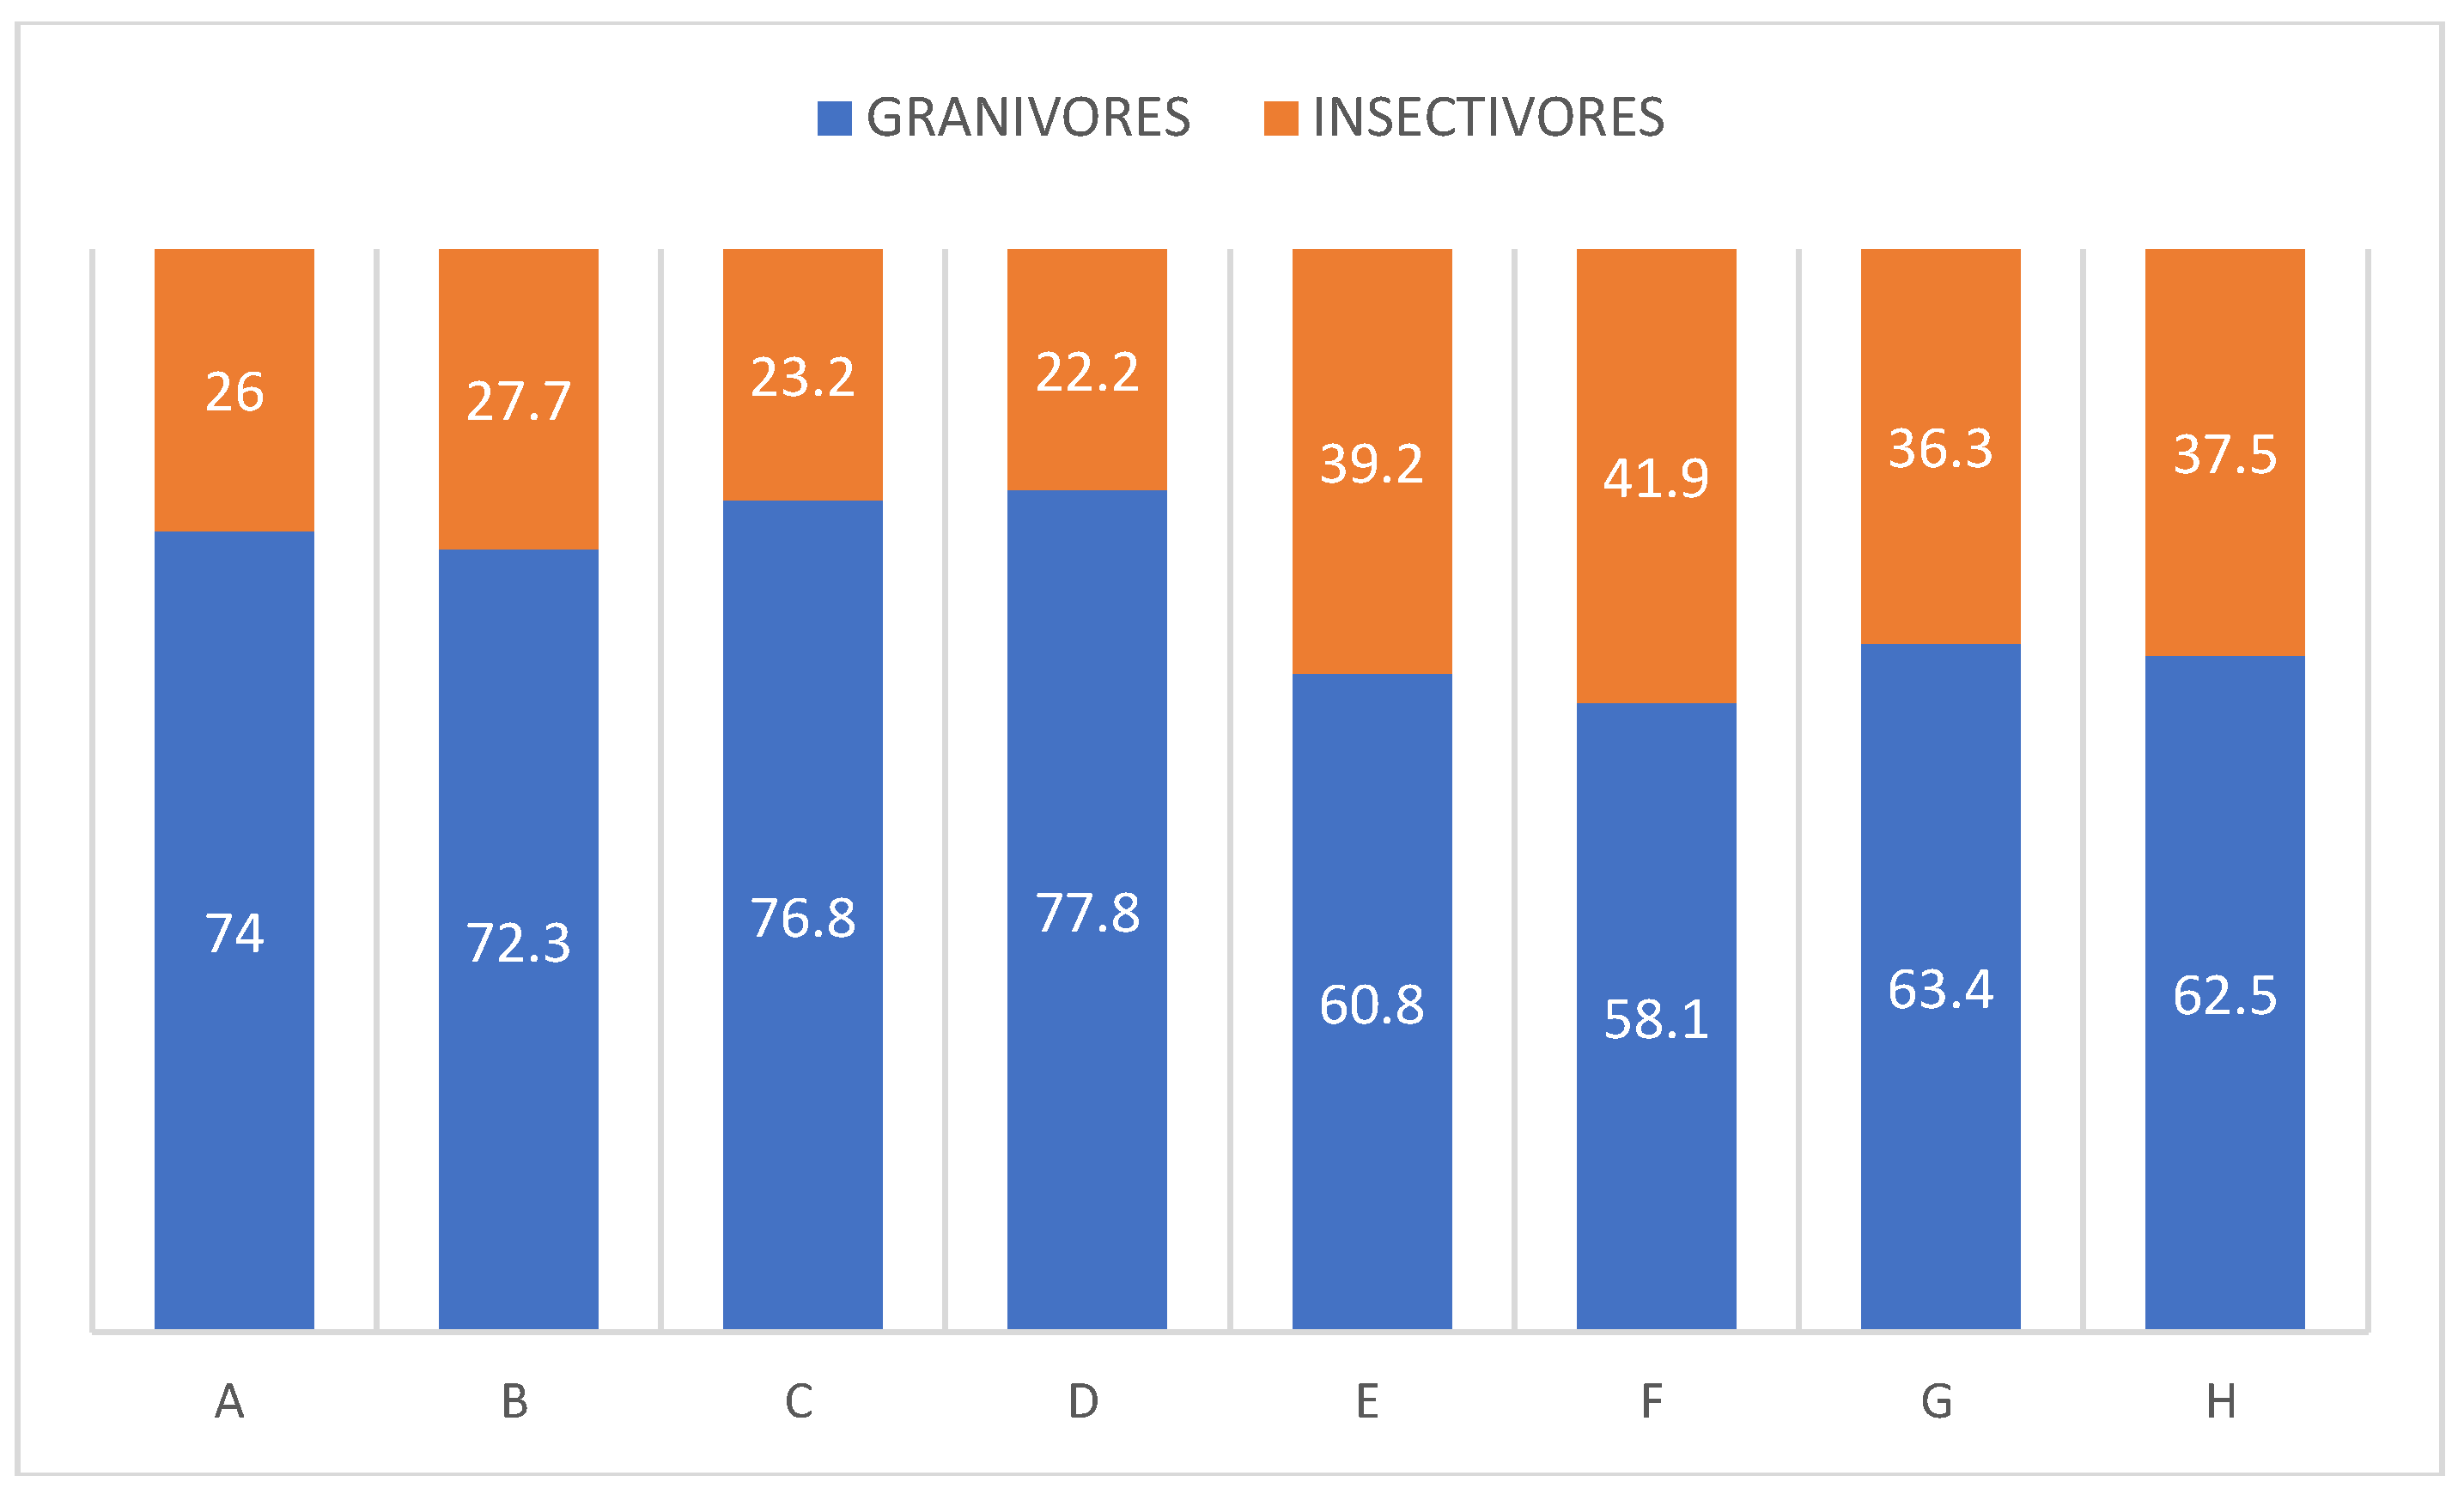
Figure 7.
Proportion of two nesting guilds of birds in various subcategories of the built-up lands in the city Ponta Delgada (see Figure 1B).
Figure 7.
Proportion of two nesting guilds of birds in various subcategories of the built-up lands in the city Ponta Delgada (see Figure 1B).
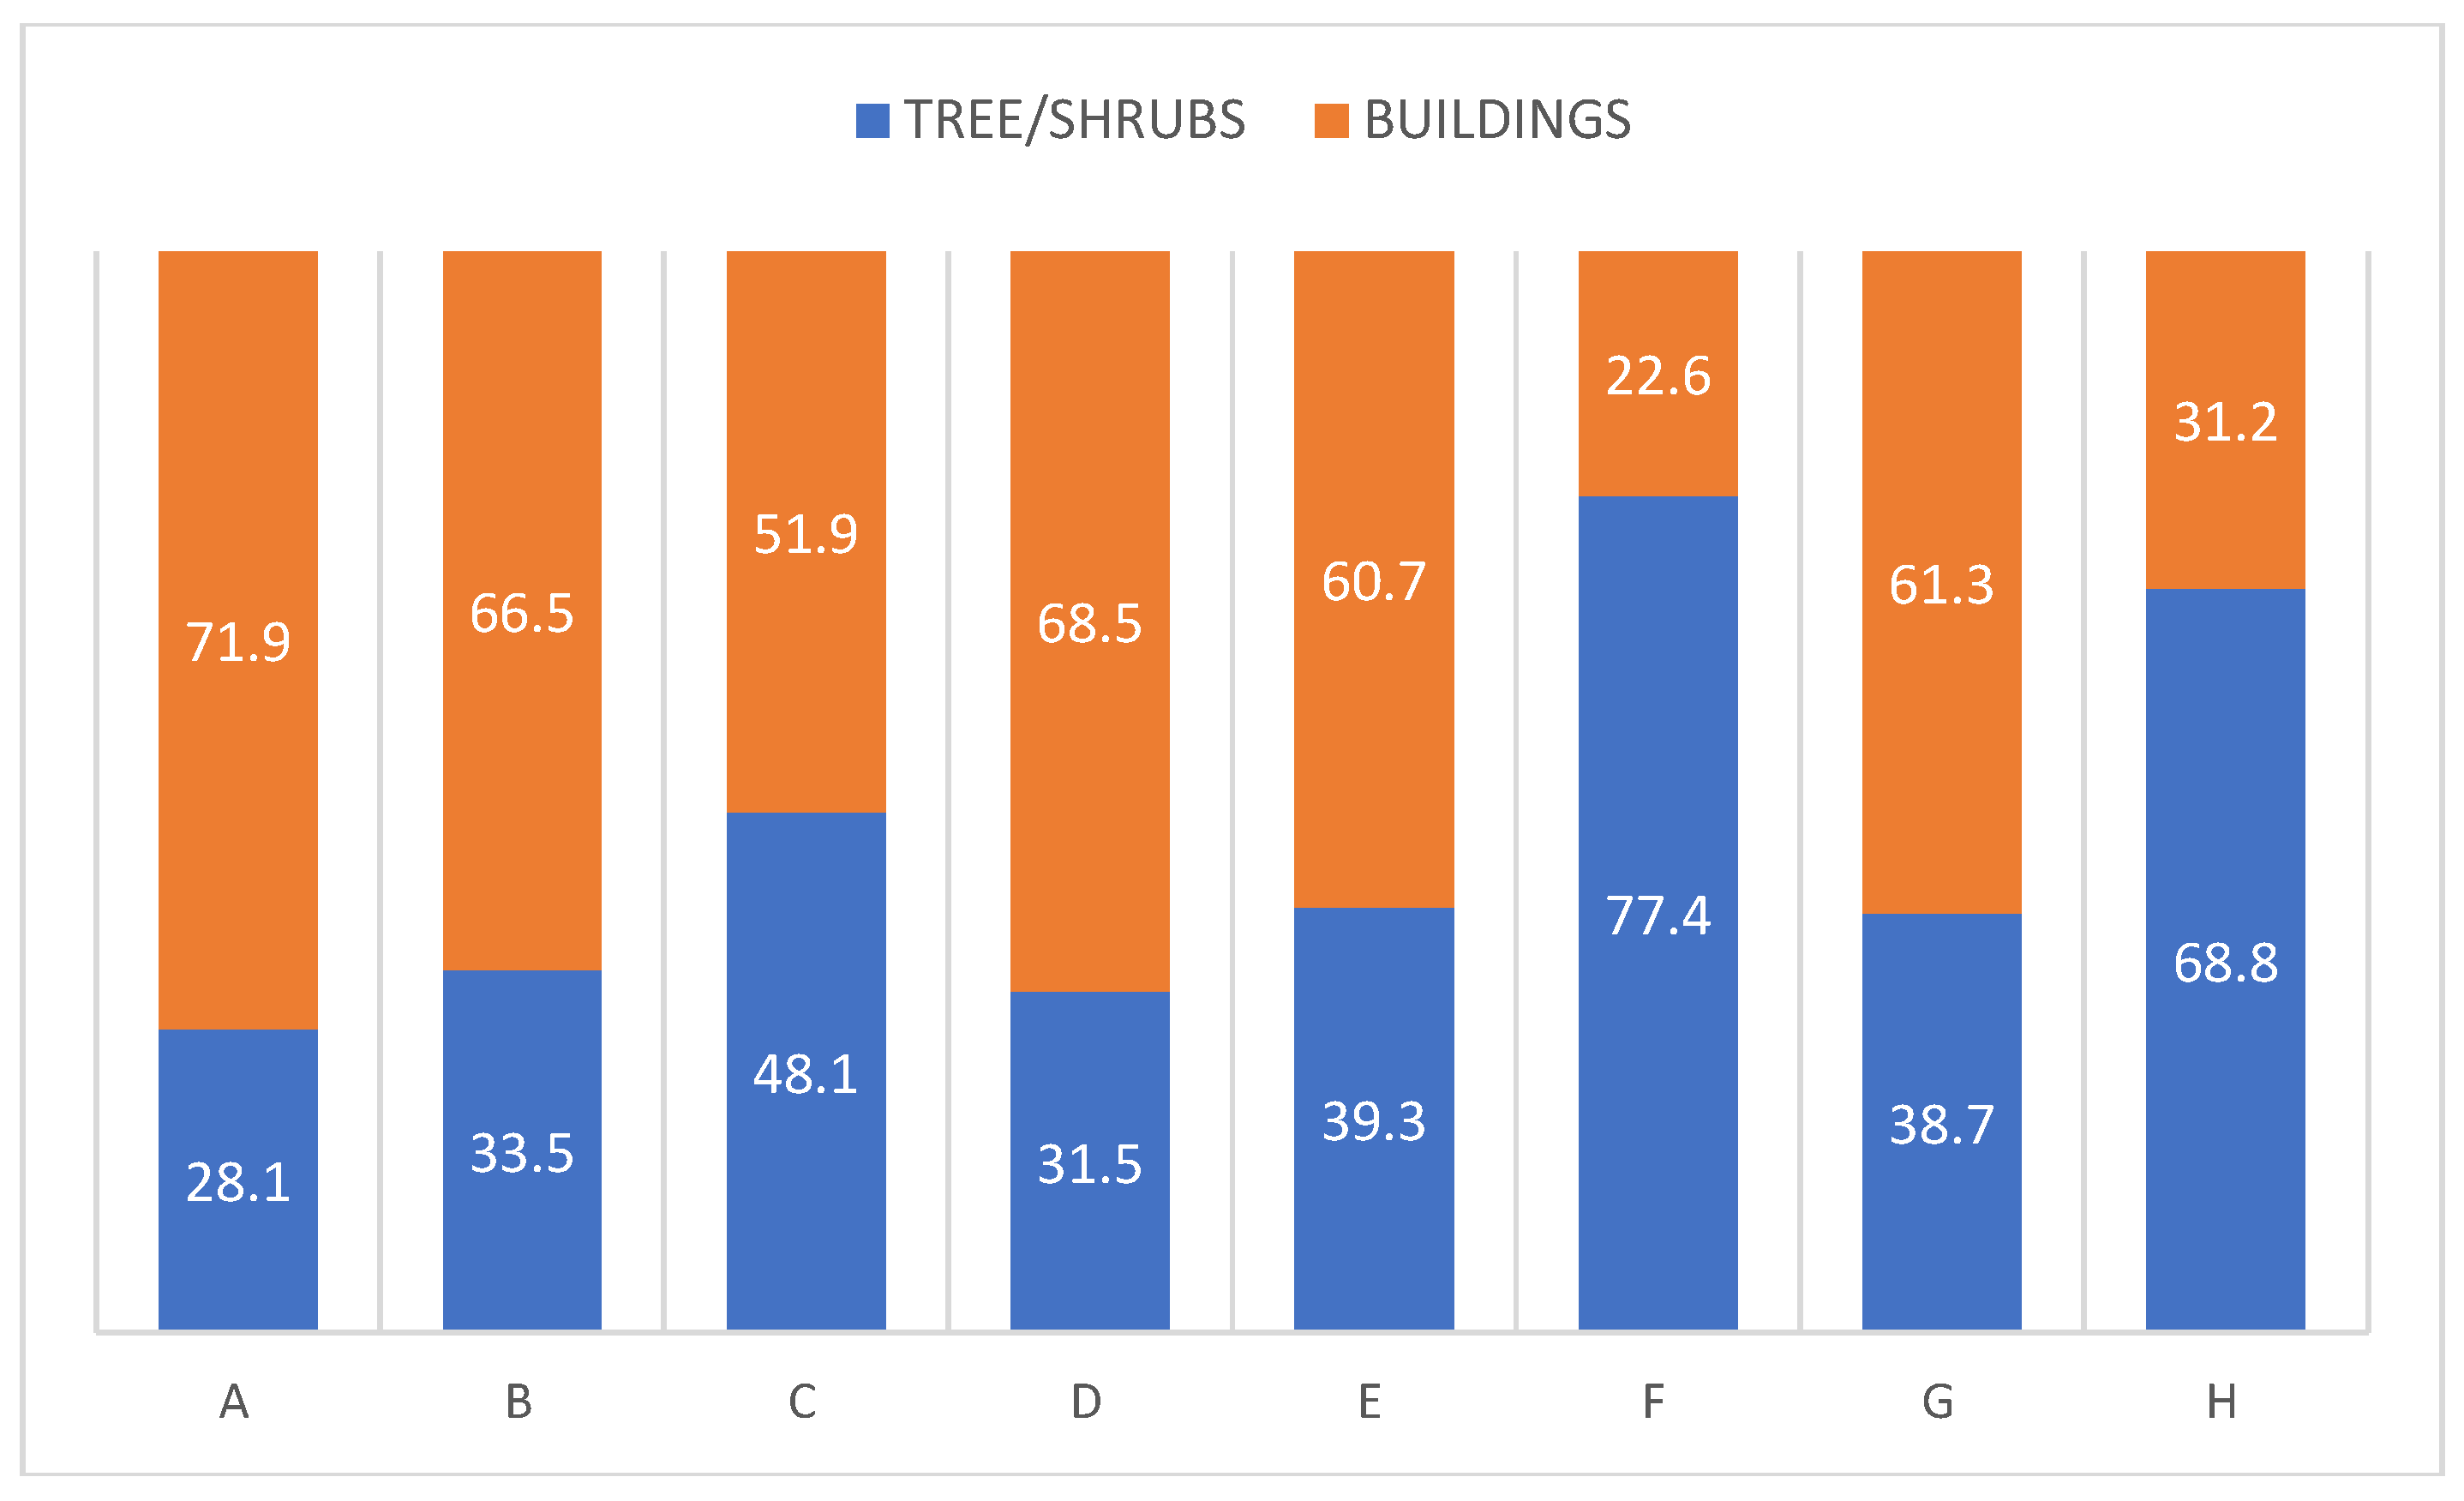

Table 1.
Characterization of bird community in main land forms in Ponta Delgada.
| Land form | N. of pairs | N. of spp. | Overall density | Cumulative dominance | Dominance index | N. of dom. | H’ | J’ | D |
|---|---|---|---|---|---|---|---|---|---|
| Costal | 248 | 10 | 54.9 | 90.4 | 0.70 | 5 | 1.53 | 0.67 | 0.70 |
| Urban | 1537 | 14 | 67.9 | 95.3 | 0.55 | 7 | 1.83 | 0.69 | 0.77 |
| Rural | 255 | 13 | 77.5 | 85.5 | 0.55 | 5 | 1.82 | 0.71 | 0.78 |
| Greenery | 499 | 20 | 68.9 | 85.2 | 0.31 | 9 | 2.46 | 0.82 | 0.90 |
| Total | 2539 | 21 | 67.9 | 91.3 | 0.49 | 7 | 2.03 | 0.68 | 0.81 |
Table 2.
Characterization of bird communities in various land forms of built-up areas (see Figure 1B) in Ponta Delgada in 2024.
Table 2.
Characterization of bird communities in various land forms of built-up areas (see Figure 1B) in Ponta Delgada in 2024.
| Parameter | A | B | C | D | E | F | G | H |
|---|---|---|---|---|---|---|---|---|
| Number of pairs | 428 | 137 | 249 | 238 | 133 | 31 | 289 | 32 |
| Number of species | 10 | 8 | 11 | 10 | 11 | 8 | 12 | 9 |
| Overall density | 85.6 | 54.8 | 40.2 | 58.0 | 33.3 | 20.7 | 68.8 | 58.2 |
| Cumulative dominance | 89.6 | 83.9 | 79.5 | 87.8 | 88.0 | 93.7 | 93.1 | 97.0 |
| Dominance index | 0.54 | 0.61 | 0.62 | 0.67 | 0.57 | 0.45 | 0.54 | 0.34 |
| N. of dominant species | 5 | 3 | 4 | 5 | 6 | 6 | 7 | 8 |
| H’ index | 1.70 | 1.62 | 1.74 | 1.52 | 1.90 | 1.85 | 1.93 | 2.09 |
| J’ index | 0.74 | 0.78 | 0.73 | 0.66 | 0.79 | 0.89 | 0.78 | 0.95 |
| D index | 0.76 | 0.75 | 0.76 | 0.65 | 0.80 | 0.85 | 0.80 | 0.90 |
Table 3.
Breeding bird communities in various lands in the urbanized landscape of Ponta Delgada. Dominant values are given in bold case. N – number of breeding pairs, Den. – density(pairs / 10 ha), Dom. - dominance.
Table 3.
Breeding bird communities in various lands in the urbanized landscape of Ponta Delgada. Dominant values are given in bold case. N – number of breeding pairs, Den. – density(pairs / 10 ha), Dom. - dominance.
| Species | Costal land, 32 ha | Urban land, 280 ha | Rural land, 37 ha | Green land, 25 ha | Total, 374 ha | ||||||||||
|---|---|---|---|---|---|---|---|---|---|---|---|---|---|---|---|
| N | Den. | Dom. | N | Den. | Dom. | N | Den. | Dom. | N | Den. | Dom. | N | Den. | Dom. | |
| Passer domesticus | 122 | 38.1 | 49.2 | 652 | 23.3 | 42.4 | 105 | 28.4 | 41.2 | 61 | 24.4 | 12.2 | 940 | 25.13 | 37.02 |
| Streptopelia decaocto | 21 | 6.6 | 8.5 | 191 | 6.8 | 12.4 | 33 | 8.9 | 12.9 | 68 | 27.2 | 13.6 | 313 | 8.37 | 12.33 |
| Turdus merula | 19 | 5.9 | 7.7 | 114 | 4.1 | 7.4 | 28 | 7.6 | 11.0 | 85 | 34.0 | 17.0 | 246 | 6.58 | 9.69 |
| Sturnus vulgaris | 9 | 2.8 | 3.6 | 194 | 6.9 | 12.6 | 34 | 9.2 | 13.3 | 44 | 17.6 | 8.8 | 281 | 7.51 | 11.07 |
| Columba livia | 51 | 15.9 | 20.6 | 117 | 4.2 | 7.6 | 19 | 5.1 | 7.5 | 28 | 11.2 | 5.6 | 215 | 5.75 | 8.47 |
| Serinus canarensis | 15 | 4.7 | 6.0 | 97 | 3.5 | 6.3 | 12 | 3.2 | 4.7 | 55 | 22.0 | 11.0 | 179 | 4.79 | 7.05 |
| Sylvia atricapilla | 5 | 1.6 | 2.0 | 101 | 3.6 | 6.6 | 12 | 3.2 | 4.7 | 25 | 10.0 | 5.0 | 143 | 3.82 | 5.63 |
| Columba palumbus | 5 | 1.6 | 2.0 | 36 | 1.3 | 2.3 | 1 | 0.3 | 0.4 | 21 | 8.4 | 4.2 | 63 | 1.68 | 2.48 |
| Erithacus rubecula | 0 | 0.0 | 0.0 | 4 | 0.1 | 0.3 | 8 | 2.2 | 3.1 | 20 | 8.0 | 4.0 | 32 | 0.86 | 1.26 |
| Chloris chloris | 0 | 0.0 | 0.0 | 10 | 0.4 | 0.7 | 0 | 0.0 | 0.0 | 25 | 10.0 | 5.0 | 35 | 0.94 | 1.38 |
| Carduelis carduelis | 1 | 0.3 | 0.4 | 11 | 0.4 | 0.7 | 1 | 0.3 | 0.4 | 35 | 14.0 | 7.0 | 48 | 1.28 | 1.89 |
| Motacilla cinerea | 0 | 0.0 | 0.0 | 2 | 0.1 | 0.1 | 1 | 0.3 | 0.4 | 4 | 1.6 | 0.8 | 7 | 0.19 | 0.28 |
| Coturnix coturnix | 0 | 0.0 | 0.0 | 8 | 0.3 | 0.5 | 1 | 0.3 | 0.4 | 0 | 0.0 | 0.0 | 9 | 0.24 | 0.35 |
| Fringilla coelebs | 0 | 0.0 | 0.0 | 0 | 0.0 | 0.0 | 0 | 0.0 | 0.0 | 10 | 4.0 | 2.0 | 10 | 0.27 | 0.39 |
| Estrilda astrild | 0 | 0.0 | 0.0 | 0 | 0.0 | 0.0 | 0 | 0.0 | 0.0 | 6 | 2.4 | 1.2 | 6 | 0.16 | 0.24 |
| Anas platyrhynchos | 0 | 0.0 | 0.0 | 0 | 0.0 | 0.0 | 0 | 0.0 | 0.0 | 2 | 0.8 | 0.4 | 2 | 0.05 | 0.08 |
| Cairina moschata | 0 | 0.0 | 0.0 | 0 | 0.0 | 0.0 | 0 | 0.0 | 0.0 | 2 | 0.8 | 0.4 | 2 | 0.05 | 0.08 |
| Regulus regulus | 0 | 0.0 | 0.0 | 0 | 0.0 | 0.0 | 0 | 0.0 | 0.0 | 1 | 0.4 | 0.2 | 1 | 0.03 | 0.04 |
| Buteo buteo | 0 | 0.0 | 0.0 | 0 | 0.0 | 0.0 | 0 | 0.0 | 0.0 | 1 | 0.4 | 0.2 | 1 | 0.03 | 0.04 |
| Asio otus | 0 | 0.0 | 0.0 | 0 | 0.0 | 0.0 | 0 | 0.0 | 0.0 | 1 | 0.4 | 0.2 | 1 | 0.03 | 0.04 |
| Psittacula krameri | 0 | 0.0 | 0.0 | 0 | 0.0 | 0.0 | 0 | 0.0 | 0.0 | 1 | 0.4 | 0.2 | 1 | 0.03 | 0.04 |
| Total | 248 | 77.5 | 100 | 1537 | 54.9 | 100 | 255 | 68.9 | 100 | 499 | 199.6 | 100 | 2539 | 67.9 | 100 |
Disclaimer/Publisher’s Note: The statements, opinions and data contained in all publications are solely those of the individual author(s) and contributor(s) and not of MDPI and/or the editor(s). MDPI and/or the editor(s) disclaim responsibility for any injury to people or property resulting from any ideas, methods, instructions or products referred to in the content. |
© 2024 by the authors. Licensee MDPI, Basel, Switzerland. This article is an open access article distributed under the terms and conditions of the Creative Commons Attribution (CC BY) license (http://creativecommons.org/licenses/by/4.0/).
Copyright: This open access article is published under a Creative Commons CC BY 4.0 license, which permit the free download, distribution, and reuse, provided that the author and preprint are cited in any reuse.


