
Submitted:
10 December 2024
Posted:
11 December 2024
You are already at the latest version
Abstract
Surface texturing entails surface alteration through forming, micro grooving, micro dimpling and microchanneling. This is achieved by laser micromachining, in addition to other related methods on the substrate surface. The present paper puts forward the surface characteristics obtained after the laser texturing of the Arbofill Fichte biodegradable polymers with four and six passes, in hex-agonal and square patterns. The results of the wettability test indicated that Arbofill Fichte has a surface with a weak hydrophobic character (contact angle near 90°), regardless of the type of texture that was obtained. The underlying material's wear behaviour changed as a result of the Laser Surface Texturing (LST) surface alteration. Friction coefficient (COF) values thus increased for all samples. Arbofill Fichte exhibits a higher Y-axis stability in both geometries, suggesting a better resistance to vertical compression (subsidence), particularly in the 6 passes case. Addition-ally, Arbofill Fichte has a better X-axis extension. Therefore, Arbofill Fichte is stable and uniform in both geometries and at both numbers of passes, providing a more consistent X-axis expansion and better-managed Y-axis compression. The possibility of use in the practice of textured surfaces is viable; thus, based on the obtained results, there is even the possibility to replace non-biodegradable polymers from different sectors of activity.
Keywords:
1. Introduction
2.1. Samples Preparation
2.2. Laser Surface Texturing (LST)
2.2.1. Microscopic Observation
2.2.2. Wettability Test
2.2.3. Wear Test
2.2.4. Scanning Electron Microscopy (SEM)
2.2.5. Degradation Test
- T↓ - T=-5°C w t = 1 h
- Aging: T= -5°C. t= 3 h
- T↑ - T= 50°C. HD = 90%. t =1 h
- Aging – T = 50°C. HD = 90%. t =3 h
2.2.6. Topography
3. Results and Discussion
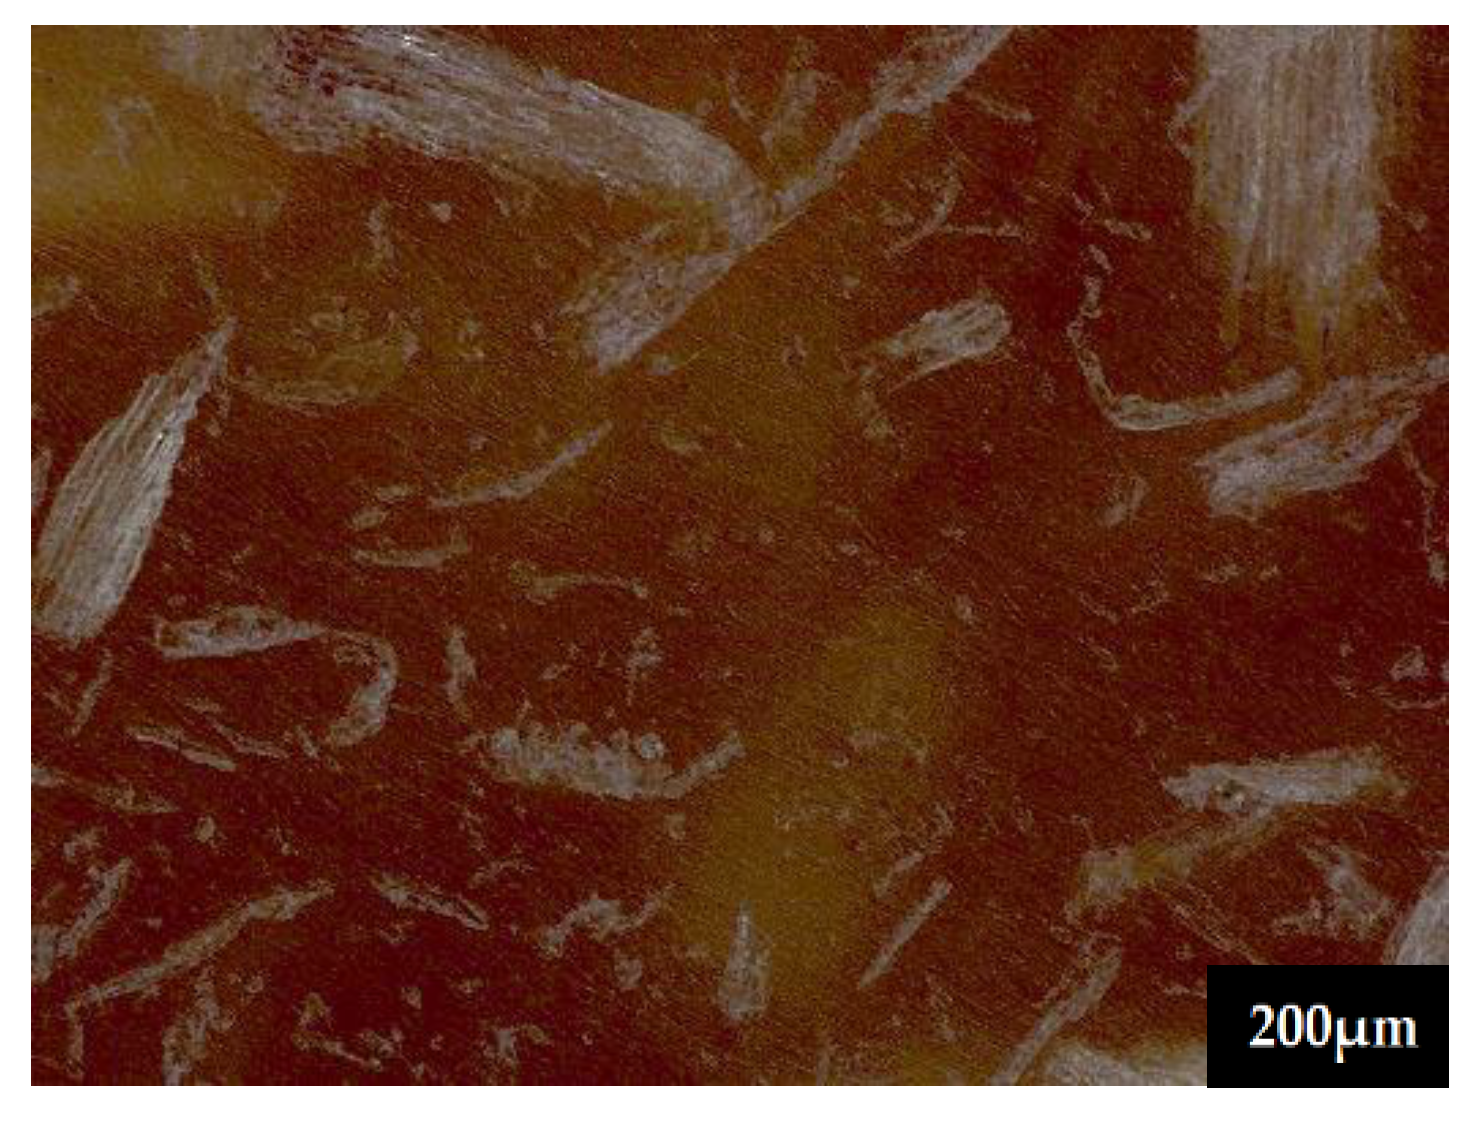
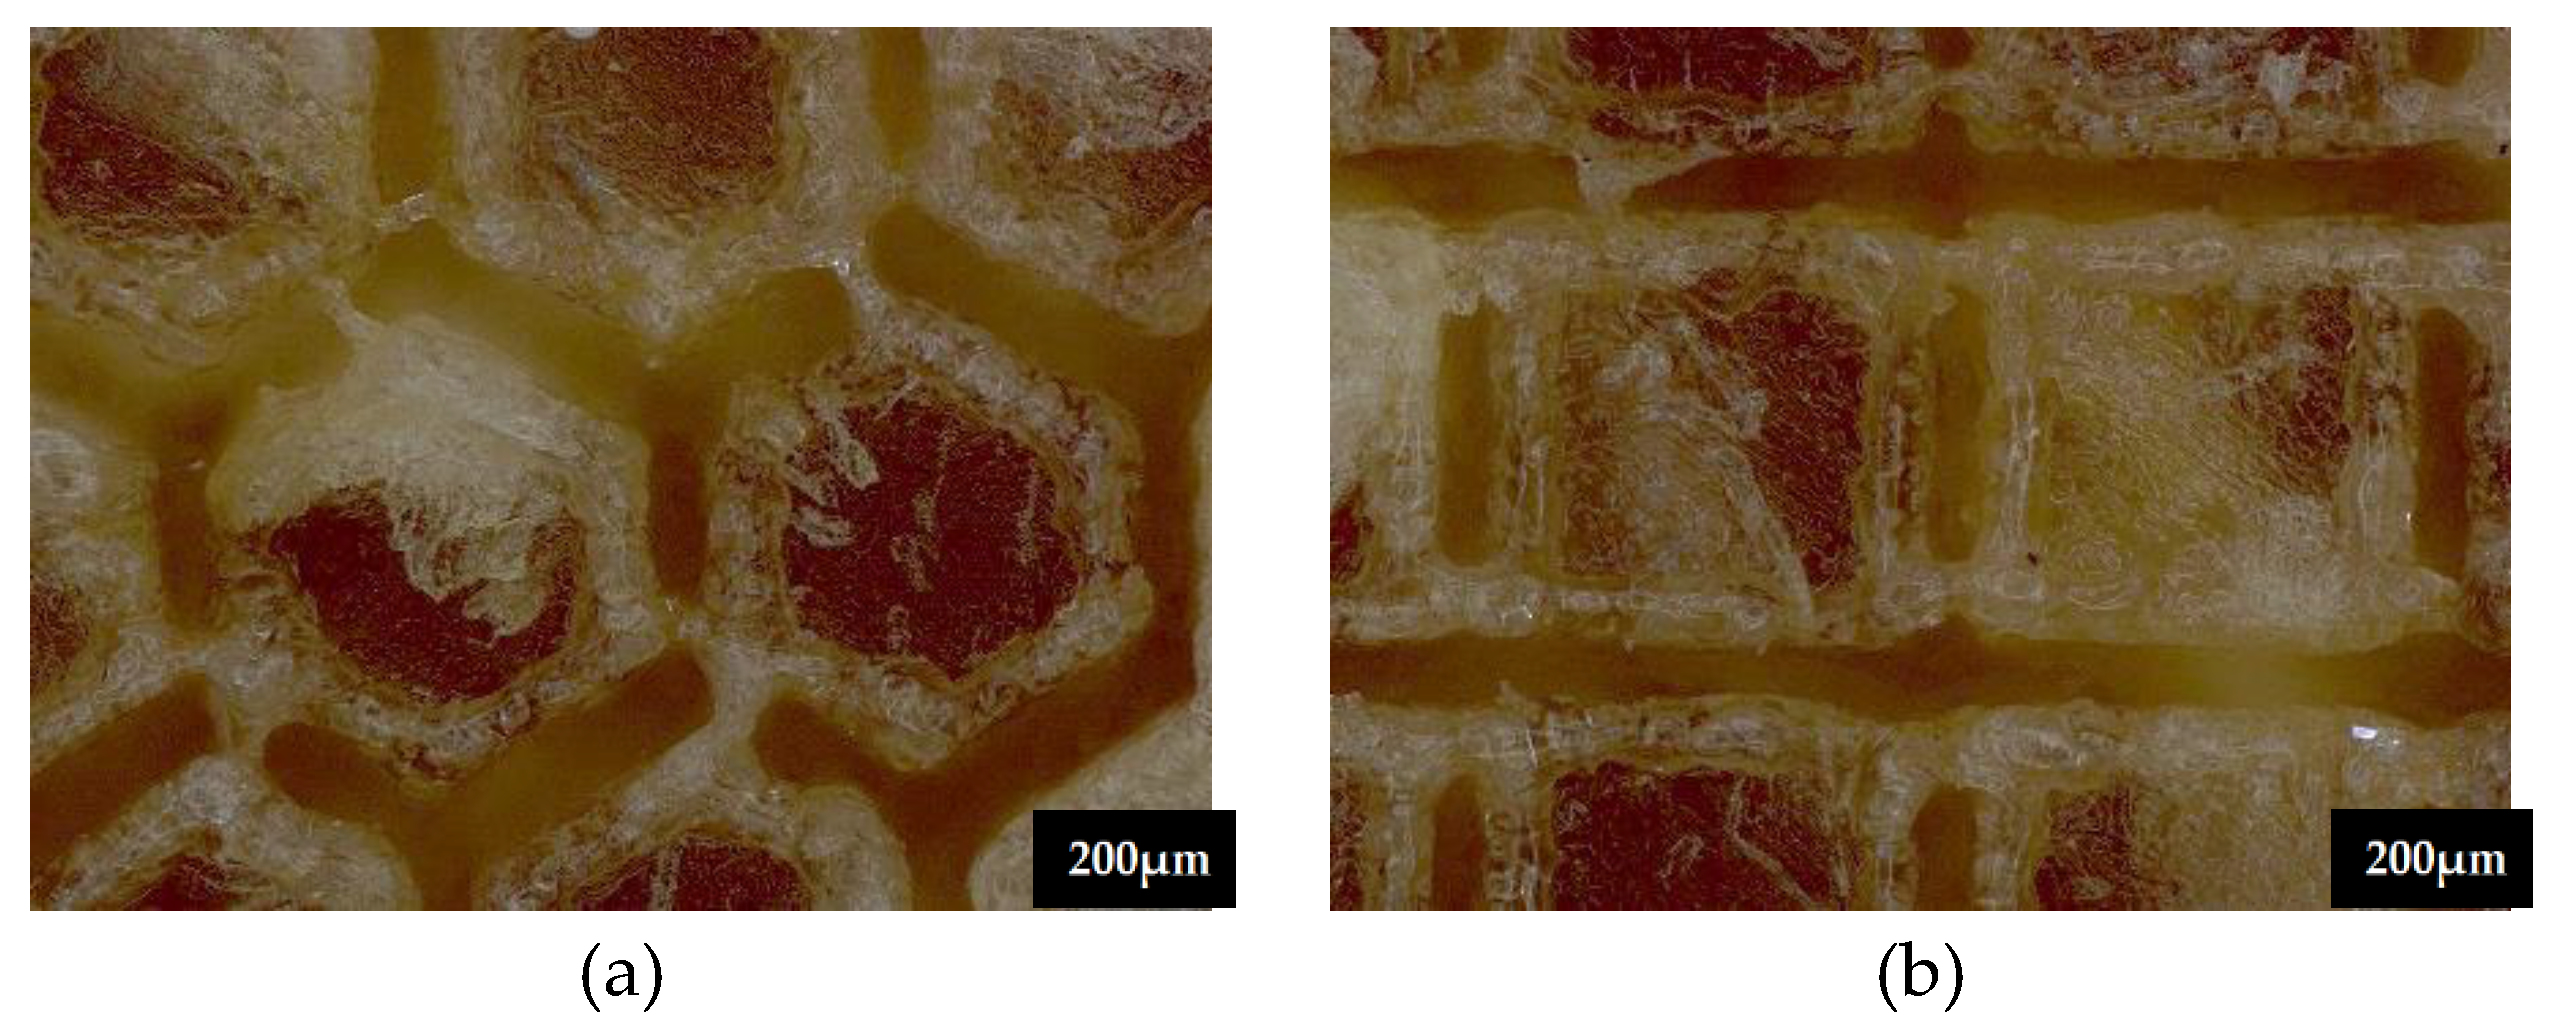
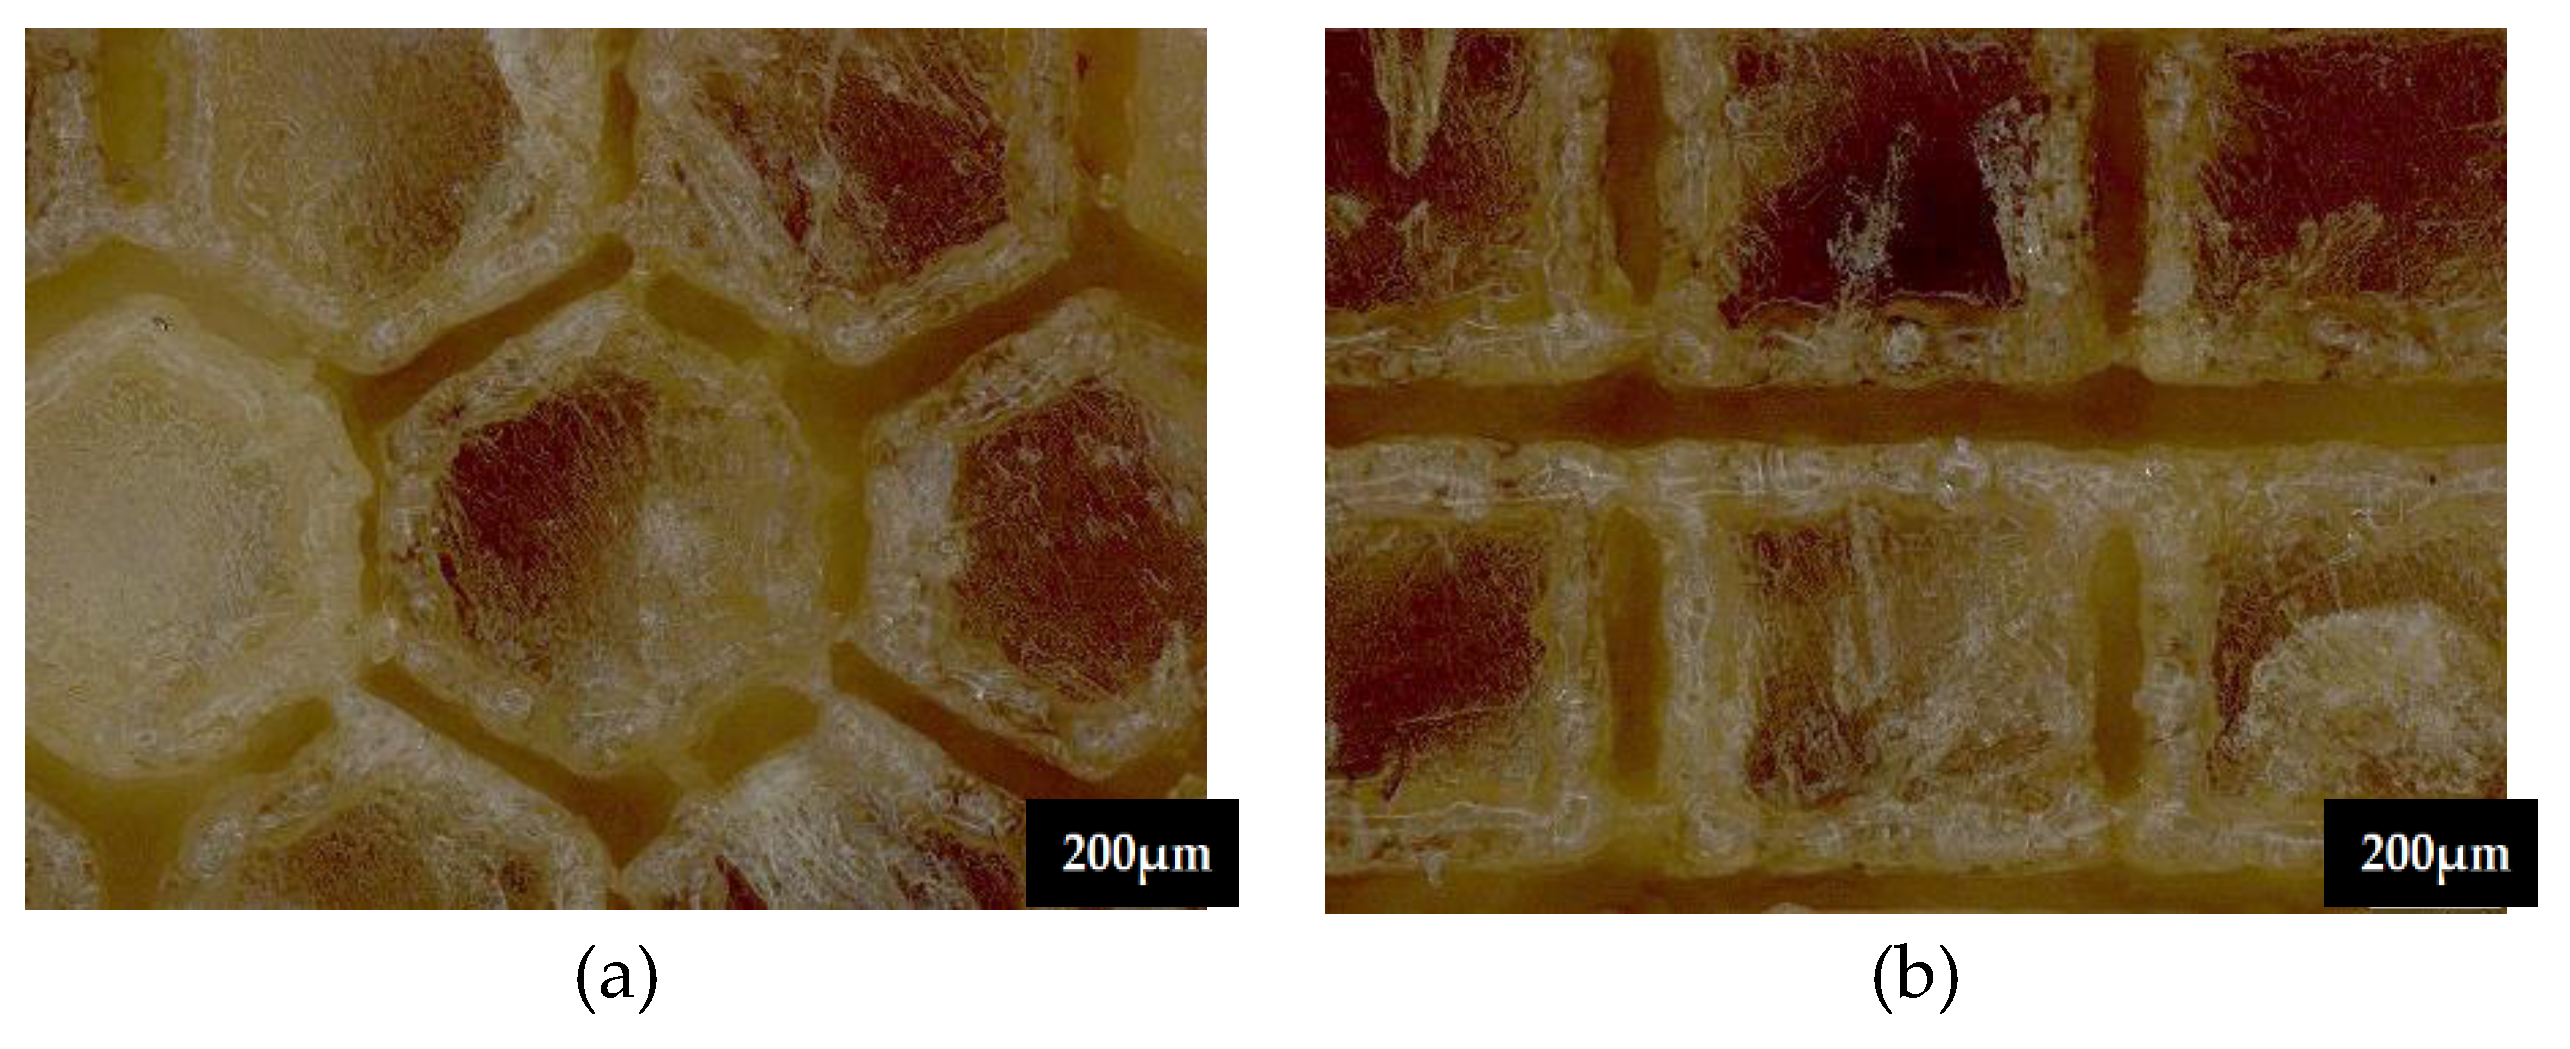
3.1. Microscopic Observation
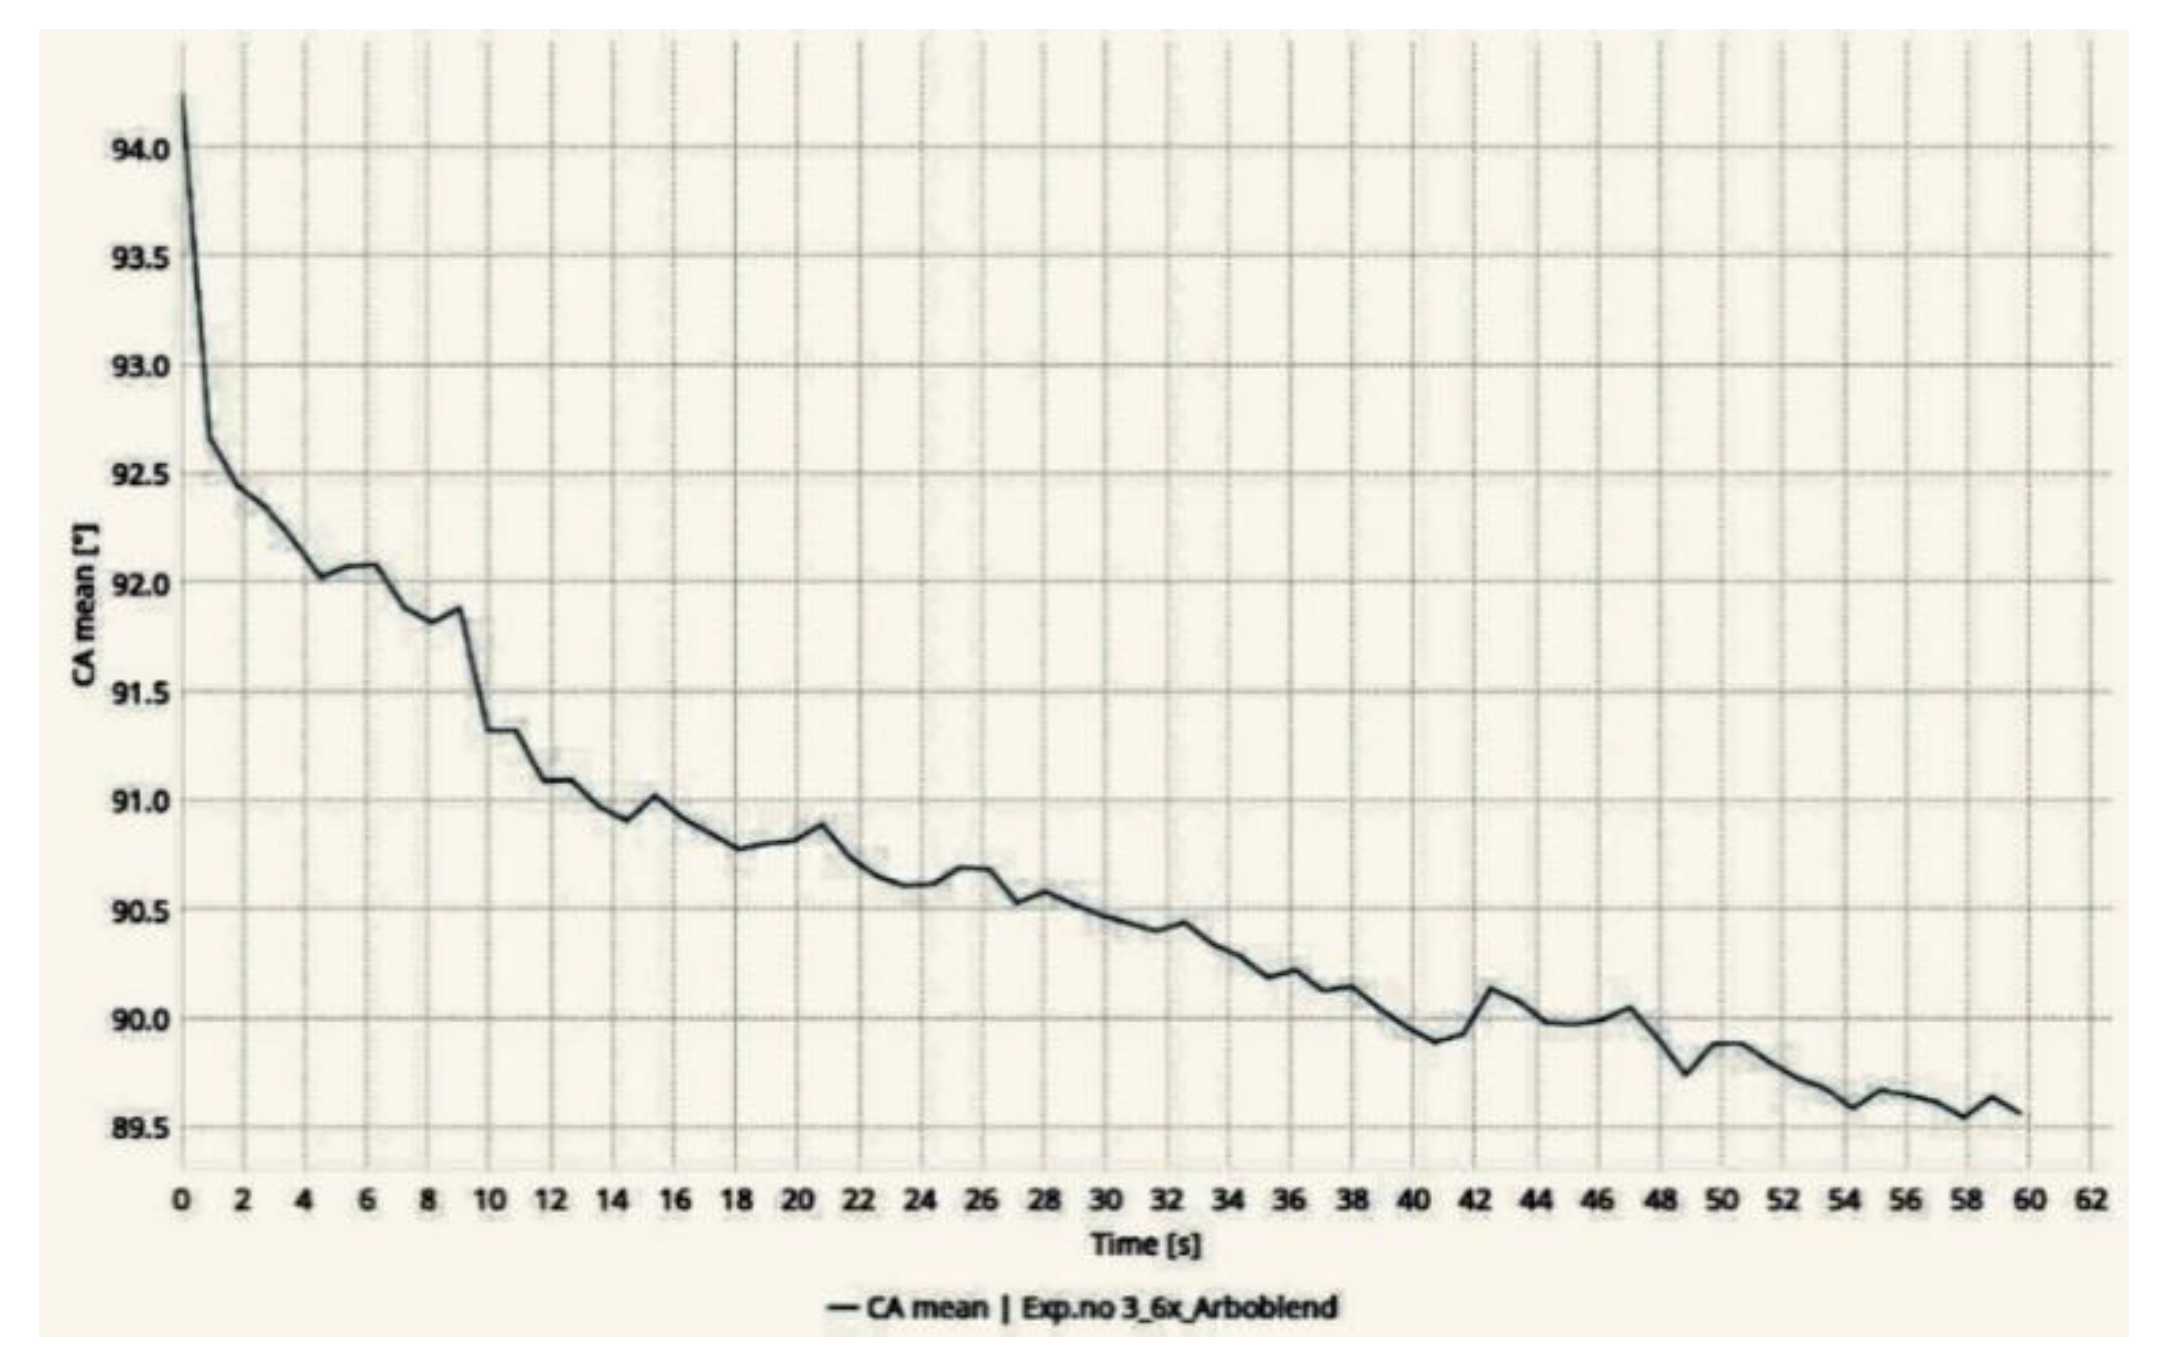
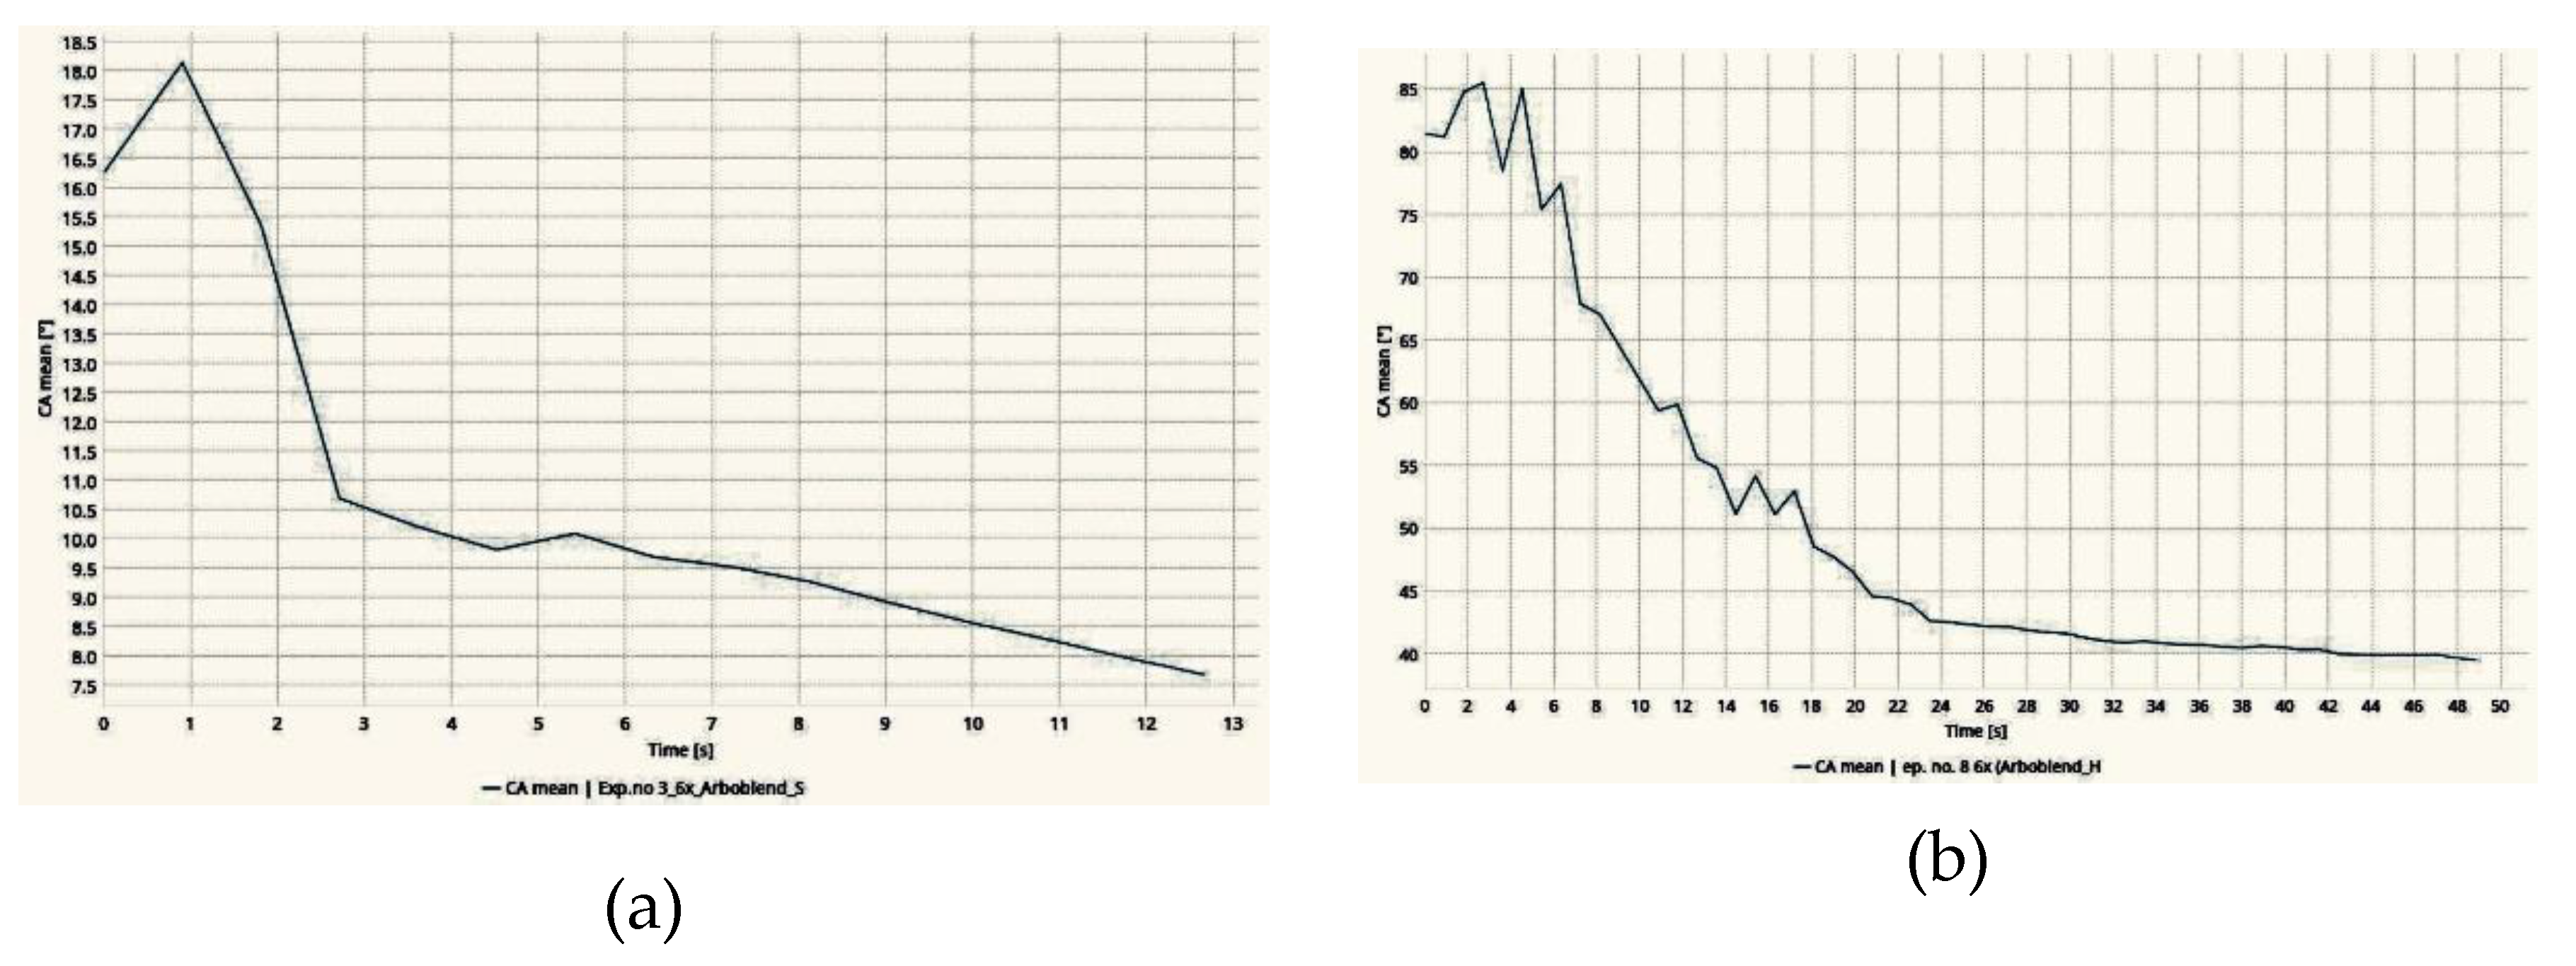
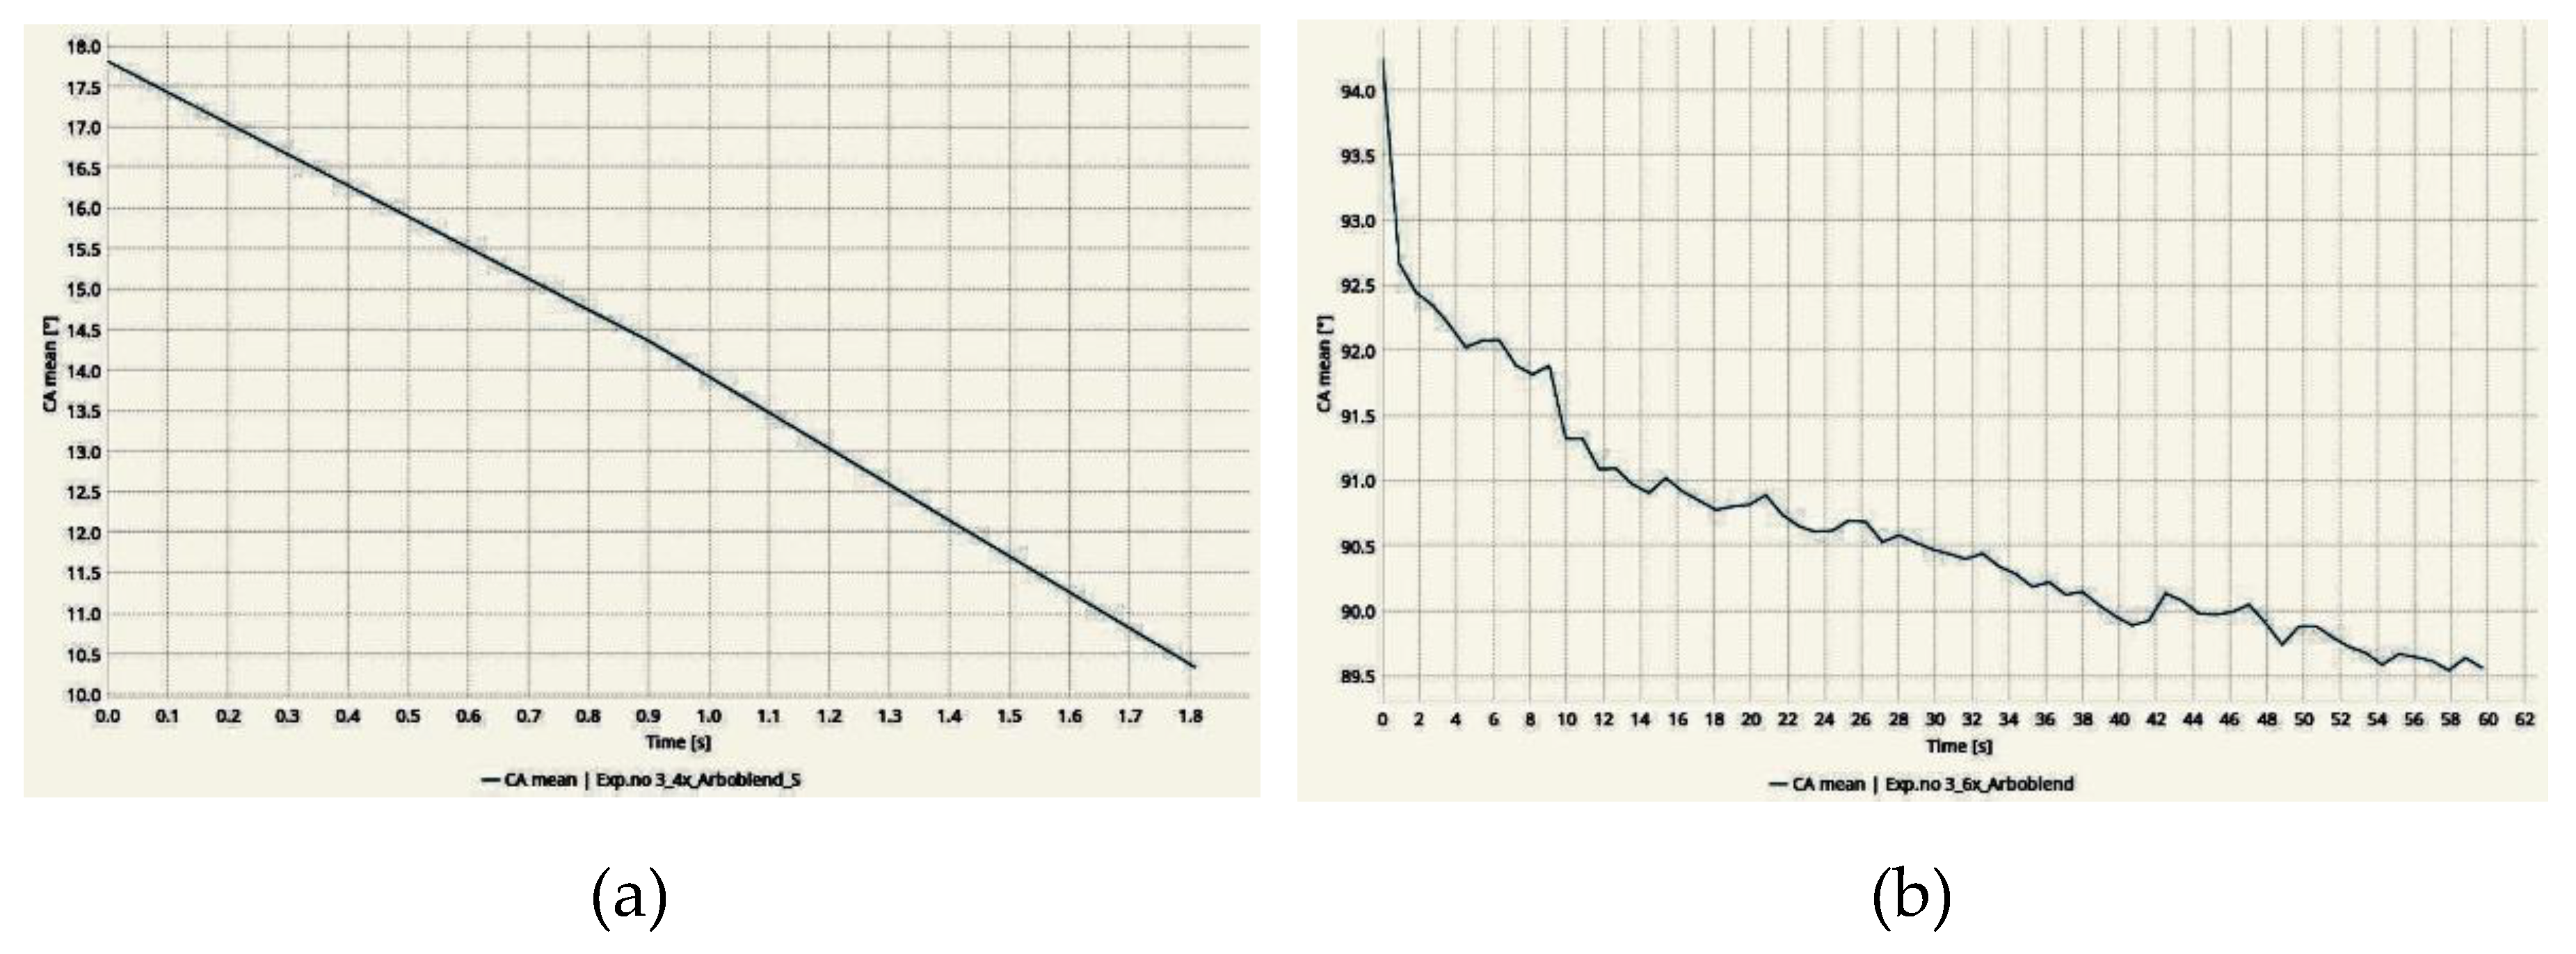
3.2. Wettability Test
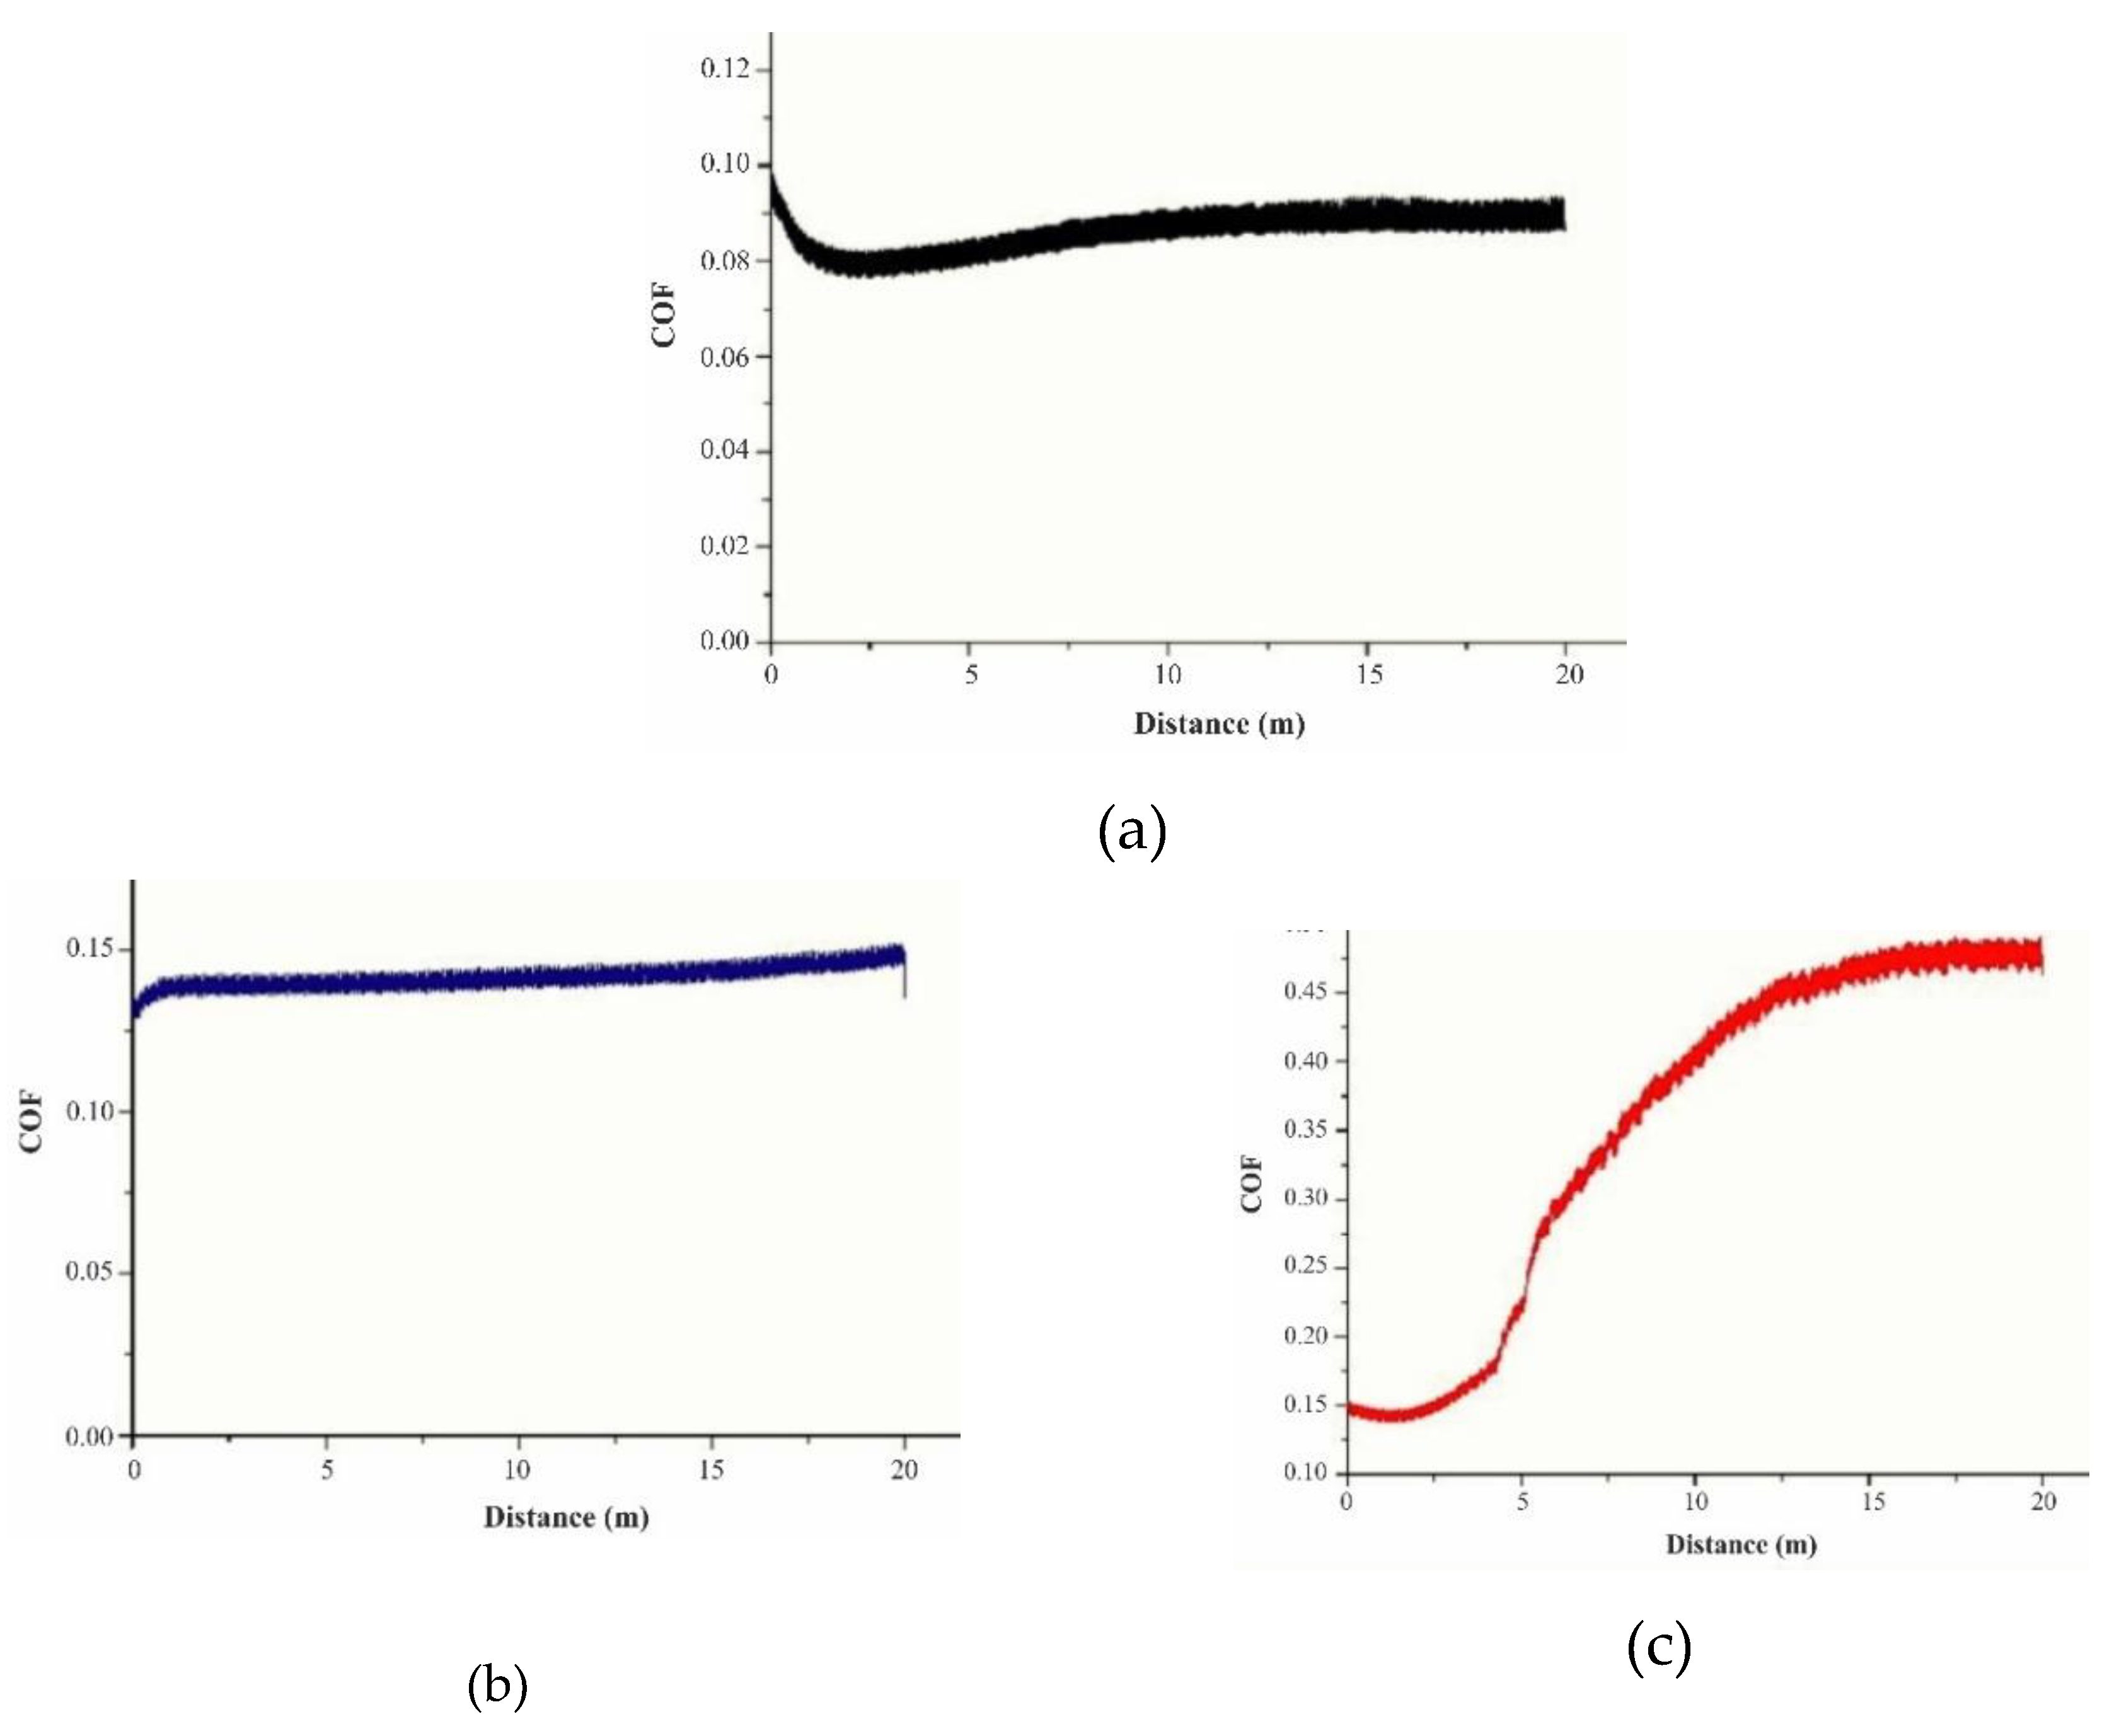
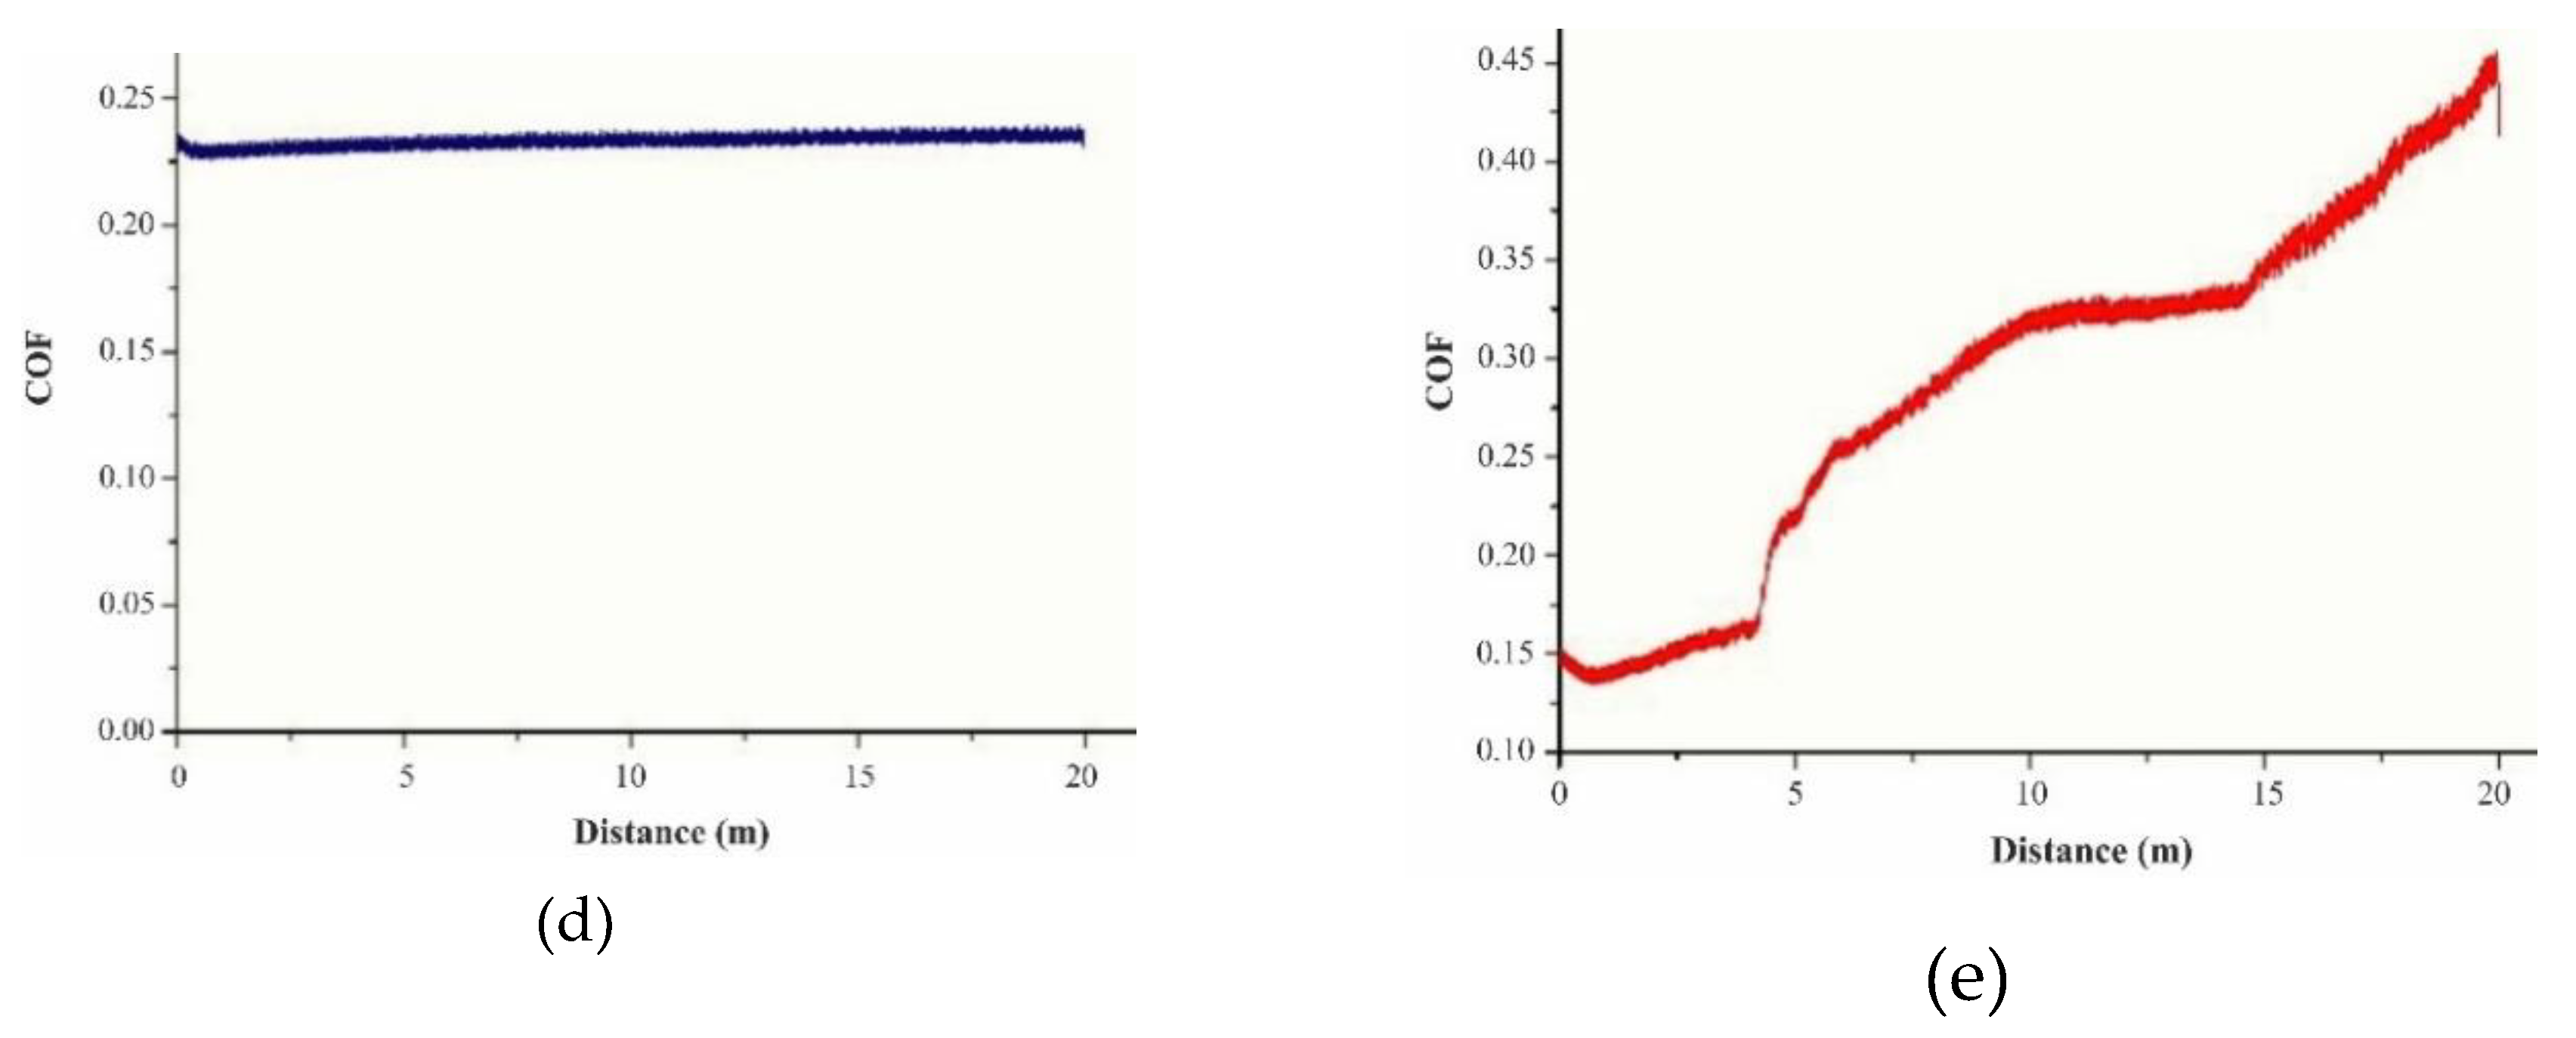
3.3. Wear Test
3.4. Degradation Test
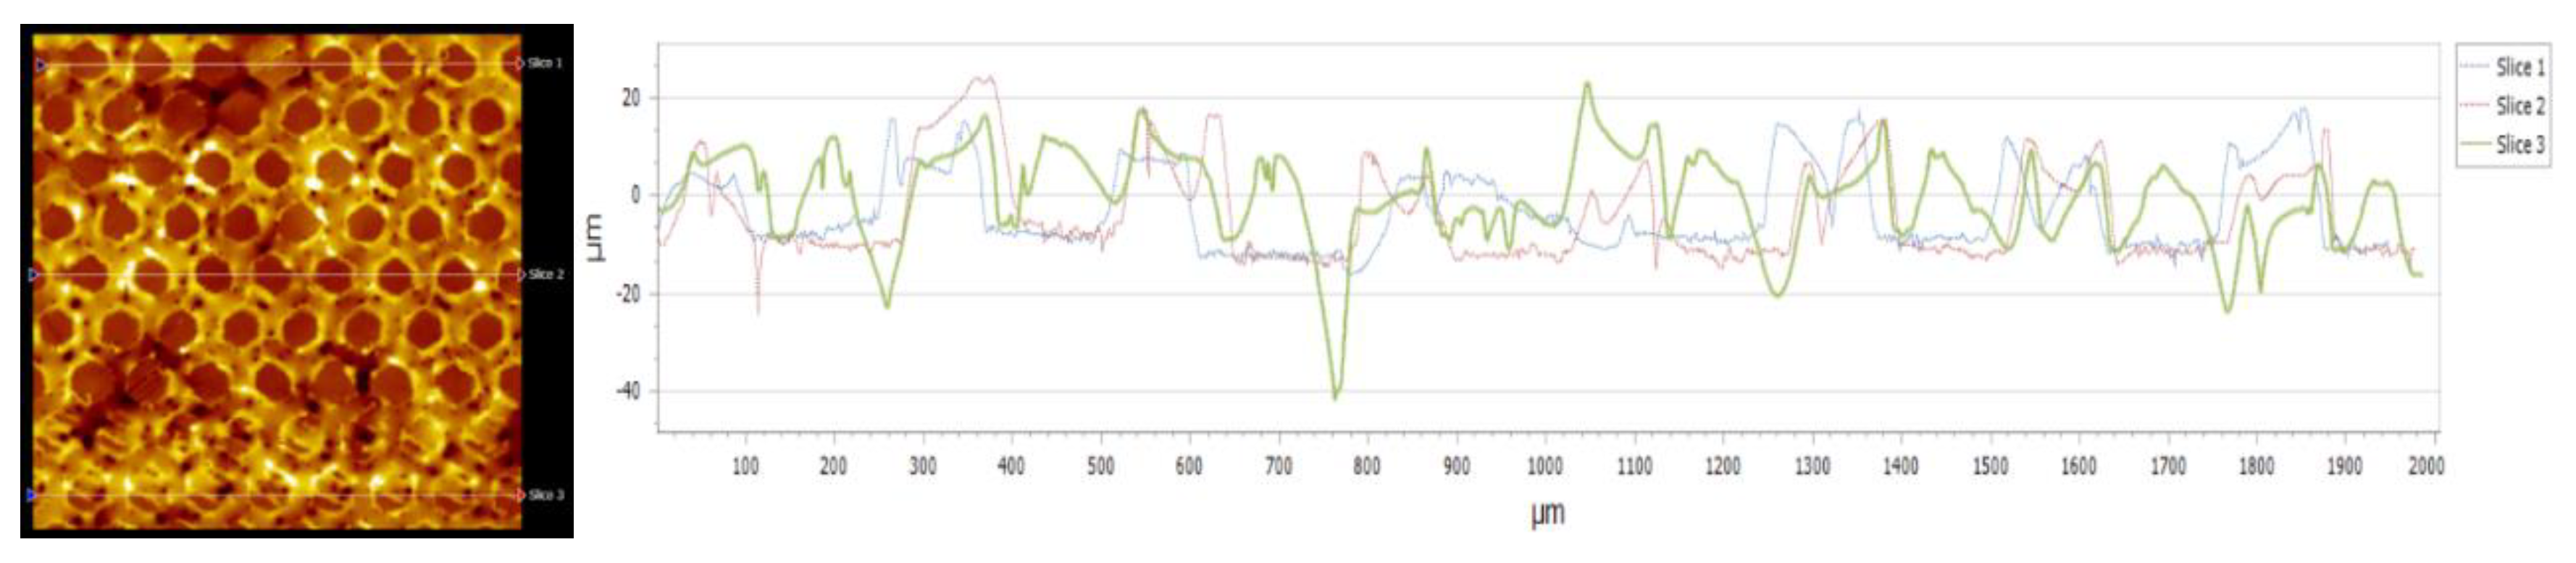
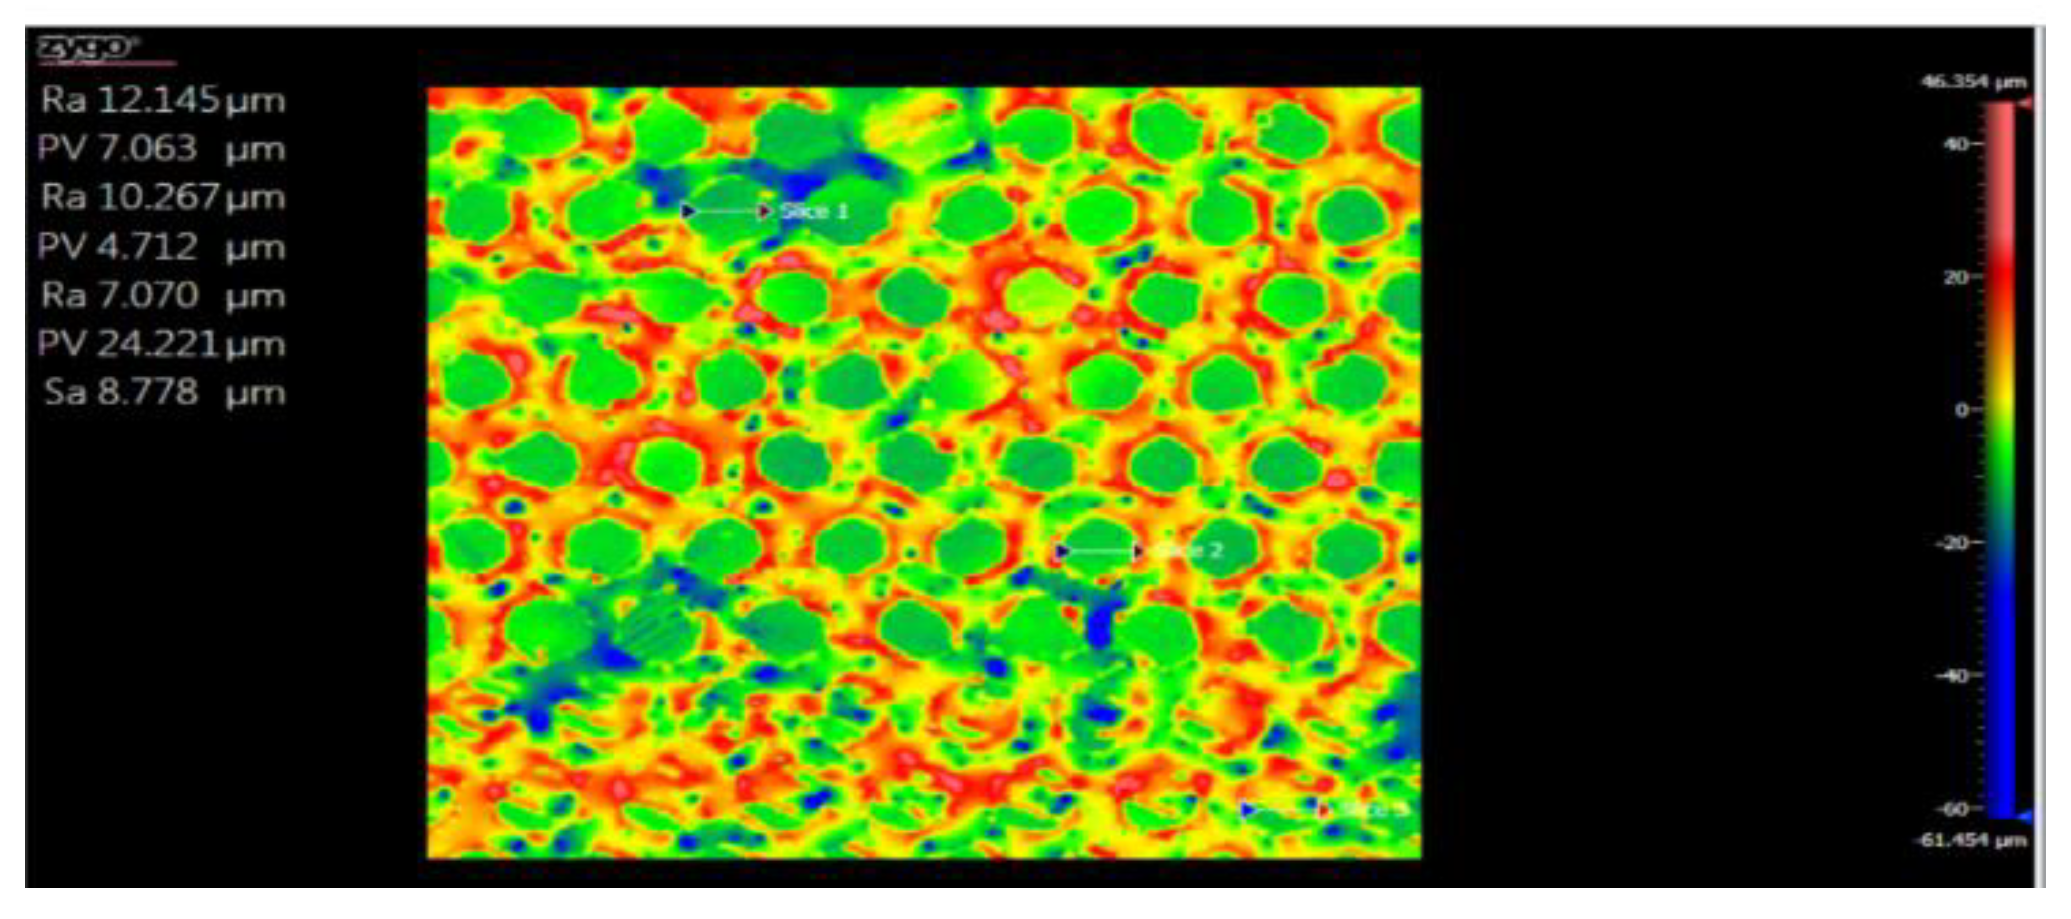
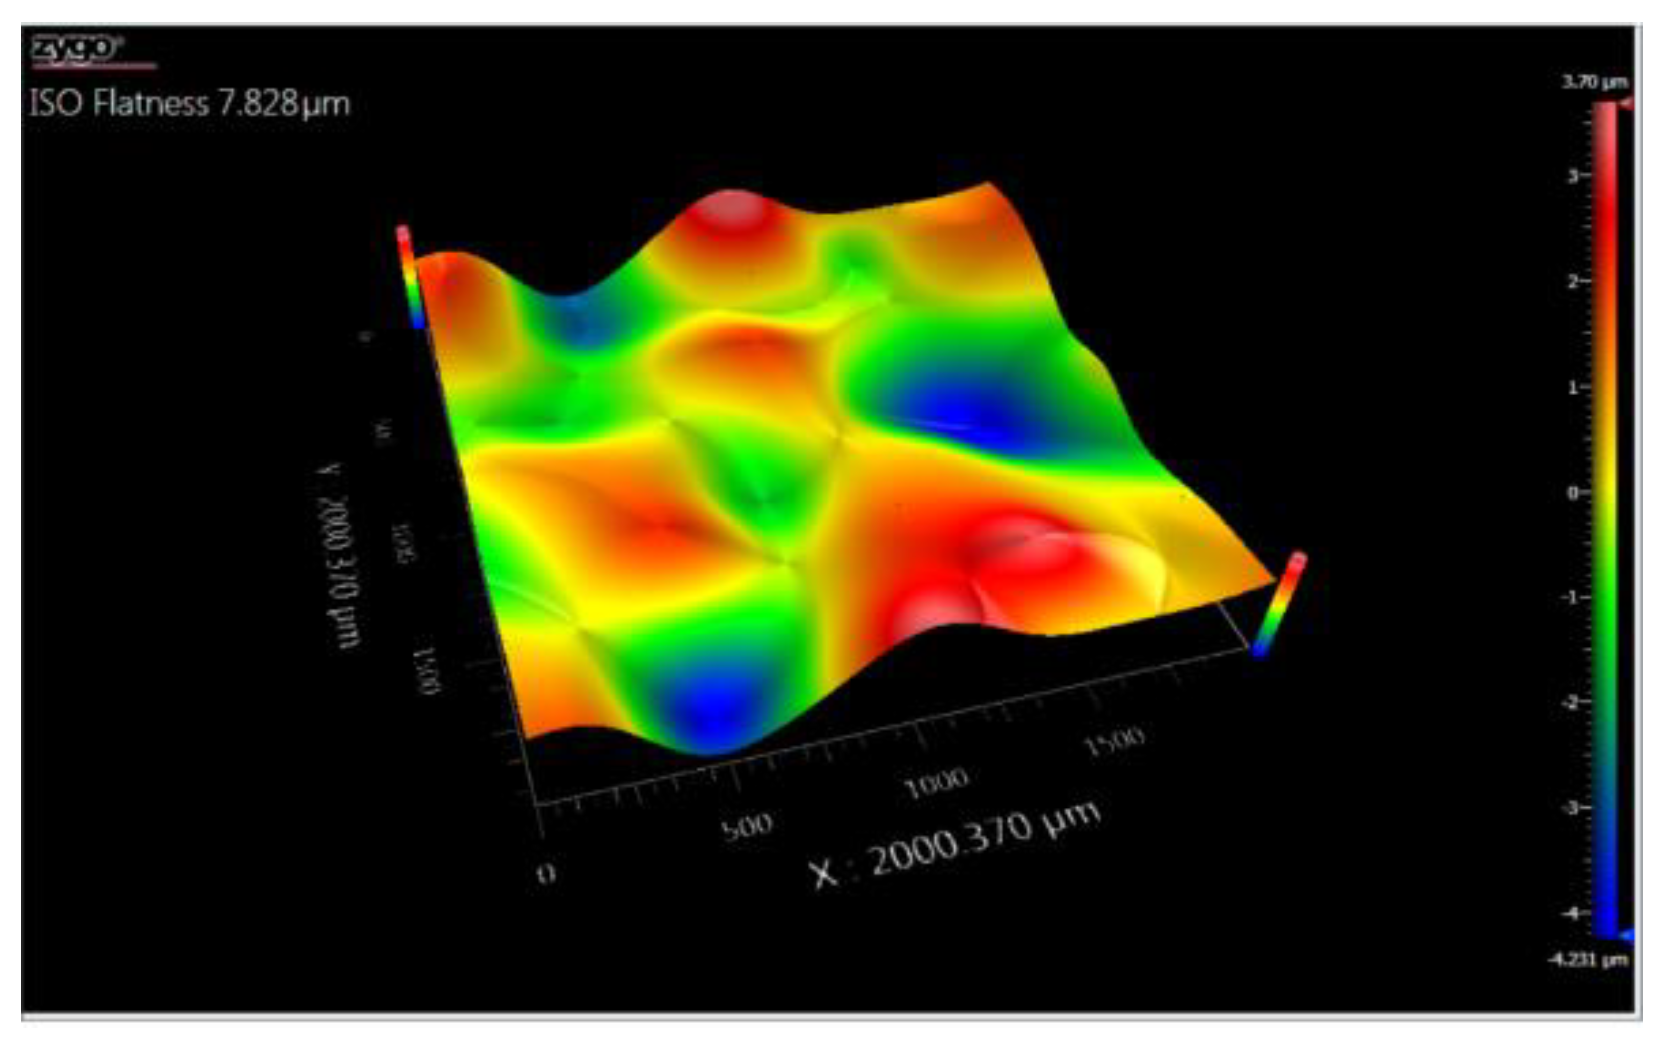
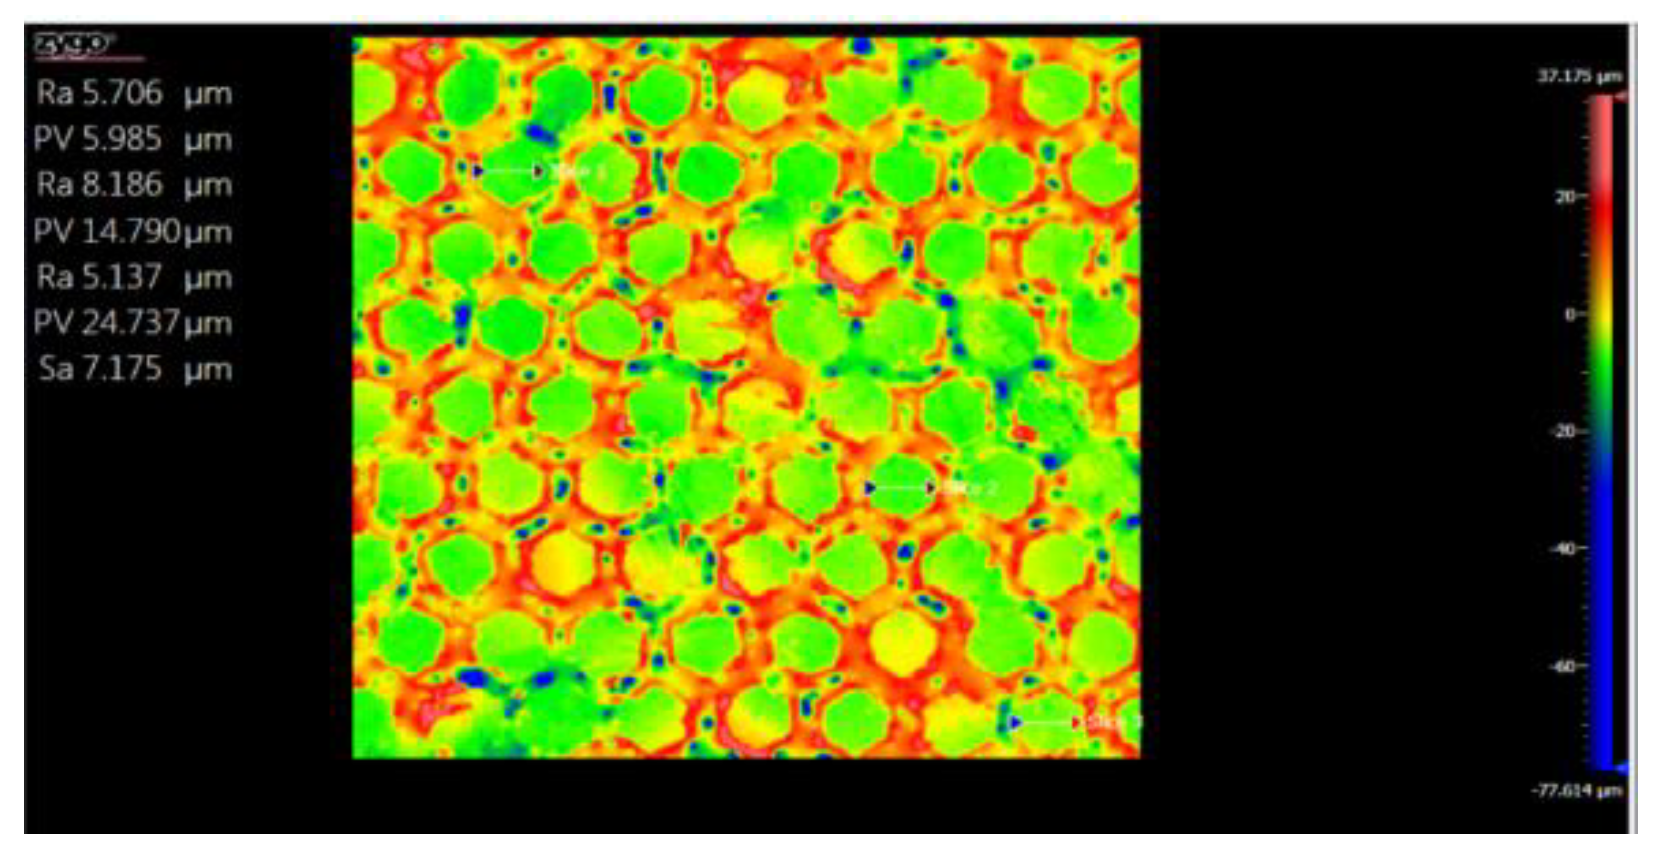
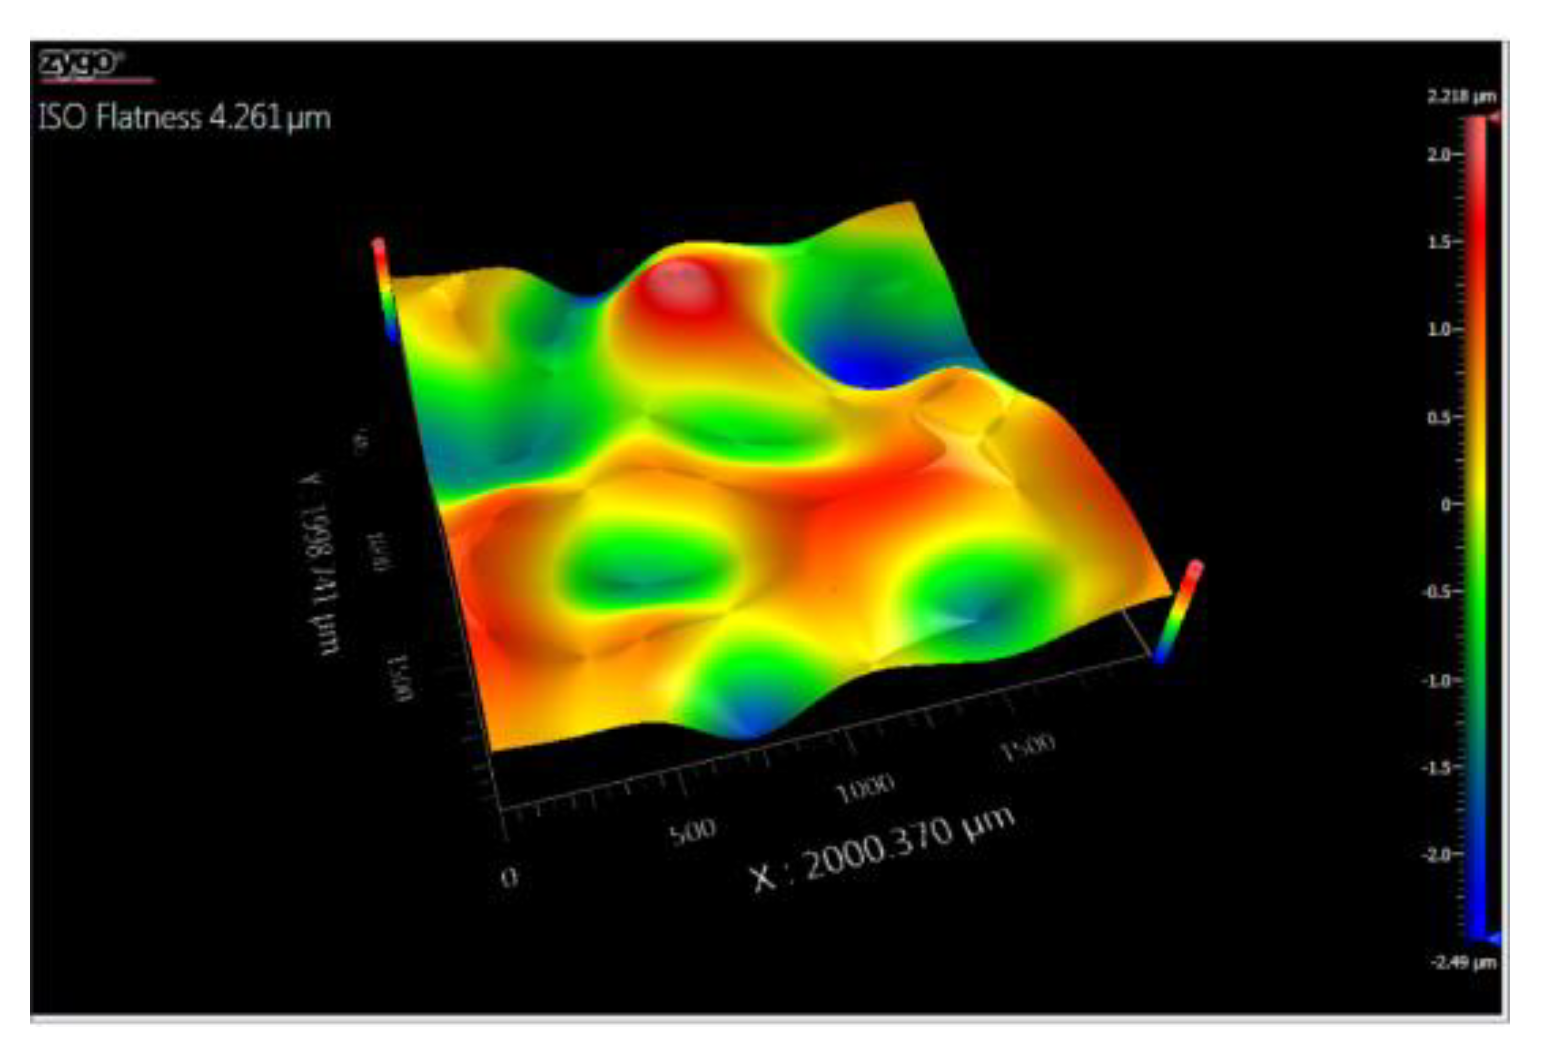
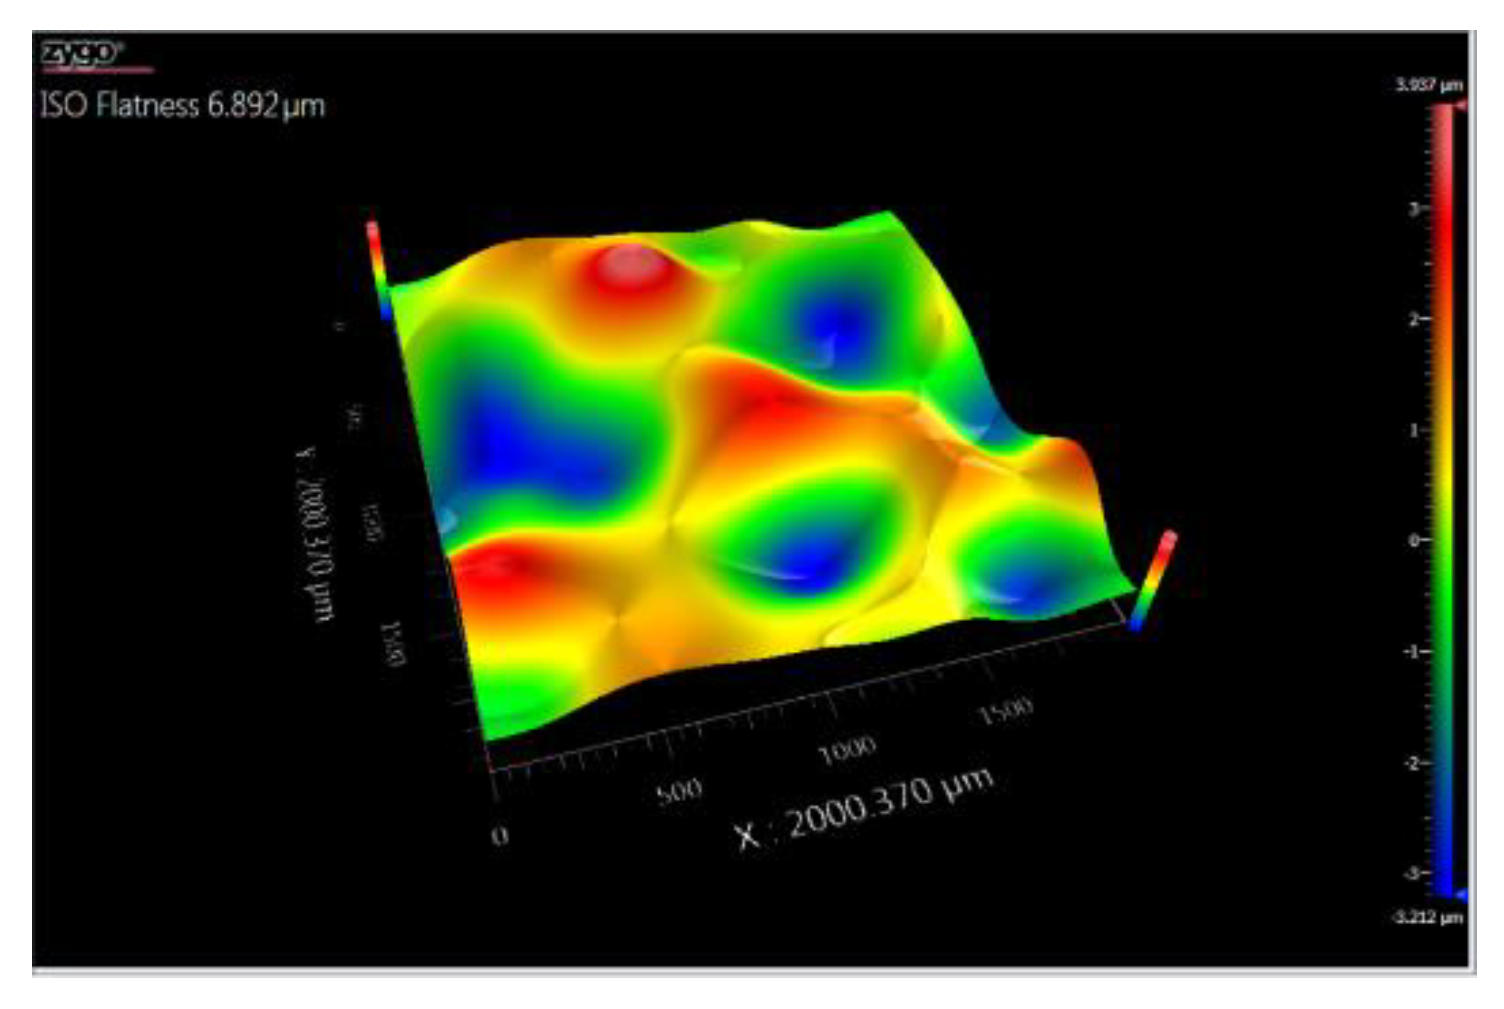
3.5. Topography
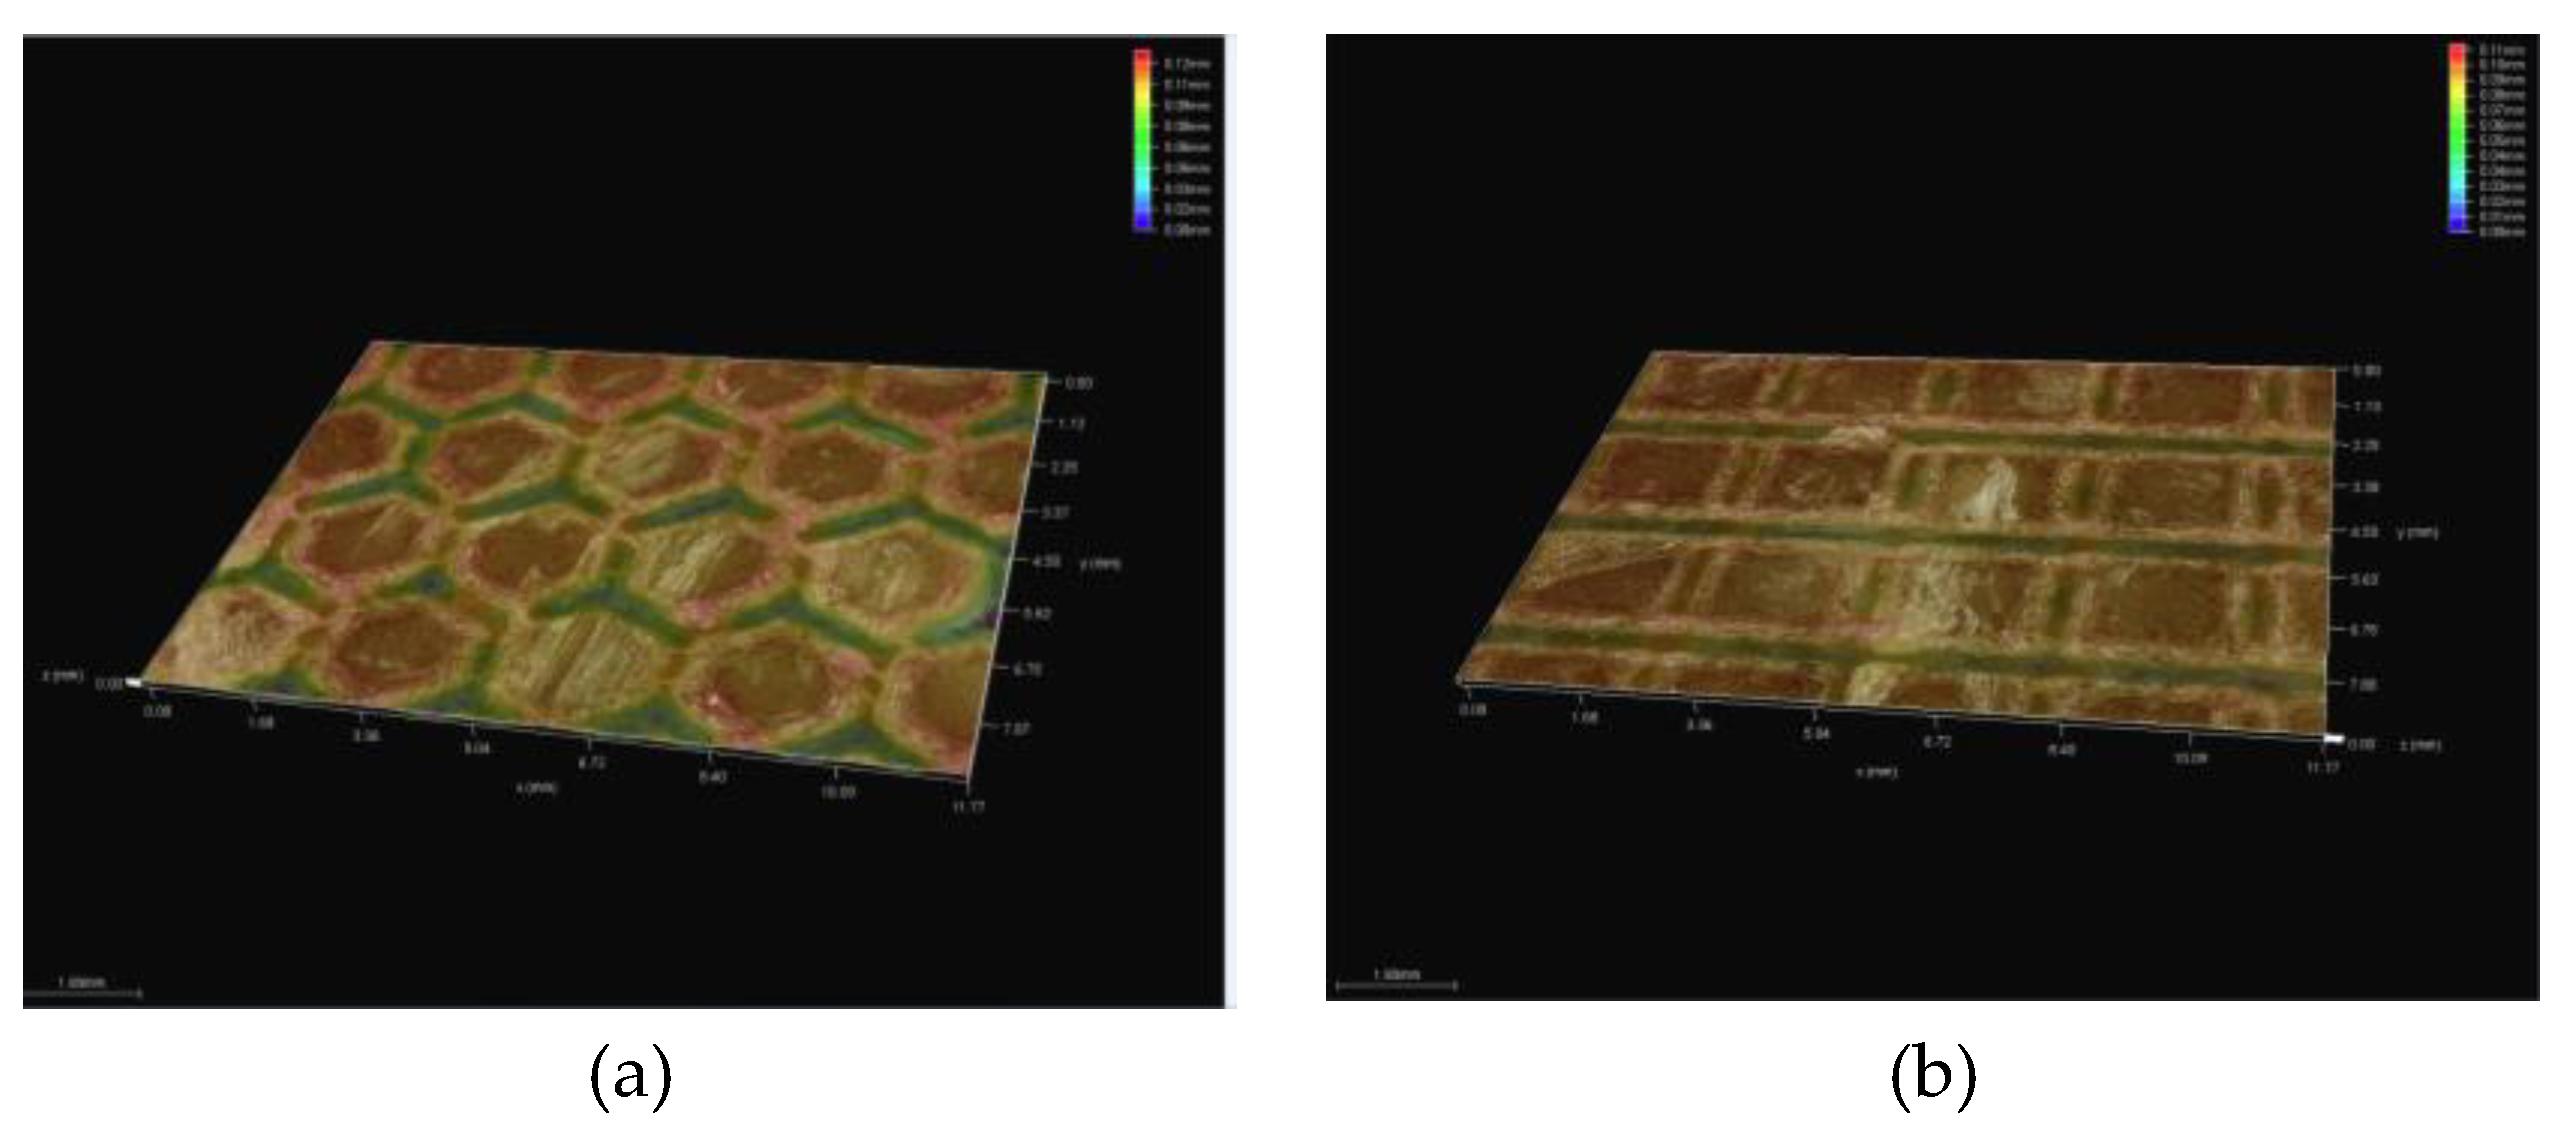
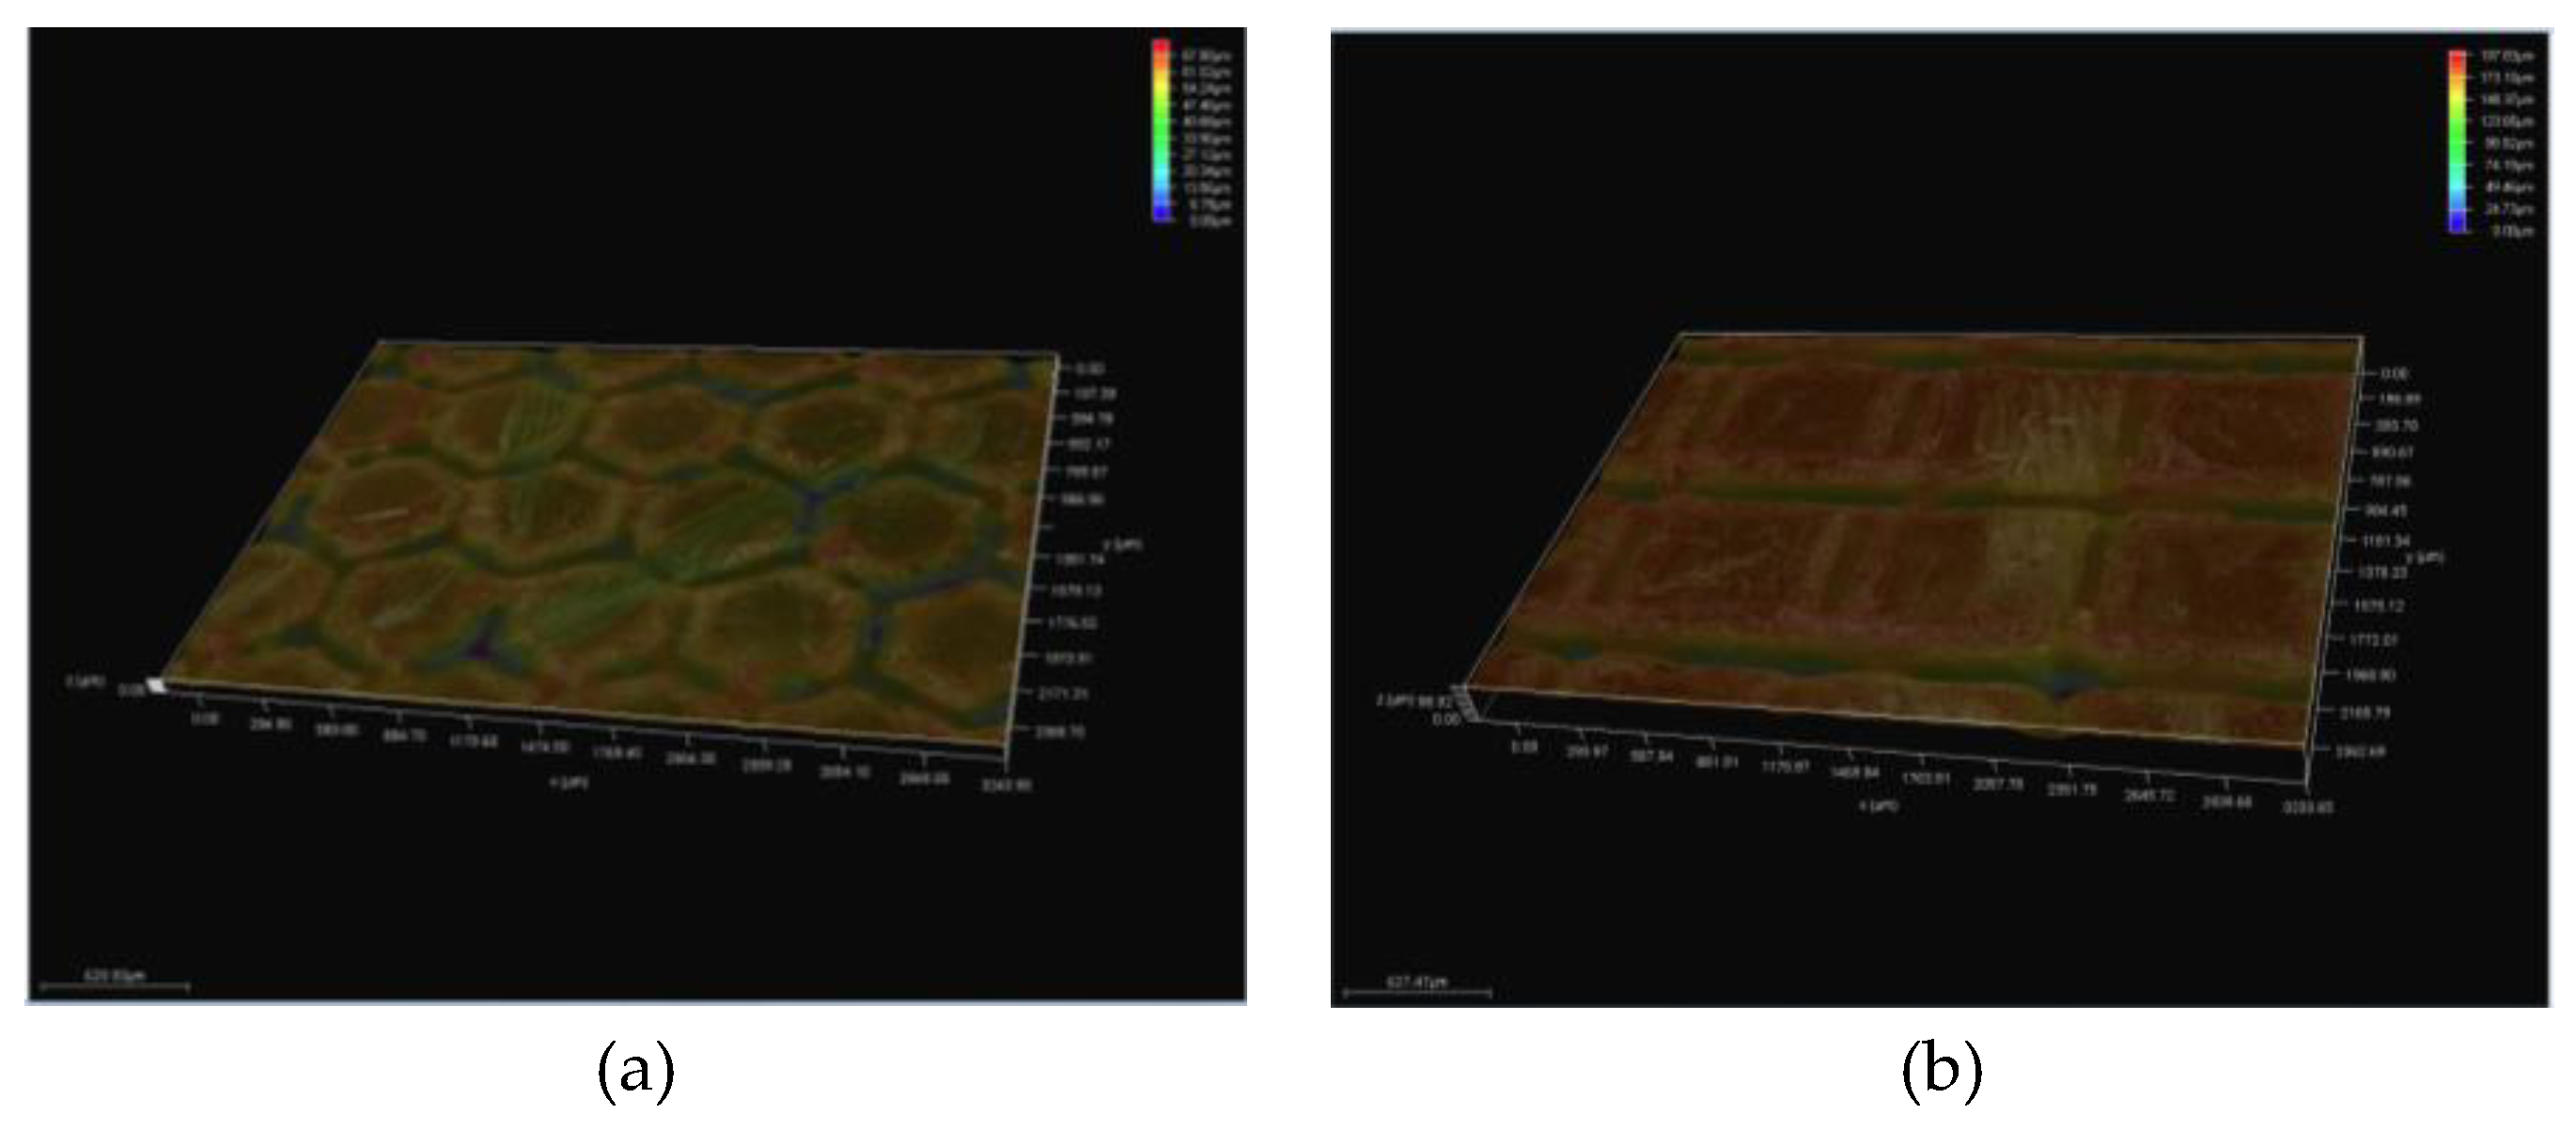
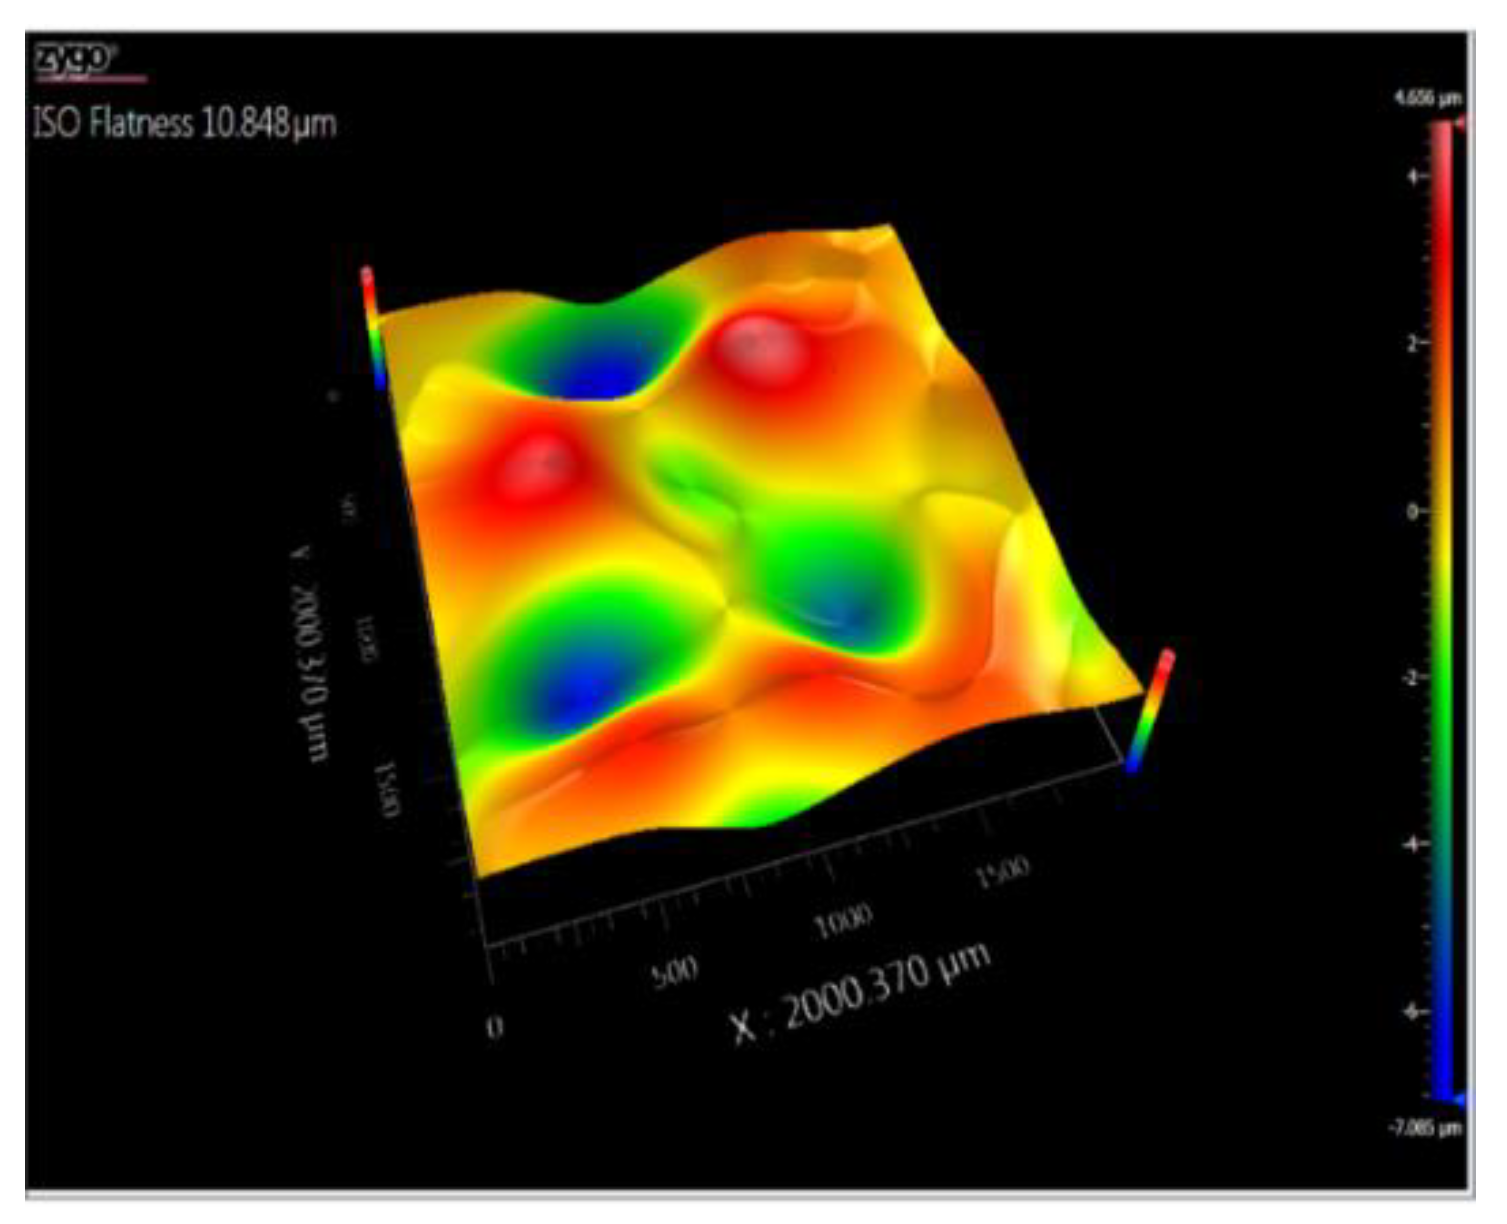
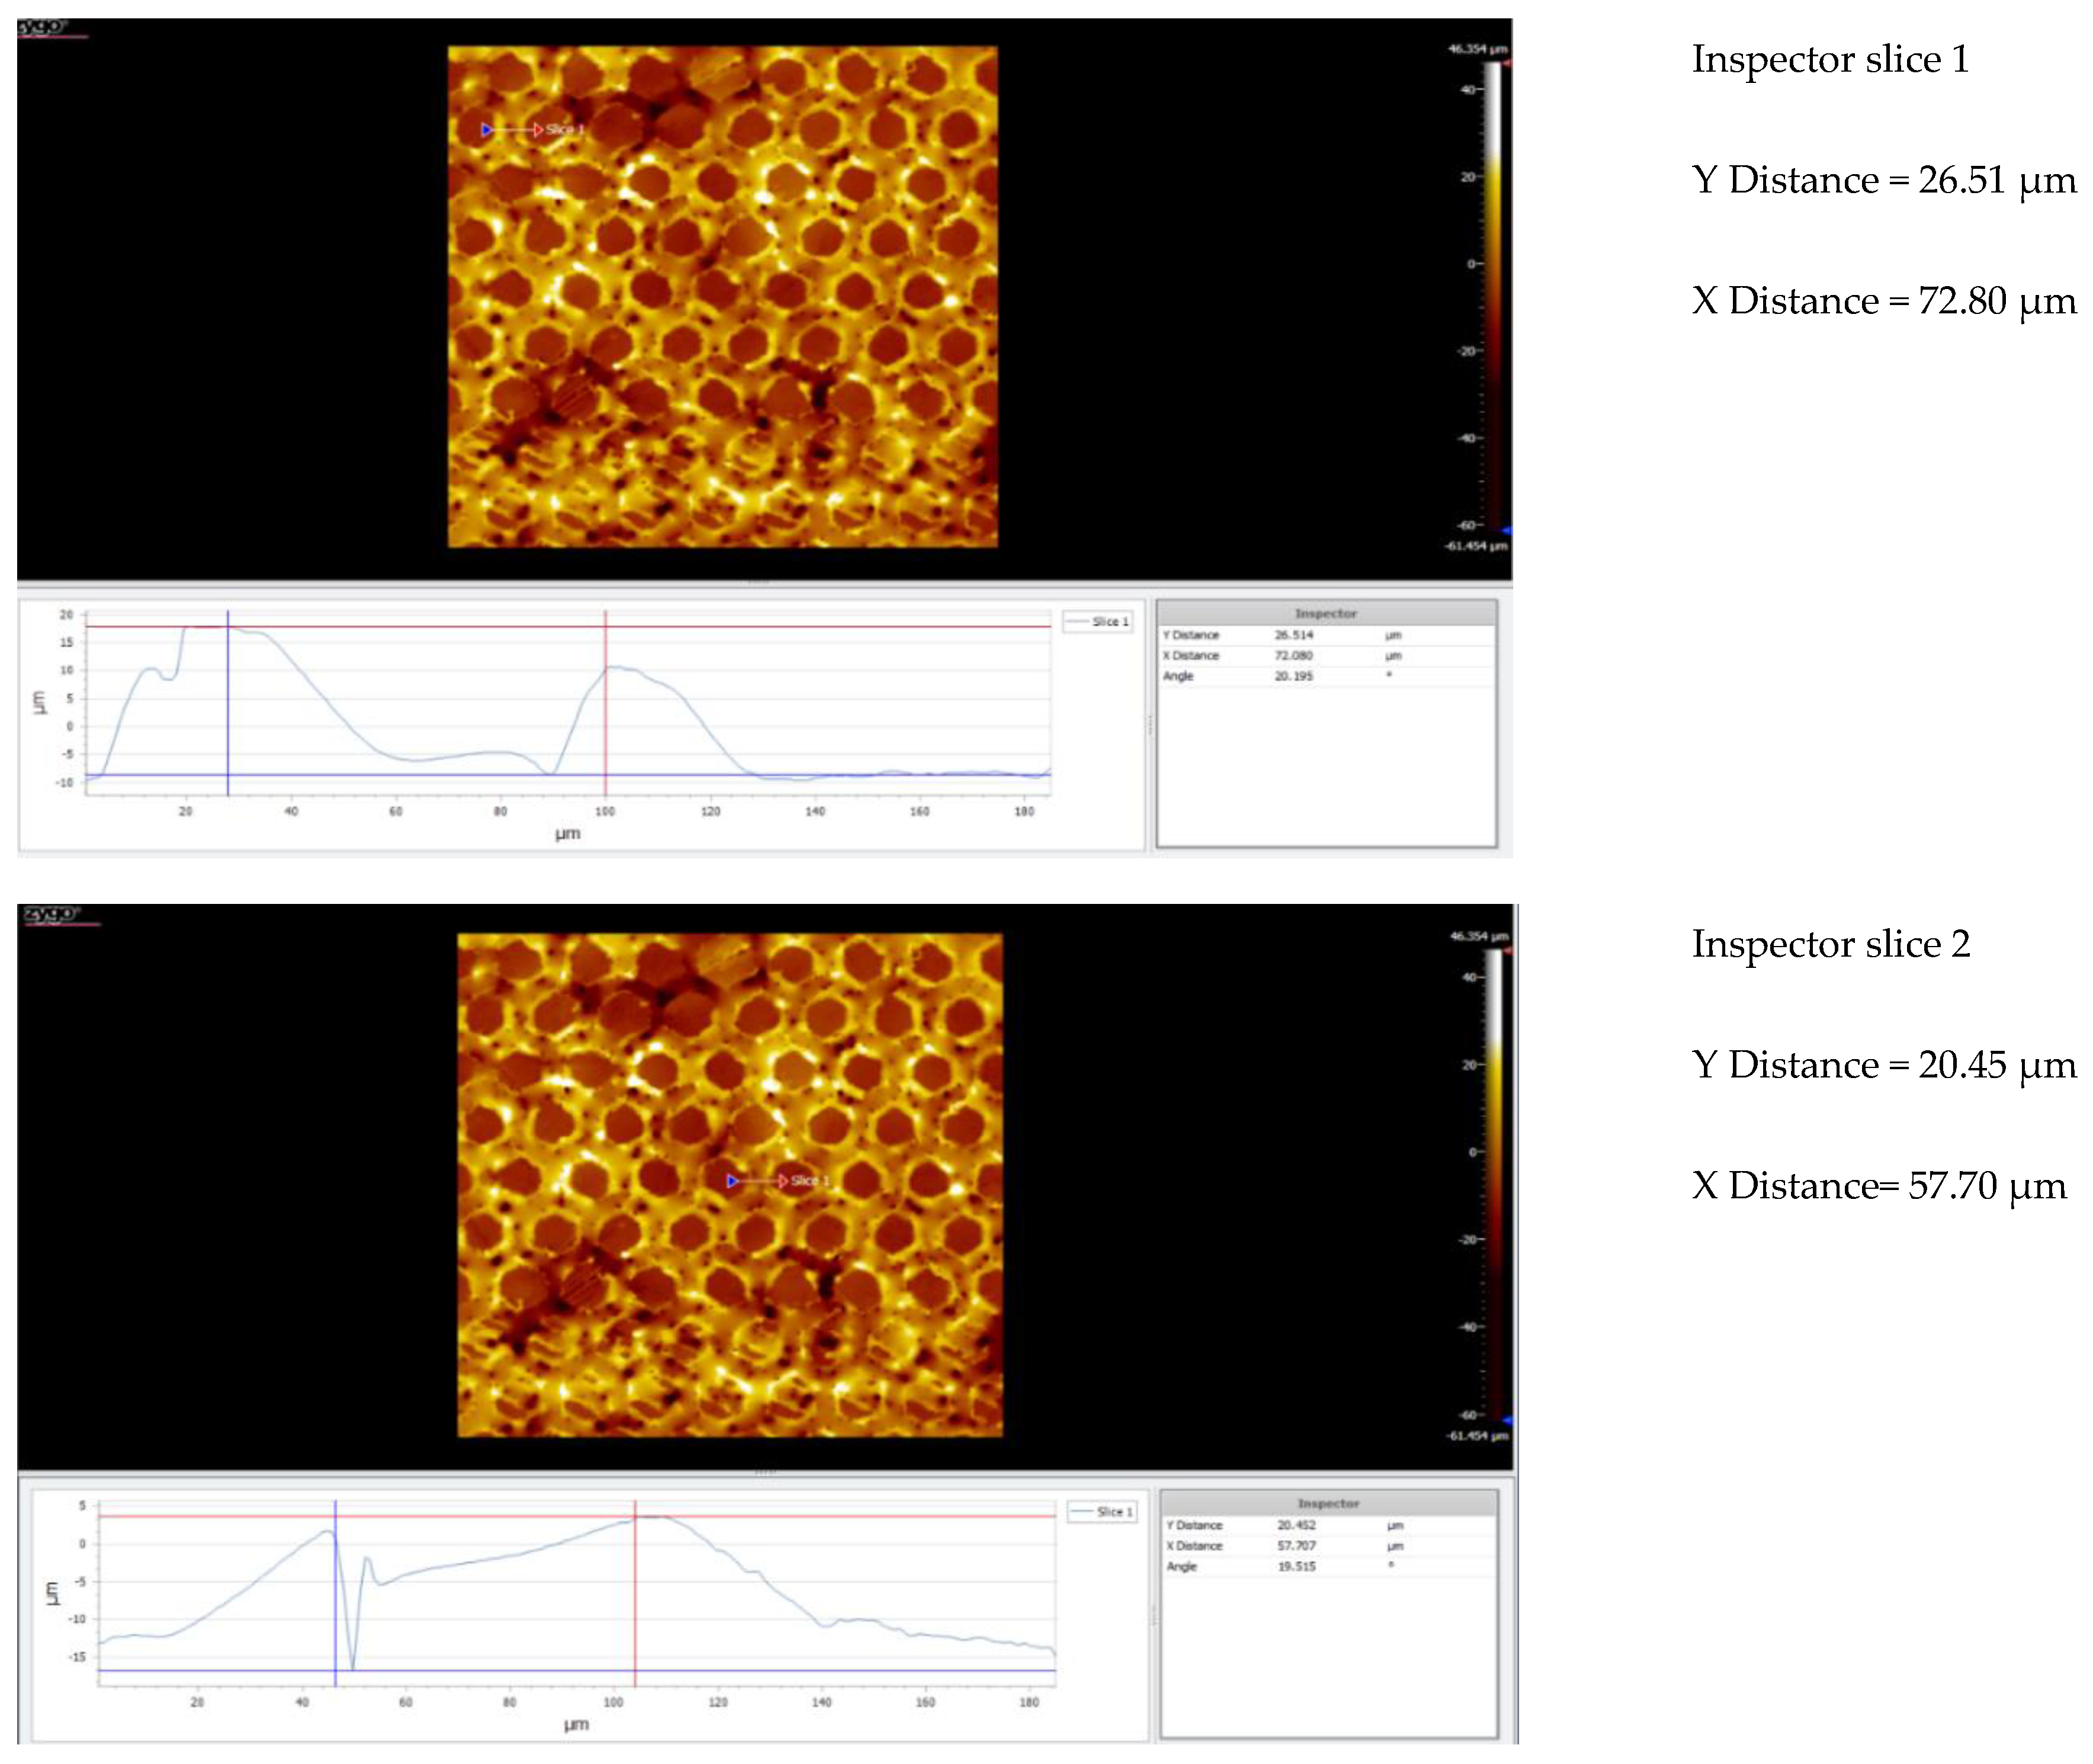
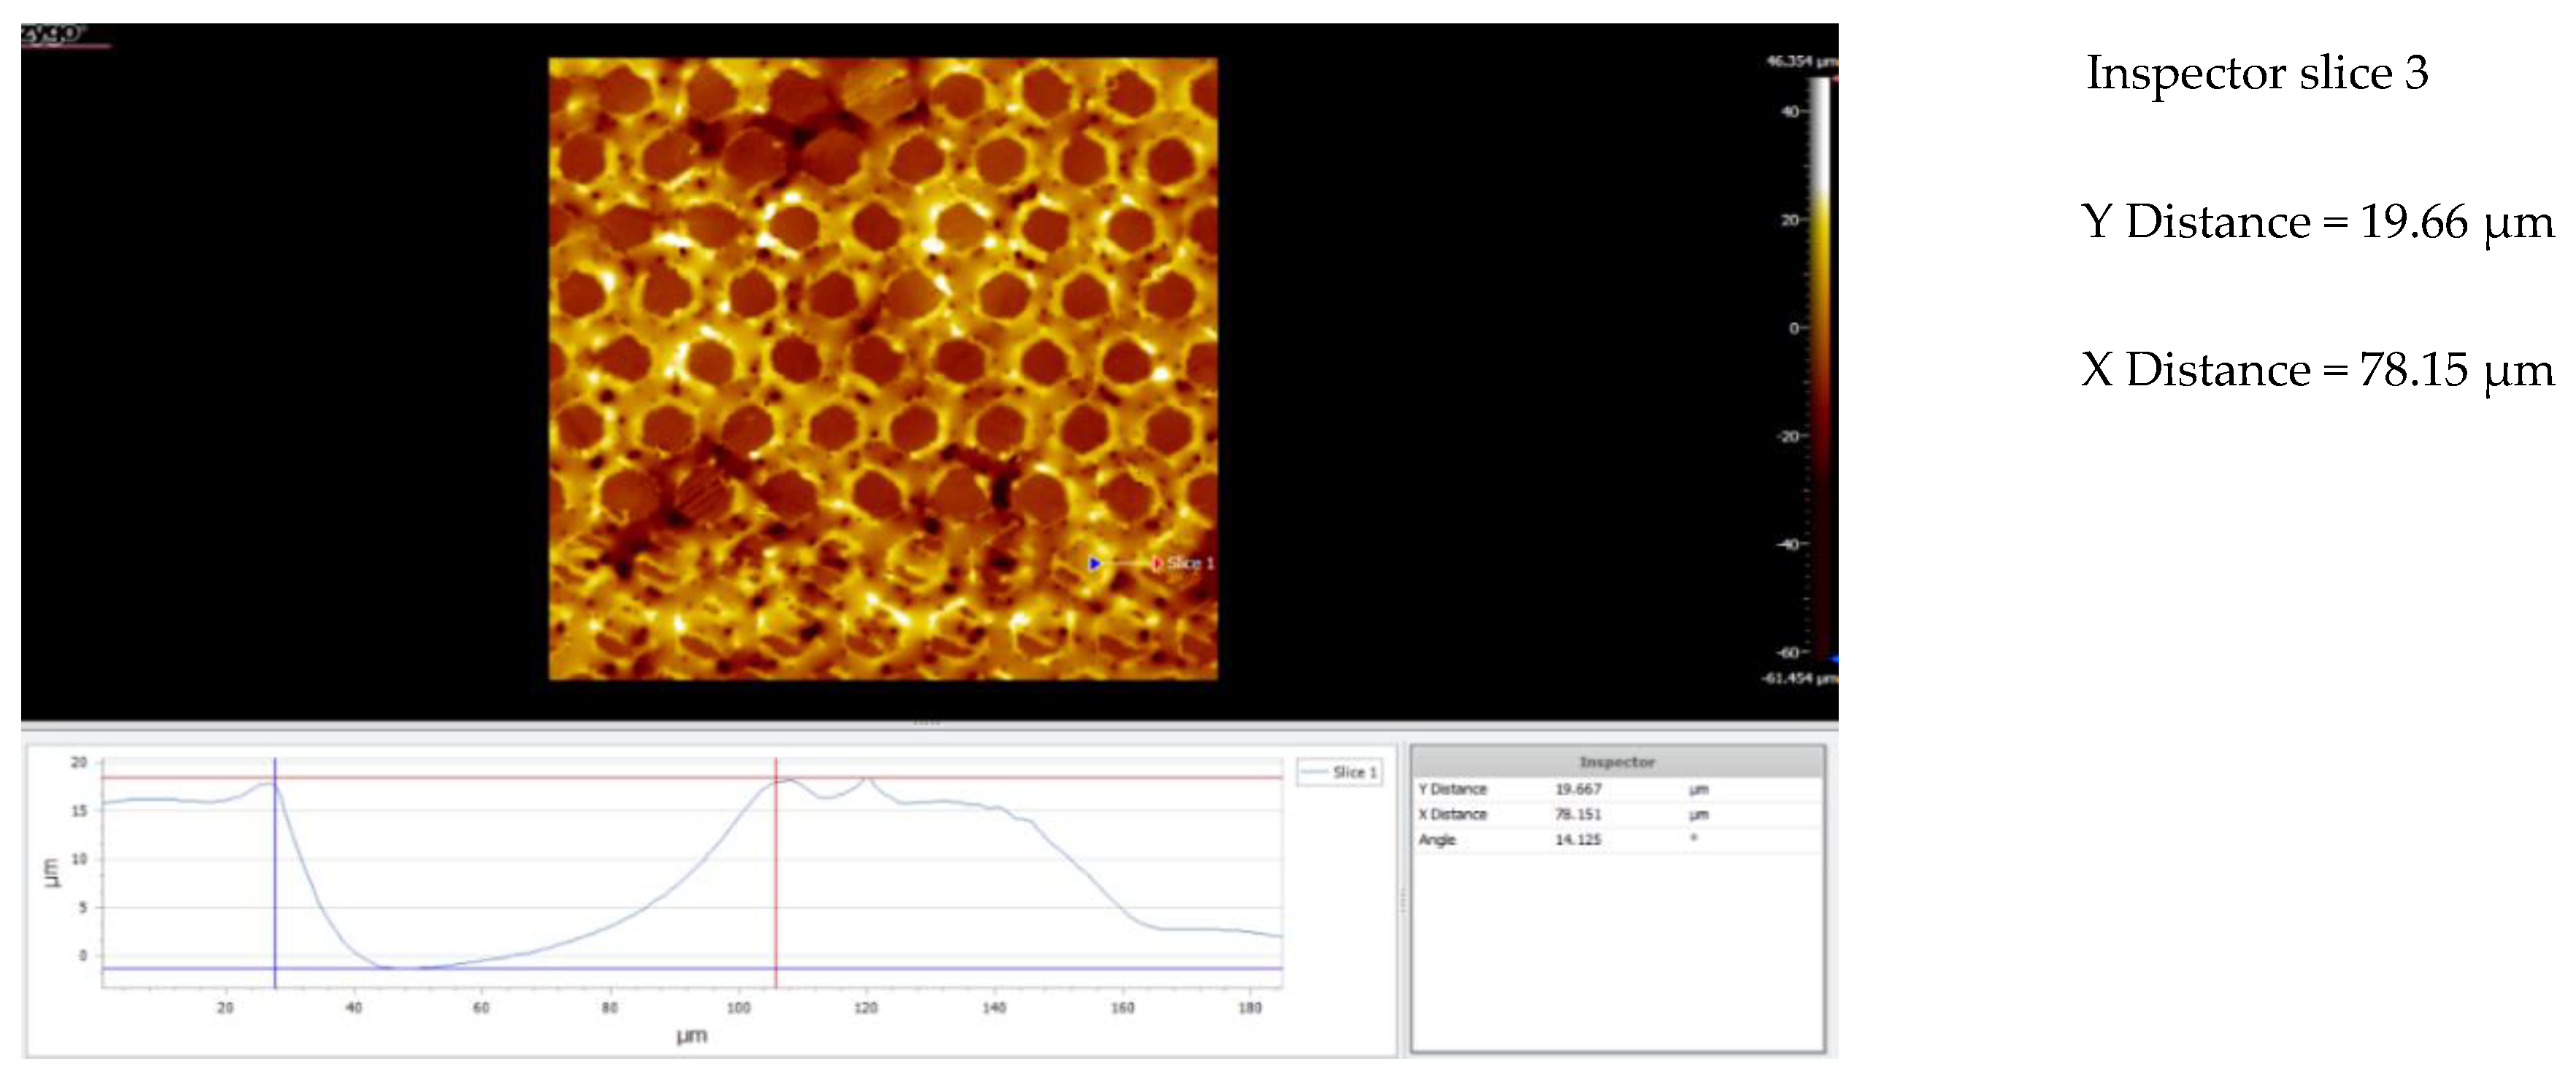
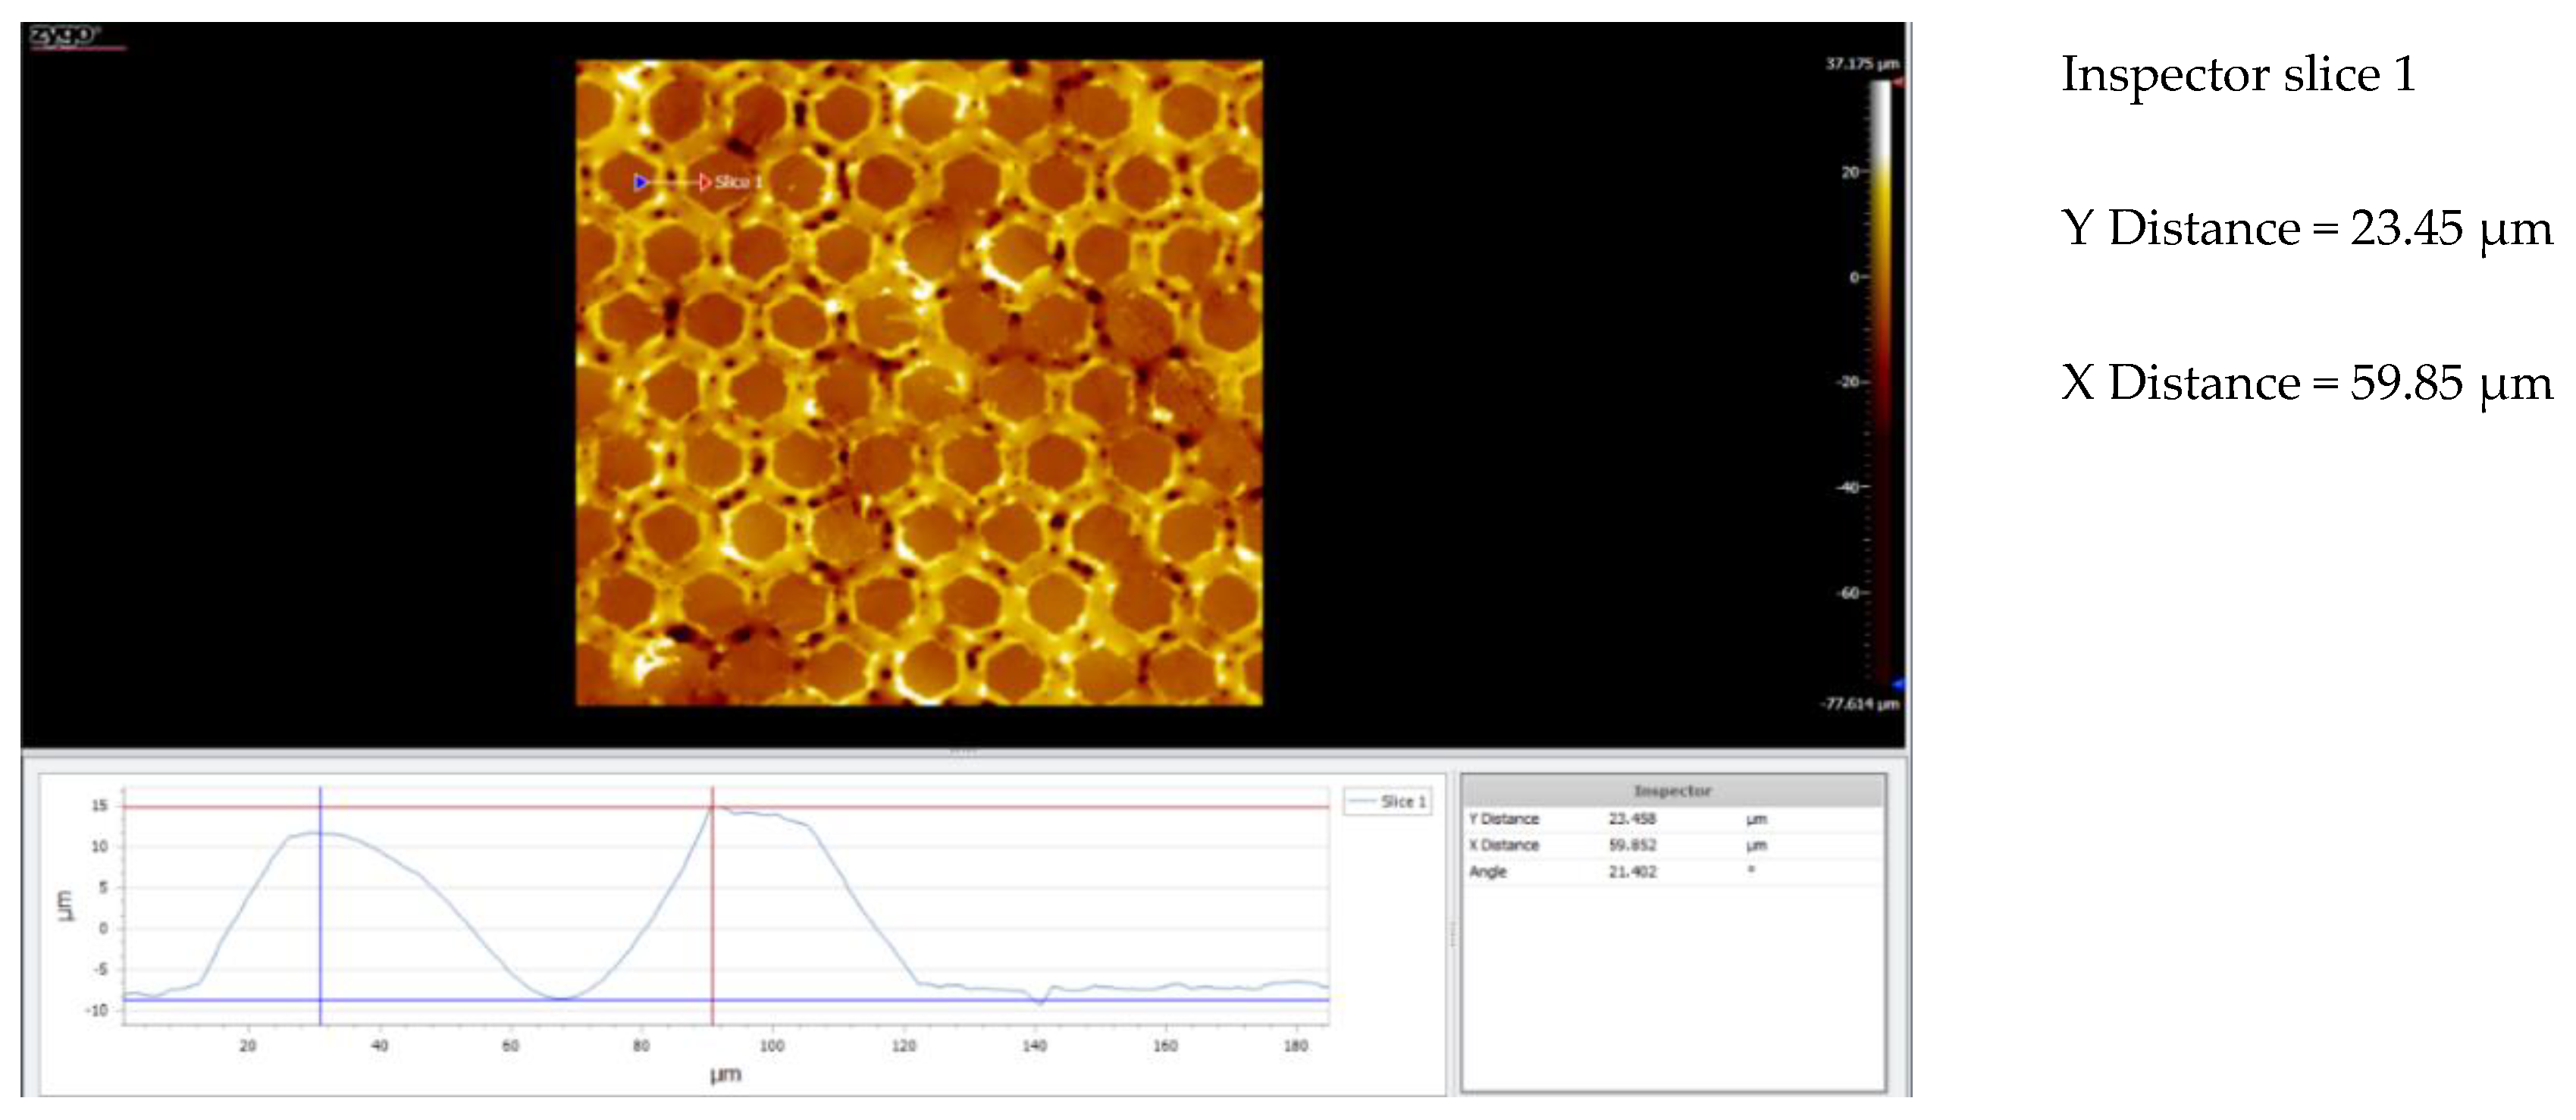
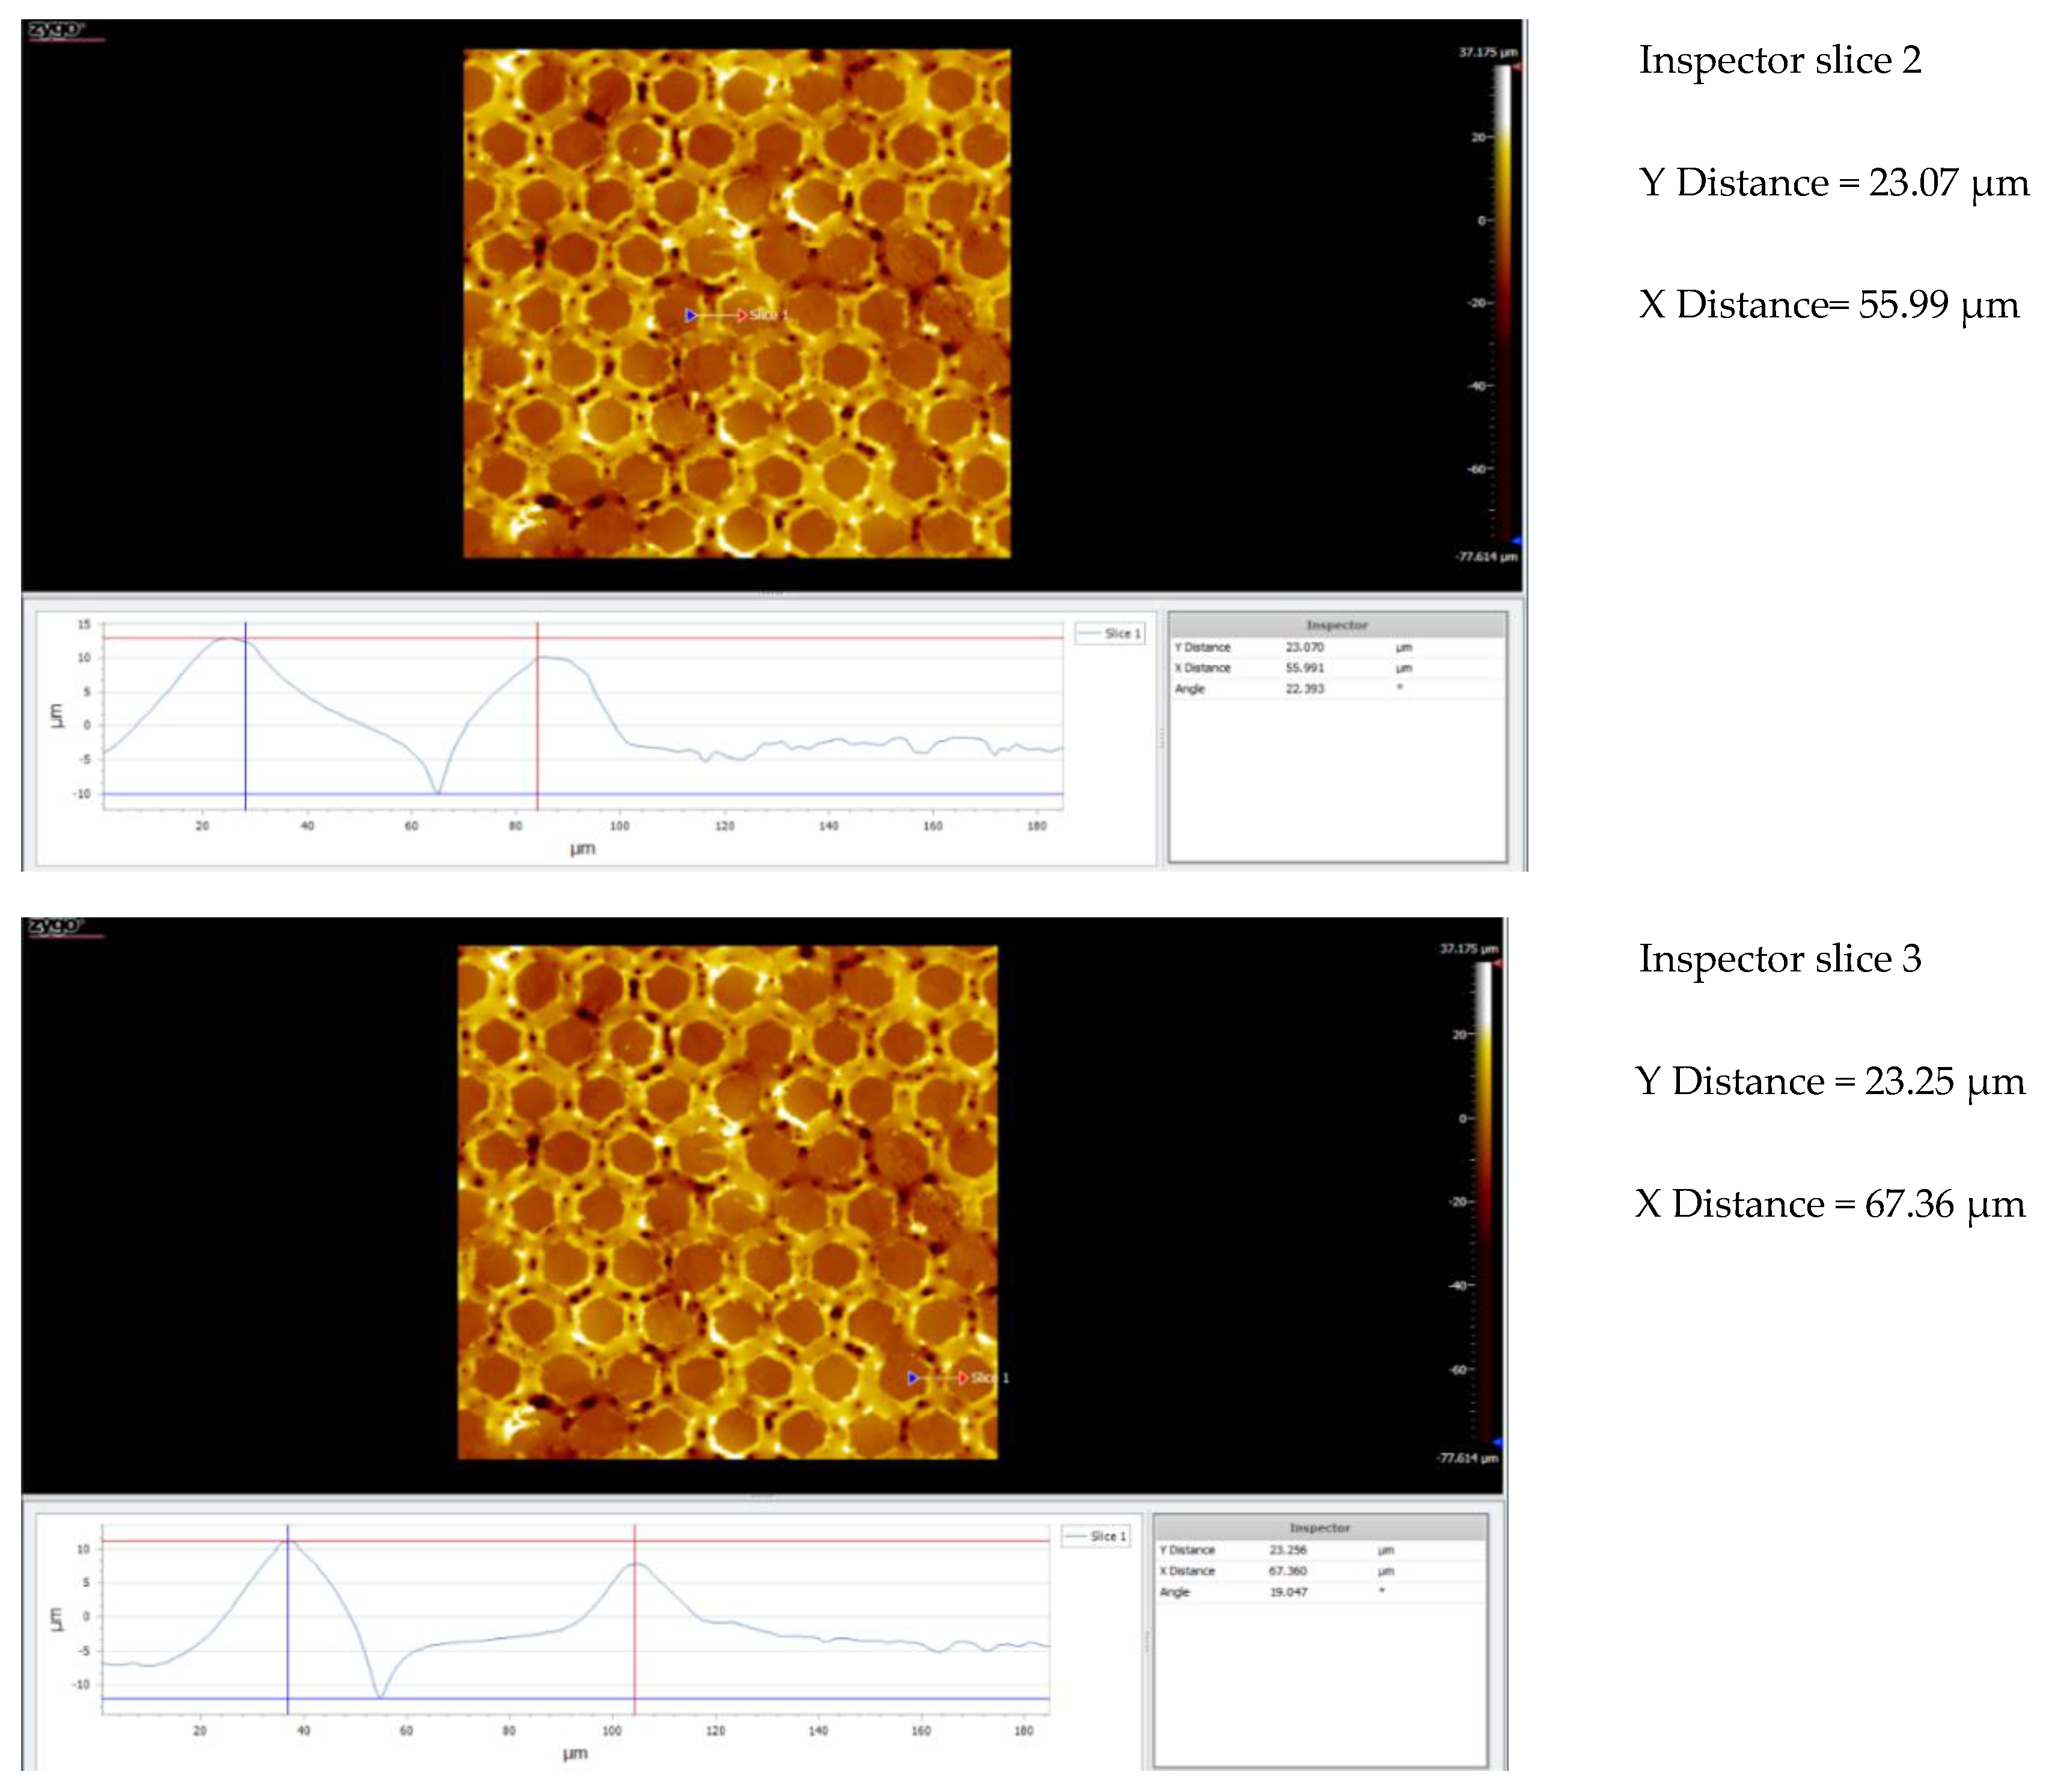
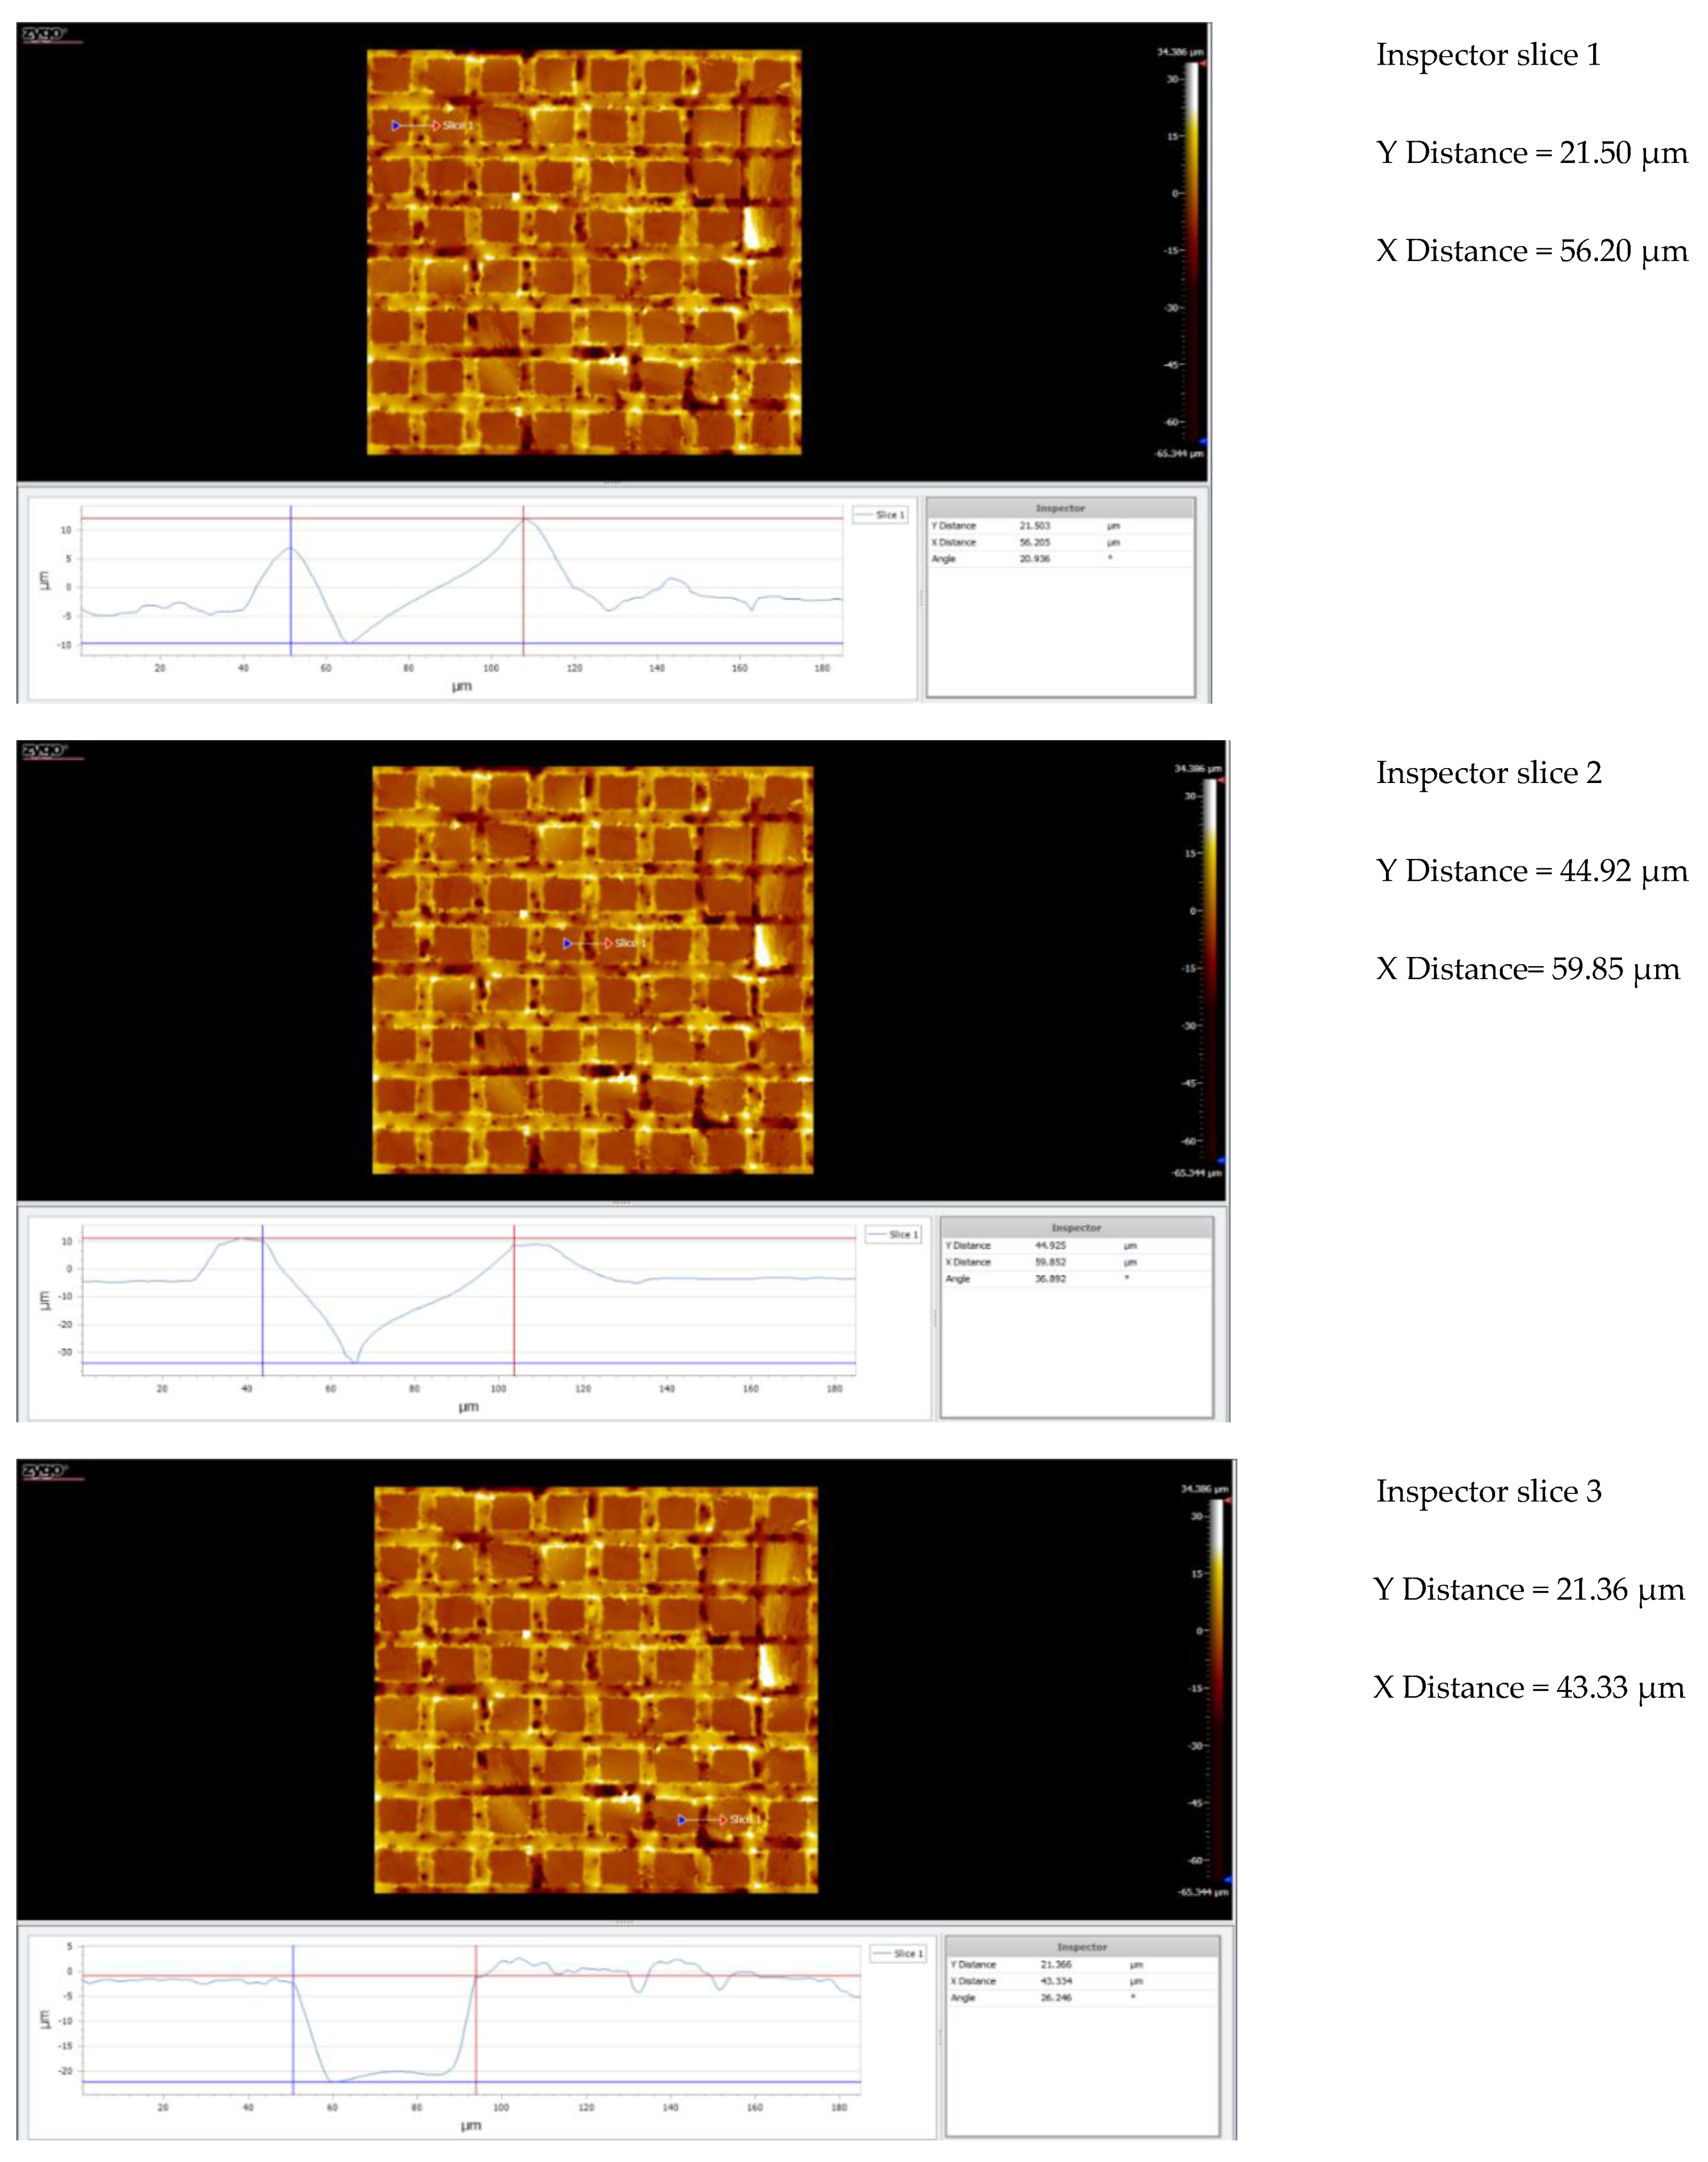
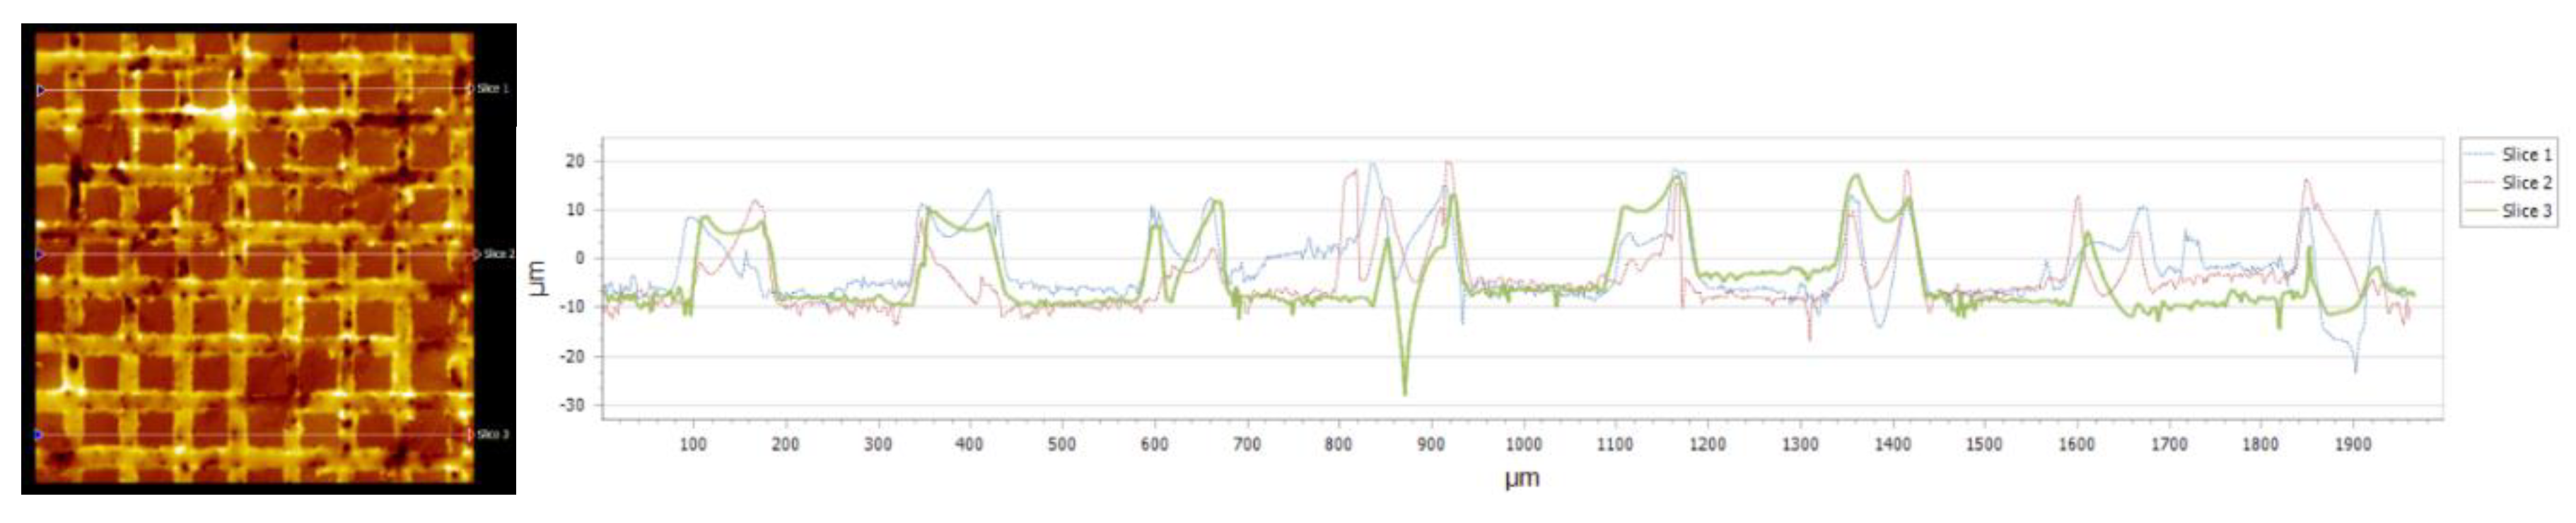
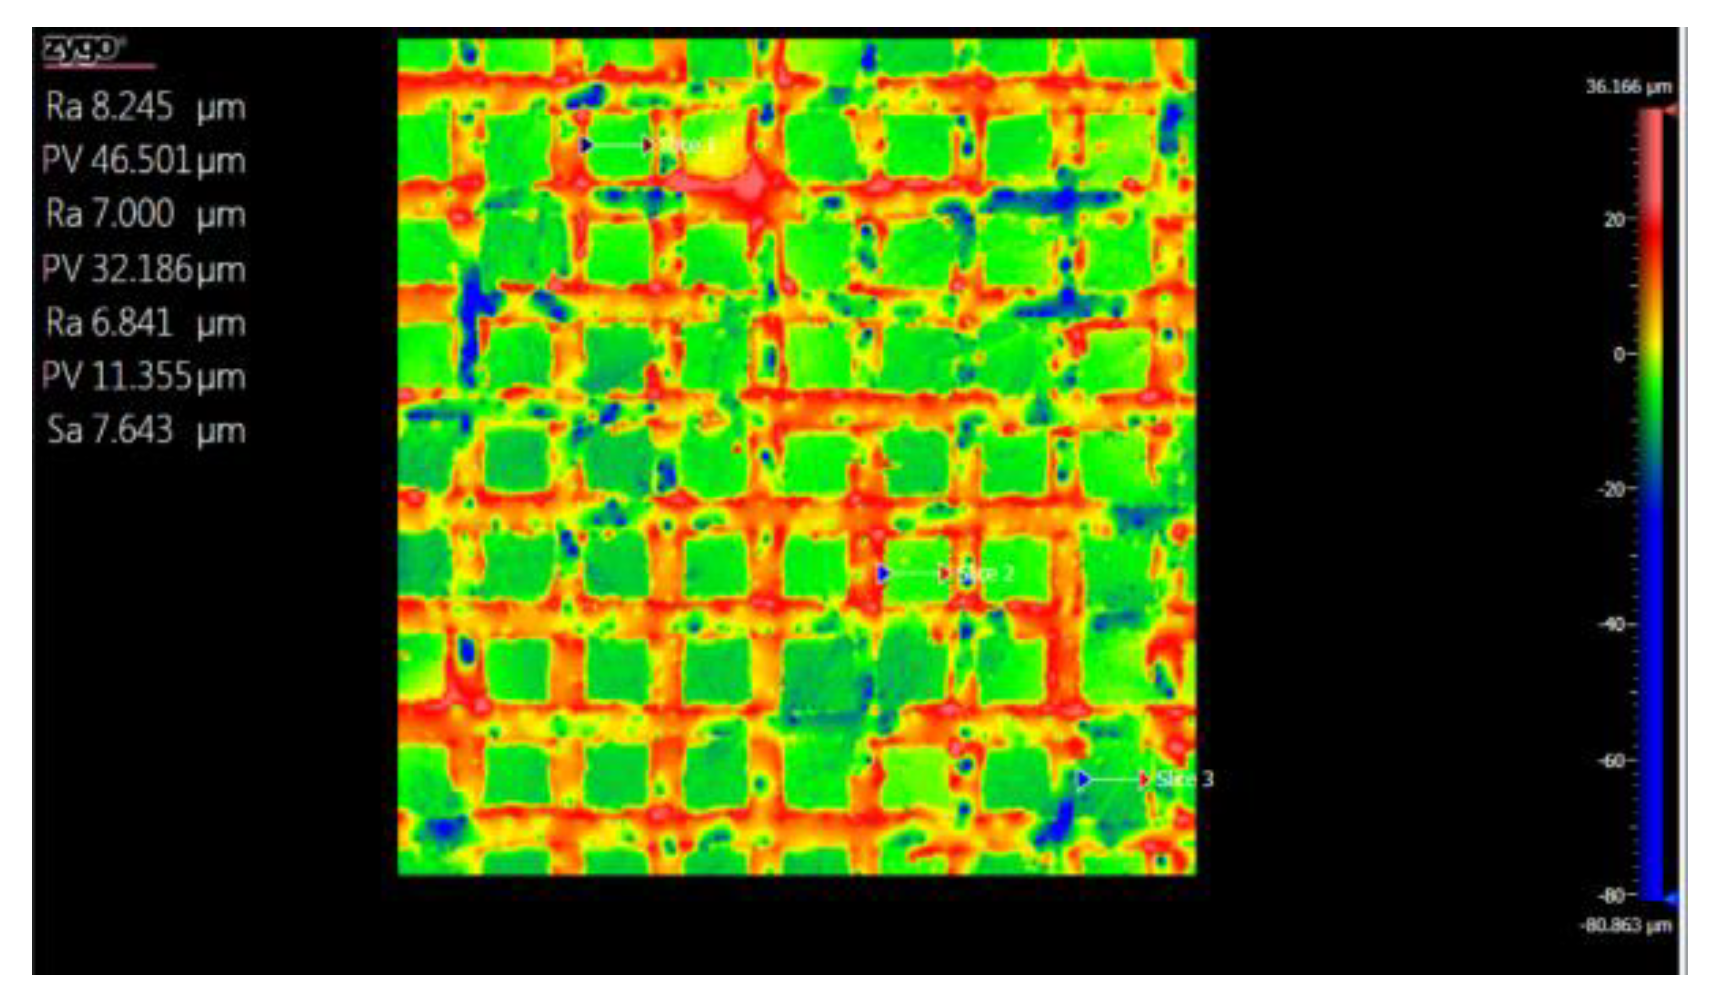
3.5.1. Topographic Analysis of Arbofill Fichte with Hexagonal Texture
3.5.2. Comparative Analysis Between the Two Processing Models 4x_H/6x_H
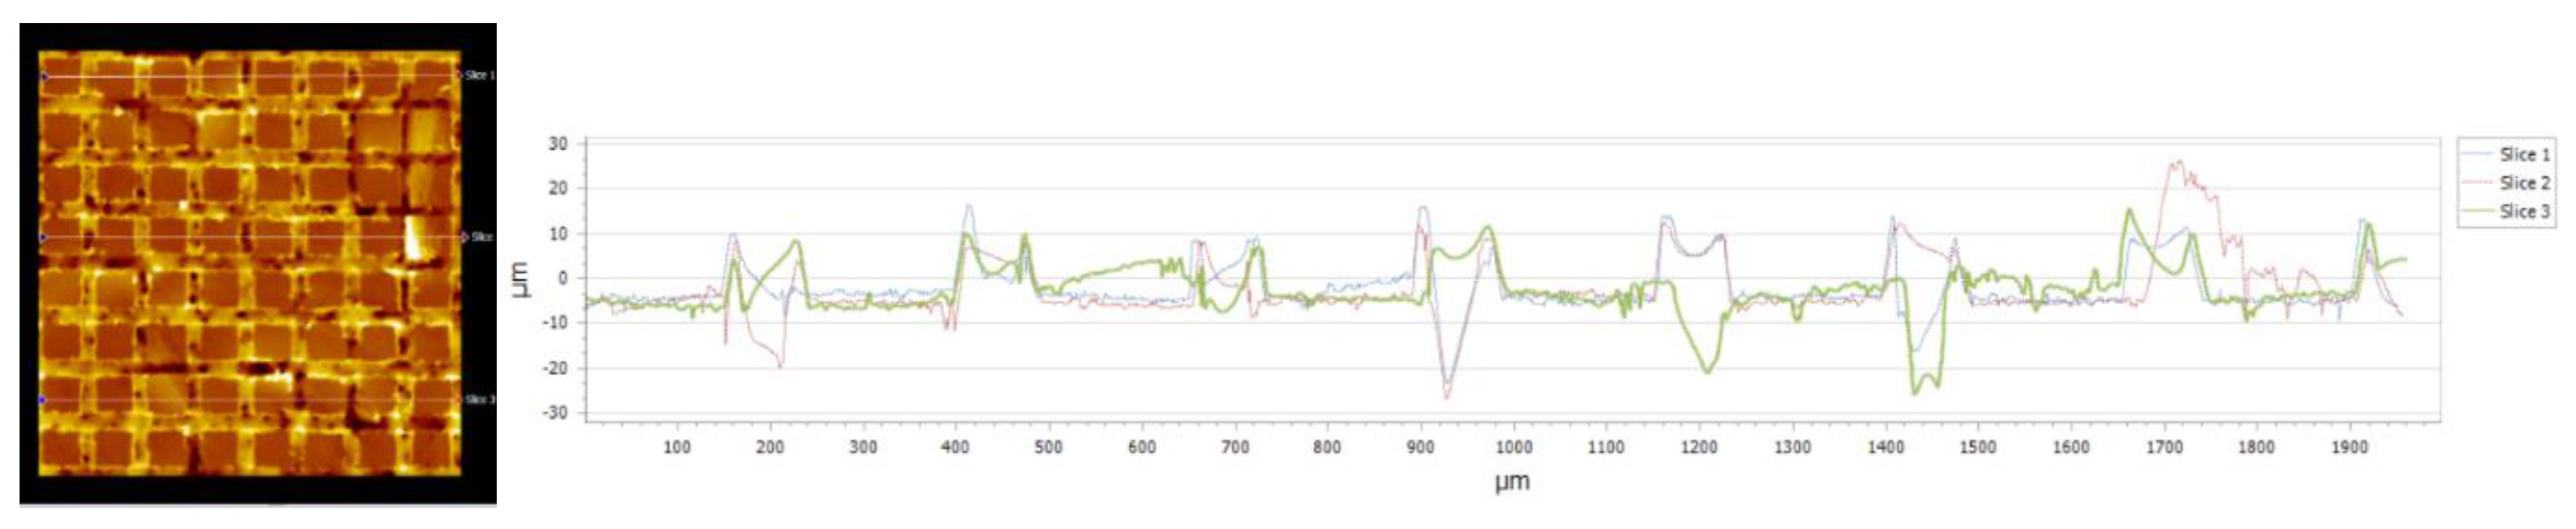
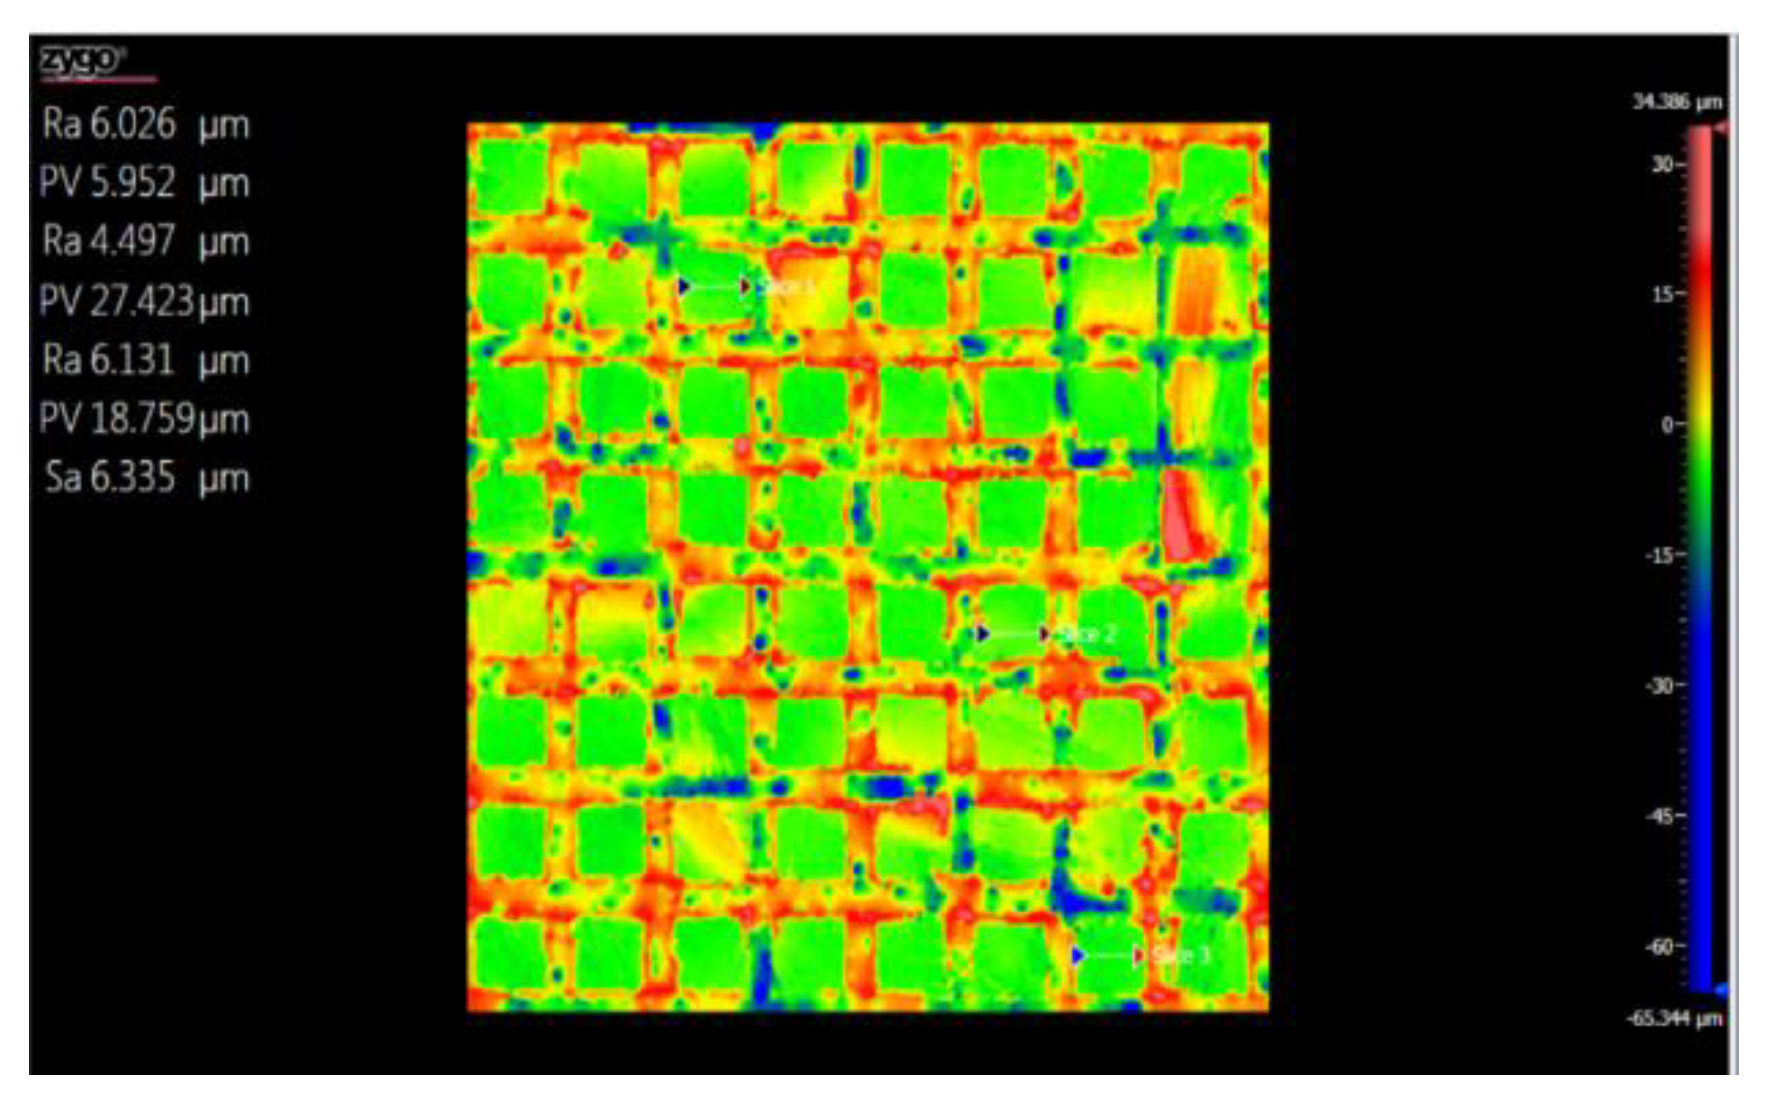
3.5.3. Topographic Analysis in the Case of Arbofill Fichte Material with a Square Texture
3.5.4. Comparative Analysis of the Two Types of Processing 4x_S and 6x_S
3.5.5. Comparison of Hexagonal and Square Geometry 4 and 6 Passes
5. Conclusions
Author Contributions
Funding
Data Availability Statement
Conflicts of Interest
References
- Li, D.; Chen, X.; Guo, C.; Tao, J.; Tian, C.; Deng, Y.; Zhang, W. Micro Surface Texturing of Alumina Ceramic with Nanosecond Laser. Procedia Eng. 2017, 174, 370–376. [Google Scholar] [CrossRef]
- Xing, Y.; Deng, J.; Feng, X.; Yu, S. Effect of laser surface texturing on Si3N4/TiC ceramic sliding against steel under dry friction. Mater. Design (1980–2015) 2013, 52, 34–45. [Google Scholar] [CrossRef]
- Šugár, P.; Šugárová, J.; Frnčík, M. Laser surface texturing of tool steel: textured surfaces quality evaluation. Open Eng. 2016, 6, 90–97. [Google Scholar] [CrossRef]
- Tripathi, K.; Gyawali, G.; Joshi, B.; Amanov, A.; Wohn, S. Improved Tribological Behavior of Grey Cast Iron Under Low and High Viscous Lubricants by Laser Surface Texturing. Mater. Perform. Charact. 2017, 6, 24–41. [Google Scholar] [CrossRef]
- Riveiro, A.; Maçon, A.L.B.; del Val, J.; Comesaña, R.; Pou, J. Laser Surface Texturing of Polymers for Biomedical Applications. Front. Phys. 2018, 6. [Google Scholar] [CrossRef]
- Ezhilmaran, V.; Vasa, N.; Vijayaraghavan, L. Investigation on generation of laser assisted dimples on piston ring surface and influence of dimple parameters on friction. Surf. Coatings Technol. 2018, 335, 314–326. [Google Scholar] [CrossRef]
- Liang, L.; Yuan, J.; Li, X.; Yang, F.; Jiang, L. Wear behavior of the micro-grooved texture on WC-Ni 3 Al cermet prepared by laser surface texturing. Int. J. Refract. Met. Hard Mater. 2018, 72, 211–222. [Google Scholar] [CrossRef]
- Shivakoti, I.; Kibria, G.; Cep, R.; Pradhan, B.B.; Sharma, A. Laser Surface Texturing for Biomedical Applications: A Review. Coatings 2021, 11, 124. [Google Scholar] [CrossRef]
- White, N.; Eder, K.; Byrnes, J.; Cairney, J.; McCarroll, I. Laser ablation sample preparation for atom probe tomography and transmission electron microscopy. Ultramicroscopy 2020, 220, 113161. [Google Scholar] [CrossRef] [PubMed]
- Riveiro, A.; Maçon, A.L.B.; del Val, J.; Comesaña, R.; Pou, J. Laser Surface Texturing of Polymers for Biomedical Applications. Front. Phys. 2018, 6. [Google Scholar] [CrossRef]
- Tomanik, M.; Kobielarz, M.; Filipiak, J.; Szymonowicz, M.; Rusak, A.; Mroczkowska, K.; Antończak, A.; Pezowicz, C. Laser Texturing as a Way of Influencing the Micromechanical and Biological Properties of the Poly (L-Lactide) Surface. Materials 2020, 13, 3786. [Google Scholar] [CrossRef]
- Riveiro, A.; Soto, R.; del Val, J.; Comesaña, R.; Boutinguiza, M.; Quintero, F.; Lusquiños, F.; Pou, J. Texturing of polypropylene (PP) with nanosecond lasers. Appl. Surf. Sci. 2016, 374, 379–386. [Google Scholar] [CrossRef]
- Dinca, V.; Alloncle, P.; Delaporte, P.; Ion, V.; Rusen, L.; Filipescu, M.; Mustaciosu, C.; Luculescu, C.; Dinescu, M. Excimer laser texturing of natural composite polymer surfaces for studying cell-to-substrate specific response. Appl. Surf. Sci. 2015, 352, 82–90. [Google Scholar] [CrossRef]
- Koufaki, N.; Ranella, A.; E Aifantis, K.; Barberoglou, M.; Psycharakis, S.; Fotakis, C.; Stratakis, E. Controlling cell adhesion via replication of laser micro/nano-textured surfaces on polymers. Biofabrication 2011, 3, 045004. [Google Scholar] [CrossRef]
- Yeong, W.Y.; Yu, H.; Lim, K.P.; Ng, K.L.G.; Boey, Y.C.F.; Subbu, V.S.; Tan, L.P. Multiscale Topological Guidance for Cell Alignment via Direct Laser Writing on Biodegradable Polymer. Tissue Eng. Part C: Methods 2010, 16, 1011–1021. [Google Scholar] [CrossRef]
- Waugh, D.; Lawrence, J. Laser surface processing of polymers for biomedical applications. In Laser-Assisted Fabrication of Materials; Springer: Berlin/Heidelberg, Germany, 2013; pp. 275–318. [Google Scholar]
- Jagur-Grodzinski, J. Polymers for tissue engineering, medical devices, and regenerative medicine. Concise general review of recent studies. Polym. Adv. Technol. 2006, 17, 395–418. [Google Scholar] [CrossRef]
- Kohane, D.S.; Langer, R. Polymeric Biomaterials in Tissue Engineering. Pediatr. Res. 2008, 63, 487–491. [Google Scholar] [CrossRef] [PubMed]
- Teo, A.J.; Mishra, A.; Park, I.; Kim, Y.-J.; Park, W.-T.; Yoon, Y.-J. Polymeric Biomaterials for Medical Implants and Devices. ACS Biomater. Sci. Eng. 2016, 2, 454–472. [Google Scholar] [CrossRef]
- Abu Bakar, M.; Cheng, M.; Tang, S.; Yu, S.; Liao, K.; Tan, C.; Khor, K.; Cheang, P. Tensile properties, tension–tension fatigue and biological response of polyetheretherketone–hydroxyapatite composites for load-bearing orthopedic implants. Biomaterials 2003, 24, 2245–2250. [Google Scholar] [CrossRef] [PubMed]
- Godara, A.; Raabe, D.; Green, S. The influence of sterilization processes on the micromechanical properties of carbon fiber-reinforced PEEK composites for bone implant applications. Acta Biomater. 2007, 3, 209–220. [Google Scholar] [CrossRef]
- Riveiro, A.; Soto, R.; Comesaña, R.; Boutinguiza, M.; del Val, J.; Quintero, F.; Lusquiños, F.; Pou, J. Laser surface modification of PEEK. Appl. Surf. Sci. 2012, 258, 9437–9442. [Google Scholar] [CrossRef]
- Zheng, Y.; Xiong, C.; Wang, Z.; Li, X.; Zhang, L. A combination of CO2 laser and plasma surface modification of poly(etheretherketone) to enhance osteoblast response. Appl. Surf. Sci. 2015, 344, 79–88. [Google Scholar] [CrossRef]
- Wilson, A.; Jones, I.; Salamat-Zadeh, F.; Watts, J.F. Laser surface modification of poly(etheretherketone) to enhance surface free energy, wettability and adhesion. Int. J. Adhes. Adhes. 2015, 62, 69–77. [Google Scholar] [CrossRef]
- Lorusso, A.; Nassisi, V.; Paladini, F.; Torrisi, L.; Visco, A.; Campo, N. Comparison of the laser effects induced on ultra-high-molecular-weight polyethylene. Radiat. Eff. Defects Solids 2008, 163, 435–440. [Google Scholar] [CrossRef]
- Riveiro, A.; Soto, R.; del Val, J.; Comesaña, R.; Boutinguiza, M.; Quintero, F.; Lusquiños, F.; Pou, J. Laser surface modification of ultra-high-molecular-weight polyethylene (UHMWPE) for biomedical applications. Appl. Surf. Sci. 2014, 302, 236–242. [Google Scholar] [CrossRef]
- Himma, N.F.; Anisah, S.; Prasetya, N.; Wenten, I.G. Advances in preparation, modification, and application of polypropylene membrane. J. Polym. Eng. 2016, 36, 329–362. [Google Scholar] [CrossRef]
- Wissemborski, R.; Klein, R. Welding and Marking of Plastics with Lasers. PhotonicsViews 2010, 7, 19–22. [Google Scholar] [CrossRef]
- Stanford, C. Surface modifications of dental implants. Aust. Dent. J. 2008, 53, S26–S33. [Google Scholar] [CrossRef] [PubMed]
- Murahara, M.; Okoshi, M. Photochemical surface modification of polypropylene for adhesion enhancement by using an excimer laser. J. Adhes. Sci. Technol. 1995, 9, 1593–1599. [Google Scholar] [CrossRef]
- Deshpande, S.; Munoli, A. Long-term results of high-density porous polyethylene implants in facial skeletal augmentation: An Indian perspective. Indian J. Plast. Surg. 2010, 43, 34–9. [Google Scholar] [CrossRef] [PubMed]
- Okoshi, M.; Inoue, N. Microfabrication of Polyethylene Using Femtosecond Ti:sapphire Laser and Nanosecond ArF Laser. Jpn. J. Appl. Phys. 2003, 42, 5642–5647. [Google Scholar] [CrossRef]
- Blanchemain, N.; Chai, F.; Bacquet, M.; Gengembre, L.; Traisnel, M.; Setti, Y.; Hildebrand, H.F. Improvement of biological response of YAG laser irradiated polyethylene. J. Mater. Chem. 2007, 17, 4041–4049. [Google Scholar] [CrossRef]
- Okoshi, M.; Inoue, N. Laser ablation of polymers using 395 nm and 790 nm femtosecond lasers. Appl. Phys. A 2004, 79, 841–844. [Google Scholar] [CrossRef]
- Ahad, I.; Budner, B.; Korczyc, B.; Fiedorowicz, H.; Bartnik, A.; Kostecki, J.; Burdyńska, S.; Brabazon, D. Polycarbonate Polymer Surface Modification by Extreme Ultraviolet (EUV) Radiation. Acta Phys. Pol. A 2014, 125, 924–928. [Google Scholar] [CrossRef]
- Viville, P.; Beauvois, S.; Lambin, G.; Lazzaroni, R.; Bre´das, J.; Kolev, K.; Laude, L. Excimer laser-induced surface modifications of biocompatible polymer blends. Appl. Surf. Sci. 1996, 96-98, 558–562. [Google Scholar] [CrossRef]
- Ahad, I.U.; Butruk, B.; Ayele, M.; Budner, B.; Bartnik, A.; Fiedorowicz, H.; Ciach, T.; Brabazon, D. Extreme ultraviolet (EUV) surface modification of polytetrafluoroethylene (PTFE) for control of biocompatibility. Nucl. Instruments Methods Phys. Res. Sect. B: Beam Interactions Mater. Atoms 2015, 364, 98–107. [Google Scholar] [CrossRef]
- Waugh, D.; Lawrence, J.; Morgan, D.; Thomas, C. Interaction of CO2 laser-modified nylon with osteoblast cells in relation to wettability. Mater. Sci. Eng. C 2009, 29, 2514–2524. [Google Scholar] [CrossRef]
- Günther D, Scharnweber D, Hess R, Wolf-Brandstetter C, Grosse Holthaus M, Lasagni AF. High precision patterning of biomaterials using the direct laser interference patterning technology. In: Vilar R, editor. Laser Surface Modification of Biomaterials. Cambridge, MA: Woodhead Publishing (2016). [CrossRef]
- Yasaka, K.; Koseki, Y.; Yoshinaka, K.; Miyake, K. Effects of Surface Texture on Soft-Materials for Medical Applications. Tribol. Online 2016, 11, 288–297. [Google Scholar] [CrossRef]
- Ikeuchi, K.; Takii, T.; Norikane, H.; Tomita, N.; Ohsumi, T.; Uyama, Y.; Ikada, Y. Water lubrication of polyurethane grafted with dimethylacrylamide for medical use. Wear 1993, 161, 179–185. [Google Scholar] [CrossRef]
- Shivakoti, I.; Kibria, G.; Cep, R.; Pradhan, B.B.; Sharma, A. Laser Surface Texturing for Biomedical Applications: A Review. Coatings 2021, 11, 124. [Google Scholar] [CrossRef]
- Mirzadeh, H.; Katbab, A.; Burford, R. CO2-laser graft copolymerization of HEMA and NVP onto ethylene-propylene rubber (EPR) as biomaterial-(III). Radiat. Phys. Chem. 1995, 46, 859–862. [Google Scholar] [CrossRef]
- Koufaki, N.; Ranella, A.; E Aifantis, K.; Barberoglou, M.; Psycharakis, S.; Fotakis, C.; Stratakis, E. Controlling cell adhesion via replication of laser micro/nano-textured surfaces on polymers. Biofabrication 2011, 3, 045004. [Google Scholar] [CrossRef] [PubMed]
- Evangelista, I.; Wencel, D.; Beguin, S.; Zhang, N.; Gilchrist, M.D. Influence of Surface Texturing on the Dry Tribological Properties of Polymers in Medical Devices. Polymers 2023, 15, 2858. [Google Scholar] [CrossRef] [PubMed]
- Affatato, S. , Brando D. Wear of Orthopaedic Implants and Artificial Joints. Woodhead Publishing; Sawston, UK: 2013. Introduction to wear phenomena of orthopaedic implants; pp. 3–26.
- Ching, H.A.; Choudhury, D.; Nine, J.; Abu Osman, N.A. Effects of surface coating on reducing friction and wear of orthopaedic implants. Sci. Technol. Adv. Mater. 2014, 15, 014402. [Google Scholar] [CrossRef]
- Howard, J.J. Balancing innovation and medical device regulation: the case of modern metal-on-metal hip replacements. Med Devices: Évid. Res. 9. [CrossRef]
- Bialas, O.; Lis, M.; Woźniak, A.; Adamiak, M. Laser Superficial Fusion of Gold Nanoparticles with PEEK Polymer for Cardiovascular Application. Materials 2021, 14, 971. [Google Scholar] [CrossRef]
- Nedelcu, D. , Plavanescu S., Puiu E., Impact resistance of “liquid wood”, Advanced Materials Research 1036, 13-17.
- Mazurchevici, S.; Quadrini, F.; Nedelcu, D. The liquid wood heat flow and material properties as a function of temperature. Mater. Res. Express 2018, 5, 035303. [Google Scholar] [CrossRef]
- Broitman, E.; Nedelcu, D.; Mazurchevici, S.; Glenat, H.; Grillo, S. Tribological and Nanomechanical Behavior of Liquid Wood. J. Tribol. 2018, 141, 022001. [Google Scholar] [CrossRef]
- Nedelcu, D. Investigation on microstructure and mechanical properties of samples obtained by injection from Arbofill. Compos. Part B: Eng. 2013, 47, 126–129. [Google Scholar] [CrossRef]
- Mazurchevici, S.-N.; Vaideanu, D.; Rapp, D.; Varganici, C.-D.; Cărăușu, C.; Boca, M.; Nedelcu, D. Dynamic Mechanical Analysis and Thermal Expansion of Lignin-Based Biopolymers. Polymers 2021, 13, 2953. [Google Scholar] [CrossRef]
- Available online: https://www.tecnaro.de/en/arboblend-arbofill-arboform/verarbeitung/ (accessed on 12 September 2022).
- D Nedelcu, C Ciofu, NM Lohan, Microindentation and differential scanning calorimetry of “liquid wood”, Composites Part B: Engineering 55, 11-15.

| Software | Cimita laser micromachining software suite for laser, motion, and vision |
| Laser | Diode-pumped solid state |
| Cut speed | 1 [mm/s] |
| Cut passes | 4 and 6 passes |
| Power | 48 [mW] |
| Pulsation frequency | 400 [Hz] |
| Wave length | 355 [nm] |
| Pulse width | 6 [ps] |
| Arbofill Fichte | Arbofill Fichte 4 texturing passes |
Arbofill Fichte 6 texturing passes |
||||||||||
| No of samples | Contact angle (°) | Texturing type |
No of samples | Contact angle (°) | Texturing type |
No of samples | Contact angle (°) | |||||
| Max. | Min. | Average | Max. | Min. | Average | |||||||
| 1 | 89 | Hexagon | 1 | - | - | 41 | 38±2 | Hexagon | 1 | 40 | 0 (22s) | - |
| 2 | 84 | 2 | - | - | 35 | 2 | 20 | 0 (9s) | - | |||
| 3 | 90 | 3 | - | - | 37 | 3 | 35 | 0 (15s) | - | |||
| Average | 87±3 | Square | 1 | 24 | 0 (15s) | - | Square | 1 | 14 | 0 (2s) | - | |
| 2 | 16 | 0 (20s) | - | 2 | 18 | 0 (2s) | - | |||||
| 3 | 18 | 0 (15s) | - | 3 | 15 | 0 (1s) | - | |||||
| Arbofill Fichte – COF 0.10 initial state | COF | |
| 4 texturing passes | Hexagon | 0.20 |
| Square | 0.51 | |
| 6 texturing passes | Hexagon | 0.26 |
| Square | 0.49 | |
| Material | Weight (g) | Difference | ||
| Before texturing | After texturing | |||
| Arbofill Fichte | 4 texturing passes | 30.123 | 30.159 | +0.036 |
| 6 texturing passes | 31.697 | 31.736 | +0.039 | |
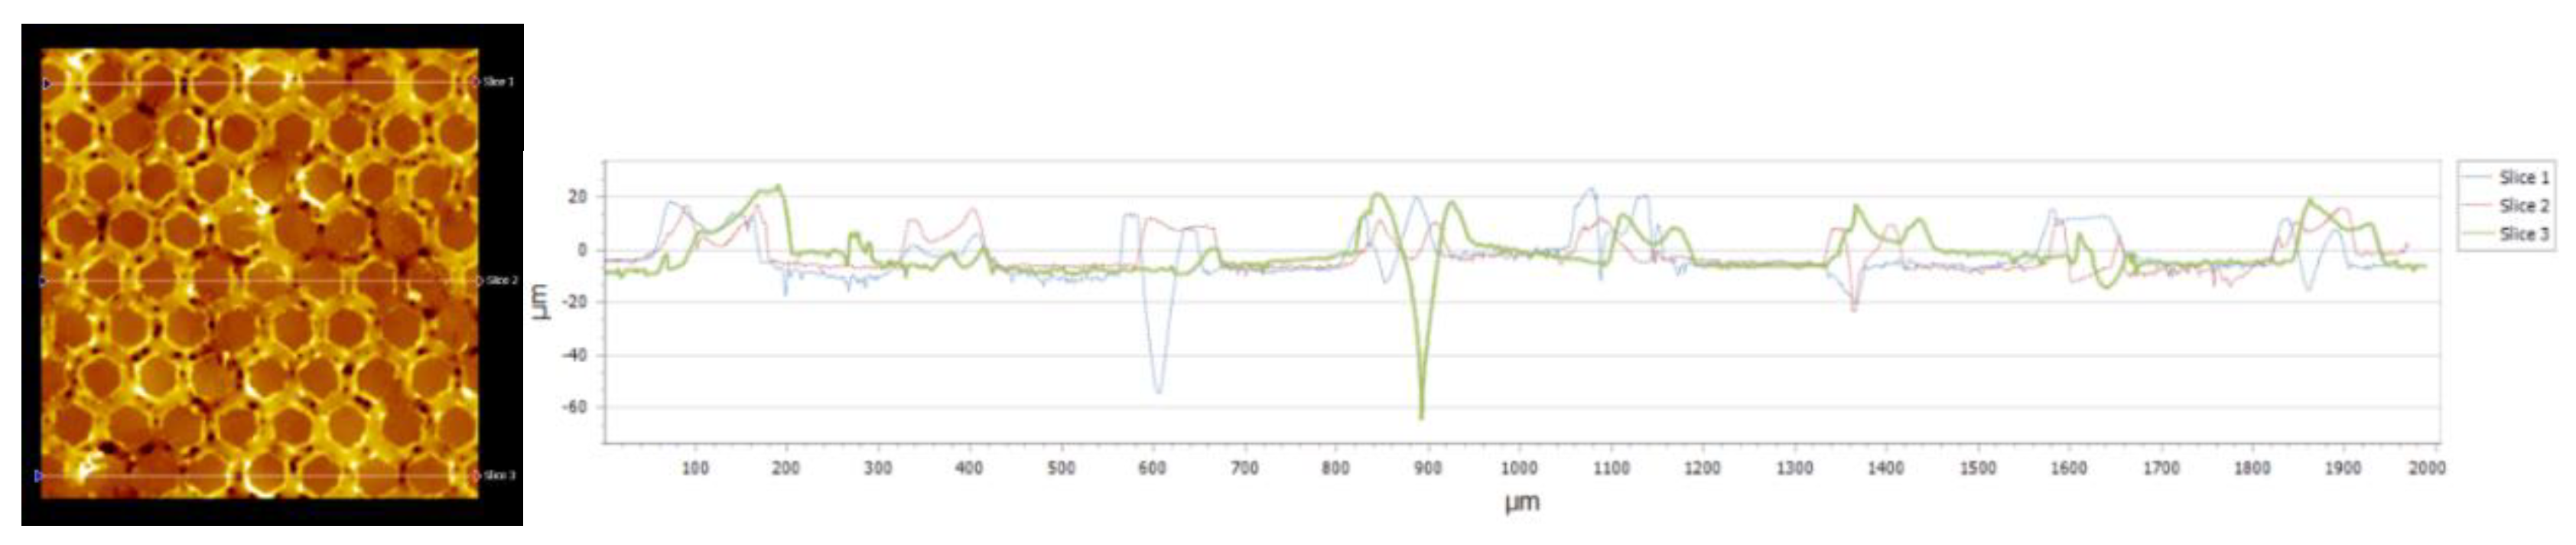
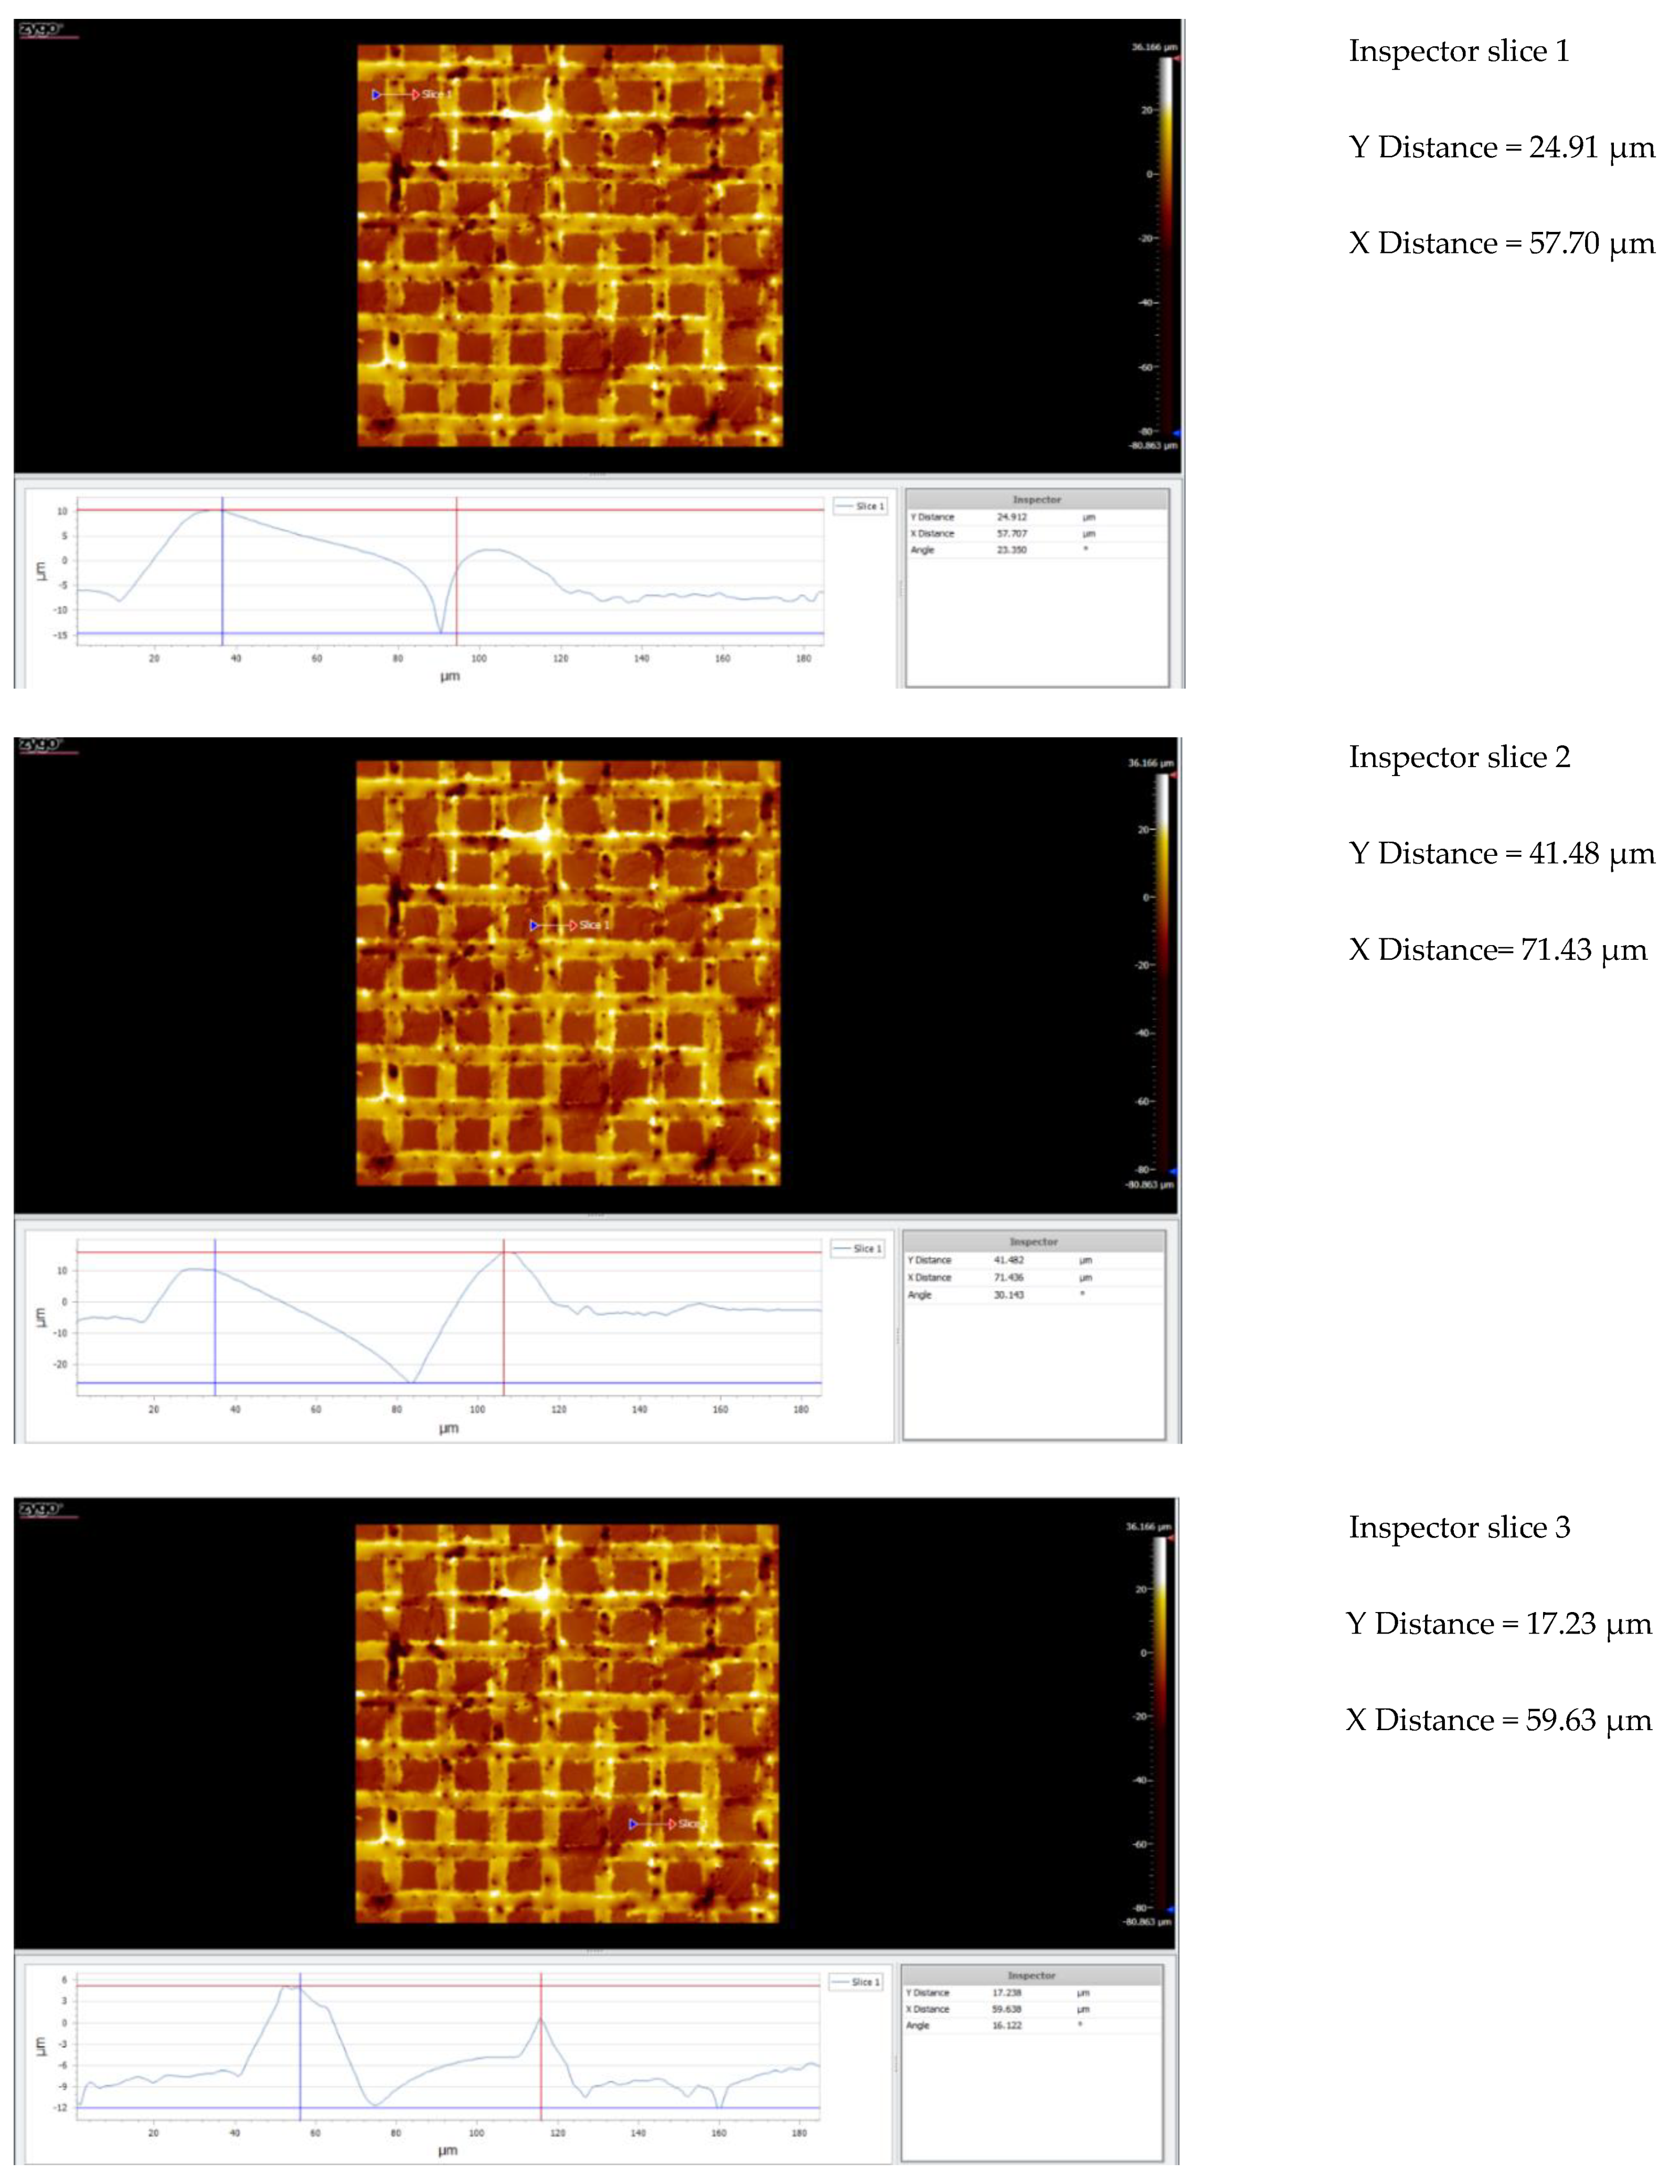
| Nr.crt. | Reference line | PV (µm) | RMS (µm) |
| 1 | Slice 1 | 34.28 | 8.67 |
| 2 | Slice 2 | 46.68 | 10.22 |
| 3 | Slice 3 | 64.88 | 9.24 |
| 4 | Mean | 48.61 | 9.38 |
| 5 | Standard deviation | 15.38 | 0.78 |
| 6 | Range | 30.59 | 1.58 |
| 7 | 3 Sigma | 46.16 | 2.35 |
| Nr.crt. | Reference line | PV (µm) | RMS (µm) |
| 1 | Slice 1 | 77.68 | 9.961 |
| 2 | Slice 2 | 40.40 | 6.887 |
| 3 | Slice 3 | 89.40 | 8.478 |
| 4 | Mean | 69.16 | 8.352 |
| 5 | Standard deviation | 25.58 | 1.406 |
| 6 | Range | 49.00 | 2.804 |
| 7 | 3 Sigma | 76.75 | 4.219 |
| Nr.crt. | Reference line | PV (µm) | RMS (µm) |
| 1 | Slice 1 | 39.75 | 5.784 |
| 2 | Slice 2 | 52.97 | 7.334 |
| 3 | Slice 3 | 41.54 | 6.130 |
| 4 | Mean | 44.75 | 6.416 |
| 5 | Standard deviation | 7.17 | 0.814 |
| 6 | Range | 13.22 | 1.550 |
| 7 | 3 Sigma | 21.52 | 2.441 |
| Nr.crt. | Reference line | PV (µm) | RMS (µm) |
| 1 | Slice 1 | 42.88 | 6.953 |
| 2 | Slice 2 | 37.04 | 7.446 |
| 3 | Slice 3 | 45.54 | 8.074 |
| 4 | Mean | 41.82 | 7.491 |
| 5 | Standard deviation | 4.34 | 0.562 |
| 6 | Range | 8.49 | 1.121 |
| 7 | 3 Sigma | 13.03 | 1.686 |
Disclaimer/Publisher’s Note: The statements, opinions and data contained in all publications are solely those of the individual author(s) and contributor(s) and not of MDPI and/or the editor(s). MDPI and/or the editor(s) disclaim responsibility for any injury to people or property resulting from any ideas, methods, instructions or products referred to in the content. |
© 2024 by the authors. Licensee MDPI, Basel, Switzerland. This article is an open access article distributed under the terms and conditions of the Creative Commons Attribution (CC BY) license (https://creativecommons.org/licenses/by/4.0/).


