Preprint
Article

Significance of Time Value When Comparing Alternatives for Building Decarbonization

Altmetrics

Downloads

10

Views

24

Comments

0

This version is not peer-reviewed

Submitted:

10 December 2024

Posted:

11 December 2024

You are already at the latest version

Alerts
Abstract
Decarbonizing buildings globally requires accurately quantifying the global warming impact of construction materials. However, standard carbon accounting methods and metrics undermine the potential of fast-growing biogenic materials because they ignore the timing of carbon uptake. The consequence is that analyses can indicate a building material is carbon-neutral when it is not climate-neutral. Here, we investigated the time-dependent effect of using fast-growing fibers in durable construction materials. The study estimated the material stock and flow and associated cradle-to-gate embodied emissions for four residential framing systems in the US: concrete masonry units, light-frame dimensional timber, and two framing systems that incorporate fast-growing fibers (bamboo and Eucalyptus). The carbon flows for these four framing systems were then scaled across four adoption scenarios, ranging from business-as-usual (no adoption of fast-growing fibers) to highly optimistic (full adoption of fast-growing materials in new construction within 10 years). Dynamic Life Cycle Assessment modeling was used to project radiative forcing and global temperature change potential. The results show that adoption of fast-growing biogenic construction materials can significantly reduce the climate impact of new US residential buildings within this century under reasonable adoption scenarios. However, net climate-cooling from residential framing will require highly aggressive, immediate adoption of fast-growing biogenic materials.
Keywords: 
Subject: Environmental and Earth Sciences  -   Sustainable Science and Technology

1. Introduction

Emissions from the built sector, including upfront material production and construction and operational energy use, reached an all-time high in 2023, comprising 37 percent of total global greenhouse gas emissions [1]. To date, policy initiatives and regulations have focused primarily on reducing operating emissions, primarily through increased operating efficiency and renewable energy sourcing. However, there is growing recognition that the embodied emissions, released upfront before a building ever becomes operational, can no longer be ignored. If globally significant measures aren’t taken to reduce the carbon footprint of durable building materials, increasing population growth and urbanization will simply drive higher demand for traditional materials and subsequently higher levels of greenhouse gases (GHGs) in the atmosphere.
Broadly speaking, there are two categories of building materials: extractive and biogenic. While building typology and construction materials vary widely country by country, by far the most used building and construction materials globally are extractive, predominantly steel and cement which represent 7.2 and 7.0 percent of global GHG emissions, respectively [2]. Due to the high embodied GHG emissions, increasing industry and governmental investment is now being directed towards producing lower (but still significantly positive) carbon footprint versions of these materials. Except for some, yet negligible, cementitious products that leverage post-manufacturing carbonation, extractive materials emit nearly 100% of their GHGs upfront. Extractive materials, unlike biogenic materials, provide no opportunity to re-capture the emitted CO2 following manufacturing. The climate impact of manufacturing and using extractive construction materials is most frequently reported using the characterization factor Global Warming Potential (GWP100).
The case with biogenic materials is, however, very different. Biogenic materials can meet comparable building code and performance requirements (load bearing, fire safety, durability, thermal performance), but they also durably store carbon captured from the atmosphere in buildings for long time periods [3]. Benefits of this carbon storage in buildings, though not “permanent”, include a reduction in cumulative energy input, buying time for longer term adaptation, delaying or avoiding climate tipping points, and the possibility of permanent storage through future technological changes [4]. However, the main carbon benefit of biobased construction is not the transfer of harvested biogenic carbon from nature to the building stock – it’s from the additional CO2 that is removed from the atmosphere when the biogenic fiber sources regrow. The potentially negative carbon footprint of biogenic materials, and the associated direct climate benefits, derives from this “forward” regrowth. The photosynthetic removal of the CO2 first offsets the emissions resulting from material production, and then the excess carbon removal can have a direct cooling effect on the atmosphere [5]. The faster the biogenic materials regrow, the faster the CO2 is removed from the atmosphere and the sooner the net cooling effect can occur. The acceleration of climate change tipping points makes the relative speed of biomass regrowth critically important. Yet the rate of regrowth varies drastically, ranging from less than one year with some agricultural crops to 45-120 years for slow-growing trees [6].
Currently, there is no standardization or consensus among current standards for the evaluation of biogenic carbon in biobased construction materials, despite their potentially significant contribution towards decarbonizing buildings [7]. Standard “static” LCAs will either (A) simply ignore biogenic carbon by assuming there is no carbon storage or emissions throughout the lifecycle (‘0/0’ approach) or (B) assume there is full credit for the net stored biogenic carbon at the beginning of the life cycle and an equivalent re-emission at the end (‘-1/+1’ approach) [8,9]. Static approaches ignore both the absolute and relative temporal benefits of biogenic carbon capture and can lead to building design strategies that are unknowingly counterproductive from a climate impact point of view. When this happens, the result will be misleading conclusions that are followed by missed opportunities. The more recent introduction of “dynamic” LCAs attempts to remedy the oversimplification relative to biogenic fibers by using time-dependent life cycle inventories and characterization factors to account for the temporal reality of when the positive and negative biogenic emissions occur [10]. Compared to the oversimplification of carbon flows in static LCAs, where all emissions are given the same weight no matter when they occur, dynamic LCAs improve accuracy by evaluating the impact on climatic radiative forcing occurring at any given point in time [11]. This accuracy enables the assessment of different carbon capture rates (“rotation cycles”) across biogenic fibers to more accurately reflect their factual impact on the climate. For example, the upfront emissions from softwood timbers continue to be climate-warming for decades after construction because of the relatively slow rate of fiber regrowth (i.e. CO2 recapture) [5]. Alternatively, a new generation of faster growing biogenic fibers (e.g. straw, hemp, bamboo, and some highly cultivated wood species) can more quickly recapture atmospheric CO2 and therefore can have a more immediate and powerful climate cooling impact.
The reporting of LCAs can be complex and difficult to interpret for many decision makers. Each GHG has its own radiative efficiency per unit mass, and the instantaneous radiative forcing caused by an increase in GHG atmospheric concentration depends on its radiative efficiency and on the lifetime of the given gas [12]. Global warming impact (GWI), which measures the total impact of GHGs on global warming (i.e. cumulative radiative forcing), is a midpoint indicator. A midpoint indicator measures the potential environmental impact at a stage in the cause-effect chain, which links emissions to radiative forcing, then climate response and finally climate impacts (e.g. radiative forcing leads to temperature change which results in sea-level rise). On the other hand, GWP, which is commonly (and incorrectly) used to refer to this midpoint impact, is a characterization factor for a given GHG. GWP is a relative metric, meaning it compares the radiative forcing of a given GHG relative to 1 kg of carbon dioxide (CO2), reporting in units of kg CO2eq. For instance, the GWP100 of methane (CH4) is 27 or 29.8, depending on the source of emissions, which means over a 100-year time horizon, it is approximately 28x more potent per unit of mass (kg) than carbon dioxide at trapping heat in the atmosphere [13]. Multiplying each mass of GHG by its GWP calculates its GWI, in kg CO2eq, for a given material or product across a time horizon.
Since 1990 and the first IPCC Assessment Report, GWP100 has become the most widely used metric for reporting climate impacts. However, some argue that absolute impacts (GWI), which are a measure of radiative forcing, provide a more accurate picture of the real-world impact of GHGs than do relative impacts (GWP), which are all normalized to the impacts of 1 kg CO2. In addition, critics of GWP100 contest that it does not measure actual warming, and therefore an alternative metric, Global Temperature change Potential (GTP), has been presented to quantify the impact of GHG emissions on future global temperatures [11]. Some reason that GTP is more appropriate for estimating climate change impacts because it is one step further along the cause-effect chain than the more causative midpoint of radiative forcing [14]. Furthermore, many concerns have been expressed about the flaws of reporting static LCA results using a relative GWP [10,12,15]. A temporal inconsistency exists between the time horizon chosen for the analysis and the time period covered by the results. This inconsistency is especially problematic for long-lasting products like buildings, making it a poor decision-making tool when trying to decarbonize the built environment. With dynamic LCAs, however, the characterization factors (CFs) are dynamic. Instead of measuring 100 years (i.e. using GWP100 CFs), dynamic CFs are used, which are a function of time (i.e. GWPt), to address temporal realities. Absolute global warming impact calculated with dynamic LCAs is therefore a much more useful decision-making metric and is better suited for the comparison of building materials.
Because the detailed analysis contained in an LCA is complex, data that summarizes the impact category (i.e. climate change) of the LCA is extracted and reported in an Environmental Product Disclosure (EPD), following ISO 14025. EPDs for construction products specifically follow ISO 21930 (and similarly EN 15804), which prescribe the climate change impact category be reported as GWP. While ISO 14040 allows for DLCA, ISO 21930/EN 15804 inexplicably mandates that EPDs, the reporting tool for construction products, employ the static -1/+1 treatment of biogenic carbon [16,17]. This practice ignores both the possible near-term climate benefits of biogenic materials compared to the longer-term climate cost of extractive materials and the differential timing benefits of faster regrowing biogenic materials compared to slower regrowing biogenic materials, thus undermining rationale decision making. There are significant impacts from ignoring the timing of carbon flows in these standards. Disregarding rotation period in static approaches can lead to errors in determining GWP values [8]. Another implication is that EPDs treat all biobased products the same, regardless of the biogenic fibers’ speed of re-growth (i.e., the speed of carbon removal). This is an inaccurate and unrepresentative way of measuring climate impact and does not convey the realities and tangible benefits of using fast-growing fibers. The existence of multiple climate system tipping points, and observations that some may have already been passed [18], underscores the weakness of ignoring time value. The goal of a construction-sector EPD is to “encourage the demand for, and supply of, building products that cause less stress on the environment” [16]. To achieve this, building designers need to be provided with the realistic carbon footprint data needed to choose building materials that ensure minimum climate impact.
Because the structural foundation and framing components of a building usually comprise the majority of a building’s mass and define its ultimate service life [19], they contribute the majority of a buildings’ upfront or embodied GHG emissions [20]. Relative to fast-growing biogenic components, they are also the most climate-leveraged end-use opportunities because of their long-term durability when storing biogenic carbon. Timber bamboo and Eucalyptus are two novel framing materials, both with superior mechanical properties and faster carbon capture rates (i.e., shorter rotations) than traditionally used framing softwoods [21,22]. By accurately analyzing the temporal global warming impact of residential framing systems, building designers and decision makers can assess how material selection impacts climate change mitigation and how incorporating time value of carbon flows is a key to optimizing the selection of framing materials.
Other research has examined this timing impact of biogenic materials relative to bioenergy [14,23], and many publications dynamically assess the implications of biogenic materials in buildings [3,4,6,12,24,25]. However, the analysis presented within the present study differentiates itself from prior studies by uniquely combining five elements: (1) analysis through a dynamic LCA methodology, (2) analysis of fast-growing fibers to quantify the decarbonization potential of biogenic materials, (3) use of structural framing systems as the building component to compare different material types, (4) analysis that extends beyond a single building to a full market (US residential market), and (5) data from real-world, in-market products comprised of fast-growing fibers. Combining these elements into a single analysis can help point the way from present hypothetical decision analysis to more realistic decision analysis in the future. Additionally, this market wide analysis provides important insights about the hard-to-change climate impacts of the building sector.

2. Materials and Methods

At present in the U.S., the two primary residential framing systems are concrete-masonry unit (“CMU”), and light-frame dimensional wood (“2x6”), representing 11% and 89% of the total residential building stock, respectively [26]. To evaluate the impact of adoption of fast-growing biogenic material, two traditional framing systems were compared to two new, US building code-compliant, prefabricated framing systems; one using timber bamboo-wood hybrid panels (“bamboo-hybrid”) and the other using Eucalyptus-wood hybrid panels (“Euc-hybrid”). These systems are summarized in Table 1. Both fast-growing biogenic products have demonstrated product-market fit and are now in their early adoption phase.
Together, the four framing systems cover the broad range of structural building materials from an extractive, non-biogenic material (CMU); to a slow-growing, biogenic option (2x6); to the two fast-growing biogenic fibers (bamboo-hybrid and Euc-hybrid). All four systems can be specified in one-to-five-story residential buildings.
Figure 1 outlines the two streams of analysis that were necessary to model climate impacts of the four framing systems across the four adoption scenarios. The first stream models the climate impact for each framing system, built from product-level GHG emissions including biogenic carbon, using three climate impact metrics (Instantaneous Radiation Forcing, Cumulative Radiation Forcing and Global Temperature Change). The second stream models the future incidence of the four framing systems, built from macroeconomic projections of residential floor area in the US housing market, through four scenarios of varying levels of market share adoption. These two streams were brought together to project the final climate impact resulting from four adoption scenarios of the four framing systems.

2.1. Climate Impact of Individual Framing Systems

To project the differential climate impact of the four framing systems, the scope of the analysis was limited to the product stage as reported in LCA Modules A1-A3. Limiting the system boundary to raw material acquisition and manufacturing (A1-A3) allowed the analysis to concentrate on the significant differences in the upfront embodied carbon of each framing system with the goal of analyzing their comparative carbon footprints through four scenarios of varied market adoption. The analysis was completed in the following four steps.
First, four functionally equivalent framings systems were specified based on a single 220 sq meter single-family residential building with an assumed minimum service life of 75 years. Table S1 shows, for each framing system, the material quantities for all components, including the installation materials. These material quantities were then used to inform the LCA.
Second, GHG emissions and biogenic carbon were sourced or calculated for all the materials comprising the four framing systems within the scope of the defined system boundary (Modules A1-A3). Life cycle inventory data was sourced from the industry-academic collaboration Carbon Leadership Forum (CLF)’s 2023 North American Material Baselines, which represent an estimate of industry-average GHG emissions for construction materials manufactured in North America [27]. When industry-average data was not available, material-specific emissions data from either publicly available EPDs or LCA tools were used. Biogenic carbon content for each biogenic source was provided from the carbon content and moisture level provided in each source when available. When not directly available, a biogenic fiber was assumed to have 10% moisture content and a carbon content of 50% by mass of the remaining “dry” fiber. That amount of carbon (C) is then multiplied by the mole ratio of CO2 /C (i.e. 44/12). Table S2 summarizes the emissions inventory for both fossil carbon and biogenic carbon and the data source for each material.
Third, for each framing system, the material quantities were scaled by the corresponding A1-A3 emissions and biogenic carbon. Table 2 details the biogenic carbon contribution from each fiber source, sums the biogenic carbon for each framing systems and compares the biogenic carbon to the emitted fossil carbon. It is noteworthy that the shorter rotation bamboo-hybrid framing shows embodied carbon nearly twice that of the Euc-hybrid framing system and over three times that of traditional 2x6 framing system. The relatively high total embodied carbon of the bamboo-based system is due to the high energy associated with processing the bamboo using today’s sub-optimal processing techniques.
Fourth, to accurately account for the A1-A3 emissions from a durable building component, it is necessary to account for both the upfront fossil emissions and the follow-on biogenic recapture which is a function of the biogenic fibers rate of regrowth or rotation cycle. As stated above, a static LCA would report these unrealistically using the -1 / +1 treatment for biogenic carbon. To more realistically assess the carbon footprint of the framing system, a dynamic LCA (DLCA) was used. Because atmospheric CDR derives from the regrowth of the biogenic fibers, not the carbon stored in the building, it is critical to consider rotation period. There are two ways to account for biogenic carbon removal; assuming carbon removal occurs before harvesting (backward-looking) or after harvesting during regrowth (forward-looking). The forward-looking approach, preferred from a sustainability point of view is used to describe a burden thinking where the harvested biomass creates a carbon debt before the biomass is regrown that must be compensated for [4,8,25]. In addition, the forward-looking approach focuses on regrowth, meaning the key differentiator among biobased materials – its regrowth profile – is accounted for. For these reasons, a forward-looking approach is the more appropriate approach for decision-making purposes. Using the emissions and rotation periods, a dynamic emissions profile was created for use in the DLCA. A1-A3 emissions were assumed to occur in the same year as the inflow of new floor space, whereas the biogenic carbon uptake is modeled using the previously described forward-looking approach. This model used a logistic function with a normal distribution [28], where g(t) is the carbon uptake for each year after replanting, with μ (the mean) occurring at half of the rotation period (μ= r/2) and σ (the variance) assumed to be half of the mean (σ=μ/2):
g t = 1 σ 2 π e 1 2 t μ σ 2
The cumulative carbon uptake was thus calculated as the integral of the normal distribution between the time of replanting and the end of the rotation period (r).
A dynamic life cycle assessment was then completed, following the method described by Levasseur et al. (2010) [10], and the implementation of the DLCA methods followed those outlined by Cooper et al. (2020) [23]. The analysis period was set at 75 years to reflect approximate service life of the building, aligning with the year 2100. Within each scenario, a stock-driven model was implemented considering each time-step of the analysis period (2025-2100) [29]. For each cohort inflow, a dynamic emissions inventory was created to determine the total emissions profile for the whole residential stock. From this dynamic emissions profile, the DLCA was performed. The analysis was performed using Python 3.10 and Excel.

2.2. Climate Impact of Framing System Market Adoption Scenarios

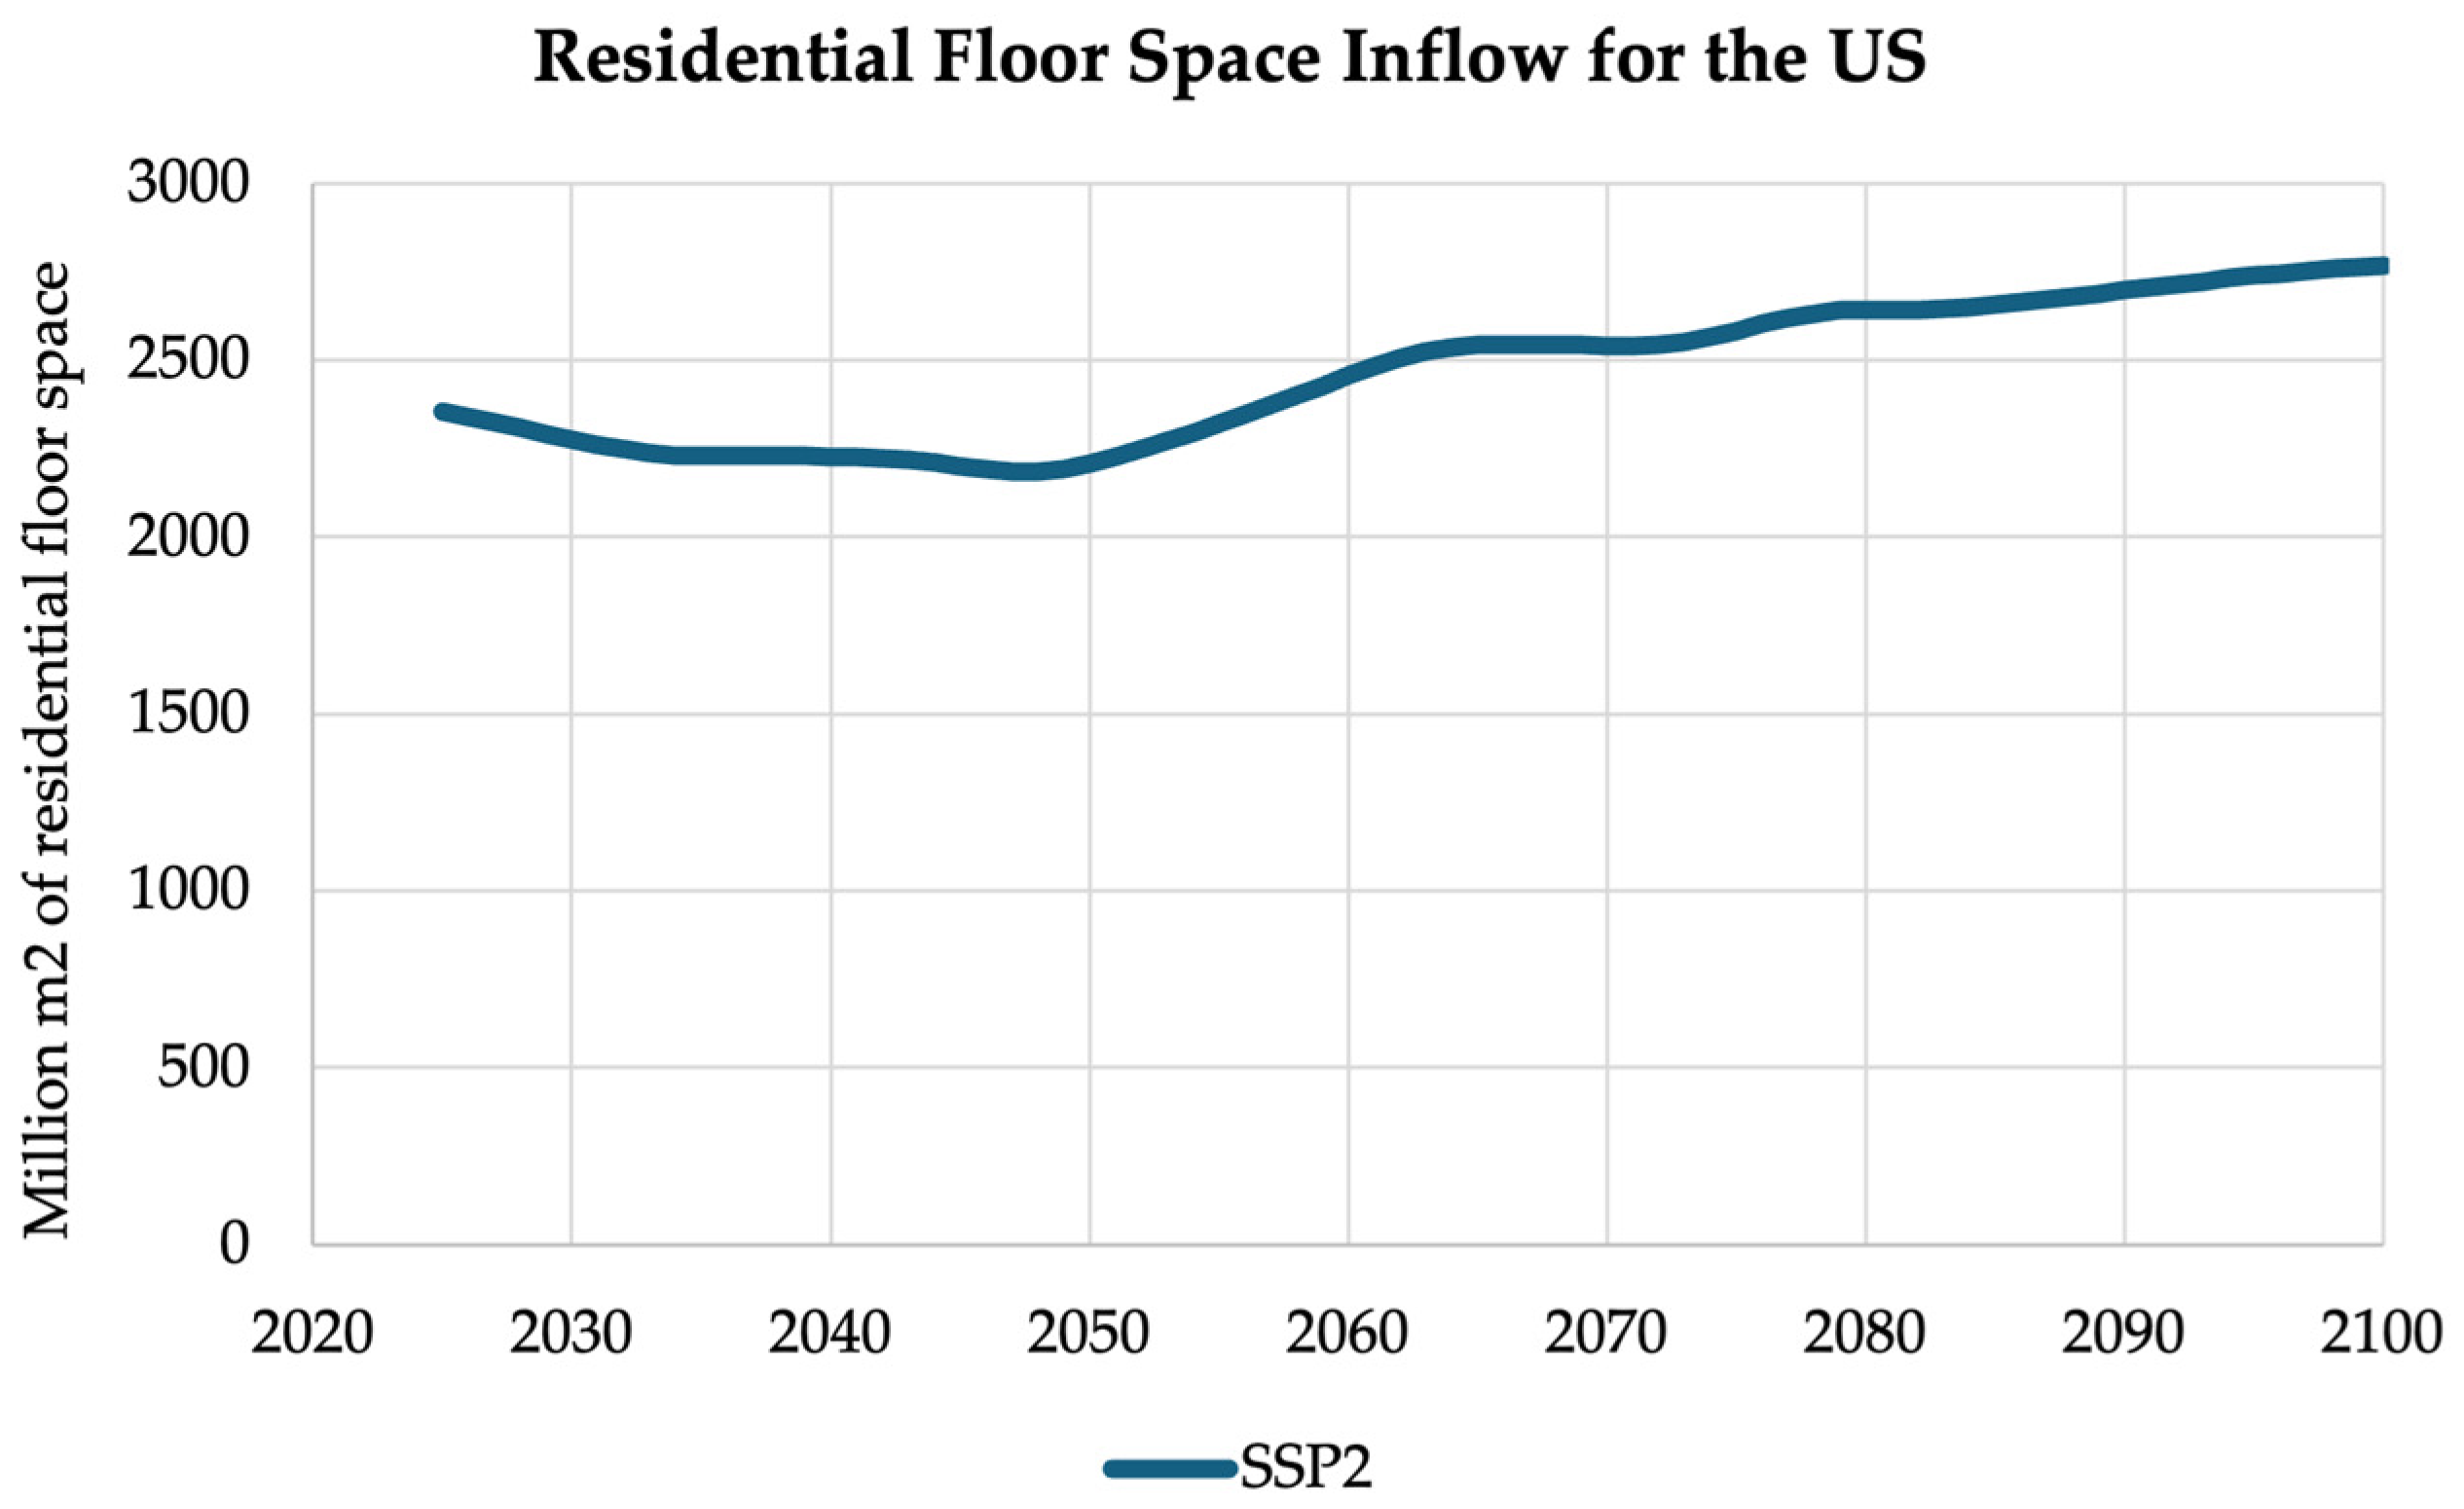
The projections of different market adoption scenarios were completed in three steps. First, a baseline projection of market-wide net new US residential construction was projected in the context of one of the Shared Socio-Economic Pathways (SSPs), which are scenarios that describe possible future socioeconomic developments and their implications for climate change [30]. ‘SSP2: Middle of the Road’ was chosen to represent the path for population, gross domestic product and baseline aggregate floor area between 2025 and 2100 [24]. Figure 2 shows the net annual inflow of residential floor space increases from approximately 2.4 million m2 in 2025 to almost 2.8 million m2 in 2100.
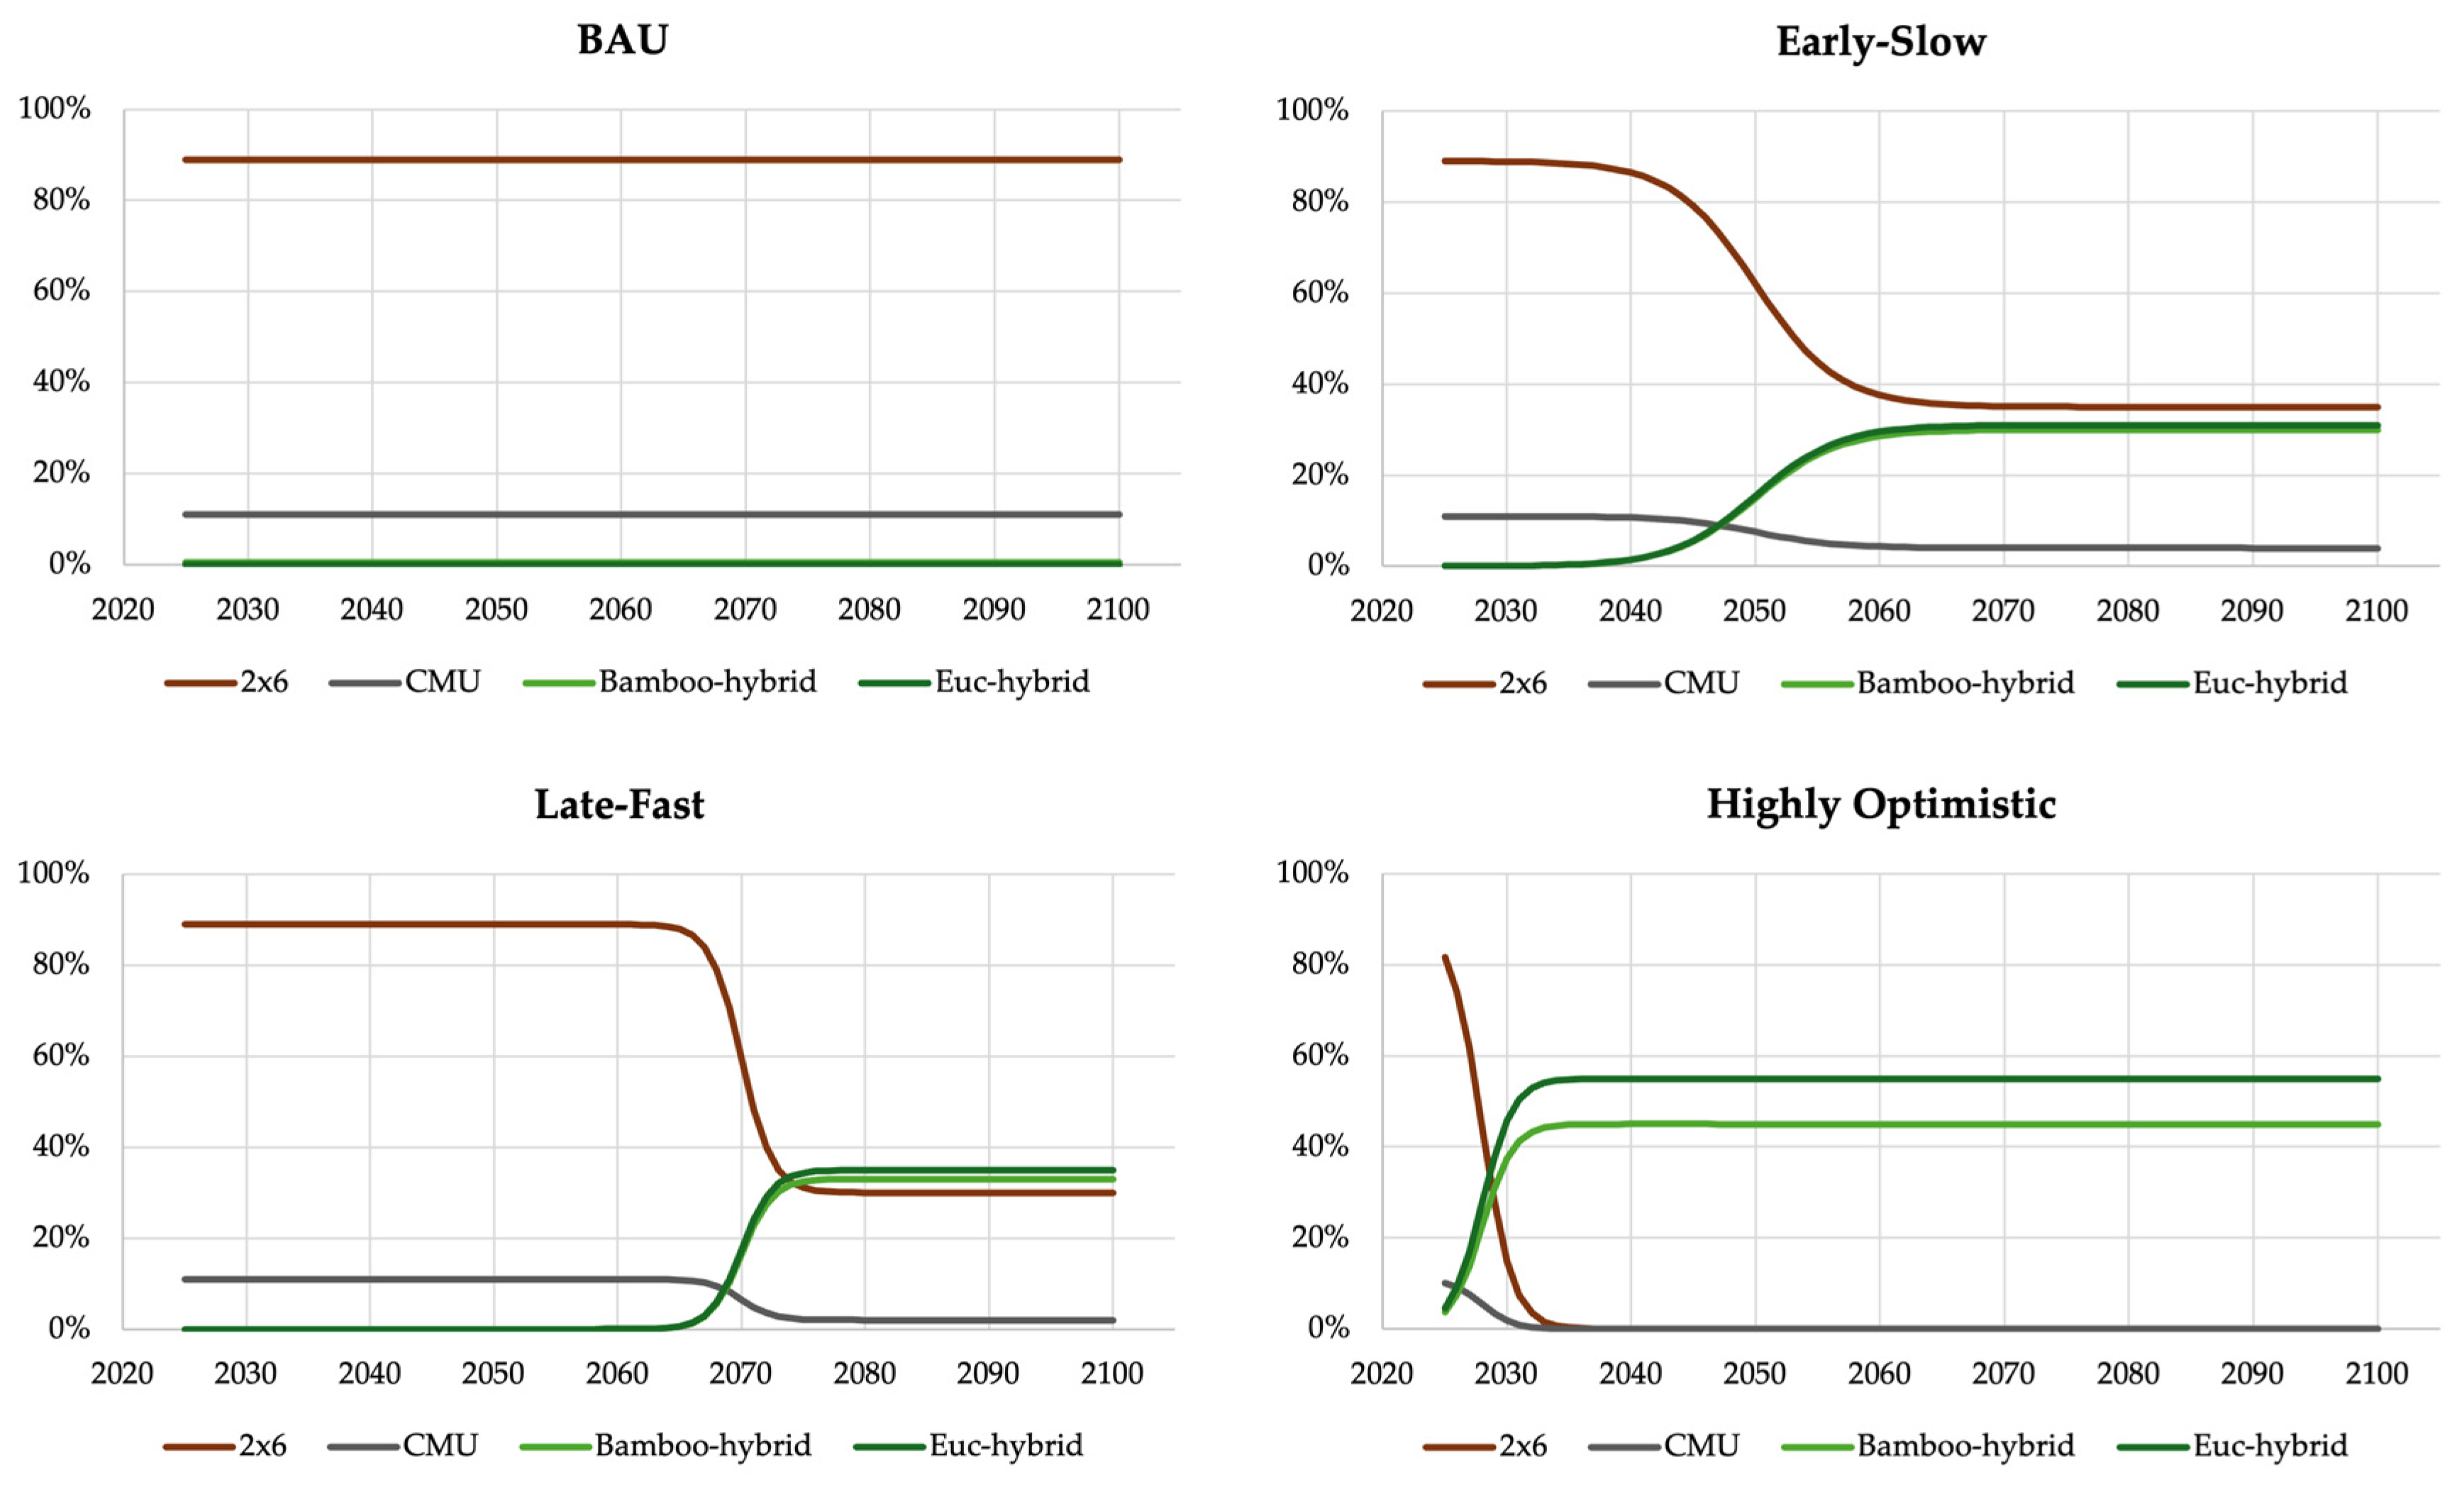
Second, four scenarios were developed to reflect varying rates of adoption of the fast-growing biogenic materials, shown in Table 3. The scenarios differ by both timing of when the adoption starts and the growth rate once adoption begins. Adoption rates were modeled using a generalized logistic function defined by the initial year of adoption, the annual growth rate and the year of final growth. Figure 3 shows the resulting market share for net new floor area in each year for each of the four framing systems across the four scenarios.
BAU was specified to represent no change in present market shares of the two traditional framing systems. This scenario represents a” business as usual” environment with zero adoption of fast-growing biogenic framing materials. Early-Slow specifies early adoption of the fast-growing biogenic framing materials, starting in 2029 and occurring at a relatively slow growth rate of 0.3 annually. This scenario recognizes the presence of in-market, fast-growing biogenic building materials such as those from BamCore (the seller of the two hybrid framing systems used in this analysis), Plantd, Hempitecture, and others. Late-Fast specifies delayed adoption of the fast-growing biogenic building materials, starting in 2062 and growing at 0.8 annually. This scenario represents a catch-up environment where accelerating climate change and activated tipping points motivate later but intense adoption. Highly Optimistic specifies very early and complete adoption of the fast-growing biogenic building materials, starting in 2025 with immediate market share of 4-5% and occurring at the growth rate of 0.8 annually. While this last scenario is highly implausible, it illustrates the extreme adoption that is required for the durable storage of biogenic carbon in US residential building frames to reach a level of decarbonization that contributes to a reduction in projected lowered Global Temperature Change (GTC) (i.e. net cooling) before 2100. Adoption rates across the non-BAU scenarios are indicative of prior adoption rates reported for renewable energy sources [31]. Table S3 reports the full set of parameters driving each scenario.
Third, the US baseline floor area projection was multiplied by the market adoption percentages in each scenario to project the final annual net new floor area for each framing system. The final step in the analysis was to integrate the DLCA outcomes reported for each framing system with the temporally changing market shares indicated for each adoption scenario. The DLCA outcome by scenario are reported in Section 3.2 below.
The goal of the analysis was to inform design decisions relative to the near-term climate impact of durable building materials. Consequentially, the principal limitation of the present study results from limiting the scope to an analysis boundary covering only LCA product stage modules (i.e. A1-A3). Still, the limited scope of the study adequately supports the stated goal. The exclusion of Modules A4 & A5 (transportation and construction) was intended to permit broader location applicability. Because the US has an extremely large land expanse, the climate impact of land transportation varies significantly, depending on distances between the factory gate and the final construction location. Similarly, the exclusion of Stage C isolates the focus on the upfront climate impacts. Recognizing that time is of the essence relative to climate change mitigation and that decisions impacting near-term climate change must be prioritized, this analysis ignores various EOL considerations. Additional limitations are discussed in Appendix A.

3. Results

3.1. Framing System-Level Results

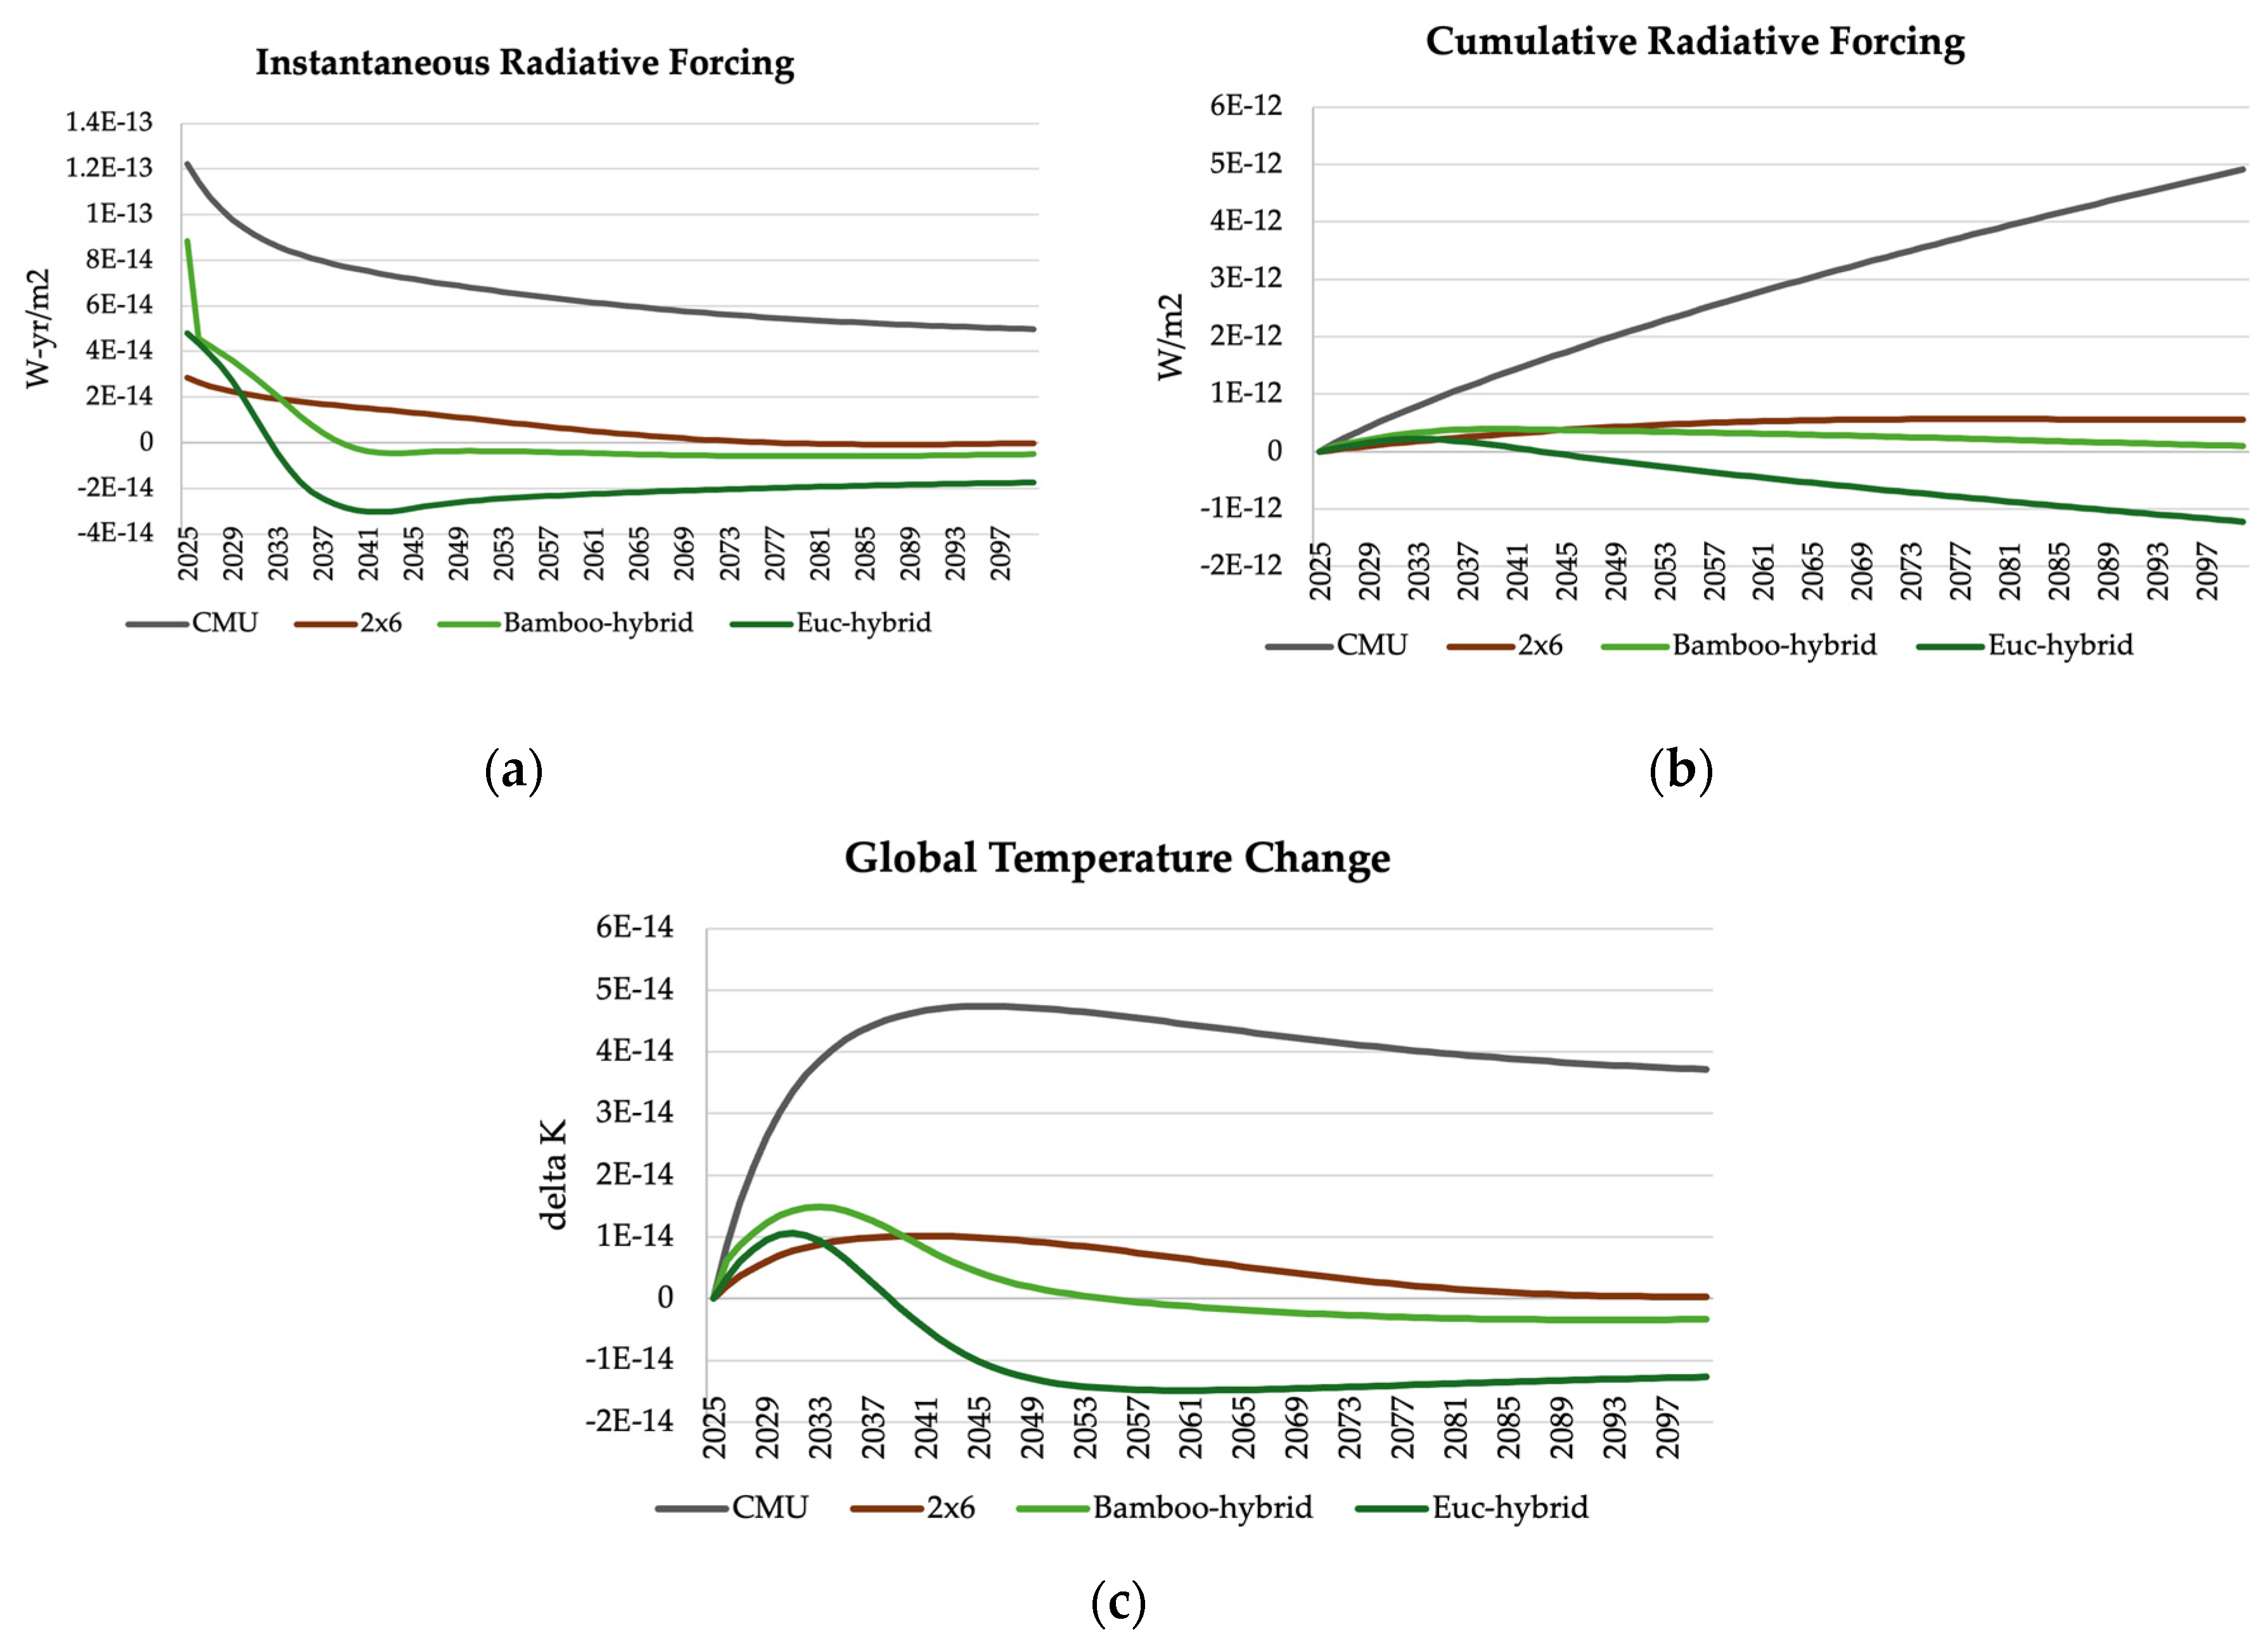
The climate impact of the four framing systems was projected using a dynamic LCA across three metrics and is shown in Figure 4: (1) Instantaneous Radiative Forcing (IRF), (2) Cumulative Radiative Forcing (CRF) and (3) Global Temperature Change (GTC).
Instantaneous Radiative Forcing (IRF) measures the amount of energy being re-radiated back into the atmosphere at any given point in time during the analysis period. The y-axis unit of measure is ’watts-per-square-meter-per-year’, which indicates the amount of solar infrared energy per unit-area of the world that is being trapped in the atmosphere due to the presence of GHGs. Positive values indicate that additional heat is being trapped in the atmosphere as a result of the GHG emissions from the framing system. Negative values, which occur only for the biogenic materials, indicate that heat is being removed from the atmosphere. All the lines trend downward due to the natural decay of greenhouse gases in the atmosphere over time due to their reaction with oceans, forests and soils which act as carbon sinks. The downward trend occurs for both extractive and biogenic framing systems. However, biogenic framing materials remove additional CO2 during regrowth, contributing further to the downward trend of the lines. After the IRF for the biogenic framing systems turns negative, the CO2 emitted in Year 0 is no longer in the atmosphere and additional heat trapping GHGs are now being removed.
Figure 4a shows that IRF for the extractive CMU framing system declines but does not approach zero. The CMU IRF cannot turn negative because its initial GHG emissions from manufacturing are never directly offset by any subsequent regrowth of biomass since they don’t have the subsequent removal of atmospheric GHGs that biogenic materials have. The IRF for the 2x6 biogenic framing system does approach zero but does not become negative because the amount of biogenic carbon storage is less than the A1-A3 emissions. In contrast, both the Euc-hybrid and bamboo-hybrid framing systems store more carbon than they emit, quickly turning negative in 2033 and 2039 respectively due to the fast growth of the biogenic fibers. This helpful climate change mitigation results from the fast re-growth of their biomass.
Cumulative Radiative Forcing (CRF) measures the total amount of radiative forcing (or energy trapped by the net addition of GHG emissions into to the atmosphere) since the beginning of the analysis period. While IRF shows the amount of radiative forcing at each single point in time over the analysis period, CRF sums those effects over the analysis period. As shown in Figure 4b, the CRF for the extractive framing system indicates that, as a result of the manufacturing of the CMU, additional heat it being trapped every year in the atmosphere through the end of the analysis period, 2100. In contrast, when the framing system incorporates biogenic fibers, the CRF levels off quickly and can decline significantly. While the slow growing, 2x6 framing system levels off quickly compared to the extractive system, only the two fast-growing systems actually decline. Once the decline begins, the net effect in that period is atmospheric cooling. When the remaining radiative forcing resulting from the upfront emissions is offset by the negative radiative forcing from biomass regrowth, the CRF will start to decline. Because the two fast growing biogenic framing systems recapture more atmospheric carbon during regrowth than is emitted in cradle-to-gate (substantial in the case of Euc-hybrid), the CRF for each of them turn negative. This indicates that in the year CRF starts to decline, the heat trapped in the atmosphere is less than the prior year. For the Euc-hybrid framing system, this occurs in 2044. The bamboo-hybrid framing system does eventually go below zero, but not until after the analysis period ends. This is because the net carbon storage of the bamboo-hybrid system is less than that of the Euc-hybrid framing system. The 2x6 framing system is close to zero because the biogenic components largely offset the non-biobased components, but they do not outweigh them, causing the line to remain slightly positive.
Figure 4c shows Global Temperature Change (GTC) results, which quantifies the climate change impact of products or systems in terms of resultant temperature change. It is an instantaneous metric showing the temperature change since the beginning of the analysis. A positive value indicates that the product has caused an increase in atmospheric temperature since leaving the manufacturing gate, while a negative value indicates the product has led to cooling. At the point when GTC turns from positive to negative, the product (i.e. the framing system) is no longer contributing to global warming and has started to contributing to global cooling. For the Euc-hybrid framing system, this occurs in 2039 and for the bamboo-hybrid framing system, it occurs in 2055.
In contrast to the above dynamic LCA, a static LCA conducted on the framing systems would provide a much simpler viewpoint. If the cradle-to-gate analysis considered a carbon emissions vs uptake balance, the total impact would be values in the Total Embodied Carbon column minus the values in the Total Biogenic Carbon columns in Table 1. This analysis would yield the following results: 65.5 kg CO2eq/m2 for CMU, 1.8 kg CO2eq/m2 for 2x6, -5 kg CO2eq/m2 for the bamboo-hybrid, and -29 kg CO2eq/m2 for the Euc-hybrid. The limitations of this approach compared to the dynamic LCA results are clearly apparent. First, no timing-related insights can be drawn from these results. The static LCA produces an incomplete projection of the climate impact at the end of the analysis period, but no visibility into what was occurring throughout the analysis period. The two fast-growing fiber-based framing systems are projected to end with negative values, but at what point in time does this happen? Second, the kg CO2eq unit of measure does not give any insight into climate-related targets set forth in the Paris Agreement, which are set in terms of global temperature change. One may surmise that a negative value is a good thing, but the translation to degrees of cooling is unclear.

3.2. Market Adoption Scenario Results

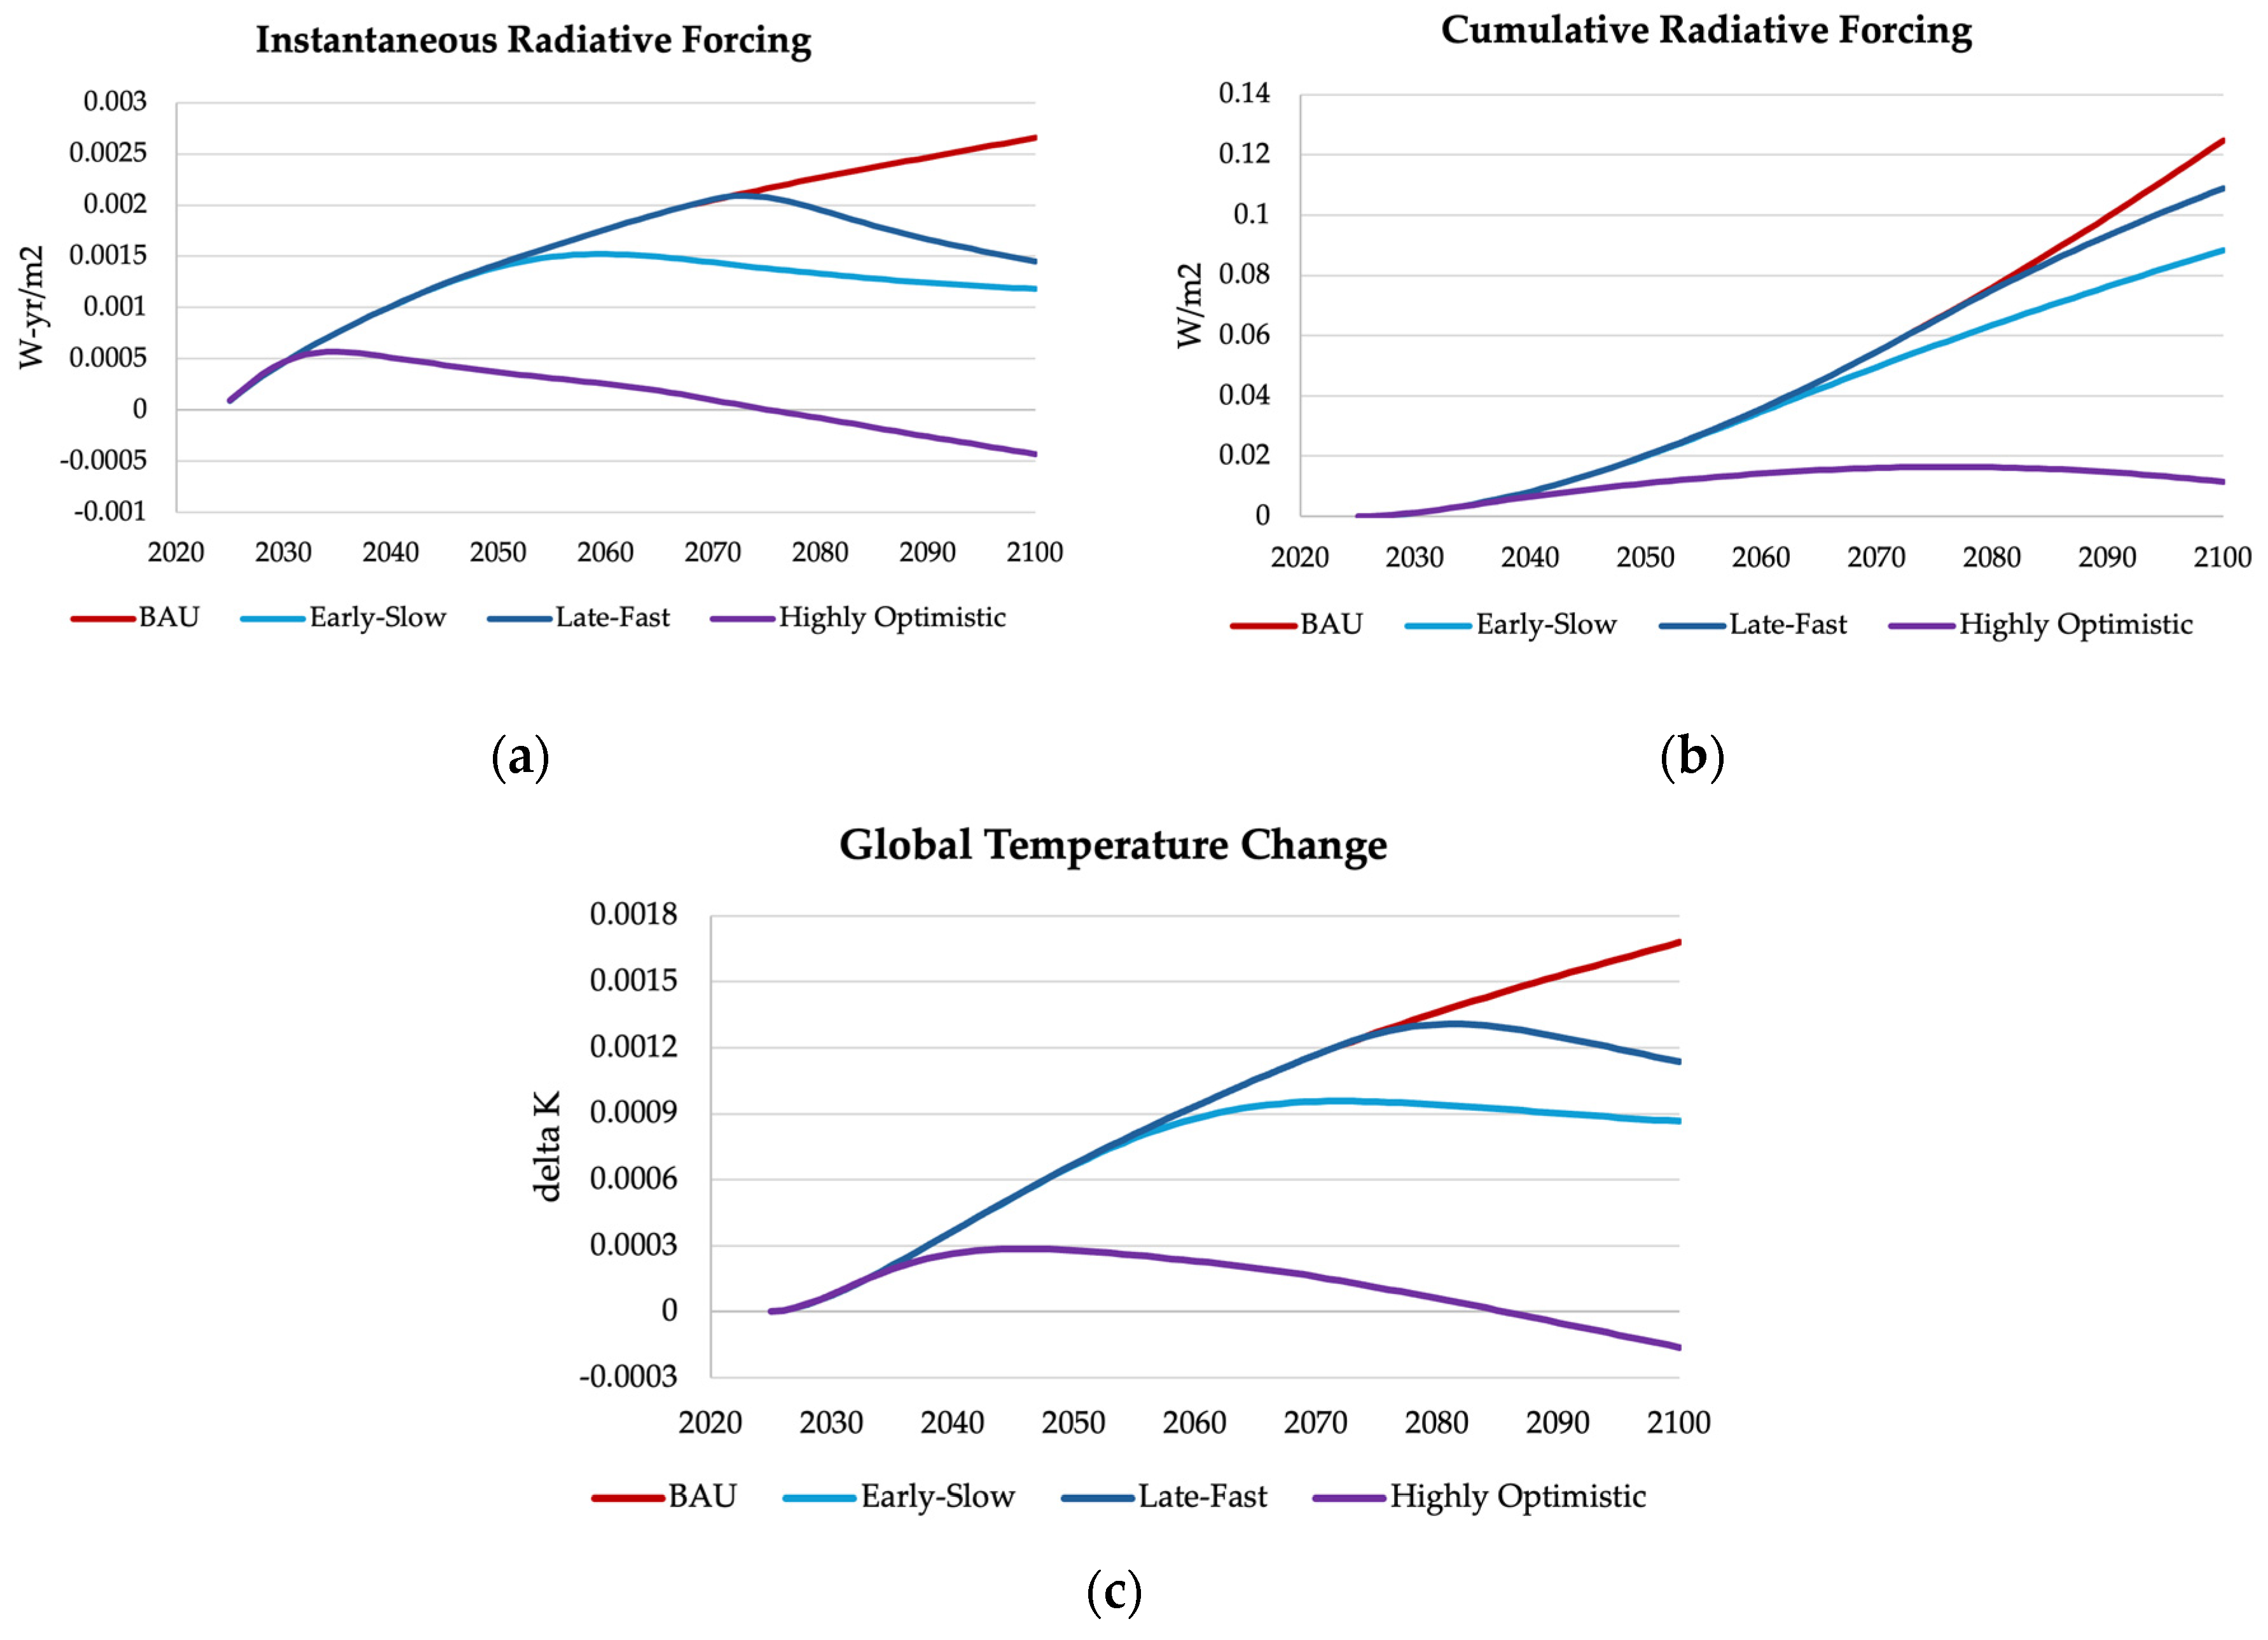
The climate impact of the four framing systems, expressed in IRF, CRF and GTC, was then scaled across the four adoption scenarios, as shown in Figure 5.
As expected, the business-as-usual scenario, without any adoption of fast-growing biogenic fiber, results in ever increasing IRF, CRF and GTC. In the Early-Slow scenario, IRF begins to decline in 2061; CRF continues to rise through 2100 but is visibly slower than for the BAU or Late-Fast scenarios; and GTC peaks in 2072, indicating that the biomass regrowth is now fully offsetting upfront emissions and starting to reverse the prior global temperature increases, recognizing that they remain well above the impact immediately following the manufacturing. In the Late-Fast scenario, IRF also continues to rise until 2073, 12 years after the Early-Slow scenario; CRF continues to rise to 2100 falling between the BAU and Early-Fast scenarios; and GTC peaks in 2082, 10 years after Early-Slow. In the Highly Optimistic scenario, where the two fast-growing biogenic framing systems (inconceivably) quickly and completely displace the two traditional systems, IRF peaks in 2035; CRF stops rising in 2076; and GTC peaks in 2046 to turn negative in 2086. This suggests that highly optimistic adoption scenarios, even if realized only in the future, can have a net cooling effect on the atmosphere fully reversing the upfront emission during the manufacturing of the structural frame.

4. Discussion

The results of this analysis are unequivocal, highlighting the magnitude of action required to decarbonize the built environment. Only immediate and extensive adoption of fast-growing, biogenic fibers into new US residential construction will lead to net-cooling by the end of the century. Moreover, static carbon accounting and the GWP metric are not sufficient for drawing this conclusion. If we are to adequately incentivize the adoption of building products that drive decarbonization, the reporting tools used to communicate their environmental impact (i.e. EPDs) must be changed. There is emerging consensus that building LCAs and biogenic carbon assessment that leverage dynamic approaches are better suited to drive informed decision. While DLCA can be a more effective tool to assess the impacts of biogenic carbon, we recognize their added complexity can present an obstacle in their widespread adoption. However, the imperative of the climate crisis necessitates better carbon assessment techniques to ensure sustainable building practices.
Bamboo has received much attention as a promising regenerative biogenic fiber due to its annual regeneration of each culm cut. While this annual regrowth of a harvested culm is a reality for timber bamboo, there are still three additional timing considerations that lead timber bamboo to underperform fast-growing wood species, like Eucalyptus. First, only culms that are generally 3 years old or more are typically harvested. Second, while timber bamboo is not clear-cut like many woods, when harvesting timber bamboo, generally only 20-30% of timber bamboo is harvested each year. Together these two factors result in an adjusted rotation cycle of 5 years, assuming 20% harvest rates. While this is still an extremely short rotation cycle, it is not the one-year rotation often perceived. Third, when establishing a new plantation of timber bamboo, the plantation must still grow for 7+ years for each clump or stand to reach the maturity that annually can produce the full-sized culms that can then be harvested. When all three of these factors are considered, the average rotation time for timber bamboo sits in the range of certain highly cultivated tree species harvested principally for sawn logs. In pursuit of carbon storing building materials, fast-growing, non-tree products are frequently being introduced, including hemp and mycelia. However, they currently do not have the load-bearing capacity to be considered a full structural substitute for wood and bamboo [32,33]. From the analysis presented herein, we have shown that fast growing timber species can be helpful drivers of building decarbonization. Here, we have considered timber bamboo, Eucalyptus, and Pinus from Southern Brazil. Other fast growing timber species merit mention as candidates for additional analysis, including Acacia from SE Asia.
While a global residential market analysis is needed, the analysis above was restricted to the US residential building market because US data about material stock and flows and market shares are readily available and the two example fast growing biogenic framing systems are currently only offered in the US market. Supporting the sensibility of this US-based analysis, floor area forecasts by comparing various global regions through 2050) show the US is a good proxy for global building floor demand given the similarity of the trend lines/growth rates, albeit with differing magnitudes [34]. Still, it is likely that such a global market analysis will only accentuate the findings here, for two reasons. First, almost all other markets rely far more intensely, if not exclusively, on higher embodied carbon extractive building materials. Thus, market share adoption of biogenic materials away from the prevailing high-embodied carbon building systems will produce a far greater relative climate benefit than seen in the above analysis. Second, the US represents only a fraction of the total global residential building stock, with that percent declining over time given the higher building stock growth rates in the developing world [35]. Thus, the impact of adoption fast-growing biogenic building materials will be materially larger.

5. Conclusions

Dynamic LCA methodology, which incorporates regrowth timing of biogenic fibers, was used to project the climate impact from market-wide adoption of fast-growing biogenic materials in durable structural frames in the US residential building stock for four scenarios with varying adoption rates from 2025-2100. Four framing systems were evaluated: one extractive (CMU), one slow-growing biogenic (2x6) and two fast-growing biogenic (bamboo-hybrid and Euc-hybrid). The results indicate that in both of the intermediate adoption scenarios (Early-Fast and Late-Slow), strong adoption of fast-growing biogenic framing systems can bend the Global Temperature Change outcome projection downward, suggesting that climate benefits are available through the adoption of fast-growing biogenic framing systems. However modest this might appear, given the extremely large unfilled global residential demand, even modest mitigation ameliorates. Unfortunately, to produce a net reduction in the Global Temperature Change outcome (i.e. net cooling) requires a nearly immediate and complete adoption of the two fast growing biogenic framing systems. The analysis projects that, under a dynamic, forward-looking accounting approach, fast growing biogenic framing systems can contribute to net-cooling by 2086. However unrealistic this most promising scenario is, the analysis here, taken as a whole, provides valuable directional guidance during building design. It is possible to improve the upfront climate impact of residential building by incorporating fast growing biogenic framing systems. Unsurprisingly, the sooner the adoption and the greater the adoption, the better the climate impact from choosing fast growing biogenic materials.
Importantly, current (static) carbon accounting practices will not reflect this net-cooling potential. Specifically, carbon accounting and reporting standards when addressing biogenic materials, as in ISO 21930 and EN15804, will need to be amended to more accurately reflect the physical reality of the temporal, and thus dynamic, nature of climate impacts. Only when such amendments are made will building owners, designers, developers and builders have the tools they need for climate-informed decision making.

Supplementary Materials

The following supporting information can be downloaded at the website of this paper posted on Preprints.org, Table S1: Material inventory for the four framing systems; Table S2: Summary of A1-A3 GHG emissions and biogenic carbon uptake per material; Table S3: Summary scenario modeling parameters.

Author Contributions

Conceptualization, K.C. and H.H.; methodology, K.C. and J.A.; software, J.A.; validation, J.A; formal analysis, K.C. and J.A.; investigation, K.C. and J.A.; resources, K.C. and J.A.; data curation, K.C. and J.A.; writing—original draft preparation, K.C. and H.H.; writing—review and editing, K.C., H.H. and J.A.; visualization, K.C.; supervision, H.H.; project administration, K.C.. All authors have read and agreed to the published version of the manuscript.

Funding

This research received no external funding.

Institutional Review Board Statement

Not applicable.

Informed Consent Statement

Not applicable.

Data Availability Statement

The original data and code presented in the study are openly available in a GitHub repository: https://github.com/jayarehart/mfa-dlca-us-fastfibers.

Acknowledgments

Not applicable.

Conflicts of Interest

The authors are affiliated with the building products manufacturer whose products’ data were used in the analysis. However, there is no conflict of interest in presenting the results to promote or favor these products. All data used in this study, including the manufacturer’s product data, are either publicly available or have been independently tested by third-party organizations. The analysis was conducted objectively, relying solely on verifiable data, to ensure transparency and accuracy without any influence from commercial interests.

Appendix A

Below are additional limitations to consider:
  • The relationship between floor space demand, population and GDP is assumed to remain throughout the entire analysis period. This correlation relies on historical data and does not consider the assumed convergences of resource consumption across regions.
  • Emissions coefficients for present day remain unchanged throughout the entire analysis period. This is likely a conservative estimate for the later years given electrical grid decarbonization, changes in fuel sources, and manufacturing efficiencies are likely to occur in the future.
  • The scope of this study is limited to only the residential building stock. While the low-rise residential building sector (including single and multifamily housing) is the largest segment of the buildings construction market [36], there are other building typologies that would extend this analysis further. Given that non-residential building types rely more heavily on extracted materials, extending the analysis to other building types would most likely intensify the projected beneficial climate impact of the biogenic materials specifically.
  • Two different framing systems were used to represent the entirety of fast-growing fiber framing alternatives. In reality, there are a multitude of options available in the market that leverage different fibers and have different product-level carbon footprints. As a result, this analysis indicates the potential impact of short rotation-based solutions, generally.
  • The definition of ‘residential’ in this analysis incapsulates multiple building types, including single-family dwellings, multi-family dwellings, temporary lodging like hotels, institutional dormitories, and nursing homes. The functional unit specified for this analysis was a single-family residence, meaning its applicability towards these additional building typologies is limited. However, the materials used within the four framing systems can also be used in multistory applications. Framing System 1 can be designed to have load capacities sufficient for high-rise buildings and Framing System 3 exhibits load capacities that reach at least eight stories. Cross-laminated timber (CLT) in particular is specifiable in buildings up to 18 stories [37], and each of the biogenic fibers represented in Framing Systems 2-4 can be incorporated into CLT with likely similar relative climate impacts.

References

  1. United Nations Environment Programme (2024). Global Status Report for Buildings and Construction: Beyond foundations: Mainstreaming sustainable solutions to cut emissions from the buildings sector. Nairobi. [CrossRef]
  2. United Nations Environment Programme, & Yale Center for Ecosystems + Architecture. (2023). Building Materials and the Climate: Constructing a New Future. Available online: https://www.unep.org/resources/report/building-materials-and-climate-constructing-new-future.
  3. Pittau, F., Krause, F., Lumia, G., & Habert, G. (2018). Fast-growing bio-based materials as an opportunity for storing carbon in exterior walls. Building and Environment, 129, 117-129. [CrossRef]
  4. Hawkins, W., Cooper, S., Allen, S., Roynon, J., & Ibell, T. (2021). Embodied carbon assessment using a dynamic climate model: Case-study comparison of a concrete, steel and timber building structure. Structures, 33, 90-98. [CrossRef]
  5. Göswein, V., Arehart, J., Phan-huy, C., Pomponi, F., & Habert, G. (2022). Barriers and opportunities of fast-growing biobased material use in buildings. Buildings and Cities, 3(1), 745–755. [CrossRef]
  6. Pittau, F., Lumia, G., Heeren, N., Iannaccone, G., & Habert, G. (2019). Retrofit as a carbon sink: The carbon storage potentials of the EU housing stock. Journal of Cleaner Production, 214, 365-376. [CrossRef]
  7. Tellnes, L. G. F., Ganne-Chedeville, C., Dias, A., Dolezal, F., Hill, C., & Zea Escamilla, E. (2017). Comparative assessment for biogenic carbon accounting methods in carbon footprint of products: A review study for construction materials based on forest products. iForest, 10, 815–823. [CrossRef]
  8. Hoxha, E., et al. (2020). Biogenic carbon in buildings: A critical overview of LCA methods. Buildings and Cities, 1(1), 504–524. [CrossRef]
  9. Andersen, C. E., Rasmussen, F. N., Habert, G., & Birgisdóttir, H. (2021). Embodied GHG emissions of wooden buildings—Challenges of biogenic carbon accounting in current LCA methods. Frontiers in Built Environment, 7, 729096. [CrossRef]
  10. Levasseur, A., Lesage, P., Margni, M., Deschênes, L., & Samson, R. (2010). Considering time in LCA: Dynamic LCA and its application to global warming impact assessments. Environmental Science & Technology, 44(8), 3169–3174. [CrossRef]
  11. Breton, C., Blanchet, P., Amor, B., Beauregard, R., & Chang, W.-S. (2018). Assessing the climate change impacts of biogenic carbon in buildings: A critical review of two main dynamic approaches. Sustainability, 10(6), 2020. [CrossRef]
  12. Zieger, V., Lecompte, T., & Hellouin de Menibus, A. (2020). Impact of GHGs temporal dynamics on the GWP assessment of building materials: A case study on bio-based and non-bio-based walls. Building and Environment, 185, 107210. [CrossRef]
  13. Forster, P., Storelvmo, T., Armour, K., Collins, W., Dufresne, J.-L., Frame, D., Lunt, D. J., Mauritsen, T., Palmer, M. D., Watanabe, M., Wild, M., & Zhang, H. (2021). The Earth’s energy budget, climate feedbacks, and climate sensitivity. In V. Masson-Delmotte, P. Zhai, A. Pirani, S. L. Connors, C. Péan, S. Berger, N. Caud, Y. Chen, L. Goldfarb, M. I. Gomis, M. Huang, K. Leitzell, E. Lonnoy, J. B. R. Matthews, T. K. Maycock, T. Waterfield, O. Yelekçi, R. Yu, & B. Zhou (Eds.), Climate change 2021: The physical science basis. Contribution of Working Group I to the Sixth Assessment Report of the Intergovernmental Panel on Climate Change (pp. 923–1054). Cambridge University Press. [CrossRef]
  14. Brandão, M., Kirschbaum, M. U. F., Cowie, A. L., & Hjuler, S. V. (2018). Quantifying the climate change effects of bioenergy systems: Comparison of 15 impact assessment methods. GCB Bioenergy. [CrossRef]
  15. Levasseur, A., Lesage, P., Margni, M., & Samson, R. (2013). Biogenic carbon and temporary storage addressed with dynamic life cycle assessment. Journal of Industrial Ecology, 17(1), 117–128. [CrossRef]
  16. International Organization for Standardization. (2007). ISO 21930:2007: Sustainability in building construction—Environmental declaration of building products (§5.1). International Organization for Standardization.
  17. European Committee for Standardization (CEN). (2019). Sustainability of construction works: Environmental product declarations—Core rules for the product category of construction products (EN 15804:2012+A2).
  18. Armstrong McKay, D. I., et al. (2022). Exceeding 1.5°C global warming could trigger multiple climate tipping points. Science, 377, eabn7950. [CrossRef]
  19. Silva, A., de Brito, J., Thomsen, A., Straub, A., Prieto, A. J., & Lacasse, M. A. (2022). Causal effects between criteria that establish the end of service life of buildings and components. Buildings, 12(2), 88. [CrossRef]
  20. Chau, C. K., Leung, T. M., & Ng, W. Y. (2015). A review on life cycle assessment, life cycle energy assessment, and life cycle carbon emissions assessment on buildings. Applied Energy, 143, 395–413. [CrossRef]
  21. Hua, L., Chen, L., Antov, P., Kristak, L., & Tahir, P. (2022). Engineering wood products from Eucalyptus spp. Advances in Materials Science and Engineering. [CrossRef]
  22. Huang, Y., & Fei, B. (2017). Comparison of the mechanical characteristics of fibers and cell walls from moso bamboo and wood. BioResources, 12(4), 8230–8239.
  23. Cooper, S. J. G., Green, R., Hattam, L., Röder, M., Welfle, A., & McManus, M. (2020). Exploring temporal aspects of climate-change effects due to bioenergy. Biomass and Bioenergy, 142, 105778. [CrossRef]
  24. Arehart, J. H., Pomponi, F., D’Amico, B., & Srubar, W. V. (2022). Framing material demand and associated embodied carbon emissions of the United States building stock: 2020–2100. Resources, Conservation and Recycling, 186, 106583. [CrossRef]
  25. Peñaloza, D., Erlandsson, M., & Falk, A. (2016). Exploring the climate impact effects of increased use of bio-based materials in buildings. Construction and Building Materials, 125, 219–226. [CrossRef]
  26. Pflieger, R., Reichle, D., & Shackford, J. (2004). Housing facts, figures & trends 2004. Washington, D.C.: National Association of Home Builders.
  27. Waldman, B., Hyatt, A., Carlisle, S., Palmeri, J., & Simonen, K. (2023). 2023 Carbon Leadership Forum North American Material Baselines (version 2). Carbon Leadership Forum, University of Washington. Seattle, WA. Available online: http://hdl.handle.net/1773/49965.
  28. Cherubini, F., Strømman, A. H., & Hertwich, E. (2011). Effects of boreal forest management practices on the climate impact of CO2 emissions from bioenergy. Ecological Modelling, 223(1), 59–66. [CrossRef]
  29. Sartori, I., Sandberg, N. H., & Brattebø, H. (2016). Dynamic building stock modelling: General algorithm and exemplification for Norway. Energy and Buildings, 132, 13–25. [CrossRef]
  30. O’Neill, B. C., Kriegler, E., Ebi, K. L., Kemp-Benedict, E., Riahi, K., Rothman, D. S., van Ruijven, B. J., van Vuuren, D. P., Birkmann, J., Kok, K., Levy, M., & Solecki, W. (2017). The roads ahead: Narratives for shared socioeconomic pathways describing world futures in the 21st century. Global Environmental Change, 42, 169–180. [CrossRef]
  31. Cherp, A., Vinichenko, V., Tosun, J., et al. (2021). National growth dynamics of wind and solar power compared to the growth required for global climate targets. Nature Energy, 6, 742–754. [CrossRef]
  32. Yadav, M., & Saini, A. (2022). Opportunities & challenges of hempcrete as a building material for construction: An overview. Materials Today: Proceedings, 65(Part 2), 2021–2028. [CrossRef]
  33. Bitting, S., Derme, T., Lee, J., Van Mele, T., Dillenburger, B., & Block, P. (2022). Challenges and opportunities in scaling up architectural applications of mycelium-based materials with digital fabrication. Biomimetics (Basel), 7(2), 44. [CrossRef]
  34. Güneralp, B., Zhou, Y., Ürge-Vorsatz, D., Gupta, M., Yu, S., Patel, P. L., Fragkias, M., Li, X., & Seto, K. C. Global scenarios of urban density and its impacts on building energy use through 2050. Proceedings of the National Academy of Sciences 2017, 114(34), 8945–8950. [CrossRef]
  35. Zhang, S., Ma, M., Zhou, N., Yan, J., Feng, W., Yan, R., You, K., Zhang, J., & Ke, J. (2024). Estimation of global building stocks by 2070: Unlocking renovation potential. Nexus, 1(3), 100019. [CrossRef]
  36. The Business Research Company. (2023). Global construction market report and strategies. Available online: https://www.thebusinessresearchcompany.com/report/construction-market.
  37. International Code Council, Inc. (2020). 2021 International Building Code (1st ed., 1st printing October 2020, 2nd printing September 2021). Washington, D.C.: International Code Council, Inc.
  38. American Galvanizers Association. (2022). Environmental Product Declaration: Hot-Dip Galvanized Steel After Fabrication. American Galvanizers Association. Available online: https://galvanizeit.org/uploads/default/2022-EPD-AGA-Hot-Dip-Galvanized-Steel-After-Fabrication.pdf.
  39. Building Transparency. (n.d.). Embodied Carbon in Construction Calculator (EC3) [Software]. Building Transparency. Available online: https://buildingtransparency.org/ec3.
  40. Boral. (2020). Environmental Product Declaration: Lime and Limestone Products. Boral. Available online: https://www.boral.com.au/sites/default/files/media/field_document/Lime-Boral-Lime-and-Limestone-Products-EPD.pdf.
  41. Vulcan Materials Company. (2020). Environmental Product Declaration: Durbin Sand & Gravel. Vulcan Materials Company. Available online: https://pcr-epd.s3.us-east-2.amazonaws.com/537.EPD_for_VMC_Durbin_Sand_Gravel.pdf.
  42. Athena Sustainable Materials Institute. (n.d.). Athena Impact Estimator for Buildings [Software]. Athena Sustainable Materials Institute. Available online: https://www.athenasmi.org.
  43. BamCore. (2023). Environmental Product Declaration: BamCore Prime Wall System. BamCore. Available online: https://www.bamcore.com/_files/ugd/77318d_558f1c606e124e6b96a2b8a59e3f22c0.pdf.
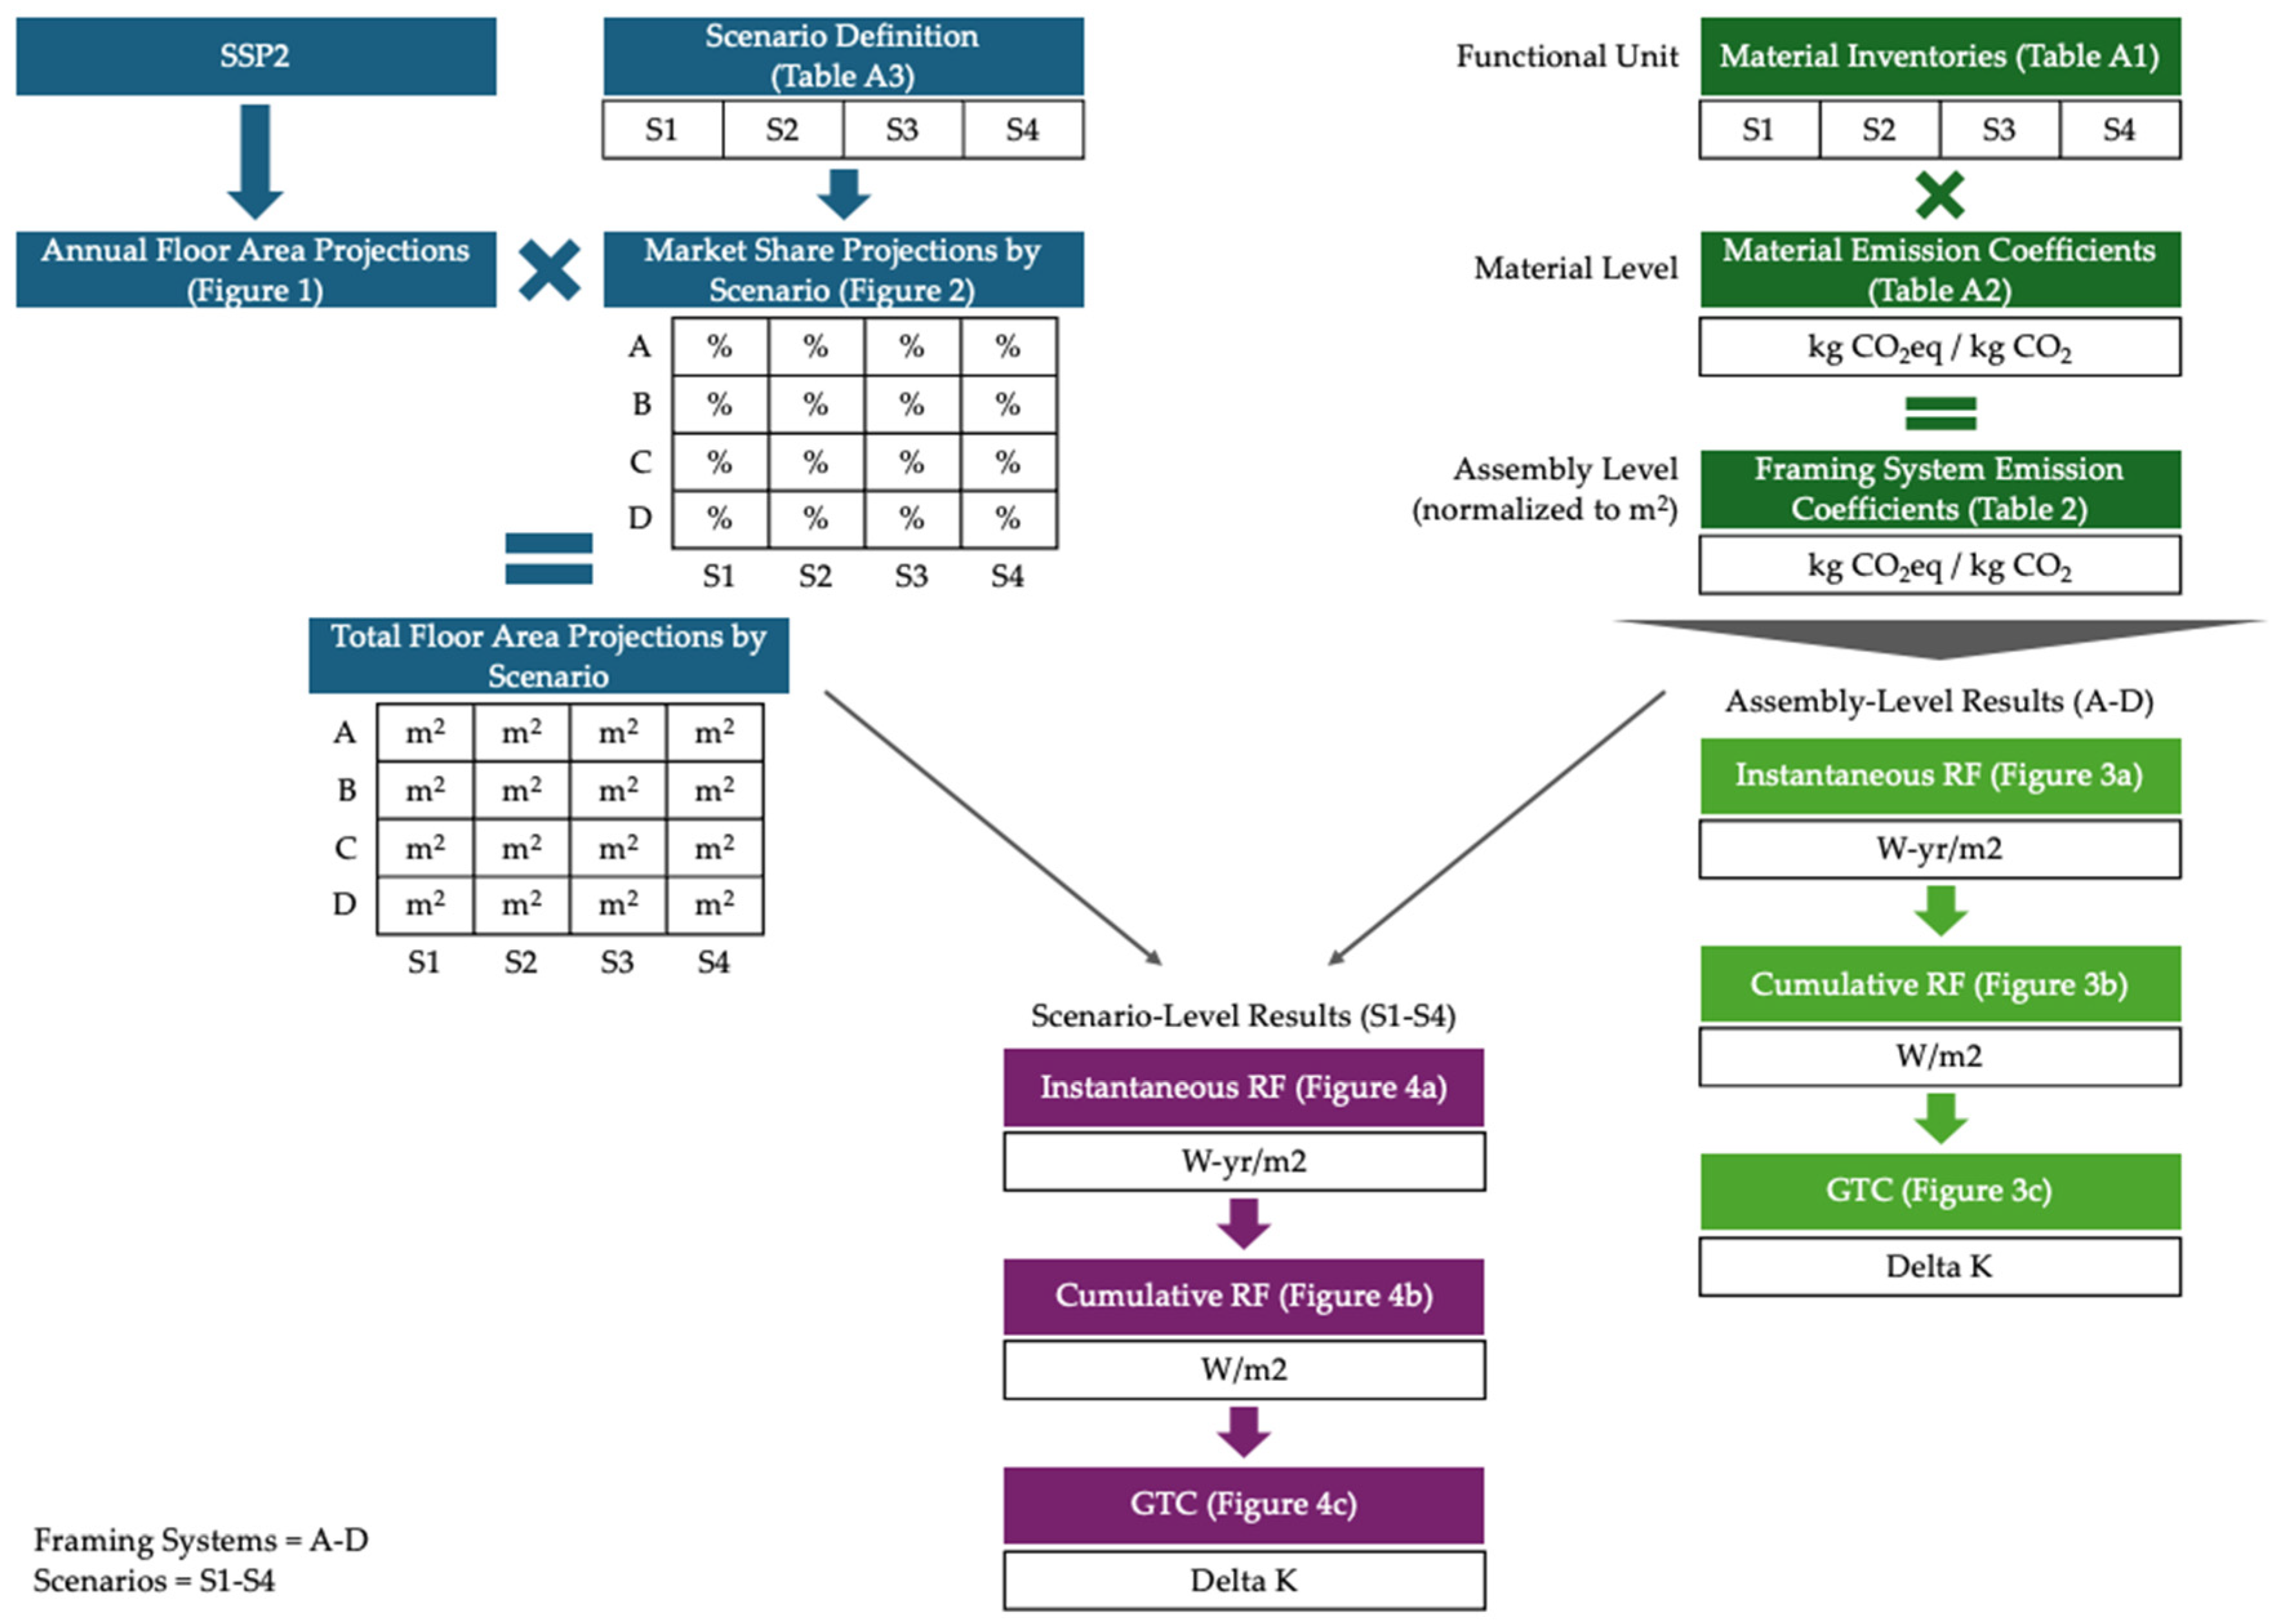
Figure 1. Flow diagram of analysis approach.
Preprints 142513 g001
Figure 2. Projected net annual inflows of residential U.S. floor area in the units of million m2 between the years of 2025 and 2100.
Preprints 142513 g002
Figure 3. Market share of four framing systems by adoption scenario.
Preprints 142513 g003
Figure 4. (a) Instantaneous radiative forcing, (b) cumulative radiative forcing, and (c) global temperature change per square meter of residential floor space supported by each framing system.
Preprints 142513 g004
Figure 5. (a) Instantaneous radiative forcing, (b) cumulative radiative forcing, and (c) global temperature of the four framing systems in the US between 2025 and 2100 for the four adoption scenarios considered.
Preprints 142513 g005
Table 1. Summary of the four framing systems analyzed.
Identifier Name Material Category
Framing System-A CMU Extractive
Framing System-B 2x6 Biogenic – Slow Growing
Framing System-C Bamboo-hybrid Biogenic – Fast Growing
Framing System-D Euc-hybrid Biogenic – Fast Growing
Table 2. Summary of the emissions of each framing system, normalized by unit floor space.
Framing System Biogenic Carbon
– US Wood
(kg CO2/m2)
Biogenic Carbon
– Bamboo
(kg CO2/m2)
Biogenic Carbon
Eucalyptus
(kg CO2/m2)
Biogenic Carbon – BR Pine
(kg CO2/m2)
Total Biogenic Carbon
(kg CO2/m2)
Total Embodied Carbon
(kg CO2eq/m2)
CMU 4.3 0 0 0 4.3 69.8
2x6 14.4 0 0 0 14.4 16.2
Bamboo-hybrid 6.7 20.6 0 28.1 55.4 50.4
Euc-
hybrid
6.7 0 17.9 31.8 56.4 27.4
Table 3. Summary of the four market adoption scenarios.
Identifier Name Growth Rate Starting Year of Growth Market Share of Fast-Growing Fibers in 2100
Scenario 1 Business as Usual (BAU) 0 n/a 0%
Scenario 2 Early-Slow 0.3 2029 61%
Scenario 3 Late-Fast 0.8 2062 68%
Scenario 4 Highly Optimistic 0.8 2025 100%
Disclaimer/Publisher’s Note: The statements, opinions and data contained in all publications are solely those of the individual author(s) and contributor(s) and not of MDPI and/or the editor(s). MDPI and/or the editor(s) disclaim responsibility for any injury to people or property resulting from any ideas, methods, instructions or products referred to in the content.
Copyright: This open access article is published under a Creative Commons CC BY 4.0 license, which permit the free download, distribution, and reuse, provided that the author and preprint are cited in any reuse.
Prerpints.org logo

Preprints.org is a free preprint server supported by MDPI in Basel, Switzerland.

Subscribe

© 2024 MDPI (Basel, Switzerland) unless otherwise stated