
Submitted:
11 December 2024
Posted:
12 December 2024
You are already at the latest version
Abstract
Sicily, an Italian region in the south of Italy, is candidate to become an energy "hub" in the Mediterranean in the coming years. Its geographical location, between the African continent and Europe, makes it a crucial hub for the distribution of electricity flows. The region has a high potential for exploiting renewable energy sources. Inspired by the Australian “Renewable Energy Zones” model, identifying existing Renewable Energy Zones (REZs) and properly designing future REZs on the territory will simplify and enhance the operation of the grid.A very effective tool in managing REZs is Dynamic Thermal Rating (DTR) technology. This technology allows dynamic rating on the high voltage transmission system, ensuring the maximum allowable current is transported while preventing the annealing of the electrical conductor and adhering to all necessary safety parameters.In the work carried out in collaboration with Terna S.p.A (Italian Transmission System Operator), the goal was to assess the application of this technology on the Sicilian electricity grid, to reduce potential network congestion and system inefficiencies.The results obtained demonstrate the significant potential of Dynamic Thermal Rating in Sicily. These devices would allow a substantial increase in the current flow on electrical lines without violating safety limits.
Keywords:
Dynamic Thermal Rating
; Sicily
; Electrical Transmission system
; Wind Power Curtailment
; Critical Span
; Grid congestion
1. Introduction
In order to facilitate the understanding of the work carried out, it is necessary to introduce the current state of the Sicilian electricity grid, integrated into broader contexts such as the Italian and international ones. This is currently characterized by three voltage levels: 380 kV, 220 kV, 150 kV. The first two voltage levels perform the function of transmission, while the 150 kV grid performs the function of so-called sub-transmission of electrical energy. The 150 kV voltage grid is the largest in the area and constitutes an energy connection between eastern and western Sicily [1].
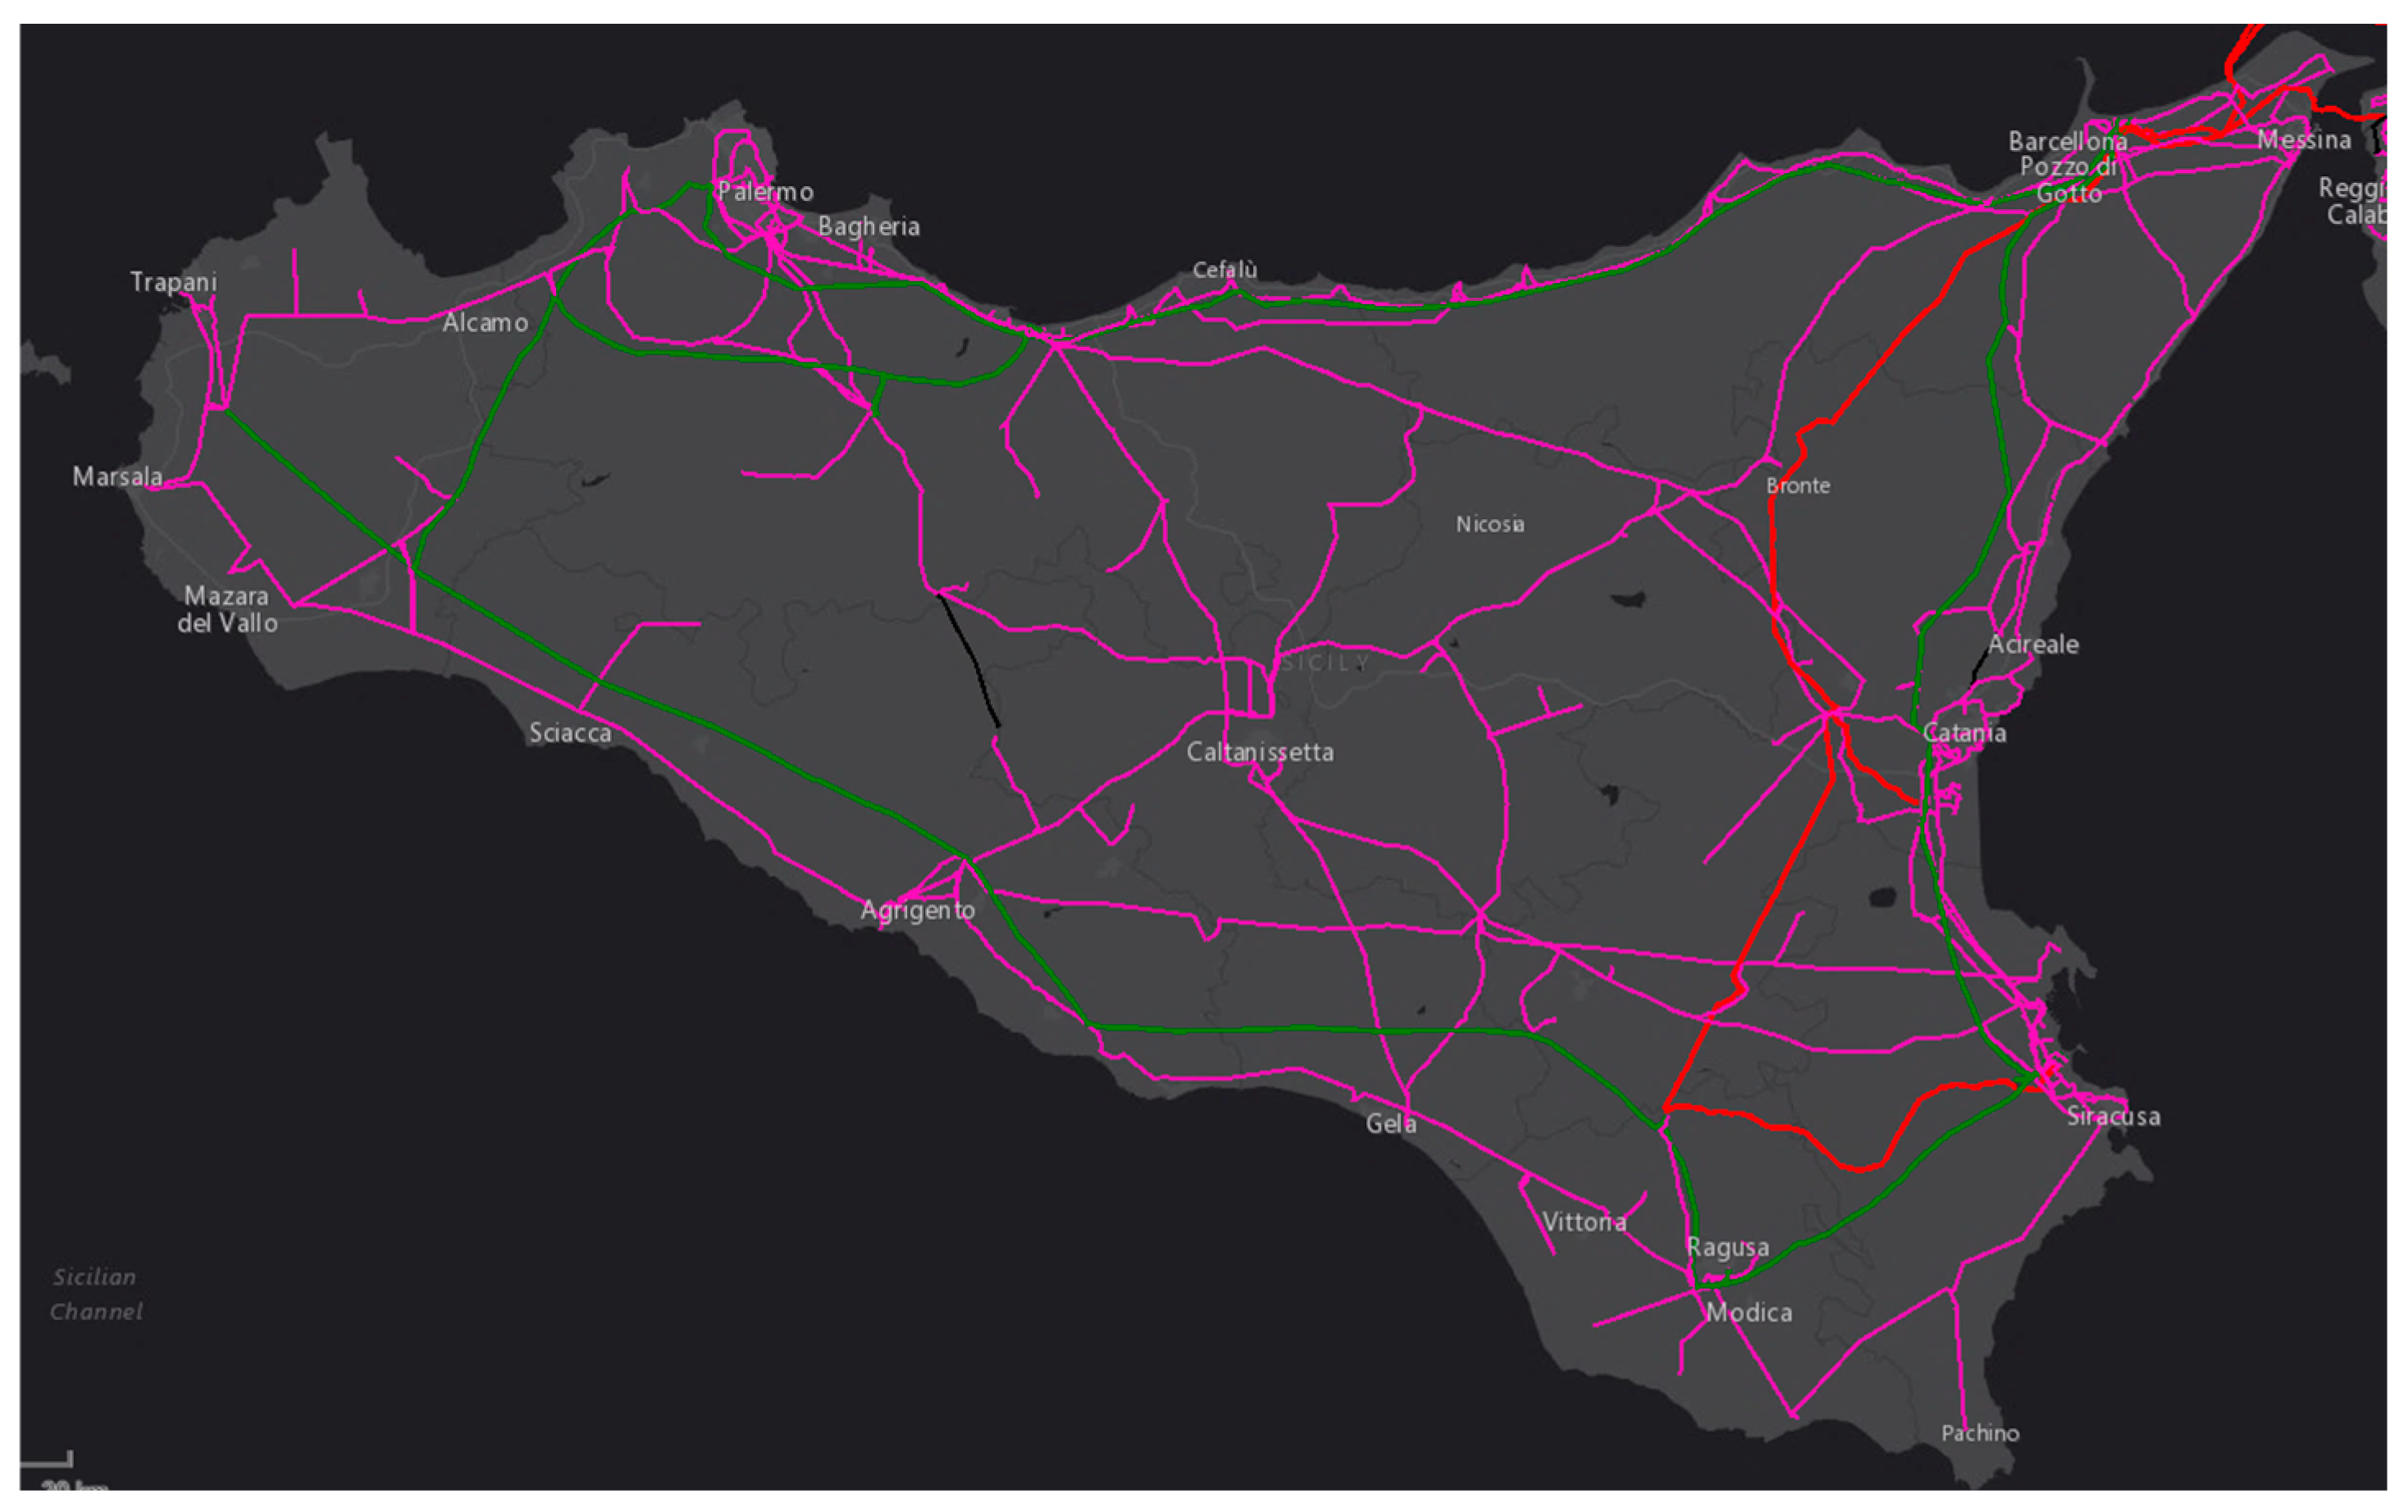
Figure 1.
Electrical Transmission system of Sicily, Italy (Sisnet, software owned by Terna).
The traditional paradigm according to which power flows were typically stable over time and unidirectional (i.e. from traditional power plants to consumers), has now been almost totally overturned as the electricity transmission grid must manage bidirectional power flows characterized by strong variability over time [1].
The exponential increase in energy production from photovoltaic and wind power plants, together with the natural aging of some transmission lines, have made it necessary to re-engineer the management of the Sicilian electricity system. Six of the nine provinces of the Sicily region are susceptible to high congestion or overloads in the presence of high generation from Renewable Energy Sources (RES) [1]. Given this condition, some areas have been identified and considered critical, two others have been declared as medium critical (Catania and Palermo) and only one province (Messina) has been declared an area with low criticality [1].
It is useful to analyze the distribution of energy production from renewable and traditional sources throughout the territory, as well as the electricity loads that characterize the region. Electricity is mainly produced by traditional thermoelectric power plants concentrated in the South-East area and by numerous RES plants, mainly wind farms, located in the western area [1].
It should be noted that the distribution of installed wind power over the territory is not homogeneous as 50% is located only in the provinces of Trapani and Palermo, located in the western area of Sicily. This heterogeneity depends mainly on the different wind conditions on the western and eastern slopes of the region [2].
If we also consider the production of electricity from traditional sources, about 60% of the total energy is produced in eastern Sicily and this is due to the greater presence of industrial poles in the eastern provinces compared to the western ones [2].
Energy demand is also different on the western and eastern slopes: on the western side the most energy-intensive sectors are the domestic and service ones, while in the east it is the industrial sector that requires more energy. The main reasons are the greater industrialization of the Catania area on the one hand, and the greater population of Palermo on the other [1].
It can be observed that the most energy-intensive provinces are Catania, Syracuse and Palermo [3].
From these considerations it is possible to say that the electricity load of Sicily is not evenly distributed, but is very unbalanced, as is production: this is therefore the main peculiarity of the current Sicilian transmission network.
In light of the considerations made so far, there are several challenges that will have to be faced in the coming years [4,5]:
- increase in grid congestion due to inconsistent distribution of RES plants with respect to consumption;
- progressive decrease in resources for voltage regulation, which leads to significant variations in the voltage waveform following a disturbance on the network, leading to a reduction in the degree of robustness of the network;
- Progressive reduction of regulating energy, caused by the replacement of traditional rotating mass generators with inverter-based systems. The increase in "inverter based" generation leads to a reduction in the inertial response of the electrical system, and consequently in the stability of the frequency, in the face of abrupt changes in the load; an answer to date provided by synchronous generators, and related mechanically coupled turbines, which exploit the stored kinetic energy; moreover, the electronics of inverters provide a short-circuit current much lower than that of large thermoelectric power plants, compromising the correct intervention of protections and automatisms in terms of both timeliness and selectivity;
- Management of extreme weather events, responsible for interruptions and reductions in the electricity transmission service.
To solve these critical issues in the grid, numerous interventions have already been launched to improve the electricity system and have already been approved in the Development [1,6]. For example, the Tyrrhenian Link will make it possible to increase electricity connections between Sicily, Sardinia and the rest of the peninsula. The TUN-ITA link will create a very important electricity link between Africa and Europe. These interventions will not only solve the current critical issues of the electricity system but will be essential to prepare the region for the development scenarios expected in the coming years. This development path is in line with the Fit-For-55 (FF55) scenario, a single policy scenario to 2030, which aims at the European objectives of reducing emissions by 55% thanks to a push towards electrification and a significant increase in renewable energy sources [7].
The significant development of energy infrastructure and electricity transmission infrastructure will have to allow the integration of the new RES plants envisaged. From 2018 to 2022, in fact, the requests for connection to the grid of RES plants in Sicily have grown exponentially and the expected future scenarios indicate a further increase in requests for connection of RES plants [4].
In the case of Sicily, a study conducted by the University of Palermo in collaboration with Terna S.p.A. states that by 2030 the power lines and transformers currently installed will be overloaded by an average of more than 70% of their capacity given the rapid increase in new connection requests. The upgrade of the grid to 400 kV must also be related to targeted local interventions that would have a great impact on the resolution of congestions [5]. The connection between Sicily and the other regions of Italy plays a fundamental role during the hours when energy production is at its highest and storage systems are saturated. For this reason, interventions such as that of the Tyrrhenian Link will be extremely important.
2. State of the Art: Renewable Energy Zones (REZ)
To make the grid capable of supporting the planned development scenarios [4], the creation and optimization of the so-called "Renewable Energy Zones" in the area are necessary. A Renewable Energy Zone is a geographical area connected to the electricity grid on the territory, which allows the profitable and cost-effective production of renewable energy [8].
The United States Agency for International Development (USAID) proposes a comprehensive methodology for the development of a REZ in six operational phases: process design and vision statement, renewable energy resource assessment, candidate zones selection, transmission options development, final transmission plan design, transmission system upgrade [8].
Among the first countries to explicitly use the renewable energy zones approach is Australia. Australia possesses some of the world’s most abundant renewable energy resources, but the current network capacity to connect these high-potential areas is limited. As highlighted in the Australian Energy Market Operator's (AEMO) Integrated System Plan, establishing Renewable Energy Zones (REZs) will be essential to harness these robust resources, enabling new generation and storage capacity in the National Electricity Market (NEM) at the lowest cost to consumers [9].
To address this, the Australian Renewable Energy Agency (ARENA) commissioned Baringa Partners, in collaboration with DIgSILENT Pacific, to conduct a study on the technical, commercial, and regulatory challenges of developing REZs within the NEM. The study also aimed to identify practical commercial and regulatory solutions to support the efficient and sustainable implementation of REZs [9].
3. Dynamic Thermal Rating
In the management of the electricity transmission network, the use of tools such as DTR (Dynamic Thermal Rating) devices is very important, capable of calculating the maximum current that the electrical conductor can sustain, in compliance with the current and minimum ground clearance limits imposed by current regulations [11]. To perform this function, these devices must be able to detect all the electrical and mechanical variables that affect the heat exchange between the conductor and the environment in which it is located. This information is processed through models based on meteorological measurements, on the detection of the mechanical sag/voltage of the conductor or on electrical quantities [10,12].
These devices are based on the following energy balance equation:
Where qc and qr indicate the heat exchanges by convection and radiation from the conductor to the surrounding environment, while qs and I2×R(Tc) constitute the heat gain caused by sun exposure and the heat produced by the joule effect by the conductor crossed by the current I [A]. R(Tc) [Ω] is the resistance of the conductor to the temperature Tc [K] (average temperature of the conductor). Ta [K] is the average temperature of the environment outside the conductor, Vm [m/s] and φ [rad] are respectively the speed and direction of the wind that impacts the conductor.
In the literature there are several studies showing how DTR systems can allow higher flow rates on power lines, compared to the conventional static limits imposed before the advent of this technology. The Dynamic Thermal Rating suggests current capacities 15%-30% higher than the conventional Static Thermal Rating, on average for 80%-90% of the operating period [13].
To take advantage of this significant increase in range, DTR devices must be positioned correctly along the transmission line. The electricity grid normally crosses large areas subject to different weather conditions, which affect the heat exchange of the conductor in different ways. For example, a conductor who is hit by strong gusts of wind tends to cool down more when compared to a conductor who is subjected to low winds. As a result, the flow rate and elongation of the conductor are not uniform over the entire transmission line. The safest and most conservative practice is to identify the so-called "hot spots" of the line, i.e. the hottest points, where the clearance from the ground is lower and the phenomena of annealing of the line are more likely. The span corresponding to the above characteristics is called the "critical span" and its identification ensures that all sections of the line can be crossed by a sustainable current flow rate [13].
To identify the hot spots of the line, sample measurements can be made, both homogeneously distributed over the territory and according to specific criteria. The article "Identification of Critical Spans for Monitoring Systems in Dynamic Thermal Rating" [14] proposes the comparison between a heuristic method of evaluation of critical spans and a homogeneous sampling method on the territory.
An aspect of considerable interest in the context of the Dynamic Thermal Rating is the correct prediction of the operating conditions of the line. A precise forecast allows operators operating the electricity grid to:
- optimize network operations;
- manage the uncertainty of loads and the intermittency of production of renewable sources;
- improve grid reliability and economic stability of power transfers;
- minimize any interruptions in production from renewable energy sources [13].
- detectors that monitor variable operating conditions;
- communication devices that receive and transmit the measured data;
- a software that interprets the data and quantifies the current capacity that the line can support.
DTR systems can apply both indirect and direct measurement methods. Indirect methods measure weather data, while direct methods can measure: the sag, the ground clearance of the conductor, the line voltage or the temperature of the conductor [16].
Some studies have focused on the impact that each of the variables affecting the heat exchange between the conductor and the environment has. In transmission lines characterized by a low current carrying capacity, the heat exchanged by convection qc plays a predominant role, while in lines where the required current carrying capacity is greater, the heat produced by the Joule effect I2×R assumes greater importance. In general, the contribution of solar radiation qs is not very influential. When the wind speed Vm is low (lower than 8-10 m/s), the heat exchanged for radiation qr can take on values equal to about 40% of qc, while for high wind speeds (greater than 10 m/s ), qr turns out to have a lower contribution [10].
4. Methodology
Currently, there are no studies describing the presence, configuration, and types of REZ [8] present in the Sicilian territory. Therefore, the goal of this study was to develop a methodology capable of identifying the REZs in the region. The main reason why the identification of REZ in Sicily is needed is to reduce network congestion, particularly the issue of Wind Power Curtailment (WPC). Once the REZs in Sicily were identified, the application of the Dynamic Thermal Rating in each of them was simulated, also making economic considerations and a verification comparison with the devices currently installed in Sicily.
5. Identification of Renewable Energy Zones
In this context, some typical requirements have been identified for a portion of land to qualify as a Renewable Energy Zone:
- high concentration of renewable energy plants (RES) connected to the transmission grid within the same geographical area.
- distribution of power flows generated by these RES through common transmission channels for all plants in the REZ. This condition allows the REZ to be treated as a sort of single equivalent grid node, simplifying the management of the grid outside the REZ.
- analysis of the relationships between all the network elements that make up the REZ.
When a REZ is properly identified and managed, it should be possible to minimize the need for flow management interventions within it.
The evaluation begins with a real scenario identified in 2024, characterized by high renewable energy production, using the TDV software. This is a software used by Terna that constantly monitors the electricity system. From TDV it is possible to extrapolate the measurements of the current capacity over a predetermined period. In the case study, it refers to the situation on April 19 at 16:00-17:00. Another software (Wincreso, also owned by Terna) was used. This program allows you to carry out "Load Flow" analyses taking into account different network assets, boundary conditions and fault simulations. Using the WinCreso software, n-1 operation scenarios [17] were simulated under the network conditions of April 19 at 16:00. Therefore, the loss of an additional element during maintenance conditions could lead to greater overloads.
The software allows the simulation of the protective system's intervention following a fault on all transmission lines. Based on these analyses, it was possible to identify the lines typically in overload under n-1 network conditions. Based on the geographical distribution of the overloaded lines, four REZs were determined: A, B, C, D. As observed, the current Sicilian REZs are located exclusively in the western part of the region, mainly due to the higher concentration of RES plants in this area. However, by consulting development scenarios for the upcoming years [2], potential REZs were also identified on the eastern side of Sicily: REZs E and F (Figure 2).
6. Application of Dynamic Thermal Rating to Sicilian Transmission Grid
The study aimed to evaluate the potential of DTR in the Sicilian territory. Both current and future scenarios are characterized by high electric power flows produced by renewable sources. The network congestion caused by these flows represents one of the main challenges for the Sicilian electricity system [1]. Specifically, the work carried out to assess the potential of Dynamic Thermal Rating in Sicily was divided into several phases:
- climatic study of Sicilian municipalities for Dynamic Thermal Rating. The location of these devices on the territory depends on identifying hot spots. A study of the climatic conditions typically characterizing the Sicilian territory was conducted. This allowed the identification of differences in terms of thermal exchange propensity across the macro-areas of the region;
- implementation of the Dynamic Thermal Rating calculation algorithm proposed by IEEE [16] on Python software. Building on the previously conducted climatic study, DTR simulations were performed for the Sicilian territory using this tool;
- identification of critical lines, based on the simulations carried out. Considering both the current configuration and the 2027 forecasts for Renewable Energy Zones in the territory, several hot spots on the Sicilian transmission lines were identified. The installation of DTR devices in these areas would significantly improve the management of the transmission system;
- brief economic considerations, in which the economic sustainability of DTR devices is demonstrated;
- comparison with current applications of Dynamic Thermal Rating in Sicily.
6.1. Climatic Study of Sicilian Municipalities for Dynamic Thermal Rating
The goal of this part of the study was to classify Sicilian municipalities based on their potential for thermal exchange between the conductors and the surrounding environment, typical of the territory in which the municipalities are located. The most important variables that affect the thermal exchange between the overhead conductor and the surrounding environment are [13]:
- Wind speed;
- Average external temperature.
Therefore, through the online platform "Servizio Informativo Agrometeorologico Siciliano" (SIAS) [19], data were collected from about 40 SIAS meteorological stations evenly distributed across the Sicilian territory. The data collected from the SIAS meteorological stations consist of:
- Daily average temperatures from 2018 to 2023;
- Daily average wind speeds from 2018 to 2023;
- Altitude above sea level for each station.
These data were then summarized by calculating (using Excel) for each location:
- Monthly average temperatures and wind speeds from 2018 to 2023;
- The average of the monthly average temperatures and wind speeds from 2018 to 2023.
Since the meteorological stations are sufficiently evenly distributed across the territory, Sicily was divided into 36 micro-zones. These micro-zones were sized based on the actual concentration of available meteorological stations. Therefore, some micro-zones have a larger area than others due to the lower availability of meteorological data to reference. Conversely, where the concentration of stations is higher, smaller micro-zones were identified.
The locations where the stations are located will henceforth be referred to as "source municipalities," as the monthly average external temperature and the monthly average wind speed for all other municipalities will be calculated based on the values from the source municipality of the same micro-zone. To calculate the monthly average external temperature of each municipality Tm [°C], the following formula was used:
Where:
- Tm is the monthly average temperature of the source municipality [°C].
- Zm is the altitude of the municipality [m].
- Zsm is the altitude of the source municipality [m].
- δ is the vertical temperature gradient [°C/m].
The determination of this formula and the vertical temperature gradient was taken from the UNI10349 standard currently in force [20]. The altitudes of the stations were obtained from the SIAS website [19], while the altitudes of all Sicilian municipalities were obtained from [21].
To calculate the monthly average wind speed for each municipality Vm [m/s] the following formula was used:
Where:
- Vsm is the monthly average wind speed of the source municipality [m/s];
- C is a dimensionless multiplicative coefficient.
The multiplicative coefficient was used to account for variations in wind speed within the same microzone. In cases where a small portion of the territory is characterized by high average slopes, the wind speed is usually less homogeneous. To improve the calculation of , a multiplicative coefficient was proposed, which can take the following values:
if |Zm-Zsm|≤250 [m] then C=1
if Zm-Zsm≥250 [m] then C=0,9
if Zms-Zm≥ 250 [m] then C=1,1
These values effectively simulate real conditions, as they were identified after sample checks of the actual wind speed distribution in high-slope areas in Sicily.
After obtaining the Tm and Vm values for all municipalities in each month of the year, a classification was performed for all municipalities based on their thermal exchange potential. The classification was carried out as follows.
The temperature range was calculated:
Where:
- Tm,max [°C is the highest monthly average external temperature recorded in Sicily for the corresponding month;
- Tm,min [°C] is the lowest monthly average external temperature recorded in Sicily for the corresponding month.
The interval ΔTmax was then divided into 3 smaller intervals. The range of the intervals was selected to make the classification as effective as possible. Each interval is referred to as a “temperature range (Range Ti).
The wind speed range was calculated:
Where:
- Vm,max [m/s] is the highest monthly average wind speed recorded in Sicily for the corresponding month;
- Vm,min [m/s] is the lowest monthly average wind speed recorded in Sicily for the corresponding month.
The interval ΔVmax was then divided into three smaller intervals. The range of the intervals was chosen with the goal of making the classification as effective as possible. Each interval is referred to as a “wind speed range (Range Vi).”
All municipalities were placed into the corresponding temperature and wind speed ranges for each month of the year.
Specifically, the temperature for a given municipality is indicated as:
- “Low T” if it falls within Range T1;
- “Medium T” if it falls within Range T2;
- “High T” if it falls within Range T3.
- Using the same criterion, the wind speed for the given municipality is indicated as:
- “Low Wind Speed” (Low W.S.) if it falls within Range V1;
- “Medium Wind Speed” (Medium W.S.) if it falls within Range V2;
- “High Wind Speed” (High W.S.) if it falls within Range V3.
Some results are presented as an example (Table 1).
In the thermal exchange phenomenon between the conductor and the external environment, the wind speed impacting the overhead power line usually plays a more significant role than the average external temperature [13]. For this reason, the nine possible combinations of temperature and wind speed have been classified as reported in Table 2:
Nine climatic classes were thus determined. Specifically, moving from one climatic class to the next reduces the conductor's propensity for thermal exchange, as the average monthly wind speed progressively decreases and the average external temperature increases.
After determining the classification methodology for climatic classes, several types of climatic analyses were conducted:
- for each month of the year, the classification of Sicilian municipalities was assessed;
- potential differences and similarities among Sicilian municipalities were observed.
By observing whole classification made during the study, differences and similarities between all the regions of the island can be seen: during the winter months, most municipalities fall into the higher classes, while during the summer months, most municipalities fall into the lower classes. This is because some areas of Sicily are characterized by more consistent wind patterns throughout the year, while other areas experience significant variations in wind speed, especially when transitioning from winter to summer.
It is observed that the areas of Trapani, Ragusa and Syracuse are usually characterized by high wind speeds throughout the year. In contrast, Enna and Messina are characterized by low wind speeds year-round. Palermo, on the other hand, has variable wind conditions throughout the year. In winter, low wind speeds are observed, gradually increasing to moderate wind speeds in summer. The Agrigento area also exhibits increasing wind speeds from winter to summer, with moderate wind speeds in winter and high wind speeds in summer. The Catania area experiences medium-low wind speeds throughout the year, as does the Caltanissetta area (Table 3).
From the considerations made so far, the potential of Dynamic Thermal Rating (DTR) is not the same in all areas of Sicily. The effectiveness of these devices increases with the wind speed impacting the electric conductor. Therefore, it is more advantageous to install a DTR on power lines in windier provinces such as Trapani, Syracuse, and Ragusa. It is also observed that the effectiveness of the device depends on identifying the hot spots of the power line. Identifying hot spots is a complex and challenging task [13], it is safer to use DTR technology in areas where even at the hot spots there is not excessively low wind speed. This reduces the likelihood of overheating in hot spots that were not identified.
In areas characterized by consistently low wind speeds (such as provinces of Enna and Messina), from a purely climatic standpoint, installing DTR devices may not be advantageous. This is for the following reasons:
- The increase in the suggested current capacity from DTR may be too low and not beneficial enough.
- The hot spots in these areas may be critical enough to make the use of DTR unsafe. In this case, the proposed solution is the re-conductoring of the electrical line.
When Dynamic Thermal Rating is insufficient, another solution to address the increase in power flows is to enhance the capacity of electrical transmission lines through "re-conductoring" [22,23]. This involves replacing old, worn-out lines with new conductors capable of operating at higher temperatures while still meeting the required minimum ground clearance, thus reducing the space occupied by infrastructure. Among the new-generation conductors are HTLS (High-Temperature Low-Sag) conductors, which have a nearly identical cross-section to conventional ones but improve the transport capacity, efficiency, and reliability of the electrical grid [24].
While conventional Aluminium Conductor Steel Reinforced (ACSR) conductors typically operate below 75°C, all HTLS conductors can continuously operate at least at 150°C, with some even able to function at 250°C without substantial changes in electrical and mechanical properties. The main advantage of replacing existing lines with HTLS conductors is that they allow the thermal rating of the line to be increased without structural modifications. Therefore, HTLS conductors have significant potential to replace conventional ACSR conductors.
6.2. Implementation of the Dynamic Thermal Rating Calculation Algorithm Proposed by IEEE on Python Software
After completing the climatic analysis of the Sicilian territory, a thermal analysis of the transmission lines was carried out. The purpose of the analysis is to calculate the current load that the conductor can withstand without exceeding the permitted limits, particularly those related to the phenomenon of annealing. The implemented algorithm is the one proposed by the IEEE Power and Energy Society in the document "IEEE Standard for Calculating the Current-Temperature Relationship of Bare Overhead Conductors" [16]. This article presents a numerical methodology where the temperature of the conductor is related both to the conductor’s current carrying capacity and to the environmental weather conditions.
In the study, the algorithm was used to calculate the Dynamic Thermal Rating of an overhead conductor. The output of the numerical method is the maximum current that can flow through the conductor without exceeding the maximum temperature limit. The analyses were carried out under steady-state conditions, considering constant external weather conditions within a one-hour interval. It is assumed that the variables proposed in the methodology evolve slowly compared to the electric phenomena being analyzed. Therefore, results obtained by considering short time intervals (one hour) are valid. For this reason, hourly weather data corresponding to the average hourly values recorded in the databases during 2024 in each of the studied Sicilian locations were implemented. These datas were available through public python libraries.
Following the simulations and considering both the current configuration and the forecasts for the Renewable Energy Zones (REZ) in 2027, some hot spots in the Sicilian transmission lines were identified. The installation of DTR devices in these hot spots could bring significant improvements in the management of the transmission system.
6.3. Identification of Critical Lines
After implementing the IEEE proposed algorithm, a methodology was developed to identify the set of locations where the Dynamic Thermal Rating simulations should be carried out. Specifically, the following steps were performed:
- identification of all municipalities crossed by each REZ;
- classification of the municipalities in each REZ based on their potential for thermal exchange, to identify the hot spot municipalities;
- once the hot spot municipalities have been identified, Dynamic Thermal Rating simulations were carried out for the municipalities crossed by each REZ in these locations.
To classify the municipalities of each REZ, a software owned by Terna called Sisnet was used, which shows the layout of the entire Italian transmission network. In each Renewable Energy Zones the following municipalities are present:
- REZ A: Mazara del Vallo, Campobello di Mazara, Castelvetrano, Partanna;
- REZ B: Marsala, Misiliscemi;
- REZ C: Trapani, Paceco, Misiliscemi, Erice, Buseto Palizzolo, Custonaci, Castellammare del Golfo;
- REZ D: Castellammare del Golfo, Alcamo, Partinico;
- REZ E: Troina, Cerami, Capizzi, Mistretta, Castel di Lucio, Regalbuto;
- REZ F: Gela, Butera, Licata, Acate, Vittoria.
To determine the hot-spot municipalities in each REZ, the following methodology was used, based on the climatic analyses mentioned in the previous paragraphs:
- for each municipality in the REZ, the climatic class for each month of the year was calculated;
- Each municipality was assigned a score, called the "hot-spot score" (Χ), which is calculated as follows:
Where Χm,month is a number corresponding to the value of the climatic class of the municipality for the given month.
It is important to make a significant clarification: the meteorological stations used for these climatic analyses may differ from the stations used for the analysis of the entire region. This choice was made to ensure the most accurate results possible. In the analysis of each REZ, only the meteorological stations available near the REZ were used, while for the global regional analysis, the stations that ensured an equitable availability of meteorological data across the entire territory were utilized.
The DTR simulations carried out consider the meteorological conditions observed on April 19, 2024. This choice aligns with the fact that the network overloads, from which the REZ were identified, were simulated under the meteorological conditions of April 19, 2024. Another important point to highlight is that the proposed results consider not only the thermal limit of conductor annealing but also the thermal limit due to the presence of tother network elements, such as current and voltage transformers.
Figure 3 illustrates the results of the simulations, comparing them with the corresponding nominal flow values currently in use. It is observed that the results obtained refer to the hypothetical network scenario of April 19, 2024, characterized by high energy production from renewable sources. In all the studied locations, it was possible to simulate a significant increase in the current capacity of the lines, without reaching conductor annealing conditions and while respecting the current limits imposed by network elements (such as current and voltage transformers). Additionally, since the analyses were conducted in the hot spots of the various Renewable Energy Zones, the installation of a few DTR devices in these municipalities should ensure an overall increase in the permissible power flows across all the lines of each REZ.
This section will present the results of the comparison between:
- overloads simulated on WinCreso, under n-1 network conditions on April 19, 2024;
- overloads following the implementation of Dynamic Thermal Rating on the same lines, under the same network conditions.
An important clarification is made: the overloads have been expressed in terms of active power [MW], assuming for simplicity a power factor of 1. This hypothesis, although far from reality, allows us to arrive at equally valid conclusions. Figure 4 shows the results for the municipality of Vittoria.
For each line under study, several quantities were calculated, and their meaning is provided below:
The nominal electrical power Pnom that the line can carry, denoted as was calculated as follows:
Where:
- Inom is the maximum current the line can carry under normal conditions [A];
- V is the nominal voltage of the line [kV];
- cosϕ is the power factor.
The excess power ΔPe, which the line would theoretically need to carry if Inom were equal to the current overload Is, was calculated as follows:
Where:
- Is is the overload current simulated on WinCreso following an electrical system contingency [A].
The excess power ΔPe,DTR resulting from an overload, which the line would theoretically need to carry if the nominal current Inom were equal to IDTR, was calculated as it follows:
The power increase ΔP+DTR that can be transported by the line if the circulating current Inom were the one proposed by the DTR IDTR simulation was calculated as follows:
As shown in Figure 4, the overload that would have occurred with the use of DTR devices would have been approximately 18 MW (9% more than the nominal power of the line). While without DTR devices the simulated overload was equal to 120 MW (61% more than the nominal power of the line). After analyzing the results of the Dynamic Thermal Rating simulation in each of the Renewable Energy Zones, it can be stated that the use of DTR technology would undoubtedly be beneficial and effective. Indeed, in all the studied hot spots, the congestion that could occur following the installation of DTRs would always be less severe than the contingencies that would currently occur without the DTR devices.
6.4. Brief Economic Considerations
The transmission of high-voltage electricity is managed by the national Transmission System Operator (TSO), which is the joint-stock company TERNA. Adjusting production based on the needs of the grid is a task of the TSO, and the correct management of power flows allows for improvements in both the overall efficiency of the electrical system and its economic performance. Among the actions implemented for the management of the electrical system, Terna reduces wind power production through dispatch orders, resulting in Wind Power Curtailment (WPC) [25,26]. In 2022, the WPC in Sicily was 30 GWh, mainly due to grid congestion [7,22].
An important Italian body that deals with the management of renewable sources is the "Energy Services Manager" (GSE S.p.A). It is an Italian joint-stock company, wholly owned by the Ministry of Economy and Finance, which is entrusted with the task of promoting and developing renewable sources and energy efficiency.
Users of one or more wind power generation units, whose energy production was reduced due to dispatch orders issued by Terna, may submit a request to GSE and, for informational purposes, to Terna for compensation for the wind power curtailment. Therefore, avoiding such WPC would result in significant economic savings for GSE and TSO. Assuming that the network congestions simulated on WinCreso (on April 19, 2024, in an n-1 grid condition) were entirely caused by excessive wind generation, the economic return from the installation of DTR devices was calculated in each of the REZs. The reduction in economic costs ROE consists of the avoided payment that the TSO would have made to producers due to the circulation of the power proposed by the DTR (ΔP+DTR) for one hour, in each of the analyzed hot spots.
In detail, for each DTR simulation, the reduction in economic costs (REC) was calculated using the following operation:
Where:
- ΔP+DTR is the increase in power that can be transported by the line if the current flow corresponds to that proposed by the DTR simulation;
- P is the average electricity price set at 90 €/MWh.
Considering that the current cost of DTR technology is several tens of thousands of euros per device and taking into account the cost of resolving congestion in the Ancillary Services Market, the results obtained also confirm the economic sustainability of this technology.
6.5. Comparison with Current Dynamic Thermal Rating Applications in Sicily
This section presents a comparison between the Dynamic Thermal Rating simulations conducted and the current supplied by some DTR devices already installed in Sicily.
Specifically, the operational DTR devices have been installed on the following lines:
- 220 kV electrical transmission line;
- 150 kV electrical transmission line.
The validation of our algorithm aligns with Terna's results under certain considerations:
- The implemented IEEE algorithm extracts data from a database with a resolution of 1 km2;
- Terna's DTR devices, on the other hand, perform point measurements at the installation sites, comparing them with data provided by Aeronautica Militare [27].
Considering these premises, the daily average current provided by our algorithm was compared to the daily average current supplied by the DTR devices on April 19, 2024 (Table 5).
From the Table 5, it is evident that the values are very similar to those provided by Terna's DTR devices. This allows us to conclude that the methodology used for the simulations delivers reliable results.
7. Discussion and Conclusions
Following the research conducted for this study, it is evident that the development prospects of the Sicilian transmission grid are both challenging and critical for the national and international electrical system. Structural interventions such as the Tyrrhenian Link, connecting Sicily, Sardinia, and Campania, and the TUN-ITA electrical channel, linking Europe to Africa, are anticipated [1,4]. The integration of renewable energy sources is a fundamental aspect for the growth and enhancement of the transmission network. Consistently with the Fit-for 55 developments plan, the number of renewable energy plants connected to the grid is expected to increase significantly in the coming years. For this reason, the proper management of the identified Renewable Energy Zones (REZs) and the potential development of new ones will optimize energy dispatching and transmission [1,4].
This study identified six Renewable Energy Zones, some of which are already operational (A, B, C, D) while others are planned for the coming years (E, F). The application of "Dynamic Thermal Rating" (DTR) technology will (and already does) improve the operation of the transmission system and the management of energy flows from renewable energy sources within the REZs. Current DTR technologies are effective, but it still has potential for enhancement.
The results demonstrate that the potential of DTR is not uniform across the various zones of Sicily. The effectiveness of these devices increases with higher wind speeds impacting the conductor. Thus, installing DTRs on lines in windier provinces, such as Trapani, Syracuse, and Ragusa, is more cost-effective. Conversely, in less windy areas (e.g., Enna and Messina), installing DTRs may not be economically advantageous due to a marginal increase in the line's capacity, making the investment less worthwhile. Critical hotspots in these areas could make DTR usage less secure. In such cases, reconductoring the line is recommended.
In all the studied locations, it was possible to simulate a significant increase in line capacity without reaching the conductor's annealing conditions and while respecting the current limits imposed by network elements (such as current and voltage transformers). Furthermore, since the analyses were conducted in the hotspots of each Renewable Energy Zones (REZs), the installation of a few DTR devices in these municipalities should ensure an overall increase in the allowable power flows across all lines within each REZ.
Specifically, when each REZ is properly identified and managed, it should be possible to minimize dispatching actions within the zone. Currently, network congestion caused by high renewable energy production is resolved by uniformly distributing wind production cuts across Sicily or targeting reductions along non-REZ routes. This approach reduces renewable energy production in areas unaffected by congestion, resulting in untargeted interventions that do not minimize the overall production cuts. As observed, targeted DTR deployment within each REZ drastically reduces network congestion.
An economic assessment was also conducted, confirming the financial viability of DTR devices. In conclusion, a comparison between DTR simulations and the results of devices currently installed in the same locations demonstrated the validity of the analyses performed.
It is important to emphasize a key point: the sensitivity analyses carried out during this study refer to a scenario of high renewable energy production (April 19, 2024). While significant, this scenario is not representative of all possible operating conditions. Comprehensive sensitivity analyses covering the entirety of potential network scenarios would be necessary, which fall outside the scope of this study.
A potential future development of this work could involve a detailed study of the electricity flows characterizing the micro-zones that make up each REZ. This approach could help identify criticalities, quality issues, and key aspects of internal management within each REZ.
The results of this work demonstrate, therefore, that optimizing the number and placement of DTR devices can enable the grid to support a significant average increase in electricity flows. Dynamic Thermal Rating proves to be a highly effective tool for managing Renewable Energy Zones and, more broadly, the Sicilian transmission system.
References
- P. di Gloria. S. Paradiso, M. Pede, V. Sorrentino, C. Vergine, F. Massaro, A. Vasile, G. Zizzo, “On the Impact of Renewable Generation on the Sicilian Power System in Near-Future Scenarios: A Case Study” Energies, vol. 17, no. 13, Jul. 2024. [CrossRef]
- Terna, S.p.A. “Econnextion: La Mappa Delle Connessioni Rinnovabili”; Rome, Italy, 2024. [Online] [Accessed 26 november 2024] [CrossRef].
- Terna S.p.A. Pubblicazioni Statistiche; Technical report; Terna S.p.A.: Rome, Italy, 2024.
- Terna, S.p.A. “Piano di Sviluppo 2023”; technical report, Rome, Italy, 2023.
- R. Musca, E. Sanseverino, A. Vasile, G. Zizzo, “Power-Flow studies on the Future Electricity Grid of Sicily: Analysis of 2030 Scenario Cases,” in 2023 AEIT International Annual Conference (AEIT), IEEE, Oct. 2023, pp. 1–6. [CrossRef]
- S. Favuzza, M. Giuseppe Ippolito, F. Massaro, L. Mineo, R. Musca, and G. Zizzo, “New energy corridors in the euro-mediterranean area: The pivotal role of sicily,” Energies, vol. 11, no. 6, Jun. 2018. [CrossRef]
- Terna, S.p.A. Documento di descrizione degli Scenari 2022, Technical report, Rome, Italy, 2022.
- N. Lee, F. Flores-Espino, and D. J. Hurlbut, “Renewable Energy Zone (REZ) Transmission Planning Process: A Guidebook for Practitioners,” Golden, CO (United States), Sep. 2017. [CrossRef]
- Australian Renewable Energy Agency, Development of Renewable Energy Zones in the NEM, [CrossRef] 2020.
- S. Karimi, P. Musilek, and A. M. Knight, “Dynamic thermal rating of transmission lines: A review,” Renewable and Sustainable Energy Reviews, vol. 91, pp. 600–612, Aug. 2018. [CrossRef]
- Massaro, F., Miceli, R., Rizzo, R. (2013). Dynamic thermal rating for overhead lines: Self-adaptive protection device. LEONARDO JOURNAL OF PRACTICES AND TECHNOLOGIES, 12(23), 97-114.
- F. Massaro, M. G. Ippolito, E. M. Carlini, and F. Bassi, “Maximizing energy transfer and RES integration using dynamic thermal rating: Italian TSO experience,” Electric Power Systems Research, vol. 174, Sep. 2019. [CrossRef]
- M. Lai and J. Teh, “Comprehensive review of the dynamic thermal rating system for sustainable electrical power systems,” Energy Reports, vol. 8, pp. 3263–3288, Nov. 2022. [CrossRef]
- M. Matus et al., “Identification of Critical Spans for Monitoring Systems in Dynamic Thermal Rating,” IEEE Transactions on Power Delivery, vol. 27, no. 2, pp. 1002–1009, Apr. 2012. [CrossRef]
- F. Massaro, M. G. Ippolito, G. Zizzo, G. Filippone, and A. Puccio, “Methodologies for the exploitation of existing energy corridors. Gis analysis and dtr applications,” Energies, vol. 11, no. 4, Apr. 2018. [CrossRef]
- “IEEE Standard for Calculating the Current-Temperature Relationship of Bare Overhead Conductors.” IEEE, Piscataway, NJ, USA, Jun. 29, 2023. [CrossRef]
- E.M. Carlini, Massaro F., Quaciari C. (2013). Methodologies to uprate an overhead line. Italian TSO case study. Journal of Electrical Systems. 9. 422-439.
- Sicily, Italy [CrossRef] [Accessed 26 november 2024].
- SIAS-Regione Siciliana. [Online] [CrossRef] [Accessed 26 november 2024], Palermo, Italia.
- UNI, Ente Italiano di Normazione. [Online] 2016 [ CrossRef] [Accessed 26 november 2024], Italia.
- Tuttitalia, [CrossRef] [Accessed 26 november 2024].
- R. Riba, Santiago Bogarra, Á. Gómez-Pau, and M. Moreno-Eguilaz, “Uprating of transmission lines by means of HTLS conductors for a sustainable growth: Challenges, opportunities, and research needs,” Renewable and Sustainable Energy Reviews, vol. 134, p. 110334, Dec. 2020. [CrossRef]
- M. G. Ippolito, F. Massaro, and C. Cassaro, “HTLS Conductors: A Way to Optimize RES Generation and to Improve the Competitiveness of the Electrical Market - A Case Study in Sicily,” Journal of Electrical and Computer Engineering, vol. 2018, 2018. [CrossRef]
- S. Favuzza, M. G. Ippolito, F. Massaro, G. Paternò, A. Puccio, and G. Filippone, “A New Approach to Increase the Integration of RES in a Mediterranean Island by Using HTLS Conductors”.
- ARERA. Delibera 25 gennaio 2010, technical report, 2010, [CrossRef].
- E. M. Carlini, S. E. M. Carlini, S. Favuzza, S. E. Giangreco, F. Massaro and C. Quaciari, "Uprating an overhead line. Italian TSO applications for integration of RES," 2013 International Conference on Clean Electrical Power (ICCEP), Alghero, Italy, 2013, pp. [CrossRef]
- Aeronautica Militare. [Online] [CrossRef] [Accessed 26 november 2024].
Figure 2.
Renewable Energy Zones in Sicily, Italy [18].
Figure 2.
Renewable Energy Zones in Sicily, Italy [18].
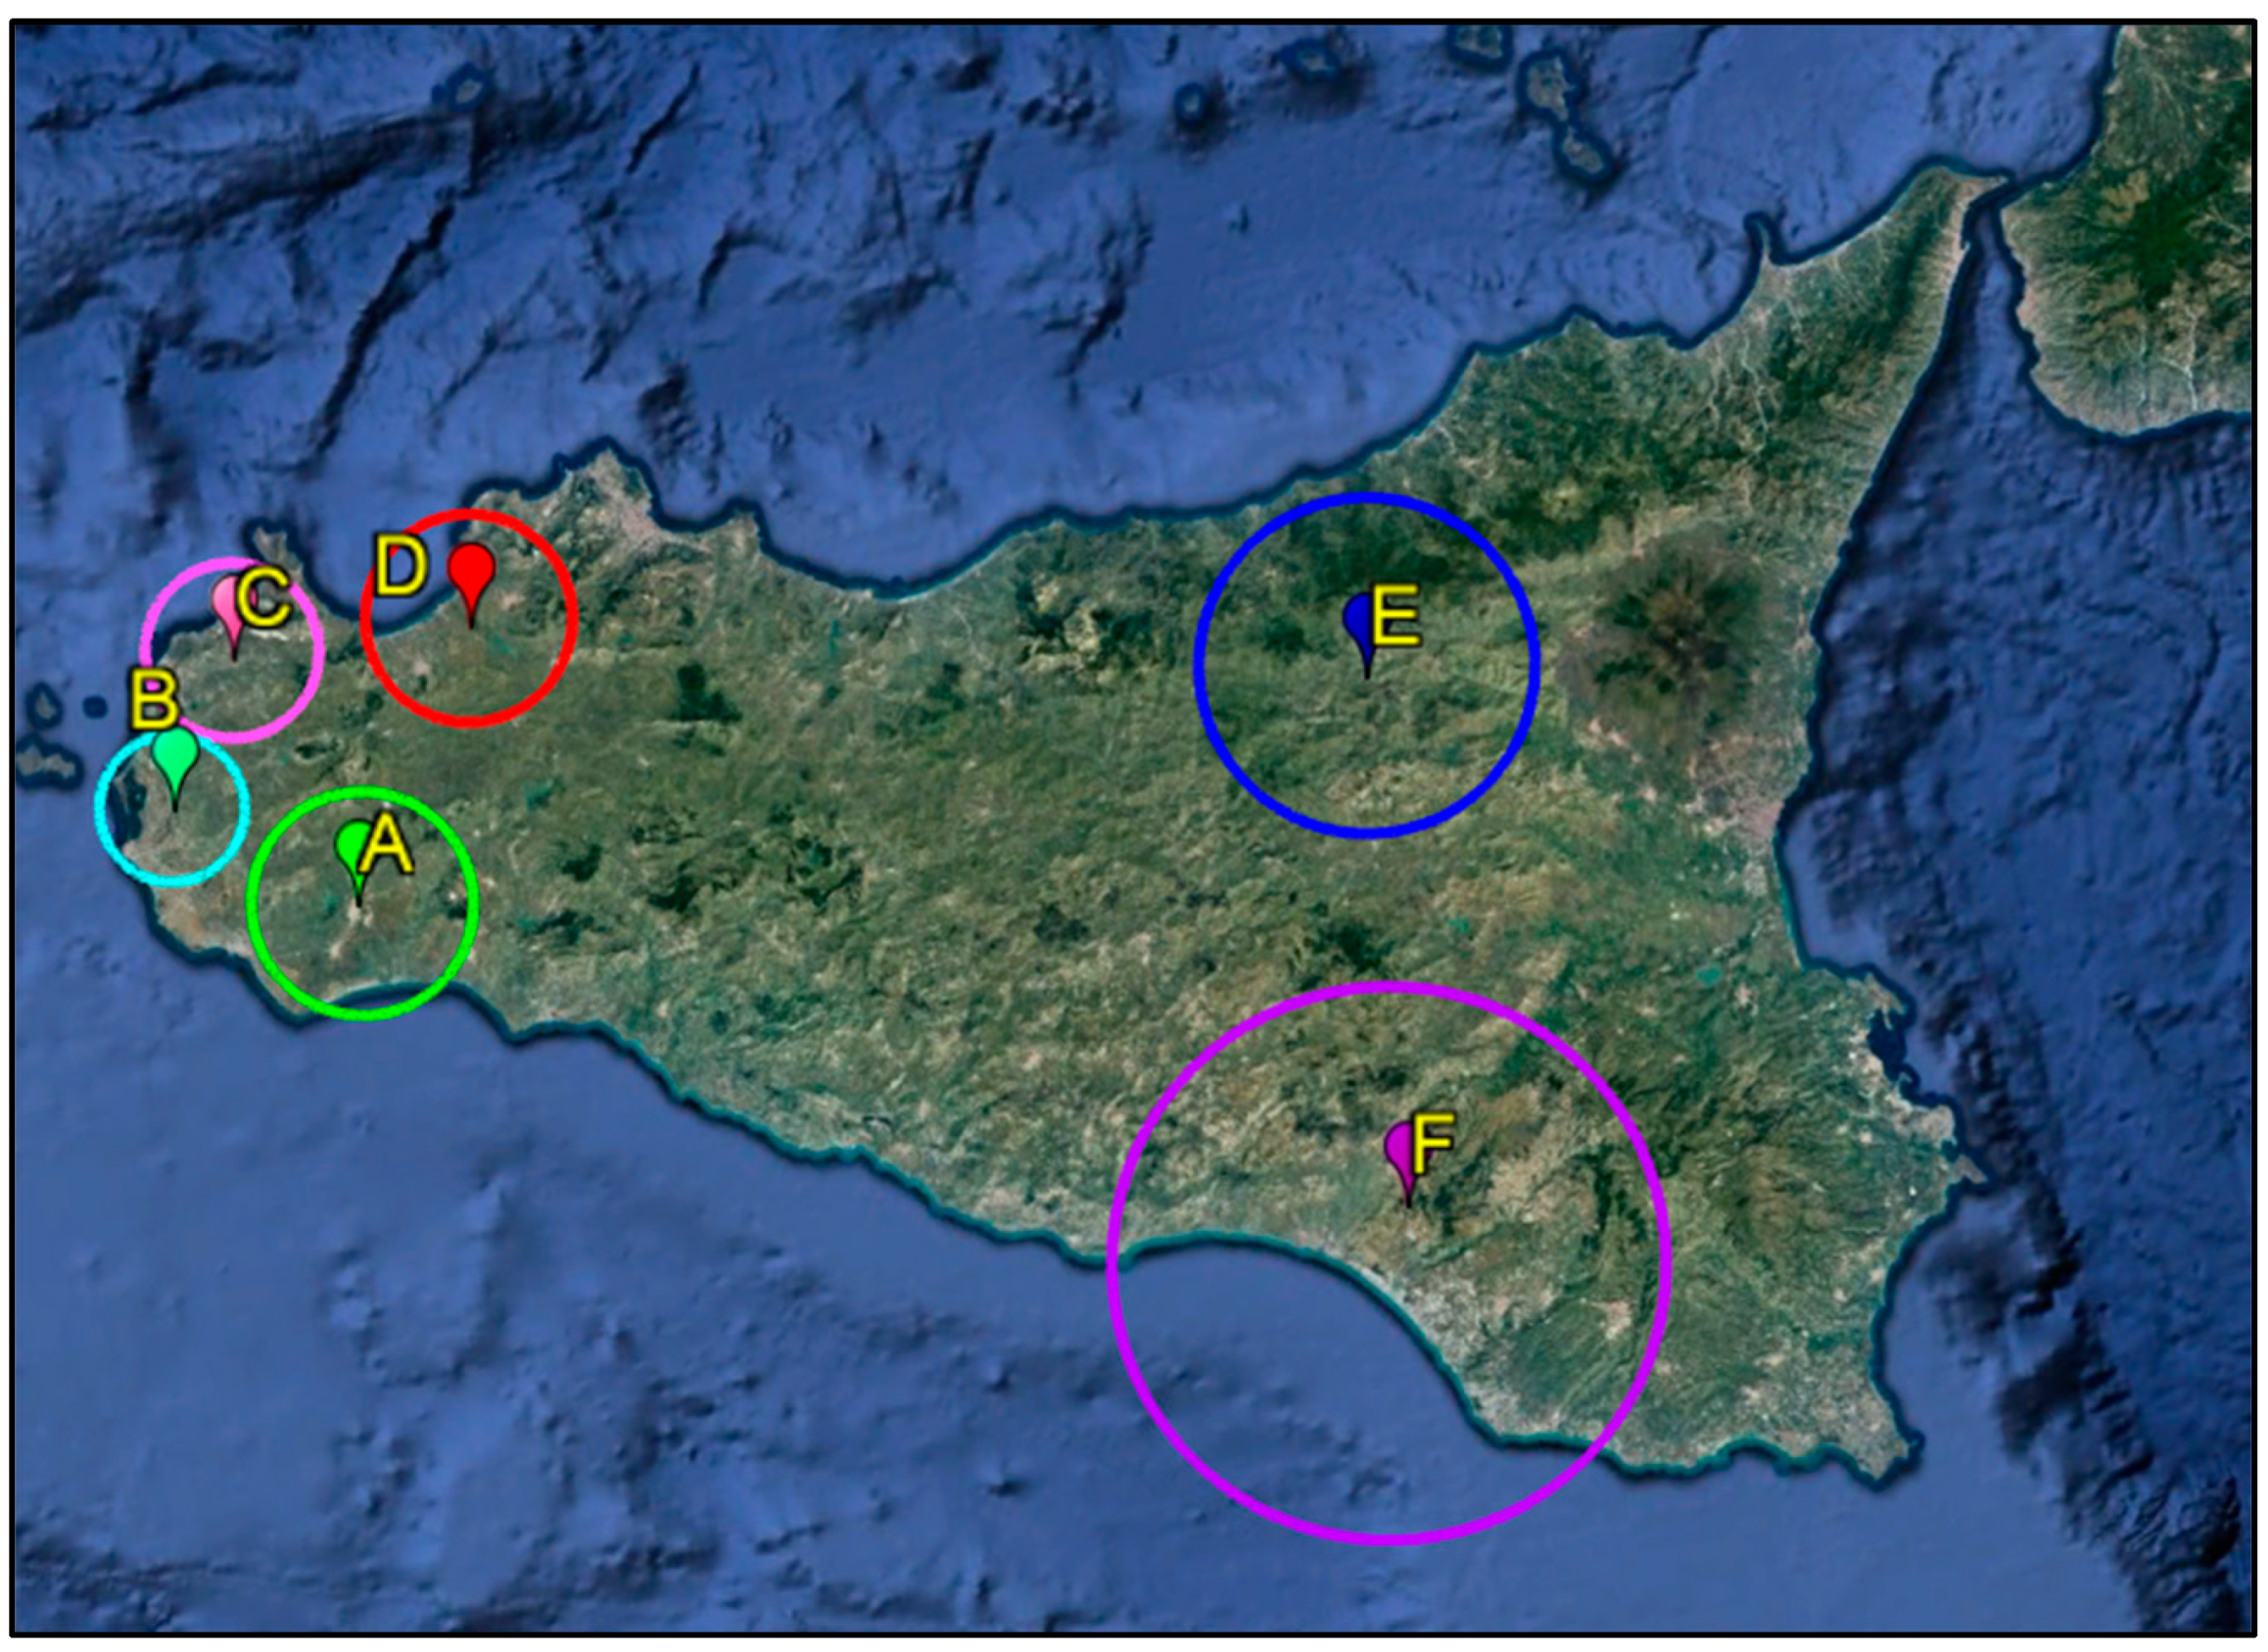
Figure 3.
Dynamic Thermal Rating of hot spots.
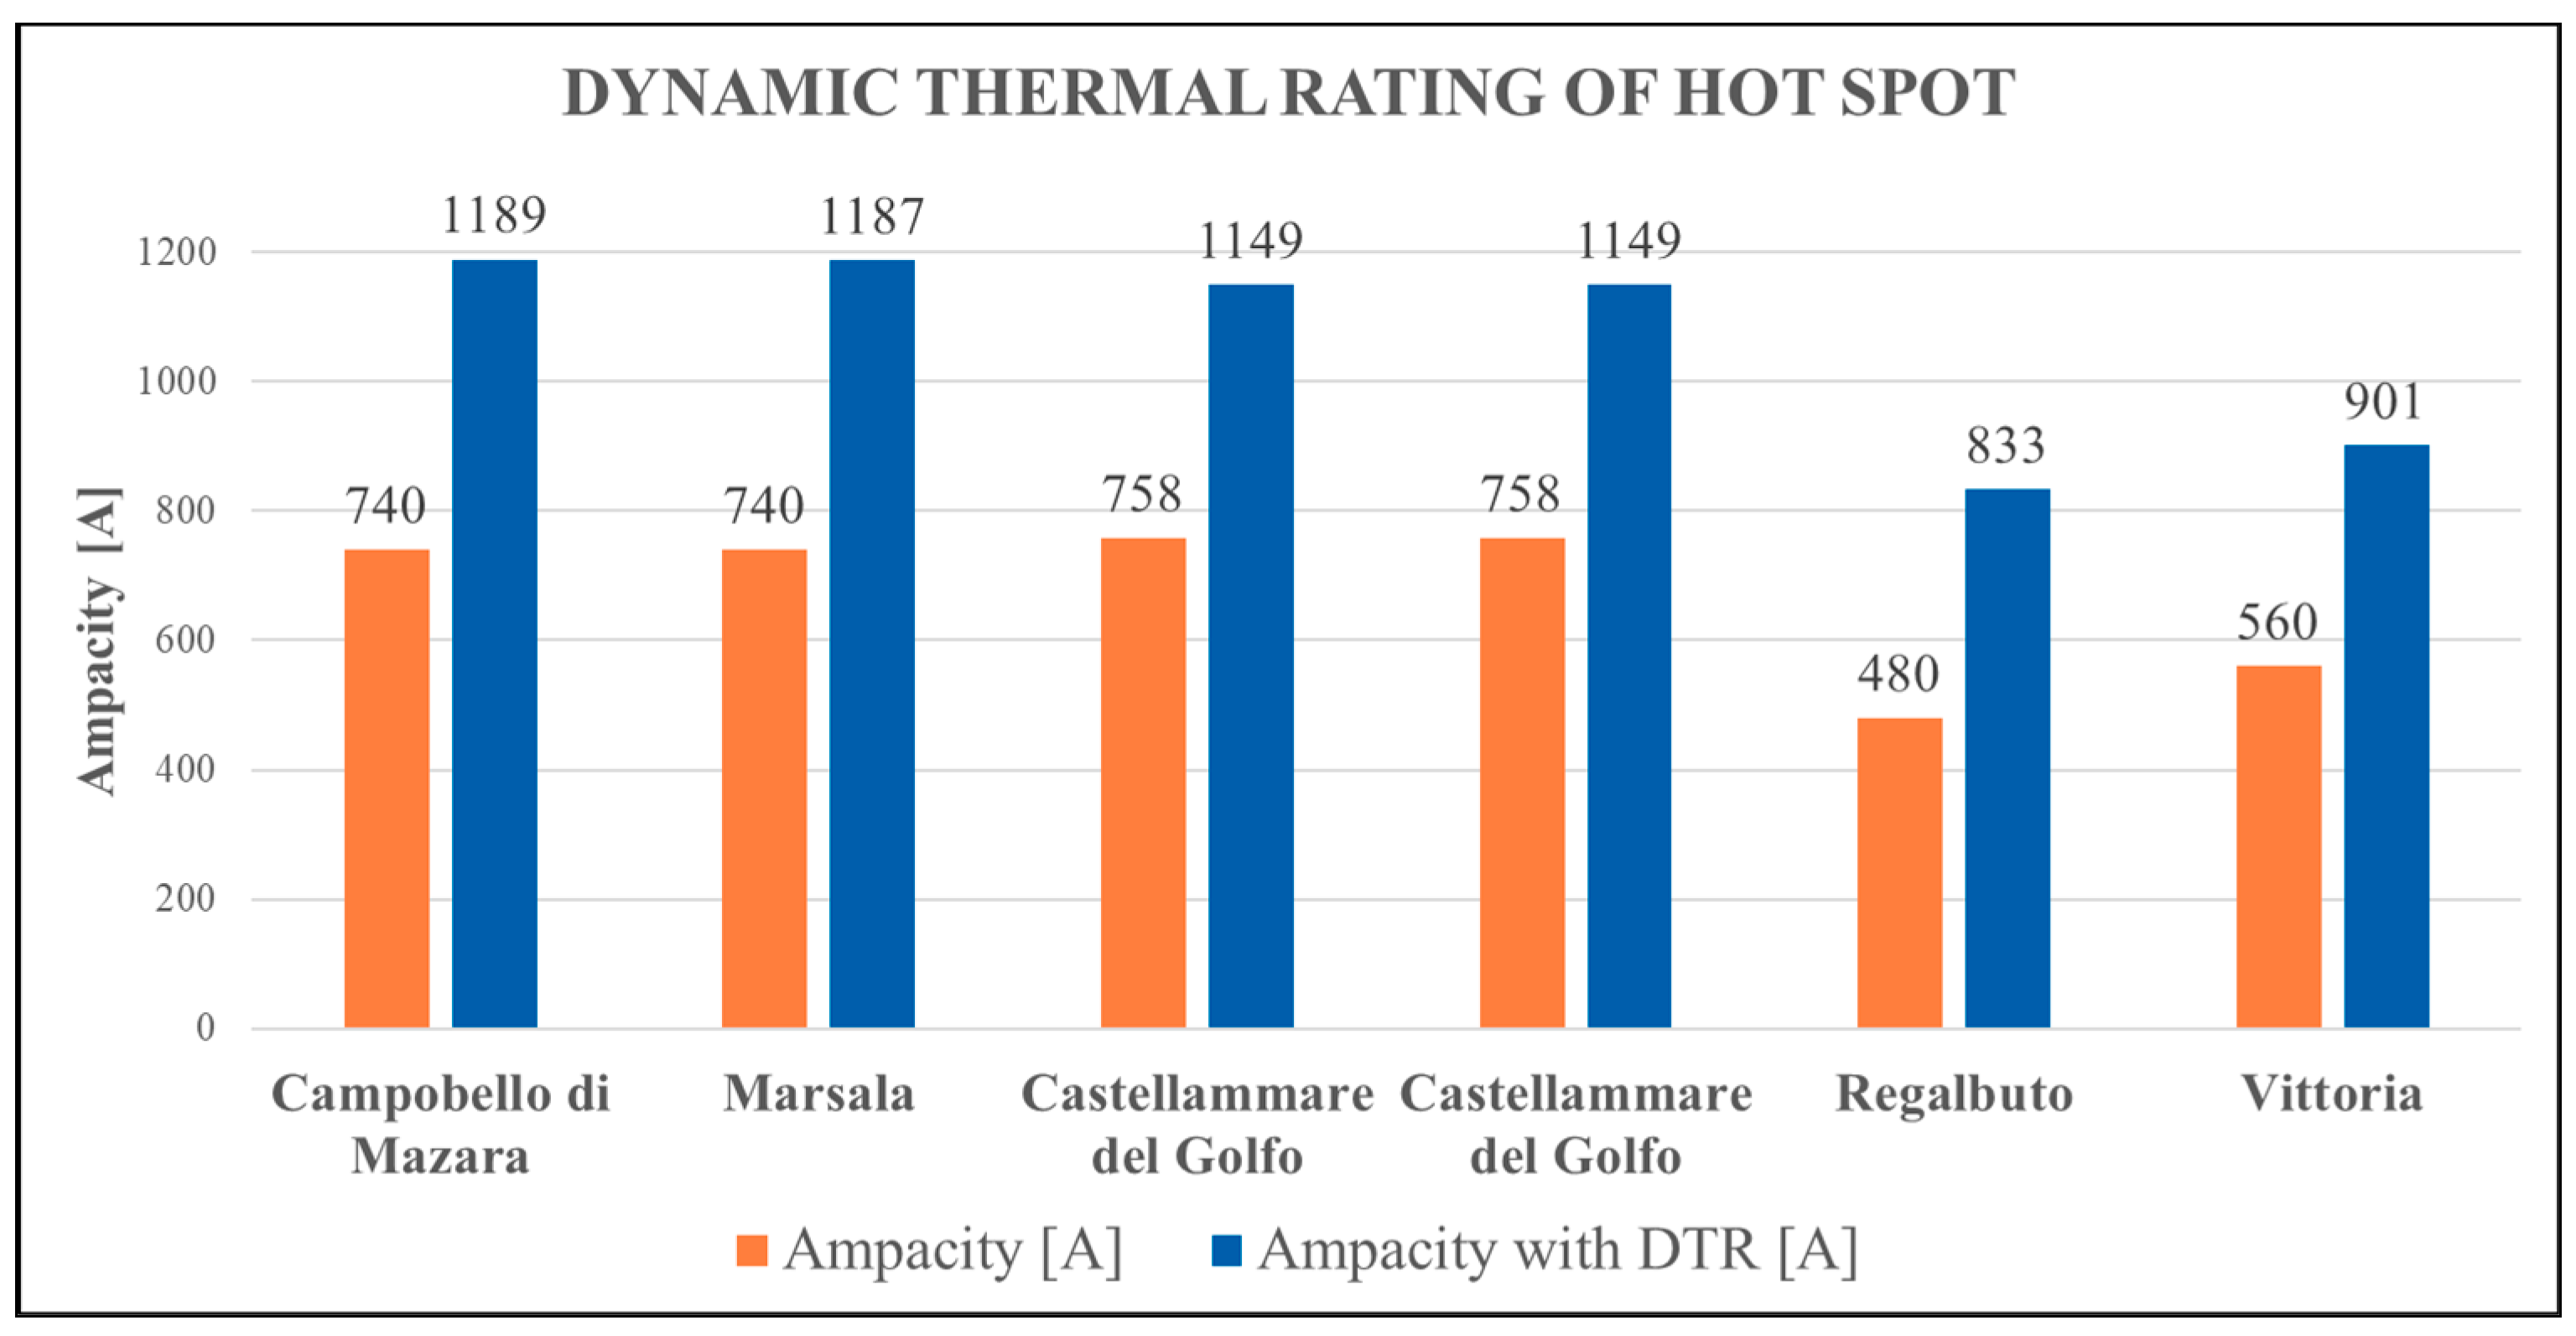
Figure 4.
Reduction of overloads in the municipality of Vittoria.
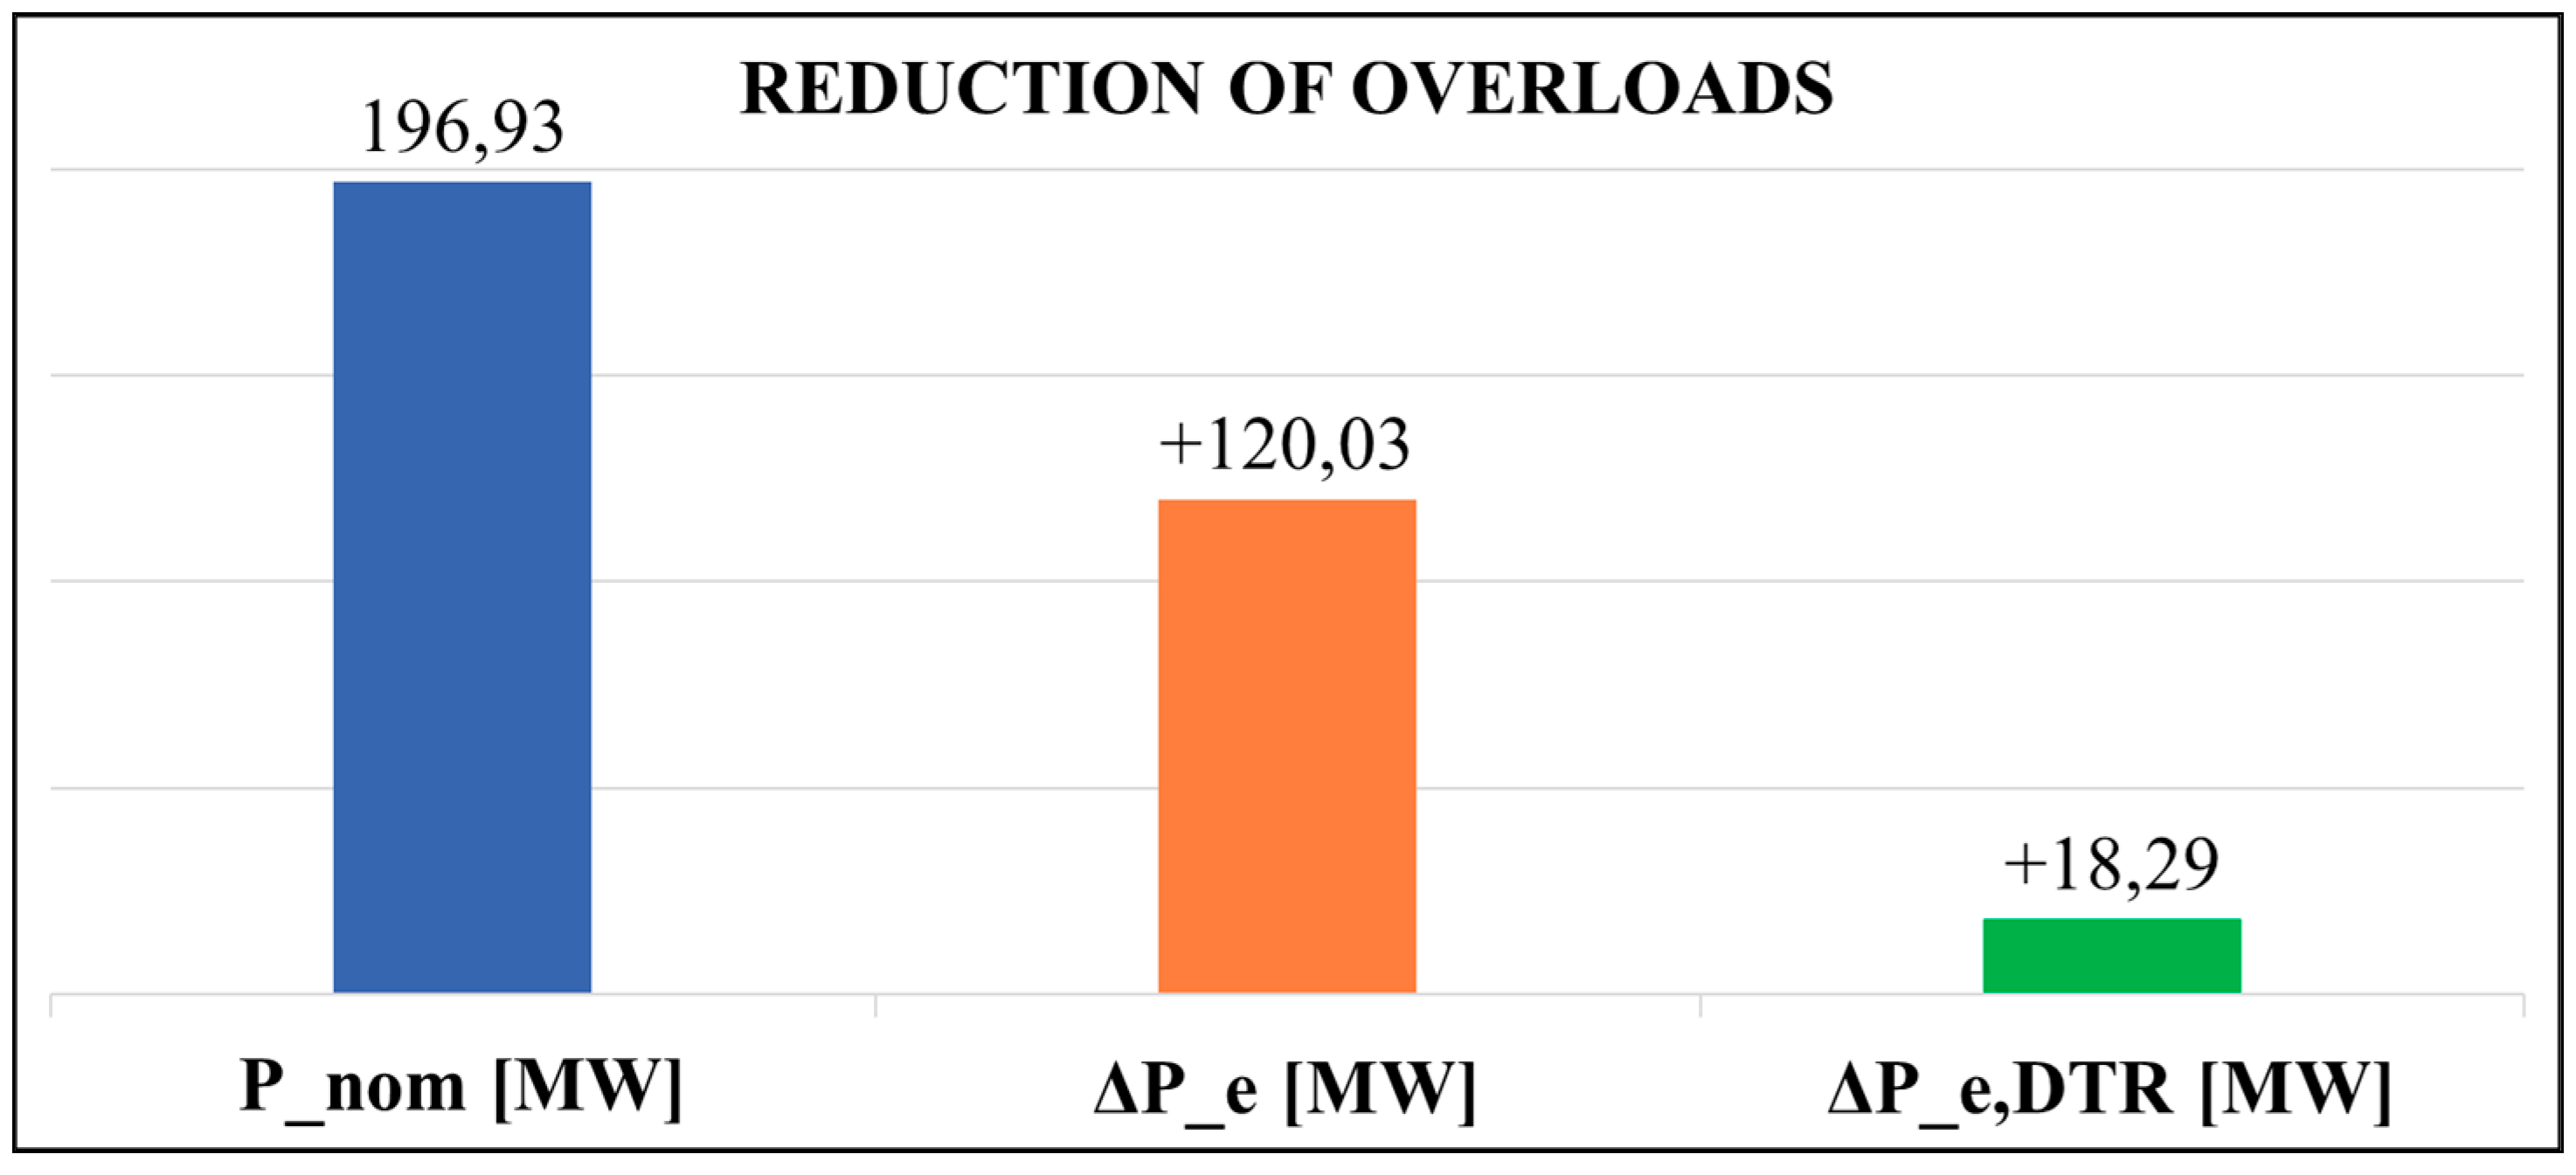
Figure 5.
Reduction of economic costs.
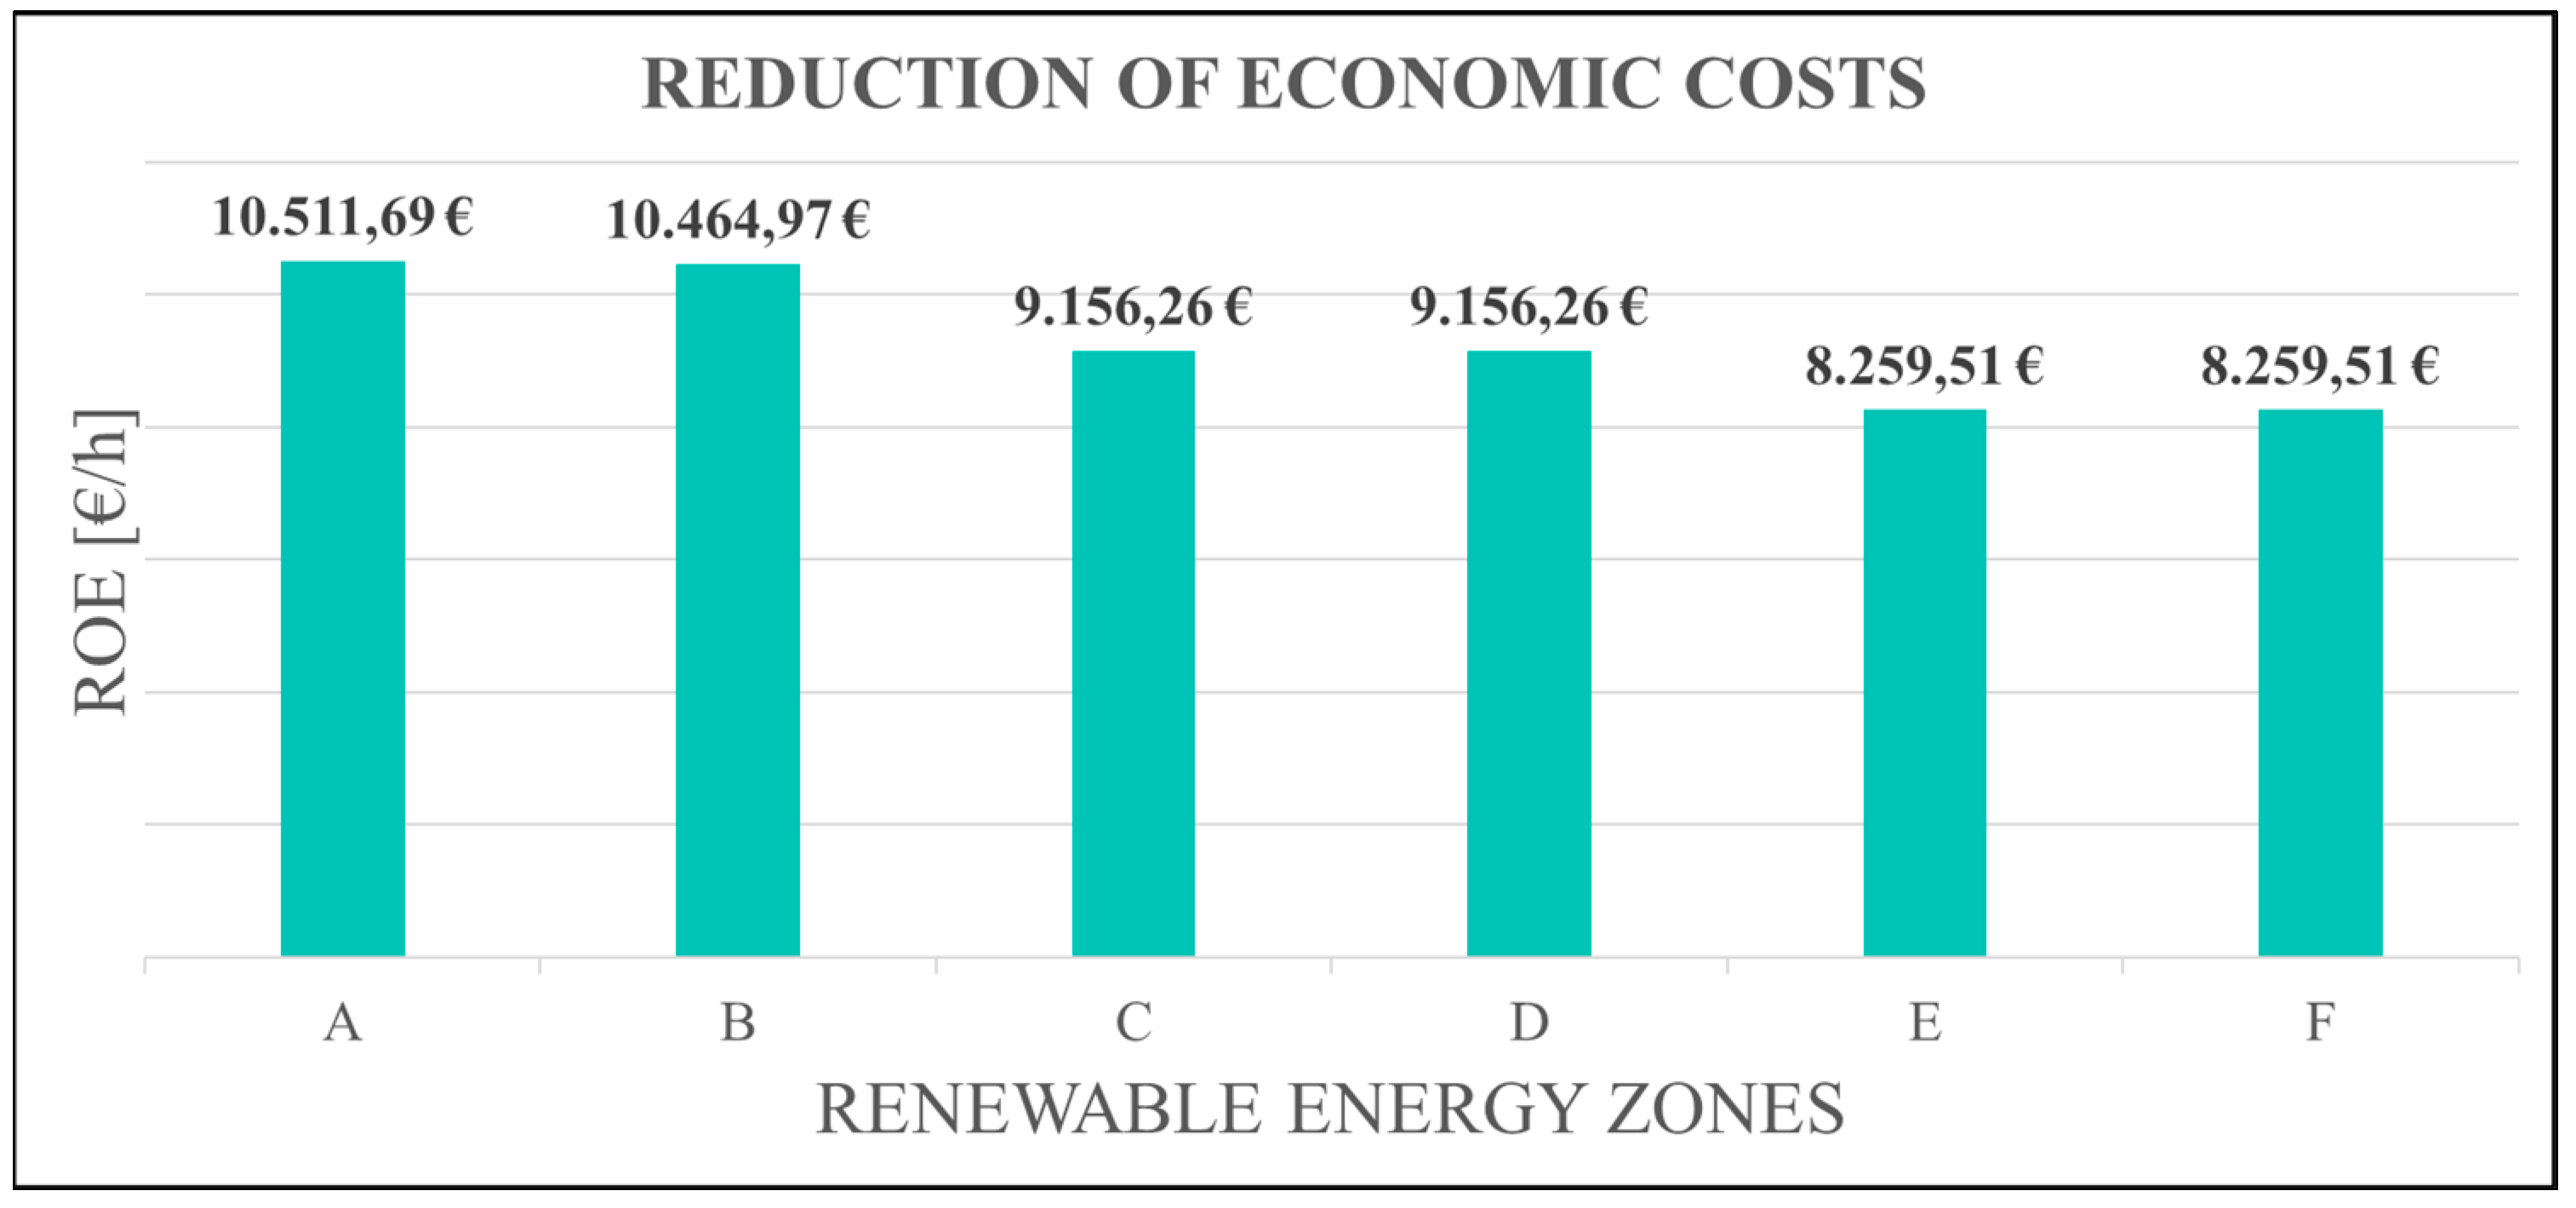

Table 1.
Classification of municipalities.
| Data referring to january | |||||
| Municipality | Tm [°C] | Vm [km/h] | Temperature | Wind speed | |
| Acate | 9,67 | 21,63 | High T | High W.S. | |
| Adrano | 6,94 | 8,27 | Low T | Low W.S. | |
| Aci Castello | 10,64 | 9,58 | High T | Medium W.S. | |
| Aci Catena | 9,75 | 9,58 | High T | Medium W.S. | |
Table 2.
Determination of climatic classes.
| Determination of climatic classes | ||
| Class | Temperature | Wind speed |
| 1 | Low T | High W.S. |
| 2 | Medium T | High W.S. |
| 3 | High T | High W.S. |
| 4 | Low T | Medium W.S. |
| 5 | Medium T | Medium W.S. |
| 6 | High T | Medium W.S. |
| 7 | Low T | Low W.S. |
| 8 | Medium T | Low W.S. |
| 9 | High T | Low W.S. |
Table 3.
Windiness of the provinces.
| Windiness of the provinces | ||
| Province | January-June | July-December |
| Agrigento | Low T | High W.S. |
| Caltanissetta | Medium T | High W.S. |
| Catania | High T | High W.S. |
| Enna | Low T | Medium W.S. |
| Messina | Medium T | Medium W.S. |
| Palermo | High T | Medium W.S. |
| Ragusa | Low T | Low W.S. |
| Syracuse | Medium T | Low W.S. |
| Trapani | High T | Low W.S. |
Table 4.
Brief economic considerations.
| REZ’S HOT SPOT | ||
| A | 116,80 | 10511,69 |
| B | 116,28 | 10464,97 |
| C | 101,74 | 9156,26 |
| D | 101,74 | 9156,26 |
| E | 91,77 | 8259,51 |
| F | 88,69 | 8259,51 |
Table 5.
Comparison on Dynamic Thermal Rating results.
| Transmission line | Average ampacity DTR Terna [A] | Proposed average ampacity[A] |
| 220 kV line | 1370 | 1371 |
| 150 kV line | 785 | 886 |
Disclaimer/Publisher’s Note: The statements, opinions and data contained in all publications are solely those of the individual author(s) and contributor(s) and not of MDPI and/or the editor(s). MDPI and/or the editor(s) disclaim responsibility for any injury to people or property resulting from any ideas, methods, instructions or products referred to in the content. |
© 2024 by the authors. Licensee MDPI, Basel, Switzerland. This article is an open access article distributed under the terms and conditions of the Creative Commons Attribution (CC BY) license (https://creativecommons.org/licenses/by/4.0/).
Copyright: This open access article is published under a Creative Commons CC BY 4.0 license, which permit the free download, distribution, and reuse, provided that the author and preprint are cited in any reuse.


