
Submitted:
11 December 2024
Posted:
12 December 2024
You are already at the latest version
Abstract
Finger vein recognition has gained significant attention for its importance in enhancing security, safeguarding privacy, and ensuring reliable liveness detection. As a foundation of vein recognition systems, vein detection faces challenges including low feature extraction efficiency, limited robustness, and a heavy reliance on real-world data. Additionally, environmental variability and advancements in spoofing technologies further exacerbate data privacy and security concerns. To address these challenges, this paper proposes MixCFormer, a hybrid CNN-Transformer architecture that incorporates Mixup data augmentation to improve the accuracy of finger vein liveness detection and reduce dependency on large-scale real datasets. First, The MixCFormer model applies baseline drift elimination, morphological filtering, and Butterworth filtering techniques to minimize the impact of background noise and illumination variations, thereby enhancing the clarity and recognizability of vein features. Next, finger vein video data is transformed into feature sequences, optimizing feature extraction and matching efficiency, effectively capturing dynamic time-series information and improving discrimination between live and forged samples. Furthermore, Mixup data augmentation is used to expand sample diversity and decrease dependency on extensive real datasets, thereby enhancing the model’s ability to recognize forged samples across diverse attack scenarios. Finally, the CNN and Transformer architecture leverages both local and global feature extraction capabilities to capture vein feature correlations and dependencies. Residual connections improve feature propagation, enhancing the stability of feature representations in liveness detection. Rigorous experimental evaluations demonstrate that MixCFormer achieves a detection accuracy of 99.51% on finger vein datasets, significantly outperforming existing methods.
Keywords:
1. Introduction
1.1. Related Work
1.2. Motivation
1.3. Our Work
- MixCFormer Architecture: We propose MixCFormer, a convolutional-transformer hybrid architecture with residual linking, which combines the local feature extraction capabilities of CNNs with the global context modeling of Transformers. The CNN branch captures local vein texture features, while the Transformer branch integrates global information to capture long-range dependencies. Residual linking enhances the efficiency of feature transfer, improving the stability of feature representation. This architectural synergy enables MixCFormer to achieve higher accuracy and robustness in the complex task of finger vein liveness detection.
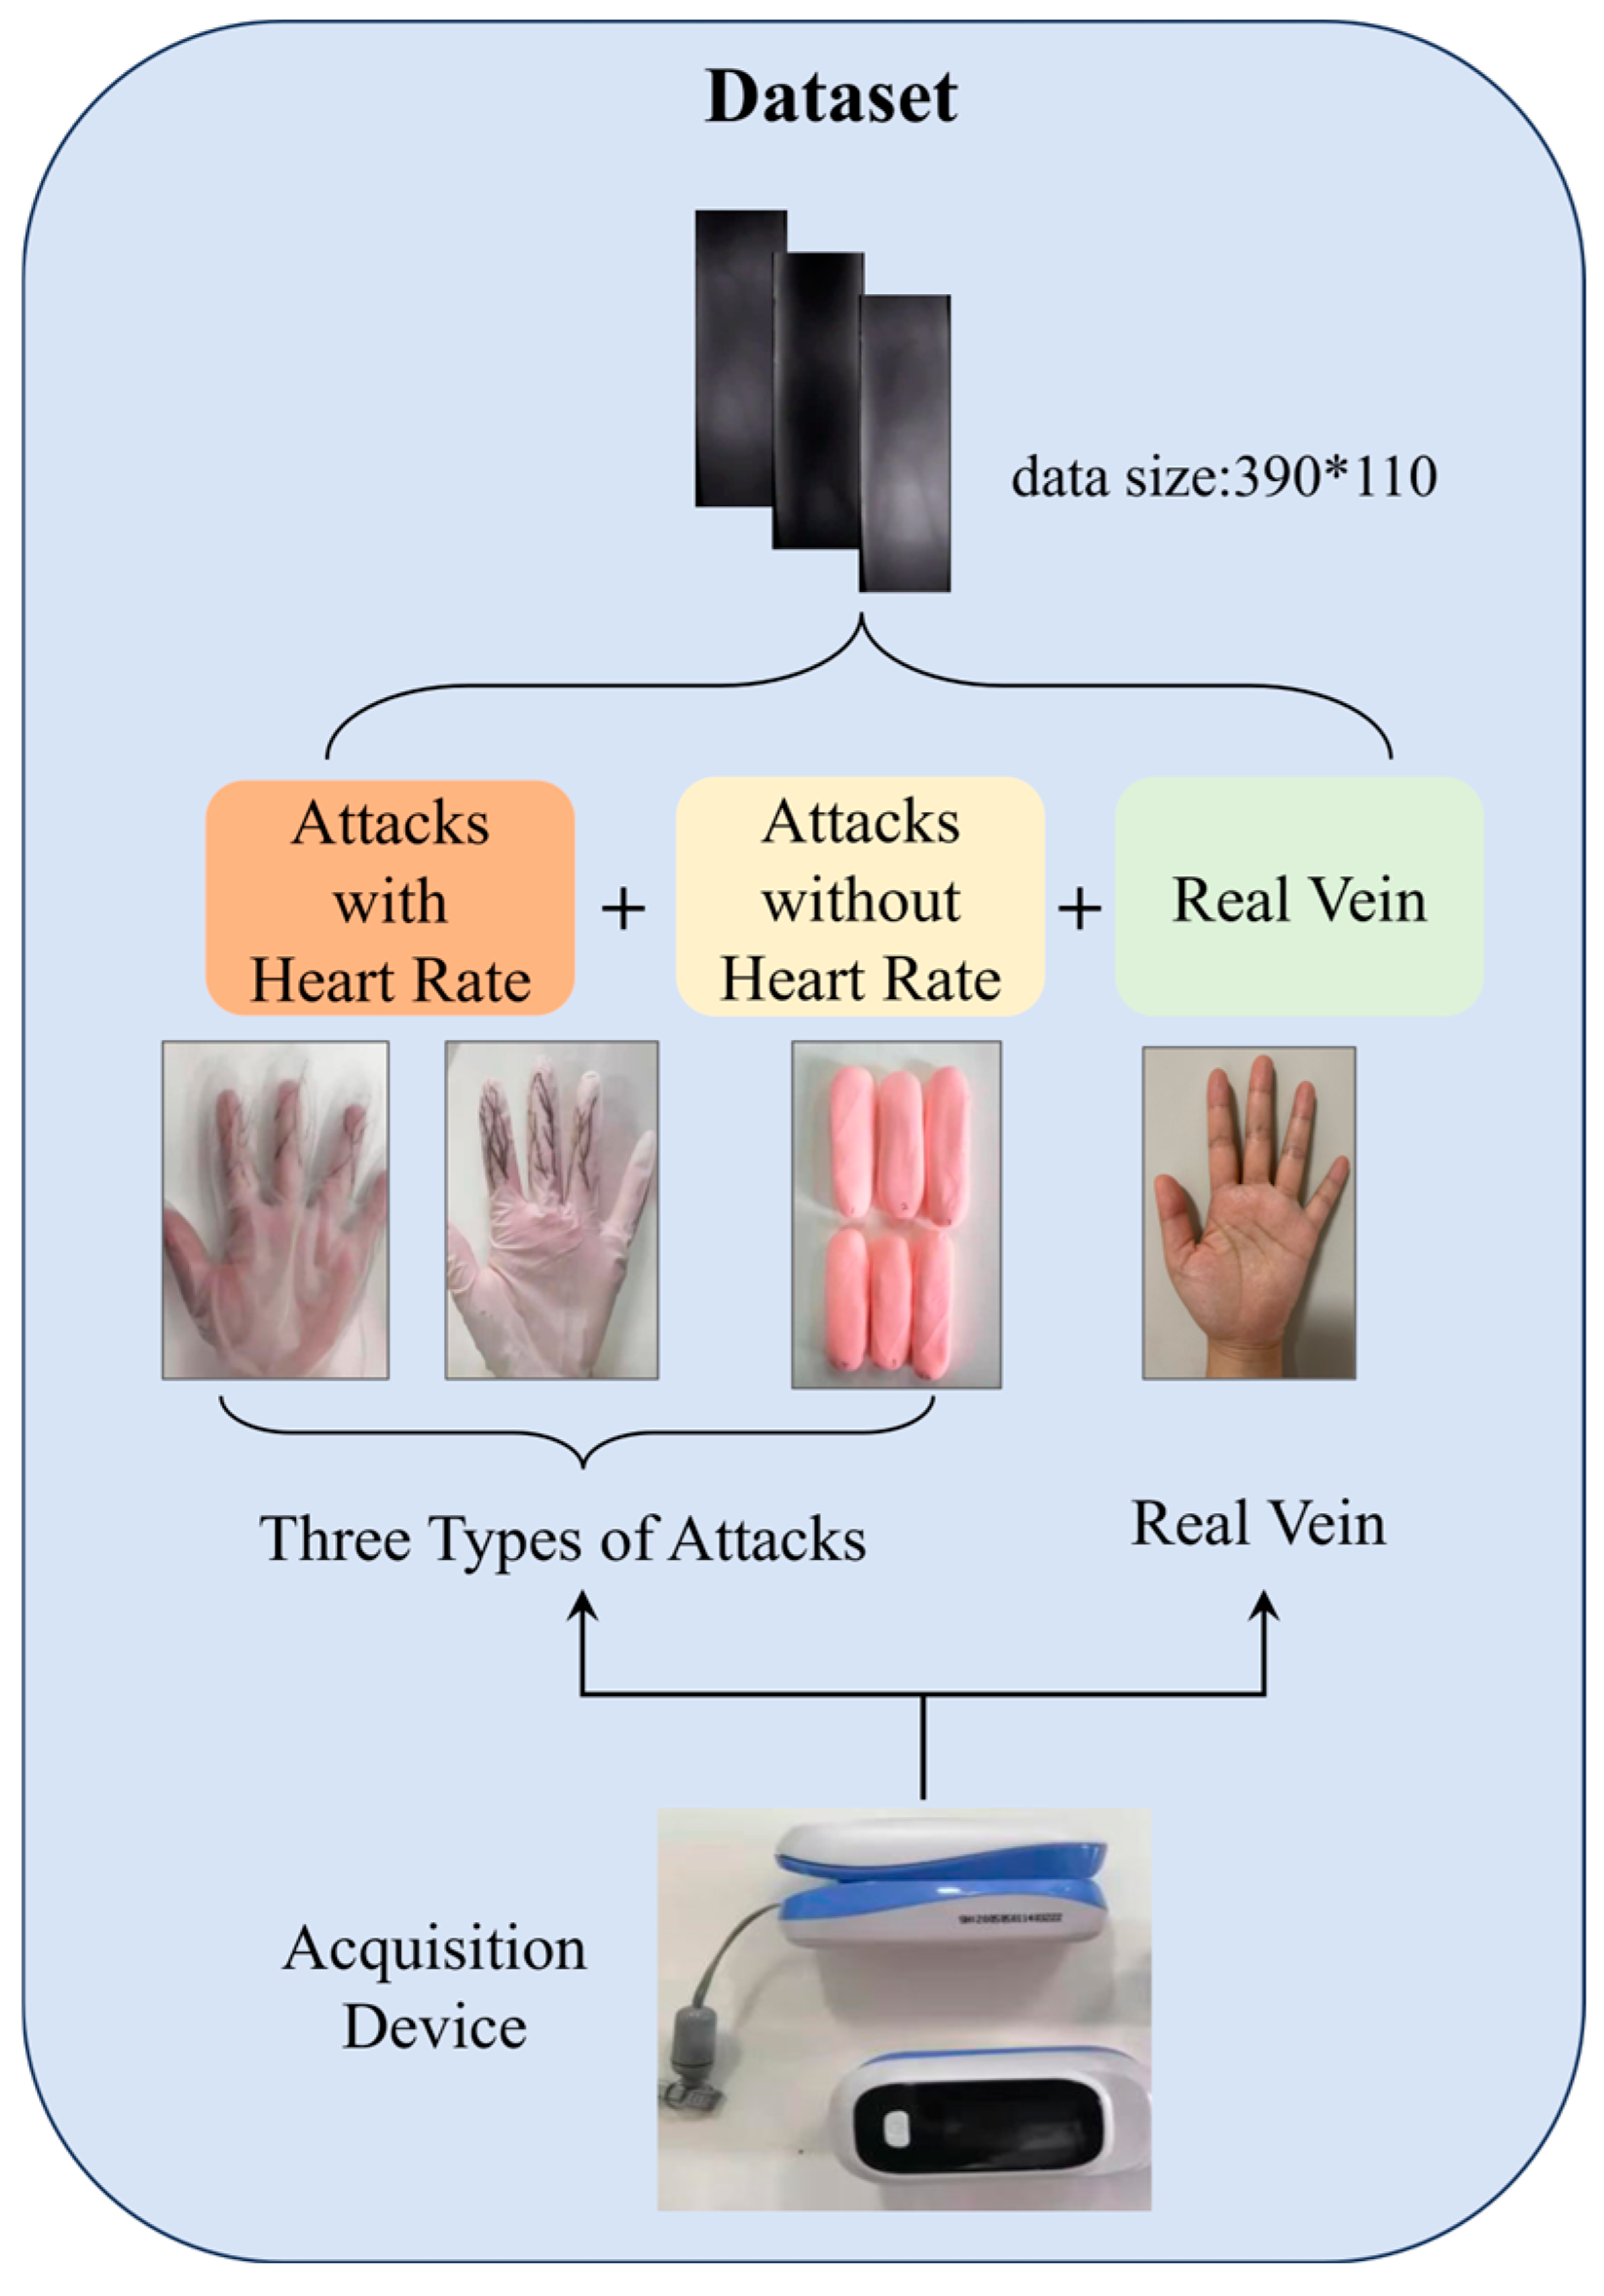
- Mixup Data Enhancement: We introduce the Mixup data augmentation technique to improve the generalization ability of the model, reduce reliance on large-scale real datasets, and enhance the recognition accuracy for forged samples. Additionally, we construct a novel dataset that includes real live finger vein data as well as three types of attack samples (two live attacks and one non-live attack). This dataset enriches the diversity of training samples and provides a comprehensive validation foundation, enhancing the model's ability to recognize and resist various attack scenarios.
- Feature Sequence Processing: We propose an innovative approach that converts finger vein video data into feature sequences for more efficient processing. This method optimizes feature extraction and matching by capturing dynamically changing temporal information, which enhances the discriminative power between live and forged vein samples. As a result, the model's real-time performance and recognition speed are improved.
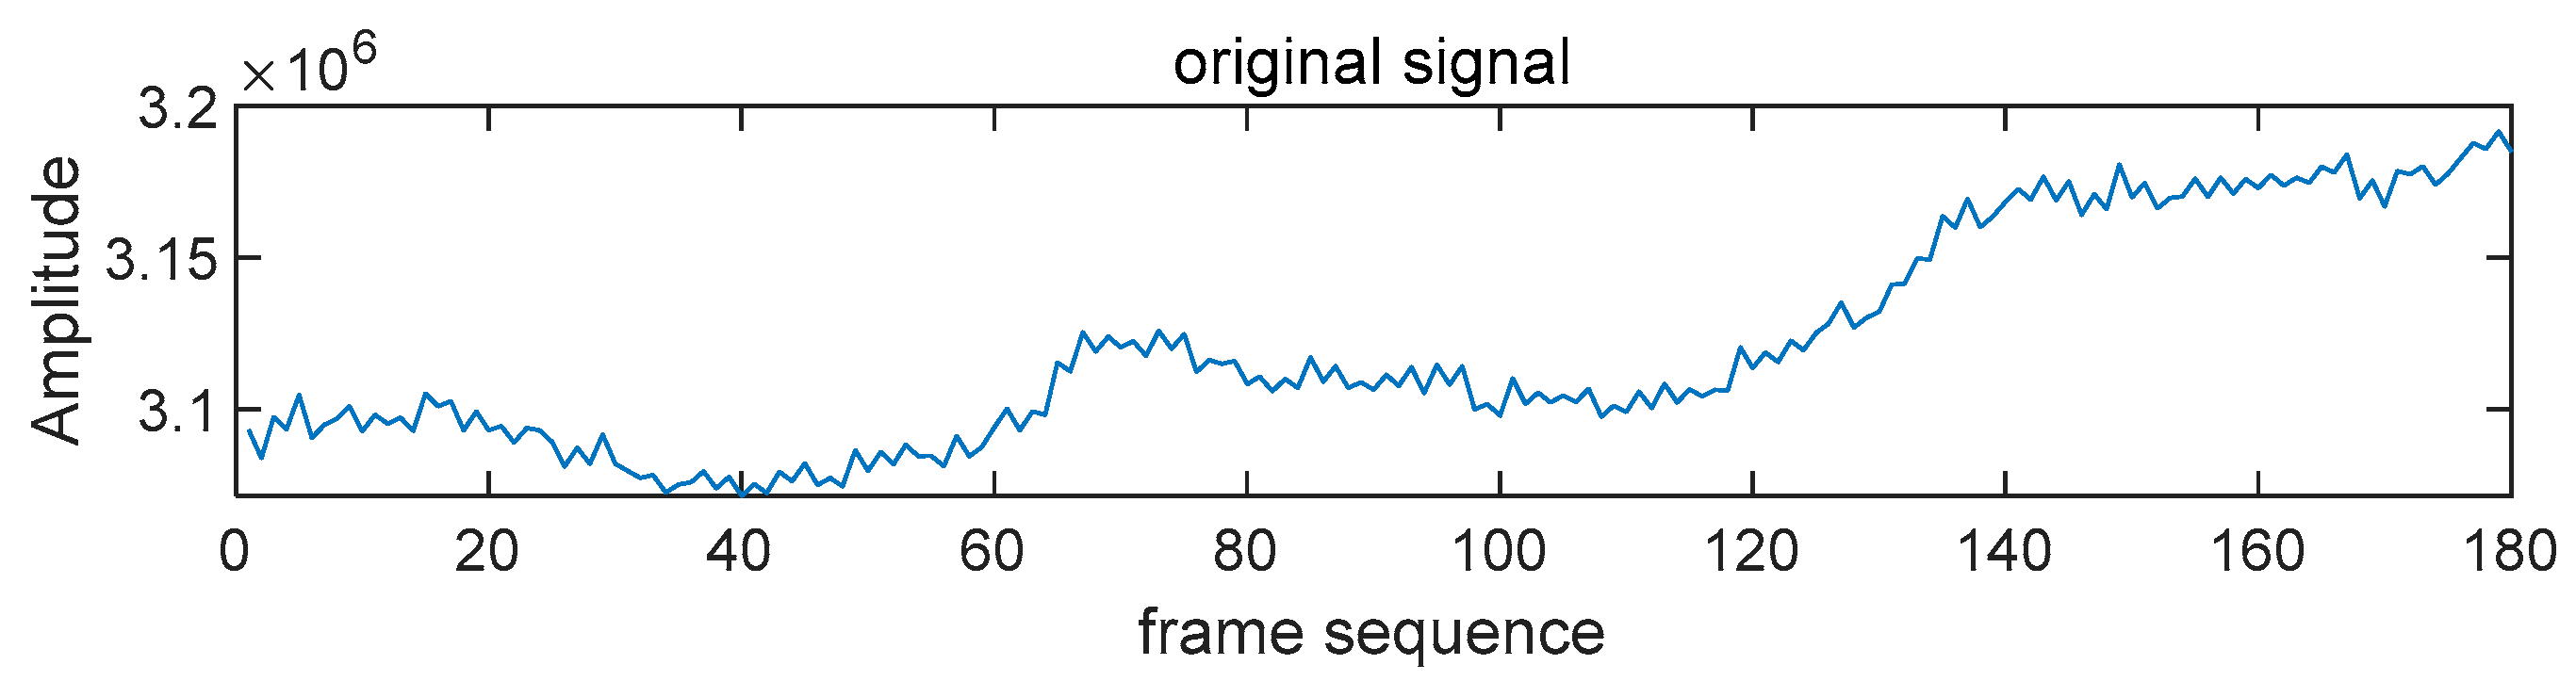
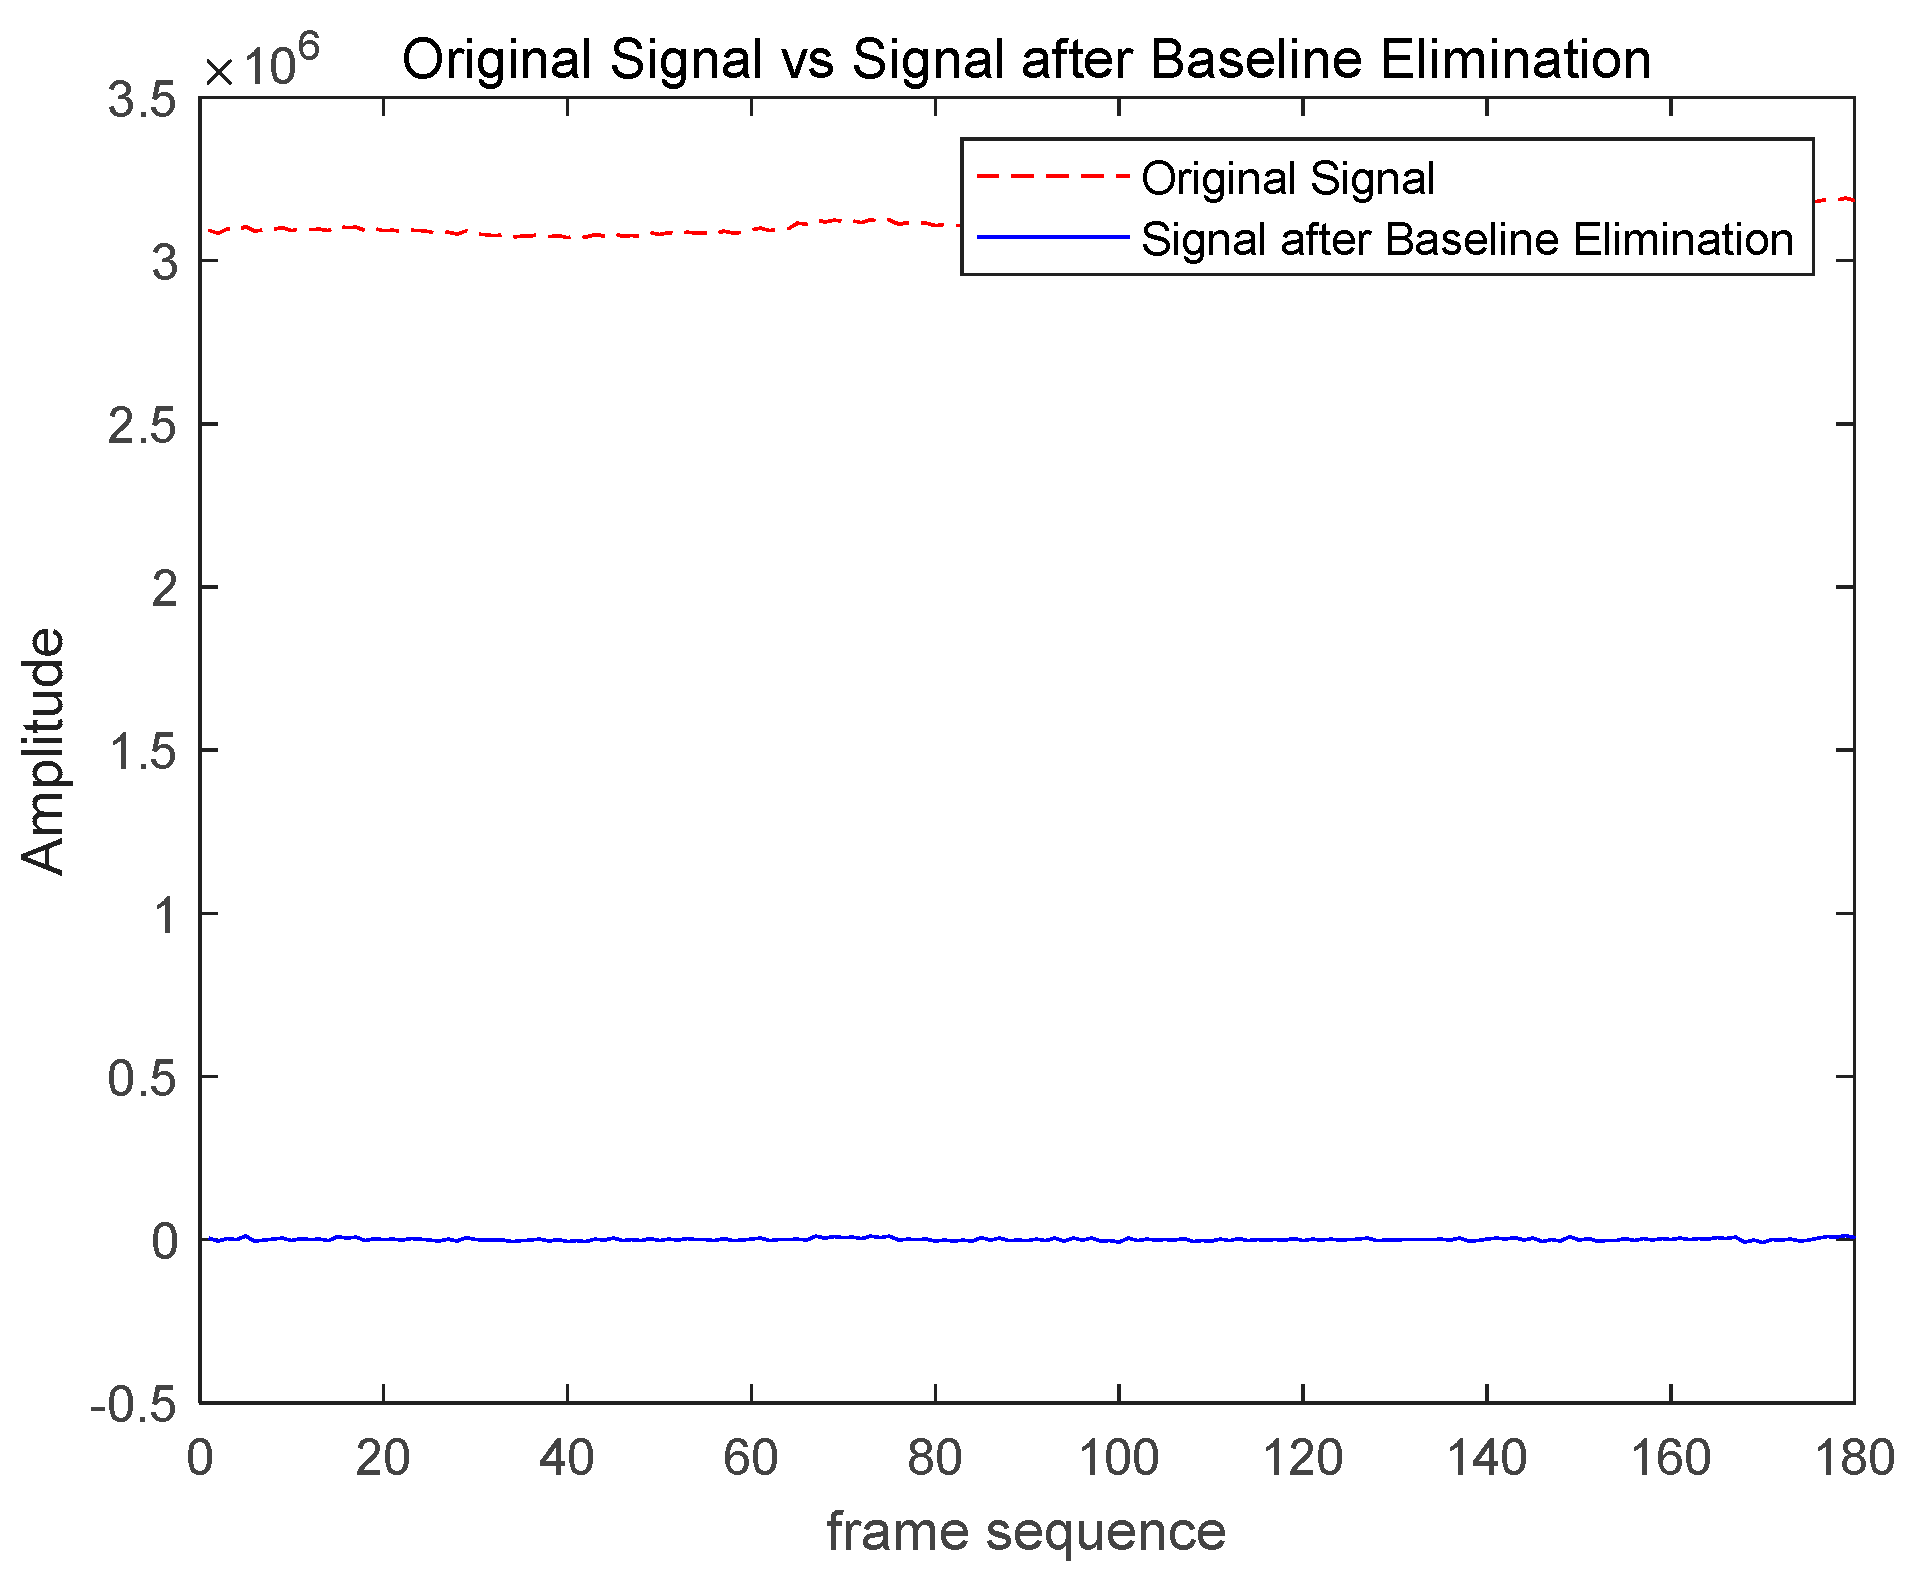
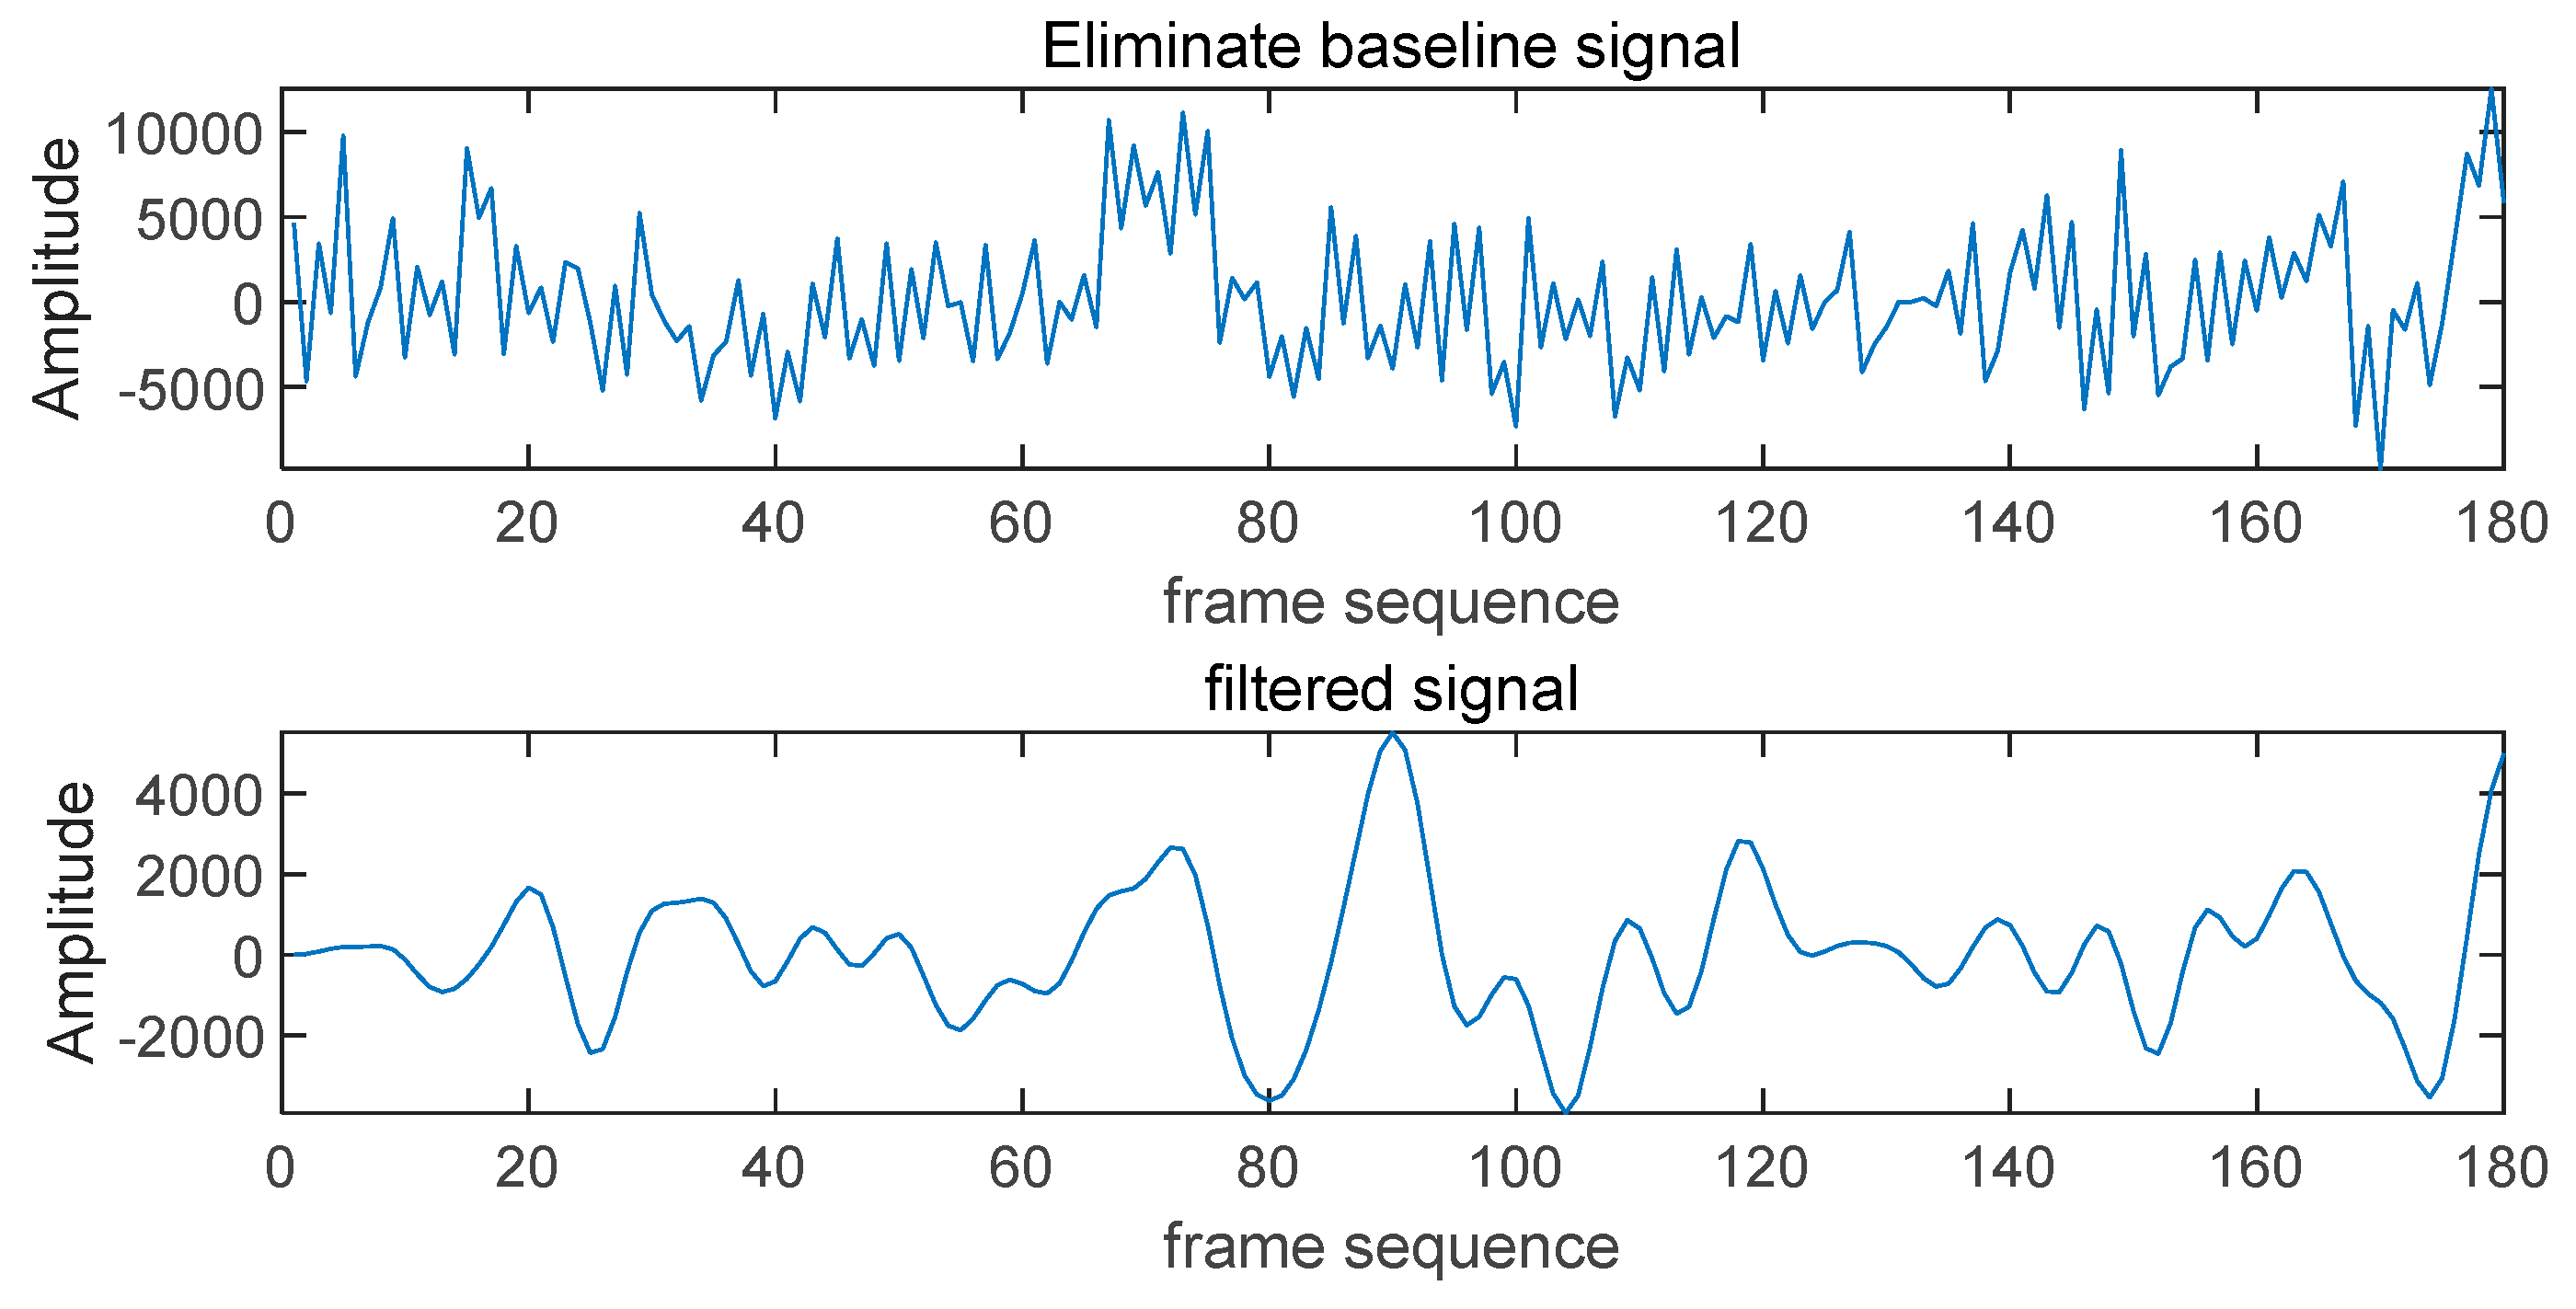
- Noise and Light Variation Suppression Techniques: For the first time, we apply a combination of baseline drift cancellation, morphological filtering, and Butterworth filtering to mitigate the impact of noise and light variation on finger vein liveness detection. Baseline drift cancellation eliminates low-frequency noise, morphological filtering optimizes image structure and accentuates vein features, and Butterworth filtering reduces high-frequency noise. The integration of these three techniques significantly enhances the model's robustness, maintaining excellent detection performance under complex lighting conditions and noisy environments, thereby improving the overall reliability and practicality of the system.
- Experimental Validation and Performance Enhancement: Rigorous experimental evaluations demonstrate that MixCFormer outperforms current state-of-the-art methods in terms of detection accuracy on finger vein datasets. This performance validation underscores the effectiveness and innovation of the proposed architecture, highlighting MixCFormer’s potential for enhanced performance and broader application in finger vein liveness detection tasks.
2. The Proposed Approach
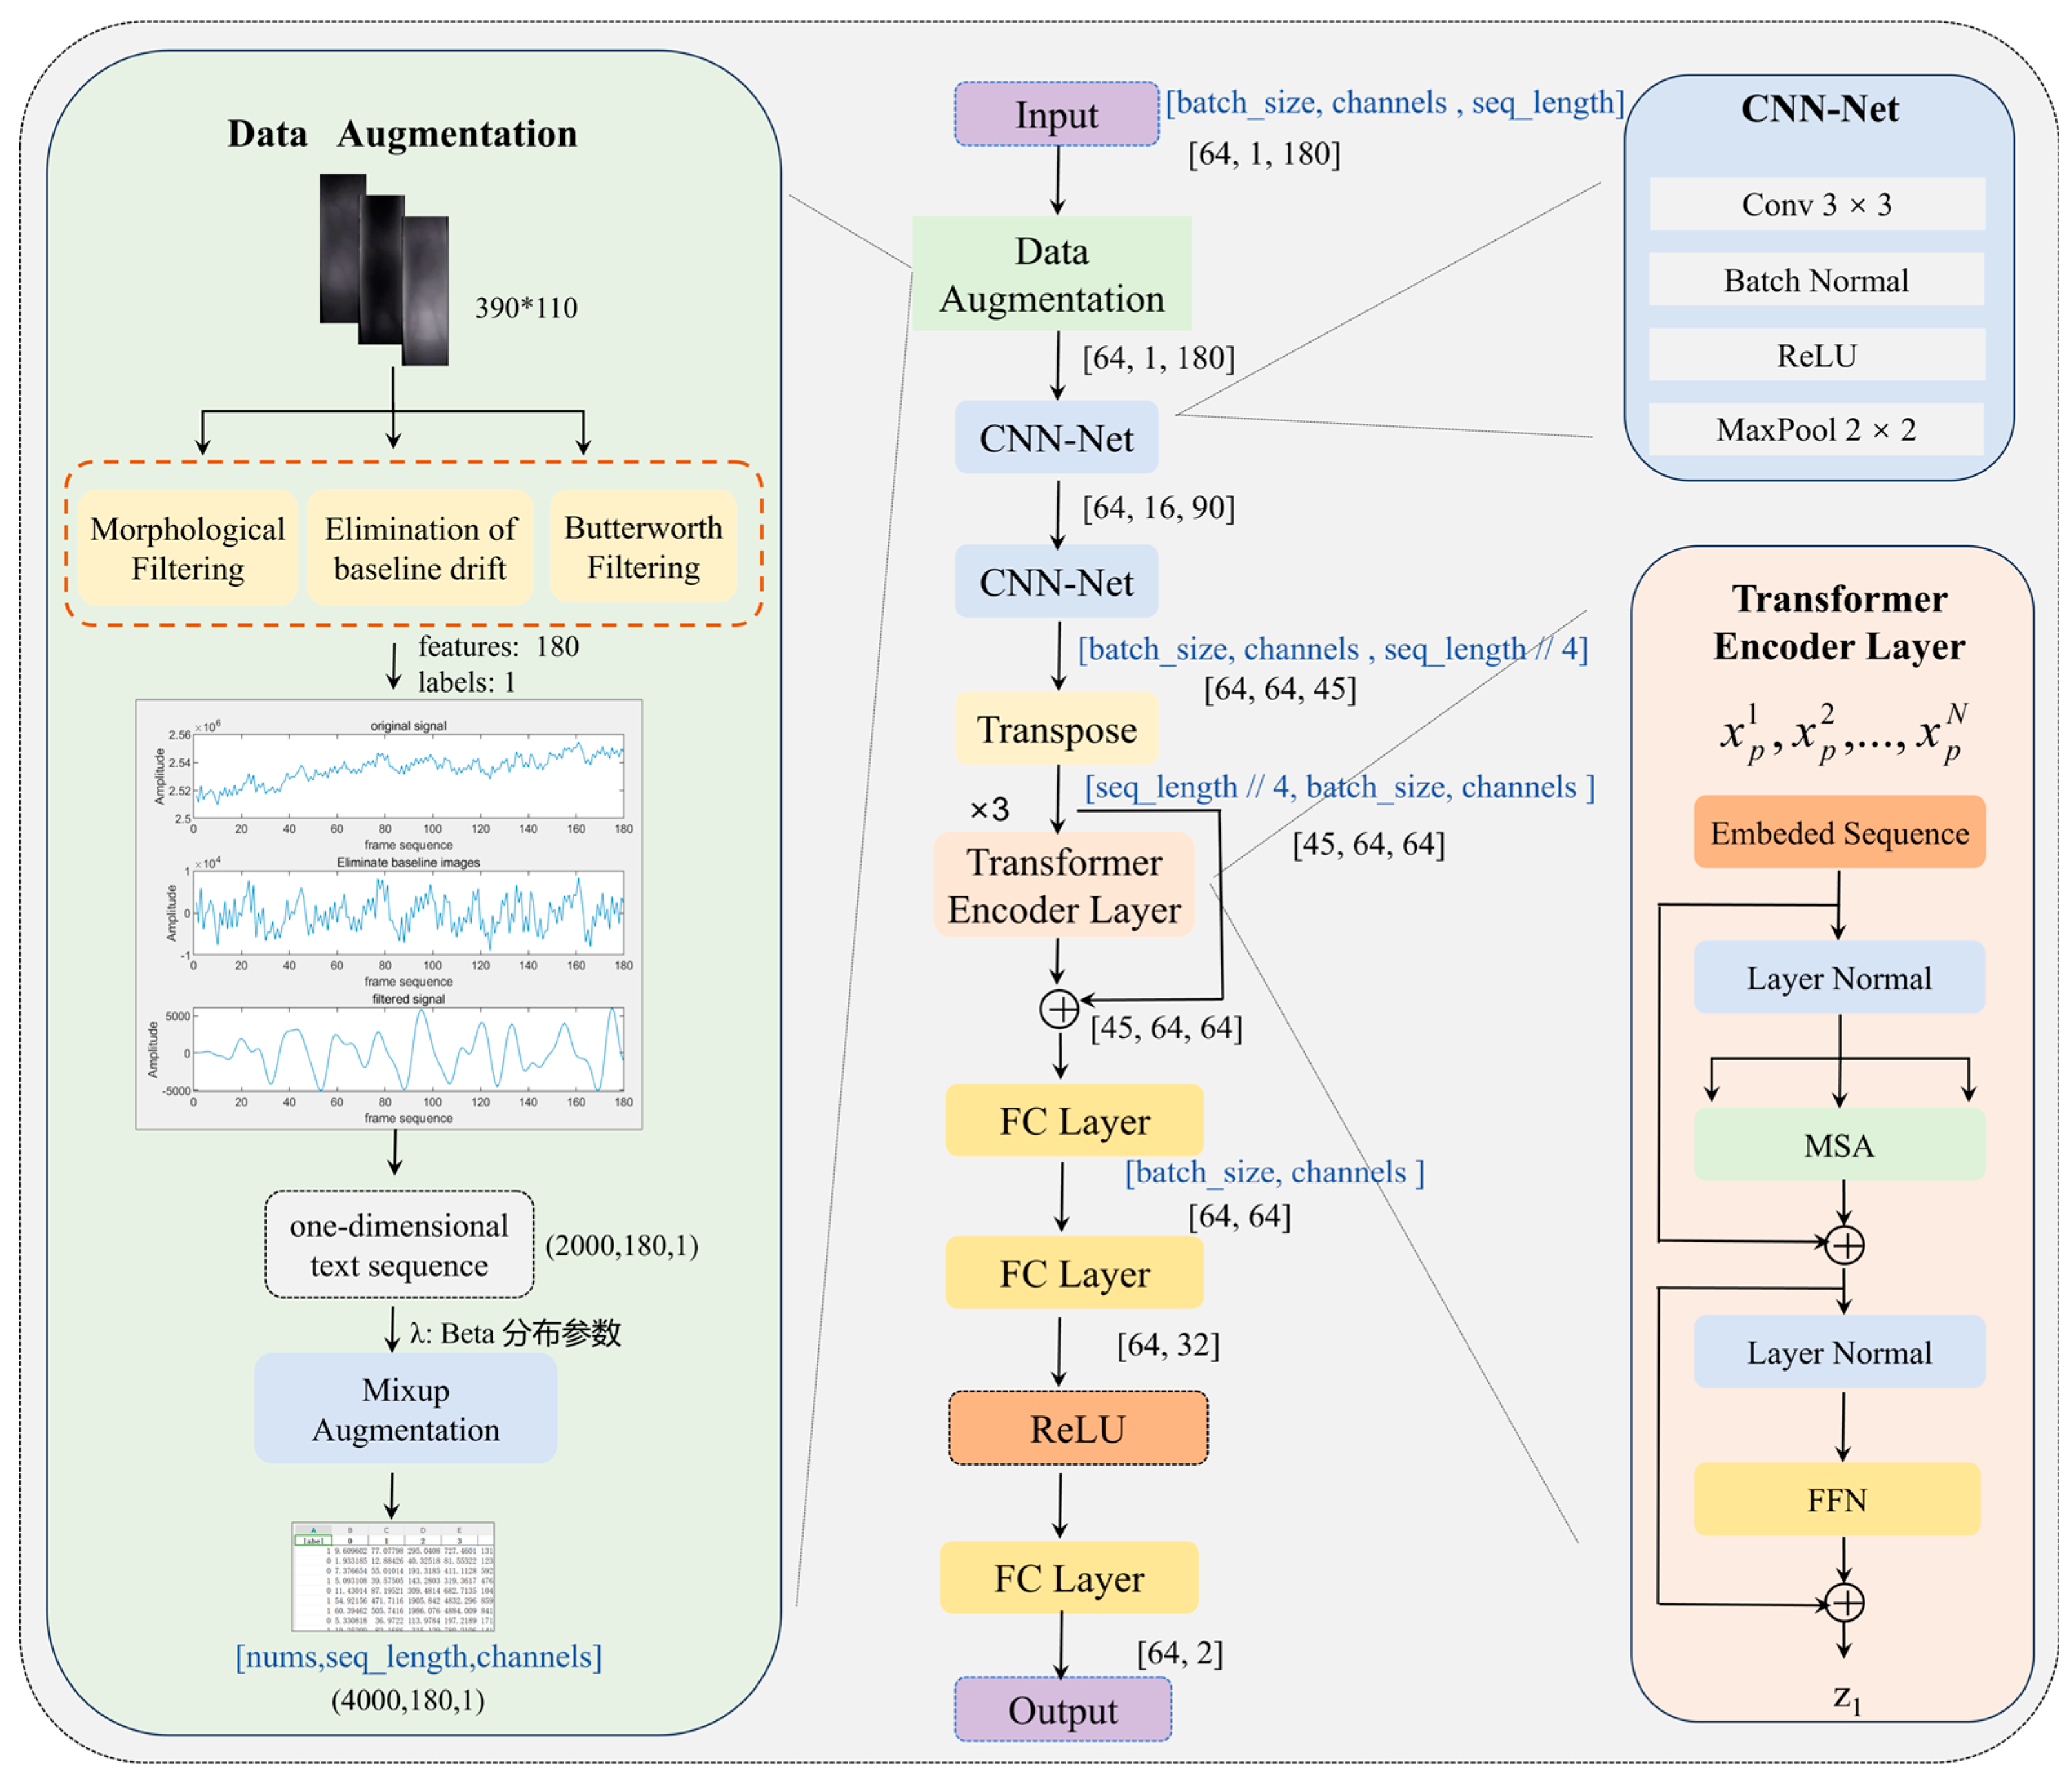
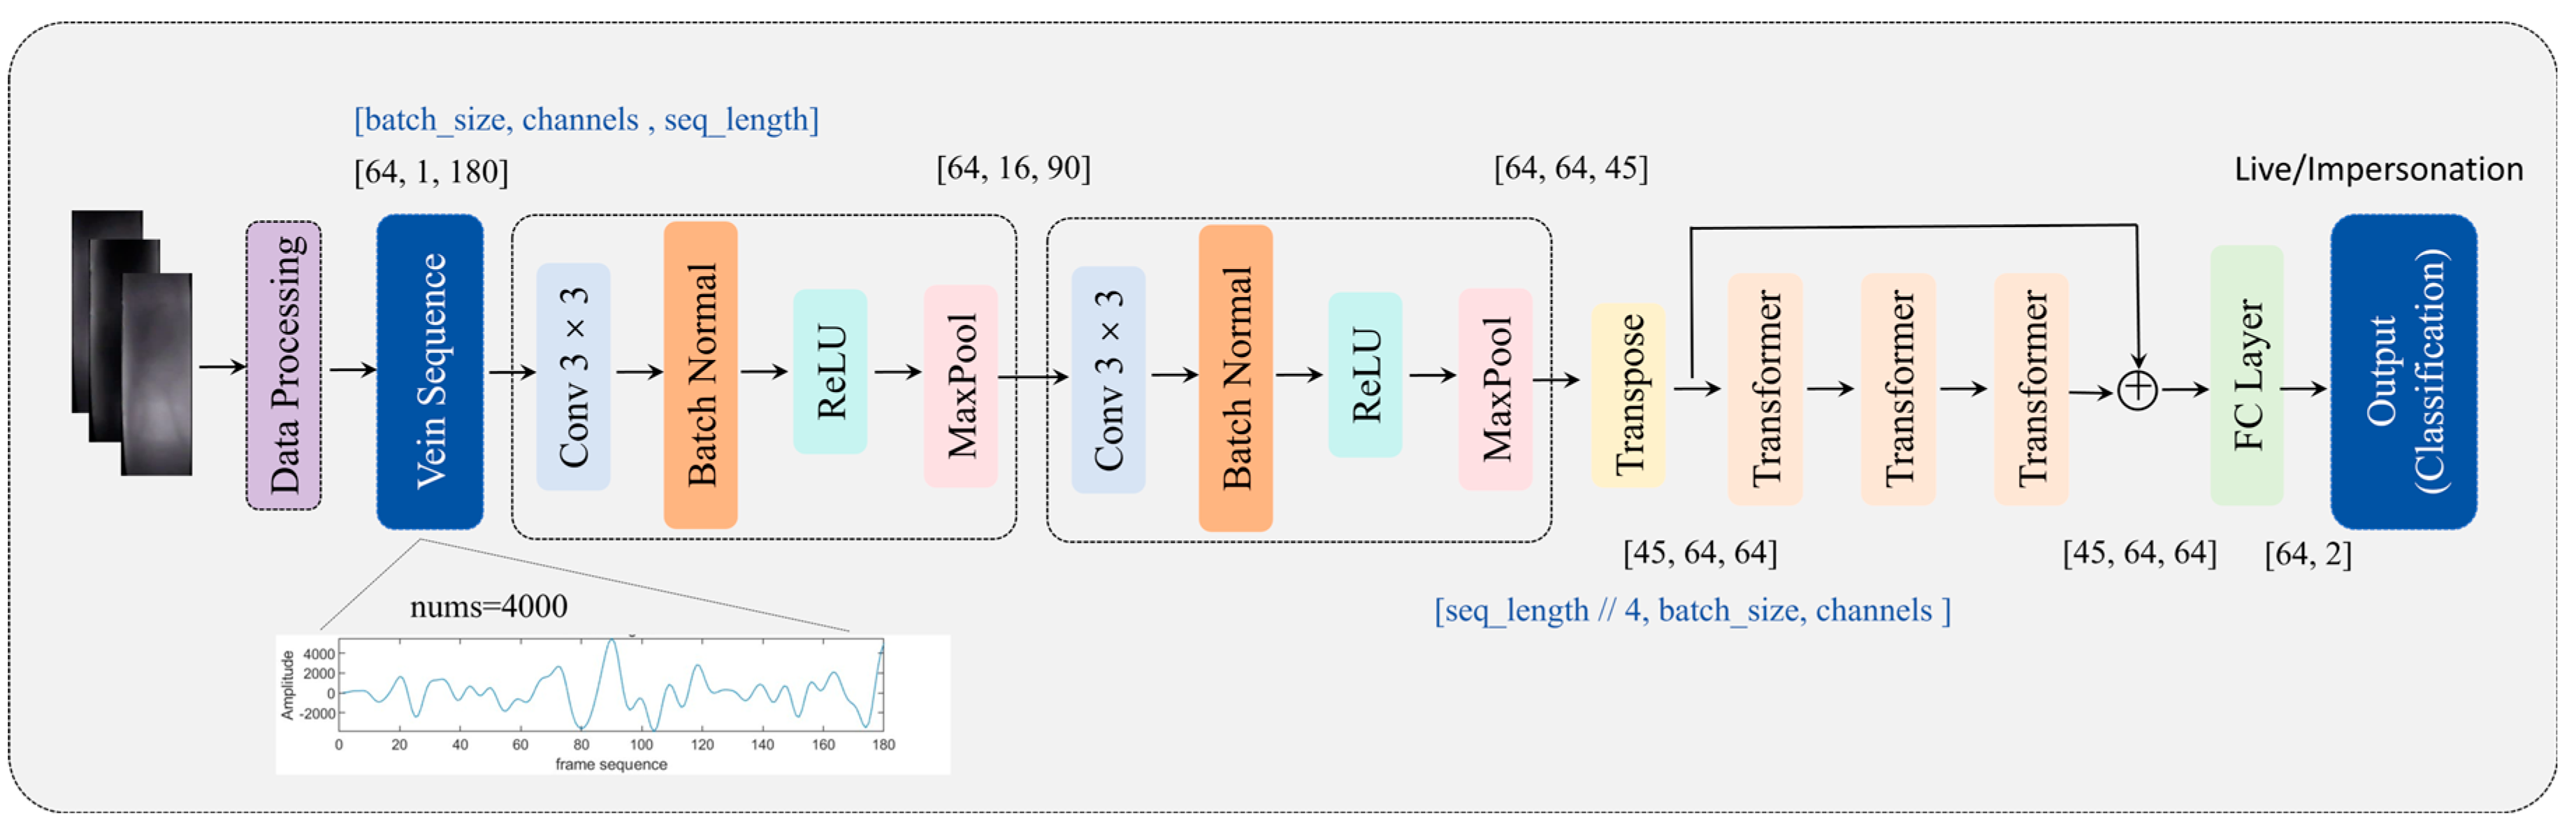
2.1. MixCFormer Model
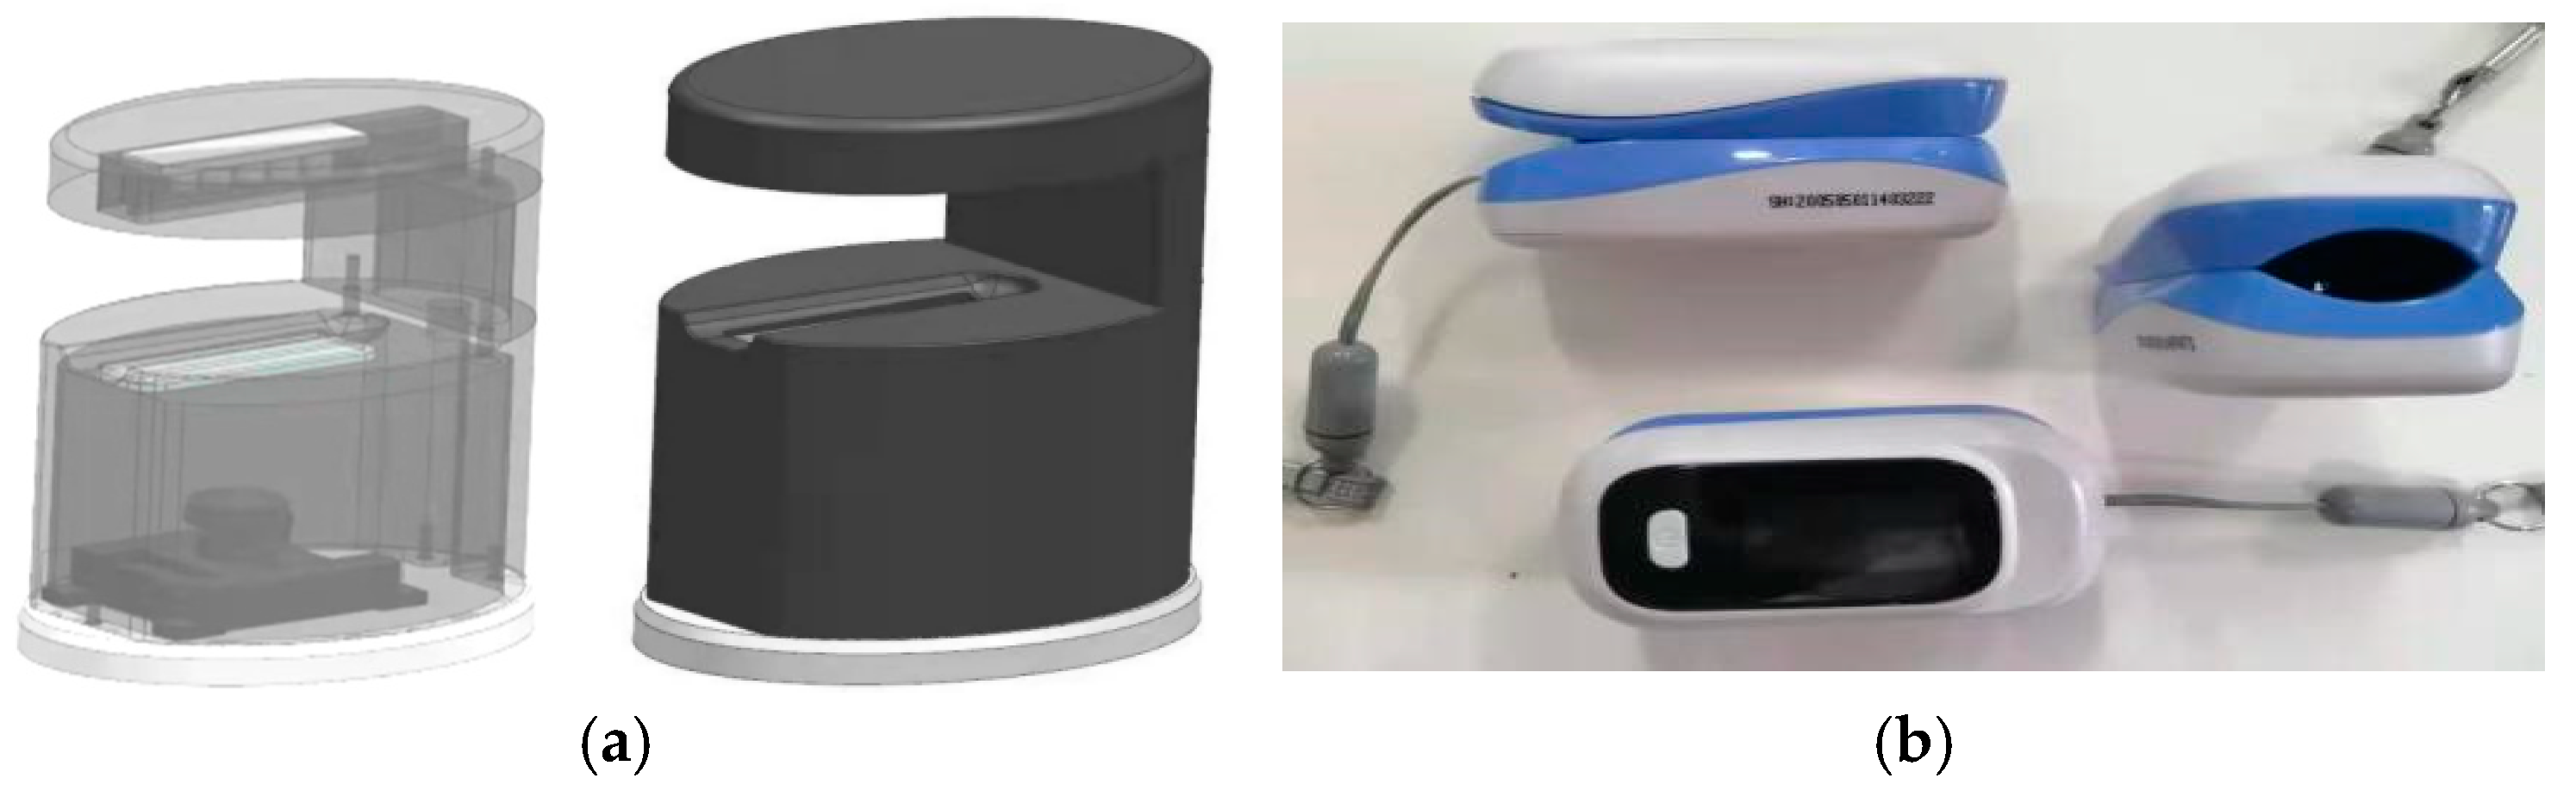
2.2. Data Acquisition and Processing
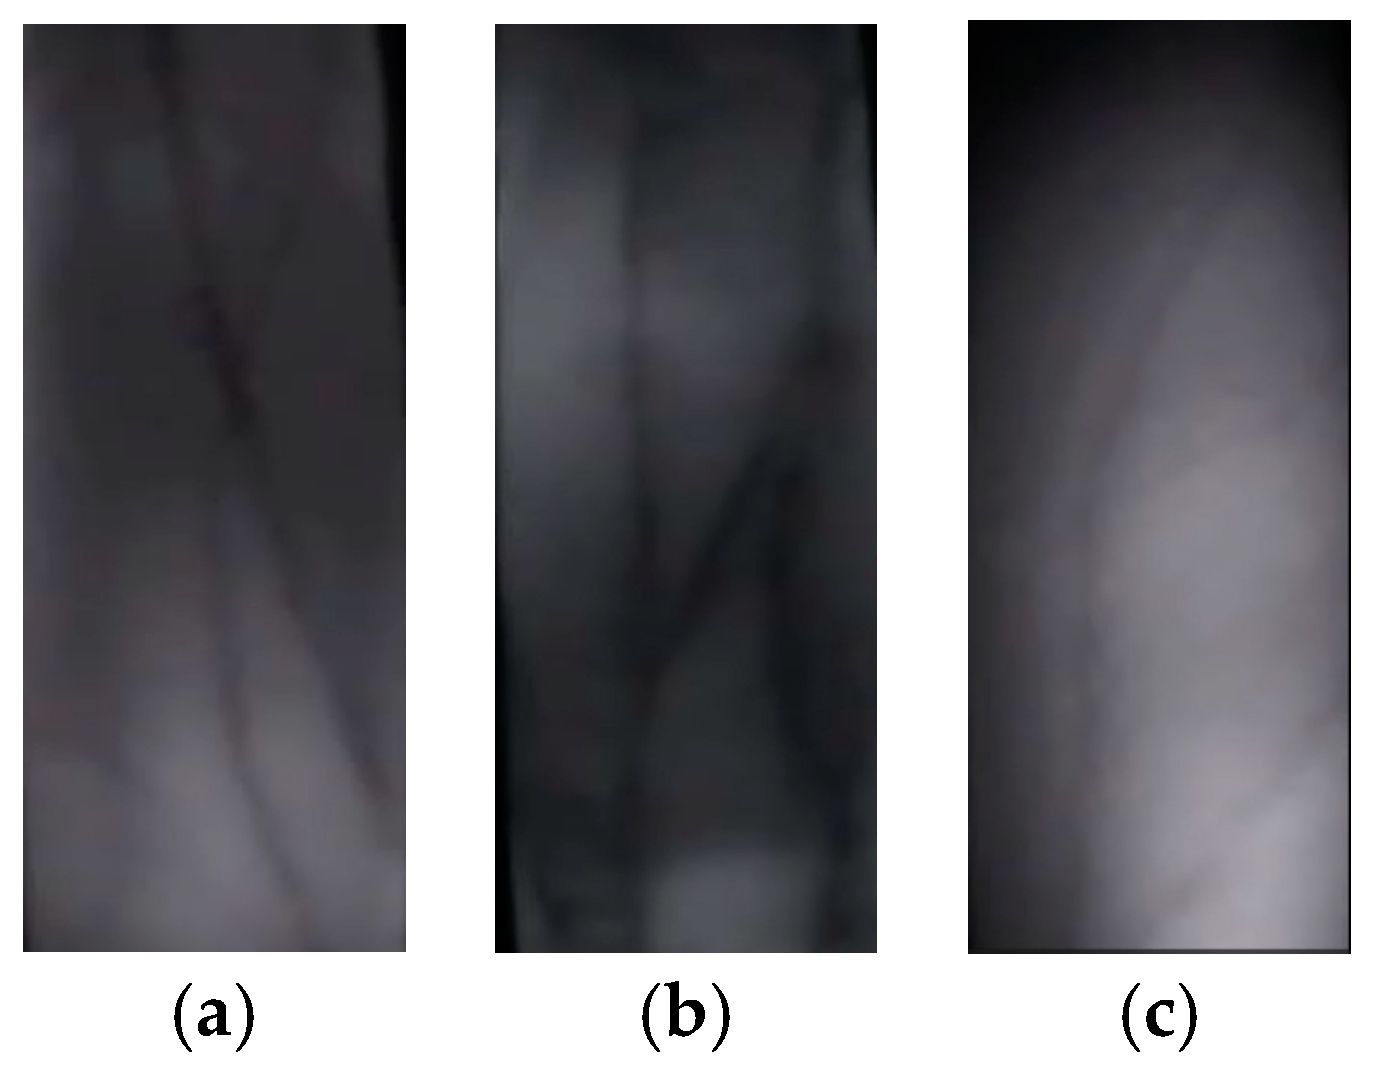
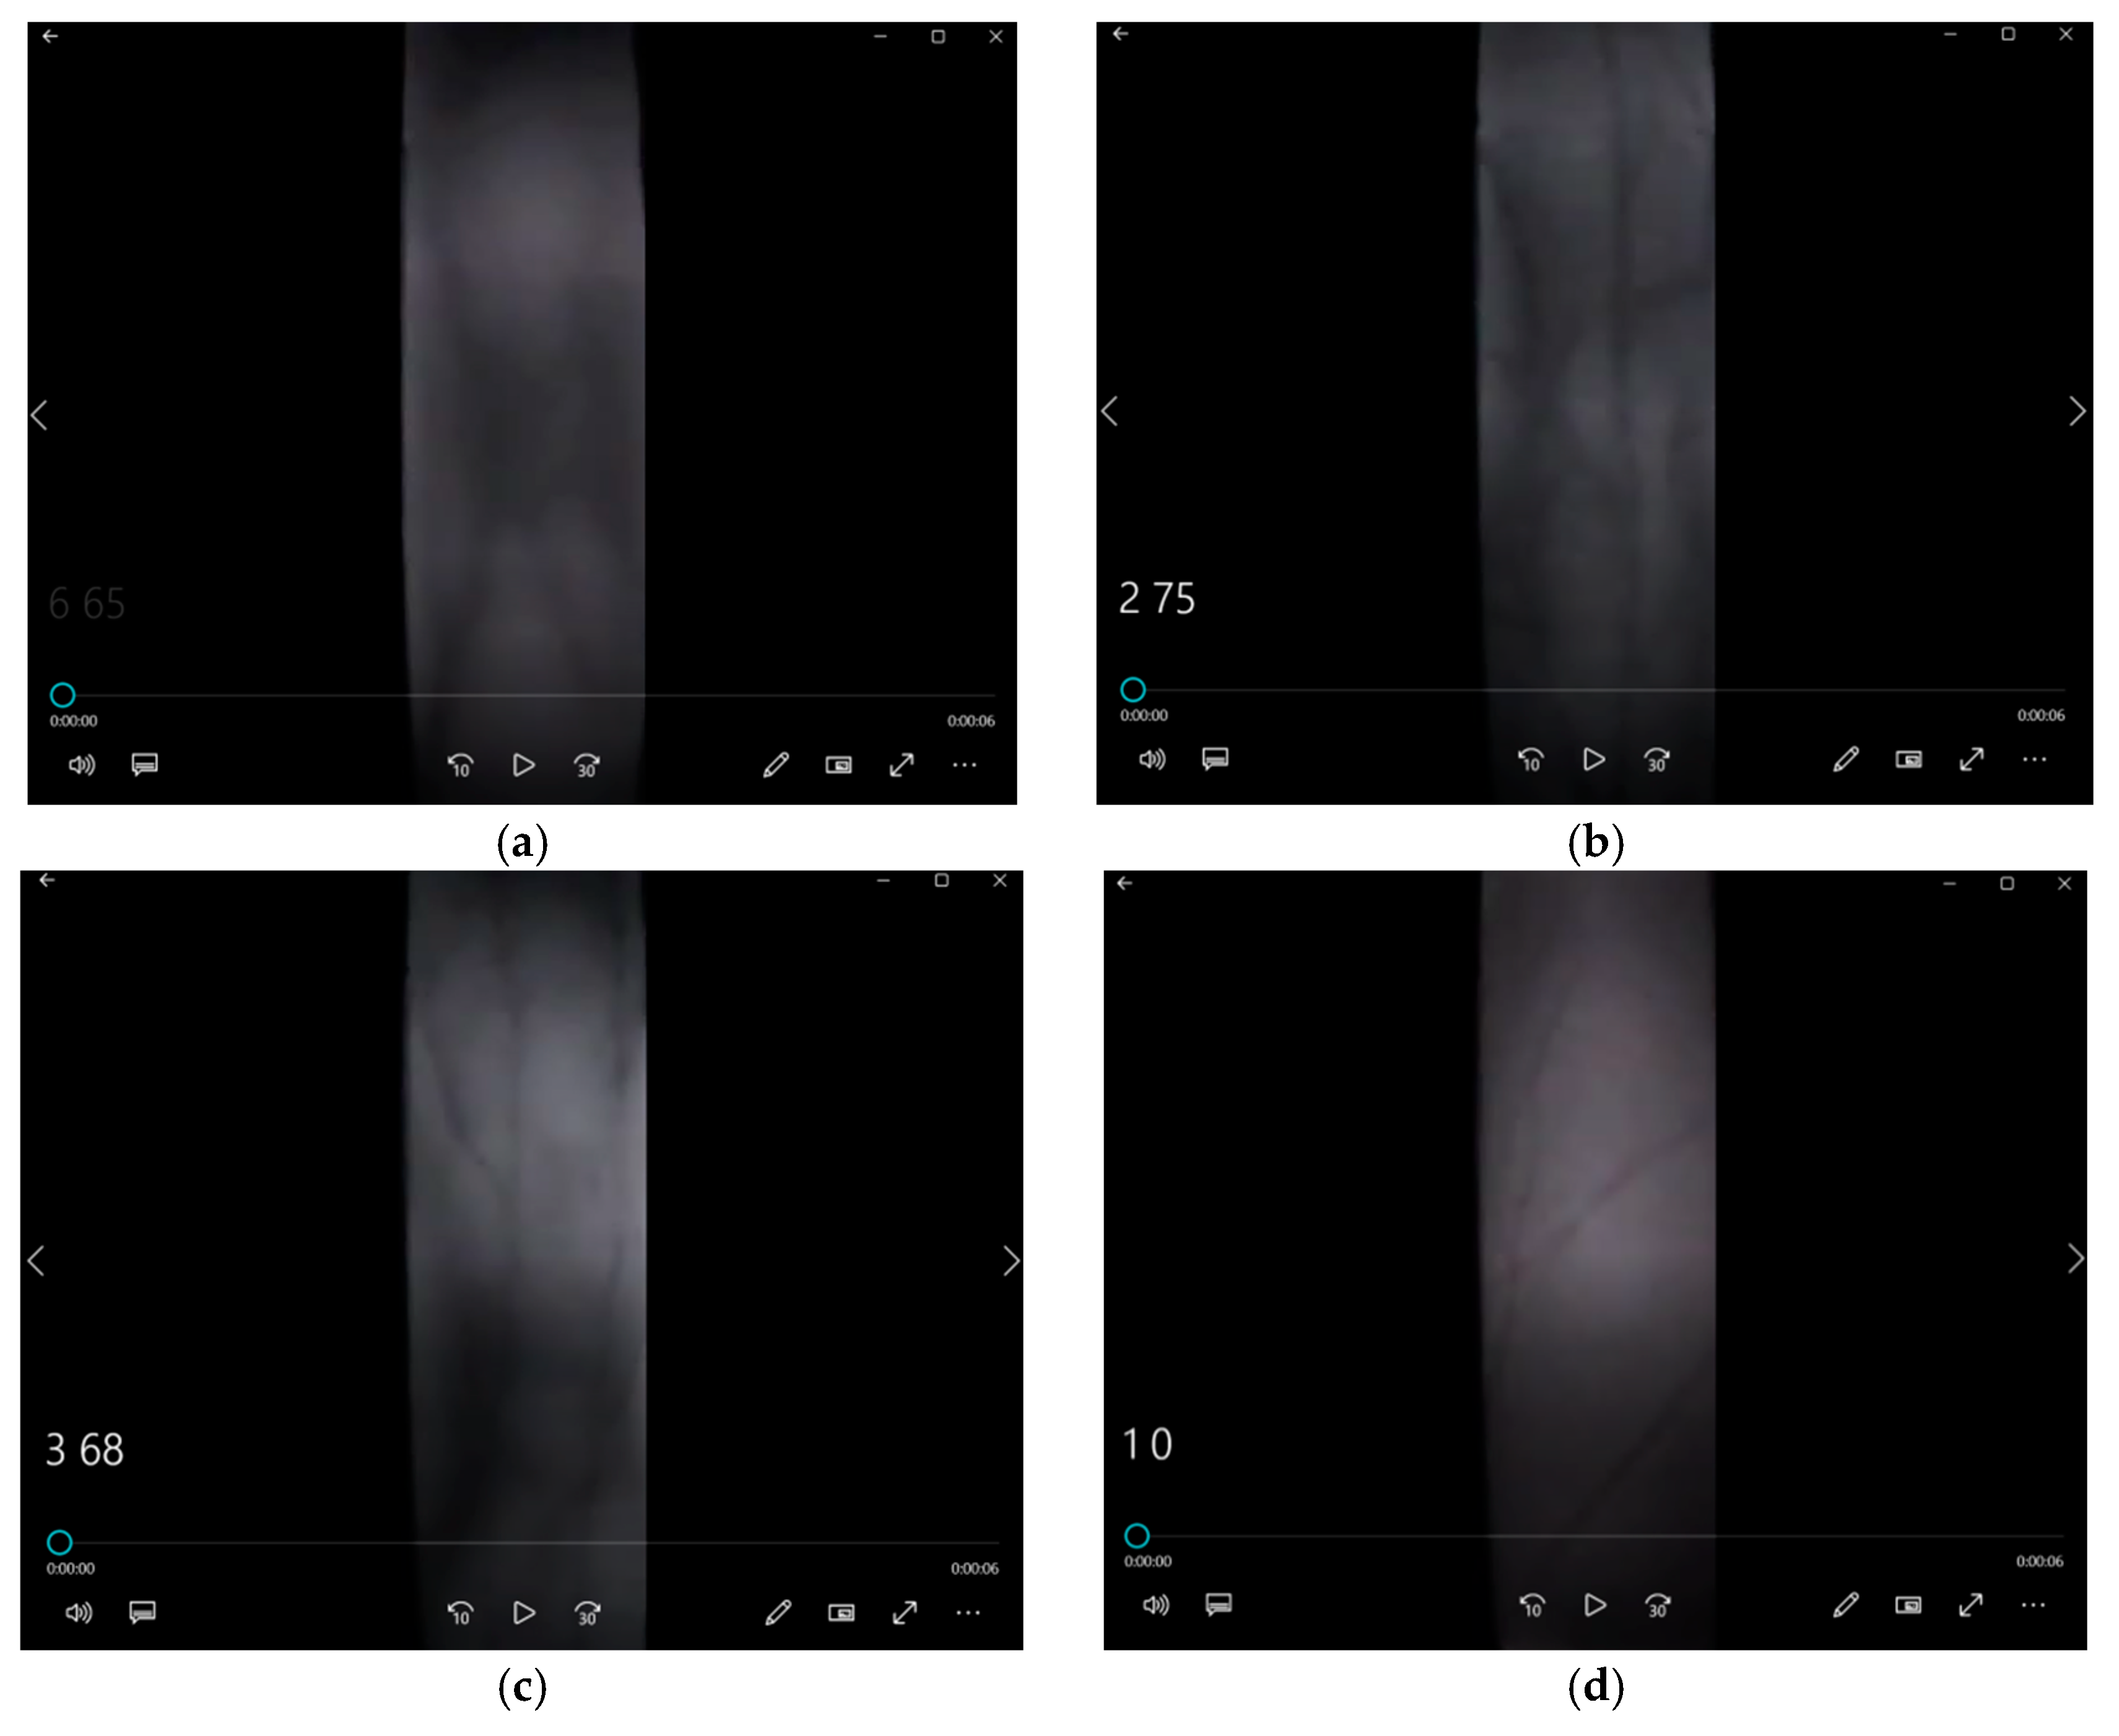
2.2.1. Acquisition of Attack Data
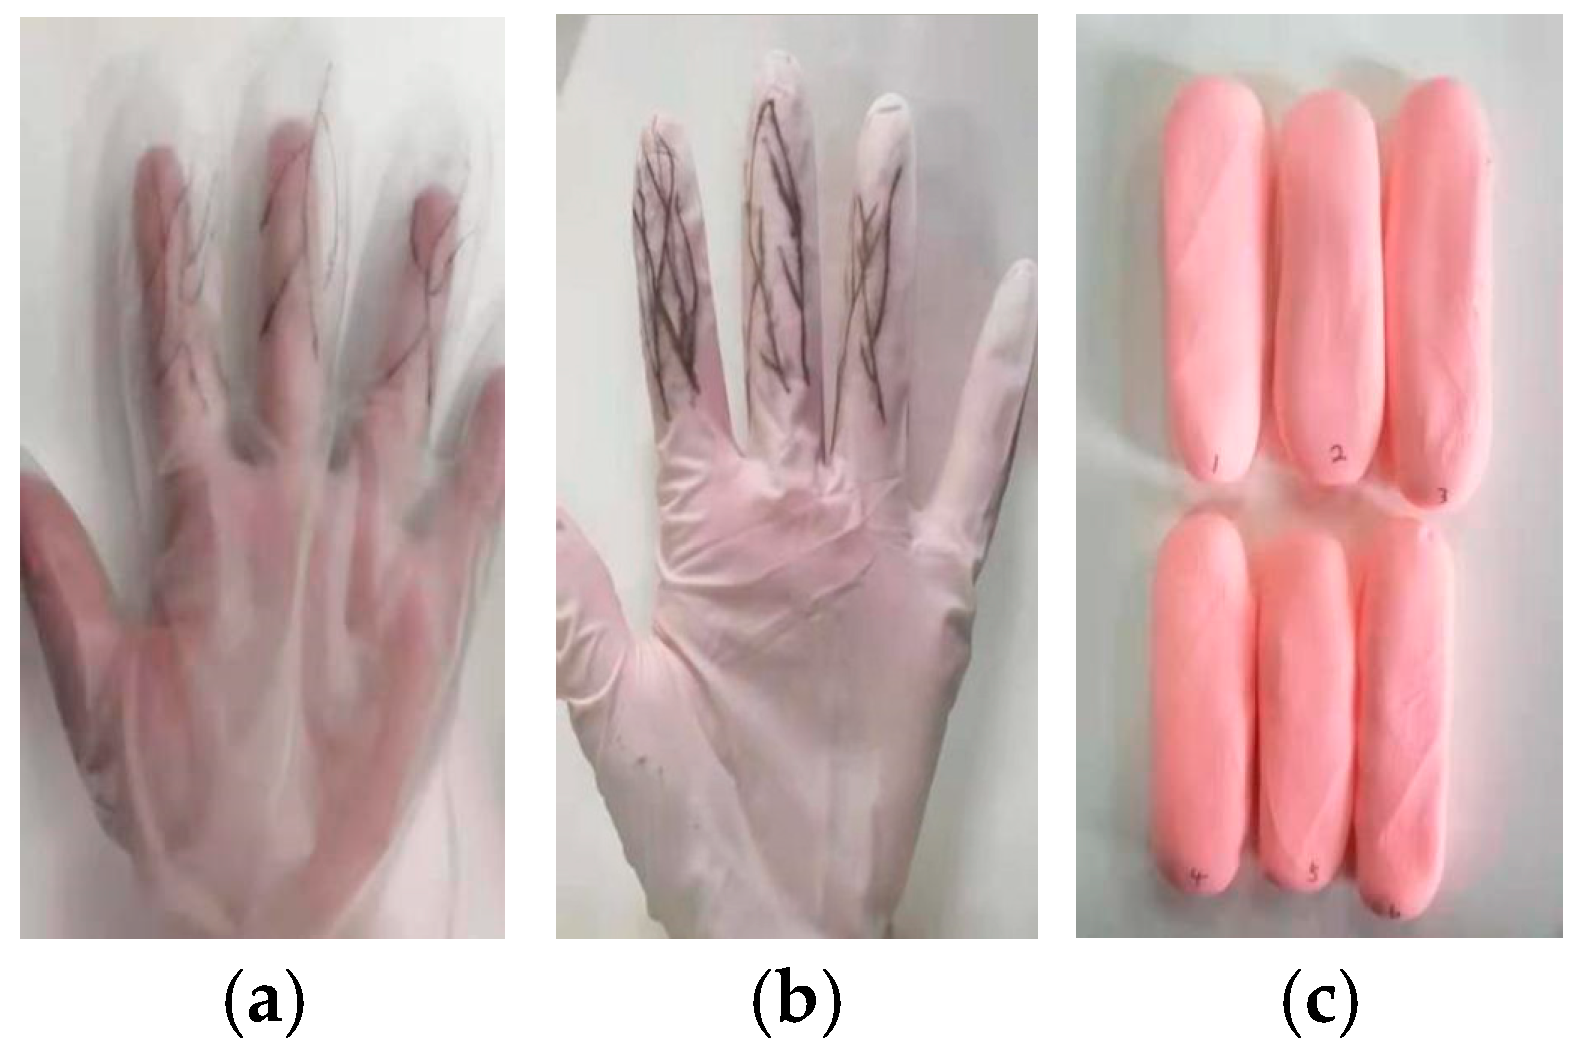
- Attack Type I: The subject wore thin gloves with disturbance patterns (Figure 4(a)), simulating surface disturbances on the finger veins. The data collection process was identical to that of real human vein data, with the same procedure applied to all six fingers.
- Attack Type II: The subject wore thick gloves (Figure 4b) with disturbance patterns drawn on the glove surfaces, adding further intrusion to the detection algorithm. The acquisition method was the same as for real vein data.
2.2.2. Generating the Sequence Signal
2.3. Mixup Data Augmentation
2.4. CNN-Transformer Hybrid Model
2.4.1. CNN Feature Extraction
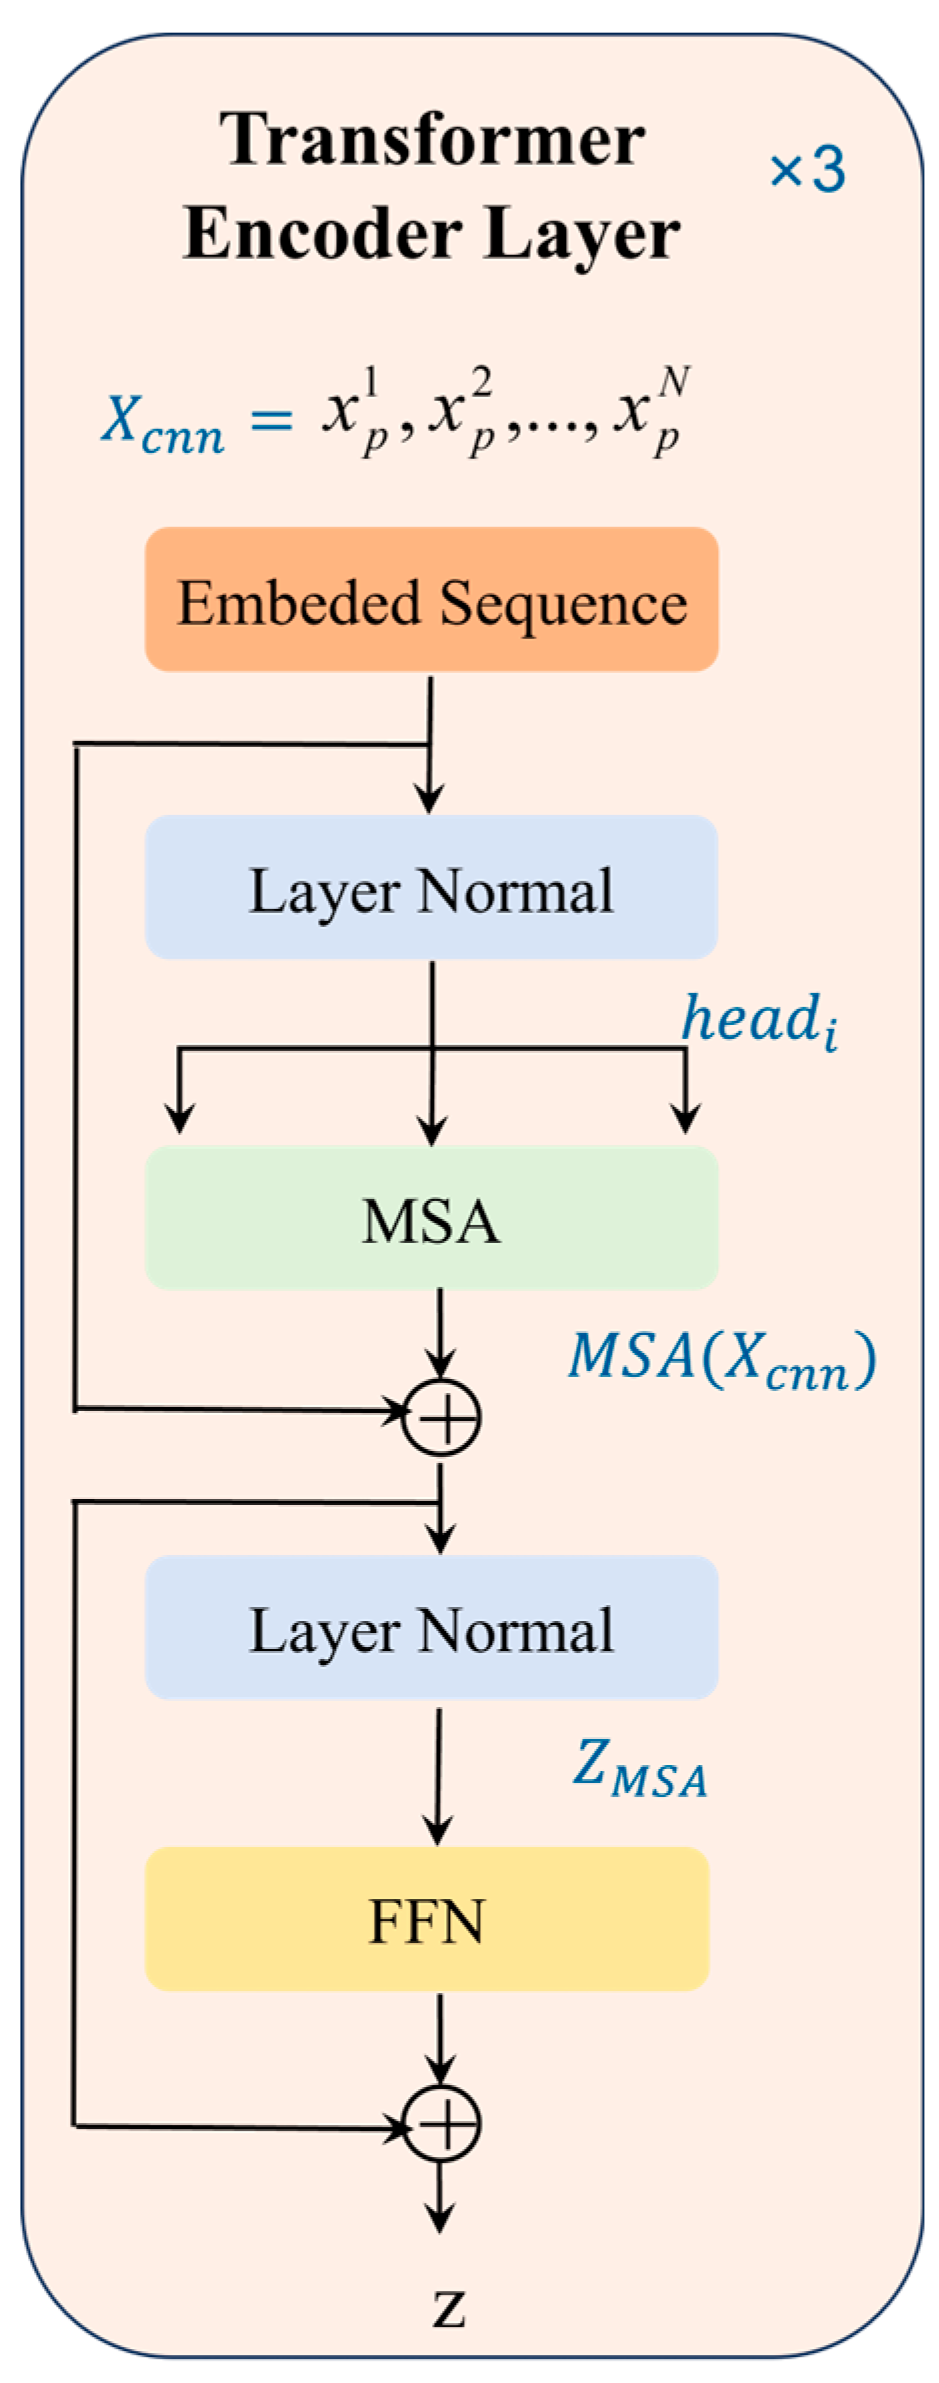
2.4.2. Transformer Coding Module
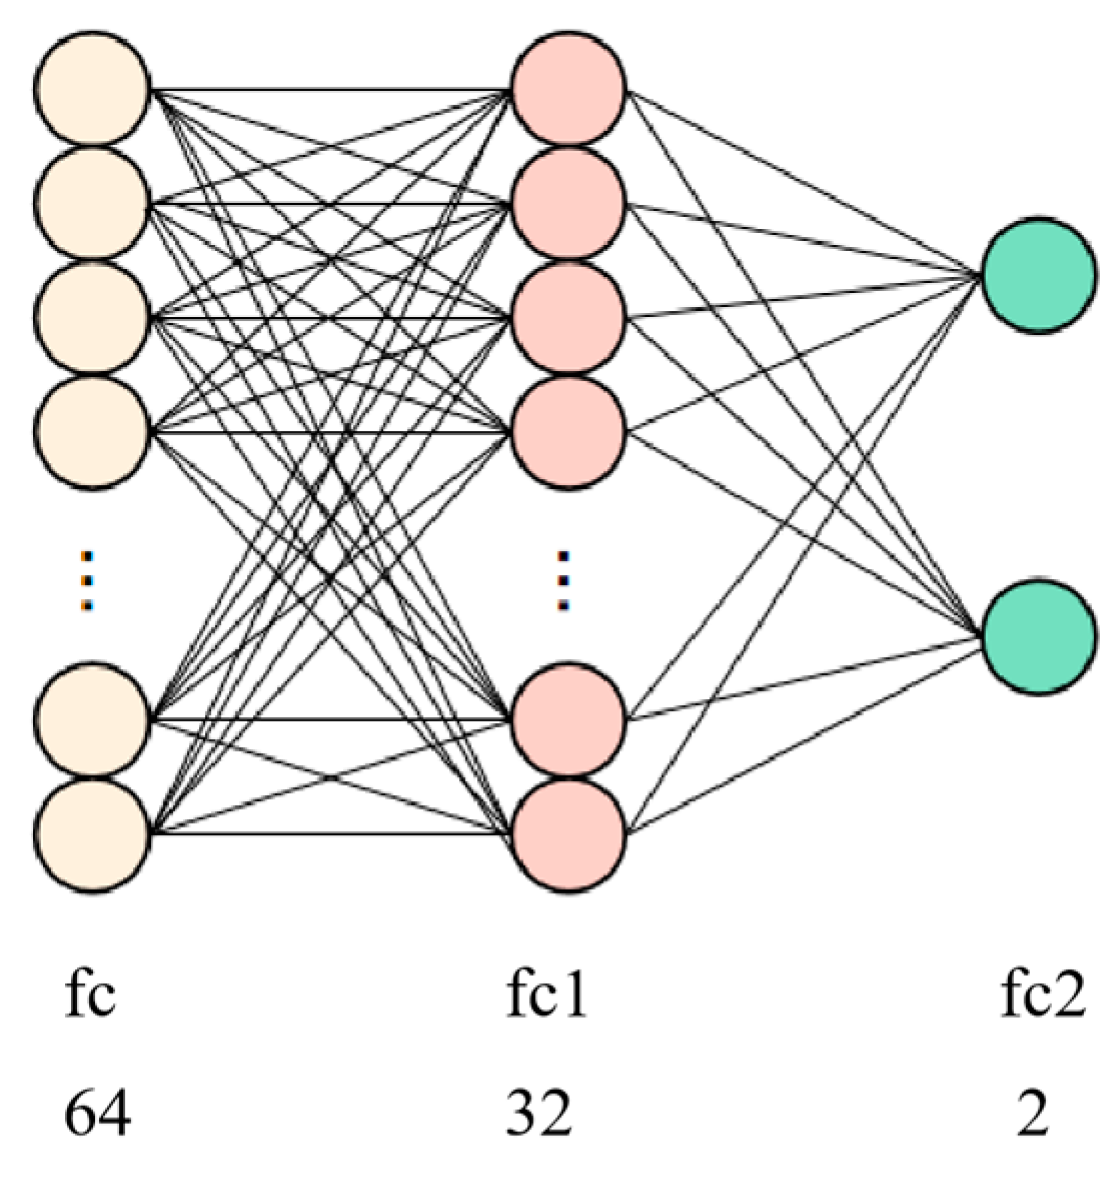
2.4.3. Fully Connected Network
2.5. Model Training and Optimization
3. Experimental Results
3.1. Dataset Description
3.2. Evaluation Metrics
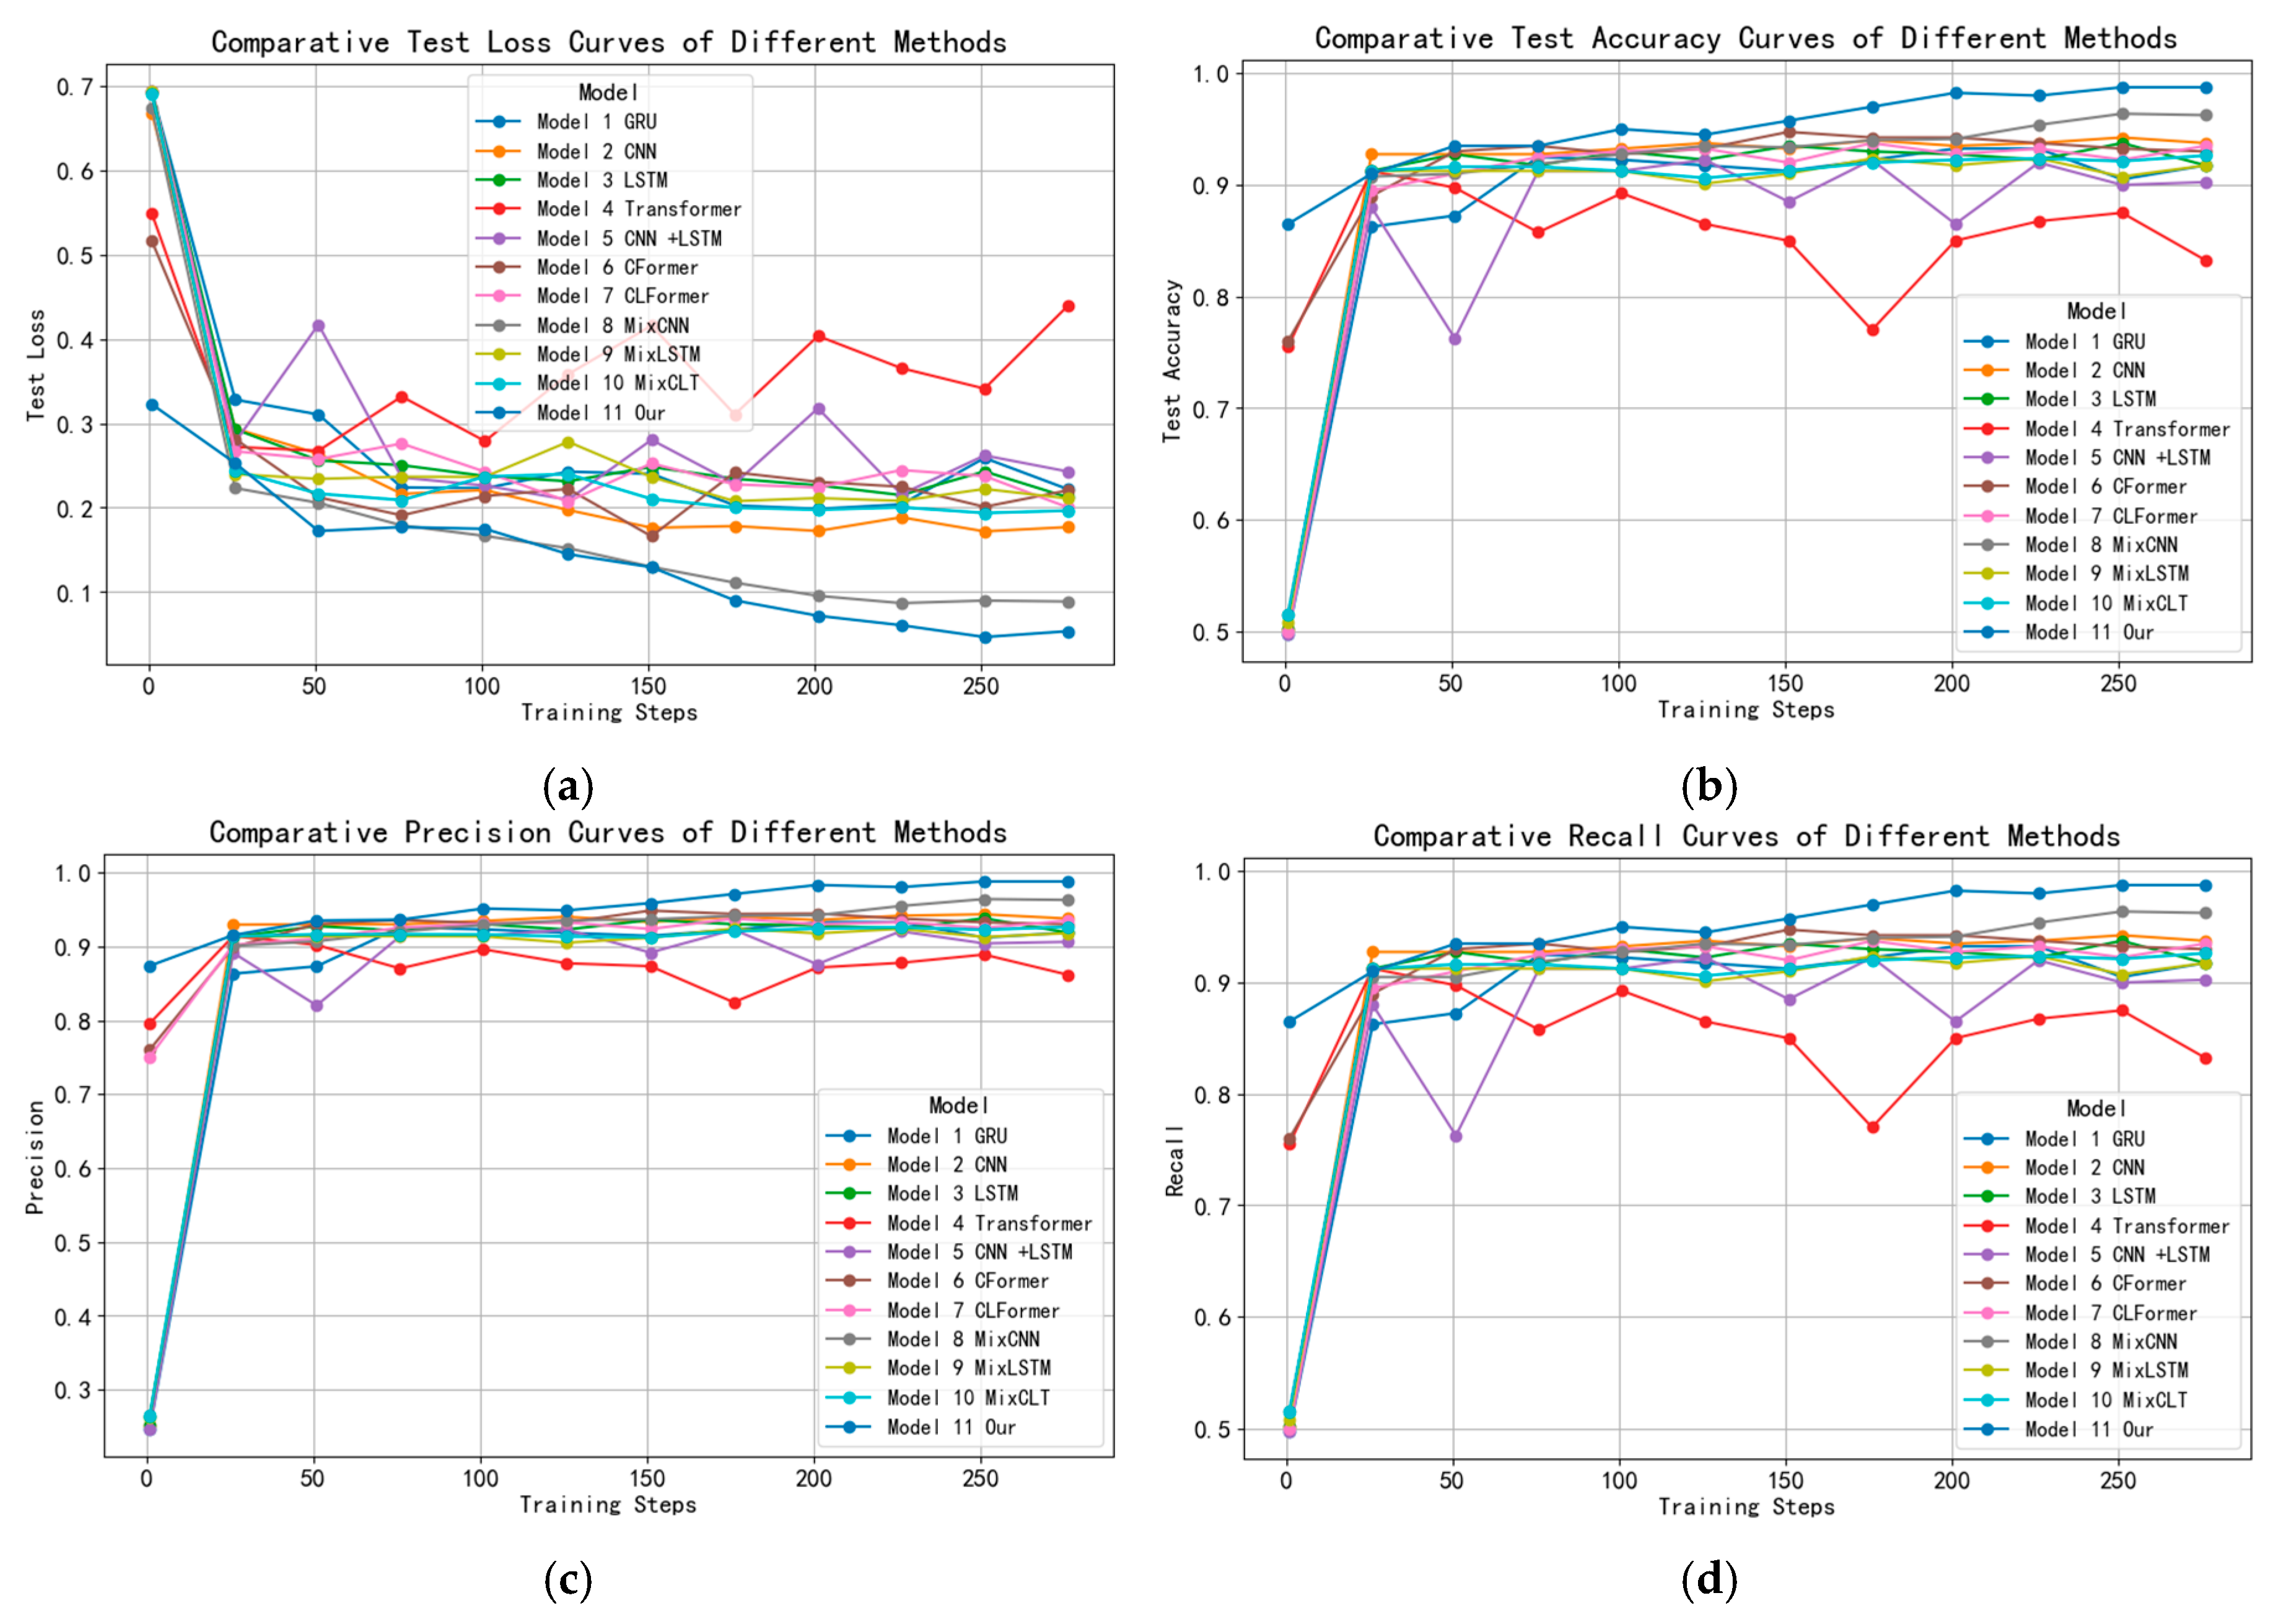
3.3. Comparison Experiment
4. Conclusions
Author Contributions
Funding
Data Availability Statement
Acknowledgments
Conflicts of Interest
References
- Jain, A.K.; Kumar, A.J.S.g.b. Biometrics of next generation: An overview. 2010, 12, 2-3.
- Zhang, L.; Li, W.; Ning, X.; Sun, L.; Dong, X. A local descriptor with physiological characteristic for finger vein recognition. In Proceedings of the 2020 25th International Conference on Pattern Recognition (ICPR), 2021; pp. 4873-4878.
- Shaheed, K.; Liu, H.; Yang, G.; Qureshi, I.; Gou, J.; Yin, Y.J.I. A systematic review of finger vein recognition techniques. 2018, 9, 213. [CrossRef]
- Chugh, T.; Cao, K.; Jain, A.K.J.I.T.o.I.F.; Security. Fingerprint spoof buster: Use of minutiae-centered patches. 2018, 13, 2190-2202. [CrossRef]
- Liu, Y.; Wei, F.; Shao, J.; Sheng, L.; Yan, J.; Wang, X. Exploring disentangled feature representation beyond face identification. In Proceedings of the Proceedings of the IEEE conference on computer vision and pattern recognition, 2018; pp. 2080-2089.
- Wu, Y.; Liao, H.; Zhu, H.; Jin, X.; Yang, S.; Qin, H. Adversarial Contrastive Learning Based on Image Generation for Palm Vein Recognition. In Proceedings of the 2023 2nd International Conference on Artificial Intelligence and Intelligent Information Processing (AIIIP), 2023; pp. 18-24.
- Nguyen, K.; Proença, H.; Alonso-Fernandez, F.J.A.C.S. Deep learning for iris recognition: A survey. 2024, 56, 1-35. [CrossRef]
- Cola, G.; Avvenuti, M.; Musso, F.; Vecchio, A. Gait-based authentication using a wrist-worn device. In Proceedings of the Proceedings of the 13th International Conference on Mobile and Ubiquitous Systems: Computing, Networking and Services, 2016; pp. 208-217.
- Qin, H.; Zhu, H.; Jin, X.; Song, Q.; El-Yacoubi, M.A.; Gao, X.J.a.p.a. EmMixformer: Mix transformer for eye movement recognition. 2024.
- Poddar, J.; Parikh, V.; Bharti, S.K.J.P.C.S. Offline signature recognition and forgery detection using deep learning. 2020, 170, 610-617. [CrossRef]
- Xie, J.; Zhao, Y.; Zhu, D.; Yan, J.; Li, J.; Qiao, M.; He, G.; Deng, S.J.A.A.M.; Interfaces. A machine learning-combined flexible sensor for tactile detection and voice recognition. 2023, 15, 12551-12559. [CrossRef]
- Qin, H.; Hu, R.; El-Yacoubi, M.A.; Li, Y.; Gao, X.J.I.T.o.C.; Technology, S.f.V. Local attention transformer-based full-view finger-vein identification. 2022, 33, 2767-2782. [CrossRef]
- Mathur, L.; Matarić, M.J. Introducing representations of facial affect in automated multimodal deception detection. In Proceedings of the Proceedings of the 2020 international conference on multimodal interaction, 2020; pp. 305-314.
- Hsia, C.-H.; Yang, Z.-H.; Wang, H.-J.; Lai, K.-K.J.A.S. A new enhancement edge detection of finger-vein identification for carputer system. 2022, 12, 10127. [CrossRef]
- Godoy, R.I.U.; Panzo, E.G.V.; Cruz, J.C.D. Vein Location and Feature Detection using Image Analysis. In Proceedings of the 2021 5th International Conference on Electrical, Telecommunication and Computer Engineering (ELTICOM), 2021; pp. 33-37.
- Khellat-Kihel, S.; Cardoso, N.; Monteiro, J.; Benyettou, M. Finger vein recognition using Gabor filter and support vector machine. In Proceedings of the International image processing, applications and systems conference, 2014; pp. 1-6.
- Park, K.R.J.C.; Informatics. Finger vein recognition by combining global and local features based on SVM. 2011, 30, 295-309.
- Krishnan, A.; Thomas, T.; Mishra, D.J.I.T.o.I.F.; Security. Finger vein pulsation-based biometric recognition. 2021, 16, 5034-5044. [CrossRef]
- Crisan, S.; Tebrean, B.J.M. Low cost, high quality vein pattern recognition device with liveness Detection. Workflow and implementations. 2017, 108, 207-216. [CrossRef]
- Das, R.; Piciucco, E.; Maiorana, E.; Campisi, P.J.I.T.o.I.F.; Security. Convolutional neural network for finger-vein-based biometric identification. 2018, 14, 360-373. [CrossRef]
- Qin, H.; Wang, P.J.A.S. Finger-vein verification based on LSTM recurrent neural networks. 2019, 9, 1687. [CrossRef]
- Qin, H.; Gong, C.; Li, Y.; El-Yacoubi, M.A.; Gao, X.; Wang, J.J.I.T.o.B., Behavior,; Science, I. Attention Label Learning to Enhance Interactive Vein Transformer for Palm-Vein Recognition. 2024. [CrossRef]
- Tyagi, S.; Chawla, B.; Jain, R.; Srivastava, S.J.J.o.I.; Systems, F. Multimodal biometric system using deep learning based on face and finger vein fusion. 2022, 42, 943-955. [CrossRef]
- Liu, W.; Lu, H.; Wang, Y.; Li, Y.; Qu, Z.; Li, Y.J.A.I. Mmran: A novel model for finger vein recognition based on a residual attention mechanism: Mmran: A novel finger vein recognition model. 2023, 53, 3273-3290.
- Wang, Y.; Wu, W.; Yao, J.; Li, D. A Palm Vein Recognition Method Based on LSTM-CNN. In Proceedings of the 2023 IEEE 5th International Conference on Civil Aviation Safety and Information Technology (ICCASIT), 2023; pp. 1027-1030.
- Abbas, T.J.J.L.M. Finger Vein Recognition with Hybrid Deep Learning Approach. 2023, 4, 23-33. [CrossRef]
- Li, X.; Zhang, B.-B.J.I.A. FV-ViT: Vision transformer for finger vein recognition. 2023.
- Qin, H.; Gong, C.; Li, Y.; Gao, X.; El-Yacoubi, M.A.J.I.T.o.I.; Measurement. Label enhancement-based multiscale transformer for palm-vein recognition. 2023, 72, 1-17. [CrossRef]
- Wang, S.; Qin, H.; Zhang, X.; Xiong, Z.; Wu, Y. VeinCnnformer: convolutional neural network based transformer for vein recognition. In Proceedings of the Fourth International Conference on Computer Vision and Data Mining (ICCVDM 2023), 2024; pp. 400-407.
- Kim, W.; Song, J.M.; Park, K.R.J.S. Multimodal biometric recognition based on convolutional neural network by the fusion of finger-vein and finger shape using near-infrared (NIR) camera sensor. 2018, 18, 2296. [CrossRef]
- Alshardan, A.; Kumar, A.; Alghamdi, M.; Maashi, M.; Alahmari, S.; Alharbi, A.A.; Almukadi, W.; Alzahrani, Y.J.P.C.S. Multimodal biometric identification: leveraging convolutional neural network (CNN) architectures and fusion techniques with fingerprint and finger vein data. 2024, 10, e2440. [CrossRef]
- El-Rahiem, B.A.; El-Samie, F.E.A.; Amin, M.J.M.S. Multimodal biometric authentication based on deep fusion of electrocardiogram (ECG) and finger vein. 2022, 28, 1325-1337. [CrossRef]
- Alay, N.; Al-Baity, H.H.J.S. Deep learning approach for multimodal biometric recognition system based on fusion of iris, face, and finger vein traits. 2020, 20, 5523.
- Tao, Z.; Zhou, X.; Xu, Z.; Lin, S.; Hu, Y.; Wei, T.J.M.P.i.E. Finger-Vein Recognition Using Bidirectional Feature Extraction and Transfer Learning. 2021, 2021, 6664809. [CrossRef]
- Huang, Z.; Guo, C.J.I.J.o.A.I.T. Robust finger vein recognition based on deep CNN with spatial attention and bias field correction. 2021, 30, 2140005.
- Babalola, F.O.; Bitirim, Y.; Toygar, Ö.J.S., Image; Processing, V. Palm vein recognition through fusion of texture-based and CNN-based methods. 2021, 15, 459-466. [CrossRef]
- Yang, H.; Fang, P.; Hao, Z. A gan-based method for generating finger vein dataset. In Proceedings of the Proceedings of the 2020 3rd International Conference on Algorithms, Computing and Artificial Intelligence, 2020; pp. 1-6.
- Madhusudhan, M.; Udayarani, V.; Hegde, C.J.I.J.o.S.A.E.; Management. An intelligent deep learning LSTM-DM tool for finger vein recognition model USING DSAE classifier. 2024, 15, 532-540. [CrossRef]
- Lu, S.; Fung, S.; Pan, W.; Wickramasinghe, N.; Lu, X.J.T.V.C. Veintr: robust end-to-end full-hand vein identification with transformer. 2024, 1-9. [CrossRef]
- Li, Y.; Ruan, S.; Qin, H.; Deng, S.; El-Yacoubi, M.A.J.I.T.o.I.F.; Security. Transformer based defense GAN against palm-vein adversarial attacks. 2023, 18, 1509-1523. [CrossRef]
- Abtahi, M.; Le, D.; Lim, J.I.; Yao, X.J.B.O.E. MF-AV-Net: an open-source deep learning network with multimodal fusion options for artery-vein segmentation in OCT angiography. 2022, 13, 4870-4888. [CrossRef]
- Chen, Y.; Ji, D.; Ma, Q.; Zhai, C.; Ma, Y.J.I.T.o.G.; Sensing, R. A Novel Generative Adversarial Network for the Removal of Noise and Baseline Drift in Seismic Signals. 2024. [CrossRef]
- Khosravy, M.; Gupta, N.; Patel, N.; Senjyu, T.; Duque, C.A.J.A.n.-i.c.a.; studies, c. Particle swarm optimization of morphological filters for electrocardiogram baseline drift estimation. 2020, 1-21.
- Zhang, X.; Jiang, S. Application of fourier transform and butterworth filter in signal denoising. In Proceedings of the 2021 6th International Conference on Intelligent Computing and Signal Processing (ICSP), 2021; pp. 1277-1281.
- Jin, X.; Zhu, H.; Yacoubi, M.A.E.; Li, H.; Liao, H.; Qin, H.; Jiang, Y.J.a.p.a. Starlknet: Star mixup with large kernel networks for palm vein identification. 2024.
- Qin, H.; Jin, X.; Zhu, H.; Liao, H.; El-Yacoubi, M.A.; Gao, X.J.a.p.a. Sumix: Mixup with semantic and uncertain information. 2024, 8, 28.
- Li, Y.; Lu, H.; Wang, Y.; Gao, R.; Zhao, C.J.A.S. ViT-Cap: a novel vision transformer-based capsule network model for finger vein recognition. 2022, 12, 10364.
- Sağ, T.; Abdullah Jalil Jalil, Z.J.I.J.o.M.L.; Cybernetics. Vortex search optimization algorithm for training of feed-forward neural network. 2021, 12, 1517-1544.
- Basha, S.S.; Dubey, S.R.; Pulabaigari, V.; Mukherjee, S.J.N. Impact of fully connected layers on performance of convolutional neural networks for image classification. 2020, 378, 112-119. [CrossRef]
- Mao, A.; Mohri, M.; Zhong, Y. Cross-entropy loss functions: Theoretical analysis and applications. In Proceedings of the International conference on Machine learning, 2023; pp. 23803-23828.
- Chandriah, K.K.; Naraganahalli, R.V.J.M.T.; Applications. RNN/LSTM with modified Adam optimizer in deep learning approach for automobile spare parts demand forecasting. 2021, 80, 26145-26159. [CrossRef]

| Models | GRU | CNN | LSTM | Transformer | Modal Structure | Mixup | Precision (%) |
|---|---|---|---|---|---|---|---|
| GRU | √ | / | / | 93.78 | |||
| CNN | √ | / | / | 94.50 | |||
| LSTM | √ | / | / | 94.39 | |||
| Transformer | √ | / | / | 91.50 | |||
| CNN +LSTM | √ | √ | Cascade | / | 93.57 | ||
| CFormer | √ | √ | Cascade | / | 95.50 | ||
| CLT | √ | √ | √ | Cascade | / | 94.26 | |
| MixCNN | √ | / | √ | 97.53 | |||
| MixLSTM | √ | / | √ | 93.43 | |||
| MixCLT | √ | √ | √ | Cascade | √ | 93.73 | |
| Our | √ | √ | / | √ | 99.51 |
| Models | Test Loss (%) |
Test Accuracy (%) |
Precision (%) |
Recall (%) |
F1 Score (%) |
|---|---|---|---|---|---|
| GRU | 0.1950 | 93.75 | 93.78 | 93.75 | 93.75 |
| CNN | 0.1613 | 94.25 | 94.50 | 94.25 | 94.24 |
| LSTM | 0.1996 | 94.25 | 94.39 | 94.25 | 94.25 |
| Transformer | 0.2530 | 91.50 | 91.50 | 91.50 | 91.50 |
| CNN +LSTM | 0.2121 | 93.50 | 93.57 | 93.50 | 93.50 |
| CFormer | 0.1706 | 95.50 | 95.50 | 95.50 | 95.50 |
| CLT | 0.2017 | 94.25 | 94.26 | 94.25 | 94.25 |
| MixCNN | 0.0949 | 97.50 | 97.53 | 97.50 | 97.50 |
| MixLSTM | 0.1919 | 93.37 | 93.43 | 93.37 | 93.37 |
| MixCLT | 0.1827 | 93.63 | 93.73 | 93.63 | 93.63 |
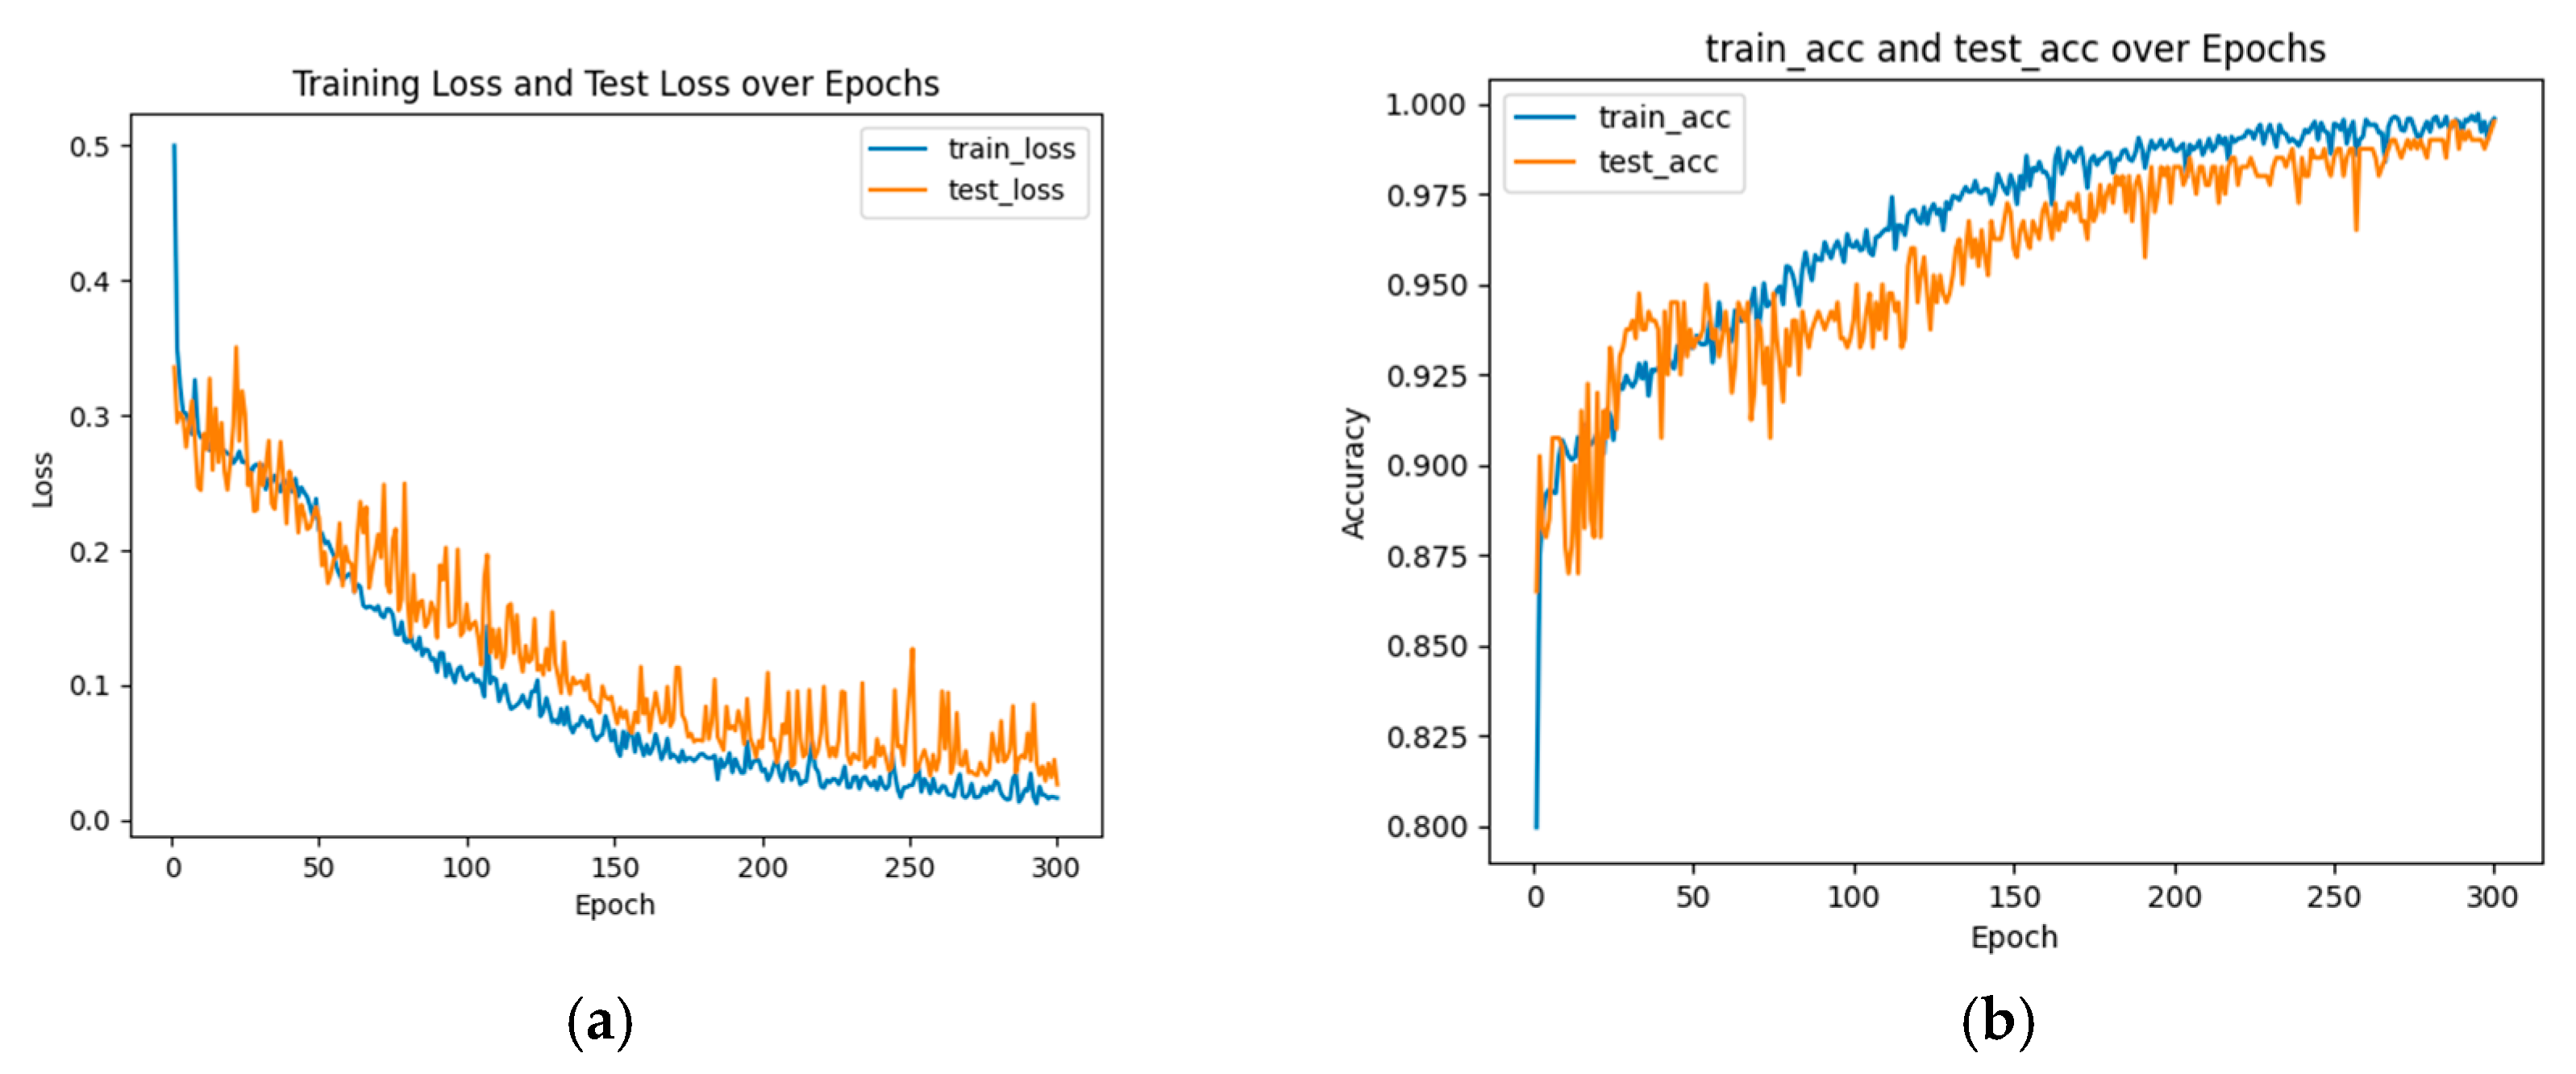
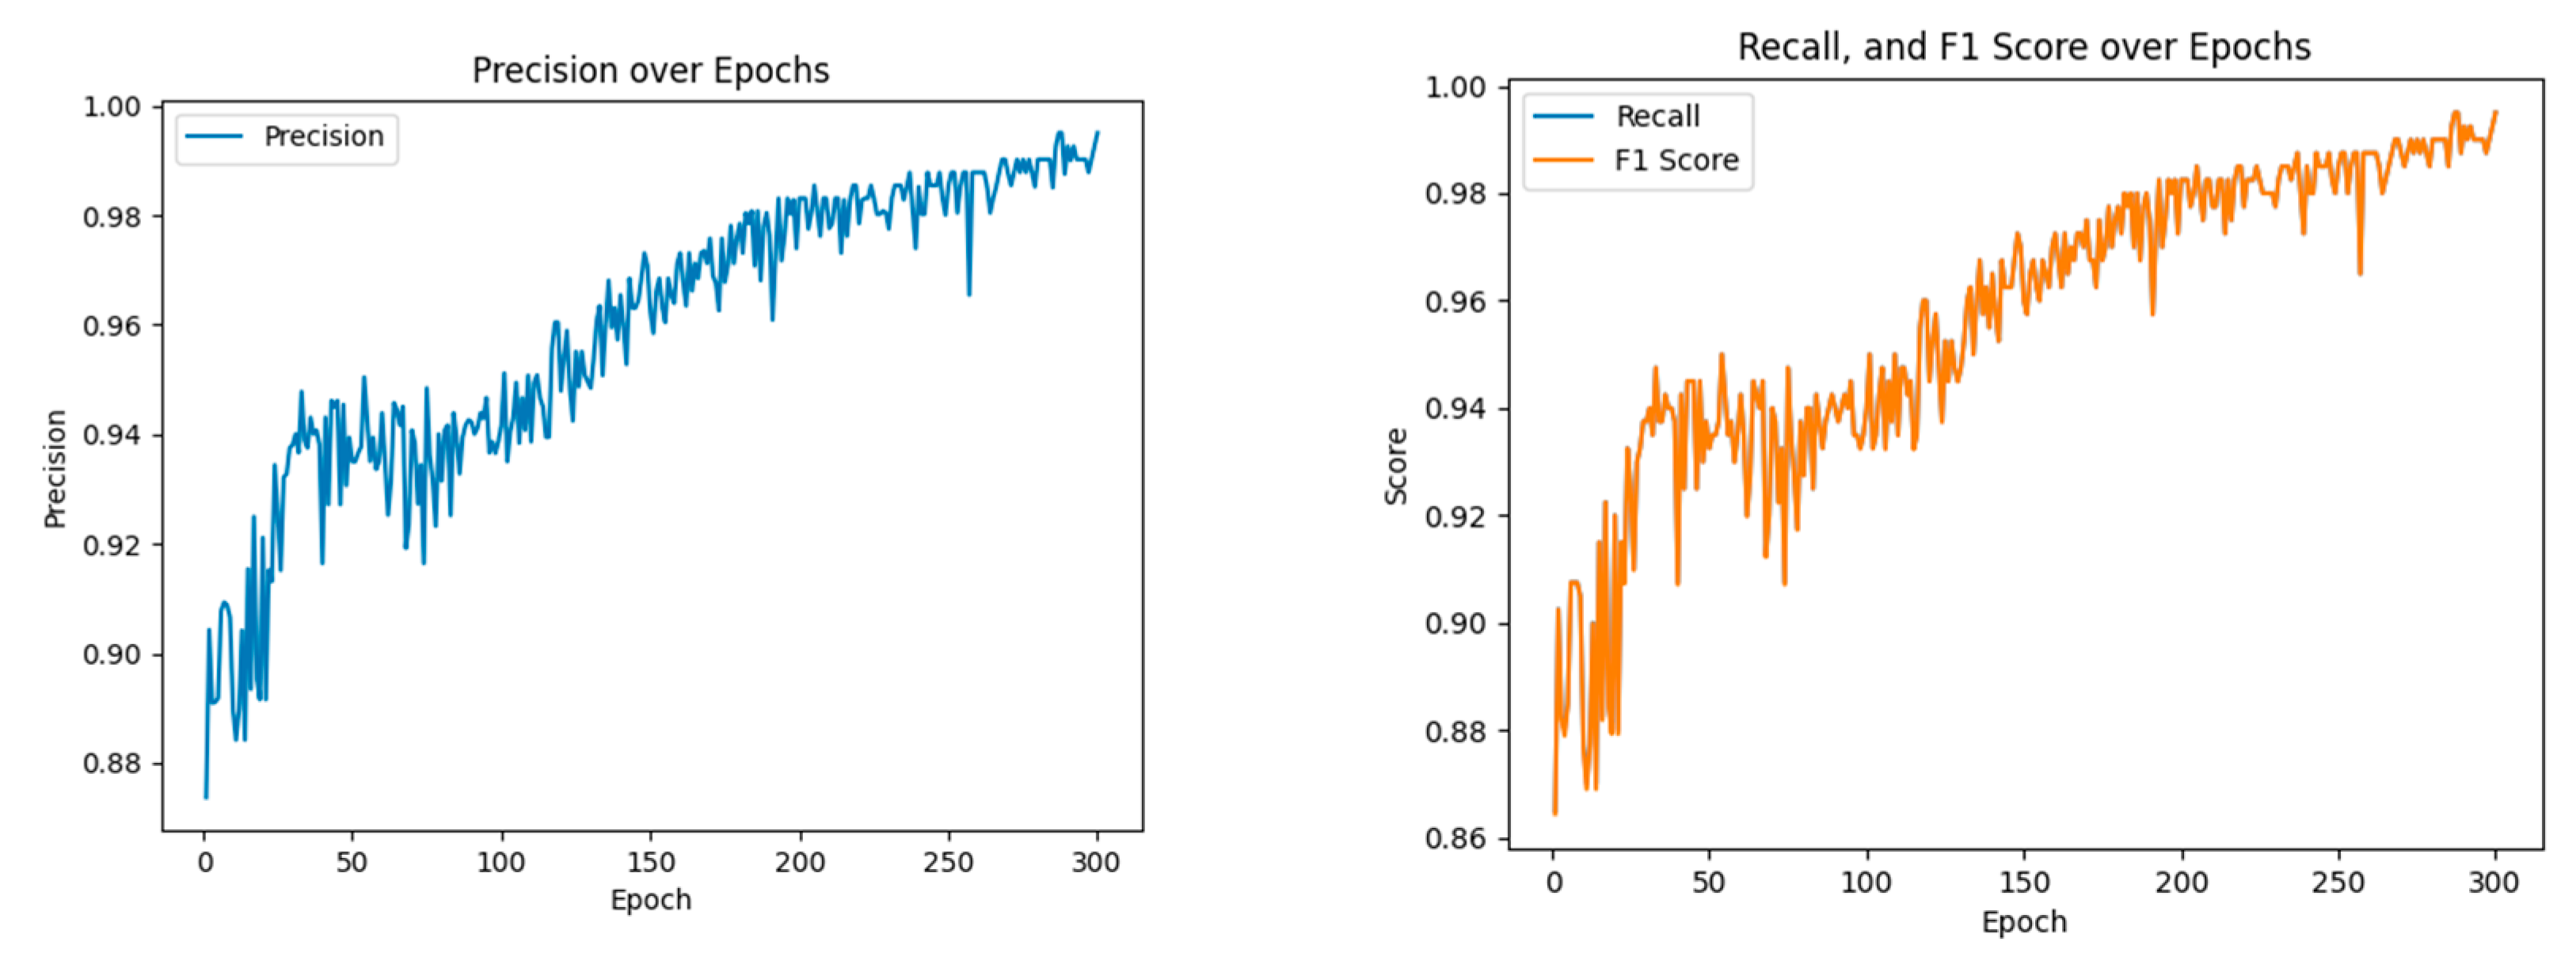
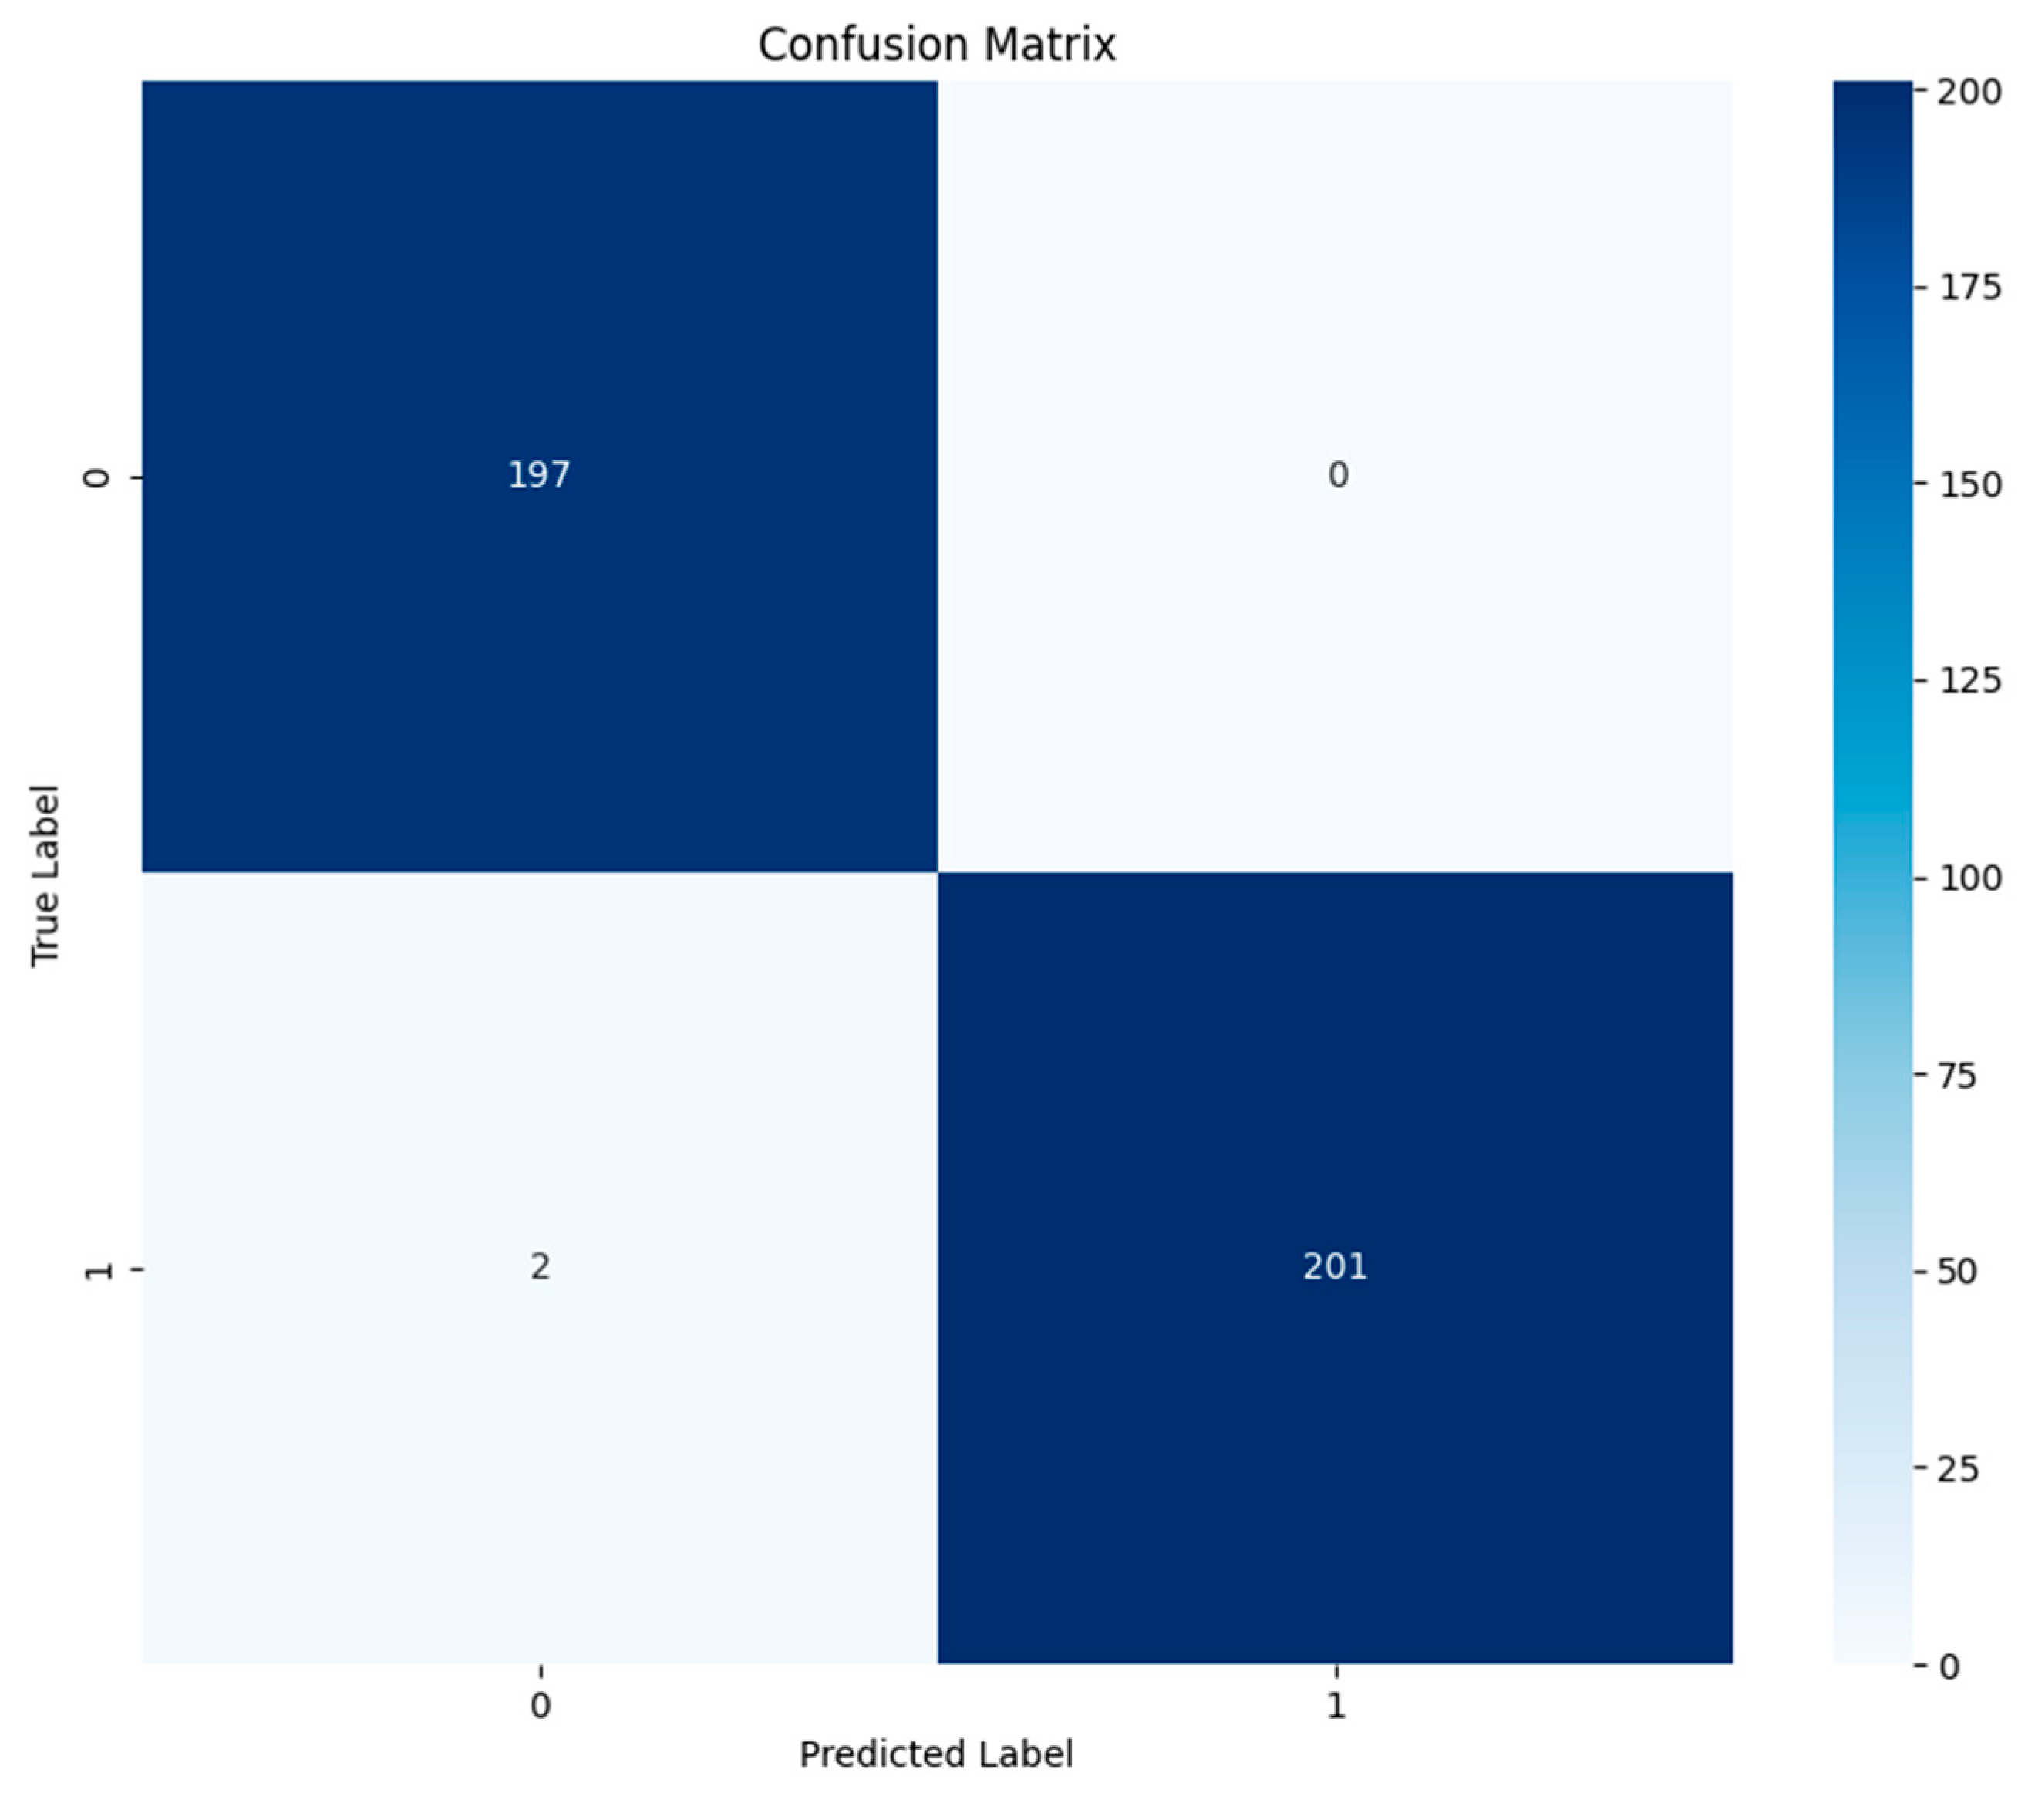
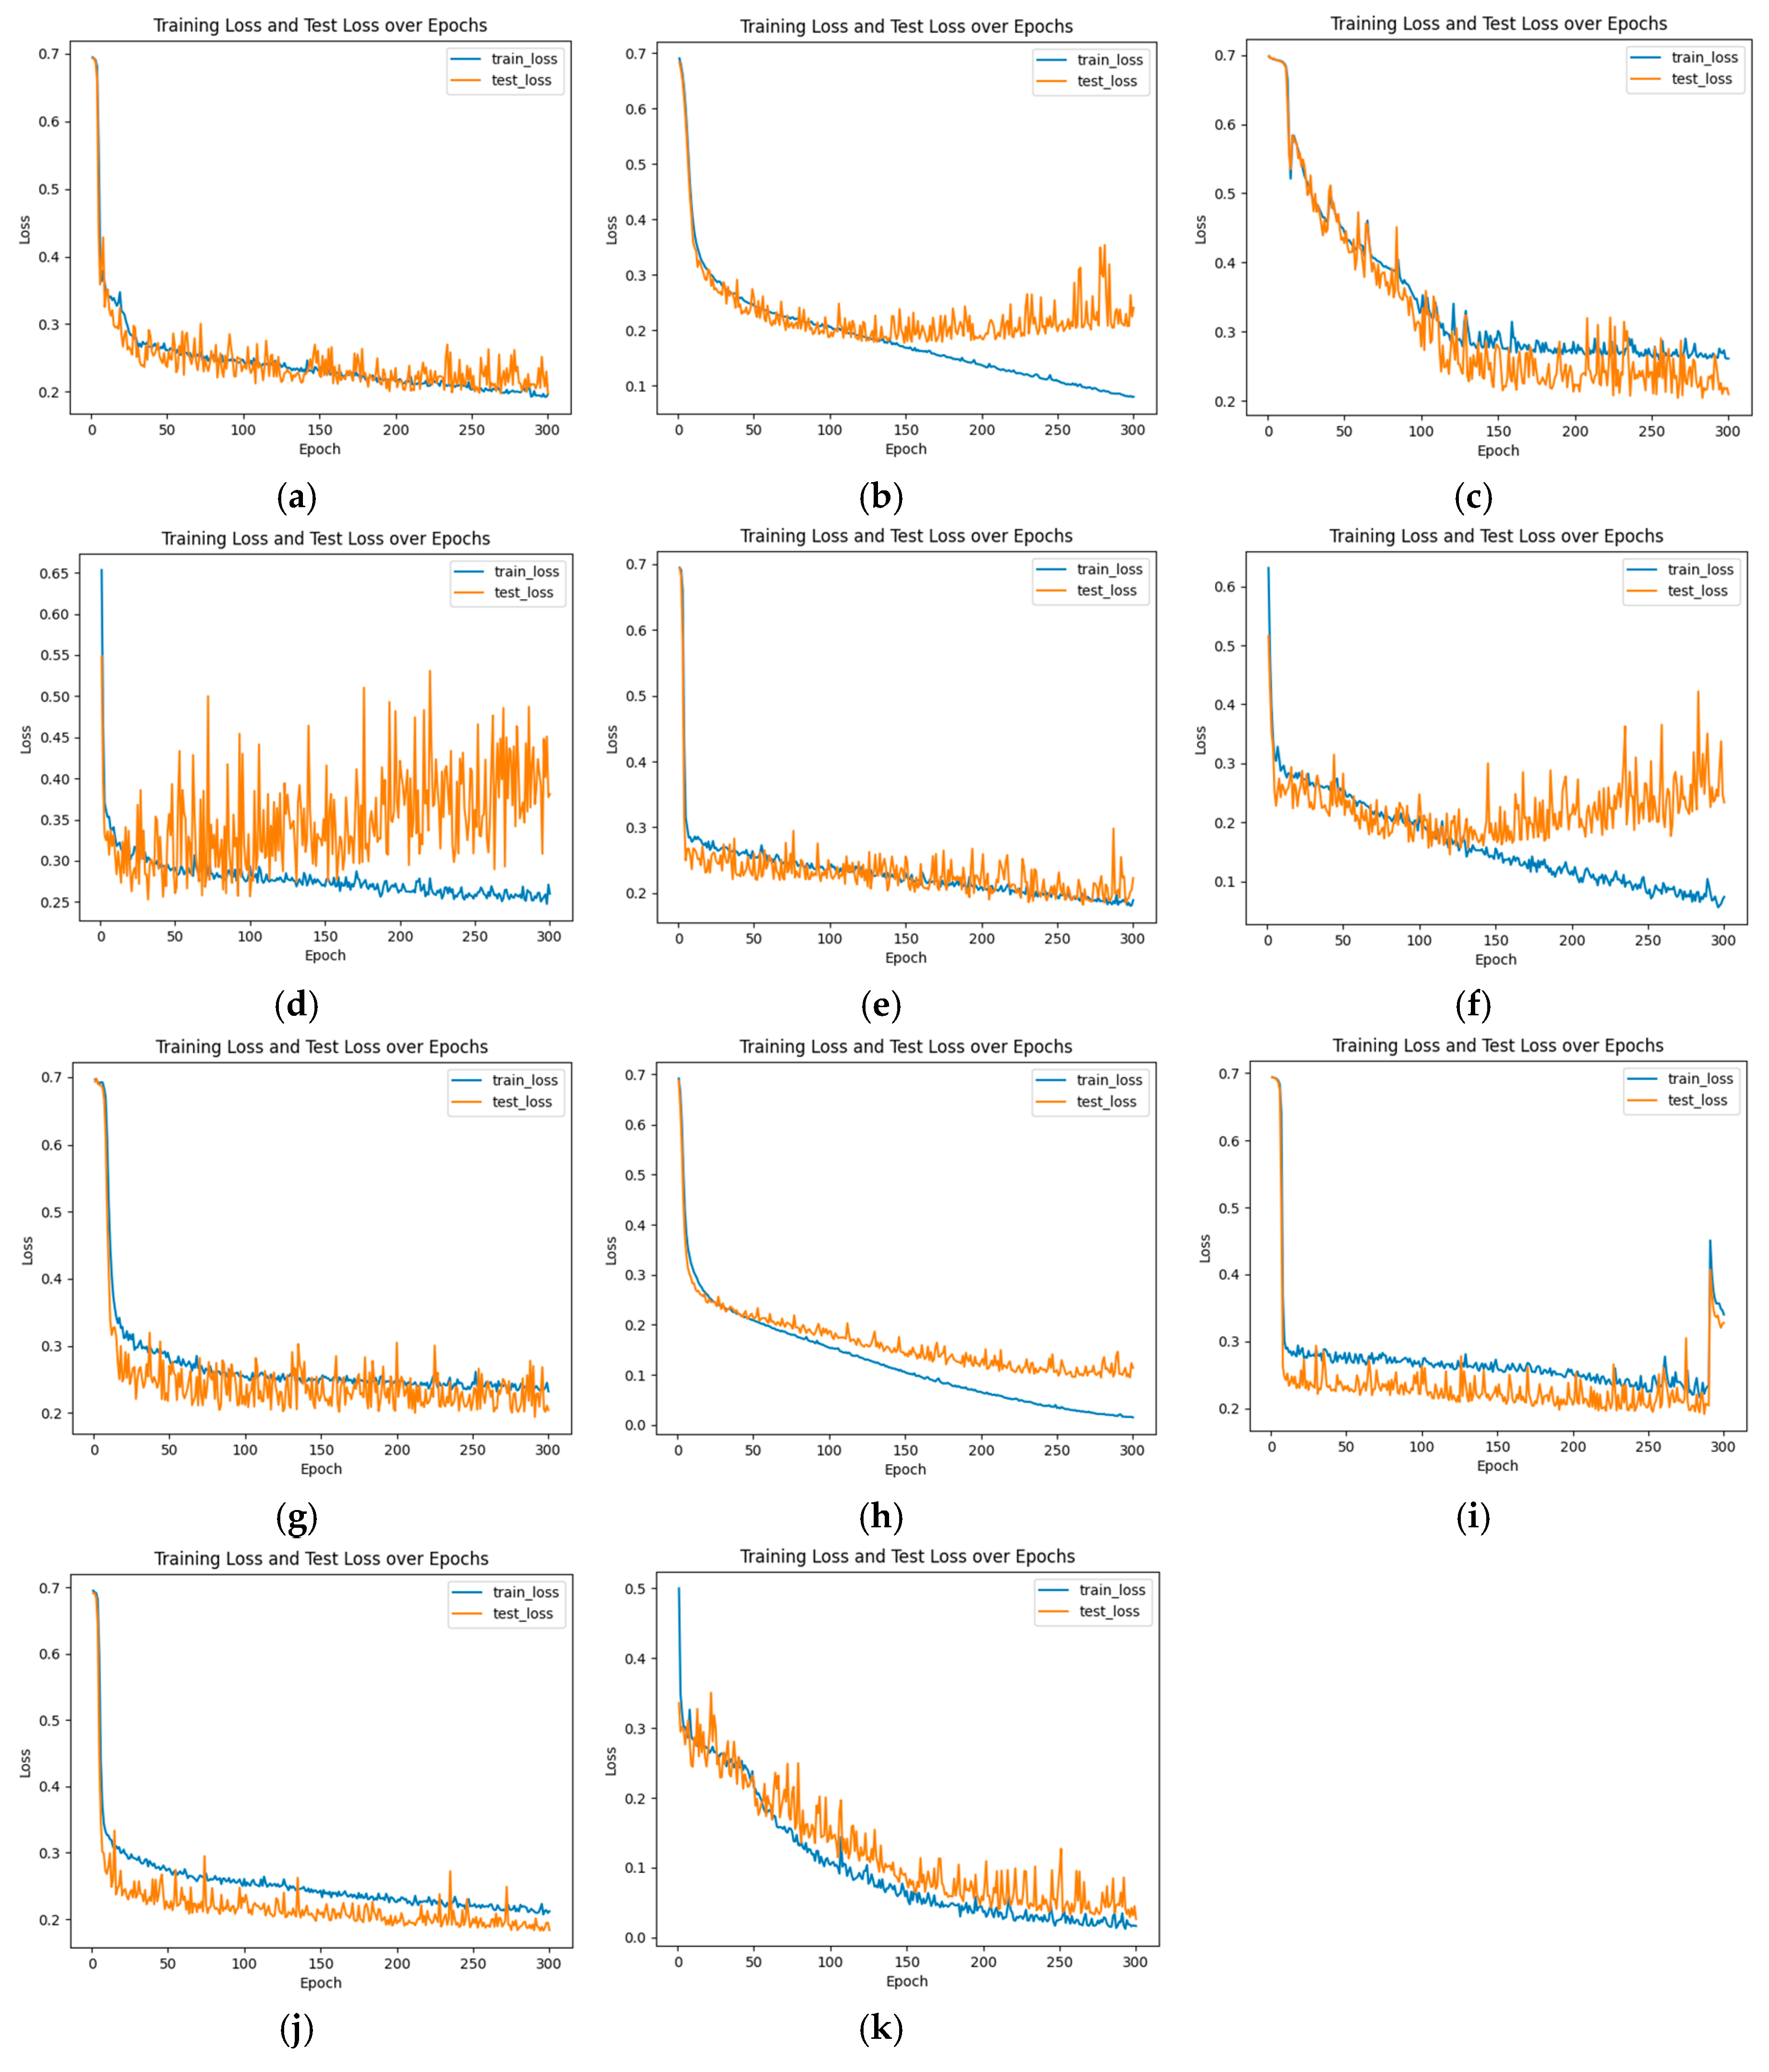
| Our | 0.0414 | 99.50 | 99.51 | 99.51 | 99.51 |
Disclaimer/Publisher’s Note: The statements, opinions and data contained in all publications are solely those of the individual author(s) and contributor(s) and not of MDPI and/or the editor(s). MDPI and/or the editor(s) disclaim responsibility for any injury to people or property resulting from any ideas, methods, instructions or products referred to in the content. |
© 2024 by the authors. Licensee MDPI, Basel, Switzerland. This article is an open access article distributed under the terms and conditions of the Creative Commons Attribution (CC BY) license (http://creativecommons.org/licenses/by/4.0/).


