1. Introduction
FY-3E (Fengyun-3E) is one of the Chinese FY-3 meteorological satellite series, it was launched on 5 July 2021. It carries the WindRAD (Wind Radar) scatterometer, the first dual-frequency (C and Ku band) rotating-fan-beam scatterometer. The number of normalized radar cross sections (the back-scattered power from the wind-roughed sea surface, called
s) increases significantly as compared to the rotating-pencil-beam (e.g., HY-2B / C / D (Hai Yang) [
1]) and the fixed-fan-beam (e.g., ASCAT-B / C (Advanced Scatterometer) on Metop [
2]) instruments, due to the dual-frequency rotating-fan-beam design. The characteristics of the geometries and the
measurements have been discussed in [
3], and an improved calibration method designed for WindRAD was introduced in [
4]. This paper focuses on the QC (Quality Control) for rain contamination in the Ku-band involved wind retrievals.
WindRAD level-1 data are organized in WVCs (Wind Vector Cells), a sub-track coordinate system with axes oriented along and across the swath. The scatterometer retrieves wind in each WVC from
s. The
s, associated with their respective geometries (azimuth angle, incidence angle, frequency, and polarization), are inverted through a GMF (Geophysical Model Function) with the MLE (Maximal Likelihood Estimation) method to derive the winds [
5,
6,
7,
8,
9].
Scatterometer winds are operationally used for nowcasting, assimilated into NWP (Numerical Weather Prediction) models and they are used in many oceanographic and climate studies [
10,
11,
12,
13,
14]. Therefore, QC is essential to guarantee the quality and consistency of the retrieved winds in these applications. Raindrops are relatively small compared to the radar wavelength, which can cause Rayleigh volume scattering in the atmosphere. The Rayleigh scattering effect is inversely proportional to the fourth power of the wavelength. Larger raindrops and smaller wavelengths lead to more intense Rayleigh scattering. Therefore, Ku-band observations are much more sensitive and are about 40 times more affected by rain than C-band observations [
15,
16,
17,
18]. Consequently, the backscatter signal
is generally enhanced, and the rain enhancement effect disturbs the Ku-band wind retrievals [
19,
20,
21]. The rain-induced backscatter is generally larger than the wind-induced backscatter, which leads to positively biased retrieved winds up to 15 m/s. The substantial biases under moderate and heavy rain result in poor retrieval performance; therefore, these WVCs must be identified and flagged.
Several rain QC methods have been developed for Ku-band scatterometers. The normalized MLE residual (
) is the most common QC indicator, which has been implemented on all pencil-beam scatterometers and the CFOSAT rotating fan-beam scatterometer [
16,
22,
23,
24]. It indicates how well the
measurements fit the wind GMF in one WVC. Rain backscatter is isotropic and causes a deviation of the measured
s from the wind GMF
s. Thus, the
is larger than it is under dry weather conditions. Another indicator is
, it uses the speed component of the observation cost function in the 2DVAR (2-D Variational Ambiguity Removal) ambiguity removal step to accept extra WVCs which are rejected by the
indicator [
17,
25]. A rain GMF was introduced in [
18] based on Bayesian retrieval and utilizing the Ku-band sensitivity at HH and VV polarization to the rain (rain GMF).
This article proposes a combined QC method with
and
called
for Ku-band-only and C&Ku wind retrieval.
Section 2 describes the used datasets and briefly summarizes the
and the
QC algorithms and their adaptation for WindRAD data. The Ku-band-only and C&Ku wind retrieval with
and
QC methods are analyzed and discussed in
Section 3 and
Section 4. It is the first time to investigate the QC for the C&Ku combined wind retrieval. The C-band is not sensitive to rain; therefore, by adding the C-band in wind retrieval, the contribution of the Ku-band in
is more discriminating for QC than the total
of C&Ku. Thus, the Ku-based
is proposed as a quality indicator. It is discussed in
Section 4. The conclusion is given in
Section 5.
2. Data and QC Algorithms
2.1. WindRAD Data
The operational WindRAD data version has been updated in May 2023. Level-1 data are organized in WVCs with a size of 20 km × 20 km or 10 km × 10 km. Each WVC contains
s in C-band at 5.40 GHz and in Ku-band at 13.256 GHz with horizontal (HH) and vertical (VV) polarizations. The incidence angles range between 33.0° and 44.0° for C-band, and between 36.5° and 44.0° for Ku-band. The characteristics of the WindRAD data have been described in [
3].
In this article, we use the 20 km level-2 updated operational version BUFR (Binary Universal Form of Representation meteorological data) products, which is internal OSI SAF (Ocean and Sea Ice Satellite Application Facility) data produced at KNMI (Royal Netherlands Meteorological Institute). The data set runs from Aug to Oct 2023 (ascending orbits) for the QC algorithm adaption and we use longer term data from Aug 2023 to March 2024 (ascending orbits) for the algorithm validation. For descending orbits, the parameters of the QC algorithms investigated in this paper were adjusted, while the methodology is general and applicable along the whole orbit. The QC results show the same effectiveness on ascending and descending orbits; thus, the descending orbits are not shown here. The level-2 products are retrieved with the CMOD7 GMF for C-band and NSCAT-4DS GMF for Ku-band (SST (Sea Surface Temperature) effect is eliminated). The C-band
s are calibrated with HOC (Higher Order Calibration) and NOCant (NWP Ocean Calibration as a function of incidence angle and relative antenna angle). The Ku-band
s are calibrated with NOCant [
4].
2.2. 3IMERG Precipitation Product
The 3IMERG (level-3 Integrated Multi-satellitE Retrievals for GPM) precipitation product utilizes information from the GPM (Global Precipitation Measurement) satellite constellation to estimate precipitation over the majority of Earth’s surface. The algorithm of 3IMERG products intercalibrates, merges, and interpolates multiple satellite microwave precipitation estimates, as well as microwave-calibrated infrared satellite estimates and precipitation gauge analyses. The system first gives a quick estimate, called IMERG Early Run, and later on a better estimate, when more data are included (IMERG Late Run). In the end, roughly 3.5 months after acquisition time, a research level product including monthly gauge data is provided called IMERG Final Run. In this article, the IMERG Final Run V07 product is used [
26]. The instantaneous microwave-only precipitation estimate is applied for better consistency with the scatterometer wind products. The chosen precipitation product is called GPM data hereafter.
The GPM product has a spatial resolution of 0.1° and a time resolution of 30 min, covering the latitude range of -60° to 60°. Thus the rain grid is smaller than a WVC (20 km). All the rain grid points overlapping a WVC are taken into account with weighted averaging. The time difference between the GPM data and the scatterometer data is limited to less than 15 min.
2.3. NWP Wind
NWP winds from the ECMWF (European Centre for Medium-Range Weather Forecasts) operational forecast model are used. Hourly forecasts with time steps of +3 h, +4 h, ..., and +21 h are available. The model winds have been interpolated in space and time to the WVCs. The equivalent neutral 10-m winds have been converted to stress-equivalent 10-m winds, correcting for the effect of air mass density [
27]. Model winds are available at every scatterometer WVC, and their spatial representativeness and high quality have been investigated in detail in [
28], with a careful error assessment of scatterometer winds, in-situ winds, and ECMWF model stress-equivalent winds.
2.4. QC Algorithm
The QC indicator
, or normalized MLE residual, has been widely used for Ku-band scatterometers as described in
Section 1. The MLE is defined for each WVC as [
5,
6,
7,
8,
9]:
where
N is the number of views in a WVC,
is the backscatter measurement,
is the simulated backscatter through the GMF, and
is the measurement error variance. The MLE is defined as the distance between a set of measured
s and simulated
s that lie on the wind GMF manifold in an N-dimensional space. The normalized MLE residual is defined as
.
is the expected MLE in a particular WVC across the swath and for a specific wind speed. Thus,
is a function of WVC number and wind speed [
16].
The algorithm needs to be adapted for WindRAD data. Firstly, the number of views for a pencil-beam scatterometer is always four for all WVCs across the swath; however, this number varies for the WindRAD rotating-fan-beam scatterometer [
3]. Therefore, before calculating
, the MLE must be normalized by the number of views in a particular WVC. Secondly, the shape of the threshold is set differently. In [
16], the
threshold is defined by following the contour line of the
as a function of wind speed. It is defined as a parabolic line for lower wind speeds, combined with a straight line for wind speeds above 15 m/s. However, the WindRAD contour lines of the
are different mainly because the number of views for a WVC is much more than four.
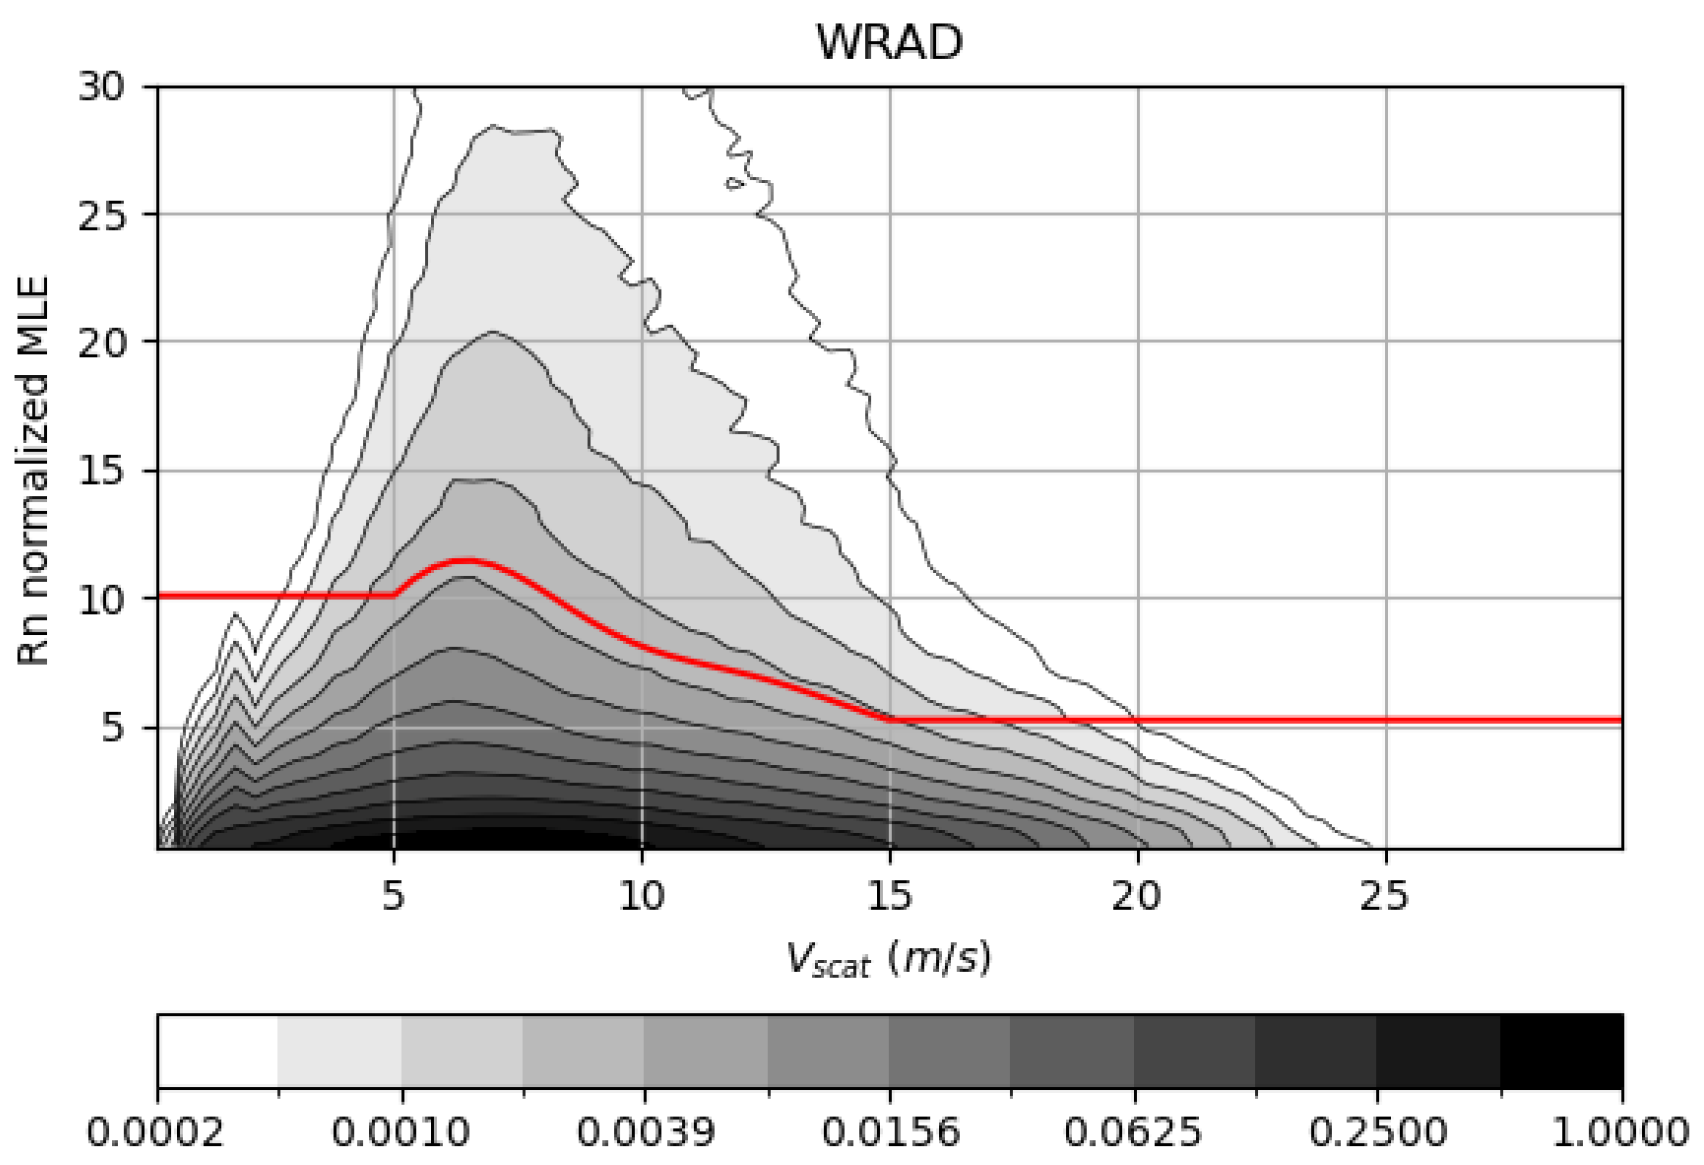
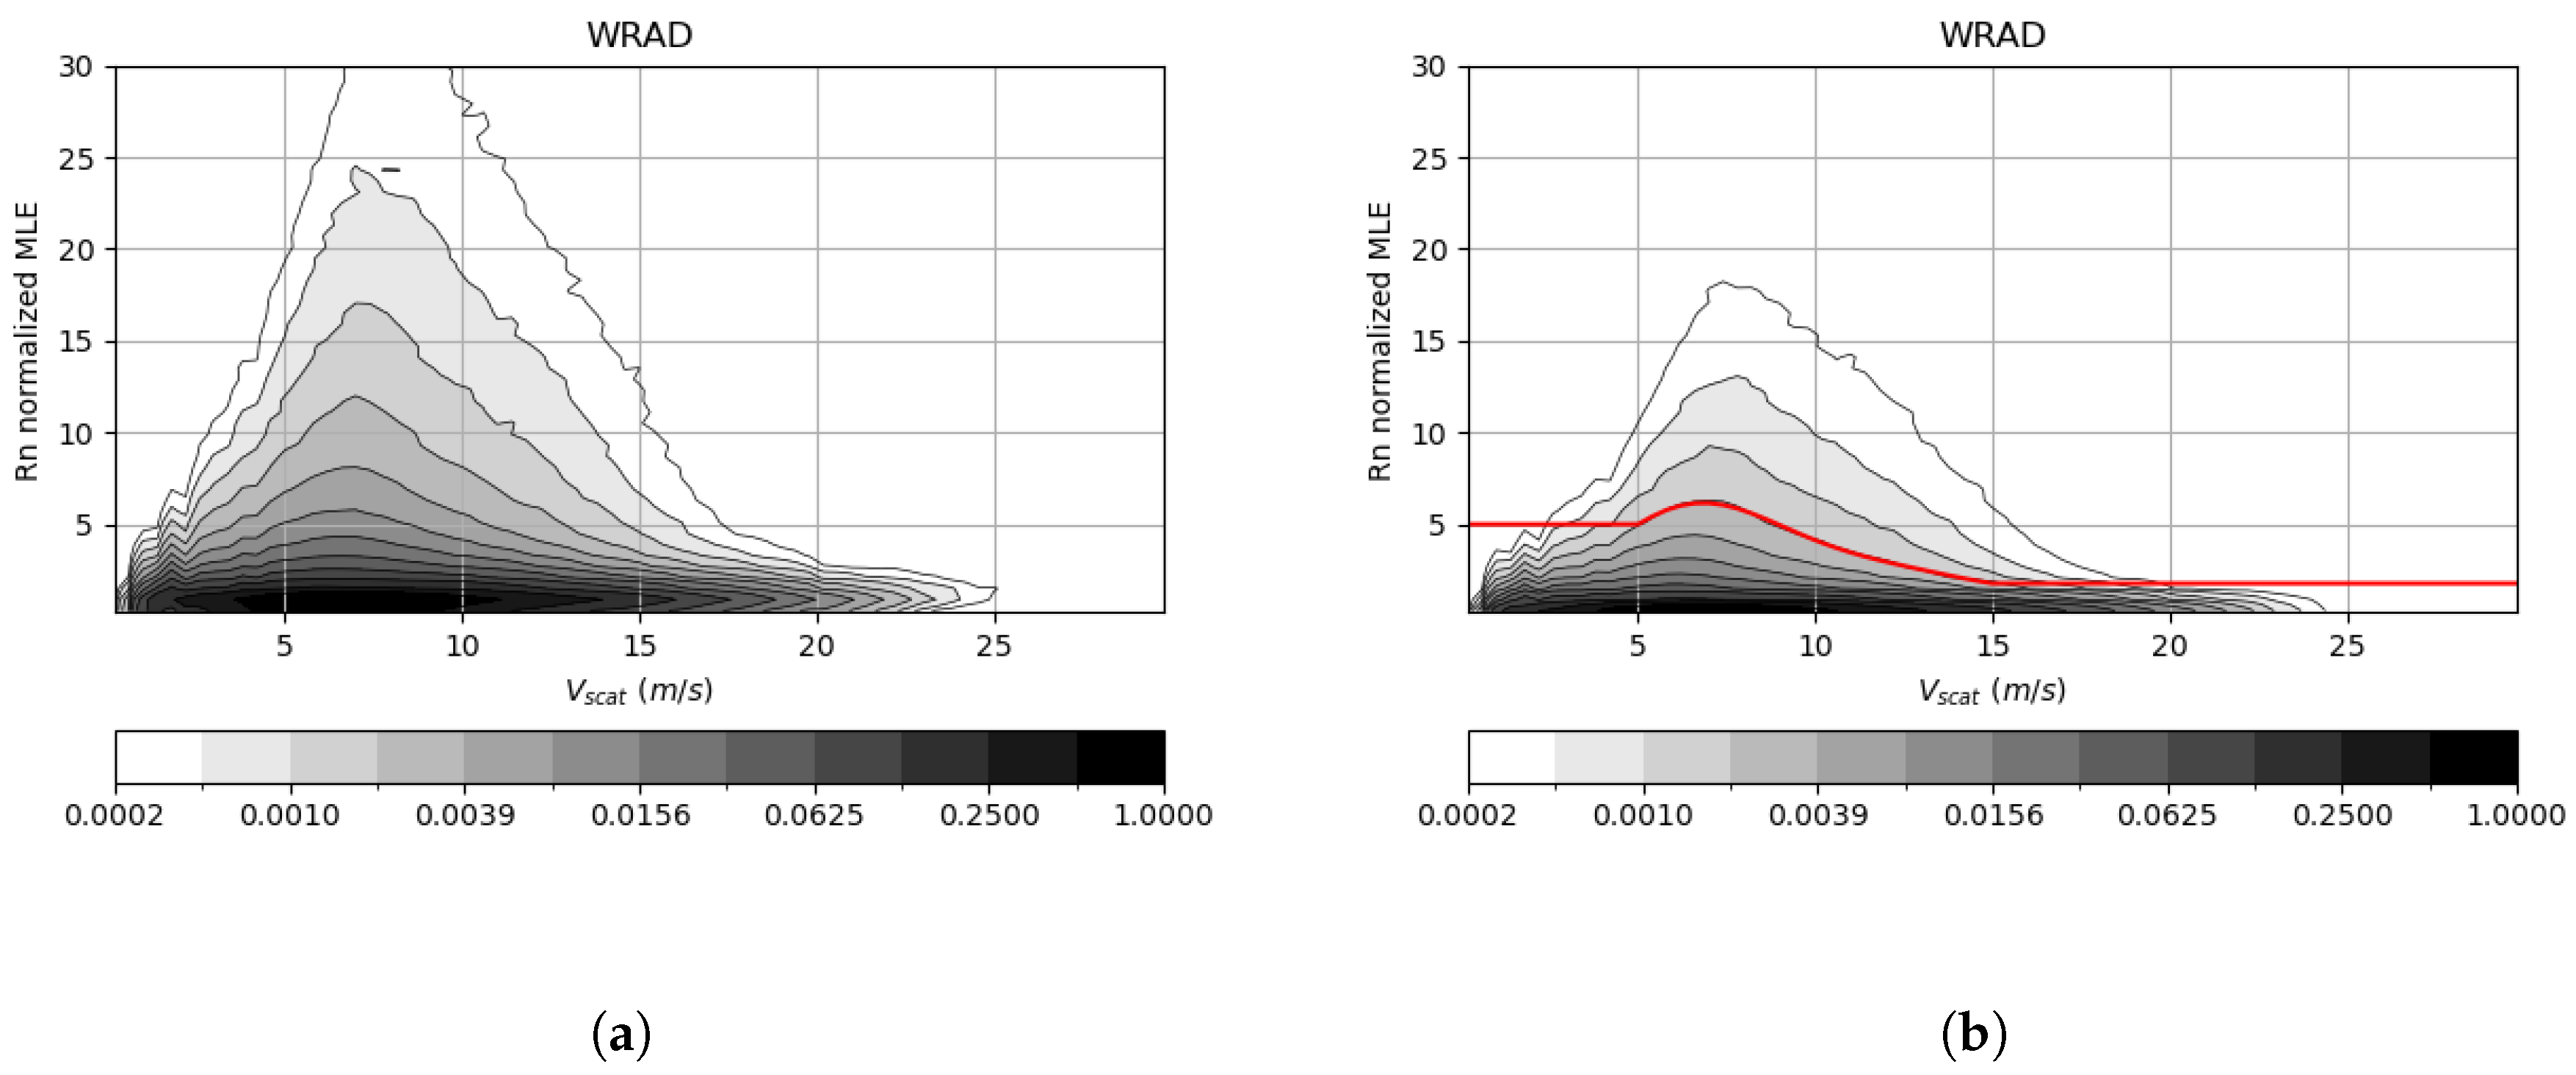
Figure 1 is an example of the
contour plot (Ku-band). The contour lines are more like a Gaussian distribution than like a parabolic distribution. Thus, a polynomial fit is applied to define the threshold. We still define the threshold as a constant value at wind speeds above 15 m/s, because otherwise more and more data are rejected with increasing wind speed until all the high winds are rejected. The threshold at a wind speed lower than 5 m/s is also set to a straight line since rain generally does not result in low wind speed retrievals. WVCs with
higher than the threshold are considered contaminated with rain and flagged. In
Section 3.1 and
Section 4.1, we give the evaluation of the threshold experiments for the Ku-band and C&Ku band.
2.5. QC Algorithm and Its Adaption to
Xu and Stoffelen [
17] proposed
as a QC indicator in addition to
for pencil-beam scatterometers. This method has also shown its capability for the rotating fan-beam scatterometer CFOSAT [
25]. In the wind retrieval ambiguity removal (2DVAR) step, a wind field is constructed from the scatterometer wind ambiguities and the NWP winds by minimizing a cost function with constraints on meteorological consistency, which is called the analysis wind field [
29].
is defined as
where
f is the analysis wind speed derived in 2DVAR and
is the selected retrieved wind speed. In the previous study [
17], the
QC for the pencil-beam scatterometer appeared to be too conservative with a high rejection rate (5 - 6%), and
was used to accept extra WVCs that were rejected by
.
is an excellent complementary indicator. For WindRAD, a proper
threshold will be set first. Then
is used to flag additional rainy WVCs, not detected by
. In this way, the local information (
) and spatial consistency (
) are both taken into account. The WVCs with
value lower than a certain threshold are considered rain-contaminated. The threshold value was modeled by three straight lines as a function of the wind speed [
30], which also performs well on WindRAD data (see
Section 3.2):
3. Ku-Band and QC Results and Discussion
3.1. QC Evaluation
The critical point of the
QC method described in
Section 2.4 is to set an appropriate threshold. The threshold is a trade-off between the data rejection of all rain-contaminated WVCs and the data rejection of good wind retrievals. WindRAD data from Aug to Oct 2023 (more than 37 million WVCs) are used to calculate the
distribution. Various experiments are performed to find the optimal trade-off for the threshold.
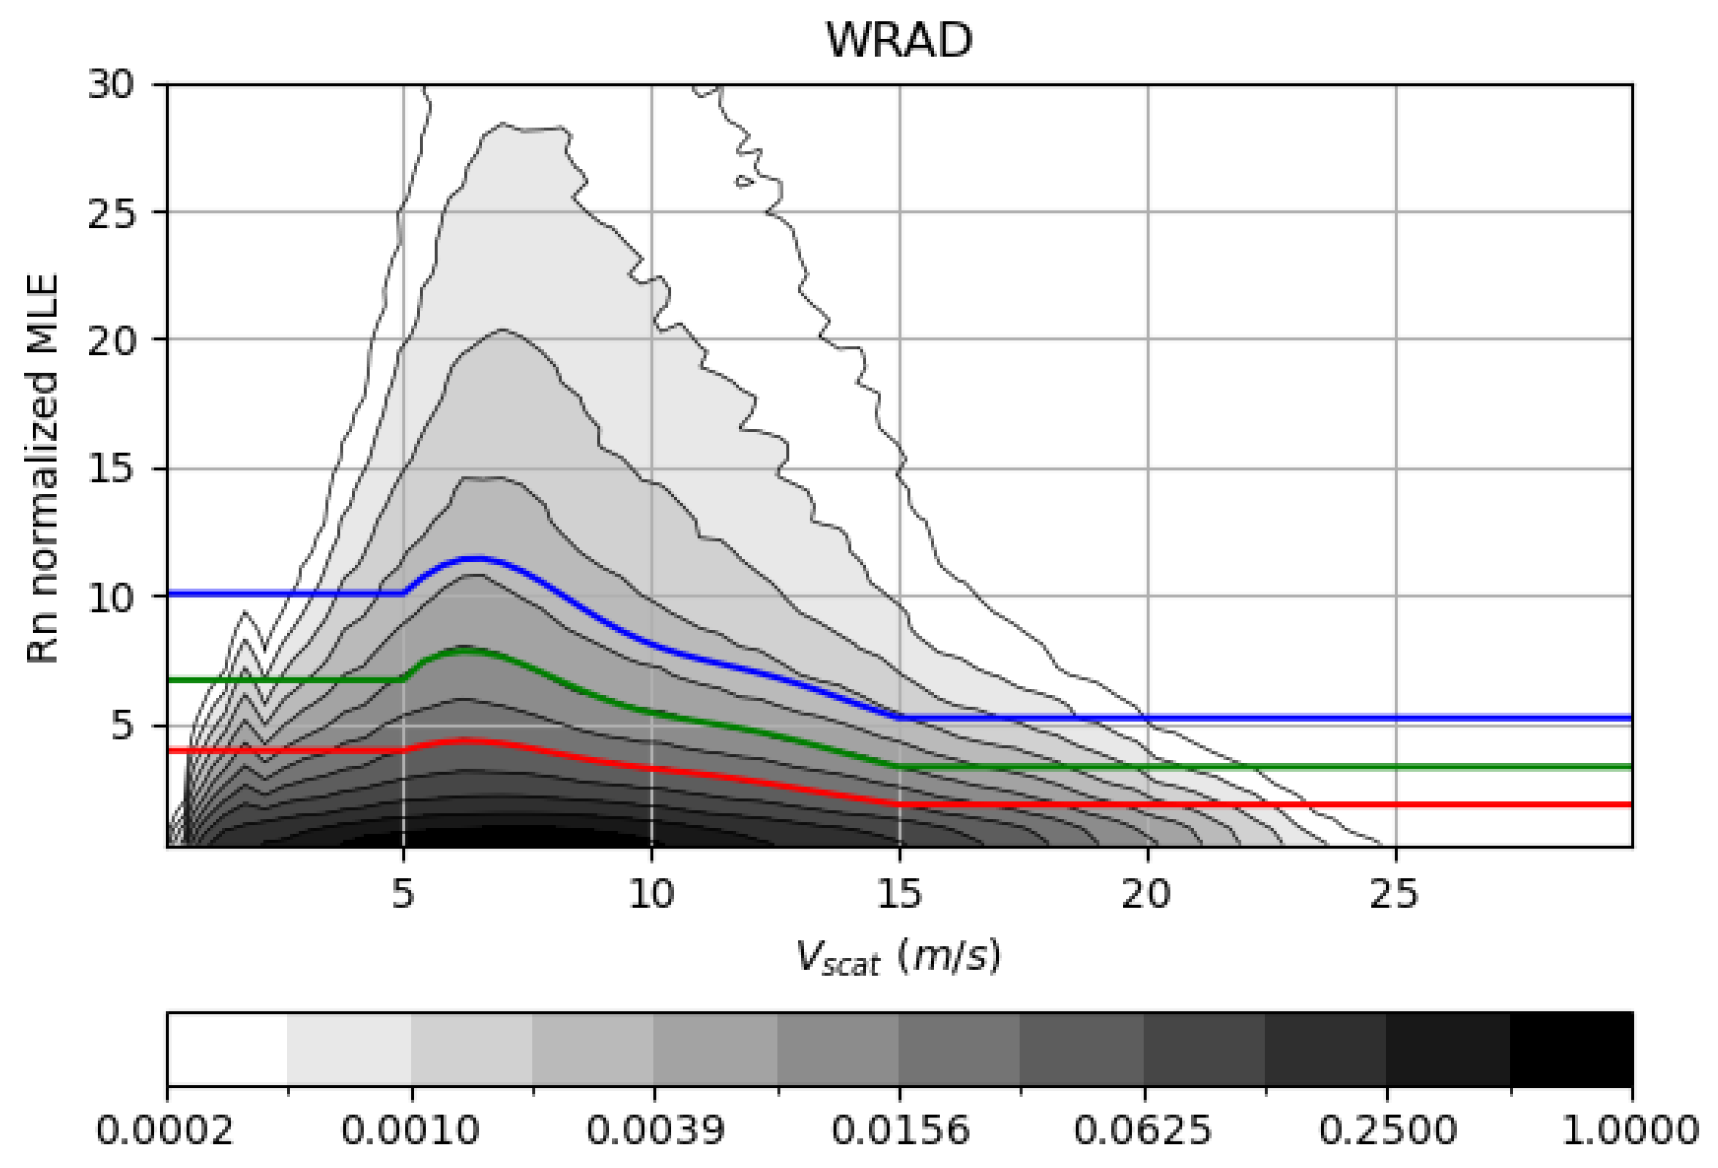
Figure 2 shows the selected tested thresholds from low rejection rate to high rejection rate: V1 (version 1, blue), V2 (version 2, green), and V3 (version 3, red).
Data from Aug 2023 in the latitude band between -20° and 20°, focusing on tropical moist convection processes, are used to evaluate the experiments.
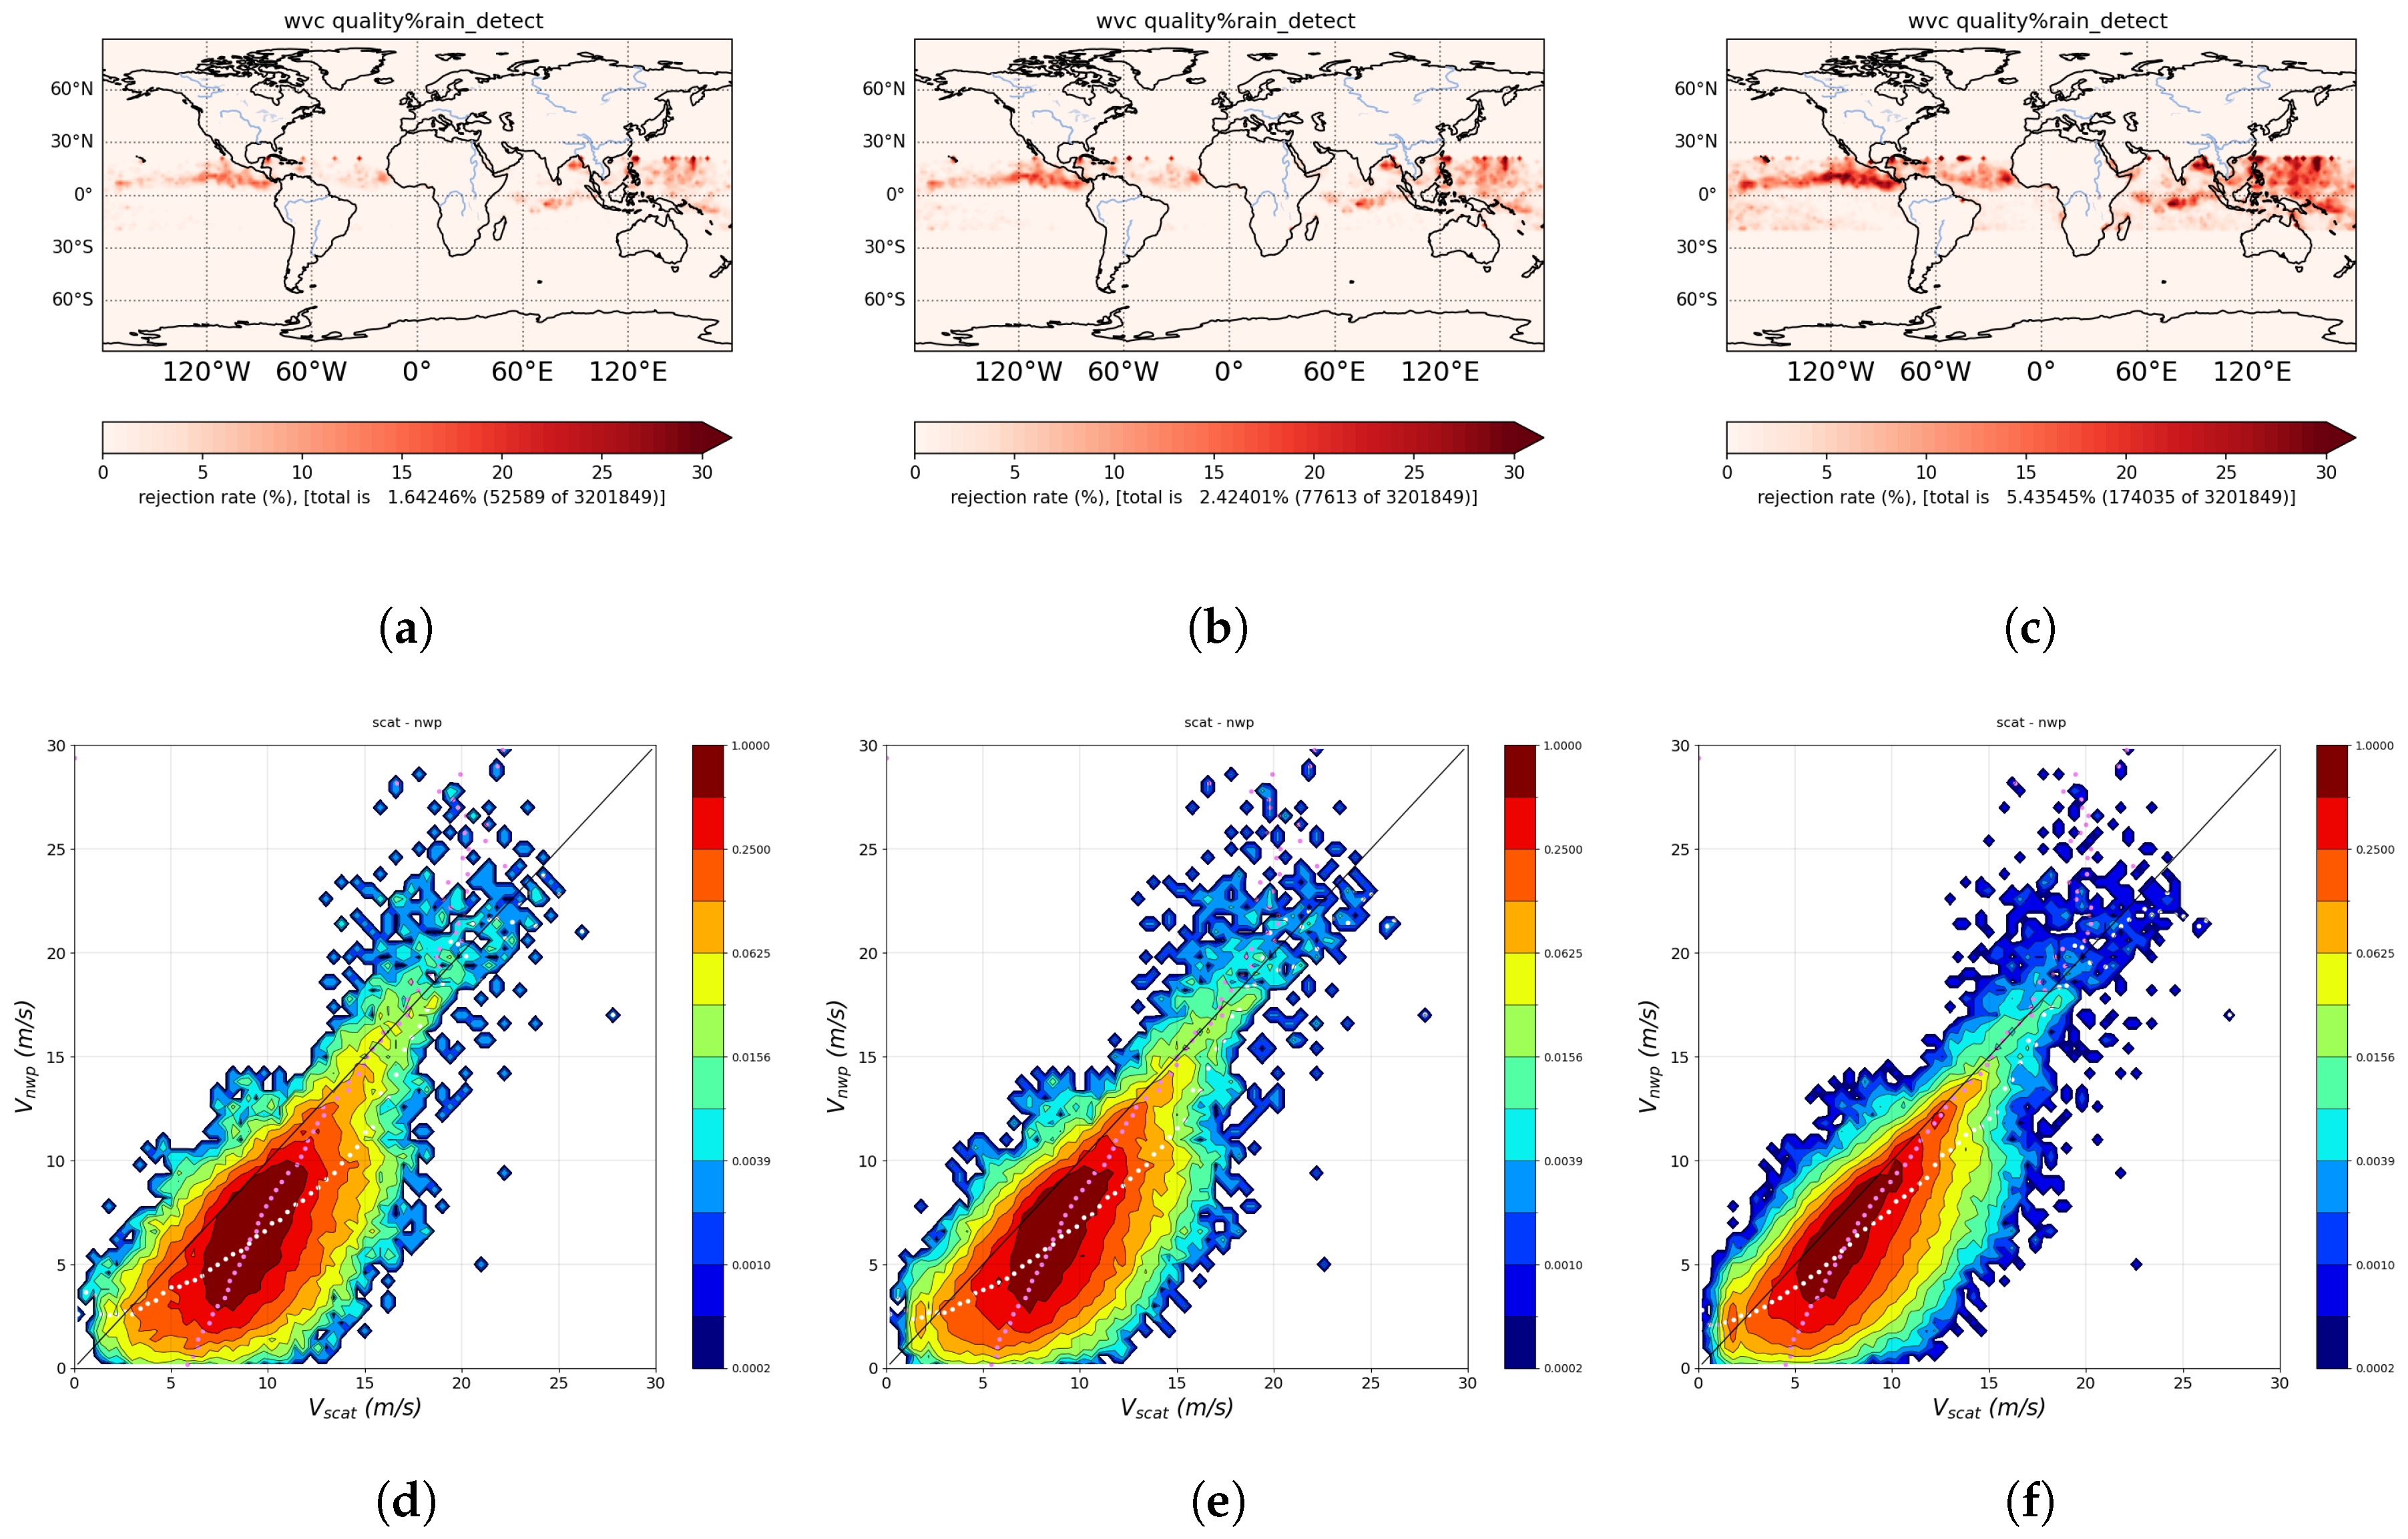
Figure 3 a, b, c show the tropical geographical distribution of the rejected winds for V1, V2, and V3, having rejection rates of 1.64%, 2.42%, and 5.44% respectively. The lower the rejection rate, the worse the rejected wind speed statistics are (
Figure 3 f, e, d), since
QC starts to reject wind from the WVCs with the highest
value (the most likely being rain contaminated) until it reaches the threshold. The rejected winds with the lowest rejection rate contain the least good quality winds. Hence, they have the worst wind statistics (V1). On the other hand, a low rejection rate allows more rain-contaminated WVCs winds to be accepted.
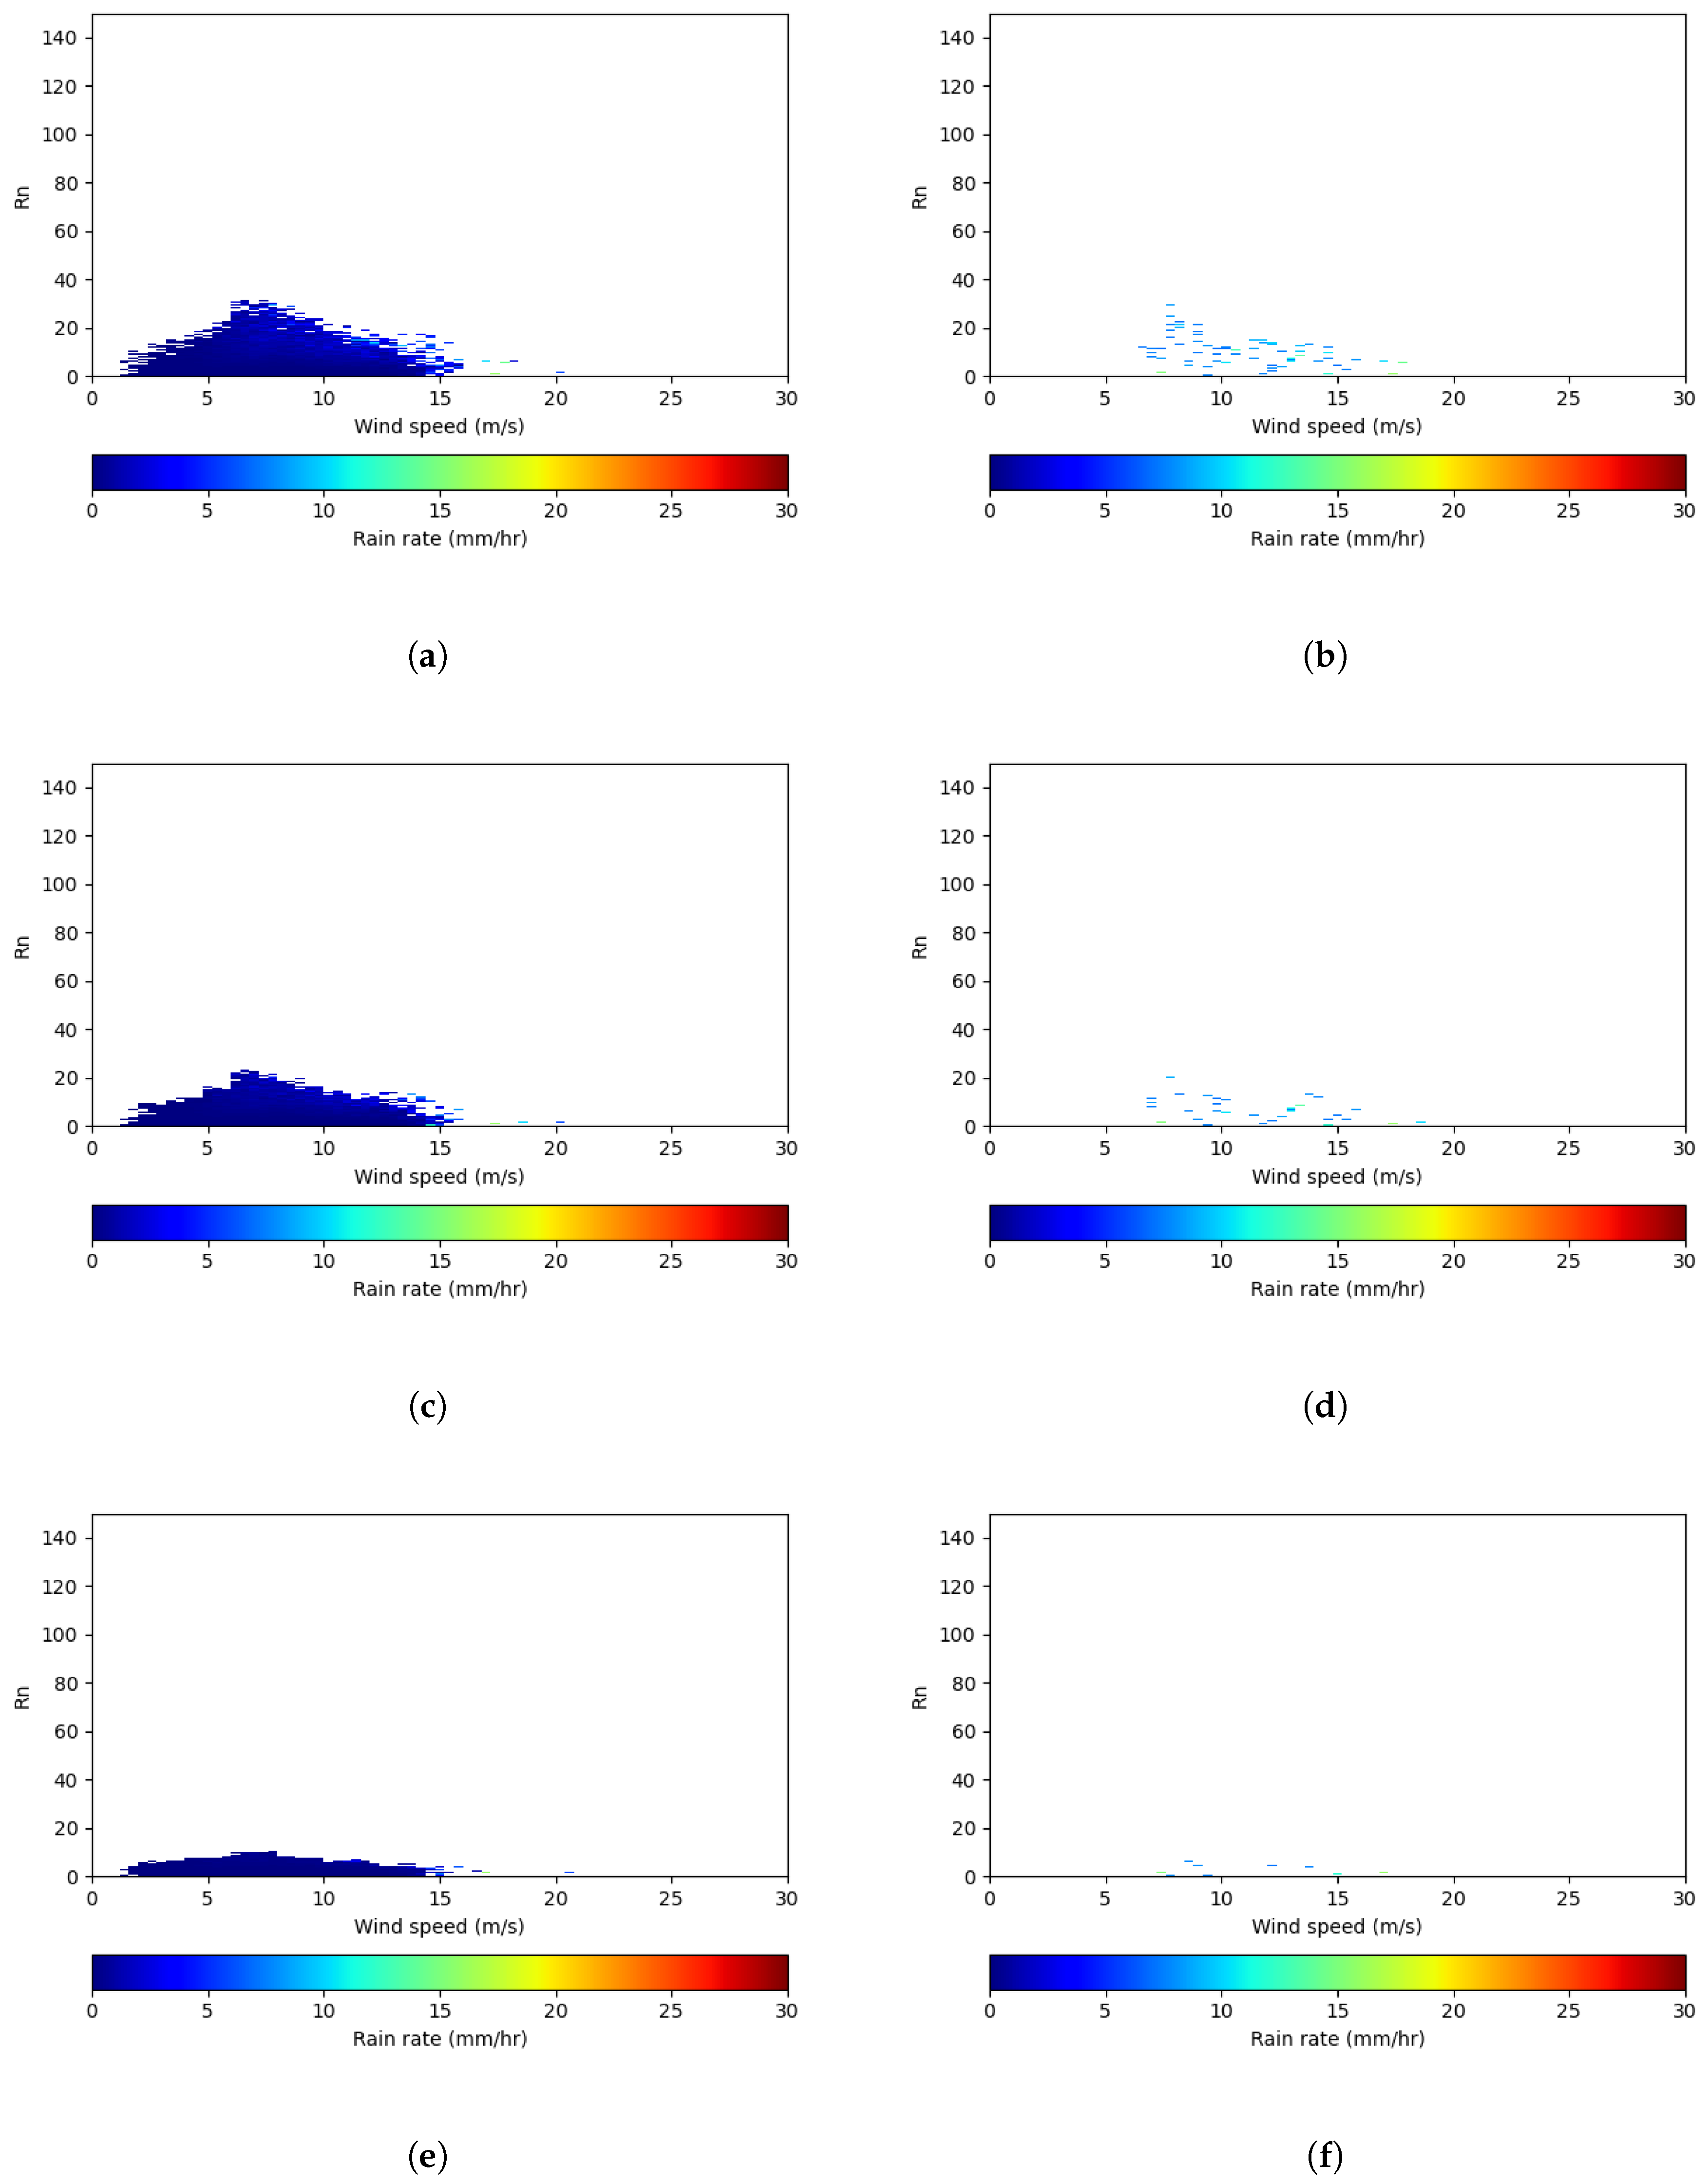
Figure 4 a and b show the V1
accepted winds collocated with the rain rate, and the V1
accepted winds collocated only with rain rates above 7 mm/hr. Most of the winds with high rain rates are excluded from the accepted winds, but compared with V2 and V3 (
Figure 4 c - f), the collocated rain rates of the accepted winds (left panel) for V1 are the highest, and more high rain rate (above 7 mm/hr) winds are accepted. V3 has the smallest number of WVCs with a rain rate higher than 7 mm/hr and the lowest rain rates for the accepted winds. But the rejected winds scatter plot (
Figure 3 f) shows that the core (the darkest red part of the contour) is closest to the diagonal. In contrast, the cores of V1 and V2 (
Figure 3 d and e) are further away from the diagonal, with a larger retrieved wind speed bias caused by rain. This indicates that too many good quality winds (along the diagonal) are rejected with V3 QC. Later on, in
Section 3.2, the
method will be combined with
to exclude additional rain-contaminated WVCs, thus, V3
is too strict. In conclusion, V1 rejects too few WVCs and keeps more rain-contaminated WVCs as accepted winds. V3 rejects more WVCs which still contain relative good quality winds. Hence, V2
is the optimal trade-off between the maximum rejection of low-quality data and the minimum rejection of high-quality data.
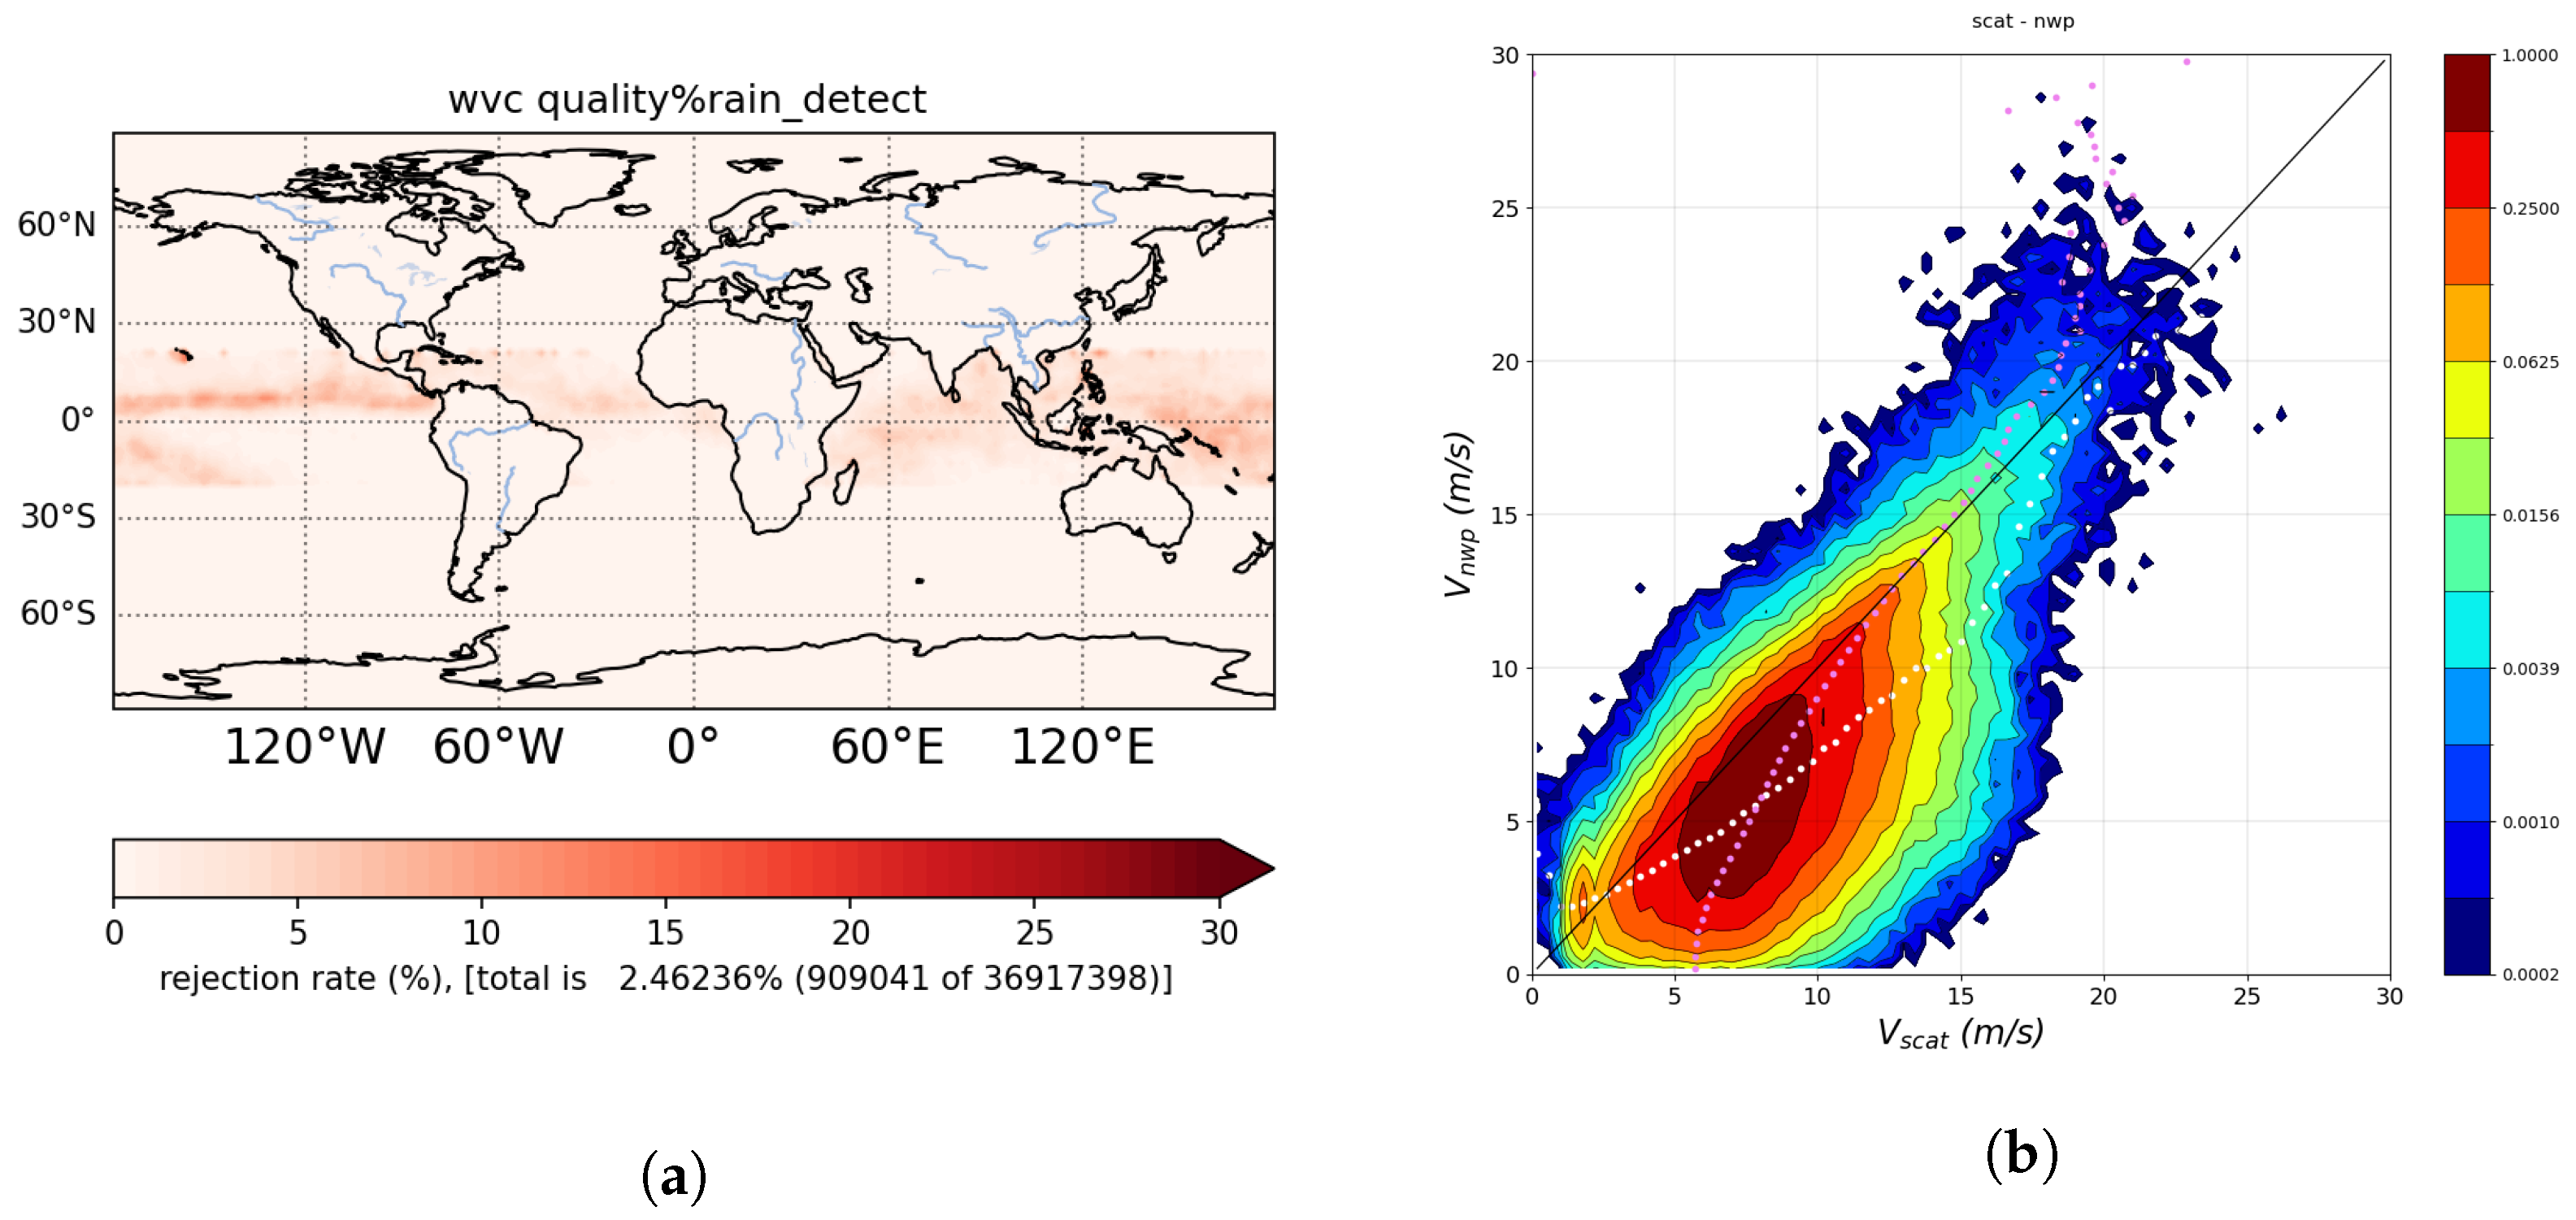
A long-term dataset from Aug 2023 to March 2024 validates the selected
QC (
Figure 5). The rejection rate of the tropical region is 2.46%, and the wind speed contour plot against the NWP wind shows a similar result as in August 2023 only. The accepted winds with a rain rate above 7 mm/hr are 0.014% of the total accepted winds, about half the fraction obtained from the V1
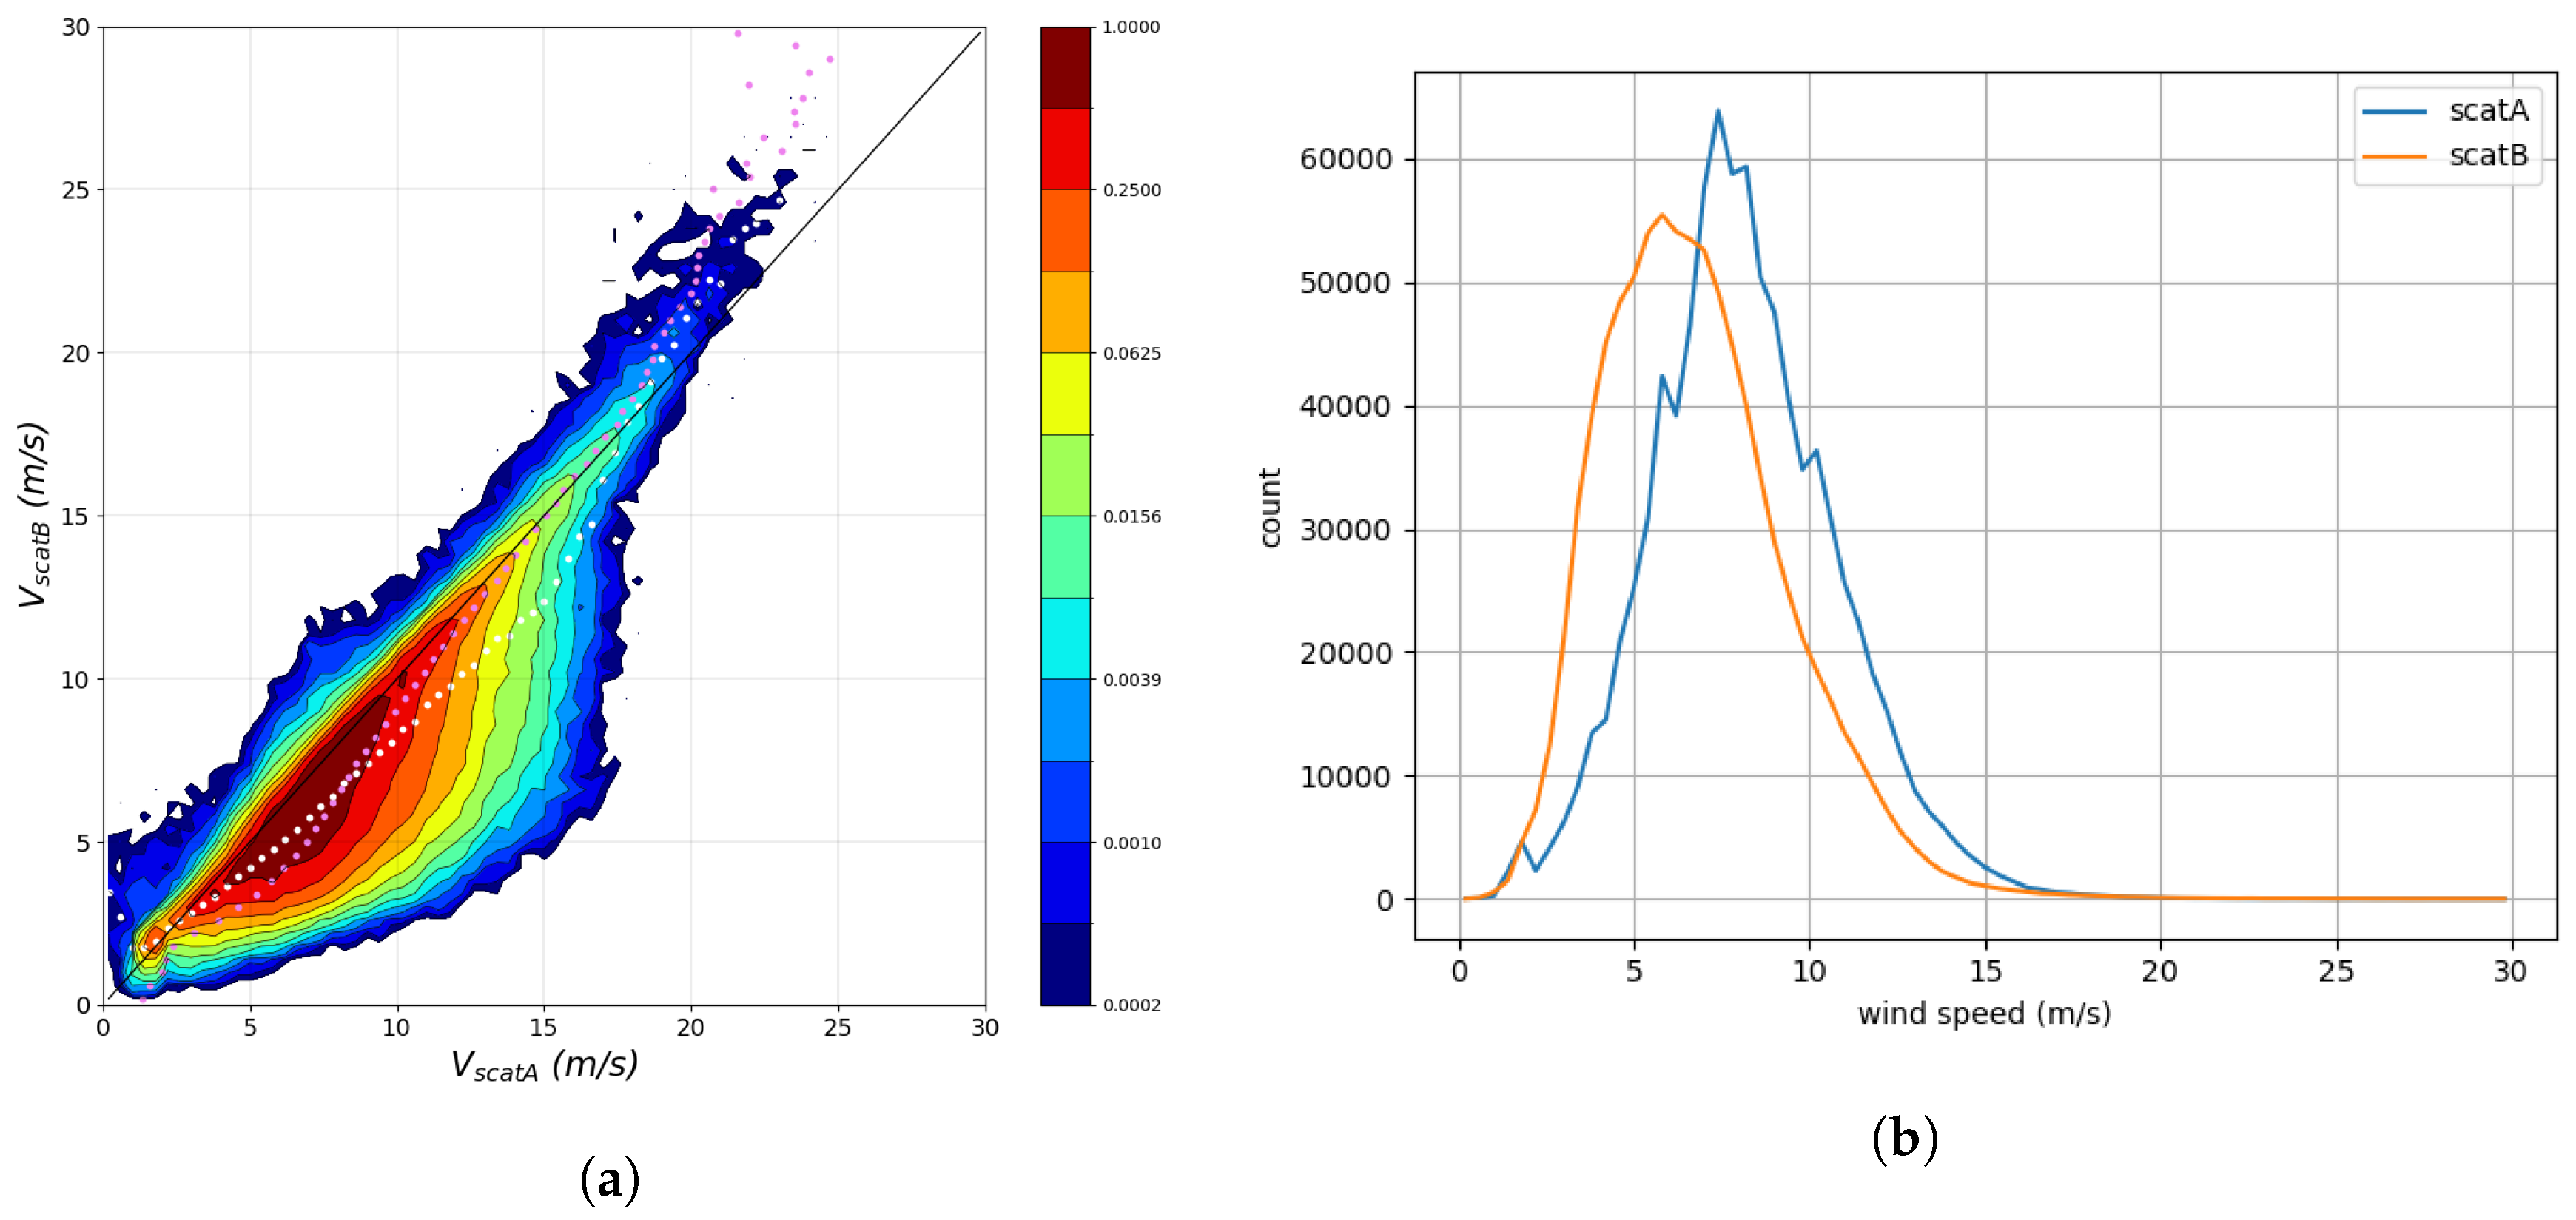
QC (0.026%). C-band wind retrievals are little influenced by rain and can be compared with the Ku-band winds. Thus, the Ku-band rejected winds are compared with the collocated accepted C-band winds from WindRAD. The rejected winds have a notable deviation from the C-band winds because rain contamination increases the backscatter, leading to a false large wind retrieval result (
Figure 6 a). The wind speed PDF (Probability Density Function) of the rejected winds (
Figure 6 b) is compared to the PDF of the corresponding accepted C-band winds, which is in agreement with
Figure 6 a. The V2
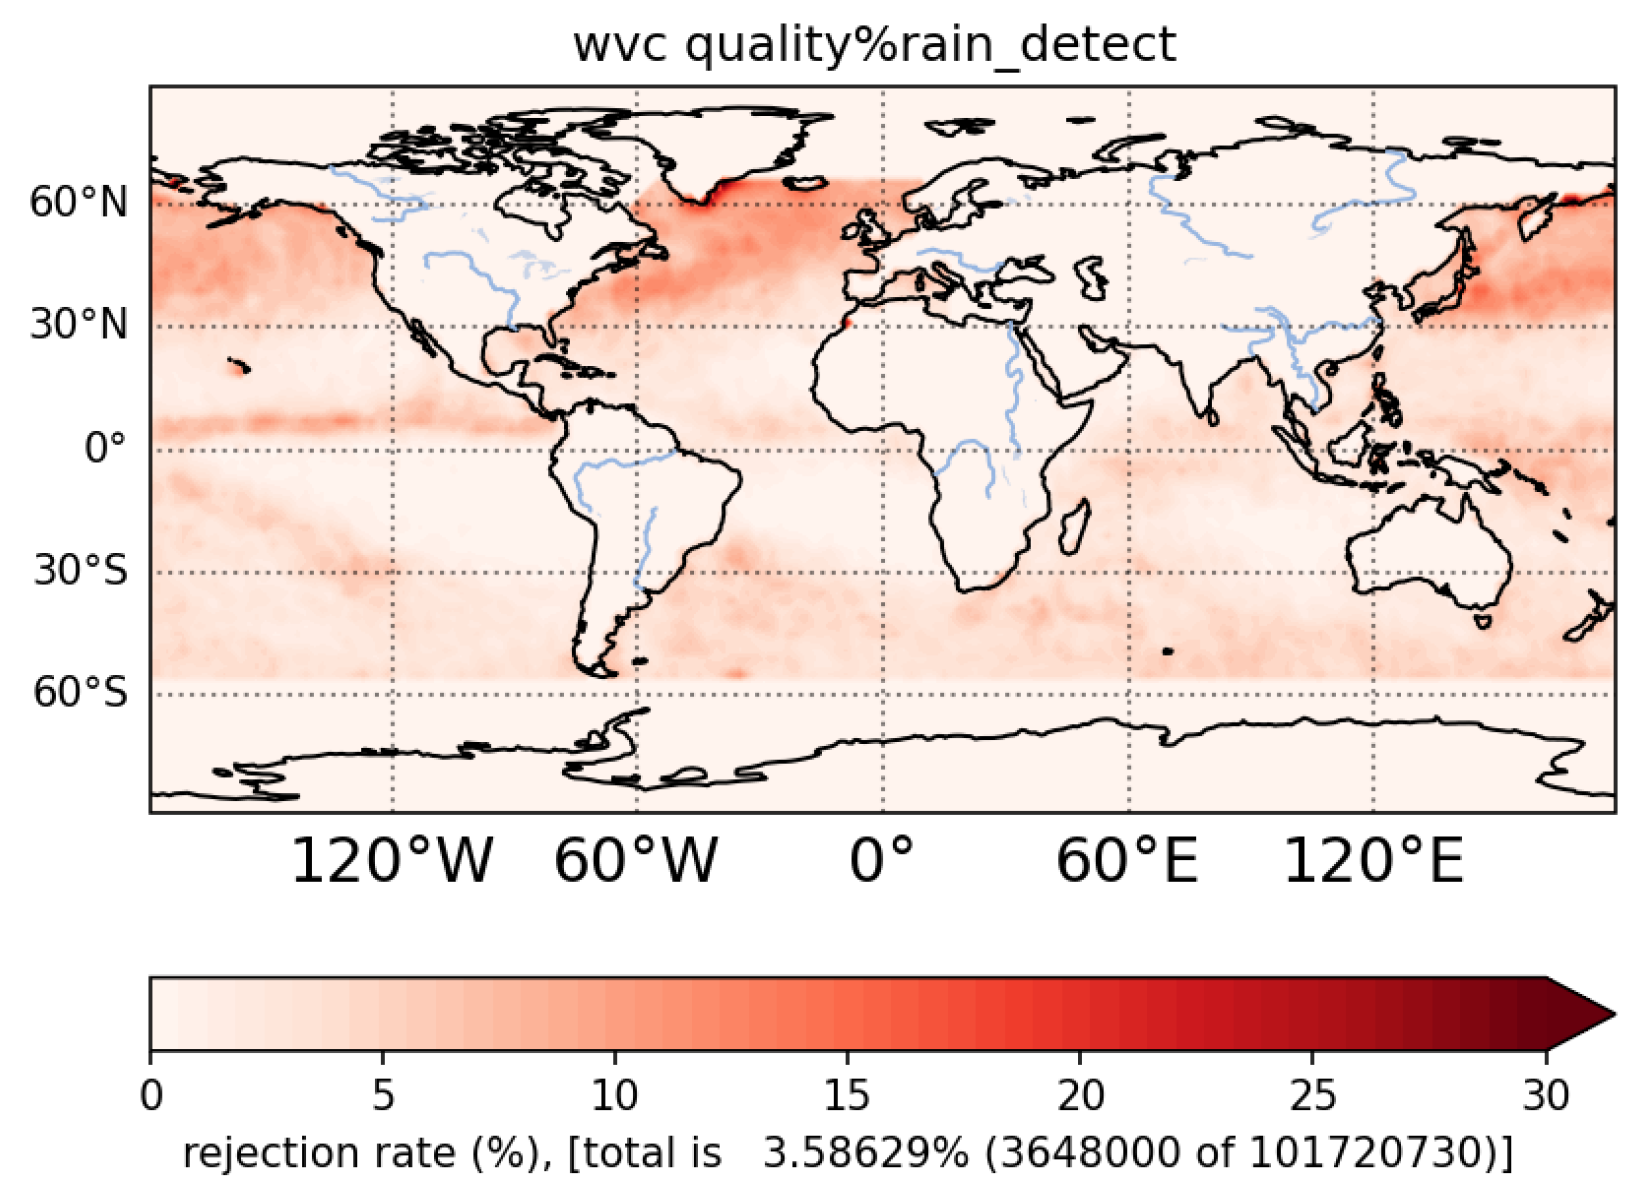
QC is also applied globally (except for the polar regions to avoid sea ice contamination) with a rejection rate of 3.58% (
Figure 7), and the accepted winds with rain rate above 7 mm/hr are about 0.013% of the total number of accepted winds, which is similar to the tropical region. The long-term dataset hence validates the suitability of the chosen V2
QC threshold.
3.2. QC Evaluation
The
threshold has been determined in
Section 3.1, together with the
threshold (eq.
3). In the combined method
, a WVC is rejected when its
higher than the
threshold or its
is lower than the
threshold.
includes both the rain local effect in an individual WVC (
) and the spatial inconsistency caused by rain (
). In this section, data from Aug 2023 to March 2024 are used.
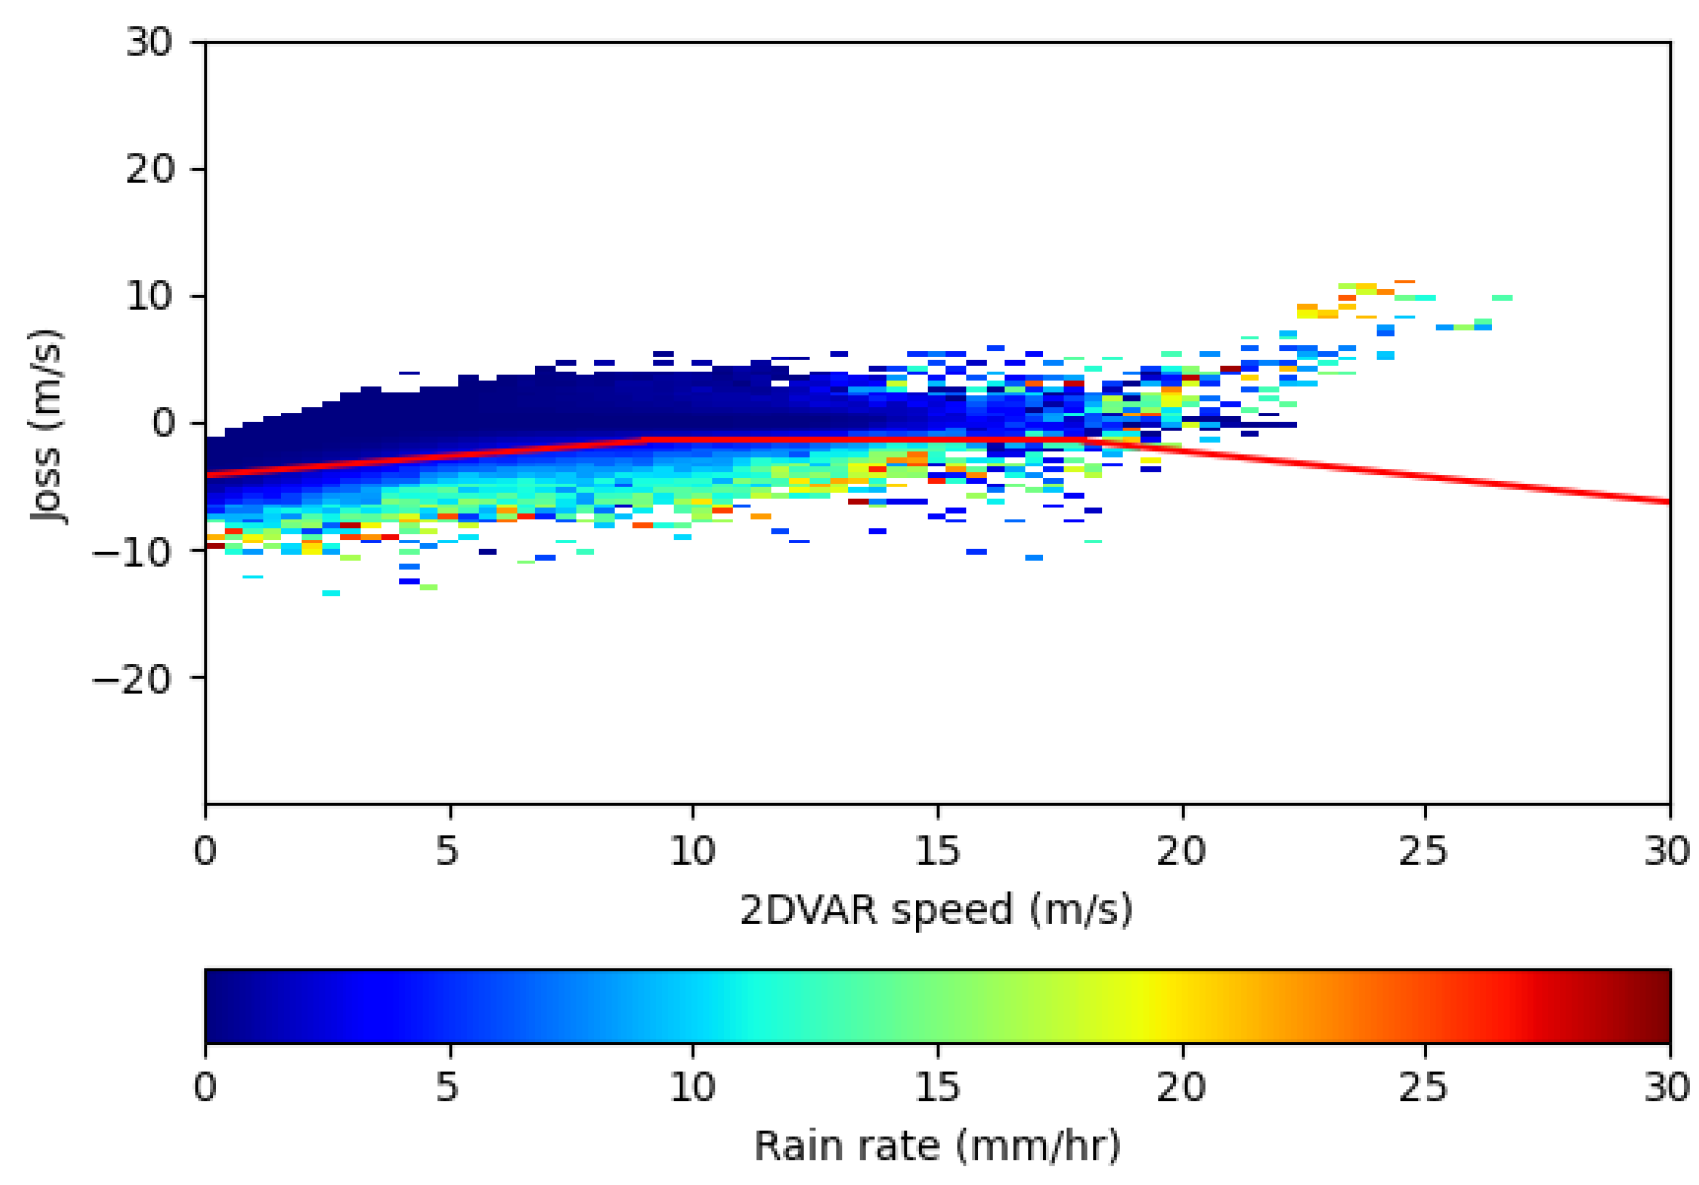
Figure 8 shows the
collocated with rain as a function of the analysis wind field constructed in the wind retrieval 2DVAR step (see
Section 2.5). The WVCs with a
value lower than the threshold (the red line in
Figure 8) are flagged, and they are indeed associated with high rain rates.
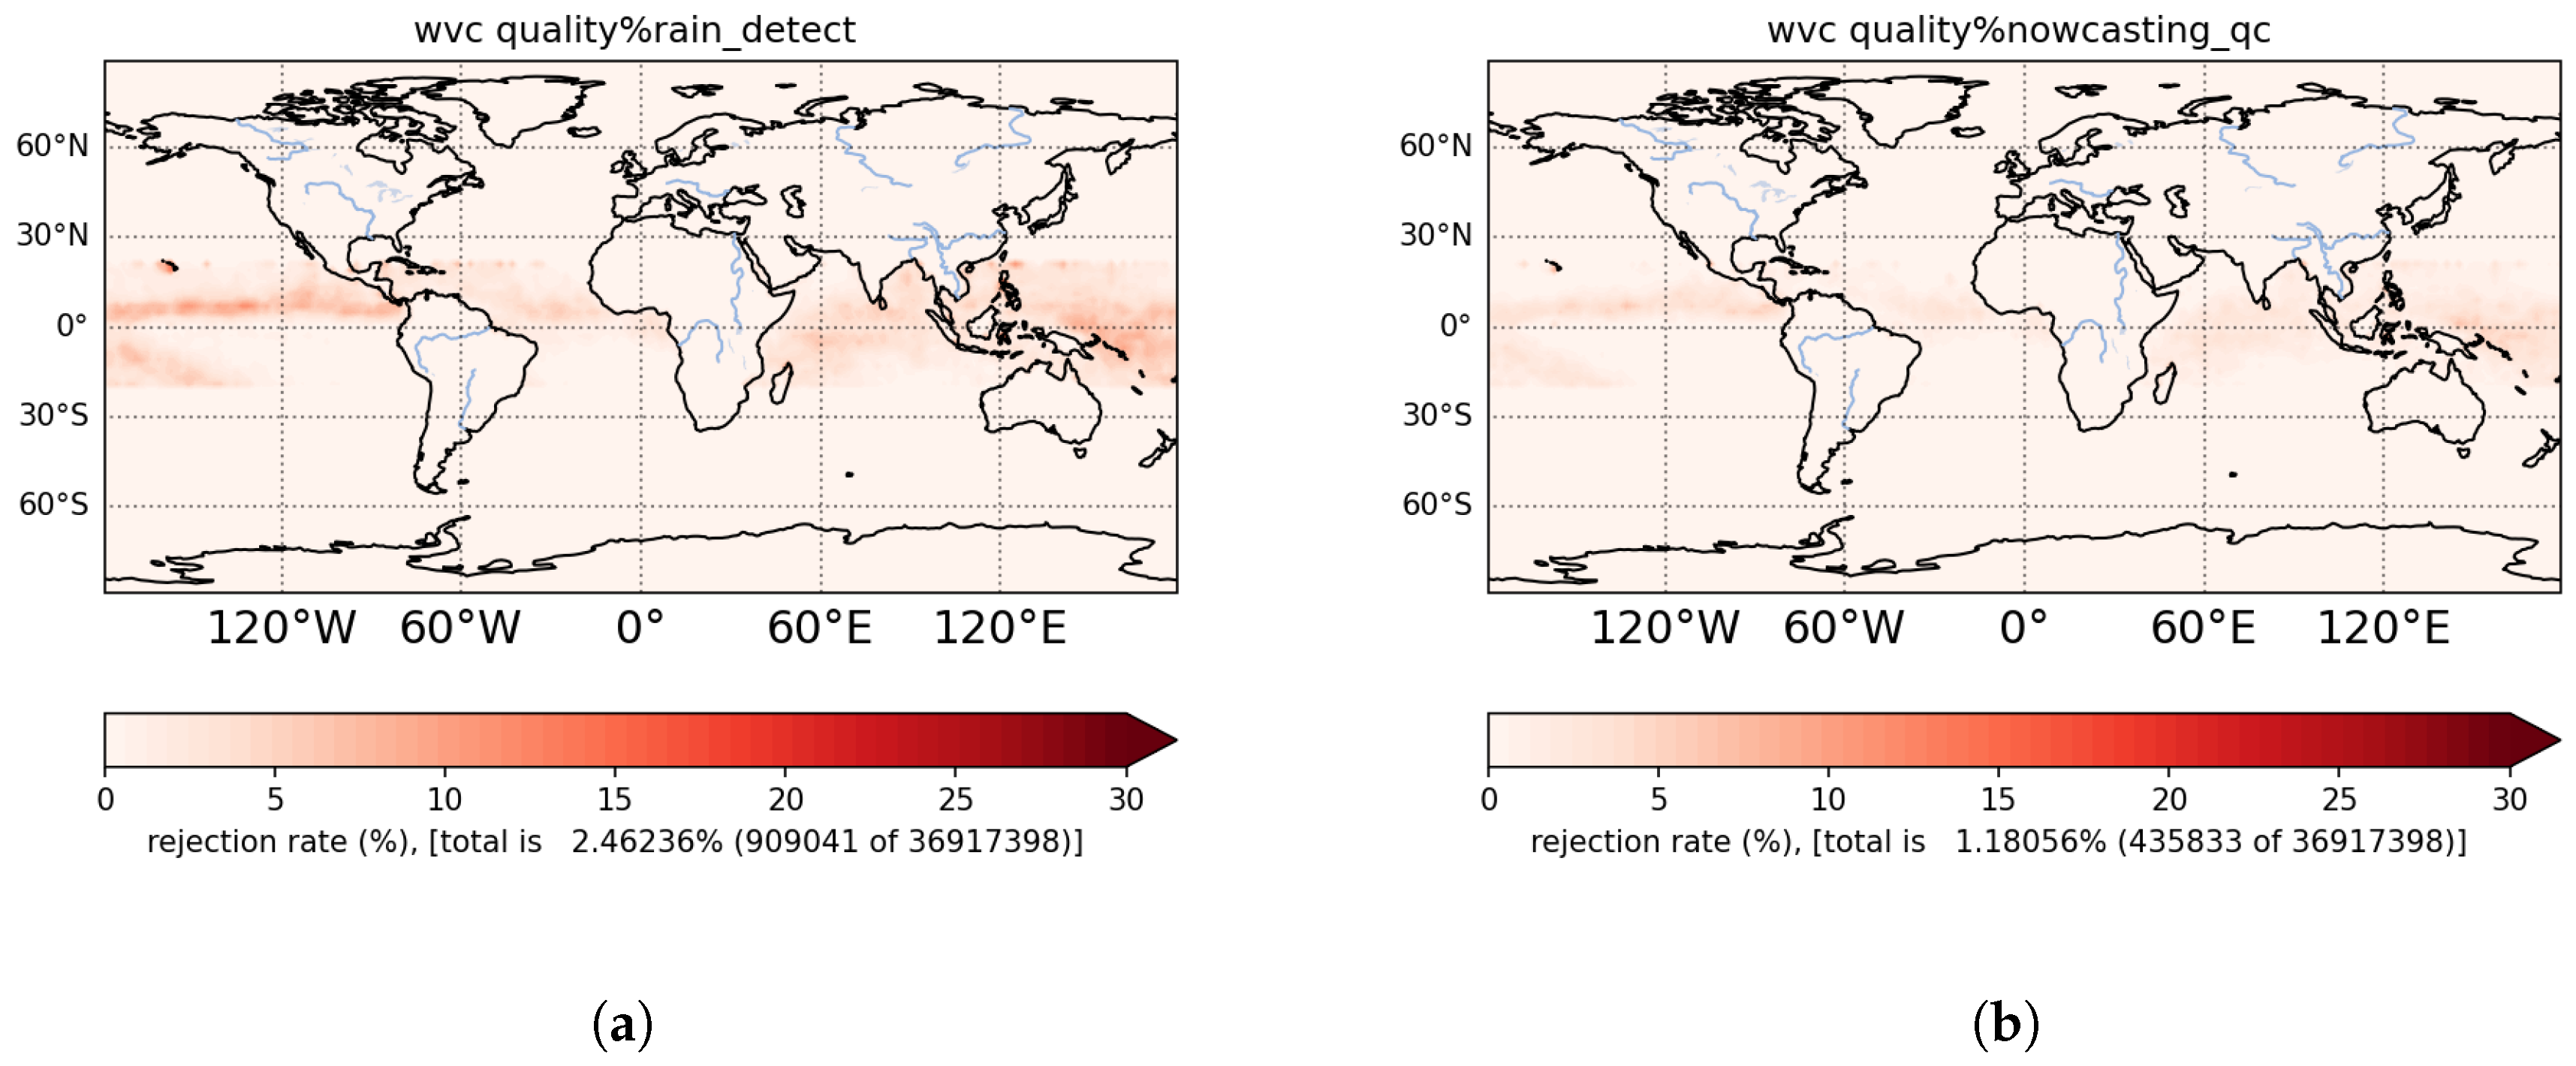
Figure 9 shows the geographical distribution of the rejected winds by
and
in the tropics, the rejection rates are 2.46% and 1.18%, respectively. The total rejection rate of
is 2.87%. This is lower than the sum of the two rejection rates, since there is some overlap between the two QC methods. An additional 0.41% of all WVCs are rejected by
as compared to
. If the statistics of the rejected winds become worse with more rejected winds, and at the same time, the statistics of the accepted winds become better or stay very similar, then, this confirms that the more rejected winds are low quality and presumably rain-contaminated, which means
is more effective.
Table 1 and
Table 2 show the wind statistics of the rejected winds and the accepted winds compared to the NWP winds and the WindRAD C-band winds, respectively. The statistics of the
accepted winds vs. the NWP winds are generally slightly better than the
winds. The rejected winds’ speed bias and the SDD of the
u v components vs. the NWP winds are all become worse with
than with
. Similarly, the statistics of the
accepted winds against the WindRAD C-band are all slightly better than the accepted winds by
, and the statistics of the rejected winds by
are either worse or stay very similar to the rejected winds by
.
rejects only 0.41% extra winds as compared to . However, still has a positive impact on the accepted wind statistics, and the statistics of the rejected winds by are either worse than or stay similar. Additionally, accepts only 0.007% of the winds with a rain rate above 7 mm/hr, this is half the amount which is accepted by (0.014%). Therefore, has a better capability to filter rain-contaminated WVCs than .
4. C&Ku Combined and QC Results and Discussion
4.1. Evaluation of the Ku Contribution to on QC
The MLE of the C&Ku wind retrieval includes both C and Ku frequencies (eq.
1). However, the C-band measurements are only little influenced by rain; therefore, the contribution of the C-band
, due to measurement noise, can dilute the effect of rain on the MLE and it may not be accurate to use the total
, based on both C- and Ku-band inputs, to set the QC threshold.
Figure 10 (a and b) shows the total
and the Ku-based
. We first discuss the respective QC results and assess the advantage of using only the Ku-based
, and then investigate the optimal threshold for
.
Data from August to October 2023 with latitudes between -20° and 20° are used. A similar amount of rejected winds is required to equally compare the rejected wind statistics between the use of total
and the Ku-based
. As shown in
Section 3.1, the
QC starts to reject the winds with the highest
value, these are most likely rain-contaminated. So, a low rejection rate (lower than 1%) is chosen to ensure that the rejected winds contain a minimal number of good quality winds.
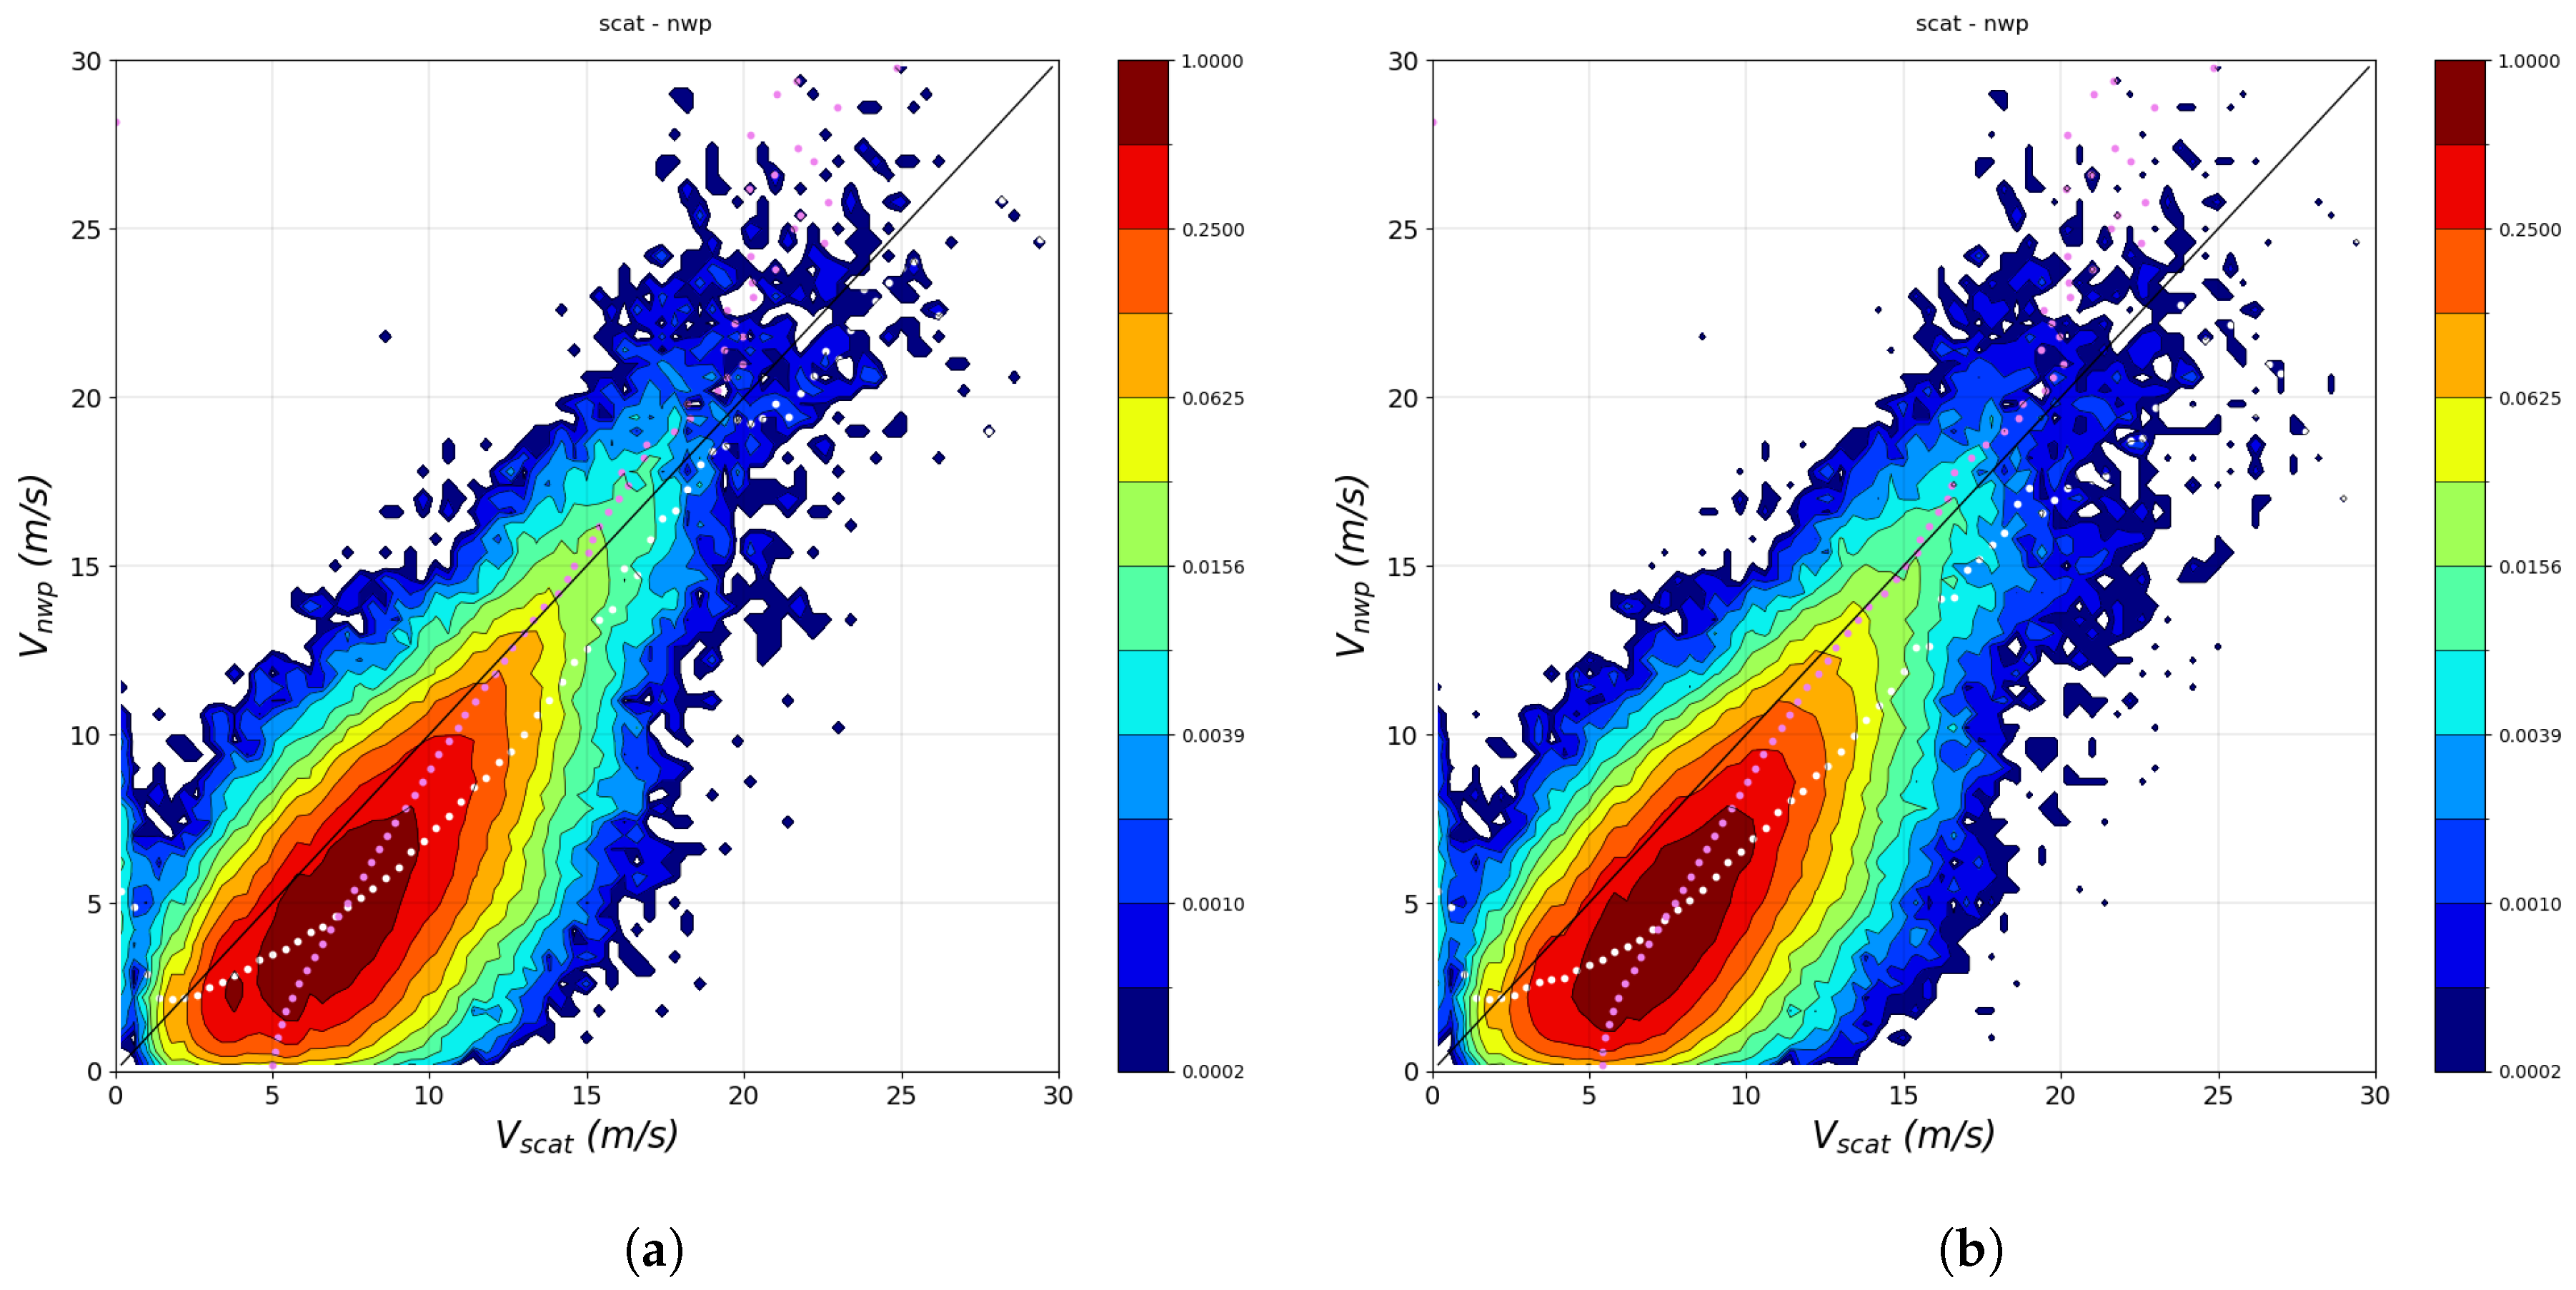
Figure 11 a and b show the geographical distribution of the rejected winds in the tropical region for the total
and the Ku-based
, with a rejection rate of about 0.7% for both. Against the NWP winds, the rejected wind speed of the Ku-based
(
Figure 11 d) shows a significantly larger deviation from the diagonal compared to the rejected winds using the total
(
Figure 11 c). Therefore, with the same amount of rejected winds, the Ku-based
can more accurately identify the rain-contaminated WVCs than the total
. The optimal QC threshold should be obtained from the Ku-based
.
Various experiments like those described in
Section 3.1 have been performed to select the optimal threshold (not shown). The chosen threshold is shown in
Figure 10 b, it is a good trade-off between keeping as much as possible the good quality winds and rejecting as much as possible the rainy WVCs. The rejection rate calculated with data from August 2023 to March 2024 is 1.11% in the tropical region, about half of the rejection rate for Ku-band-only (2.46%). At the same time and with this reduced rejection rate, the rejected and accepted wind statistics against the NWP winds and the C-band WindRAD winds (
Table 3) do not show a large difference compared to those of the Ku-band-only (
Table 1 and
Table 2). In addition, the percentage of the accepted winds with a rain rate above 7 mm/hr is 0.041%, which is three times as much as when the Ku-band
is used (0.014%). This indicates that by adding C-band measurements to the wind retrieval, the rain effect is suppressed, and some of the WVCs rejected by Ku-band
are now accepted by C&Ku. Thus, the C&Ku wind retrieval can achieve similar QC results in terms of rejected and accepted wind statistics and still reject fewer WVCs. Hence, the C-band has a clear added value in rainy conditions to obtain improved vector winds.
4.2. QC Evaluation
The combined QC method
is also applied on the C&Ku wind retrieval with the same procedure as in
Section 3.2. The data from Aug 2023 to March 2024 are evaluated in the tropical region with latitudes between [-20°, 20°].
The rejection rate using
QC is 0.73%, the rejection rate using
QC is 1.11%, and the rejection rate using
QC is 1.53%. Hence, 0.42% of extra data are rejected using
as compared to
, which is almost the same number as for the Ku-band retrievals (0.41%).
Figure 12 shows the speed contour plot of the rejected winds against NWP winds using
(a) and
(b). The rejected winds from
QC deviate more from the diagonal than the rejected winds from
QC. The statistics of rejected winds for
against NWP winds and the WindRAD C-band winds (
Table 4 and
Table 5) are all worse than for
, except the wind speed bias against the WindRAD C-band winds is slightly better (very similar), which might be because the C&Ku winds contain the same C-band source. The accepted wind statistics for
QC are all slightly better than the accepted wind statistics for
QC (
Table 4 and
Table 5). As described in
Section 3.2, only when the extra rejected winds are rain-contaminated (low quality), the statistics of the rejected winds will become worse with more rejected winds, whereas the statistics of the accepted winds will become better or stay similar. Therefore, as discussed above, the extra rejected winds by
are rain-contaminated and which is not detected by
. Furthermore, the accepted winds with rain rates above 7 mm/hr are about 0.027% of the total wind count, a reduction of more than one-third as compared to
QC (0.041%). In conclusion, the
can further identify the rain-contaminated WVCs and works consistently for the C&Ku wind retrieval.
5. Conclusions
WindRAD is a dual-frequency rotating-fan-beam scatterometer with C-band and Ku-band antennas. C-band measurements are only little influenced by rain, whereas Ku-band measurements are very sensitive to heavy rain because of their shorter wavelength. In this article, the QC in association with rain contamination for Ku-band and C&Ku wind retrievals has been thoroughly investigated, focusing on the tropical region. The normalized MLE residual
and the combined method
(
and
) are adapted to the WindRAD measurements. The
threshold is a trade-off between a high rejection rate of low quality winds and a low rejection rate of good quality winds.
considers spatial consistency, and it is an excellent complementary indicator in detecting rainy WVCs [
17]. The
is a combination of
and
that makes use of both the local information (MLE) and the spatial consistency (
).
For Ku-band wind retrieval, first an optimal threshold is set and then the QC is combined with QC. An additional 0.41% of WVCs are rejected when QC is used. With more rejected winds, the statistics of rejected wind are worse than the results with QC, indicating the more rejected winds are most likely rain-contaminated. The statistics of accepted winds are all slightly better than with QC. Moreover, the number of accepted WVCs with high rain rate (> 7 mm/hr) is reduced by half for QC, as compared to QC. In conclusion, the combined QC method can distinguish rain-contaminated WVCs better than the QC method.
An important opportunity for the C&Ku wind retrieval is to use the Ku-based instead of the total (C and Ku) . The Ku-based results and the total results are compared for the same rejection rate of 0.7%. The rejected winds speed contour plot against NWP winds has a larger deviation from the diagonal for the Ku-based than for the total . The reason for this is that rain does not influence the C-band observations to any substantial extent, and hence, the C-band measurement noise contribution to may lead to false alarms in rain detection. Thus, the Ku-based QC is more effective than the total QC to identify rainy WVCs.
1.11% of the C&Ku wind retrievals are rejected by Ku-based QC, which is reduced by about half compared to the Ku-band-only retrievals. At the same time and with the reduced rejection rate, the statistics of the accepted and rejected winds do not differ much from those using Ku-band-only retrievals. When using Ku-based and looking at the WVCs with a high rain rate of over 7 mm/hr, three times more accepted winds are retrieved using C&Ku than using Ku-band-only. This indicates that combining the C-band with the Ku-band suppresses the rain effect in the wind retrieval and hence achieves good-quality winds with fewer rejected WVCs. The Ku-based and for C&Ku retrievals are also compared. An additional 0.42% of WVCs are rejected by the Ku-based . Like for the Ku-band-only retrieval, the statistics of rejected winds are worse than the results with QC, and at the same time, the statistics of accepted winds are slightly improved compared to the result with QC. Therefore, the Ku-based can accurately exclude more rainy WVCs and its performance characteristics are consistent with the Ku-band-only wind retrieval results.
Above all, the is an optimal QC method to detect rain contamination for wind retrievals where Ku-band observations are used. The Ku-based is the key to improving QC for C&Ku wind retrieval. Adding the C-band observations to the wind retrieval suppresses the rain effect, and the same QC skill (in terms of accepted wind statistics) can be achieved with fewer rejected WVCs.
The very different rain effect for C-band and Ku-band may furthermore be exploited in the future for rain correction and as such further improve the quality of the WindRAD ocean surface vector winds in rainy areas. In addition, WindRAD may have a good capability to measure rain rates, which may be exploited in such future work.
Author Contributions
Conceptualization, Z.L.; methodology, Z.L., A.V., and A.S.; software, Z.L.; validation, Z.L.; formal analysis, Z.L.; investigation, Z.L.; resources, Z.L., A.V., and A.S.; data curation, Z.L., A.V., and A.S.; writing—original draft preparation, Z.L.; writing—review and editing, Z.L., A.V., and A.S.; visualization, Z.L.; supervision, A.S. and A.V.; project administration, A.V. and A.S.; funding acquisition, A.S., A.V., and Z.L. All authors have read and agreed to the published version of the manuscript.
Funding
This research was supported by EUMETSAT OSI SAF CDOP4 (Darmstadt, Germany).
Data Availability Statement
WindRAD data will be added later on KNMI data platform upon the acceptance of the manuscript. Huffman, G.J., E.F. Stocker, D.T. Bolvin, E.J. Nelkin, Jackson Tan (2023), GPM IMERG Final Precipitation L3 Half Hourly 0.1 degree x 0.1 degree V07, Greenbelt, MD, Goddard Earth Sciences Data and Information Services Center (GES DISC), Accessed: [Data Access Date],
10.5067/GPM/IMERG/3B-HH/07.
Acknowledgments
We acknowledge the support of CMA in providing the data, status, and mission information. The support from the EUMETSAT Ocean and Sea Ice Satellite Application Facility is also much appreciated.
Conflicts of Interest
The authors declare no conflicts of interest. The funders had no role in the design of the study; in the collection, analyses, or interpretation of data; in the writing of the manuscript; or in the decision to publish the results.
Abbreviations
The following abbreviations are used in this manuscript:
| ASCAT |
Advanced Scatterometer |
| ECMWF |
European Centre for Medium-Range Weather Forecasts |
| FY-3E |
Fengyun-3E |
| GMF |
Geophysical Model Function |
| GPM |
Global Precipitation Measurement |
| HOC |
Higher Order Calibration |
| HY |
Hai Yang |
| KNMI |
Royal Netherlands Meteorological Institute |
| MLE |
Maximal Likelihood Estimation |
| NOCant |
NWP Ocean Calibration as a function of incidence angle and relative antenna angle |
| NWP |
Numerical Weather Prediction |
| OSI SAF |
Ocean and Sea Ice Satellite Application Facility |
| PDF |
Probability Density Function |
| QC |
Quality Control |
| SST |
Sea Surface Temperature |
| SDD |
Standard Deviation Difference |
| WindRAD |
Wind Radar |
| WVC |
Wind Vector Cell |
| 2DVAR |
2-D Variantional Ambiguity Removal |
| 3IMERG |
Level-3 Integrated Multi-satellitE Retrievals for GPM |
References
- Jiang, X.; Lin, M.; Liu, J.; Zhang, Y.; Xie, X.; Peng, H.; Zhou, W. The HY-2 satellite and its preliminary assessment. International Journal of Digital Earth 2012, 5, 266–281. [Google Scholar] [CrossRef]
- Gelsthorpe, R.V.; Schied, E.; Wilson, J.J.W. ASCAT - Metop’s advanced scatterometer. ESA BULLETIN-EUROPEAN SPACE AGENCY, 2000. [Google Scholar]
- Li, Z.; Verhoef, A.; Stoffelen, A.; Shang, J.; Dou, F. First Results from the WindRAD Scatterometer on Board FY-3E: Data Analysis, Calibration and Wind Retrieval Evaluation. Remote Sensing 2023, 15, 2087. [Google Scholar] [CrossRef]
- Li, Z.; Stoffelen, A.; Verhoef, A.; Wang, Z.; Shang, J.; Yin, H. Higher-order calibration on WindRAD (Wind Radar) scatterometer winds. Atmospheric Measurement Techniques 2023, 16, 4769–4783. [Google Scholar] [CrossRef]
- Chi, C.Y.; Li, F.K. A comparative study of several wind estimation algorithms for spaceborne scatterometers. IEEE Transactions on Geoscience and Remote Sensing 1988, 26, 115–121. [Google Scholar] [CrossRef]
- Pierson, W.J. Probabilities and statistics for backscatter estimates obtained by a scatterometer. Journal of Geophysical Research 1989. [Google Scholar] [CrossRef]
- Portabella, M.; Stoffelen, A. Characterization of Residual Information for SeaWinds Quality Control. IEEE Trans. Geosci. Rem. Sens 2002, 40, 2747–2759. [Google Scholar] [CrossRef]
- Cornford, D.; Csató, L.; Evans, D.J.; Opper, M. Bayesian Analysis of the Scatterometer Wind Retrieval Inverse Problem: Some New Approaches. Journal of the Royal Statistical Society. Series B (Statistical Methodology) 2004, 66, 609–652. [Google Scholar] [CrossRef]
- Stoffelen, A.; Portabella, M. On Bayesian Scatterometer Wind Inversion. IEEE Transactions on Geoscience and Remote Sensing 2006, 44, 1–11. [Google Scholar] [CrossRef]
- Isaksen, L.; Stoffelen, A. ERS scatterometer wind data impact on ECMWF’s tropical cyclone forecasts. IEEE Transactions on Geoscience and Remote Sensing 2000, 38, 1885–1892. [Google Scholar] [CrossRef]
- Atlas, R.; Hoffman, R.N.; Leidner, S.M.; Sienkiewicz, J.; Yu, T.W.; Bloom, S.C.; Brin, E.; Ardizzone, J.; Terry, J.; Bungatoand, D.; Jusem, J.C. The Effects of Marine Winds from Scatterometer Data on Weather Analysis and Forecasting. Bull. Amer. Meteor. Soc. 2001, 82, 1965–1990. [Google Scholar] [CrossRef]
- Singh, R.; Kumar, P.; Pal, P.K. Assimilation of oceansat-2-scatterometer-derived surface winds in the weather research and forecasting model. IEEE Transactions on Geoscience and Remote Sensing 2012. [Google Scholar] [CrossRef]
- Belmonte Rivas, M.; Stoffelen, A. Characterizing ERA-Interim and ERA5 surface wind biases using ASCAT. Ocean Science 2019, 15, 831–852. [Google Scholar] [CrossRef]
- Trindade, A.; Portabella, M.; Stoffelen, A.; Lin, W.; Verhoef, A. ERAstar: A High-Resolution Ocean Forcing Product. IEEE Transactions on Geoscience and Remote Sensing 2020, 58, 1337–1347. [Google Scholar] [CrossRef]
- Van de Hulst, H.C. Light scattering by small particles; John Wiley and Sons: New York, 1958. [Google Scholar]
- Portabella, M.; Stoffelen, A. Rain Detection and Quality Control of SeaWinds. Journal of Atmospheric and Oceanic Technology 2001, 18, 1171–1183. [Google Scholar] [CrossRef]
- Xu, X.; Stoffelen, A. Improved Rain Screening for Ku-Band Wind Scatterometry. IEEE Transactions on Geoscience and Remote Sensing 2020, 58, 2494–2503. [Google Scholar] [CrossRef]
- Zhao, K.; Stoffelen, A.; Verspeek, J.; Verhoef, A.; Zhao, C. Bayesian Algorithm for Rain Detection in Ku-Band Scatterometer Data. IEEE Transactions on Geoscience and Remote Sensing 2023, 61. [Google Scholar] [CrossRef]
- BLIVEN, L.F.; GIOVANANGELI, J. .P. An experimental study of microwave scattering from rain- and wind-roughened seas. International Journal of Remote Sensing 1993, 14, 855–869. [Google Scholar] [CrossRef]
- Craeye, C.; Schlüssel, P. Rainfall on the sea: Surface Renewals and Damping. Boundary-Layer Meteorol. 1998, 89, 349–355. [Google Scholar] [CrossRef]
- Tournadre, J. Impact of rain cell on scatterometer data: 1. Theory and modeling. Journal of Geophysical Research 2003. [Google Scholar] [CrossRef]
- Stoffelen, A.; Anderson, D. Scatterometer data interpretation: Measurement space and inversion. Journal of Atmospheric and Oceanic Technology 1997, 14, 1298–1313. [Google Scholar] [CrossRef]
- Figa, J.; Stoffelen, A. On the assimilation of Ku-band scatterometer winds for weather analysis and forecasting. IEEE Transactions on Geoscience and Remote Sensing 2000, 38, 1893–1920. [Google Scholar] [CrossRef]
- Li, Z.; Verhoef, A.; Stoffelen, A.; Verhoef, A.; Verhoef, A. CWDP L2A processor Specification and User Manual. Technical report, KNMI, de Bilt, the Netherlands, 2019.
- Xu, X.; Stoffelen, A.; Lin, W.; Dong, X. Rain False-Alarm-Rate Reduction for CSCAT. IEEE Geoscience and Remote Sensing Letters 2022, 19. [Google Scholar] [CrossRef]
- Bolvin, D.T.; Joyce, R.; Nelkin, E.J.; Tan, J.; Braithwaite, D.; Hsu, K.; Kelley, O.A.; Nguyen, P.; Sorooshian, S.; Watters, D.C.; West, B.J.; Xie, P. Algorithm Theoretical Basis Document (ATBD) NASA Global Precipitation Measurement (GPM) Integrated Multi-satellitE Retrievals for GPM (IMERG) Version 07. Technical report, NASA, Greenbelt, 2023.
- De Kloe, J.; Stoffelen, A.; Verhoef, A. Improved Use of Scatterometer Measurements by Using Stress-Equivalent Reference Winds. IEEE Journal of Selected Topics in Applied Earth Observations and Remote Sensing 2017, 10. [Google Scholar] [CrossRef]
- Vogelzang, J.; Stoffelen, A. On the Accuracy and Consistency of Quintuple Collocation Analysis of In Situ, Scatterometer, and NWP Winds. Remote Sensing 2022, 14. [Google Scholar] [CrossRef]
- Vogelzang, J. Two-dimensional variational ambiguity removal ( 2DVAR ). Technical report, KNMI, de Bilt, the Netherlands, 2013.
- Verhoef, A.; Stoffelen, A. Advances in Ku-band scatterometer Quality Control. Technical report, 2021.
Figure 1.
Ku-band two dimensinal histogram of as a function of the NWP wind speed (data Aug 2023 to Oct 2023). The gray scale shows the fractional number of WVCs per and wind speed bin. The red line is the example threshold for the .
Figure 1.
Ku-band two dimensinal histogram of as a function of the NWP wind speed (data Aug 2023 to Oct 2023). The gray scale shows the fractional number of WVCs per and wind speed bin. The red line is the example threshold for the .
Figure 2.
contour plot with the wind solution closest to the ECWMF wind at different threshold: blue line V1; green line V2; red line V3 (see text), the gray scale shows the fractional number of WVCs.
Figure 2.
contour plot with the wind solution closest to the ECWMF wind at different threshold: blue line V1; green line V2; red line V3 (see text), the gray scale shows the fractional number of WVCs.
Figure 3.
Rejected winds distribution within latitude [-20, 20] and their corresponding wind speed contour plots (retrieved winds versus NWP winds) for different thresholds: V1 (a, d), V2 (b, e), V3 (c, f). In (d, e, f), the white dotted line shows the average wind speed of the NWP wind per retrieved wind, the light purple dotted line shows the average wind speed of the retrieved wind per NWP wind.
Figure 4.
Left panels: versus accepted retrieved wind speed, collocated with rain rate. Right panels: versus the accepted retrieved wind speed for rain rates above 7 mm/hr. (a, b) V1, (c, d) V2, (e, f) V3.
Figure 4.
Left panels: versus accepted retrieved wind speed, collocated with rain rate. Right panels: versus the accepted retrieved wind speed for rain rates above 7 mm/hr. (a, b) V1, (c, d) V2, (e, f) V3.
Figure 5.
Long term (Aug 2023 to March 2024) V2 QC rejected winds geographical distribution within latitutde [-20°, 20°]) (a) and its corresponding wind speed contour against NWP winds (b).
Figure 5.
Long term (Aug 2023 to March 2024) V2 QC rejected winds geographical distribution within latitutde [-20°, 20°]) (a) and its corresponding wind speed contour against NWP winds (b).
Figure 6.
Long-term statistics from Aug 2023 to March 2024 for tropical region (latitude [-20°, 20°]) between the rejected winds from Ku-band WindRAD V2 QC (scatA) and the collocated accepted winds from C-band WindRAD (scatB): (a) the contour plot of rejected winds (Ku) vs. accepted winds (C), the color bar shows the fractional number of WVCs; (b): the wind speed PDF of rejected winds (Ku-band) and accepted winds (C-band).
Figure 7.
Long-term (from Aug 2023 to March 2024) geographical distribution of rejected winds for V2 QC, latitudes between [-55°, 60°].
Figure 7.
Long-term (from Aug 2023 to March 2024) geographical distribution of rejected winds for V2 QC, latitudes between [-55°, 60°].
Figure 8.
Ku-band
value collocated with rain as a function of the analysis wind speed wind speed. The red line is the threshold mentioned in eq.
3. Data are from Aug 2023 to March 2024, latitude [-20°, 20°].
Figure 8.
Ku-band
value collocated with rain as a function of the analysis wind speed wind speed. The red line is the threshold mentioned in eq.
3. Data are from Aug 2023 to March 2024, latitude [-20°, 20°].
Figure 9.
Geographical distribution of the rejected winds for the data from Aug 2023 to March 2024, latitude [-20°, 20°]: (a) the winds rejected by QC; (b) the winds rejected by QC.
Figure 9.
Geographical distribution of the rejected winds for the data from Aug 2023 to March 2024, latitude [-20°, 20°]: (a) the winds rejected by QC; (b) the winds rejected by QC.
Figure 10.
contour plot of the C&Ku wind solution closest to the NWP winds, the color bar shows the fraction of WVC numbers: (a) the total ; (b) the Ku contribution to , the red line shows the optimal threshold (see text).
Figure 10.
contour plot of the C&Ku wind solution closest to the NWP winds, the color bar shows the fraction of WVC numbers: (a) the total ; (b) the Ku contribution to , the red line shows the optimal threshold (see text).
Figure 11.
Top panels: geographical distribution of the rejected winds in the tropics [-20°, 20°]: (a) using the total , (b) using the Ku-based . Bottom panels: the rejected wind speed contour plot against NWP wind: (c) using the total , (d) using the Ku-based .
Figure 11.
Top panels: geographical distribution of the rejected winds in the tropics [-20°, 20°]: (a) using the total , (b) using the Ku-based . Bottom panels: the rejected wind speed contour plot against NWP wind: (c) using the total , (d) using the Ku-based .
Figure 12.
Contour plots of rejected winds against NWP winds, data from August 2023 to March 2024, latitude [-20°, 20°]: (a) rejected winds using QC; (b) rejected winds using QC.
Figure 12.
Contour plots of rejected winds against NWP winds, data from August 2023 to March 2024, latitude [-20°, 20°]: (a) rejected winds using QC; (b) rejected winds using QC.
Table 1.
Ku-band wind statistics comparison of and against NWP winds, tropical region latitude [-20°, 20°], data from August 2023 to March 2024.
Table 1.
Ku-band wind statistics comparison of and against NWP winds, tropical region latitude [-20°, 20°], data from August 2023 to March 2024.
| |
QC method |
Speed bias (m/s) |
SDD of u (m/s) |
SDD of v (m/s) |
| Rejected winds |
|
2.312 |
2.34 |
2.38 |
|
2.491 |
2.39 |
2.44 |
| Accepted Winds |
|
0.113 |
1.15 |
1.19 |
|
0.096 |
1.13 |
1.17 |
Table 2.
Ku-band wind statistics comparison of and against WindRAD C-band winds, tropical region latitude [-20°, 20°], data from August 2023 to March 2024.
Table 2.
Ku-band wind statistics comparison of and against WindRAD C-band winds, tropical region latitude [-20°, 20°], data from August 2023 to March 2024.
| |
QC method |
Speed bias (m/s) |
SDD of u (m/s) |
SDD of v (m/s) |
| Rejected winds |
|
1.469 |
2.99 |
2.42 |
|
1.466 |
3.09 |
2.53 |
| Accepted Winds |
|
0.367 |
1.34 |
1.29 |
|
0.362 |
1.32 |
1.28 |
Table 3.
Rejected and accepted wind statistics (C&Ku) against NWP winds and against C-band WindRAD winds using the Ku-based , data from August 2023 to March 2024.
Table 3.
Rejected and accepted wind statistics (C&Ku) against NWP winds and against C-band WindRAD winds using the Ku-based , data from August 2023 to March 2024.
| |
Compare against |
Speed bias (m/s) |
SDD of u (m/s) |
SDD of v (m/s) |
| Rejected winds |
NWP winds |
2.301 |
2.24 |
2.35 |
| C-band (WindRAD) |
1.375 |
2.28 |
2.40 |
| Accepted Winds |
NWP winds |
0.120 |
1.14 |
1.22 |
| C-band (WindRAD) |
0.359 |
1.27 |
1.22 |
Table 4.
Wind statistics (C&Ku) for QC and QC against NWP winds, tropical latitude region [-20°, 20°], data from August 2023 to March 2024.
Table 4.
Wind statistics (C&Ku) for QC and QC against NWP winds, tropical latitude region [-20°, 20°], data from August 2023 to March 2024.
| |
QC method |
Speed bias (m/s) |
SDD of u (m/s) |
SDD of v (m/s) |
| Rejected winds |
|
2.301 |
2.24 |
2.35 |
|
2.690 |
2.42 |
2.50 |
| Accepted Winds |
|
0.120 |
1.14 |
1.22 |
|
0.103 |
1.12 |
1.20 |
Table 5.
Wind statistics (C&Ku) for QC and QC against WindRAD C-band winds, tropical latitude region [-20°, 20°], data from August 2023 to March 2024.
Table 5.
Wind statistics (C&Ku) for QC and QC against WindRAD C-band winds, tropical latitude region [-20°, 20°], data from August 2023 to March 2024.
| |
QC method |
Speed bias (m/s) |
SDD of u (m/s) |
SDD of v (m/s) |
| Rejected winds |
|
1.375 |
2.82 |
2.40 |
|
1.293 |
2.97 |
2.60 |
| Accepted Winds |
|
0.359 |
1.27 |
1.22 |
|
0.355 |
1.25 |
1.21 |
|
Disclaimer/Publisher’s Note: The statements, opinions and data contained in all publications are solely those of the individual author(s) and contributor(s) and not of MDPI and/or the editor(s). MDPI and/or the editor(s) disclaim responsibility for any injury to people or property resulting from any ideas, methods, instructions or products referred to in the content. |
© 2024 by the authors. Licensee MDPI, Basel, Switzerland. This article is an open access article distributed under the terms and conditions of the Creative Commons Attribution (CC BY) license (https://creativecommons.org/licenses/by/4.0/).