
Submitted:
13 December 2024
Posted:
13 December 2024
You are already at the latest version
Abstract
Calponin 3 (CNN3) is an actin-binding protein that modulates actin cytoskeleton dynamics, which are vital processes for maintaining skeletal muscle homeostasis. Although the function of CNN3 in actin dynamics has been established, its biological significance in myogenic differentiation of pro-genitor cells remains largely unexplored. This study investigates the role of CNN3 in myogenic differentiation and its impact on actin cytoskeletal dynamics and mechanosensitive signaling in C2C12 myoblasts. CNN3 knockdown led to a marked increase in F-actin accumulation, which promoted the nuclear translocation of YAP1, a mechanosensitive transcriptional coactivator re-quired for response to mechanical cues that drive cell proliferation. CNN3 depletion enhanced myoblast proliferation and increased the expressions of YAP1 target genes involved in cell cycle progression, including PCNA, cyclin B1, and cyclin D1. Flow cytometry revealed that CNN3-deficient cells displayed higher S and G2/M phase fractions, which concurred with elevated proliferation rates. Furthermore, CNN3 knockdown impaired myogenic differentiation, as evi-denced by reduced levels of MyoD, MyoG, and MyHC, key markers of myogenic commitment and maturation, and immunocytochemistry showed myotube formation was diminished in CNN3-suppressed cells, which was supported by lower differentiation and fusion indices. These findings suggest that CNN3 is essential for myogenic differentiation and that it functions by regu-lating actin remodeling and YAP1 signaling to direct progenitor cells toward proliferation rather than differentiation. This study demonstrates CNN3 as a critical factor in skeletal myogenesis and a potential therapeutic target in muscle-wasting conditions.
Keywords:
calponin
; actin cytoskeleton remodeling
; myogenic differentiation
; YAP1
; mechanotransduction
; proliferation
1. Introduction
Skeletal muscle comprises approximately 50% of total body mass and is essential for various physiological processes, including locomotion, respiration, metabolism, and energy storage [1]. The process of muscle tissue development and regeneration, referred to as myogenesis, play vital roles in muscle mass maintenance, especially in response to injury or disease [2,3]. Myogenesis involves a sequence of cellular events that begin with myoblast proliferation, followed by myoblast differentiation into myocytes, and culminating in the fusion of myocytes into multinucleated myotubes, which ultimately form functional muscle fibers [4,5]. This process is precisely regulated by a complex network of signaling pathways, with cytoskeletal dynamics particularly critical for myoblast differentiation, fusion, and maturation [6,7]. Recent research has highlighted that mechanotransduction is a pivotal regulatory mechanism in skeletal myogenesis, which involves the translation of mechanical cues into biochemical signals for the myogenic transcription program [8,9]. Accordingly, dysregulation in cytoskeletal remodeling has been directly associated with defects in myoblast differentiation, thereby impeding the formation of myotubes from progenitor cells [10,11,12,13].
The actin cytoskeleton is especially dynamic and undergoes precise temporal and spatial remodeling, which supports the morphological and functional changes essential for myogenesis [14,15]. This remodeling is facilitated by various actin-binding proteins (ABPs) that coordinate actin assembly, disassembly, and stability to support rapid cellular adaptations [15,16]. Among these actin-binding proteins (ABPs), calponin 3 (CNN3), a member of the calponin family, regulates actomyosin interactions, cytoskeletal rearrangement, and stress fiber formation through its actin-binding ability [17,18]. Therefore, CNN3 plays a pivotal role in actin cytoskeleton dynamics and maintaining cytoskeletal integrity [18,19,20]. Previous studies have shown that CNN3 is expressed in myoblasts and is critical for actin stabilization during trophoblast fusion in embryonic development [18,21]. Muscle atrophy conditions, such as sarcopenia, muscular dystrophies, and cachexia, are marked by impaired myogenic differentiation and diminished muscle regeneration [3,22]. Recent evidence further indicates that CNN3 levels are reduced in various muscle atrophy models, including starvation-induced atrophy in murine myotubes [23] and human tibial muscular dystrophy [24]. Thus, it appears CNN3 may play a role in muscle development and preservation, and its reduction might impair myogenesis and contribute to muscle atrophy. Despite its established role in actin dynamics, the specific functions of CNN3 in skeletal myogenesis, particularly regarding myogenic differentiation and myotube formation, remain largely unexplored.
Emerging evidence suggests that mechanotransduction pathways, particularly those mediated by actin dynamics, are central to determining cellular fate by modulating transcriptional programs and cell cycle progression [25]. In this aspect, the balance between filamentous actin (F-actin) and globular actin (G-actin) plays a critical role in these pathways by controlling the nuclear translocation of Yes-associated protein-1 (YAP1), a mechanosensitive transcriptional coactivator essential for cellular responses to mechanical cues [26,27]. In response to elevated F-actin levels, YAP1 translocates to the nucleus, promoting cell cycle progression and proliferation [28]. This mechanism ultimately inhibits the differentiation of progenitor cells by maintaining them in a proliferative state rather than allowing them to transition into mature myogenic cells. Thus, this F-actin-driven YAP1 activation links cytoskeletal dynamics to the suppression of myogenesis by driving the expressions of genes associated with proliferation [26,27,29]. Given the role played by CNN3 in actin remodeling, it is likely involved in modulating mechanosensitive YAP1 signaling during myogenic differentiation. However, the specific role of CNN3 remains to be elucidated, and understanding its contributions could offer significant insights into muscle development and regeneration mechanisms.
This study aimed to investigate the role of CNN3 in myogenic differentiation by analyzing its influence on actin cytoskeletal dynamics and key mechanosensitive signaling pathways critical for skeletal muscle homeostasis. Specifically, we examined the effects of CNN3 knockdown on actin remodeling, YAP1 nuclear translocation, cell cycle progression, and cell proliferation, as well as its downstream impact on the expression of myogenic factors and the transition from myoblasts to myotubes. This research is the first to identify CNN3 as a pivotal regulator of myoblast proliferation and differentiation, operating through its modulation of actin organization and mechanosensitive transcriptional programming.
2. Materials and Methods
2.1. Cell Culture
C2C12 myoblasts (ATCC, CRL-1772, Manassas, VA, USA) were cultured in growth medium (GM) composed of DMEM containing 10% Fetal Bovine Serum (FBS) and 100 units/ml penicillin/streptomycin (Gibco, Carlsbad, CA, USA). To induce differentiation, cells were seeded in 35 mm dishes (~1.3x10⁵ cells per dish) and maintained in GM until ~90% confluent. Differentiation was then initiated by switching to differentiation medium (DM; DMEM containing 2% horse serum (Gibco)). Cells were incubated in DM for up to five days with medium changes every 24 hrs.
2.2. Oligonucleotide Transfection
C2C12 cells were seeded in 35 mm dishes at a density of ~1.3×10⁵ cells per dish and allowed to reach 40–50% confluency over 20–24 hrs. Transfection was performed using 200 nM scrambled control RNA (scRNA, Genolution, Seoul, Korea), CNN3 siRNA (siCNN3-1, Bioneer, Daejeon, Korea), or an alternative CNN3 siRNA (siCNN3-2, Genolution) with Lipofectamine 2000 (Invitrogen, Carlsbad, CA, USA) in serum-free DMEM for 4 hrs. Cells were then maintained in GM for 24 hrs. Oligonucleotide sequences are detailed in Table S1.
2.3. RT-qPCR
Total RNA was extracted using a Total RNA Miniprep kit (Enzynomics, Daejeon, Korea) and quantified using a Nanodrop spectrophotometer (Keen Innovative Solutions, Daejeon, Korea). Complementary DNA was synthesized using the miScript II RT Kit (Qiagen, Hilden, Germany). Relative mRNA levels were assessed via RT-qPCR using SYBR Green (Enzynomics) in a LightCycler 480 (Roche Applied Science, Basel, Switzerland). Reactions were performed in triplicate, and expression levels were normalized versus GAPDH using the 2–ΔΔCt method. Primer sequences and conditions are listed in Table S2.
2.4. Cytoplasmic and Nuclear Fraction Extraction
C2C12 cells were harvested with trypsin/EDTA (Gibco) 24 hrs after transfection, and cytoplasmic and nuclear fractions were separated using NE-PER Reagents (Thermo Fisher Scientific), according to the manufacturer’s instructions. Cells were incubated on ice with CER I solution for 10 minutes, and then CER II solution was added, and incubation continued for one minute. Lysates were centrifuged at ~15,000 rpm for 15 minutes at 4°C. Supernatants (cytoplasmic fractions) were transferred to clean tubes, and the remaining residues were resuspended in NER solution to obtain nuclear fractions. Equal amounts of cytoplasmic and nuclear fractions were immunoblotted.
2.5. Immunoblot Analysis
Total protein was extracted using lysis buffer containing 1% phosphatase inhibitor cocktail II, 0.2 mM PMSF, and 2% Triton-X in PBS (Sigma-Aldrich, St. Louis, MO, USA). Protein concentrations were determined using the Bradford assay. Samples were denatured at 100°C for 10 minutes, and equal amounts of protein (20 µg) were separated by SDS-PAGE, transferred to nitrocellulose membranes (Amersham Biosciences, Piscataway, NJ, USA), blocked with 5% skimmed milk in TBST (0.5% Tween 20-TBS), and incubated overnight at 4°C with primary antibodies. The following day, membranes were washed and incubated with secondary antibodies diluted at 1:10,000. Blots were visualized using TOPviewTM ECL Femto Western Substrate (Enzynomics) and analyzed with Fusion Solo software (Paris, France). The antibodies used are listed in Table S4.
2.6. Immunocytochemistry
Cells were fixed in 4% paraformaldehyde for 10 min, permeabilized with 0.3% Triton X-100 for 15 minutes, and blocked with 3% bovine serum albumin in PBS at room temperature for 2 hrs. Cells were then incubated with an anti-myosin heavy chain (MyHC) antibody (1:100 dilution) overnight at 4°C. After washing, samples were incubated with Alexa 488-conjugated secondary antibody (Invitrogen) for 1 hour and counterstained with Hoechst 33342. Images were captured from five randomly selected fields using a Leica fluorescence microscope. Experiments were performed using at least three independent replicates. MyHC-positive areas, nucleus numbers in myotubes, and myotube widths were determined using ImageJ software. Differentiation and fusion indexes were calculated as previously described [12]. F-actin was stained with FITC-conjugated phalloidin (Sigma).
2.7. Cell Proliferation Assay
Cell proliferation was measured using Click-iT™ EdU kit (Invitrogen). Briefly, C2C12 cells were seeded in 8-chamber slides at 3x10⁴ cells/well and transiently transfected with scRNA or siCNN3. At 24 hrs post-transfection, cells were treated with 10 µM EdU for 4 hrs at 37℃, then fixed with 4% paraformaldehyde, permeabilized with 0.3% Triton X-100 in PBS, and incubated with Click-iT reaction cocktail. Nuclei were counterstained with Hoechst 33342, and fluorescent images were captured using a Leica fluorescence microscope. EdU-positive and total cell numbers were counted in five random fields using ImageJ software, and experiments were performed independently at least three times.
2.8. Cell Viability
Myoblasts were seeded in 96-well plates at 10³ cells/well and transfected with siRNA using Lipofectamine 2000 (Invitrogen). After 24 hrs, cells were incubated in GM containing 10 µL of Quanti-Max WST-8 Cell Viability Assay solution (BioMax, Seoul, Korea) for 4 hrs at 37°C. Cell viability was measured at 450 nm using a microplate reader (Model 680, Bio-Rad, Hercules, CA, USA).
2.10. Flow Cytometry
Myoblasts were collected using trypsin-EDTA, centrifuged at 5000 rpm for 5 minutes at 4°C, rinsed with PBS, fixed in 70% ethanol overnight at 4°C, and stained for 20 minutes using the Propidium Iodide Flow Cytometry Kit (ab139418, Abcam, Cambridge, UK) for cell cycle analysis, FITC-phalloidin for F-actin quantitation, or DNase I for G-actin quantitation. Samples were analyzed using a CytoFLEX instrument (Beckman Coulter, USA).
2.11. Statistical Analysis
Results are expressed as means ± standard errors (SEM) from at least three independent experiments. One-way analysis of variance (ANOVA) was used to compare group differences. When significant differences were detected, post-hoc analysis was performed using Tukey’s test. A p-value of <0.05 was considered statistically significant.
3. Results
3.1. CNN3 Expression Increased During Myoblast Differentiation
The regulation of differentiation in progenitor cells requires actin cytoskeleton remodeling, which is finely orchestrated by ABPs [15,16]. Given the importance of the role of CNN3 in actin cytoskeleton dynamics [18,19,20,21], we first assessed its expression in various mouse tissues, including C2C12 myoblasts and skeletal and cardiac muscles, before investigating its involvement in myogenic differentiation. Immunoblot analysis revealed that CNN3 was ubiquitously expressed at significantly higher levels in myoblasts than in fully differentiated skeletal muscles, such as soleus, gastrocnemius, and cardiac muscles (Figure 1A). We also monitored its expression profile over the 5-day differentiation period in C2C12 myoblasts (Figure 1B,C). MyoD (an early marker of myogenic commitment) levels decreased after the initiation of differentiation, whereas MyoG (a key marker of myogenic differentiation onset) levels gradually increased to peak on differentiation day 3. MyHC (myosin heavy chain; a terminal differentiation marker) levels increased progressively from day 2 to peak after day 4 (Figure 1B,C). Interestingly, CNN3 expression increased as the process progressed toward myotube formation (Figure 1B,C), suggesting that CNN3 might play a role in regulating myogenic differentiation, possibly through modulation of actin cytoskeletal dynamics and thereby influencing the expression of myogenic regulatory factors through the mechanosensitive signaling axis.
3.2. CNN3 Knockdown Enhanced F-Actin and Nuclear YAP1 Levels in Myoblasts
To determine whether CNN3 knockdown affects myogenic differentiation, we hypothesized that CNN3 suppression could alter actin filament dynamics and impair myogenic differentiation by promoting the nuclear translocation of YAP1. To test this hypothesis, C2C12 myoblasts were transfected with control scrambled RNA (scRNA) or CNN3-specific siRNAs (siCNN3-1 or siCNN3-2) and cultured for 24 hrs in a GM. Both siRNA constructs resulted in approximately 50% reduction of CNN3 protein compared to controls (Figure 2A). Therefore, siCNN3-1 (briefly named siCNN3) was used to suppress the CNN3 protein level for subsequent experiments in this study.
Next, we evaluated whether CNN3 knockdown altered F-actin levels in C2C12 myoblasts. Fluorescent phalloidin staining revealed that CNN3 knockdown significantly increased F-actin levels by ~1.7-fold compared to controls (Figure 2B). Flow cytometry further confirmed this observation by demonstrating elevated phalloidin fluorescence, indicative of increased actin polymerization (Figure 2C). Since total actin levels were unaffected by CNN3 knockdown, this increase in F-actin was attributed to impaired actin depolymerization resulting from CNN3 suppression rather than an upregulation of actin expression.
The accumulation of F-actin has been linked to increased nuclear translocation of YAP1, a mechanosensitive coactivator that promotes cell proliferation, by inhibiting its phosphorylation [30]. To investigate whether CNN3 knockdown affects the localization of YAP1, we measured YAP1 levels in the cytoplasmic and nuclear fractions of C2C12 myoblasts. Our results demonstrated a significant decrease in cytoplasmic YAP1 phosphorylation and YAP1 levels, accompanied by increased nuclear YAP1 localization in siCNN3-transfected cells (Figure 2D and 2E). These findings suggest that CNN3 knockdown enhances F-actin accumulation, leading to reduced YAP1 phosphorylation and promoting its nuclear translocation.
3.3. CNN3 Knockdown Increased YAP1 Target Gene Expressions and Induced Myoblast Proliferation
Given that the nuclear translocation of YAP1 drives cell cycle progression and promotes proliferation [31], we investigated whether CNN3 knockdown could stimulate these processes in C2C12 myoblasts. To address this, we assessed the proliferation of C2C12 myoblasts transfected with scRNA or siCNN3 using EdU-Coupled Fluorescence Intensity (E-CFI) analysis and viable cell assays. CNN3 knockdown led to a marked increase in EdU-positive cell numbers and overall cell viability, indicating enhanced proliferation compared to controls (Figure 3A–C). Furthermore, RT-qPCR analysis revealed significant upregulations of the mRNA levels of YAP1 target genes, including those of proliferating cell nuclear antigen (PCNA), cyclin B1, and cyclin D1, in siCNN3-transfected cells (Figure 3D). Flow cytometry supported these findings by showing increased proportions of cells in the S and G2/M phases along with a reduction in the G0/G1 phase (Figure 3E,F). Together, these observations suggest that CNN3 knockdown stimulates myoblast proliferation by enhancing YAP1 signaling and promoting cell cycle progression.
3.4. CNN3 Was Required for Myogenic Differentiation
Since increased cell cycle progression generally opposes progenitor cell differentiation [4], we hypothesized that CNN3 knockdown might reduce the expression of myogenic factors, thereby hindering myoblast differentiation. To test this hypothesis, we analyzed the expression of MyoD, MyoG, and MyHC at differentiation days 0, 3, and 5 of C2C12 cells transfected with either scRNA or siCNN3. Our results revealed that the protein levels of MyoD, MyoG, and MyHC were significantly lower in siCNN3-transfected cells compared to scRNA controls (Figure 4A,B). MyoD initiates myogenic differentiation by inducing MyoG expression, which subsequently drives myoblast differentiation [32]. The reduced levels of MyoG and MyHC further confirmed differentiation impairment. These results suggest that CNN3 is critical for initiating the expression of key myogenic regulatory factors, including MyoD and MyoG, and is essential for proper myoblast differentiation.
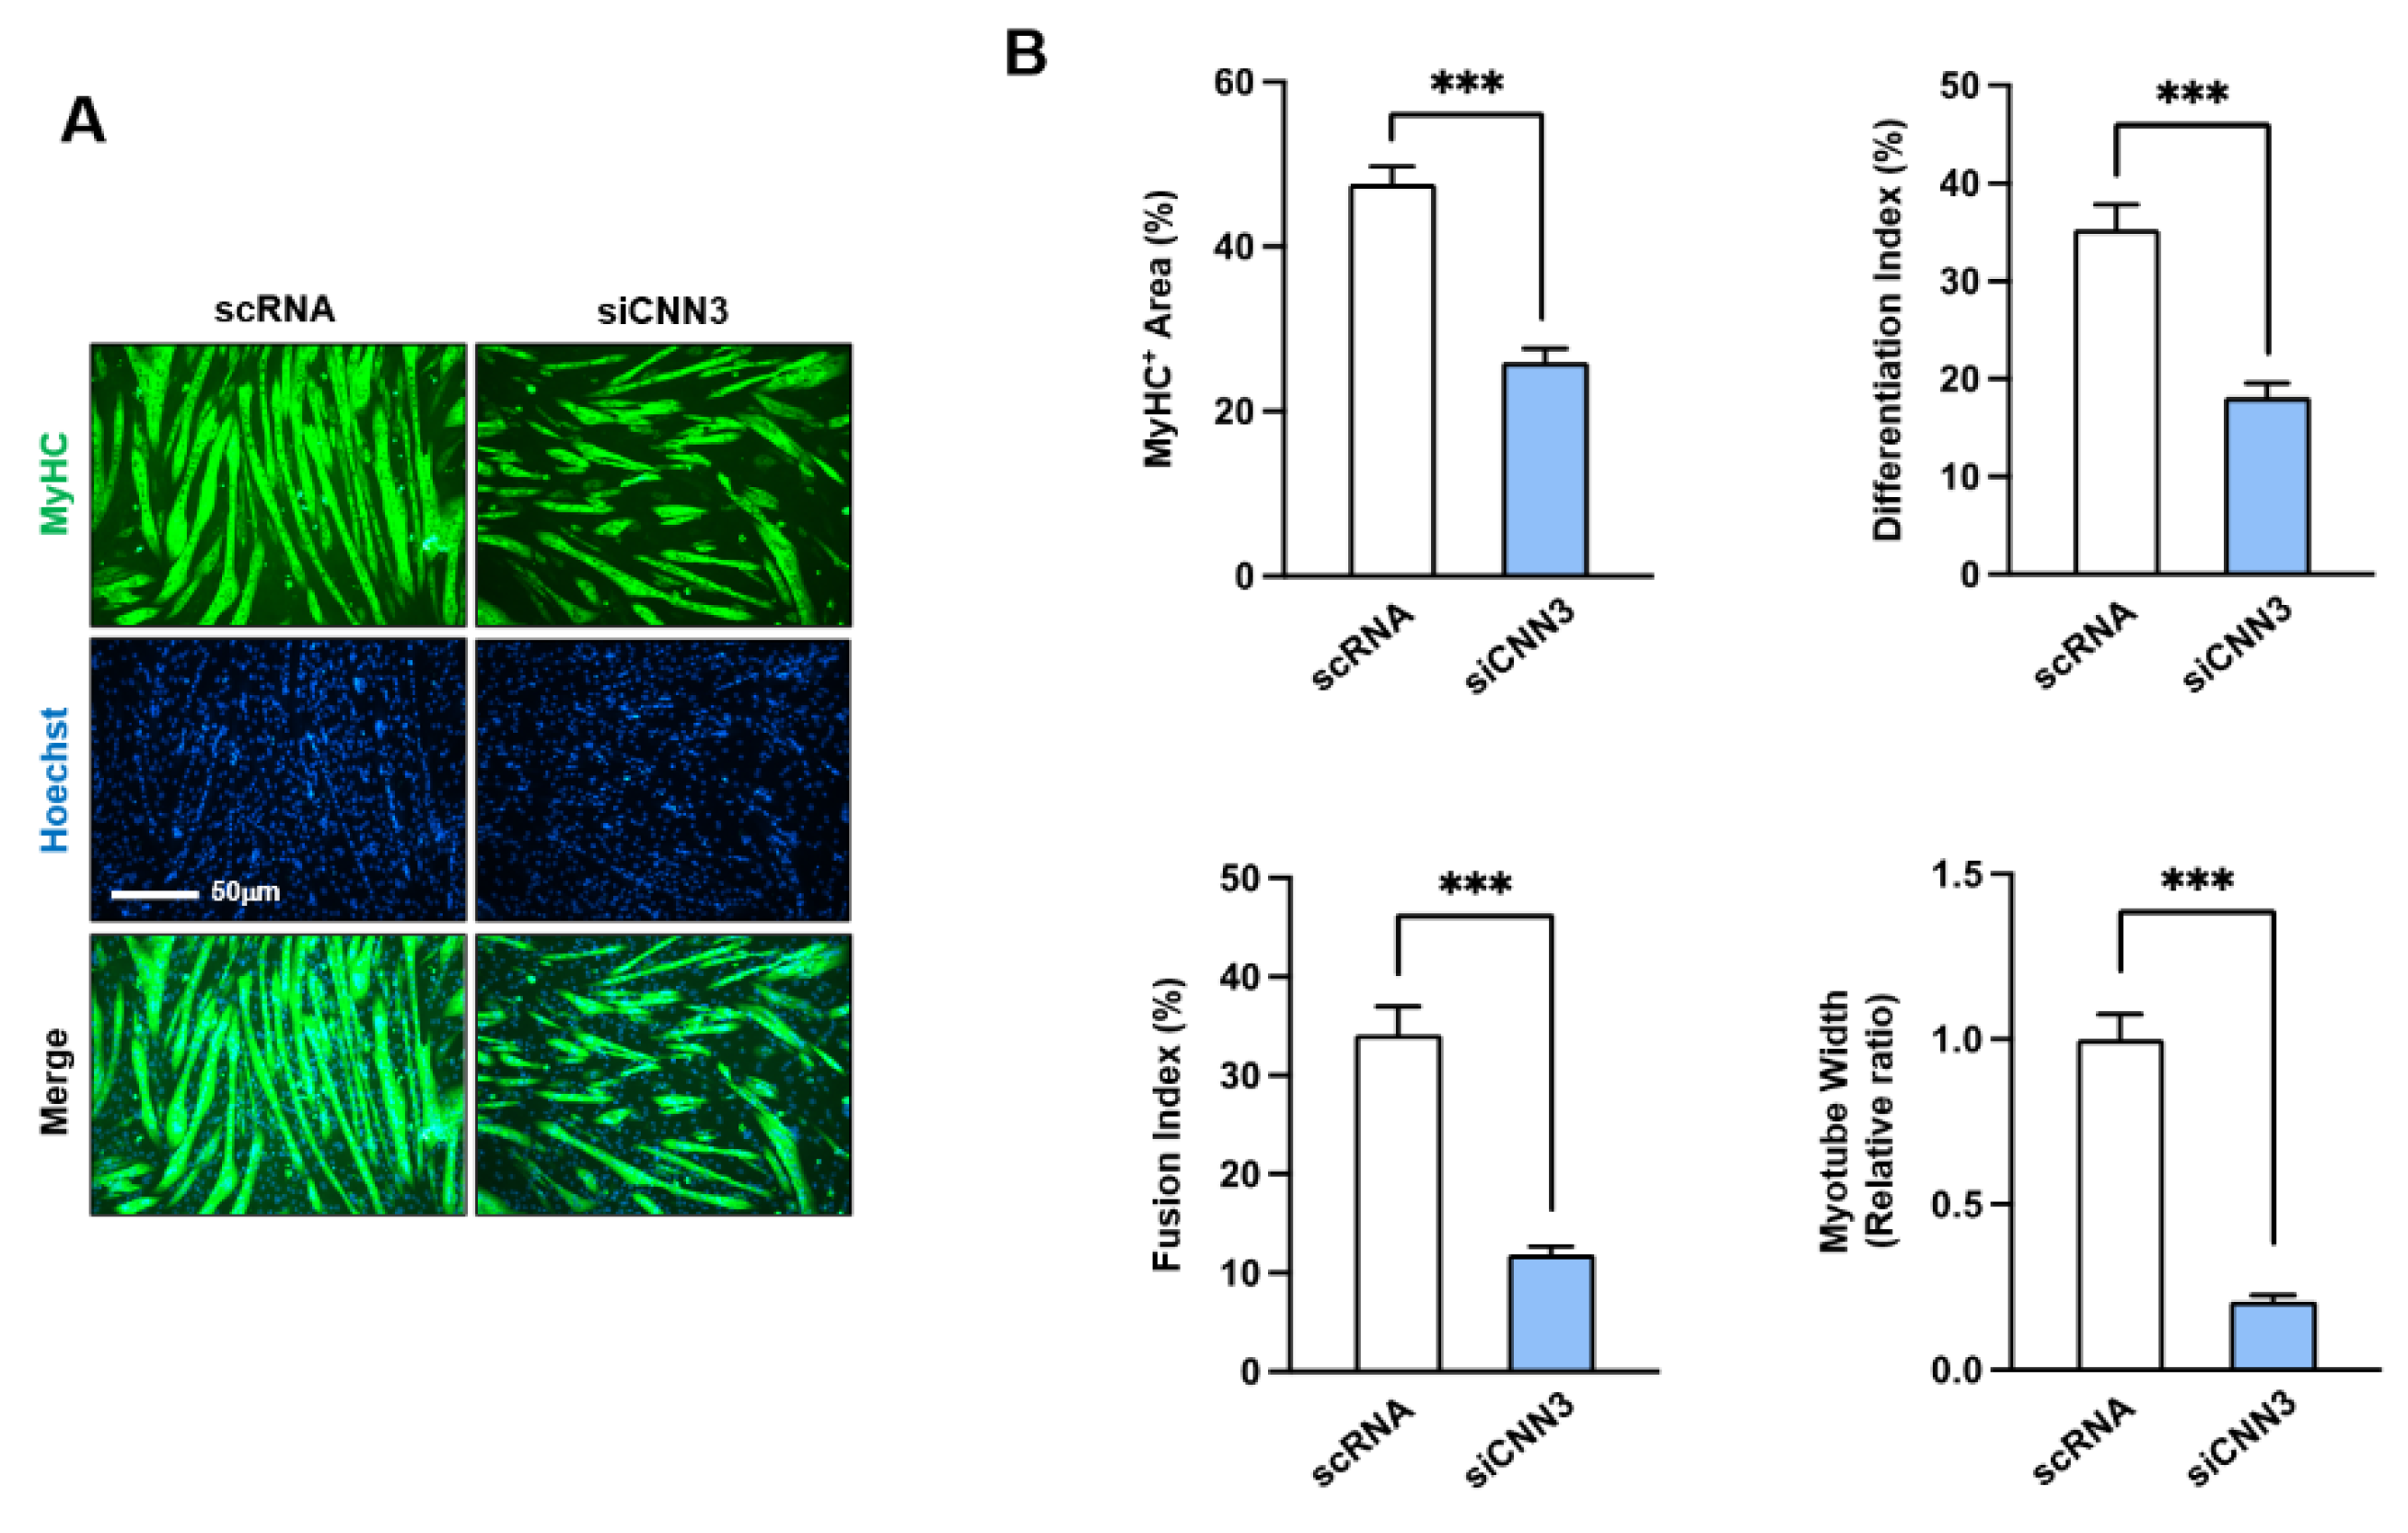
To further confirm the role of CNN3 in myoblast differentiation and myotube formation, we conducted an immunocytochemical analysis of C2C12 cells using a MyHC antibody after five days of differentiation. Myoblasts transfected with siCNN3 exhibited significantly impaired differentiation, as indicated by reduced MyHC-positive areas, lower differentiation and fusion indices, and decreased myotube width (Figure 5A,B). Collectively, these results underscore that CNN3 is essential for proper myogenic differentiation and myotube formation; its absence inhibits the expression of myogenic regulatory factors, impairing myoblast fusion and maturation.
4. Discussion
Actin dynamics are fundamental to myogenesis, integrating mechanosensitive transcriptional programs with myogenic gene expression and cell cycle regulation to ensure the precise control of myogenic processes [9,15]. Although CNN3 has been shown to play a crucial role in actin cytoskeleton dynamics in various contexts, its function in the differentiation of progenitor cells during myogenesis has remained unexplored. This study reveals for the first time the critical role played by CNN3 in myogenic differentiation by demonstrating its impact on actin remodeling, YAP1 signaling, and cell cycle progression in C2C12 myoblasts. Specifically, our findings demonstrate that (i) CNN3 expression is upregulated during differentiation, (ii) CNN3 knockdown elevates F-actin levels and promotes YAP1 nuclear localization, (iii) CNN3 depletion facilitates cell cycle progression and enhances myoblast proliferation, and (iv) CNN3 knockdown results in a marked decrease in the expression of myogenic regulatory factors, and thus, impairs differentiation, fusion, and myotube formation. These findings establish CNN3 as a key regulator of the F-actin/YAP axis, crucial for balancing cell proliferation and differentiation.
During myofiber formation, actin cytoskeletal remodeling is crucial for cellular morphology, membrane reconfiguration, and the activation of myogenic transcriptional programs [6,7]. Our findings indicate that CNN3 expressions increase at the onset of differentiation and remains steady throughout myotube formation (Figure 1), implying its involvement in muscle development. Previous studies have demonstrated the importance of CNN3 in embryonic myogenesis, during which it is highly expressed in muscle tissues [18,33,34]. CNN3 regulates actin cytoskeleton rearrangement during embryonic development and promotes cell fusion in trophoblasts and myoblasts [18,33]. Moreover, CNN3 knockout caused embryonic and postnatal lethality, highlighting its essential role in development [34]. Our findings underscore the function of CNN3 in essential processes for myogenesis, similar to its developmental functions reported in other studies.
Our results further demonstrate that CNN3 knockdown increases F-actin accumulation, potentially contributing to YAP1 activation in response to mechanical stress (Figure 2). This observation is consistent with findings in fibroblasts and epithelial cells, where CNN3 depletion has been shown to promote actin polymerization [19,35]. Moreover, CNN3 depletion in lens epithelial cells similarly reorganized actin stress fibers, stimulated focal adhesion formation, and activated YAP1 signaling [36]. Although we were unable to measure actin polymerization rates directly, these observations highlight the critical role of CNN3 in cytoskeletal rearrangement. CNN3 appears to be essential for maintaining cytoskeletal integrity and regulating cell proliferation across diverse cellular contexts. Furthermore, the increased F-actin accumulation and subsequent YAP1 activation induced by siCNN3 in our model underscore the regulatory function of CNN3 in myogenesis via actin dynamics.
We observed that CNN3 knockdown significantly facilitates myoblast proliferation, as evidenced by increased cell viability, elevated EdU incorporation, and the upregulation of cell cycle-related genes (PCNA, cyclin B1, and cyclin D1) (Figure. 3). In addition, flow cytometry revealed the cell cycle progression in the S and G2/M phase in CNN3 depleted cells, suggesting promoted cell cycle progression. This increase in cell proliferation following CNN3 knockdown is associated with the activation of YAP1, which responds to cytoskeletal tension [28,37]. Because CNN3 depletion increased nuclear YAP1 levels by reducing its cytoplasmic phosphorylation, thereby preventing its degradation and increasing its nuclear accumulation. Balance between F-actin and G-actin is crucial in mechanotransduction pathways and influences the nuclear localization of YAP1 [31,38]. Moreover, elevated F-actin levels prompt the nuclear translocation of YAP1, thus driving cell cycle progression and proliferation, suppressing differentiation by maintaining progenitor cells in a proliferative state rather than allowing them to differentiate into mature muscle cells [4,31]. These findings suggest that CNN3 is essential for maintaining the mechanical cues necessary for YAP1 signaling, which promotes cell proliferation and survival.
Throughout myogenesis, myoblast differentiation into myotubes requires an inverse relationship with proliferation, necessitating cell cycle arrest and cessation of proliferation [4]. The temporal expression pattern of CNN3 during differentiation observed in this study suggests that CNN3 is crucial for exiting the proliferative cycle, thereby enabling cells to differentiate and fuse into myotubes. Recent studies have also established a connection between CNN3 expression and cell proliferation. For instance, overexpression of CNN3 inhibits the proliferation, migration, and invasion of non-small cell lung cancer cells [39], whereas CNN3 knockout (-/-) embryos displayed increased proliferation of neuronal precursor cells [40]. In agreement with these reports, our findings showed that CNN3 knockdown facilitated cell cycle progression and proliferation in myoblasts, leading to the suppression of myogenic differentiation (Figure 3, Figure 4 and Figure 5). Hence, the disrupted balance between proliferation and differentiation observed in CNN3-depleted myoblasts underscores the critical role of CNN3 in coordinating these processes during myogenesis.
The present study identifies CNN3 as a pivotal regulator of myoblast differentiation and proliferation due to its influence on actin cytoskeletal dynamics and the mechanosensitive transcription program for myogenic differentiation. CNN3 depletion leads to actin polymerization, stimulates nuclear translocations of YAP1, increases the expression of cell cycle-promoting genes, and consequently provokes the downregulation of key myogenic regulatory genes to inhibit myotube formation and myoblast proliferation. In addition, the study provides valuable insights into the molecular mechanisms underlying skeletal myogenesis and identifies CNN3 as a potential therapeutic target for muscle-related disorders. Further investigations into the regulation and function of CNN3 would enhance our understanding of muscle biology and possibly lead to novel treatments for muscle degeneration and related conditions.
5. Conclusions
This study identifies CNN3 as a key regulator of myoblast differentiation. By modulating F-actin levels and YAP1 nuclear localization, CNN3 governs the transition from proliferation to differentiation, a crucial process in myogenesis. CNN3 knockdown elevated F-actin levels and YAP1 activity, promoting myoblast proliferation while impairing myogenic differentiation. These findings underscore the essential role of CNN3 in proper myogenic differentiation and highlight its potential as a target for therapies addressing muscle-wasting diseases.
Supplementary Materials
The following supporting information can be downloaded at: Preprints.org, Table S1: Oligonucleotide sequences for transfection, Table S2: Primer lists and conditions for RT-qPCR, Table S3: Primer lists for promotor cloning, Table S4: Antibodies list.
Author Contributions
W.L. and M.T.N. conceived and designed the experiments. Q.K.L. and M.T.N. performed the experiments and analyzed the data. W.L., Q.K.L, and M.T.N. wrote the manuscript. All authors have read and agreed to the published version of the manuscript.
Funding
This study was supported by the National Research Foundation of Korea (NRF), which is funded by the Korean government (grant no. NRF-2022R1F1A1072273) and the Dongguk University Research Program of Joint Research Support Project (K-2024-G-0002-00010).
Institutional Review Board Statement
Not applicable.
Informed Consent Statement
Not applicable.
Data Availability Statement
The data presented in this study are available on request from the corresponding author.
Conflicts of Interest
The authors declare no conflict of interest.
References
- Brooks, S.V.; Guzman, S.D.; Ruiz, L.P. Skeletal muscle structure, physiology, and function. Handb Clin Neurol 2023, 195, 3–16. [Google Scholar] [CrossRef] [PubMed]
- Schiaffino, S.; Dyar, K.A.; Ciciliot, S.; Blaauw, B.; Sandri, M. Mechanisms regulating skeletal muscle growth and atrophy. FEBS J 2013, 280, 4294–4314. [Google Scholar] [CrossRef] [PubMed]
- Sartori, R.; Romanello, V.; Sandri, M. Mechanisms of muscle atrophy and hypertrophy: Implications in health and disease. Nature communications 2021, 12, 330. [Google Scholar] [CrossRef] [PubMed]
- Chal, J.; Pourquie, O. Making muscle: Skeletal myogenesis in vivo and in vitro. Development 2017, 144, 2104–2122. [Google Scholar] [CrossRef]
- Feng, L.T.; Chen, Z.N.; Bian, H. Skeletal muscle: Molecular structure, myogenesis, biological functions, and diseases. MedComm (2020) 2024, 5, e649. [Google Scholar] [CrossRef]
- Buckingham, M.; Rigby, P.W.J. Gene Regulatory Networks and Transcriptional Mechanisms that Control Myogenesis. Dev Cell 2014, 28, 225–238. [Google Scholar] [CrossRef]
- Moujaber, O.; Stochaj, U. The Cytoskeleton as Regulator of Cell Signaling Pathways. Trends Biochem Sci 2020, 45, 96–107. [Google Scholar] [CrossRef]
- Jaalouk, D.E.; Lammerding, J. Mechanotransduction gone awry. Nat Rev Mol Cell Biol 2009, 10, 63–73. [Google Scholar] [CrossRef]
- Harris, A.R.; Jreij, P.; Fletcher, D.A. Mechanotransduction by the Actin Cytoskeleton: Converting Mechanical Stimuli into Biochemical Signals. Annu Rev Biophys 2018, 47, 617–631. [Google Scholar] [CrossRef]
- Nowak, S.J.; Nahirney, P.C.; Hadjantonakis, A.K.; Baylies, M.K. Nap1-mediated actin remodeling is essential for mammalian myoblast fusion. J Cell Sci 2009, 122, 3282–3293. [Google Scholar] [CrossRef]
- Zhang, T.; Zaal, K.J.; Sheridan, J.; Mehta, A.; Gundersen, G.G.; Ralston, E. Microtubule plus-end binding protein EB1 is necessary for muscle cell differentiation, elongation and fusion. J Cell Sci 2009, 122, 1401–1409. [Google Scholar] [CrossRef] [PubMed]
- Nguyen, M.T.; Won, Y.H.; Kwon, T.W.; Lee, W. Twinfilin-1 is an essential regulator of myogenic differentiation through the modulation of YAP in C2C12 myoblasts. Biochem Bioph Res Co 2022, 599, 17–23. [Google Scholar] [CrossRef] [PubMed]
- Nguyen, M.T.; Min, K.H.; Kim, D.; Park, S.Y.; Lee, W. CFL2 is an essential mediator for myogenic differentiation in C2C12 myoblasts. Biochem Bioph Res Co 2020, 533, 710–716. [Google Scholar] [CrossRef] [PubMed]
- Guerin, C.M.; Kramer, S.G. Cytoskeletal remodeling during myotube assembly and guidance: Coordinating the actin and microtubule networks. Communicative & integrative biology 2009, 2, 452–457. [Google Scholar]
- Nguyen, M.T.; Dash, R.; Jeong, K.; Lee, W. Role of Actin-Binding Proteins in Skeletal Myogenesis. Cells 2023, 12. [Google Scholar] [CrossRef]
- Vakhrusheva, A.V.; Murashko, A.V.; Trifonova, E.S.; Efremov, Y.M.; Timashev, P.S.; Sokolova, O.S. Role of actin-binding proteins in the regulation of cellular mechanics. Eur J Cell Biol 2022, 101, 151241. [Google Scholar] [CrossRef]
- Takahashi, K.; Nadal-Ginard, B. Molecular cloning and sequence analysis of smooth muscle calponin. J Biol Chem 1991, 266, 13284–13288. [Google Scholar] [CrossRef]
- Shibukawa, Y.; Yamazaki, N.; Kumasawa, K.; Daimon, E.; Tajiri, M.; Okada, Y.; Ikawa, M.; Wada, Y. Calponin 3 regulates actin cytoskeleton rearrangement in trophoblastic cell fusion. Mol Biol Cell 2010, 21, 3973–3984. [Google Scholar] [CrossRef]
- Daimon, E.; Shibukawa, Y.; Wada, Y. Calponin 3 regulates stress fiber formation in dermal fibroblasts during wound healing. Arch Dermatol Res 2013, 305, 571–584. [Google Scholar] [CrossRef]
- Rami, G.; Caillard, O.; Medina, I.; Pellegrino, C.; Fattoum, A.; Ben-Ari, Y.; Ferhat, L. Change in the shape and density of dendritic spines caused by overexpression of acidic calponin in cultured hippocampal neurons. Hippocampus 2006, 16, 183–197. [Google Scholar] [CrossRef]
- Shibukawa, Y.; Yamazaki, N.; Daimon, E.; Wada, Y. Rock-dependent calponin 3 phosphorylation regulates myoblast fusion. Exp Cell Res 2013, 319, 633–648. [Google Scholar] [CrossRef] [PubMed]
- Ebner, N.; Anker, S.D.; von Haehling, S. Recent developments in the field of cachexia, sarcopenia, and muscle wasting: Highlights from the 12th Cachexia Conference. J Cachexia Sarcopenia Muscle 2020, 11, 274–285. [Google Scholar] [CrossRef] [PubMed]
- Stevenson, E.J.; Koncarevic, A.; Giresi, P.G.; Jackman, R.W.; Kandarian, S.C. Transcriptional profile of a myotube starvation model of atrophy. J Appl Physiol (1985) 2005, 98, 1396–1406. [Google Scholar] [CrossRef] [PubMed]
- Screen, M.; Raheem, O.; Holmlund-Hampf, J.; Jonson, P.H.; Huovinen, S.; Hackman, P.; Udd, B. Gene expression profiling in tibial muscular dystrophy reveals unfolded protein response and altered autophagy. PLoS ONE 2014, 9, e90819. [Google Scholar] [CrossRef]
- Provenzano, P.P.; Keely, P.J. Mechanical signaling through the cytoskeleton regulates cell proliferation by coordinated focal adhesion and Rho GTPase signaling. J Cell Sci 2011, 124, 1195–1205. [Google Scholar] [CrossRef]
- Watt, K.I.; Goodman, C.A.; Hornberger, T.A.; Gregorevic, P. The Hippo Signaling Pathway in the Regulation of Skeletal Muscle Mass and Function. Exercise and Sport Sciences Reviews 2018, 46, 92–96. [Google Scholar] [CrossRef]
- Fischer, M.; Rikeit, P.; Knaus, P.; Coirault, C. YAP-Mediated Mechanotransduction in Skeletal Muscle. Front Physiol 2016, 7, 41. [Google Scholar] [CrossRef]
- Dupont, S.; Morsut, L.; Aragona, M.; Enzo, E.; Giulitti, S.; Cordenonsi, M.; Zanconato, F.; Le Digabel, J.; Forcato, M.; Bicciato, S.; et al. Role of YAP/TAZ in mechanotransduction. Nature 2011, 474, 179–183. [Google Scholar] [CrossRef]
- Qin, S.; Li, C.; Lu, H.; Feng, Y.; Guo, T.; Han, Y.; Zhang, Y.; Tang, Z. Biology of Hippo signaling pathway: Skeletal muscle development and beyond. Journal of Integrative Agriculture 2024, 23, 1825–1838. [Google Scholar] [CrossRef]
- Dupont, S. Role of YAP/TAZ in cell-matrix adhesion-mediated signalling and mechanotransduction. Exp Cell Res 2016, 343, 42–53. [Google Scholar] [CrossRef]
- Panciera, T.; Azzolin, L.; Cordenonsi, M.; Piccolo, S. Mechanobiology of YAP and TAZ in physiology and disease. Nat Rev Mol Cell Biol 2017, 18, 758–770. [Google Scholar] [CrossRef] [PubMed]
- Deato, M.D.E.; Marr, M.T.; Sottero, T.; Inouye, C.; Hu, P.; Tjian, R. MyoD targets TAF3/TRF3 to activate myogenin transcription. Molecular cell 2008, 32, 96–105. [Google Scholar] [CrossRef] [PubMed]
- Shibukawa, Y.; Yamazaki, N.; Daimon, E.; Wada, Y. Rock-dependent calponin 3 phosphorylation regulates myoblast fusion. Experimental cell research 2013, 319, 633–648. [Google Scholar] [CrossRef]
- Flemming, A.; Huang, Q.Q.; Jin, J.P.; Jumaa, H.; Herzog, S. A Conditional Knockout Mouse Model Reveals That Calponin-3 Is Dispensable for Early B Cell Development. PLoS ONE 2015, 10, e0128385. [Google Scholar] [CrossRef]
- Nair, V.A.; Al-Khayyal, N.A.; Sivaperumal, S.; Abdel-Rahman, W.M. Calponin 3 promotes invasion and drug resistance of colon cancer cells. World J Gastrointest Oncol 2019, 11, 971–982. [Google Scholar] [CrossRef]
- Maddala, R.; Mongan, M.; Xia, Y.; Rao, P.V. Calponin-3 deficiency augments contractile activity, plasticity, fibrogenic response and Yap/Taz transcriptional activation in lens epithelial cells and explants. Sci Rep 2020, 10, 1295. [Google Scholar] [CrossRef]
- Aragona, M.; Panciera, T.; Manfrin, A.; Giulitti, S.; Michielin, F.; Elvassore, N.; Dupont, S.; Piccolo, S. A mechanical checkpoint controls multicellular growth through YAP/TAZ regulation by actin-processing factors. Cell 2013, 154, 1047–1059. [Google Scholar] [CrossRef]
- Mosaddad, S.A.; Salari, Y.; Amookhteh, S.; Soufdoost, R.S.; Seifalian, A.; Bonakdar, S.; Safaeinejad, F.; Moghaddam, M.M.; Tebyanian, H. Response to Mechanical Cues by Interplay of YAP/TAZ Transcription Factors and Key Mechanical Checkpoints of the Cell: A Comprehensive Review. Cell Physiol Biochem 2021, 55, 33–60. [Google Scholar] [CrossRef]
- Yang, C.; Zhu, S.; Feng, W.; Chen, X. Calponin 3 suppresses proliferation, migration and invasion of non-small cell lung cancer cells. Oncol Lett 2021, 22, 634. [Google Scholar] [CrossRef]
- Junghans, D.; Herzog, S. Cnn3 regulates neural tube morphogenesis and neuronal stem cell properties. FEBS J 2018, 285, 325–338. [Google Scholar] [CrossRef]
Figure 1.
Modulation of CNN3 expression during myoblast differentiation. (A) Immunoblotting was conducted to assess CNN3 expression levels in C2C12 myoblasts and various tissues from C57BL/6 mice; α-tubulin was used as a loading control. (B) C2C12 myoblasts were harvested on specified differentiation days, and the protein expression levels of MyoD, MyoG, MyHC, and CNN3 were determined by immunoblotting; β-actin was used as a loading control. (C) Protein levels were normalized versus β-actin, and relative expression ratios were calculated, setting day 0 as one for MyoD and CNN3, day 1 for MyoG, and day 2 for MyHC. Data are presented as means ± SEMs (n = 3), and asterisks indicate statistical significance (*P < 0.05, **P < 0.01, ***P < 0.001).
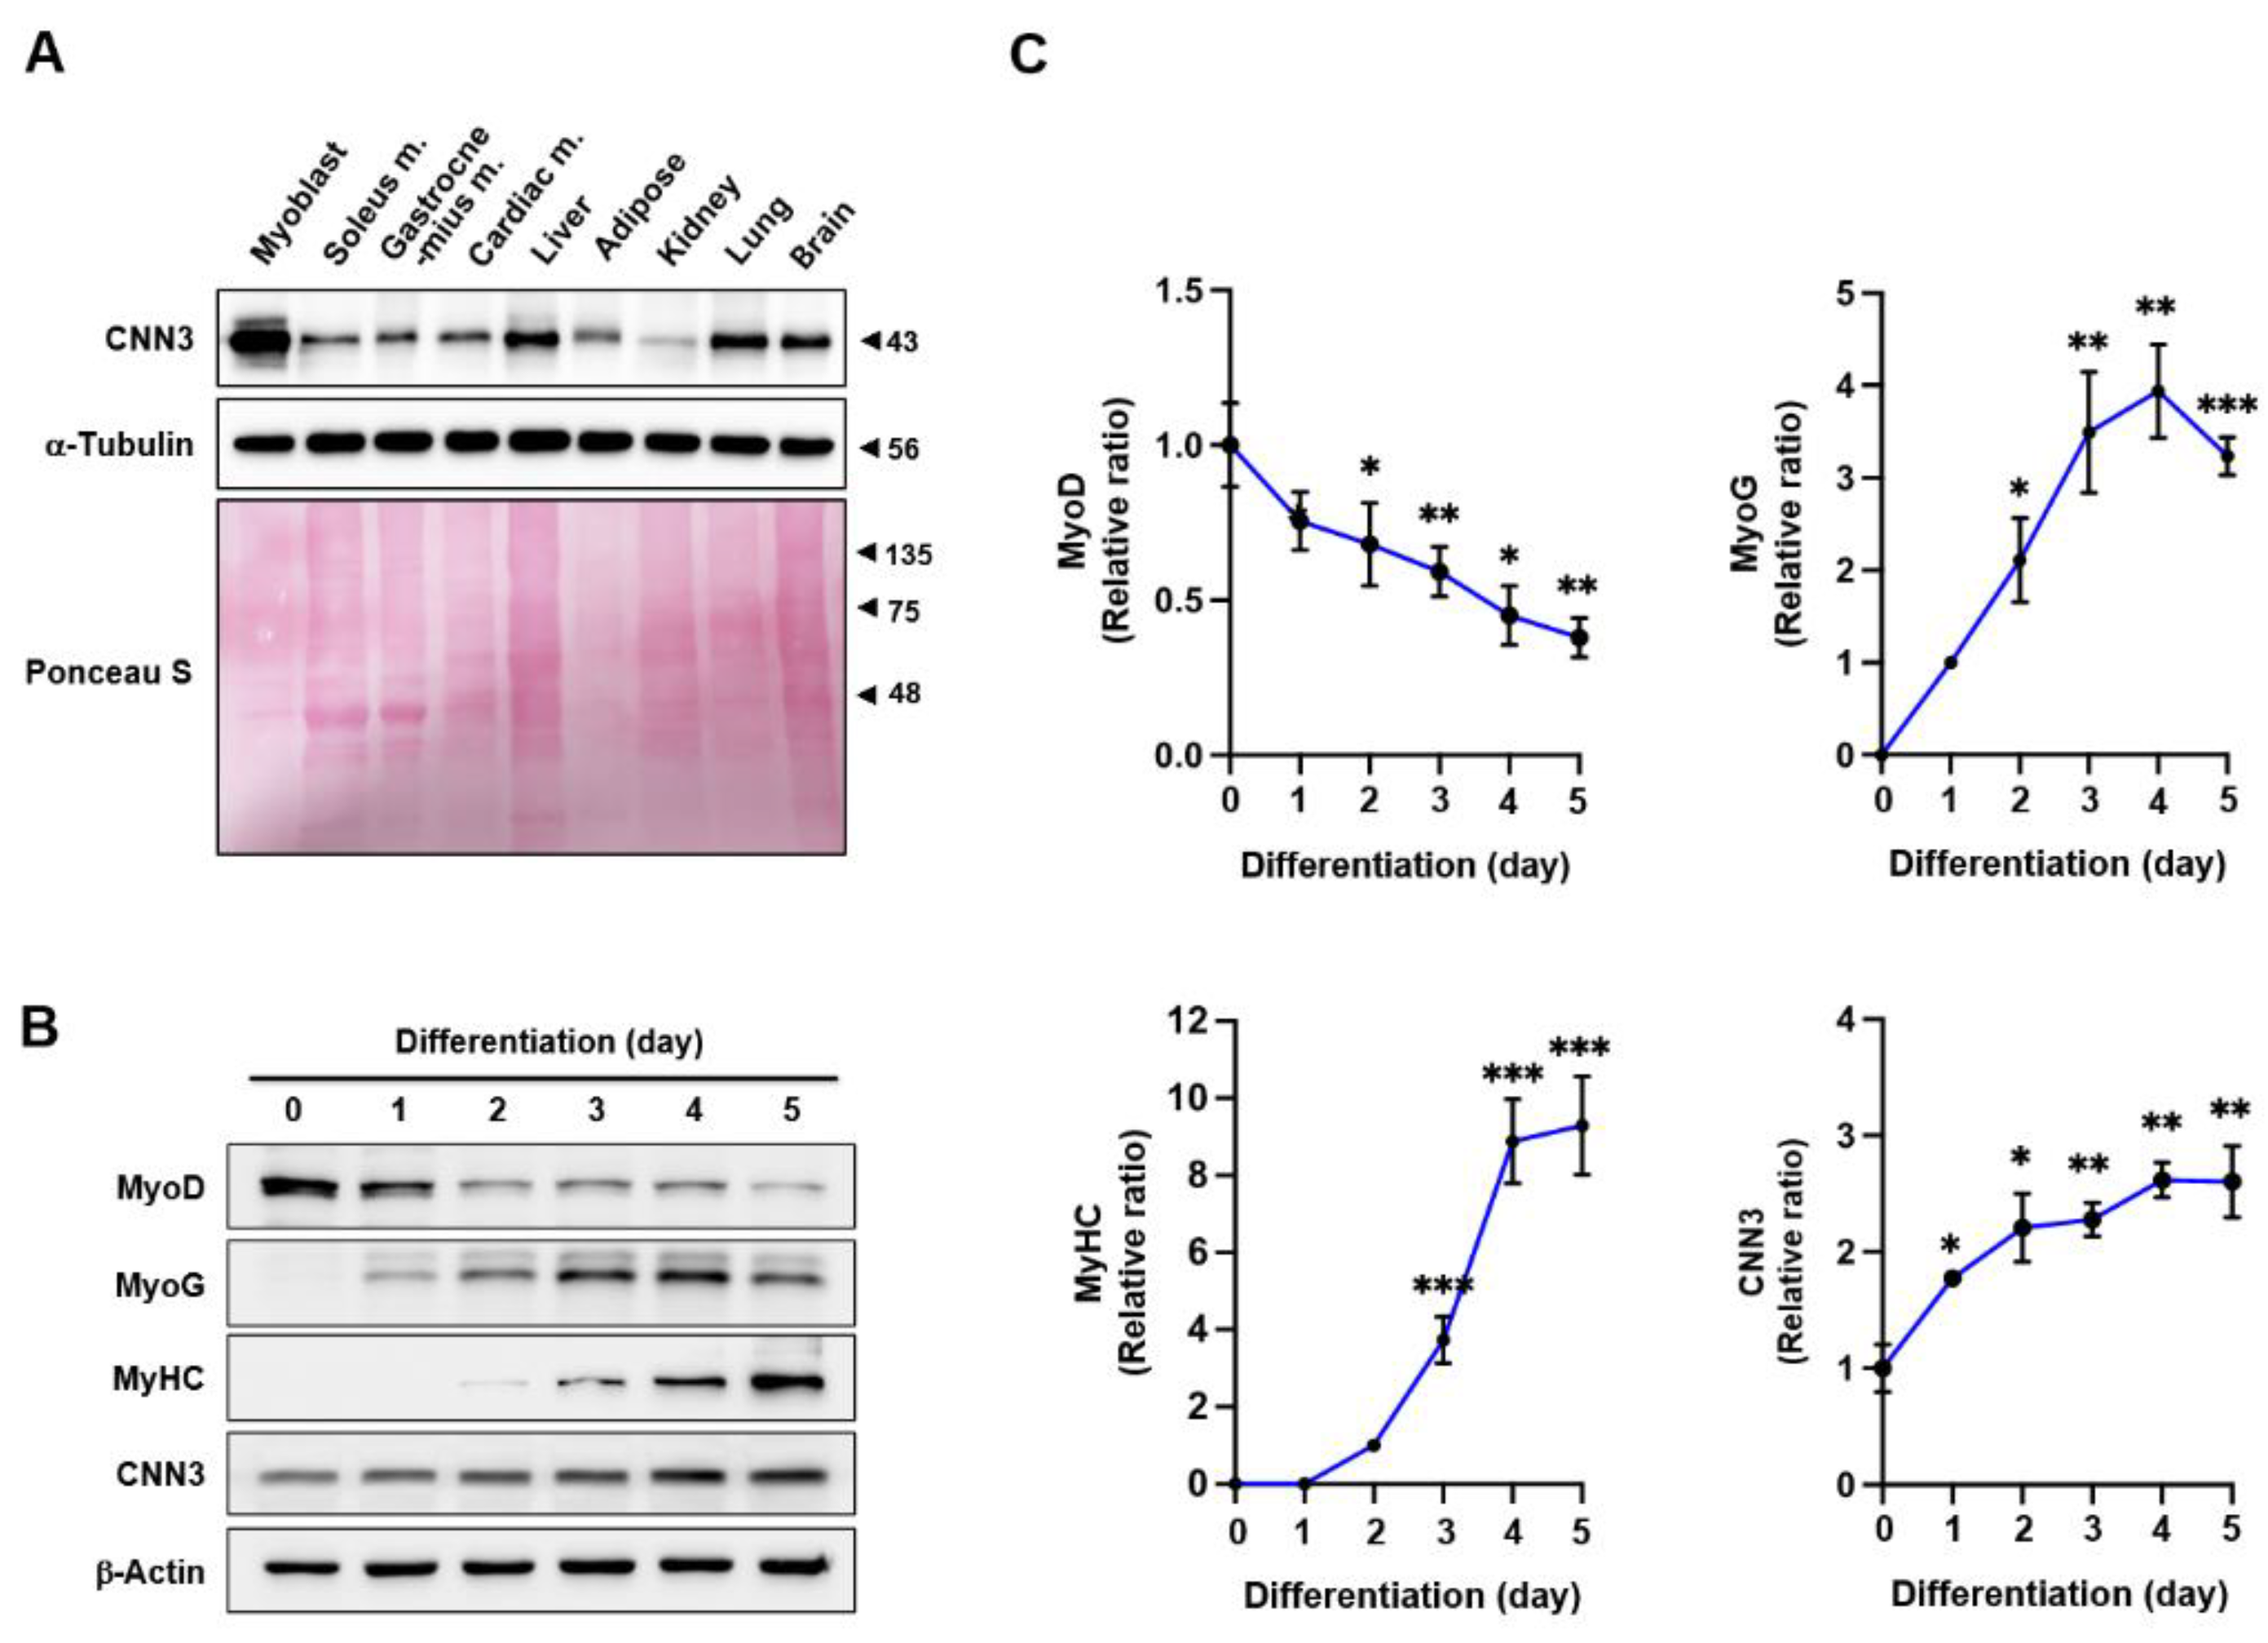
Figure 2.
CNN3 knockdown elevated F-actin levels and increased nuclear localization of YAP1. C2C12 myoblasts were transfected with 200 nM of either control scRNA or siCNN3 (siCNN3-1 or siCNN3-2). (A) CNN3 expressions were assessed by immunoblotting 24 hrs after transfection. CNN3 expression levels were normalized to β-actin, and relative expression ratios were calculated with the control scRNA set to one. (B) Cells were stained with FITC-phalloidin (green) for F-actin and Hoechst 33342 (blue) for nuclei. Scale bar: 25 μm. Phalloidin intensities were quantified using ImageJ software. (C) F-actin levels were analyzed by flow cytometry after staining with FITC-phalloidin. (D) Cytoplasmic and nuclear fractions were immunoblotted for YAP1, pYAP1 (phosphorylated YAP1), and CNN3. α-Tubulin and lamin B2 served as cytoplasmic and nuclear markers, respectively, and β-actin was used as a loading control. (E) Protein levels were normalized versus β-actin, and relative expression ratios were calculated versus scRNA. Data are presented as means ± SEMs (n = 3), and asterisks indicate statistical significance (*P < 0.05, **P < 0.01, ***P < 0.001).
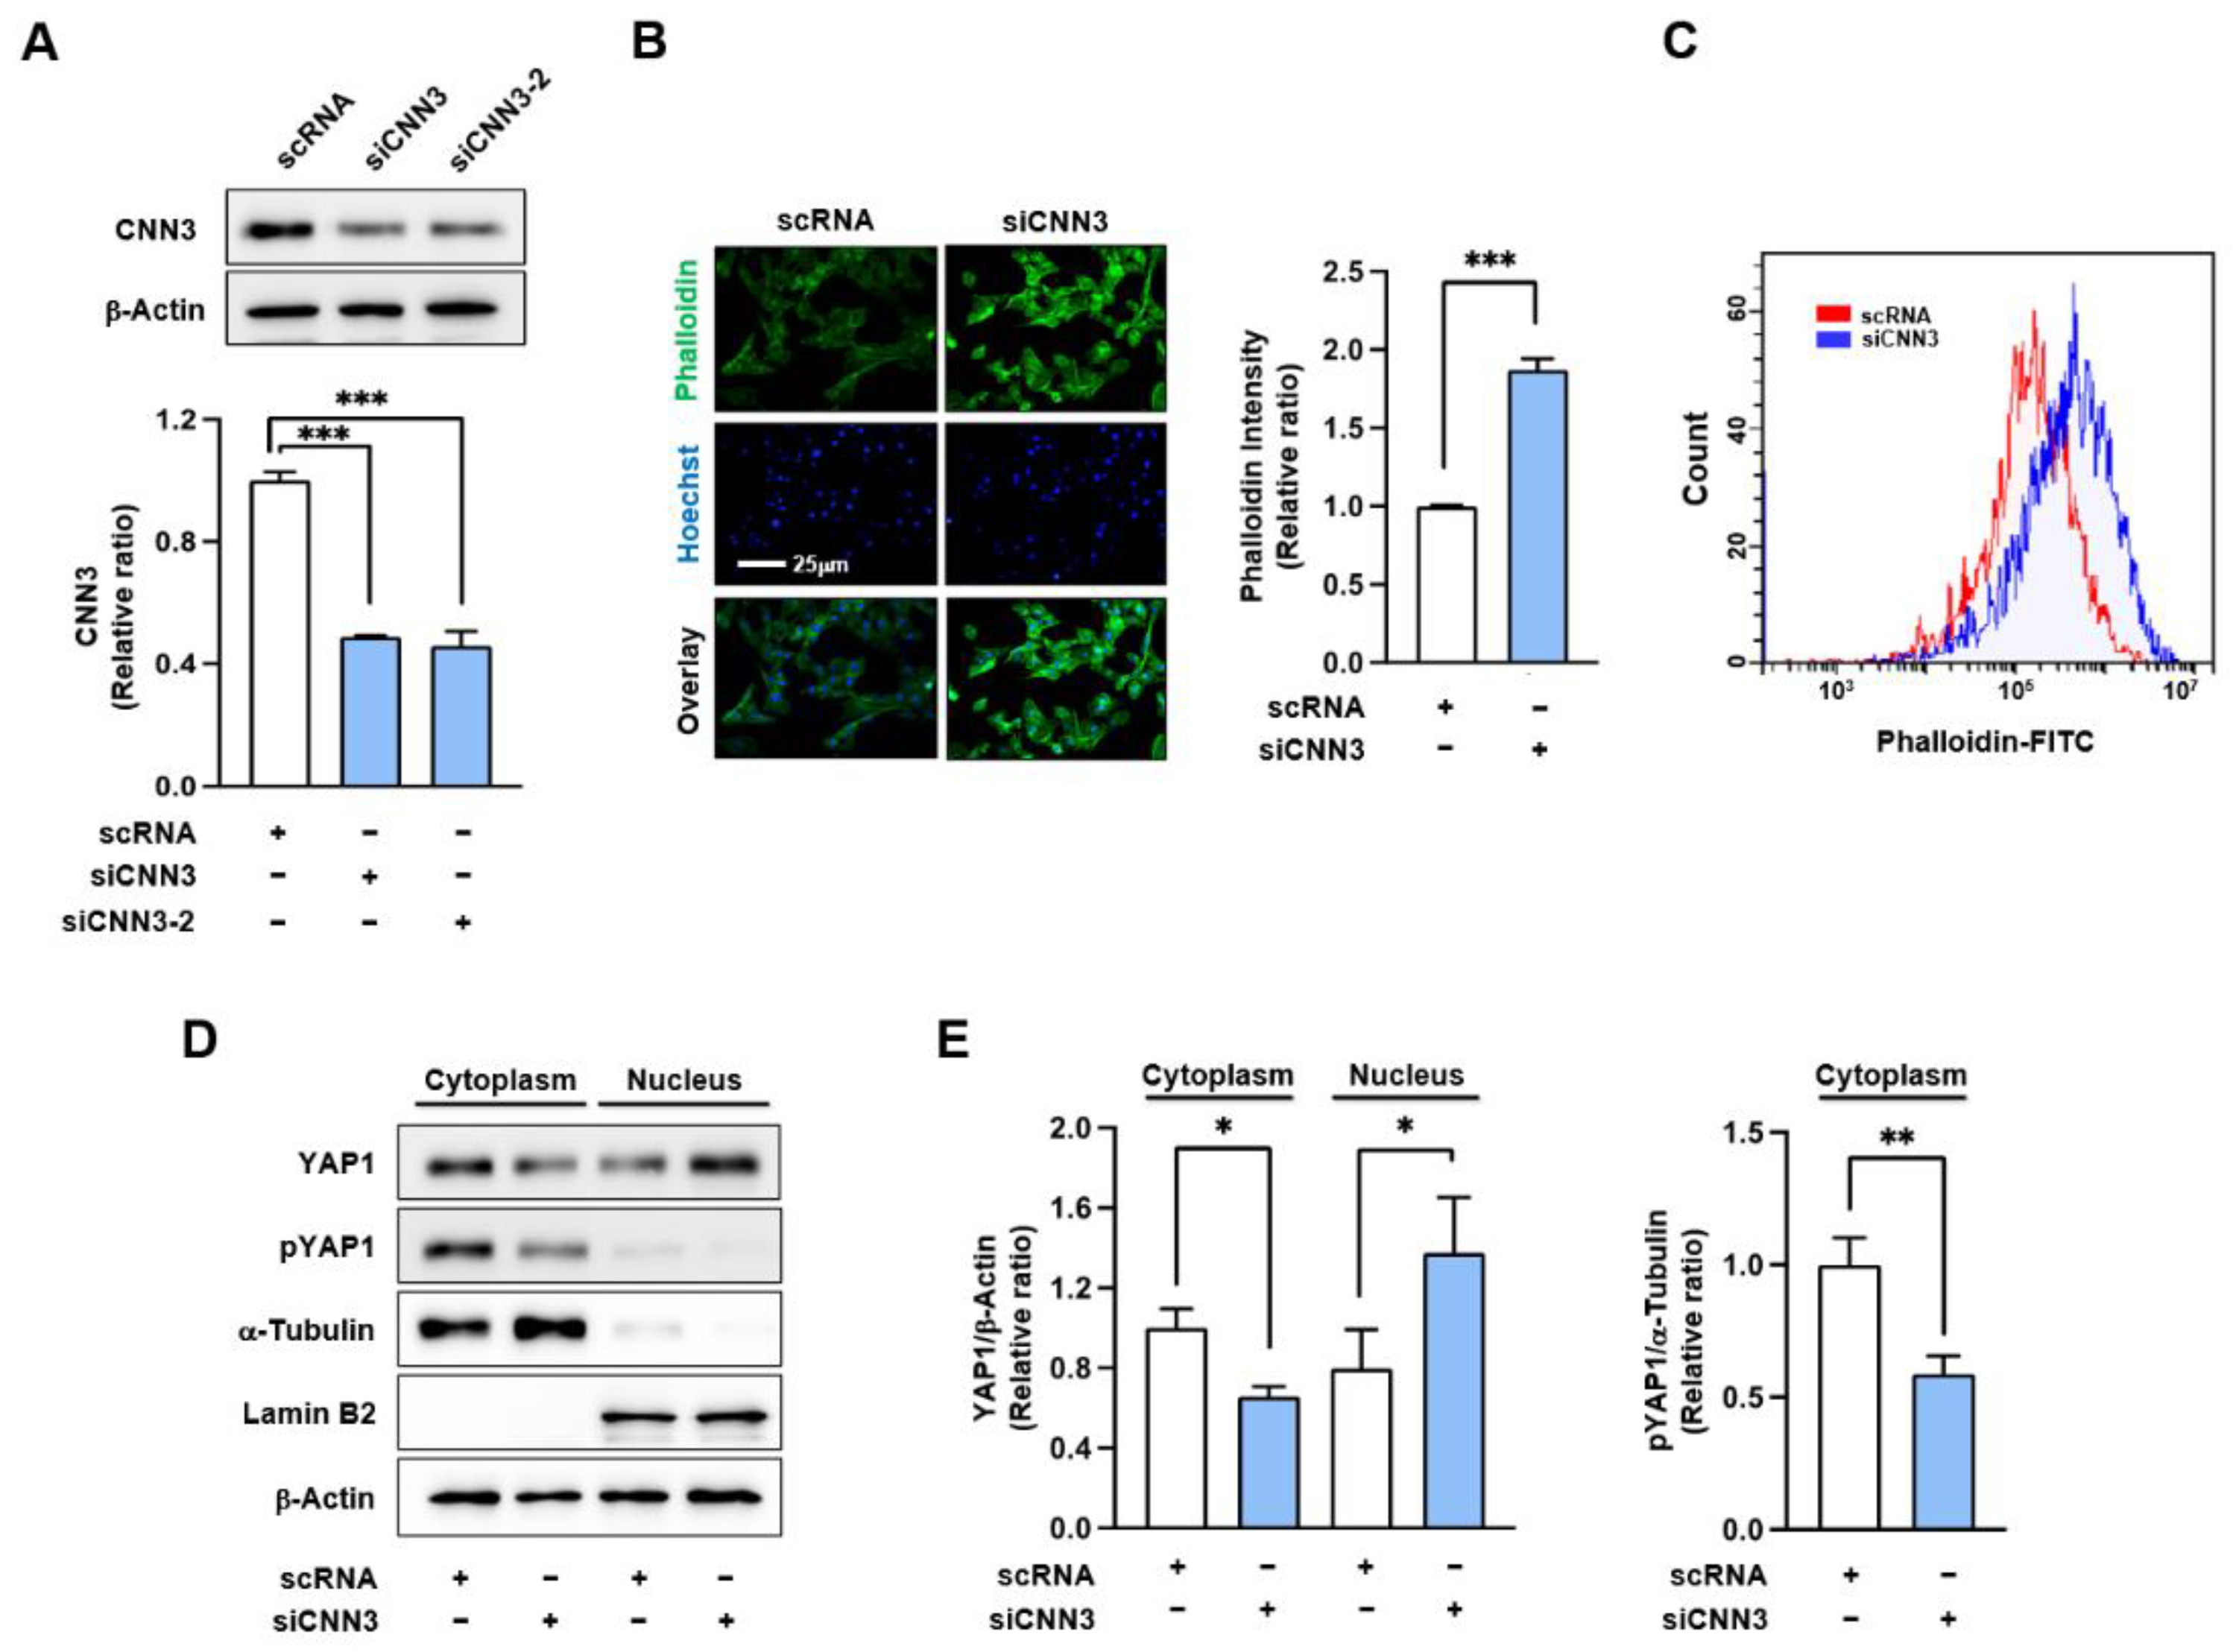
Figure 3.
CNN3 depletion facilitated cell proliferation and cell cycle progression. C2C12 myoblasts were transfected with either control scRNA or siCNN3 and analyzed 24 hrs post-transfection. (A) Cell proliferation was evaluated by EdU incorporation (green) to label replicating cells, and Hoechst 33342 (blue) was used to counterstain nuclei. Scale bar: 50 µm. (B) The percentages of EdU-positive cells were determined using ImageJ software. (C) Viable cell numbers were measured using a cell viability assay kit. (D) mRNA levels of proliferation markers (PCNA, Cyclin B1, and Cyclin D1) were assessed by RT-qPCR and normalized versus GAPDH expression. (E-F) Cell cycle analysis was performed using flow cytometry with scatter plots. Data are presented as means ± SEMs (n = 3), and asterisks indicate statistical significance (*P < 0.05, **P < 0.01, ***P < 0.001).
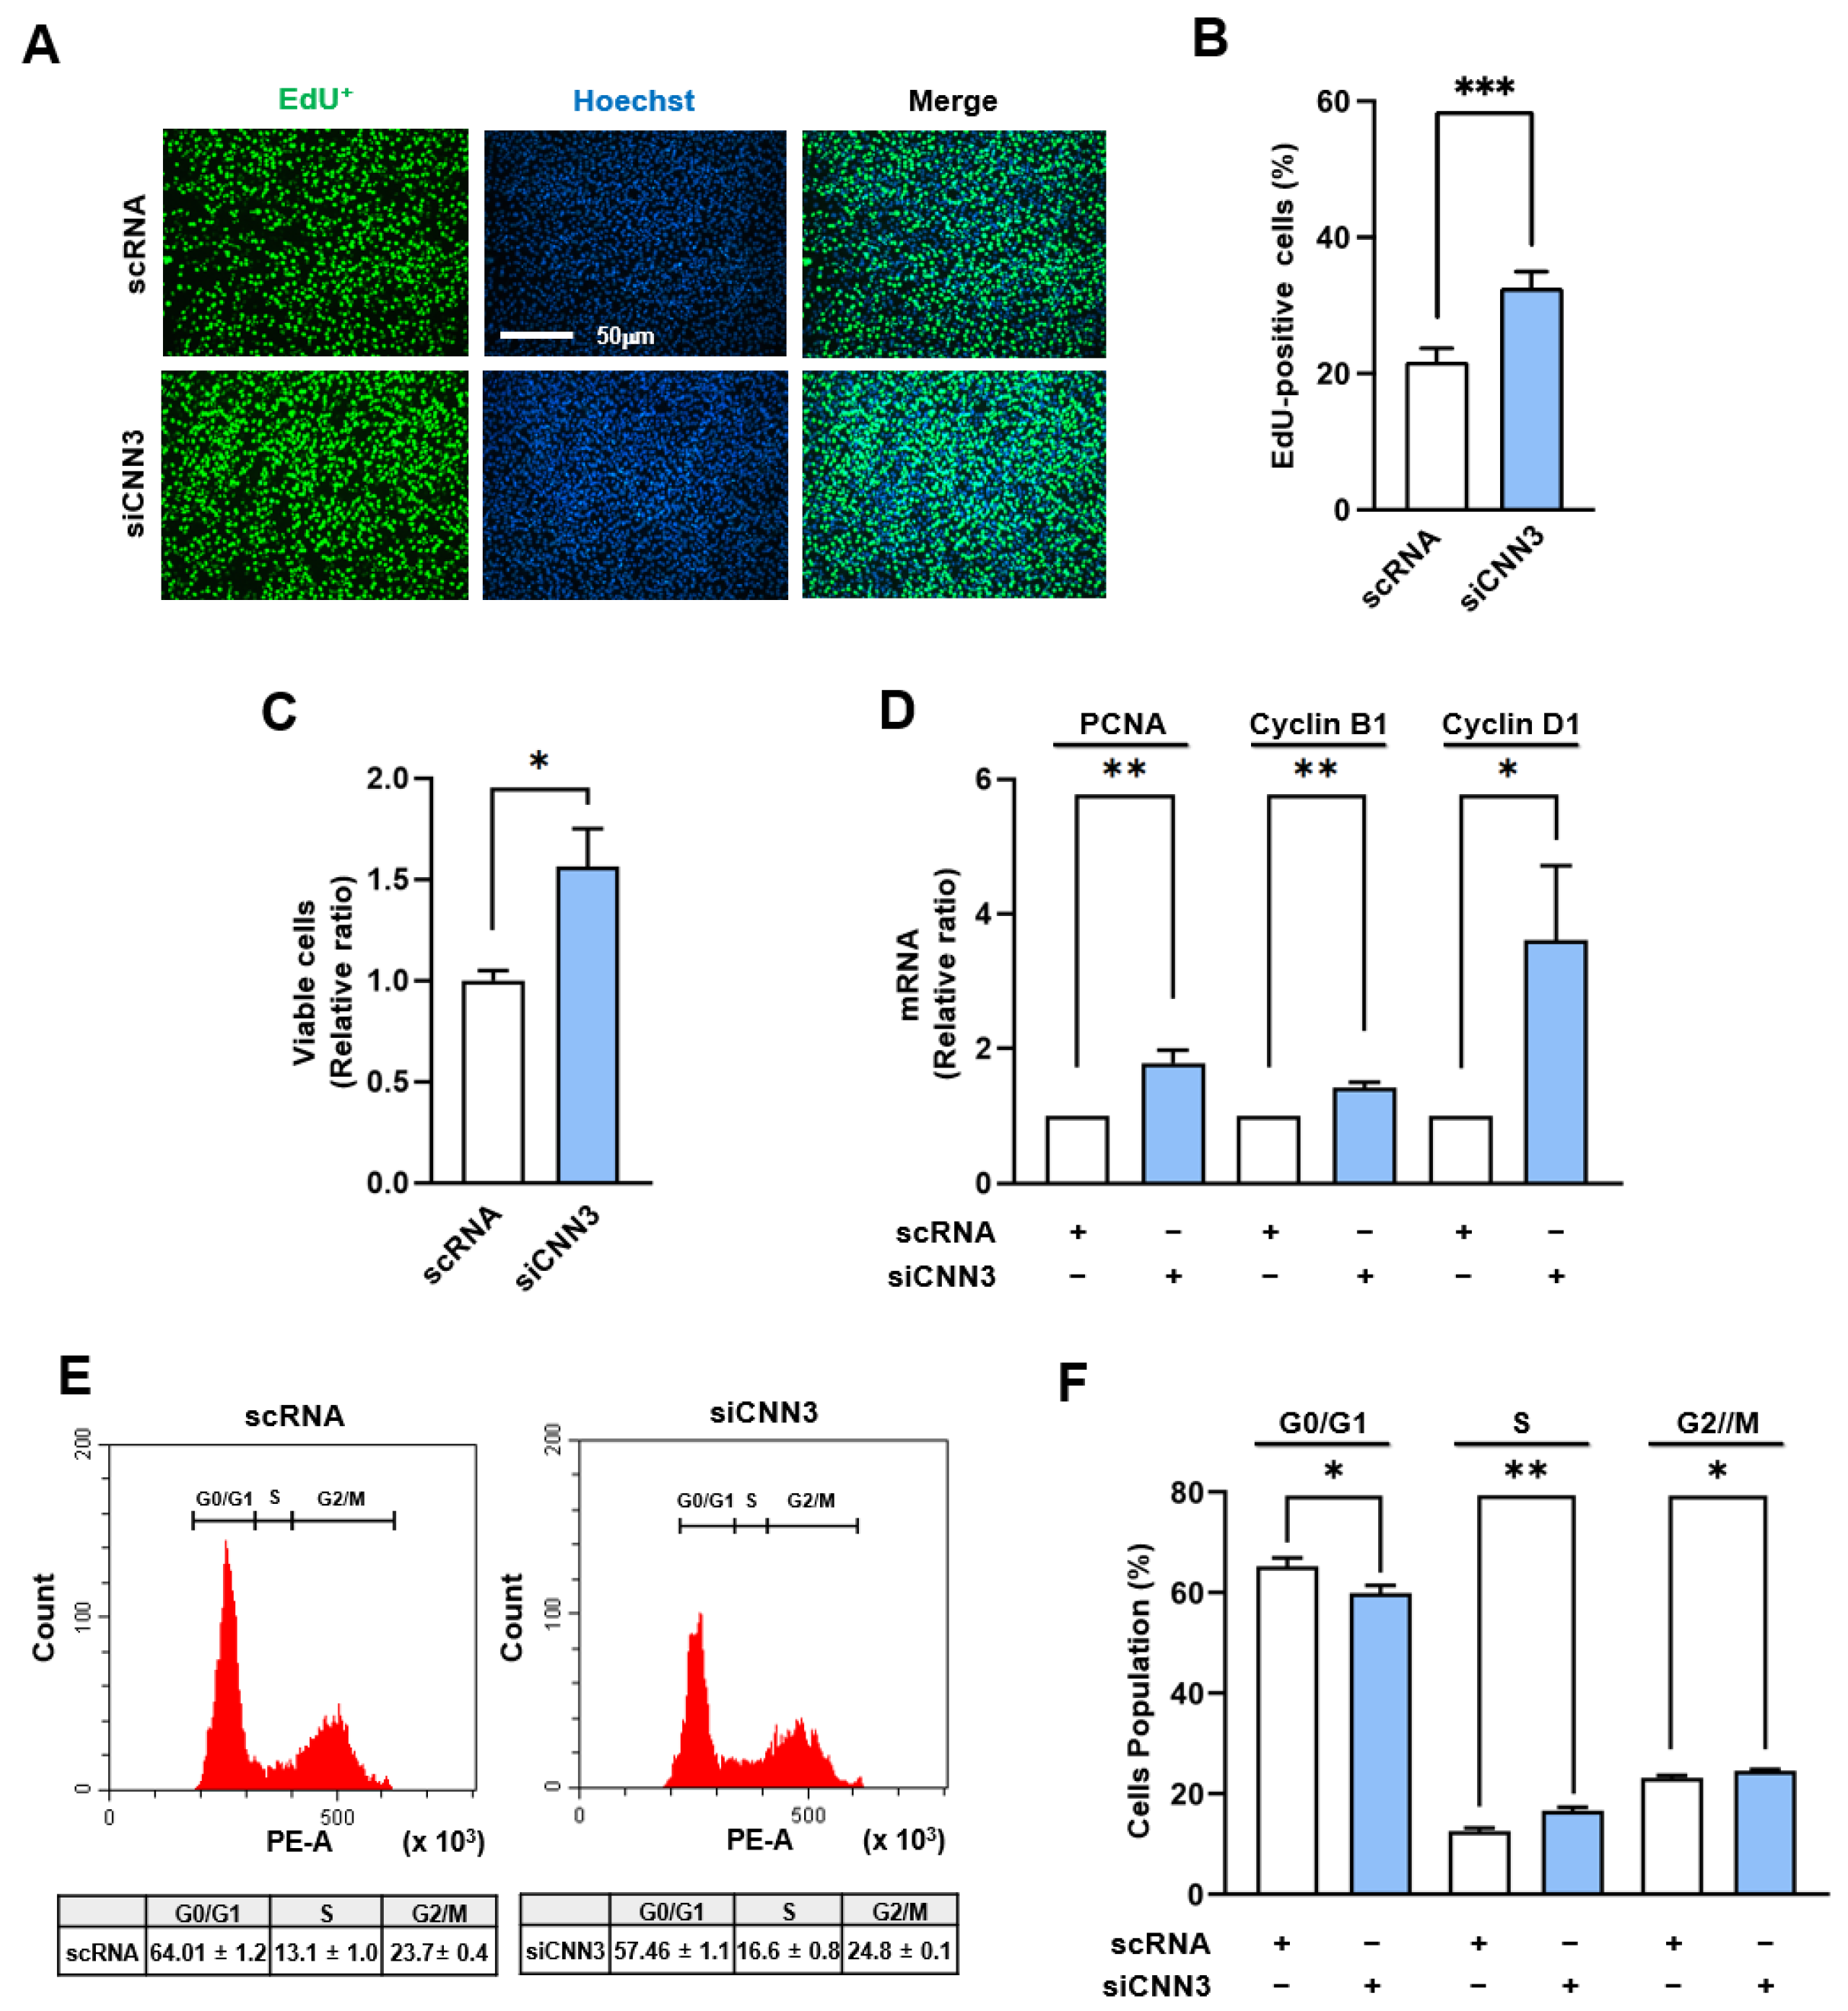
Figure 4.
CNN3 knockdown suppressed expressions of myogenic regulatory factors. C2C12 myoblasts were transfected with either control scRNA or siCNN3, allowed to differentiate, and then harvested on specified differentiation days. (A) Protein expression levels of MyoD, MyoG, MyHC, and CNN3 were analyzed by immunoblotting. (B) Protein expression levels in scRNA (open column) and siCNN3 (blue column) were normalized versus β-actin. Results are presented as relative ratios versus scRNA levels on day 0 (for CNN3 and MyoD) or day 3 (for MyoG and MyHC). Data are presented as means ± SEMs (n = 3), and asterisks indicate statistical significance (*P < 0.05, **P < 0.01, ***P < 0.001); ns indicates non-significant.
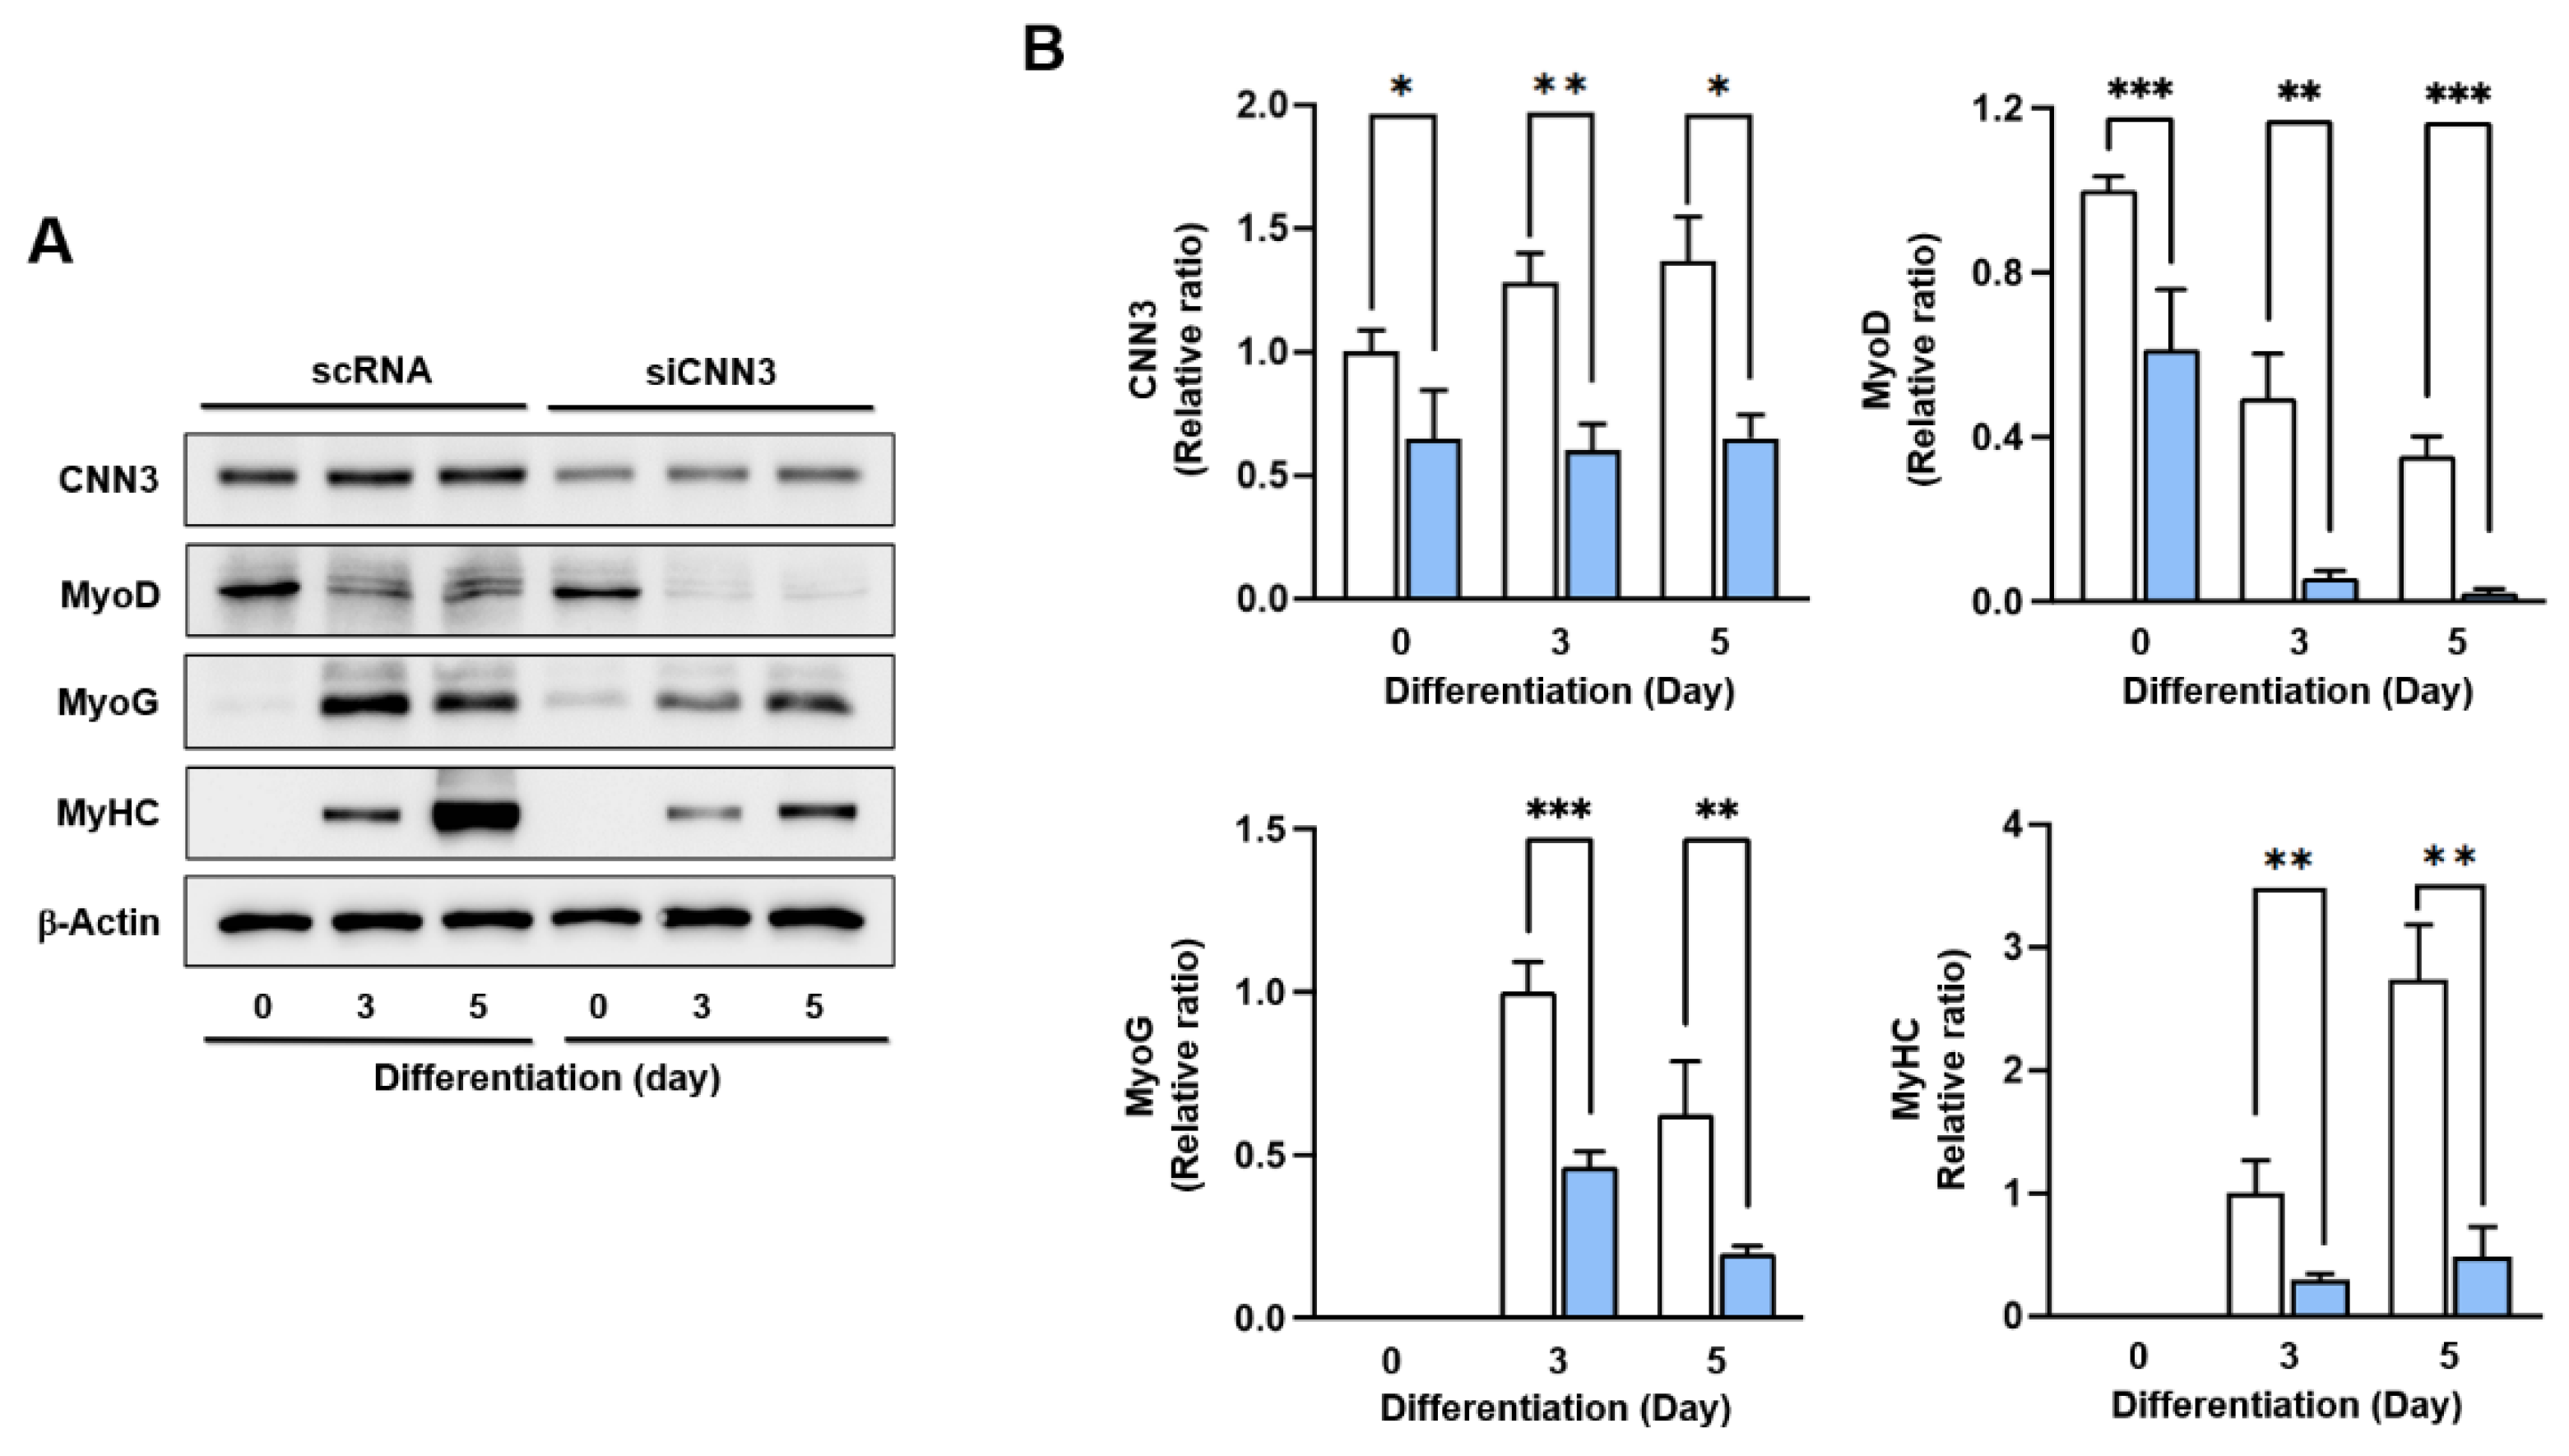
Figure 5.
CNN3 depletion impaired myogenic differentiation. C2C12 myoblasts were transfected with control scRNA or siCNN3 and then allowed them to differentiate for 5 days. (A) Representative immunocytochemistry results after staining with MyHC antibody (green) and Hoechst 33342 (blue). Scale bar: 100 μm. (B) MyHC-positive areas, differentiation indices, fusion indices, and myotube widths were determined as described in Materials and Methods. Data are presented as means ± SEMs (n = 3), and asterisks indicate statistical significance (***P < 0.001).
Disclaimer/Publisher’s Note: The statements, opinions and data contained in all publications are solely those of the individual author(s) and contributor(s) and not of MDPI and/or the editor(s). MDPI and/or the editor(s) disclaim responsibility for any injury to people or property resulting from any ideas, methods, instructions or products referred to in the content. |
© 2024 by the authors. Licensee MDPI, Basel, Switzerland. This article is an open access article distributed under the terms and conditions of the Creative Commons Attribution (CC BY) license (https://creativecommons.org/licenses/by/4.0/).
Copyright: This open access article is published under a Creative Commons CC BY 4.0 license, which permit the free download, distribution, and reuse, provided that the author and preprint are cited in any reuse.


