
Submitted:
13 December 2024
Posted:
13 December 2024
You are already at the latest version
Abstract
Mycorrhizal symbiosis has been the focus of research for more than a century due to the positive effect of fungi on the growth of the majority of woody plants. Extramatrical mycelium (EMM) of ectomycorrhiza (EMR) reaches one third of the total soil microbial biomass, and litter from this short-living pool represents 60% of the total litterfall mass in forest ecosystems. The functioning of EMR improves the nitrogen nutrition of trees and thus contributes to the carbon balance of forest soils. The model presented here is an attempt to describe these EMR functions quantitatively. It calculates the growth of EMM, and the subsequent “mining” of additional nitrogen from recalcitrant soil organic matter (SOM) for EMR growth, with the associated formation of “dissolved soil carbon”. The decomposition of EMM litter is carried out by all organisms in the soil food webs, forming available NH4+ in the first phase, and then solid-phase by-products (excretes) as a new labile SOM pool. These substances are the feedback that determines the positive role of the EMR symbiosis for forest vegetation. The sensitivity analysis revealed a leading role of the C:N ratio of biotic components in the dynamics of EMM. The model validation showed a satisfactory agreement between simulated and observed data in relation to EMM respiration in larch forest plantations of different ages. The model testing within the EFIMOD3 model system allowed a quantitative evaluation of the contribution of different components in forest soil and ecosystem respiration. The validation and testing of this model demonstrated the adequacy of the theoretical background used in this model, with a fast EMM decomposition cycle by all soil biota of food webs, and without direct resource exchange between plants and fungi.
Keywords:
ectomycorrhiza
; modelling
; growth
; N mining
; dissolved organic matter
; mycelial litter
; decomposition
; food web fauna
; NH4+
; faunal casts
1. Introduction
The development of mathematical modelling in ecology, soil science, forestry and other biological disciplines began in the 20th century with very simple functions, followed by a steady increase in the complexity of the model structure as new experimental data and ideas for quantification and parameterisation of processes in natural systems emerged.
The first equations for the dynamics of organic debris and soil organic matter (SOM) described the formation/accumulation of SOM, but then the focus shifted to the processes of SOM decomposition. At that time, the development of SOM models focused on SOM as an important factor for plant nutrition and improvement of edaphic conditions in terrestrial ecosystems [1,2,3]. Nowadays, the emphasis has shifted back to the sequestration of “soil organic carbon” (SOC instead of SOM) in the soil system due to the problem of climate change and the important role of soil in the global carbon cycle [4,5,6,7].
The number of recent models of SOM dynamics is quite large (see review in [8]). The effect of biological factors in the recent models is mostly limited by microbiological activity. SOM dynamics have not been directly linked to the whole soil biota. Modern models satisfactorily reproduce the processes of SOM transformation, decomposition and formation of SOM pools with relative stability or protection against its mineralisation within the framework of the classical concept of “plant – soil” interaction and ecosystem feedback through the “plant debris – soil nutrients” exchange. Some recent SOM models are integrated with plant/vegetation simulators and reproduce the organic carbon cycle at the ecosystem level [9,10,11]. This has led to increased interest in studying the finer biotic mechanisms of “plant – soil biota – soil” interactions.
Two widespread mechanisms of “plant – soil” biotic interactions are (i) the activation of rhizosphere soil microorganisms by plant roots, the so-called the “priming effect” [12,13], and (ii) the symbiosis of plant roots with mycorrhizal fungi [14,15,16]. Symbiotic microbial nitrogen fixation and nutrient transfer from the canopy to the soil through litterfall are also such “plant – soil” interactions [17,18,19]. The cumulative effect of these mechanisms of “plant – soil biota – soil” interactions leads to the optimisation of the edaphic environment in terrestrial ecosystems and increased plants growth and vitality.
The rhizosphere priming effect is well documented and has been studied in detail [12], which has allowed the mathematical simulation of this phenomenon [20,21]. However, the mycorrhizal symbiosis is a more powerful type of “plant – soil biota – SOM” interactions that has been underexplored for about 150 years. It is a widespread phenomenon in the world’s vegetation. There are five types of such symbiosis, but two are dominant. These are ectomycorrhiza in temperate and boreal forests and arbuscular mycorrhiza in forests and grasslands, mostly in warmer climates.
Ectomycorrhiza (EMR) forms a mycelial mantle (sheath) on the growing root tip that produces a large amount of extramatrical mycelium (EMM) that penetrates a whole volume of organic and organomineral soil horizons. Arbuscular mycorrhizal cells live inside the roots from where the EMM hyphae occupy a large soil volume. EMR explores the entire soil volume and its dense network of EMM “mines” the nutrients from SOM, thus covering their lack for fungal growth [22,23]. EMM accounts for one third of the total biomass of soil microorganisms [24].
Mycorrhizal fungi are obligatory biotrophs that exist on matter and energy obtained from the host plant in the form of root exudates (RE). The products of plant photosynthesis are the driving force behind the functioning of EMR. Trees spend 10–25% of their NPP for RE [23]. RE include carbohydrates, amino acids, organic acids and some other organic compounds [14,15,25]. However, RE do not cover all EMM growth requirements due to an imbalance of C and N in their composition [26]. First of all, RE in boreal and temperate forests are deficient in nitrogen, whereas the limiting nutrient for more southern vegetation zones is phosphorus. Therefore, EMR performs a rather specific SOM decomposition pattern, replenishing the missing N by “mining” from SOM [14,23,27,28]. EMM depolymerises large organic molecules of N-rich recalcitrant SOM for N extraction (“mining”), but does not mineralise all the “dissolved organic carbon” (DOC) obtained. This is a major difference between mycorrhiza and soil saprotrophic fungi: EMM produces a lot of DOC [24,29], but contributes about 2% to the total SOM mineralisation [22,30,31]. This DOC after N mining plus the rest of acid RE after mycorrhizal consumption of carbohydrates and amino acids are biochemical agents of soil minerals’ dissolution [32,33]. This resulted in an increase in the availability of phosphorus and other elements to plant roots.
EMM has a short lifespan, varying from a few days to several weeks [14,34,35]. This results in a high EMM turnover rate. Therefore, EMM produces a large pool of litter, which is larger than leaf litter and can reach 62% of the total annual above- and belowground litter from trees [36,37,38,39].
The decomposition of this very large and previously unknown pool of fungal litter is carried out by all soil biota: bacteria, fungi, micro- and mesofauna of food webs. However, the role of soil fauna in the fate of this specific litter is mostly missing in EMR studies [40], leading to an underestimation of the contribution of EMM litter to SOM formation. In the case of only microbial decomposition, the intermediate product of microbial exoenzymatic depolymerisation of SOM is DOC. It is consumed by microorganisms for their own biomass growth [41]. So, in effect, new microbial biomass, CO2 and H2O remain after complete SOM mineralisation by microorganisms. Nevertheless, there is a concept in soil science that the DOC produced microbial activity is an important source of new SOM formation by stabilising on a surface of soil minerals [42,43,44].
A different situation occurs in the case of mycelial litter decomposition with the participation of fauna of soil food webs as active agent of litter transformation [45]. Soil micro- and mesofauna consume litter, transform organic matter and produce solid-phase metabolic products in the form of casts (coprolites). They have been known in soil ecology since the 19th century as main products of SOM formation [46,47]. These casts, which are rich in N and not yet bound to the soil mineral matrix, sesquioxides and calcium, represent a previously unrecognised labile SOM fraction, which determines a positive role of EMR for plant growth and also a significant contribution of EMR to SOM recovery. Furthermore, the formation of available ammonia N in food webs is an additional factor in the positive effect of EMR on tree growth. It occurs because some excess N is produced during the consumption of microorganism (including EMM) by soil fauna, as a significant part of the consumed C is used for faunal respiration [48,49]. This pathway of EMM litter transformation and decomposition is consistent with the concept and experimental data on the prominent role of food webs in resource acquisition and consumption in soils of terrestrial ecosystems [21,48,49,50,51,52,53]. With regard to soil food webs, their active role has been confirmed by the oscillatory respiration on an hourly scale, which reflects the high activity of “predator – prey” type of relationships between the soil fauna of “microbial grazers” and microorganisms [54,55].
This role of EMR in SOM recovery and sequestration represents a feedback in the mycorrhizal symbiosis that determines a well-known positive effect of EMR on tree growth [56,57]. Thus, the increase in biomass increment, photosynthetic rate or respiration in tree seedlings with ectomycorrhiza was 1.2–2.6 times higher than the same in non-infected plants [14,58,59,60]. Currently, there is a growing interest in mathematical modelling of the functioning of EMR as a powerful phenomenon reflecting the interaction between tree and soil. Thus, there are studies on principles and approaches of EMR simulation [61,62,63], modelling of special patterns of EMM distribution in forest ecosystems [64], model assessment of nitrogen uptake by EMR fungi [4], quantification of factors of EMM decomposition [65], and well-parameterised simulation of EMM growth [66]. More promising is a successful attempt to integrate the EMR model into the whole ecosystem simulator, MYCOFON [67].
The majority of recent EMR models have two specific features: (i) they consider the dynamics of EMM litter decomposition as controlled only by microorganisms, without including the soil fauna of food webs; (ii) the models are not integrated into the whole ecosystem models. Therefore, the aim of this work was to develop an EMR model that can reproduce the role of all soil biota with special reference to soil food webs, SOM dynamics and plant nutrition as recently conceptualised [40]. This model has been developed for integration with the Romul_Hum model of SOM dynamics [8,53] and the most recent version of the forest ecosystem model, EFIMOD3 [68].
2. Model description
2.1. Basic postulates
The following postulates, based on previous studies on the functioning of EMM, were used to construct the model. In the mycorrhizal symbiosis, the fungi are very active and consume all N of the RE for their own growth (mainly for the EMM), thus making impossible the transfer of N of exudates to the soil through the dense Hartig net of the mycelial mantle.
EMM decomposes SOM to cover the N deficiency for EMM growth only. It is selective N mining from recalcitrant stable SOM with increased N concentration. In effect, the mycorrhizal fungi are de facto “working for themselves”.
EMM has a short lifespan. Therefore, EMM produces a large litter pool, which is supposed to be a dominant component in the structure of total litter input in forest ecosystems.
This large litter pool of EMM is consumed by soil micro- and mesofauna of different trophic levels in soil food webs. It ensures SOM replenishment by solid-phase products of soil faunal metabolism, namely labile SOM from faunal excreta.
Additional N in EMR occurs through N mining during selective decomposition of recalcitrant SOM and also after EMM consumption by soil fauna in food webs. This N becomes available to roots after microbial decomposition of rapidly decomposing N rich labile SOM originated from faunal excreta. This explains the positive role of EMR in tree nutrition and growth.
2.2. Initialisation
The model has been developed for steady-state conditions with developed mycorrhiza in a forest ecosystem, where mycorrhizal growth is in equilibrium with its die off and consumption by soil fauna (faunal consumption is a dominant process) and is linked to growth of fine roots. All calculations in the model are performed in terms of carbon stocks per unit area (e.g. in kg m−2), with a time step of 1 day. Hydrothermal conditions are assumed to be optimal with soil moisture at 60% of the specific water retention and a soil temperature of 20° C. Total SOC represents the sum of the carbon stocks of the organic and organomineral horizons (O and Ah/AhE) in the topsoil. The pools of SOC, SON, biomass of fine roots, a rate and composition of RE are obtained from the EFIMOD3 system of models as part of which the EMR model was developed. All parameters and variables are presented in Table 1 and Table 2.
The biomass of the ectomycorrhizal mantle reaches 30–60% of fine roots biomass [14,72,73]. We postulated it as a constant fraction of 0.4 of the fine root biomass of trees. To date, the fraction of fine roots determined experimentally in the field studies includes both roots and ectomycorrhizal mantle. It follows, that a fraction of the ectomycorrhizal mantle biomass can be isolated from the experimentally measured fine root biomass. Therefore, we used the fine roots biomass to determine the initial value and dynamics of the fungal mantle in the EMR model, which has been integrated with the EFIMOD3 model. It is included in the model formulation as part of the ectomycorrhizal biomass. The lifespan of the mantle is 2–3 weeks, while the lifespan of fine roots without mantle is about 3 years [14].
Ectomycorrhiza develops a dense network of EMМ, which also has the same lifespan as the mantle [14,34,35,74]. Its biomass represents 30% of the total biomass of all soil microorganisms [24], and this parameter was used to calculate the initial biomass of EMM. The biomass of soil microorganisms can be estimated in the absence of measured data using the equation derived from [75]:
where is the C of all microorganisms (all fungi and all bacteria, but excluding microfauna), % of total SOC ().
The biomass of EMM () can be calculated as
The C:N ratio of the EMM () is also required to calculate the EMM dynamics in the model. It can be calculated using the following equation [53]:
where is the C:N ratio of soil organic matter.
2.3. Root exudate input
The input of root exudates (, kg [C] m−2 day−1) is determined in the photosynthesis submodel of EFIMOD3 as part of the gross primary production (GPP) of the trees, or this input can be obtained from the available measured data. The actual RE consumption () can be partially reduced due to competition with priming () and RE consumption efficiency ():
The second and third terms of this equation are assumed to be 1.0 in this pilot version of the model due to the lack of experimental data.
2.4. EMM growth
Consumed RE are used for EMM growth () taking into account (i) the N pool in RE () and (ii) the need for RE carbon for EMM growth respiration. It can be expressed by two equations:
where is the C:N ratio of the EMM biomass;
where is RE respiration as a cost of EMM growth; is a portion of consumed C spent on EMM growth; is a portion of consumed C spent on respiration (with the condition that ).
The use of RE for EMM growth and respiration does not utilise the entire RE pool due to insufficient nitrogen content (the C:N ratio of RE is significantly higher than the C:N ratio of EMM biomass). The rest of the RE () is calculated as follows:
This pool contains a significant amount of organic acids as RE proteins and carbohydrates are consumed by EMM for biomass production and respiration.
2.5. N mining
Complete assimilation of RE carbon for EMM growth requires additional nitrogen, which fungi “mine” from SOM by decomposing it to soluble compounds (dissolved organic carbon, DOC) during the process of enzymatic depolymerisation of large organic molecules [15,28]. It is therefore necessary to determine N deficiency for the assimilation of the rest of RE for EMM growth ():
It is possible to calculate the amount of SOC, which is “mined” from the total pool of SOC (), using the following equation:
where is the C:N ratio of total SOM. This SOC represents a depolymerised soluble organic matter with a strongly reduced N content after its “mining” for the assimilation of the remaining C of RE for EMM growth:
where is the additional growth of EMM using “mined” N and the rest of RE.
The processes of RE assimilation for EMM growth and N mining from total SOM lead to the production of two fractions of nitrogen-poor and acidified soluble organic matter. This mixture represents “dissolved organic carbon” (DOC) at a given time step i, which can be described by the following equation:
2.6. EMM consumption and mortality
The biomass of EMM decreases under the influence of natural mortality and consumption by the soil fauna of food webs:
where is the EMM mortality; is the consumption of EMM by soil micro- and mesofauna in food webs; and are the rates of natural mortality and consumption by soil fauna, respectively.
The total carbon budget of EMM at a given time step i () can be expressed as the difference between the corresponding value at a previous time step () and all incoming and outcoming fluxes, taken with the corresponding sign:
2.7. Food webs dynamics
The main consumers of EMM biomass are the soil micro- and mesofauna of the food webs. A specific feature of soil fauna physiology is the formation of solid excreta as a major metabolic by-product. This process is important for understanding the role of micro- and mesofauna in the soil carbon balance. Cast excretion (), respiration () and growth () of micro- and mesofauna can be described by operating on the value of EMM biomass consumed, cast production rate () and respiration rate ():
These three equations describe the functioning of the soil fauna in relation to the use of EMM as a basic level of food webs, although in other cases the basic level is represented by saprotrophic microorganisms.
In this case, part of the EMM consumed has been used for respiration, while some N remains excess and is excreted as ammonium () [48,49]. This can be calculated using the following equation ([48,21], adopted):
where is the C:N ratio of micro- and mesofauna. The proportion of the faunal population () that die-off is described as follows:
where is the faunal necromass production (in terms of carbon) and is the faunal mortality rate.
Micro- and mesofauna are a food resource for higher trophic levels with larger predators in soil food webs. In this case, the consumption of micro- and mesofauna can be represented as follows:
where is the consumed biomass (in terms of carbon) of micro- and mesofauna and is the consumption rate.
An entire carbon budget of the trophic level of micro- and mesofauna in food webs at a given time step i can be represented as follows:
The representation of the higher trophic levels of food webs (soil macrofauna) in the current version of the model does not include aboveground fauna and earthworms. The macrofauna consume the biomass of the micro- and mesofauna. The fluxes associated with the soil macrofauna are described in the same terms as for the micro- and mesofauna:
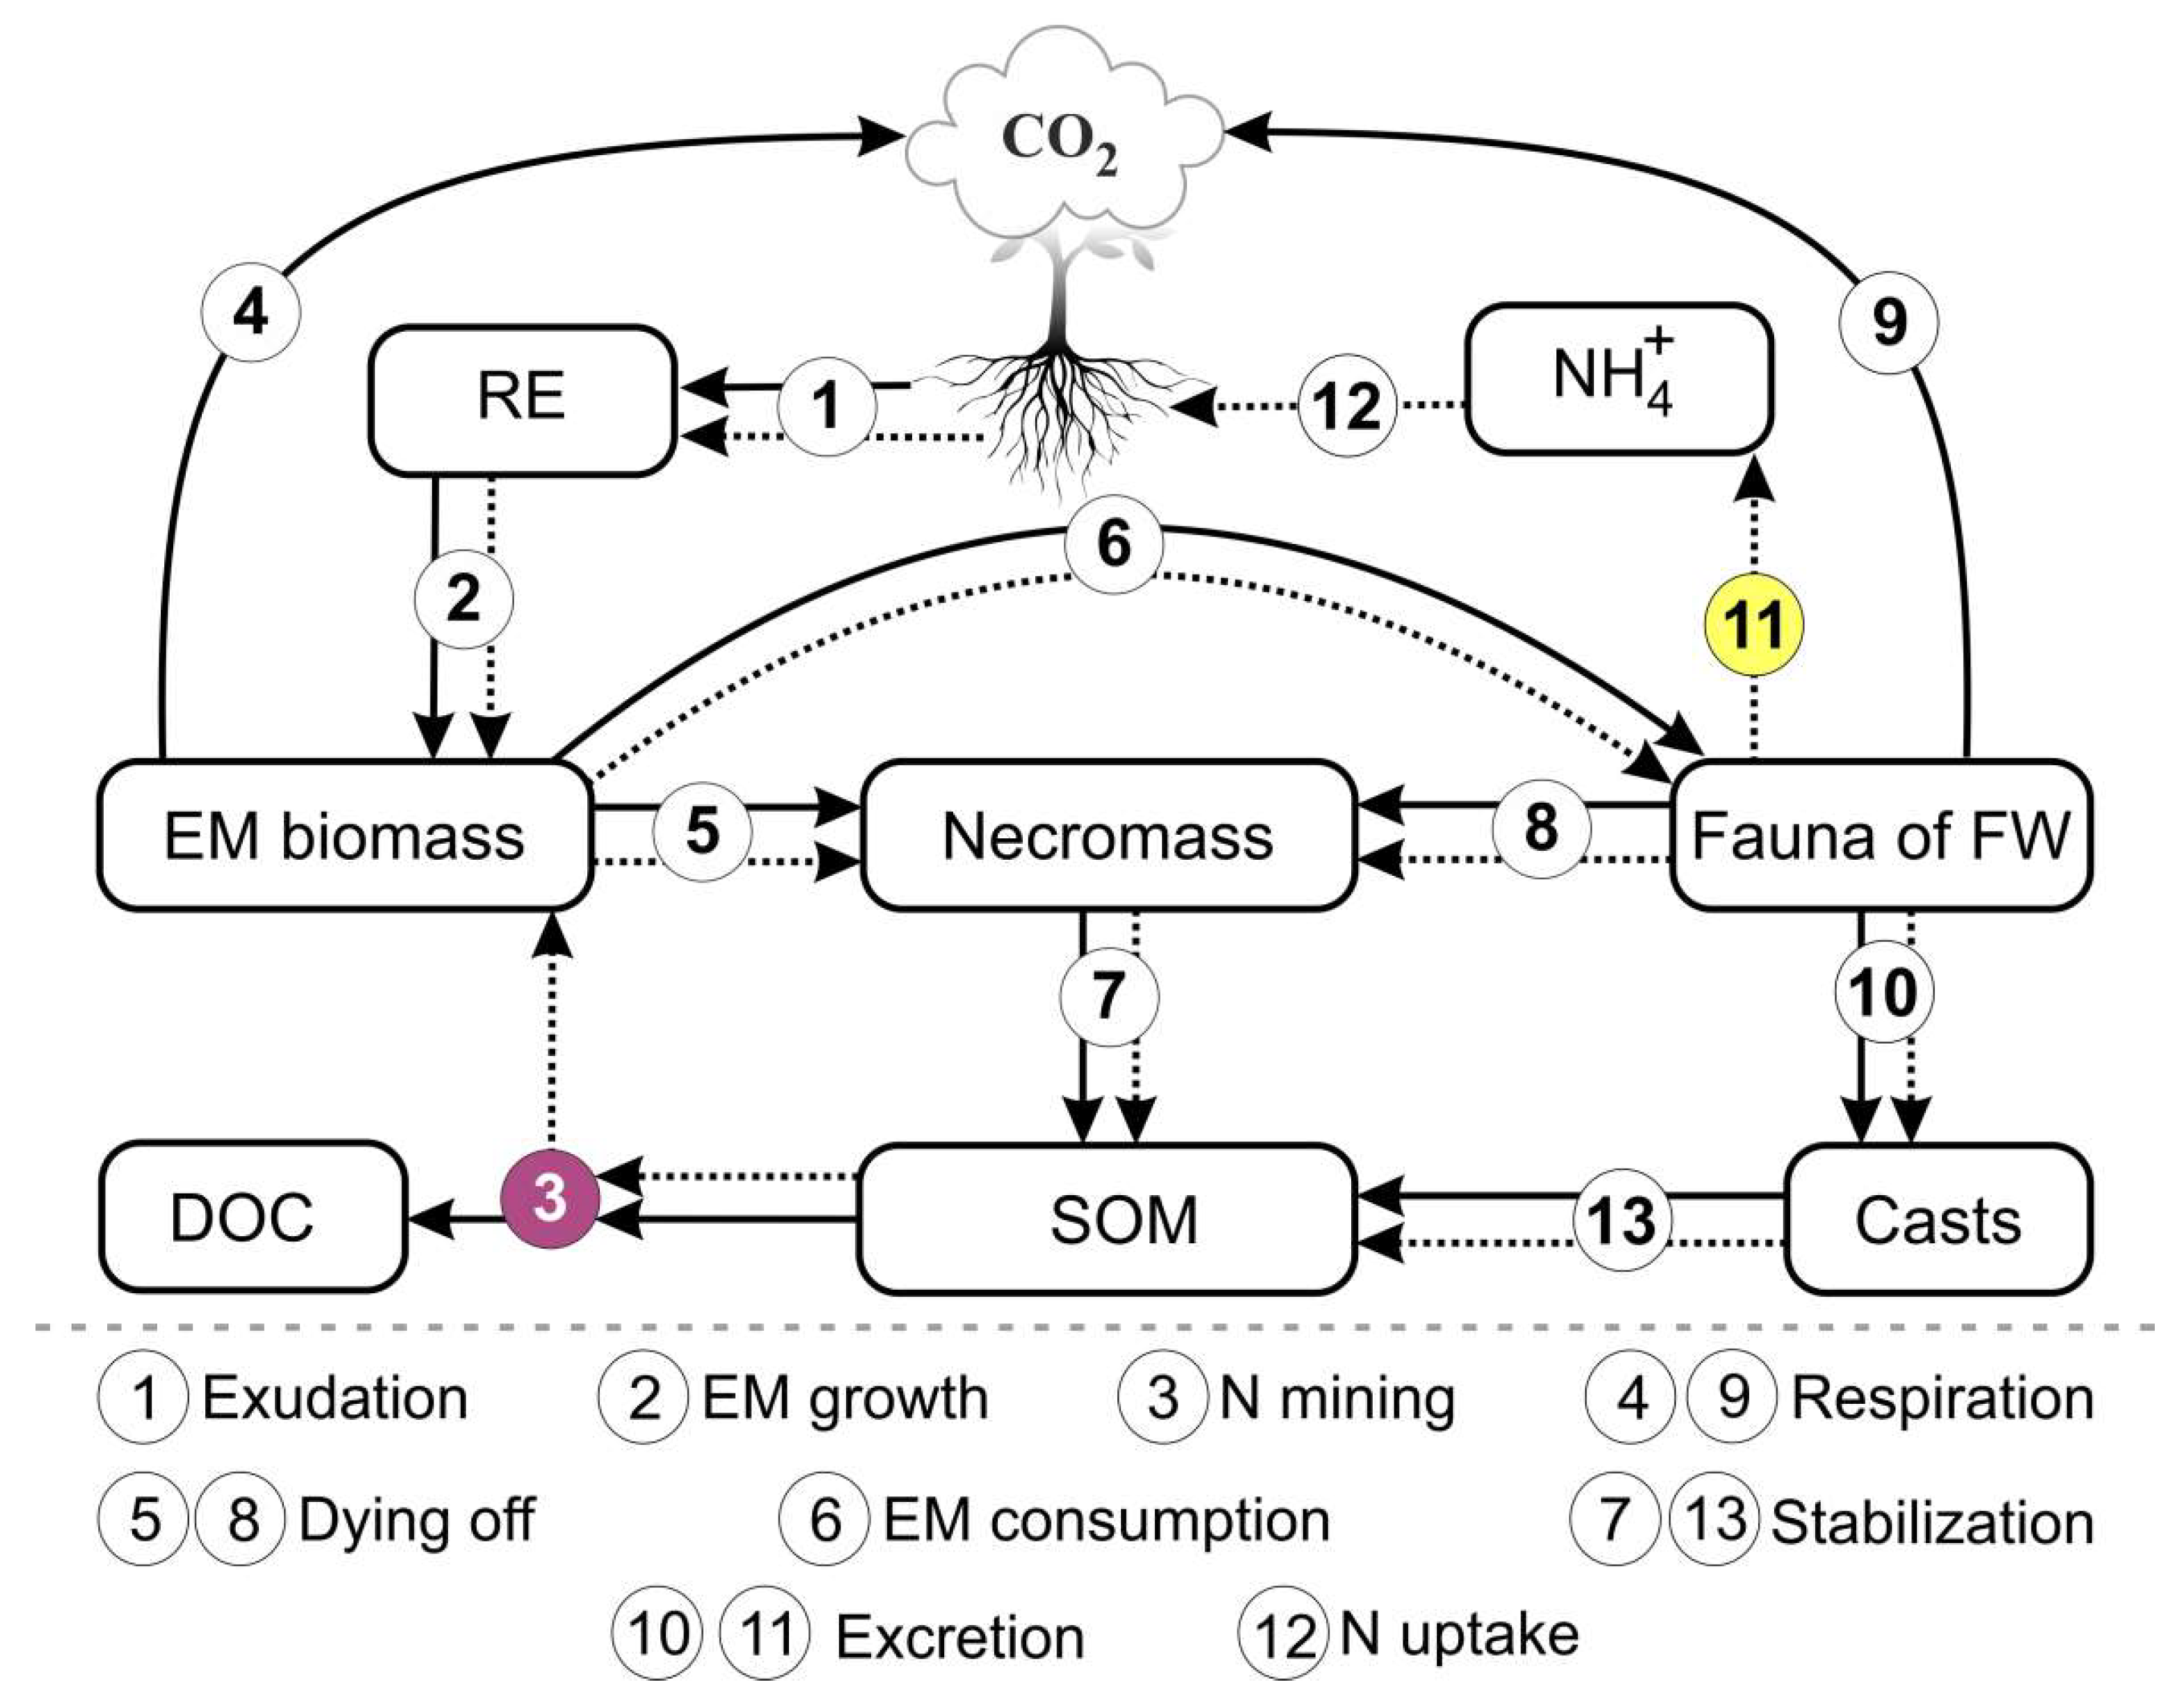
The outputs of the model are shown in Table 1. This list can be modified according to the specifics of the simulation tasks. The general scheme of the model is shown in Figure 1.
Figure 1.
Flowchart of the model of EMR functioning in forest soils. The solid lines represent C fluxes and the dotted lines represent N fluxes. The numbers in the circles represent the processes of EMR functioning reproduced in the model.
Figure 1.
Flowchart of the model of EMR functioning in forest soils. The solid lines represent C fluxes and the dotted lines represent N fluxes. The numbers in the circles represent the processes of EMR functioning reproduced in the model.
3. Sensitivity analysis
The analysis of model sensitivity to uncertainty in parameter estimation was carried out in the same way as for the priming model [21]. The approach of testing the sensitivity to each parameter in isolation is often criticised for its inability to account for the complexity arising from the possible non-linear interactions. Therefore, we used the approach proposed in [76]. According to this approach, we generated the uniform distributions for each input parameter in a range of ±30% from the default values. A dataset containing all possible combinations of parameter values was then compiled. The model was run for one year (365 daily time steps) for each record in the dataset, and the sum of EMM, soil micro-, meso- and macrofauna respiration () was calculated as the target variable, whose calculation involves (either directly or indirectly) all analysed parameters. Then, the multiple linear regression analysis of the standardised values ()
of the output variable with respect to the set of standardised values of the input parameters (I1 … In) was performed, where is the input parameter or target variable, is the mean value, and is the standard deviation. The standardised regression coefficients c0 … cn (the subscript 0 refers to an intercept) can be considered as a measure of the sensitivity of the model to the variation of a given parameter, while the value of the coefficient of determination, R2, indicates the non-linearity of the model (the lower the R2, the higher the non-linearity).
The results of the sensitivity analysis (Table 3) showed that the target variable is most sensitive to C:N ratios, especially those of EMR fungi. Other influential parameters include the respiration rates of the soil meso- and macrofauna. The analysis also showed that the model is almost linear.

Table 3.
Analysis of model sensitivity to uncertainty in input parameters.
| Parameter | Parameter Name | Standardised Coefficient of Linear Regression |
|---|---|---|
| C:N ratio of root exudates | −0.245*** | |
| C:N ratio of ectomycorrhiza | 0.723*** | |
| C:N ratio of soil mesofauna | −0.344*** | |
| C:N ratio of soil macrofauna | −0.164*** | |
| respiration rate of ectomycorrhiza | 0.238*** | |
| mortality rate of ectomycorrhiza | −0.0553*** | |
| consumption rate of ectomycorrhiza | 0.0730*** | |
| mortality rate of soil micro- and mesofauna | −0.0126*** | |
| consumption rate of soil micro- and mesofauna | 0.0167*** | |
| respiration rate of soil micro- and mesofauna | 0.326*** | |
| respiration rate of soil macrofauna | 0.142*** | |
| Intercept | ~0 | |
| R2 | 0.921 | |
Note: *** indicates the significance level (p < 0.001).
4. Model validation
Despite a very large number of publications on mycorrhizal symbiosis (cited in [14,15]), a number of papers on EMR dynamics with a complete dataset of environmental and physiological parameters of EMR functioning in forest ecosystems are not so abundant. We found 4 papers with sufficiently detailed data on mycorrhizal respiration, soil climate, EMM biomass production and soil properties. All papers were carried out on the same experimental plot at the same time. This allowed us to reconstruct all the input parameters and data necessary for the validation of the EMR model.
The comprehensive EMM respiration data from [77] were used to validate the model. In this paper, the average EMM respiration values for the spring, summer and autumn months are given for Larix gmelinii var. principis-rupprechtii plantations of 3 different ages (11, 25 and 45 years) located in northeastern China. Data from [78] were used to reconstruct the seasonal dynamics of mycorrhizal respiration. In this paper, seasonal dynamics of heterotrophic and autotrophic respiration (including mycorrhizal respiration), soil temperature and soil moisture are provided with a time step of 2 weeks. Data from [78] were interpolated to daily resolution using a cubic spline method [79]. The seasonal dynamics of mycorrhizal respiration was calculated in proportion to the seasonal dynamics of autotrophic respiration:
where is the Julian date ( denotes the total number of days for which the measured data are available), is the measured ectomycorrhizal respiration at DOY, is the measured autotrophic respiration at , is the mean daily ectomycorrhizal respiration.
Net primary production (NPP) data of different tree organs for these plantations from [80] were used to create an input dataset on the amount of root exudates entering the soil. The global root exudate flux is estimated to be about 9% (7–14%) of the global annual gross primary productivity (GPP) for mature trees [81]. At the same time, a number of studies estimate NPP to be 0.47±0.04 of GPP [82]. As stated in [83], the production of root exudates is proportional to the proportion of total NPP used for root growth. Therefore, the following equation was used to calculate root exudate (RE) production for 3 scenarios of exudate production rate and 3 stand ages:
where is the total NPP for stands aged 11, 25 or 45 years; is the proportion of root exudates in total GPP for 3 different scenarios of exudate production (0.07, 0.09 and 0.14, respectively); is the NPP of roots for stands aged 11, 25 and 45 years; is the total NPP for stand aged 45 years; is the NPP of roots for stand aged 45 years.
To reconstruct the seasonal dynamics of root exudate supply, it was assumed that the daily NPP is proportional to the amount of mineralised soil N. The dependence of the mineralisation rate on soil temperature and moisture from the Romul_Hum model [8] was used to calculate the seasonal dynamics of N mineralisation and, consequently, root exudate supply. Finally, ectomycorrhizal respiration calculated by the model was compared with measured data from [77] using Theil’s U index of inequality (0…1; [84]):
where n is the number of observations, ot is the observed EMM respiration at day t, mt is the simulated EMM respiration at day t. The case where U = 0 corresponds to full identity of measured and simulated values.
Figure 2.
Comparison of measured and simulated seasonal dynamics of ectomycorrhizal respiration for stands of different ages. U is the Theil’s U index of inequality.
Figure 2.
Comparison of measured and simulated seasonal dynamics of ectomycorrhizal respiration for stands of different ages. U is the Theil’s U index of inequality.
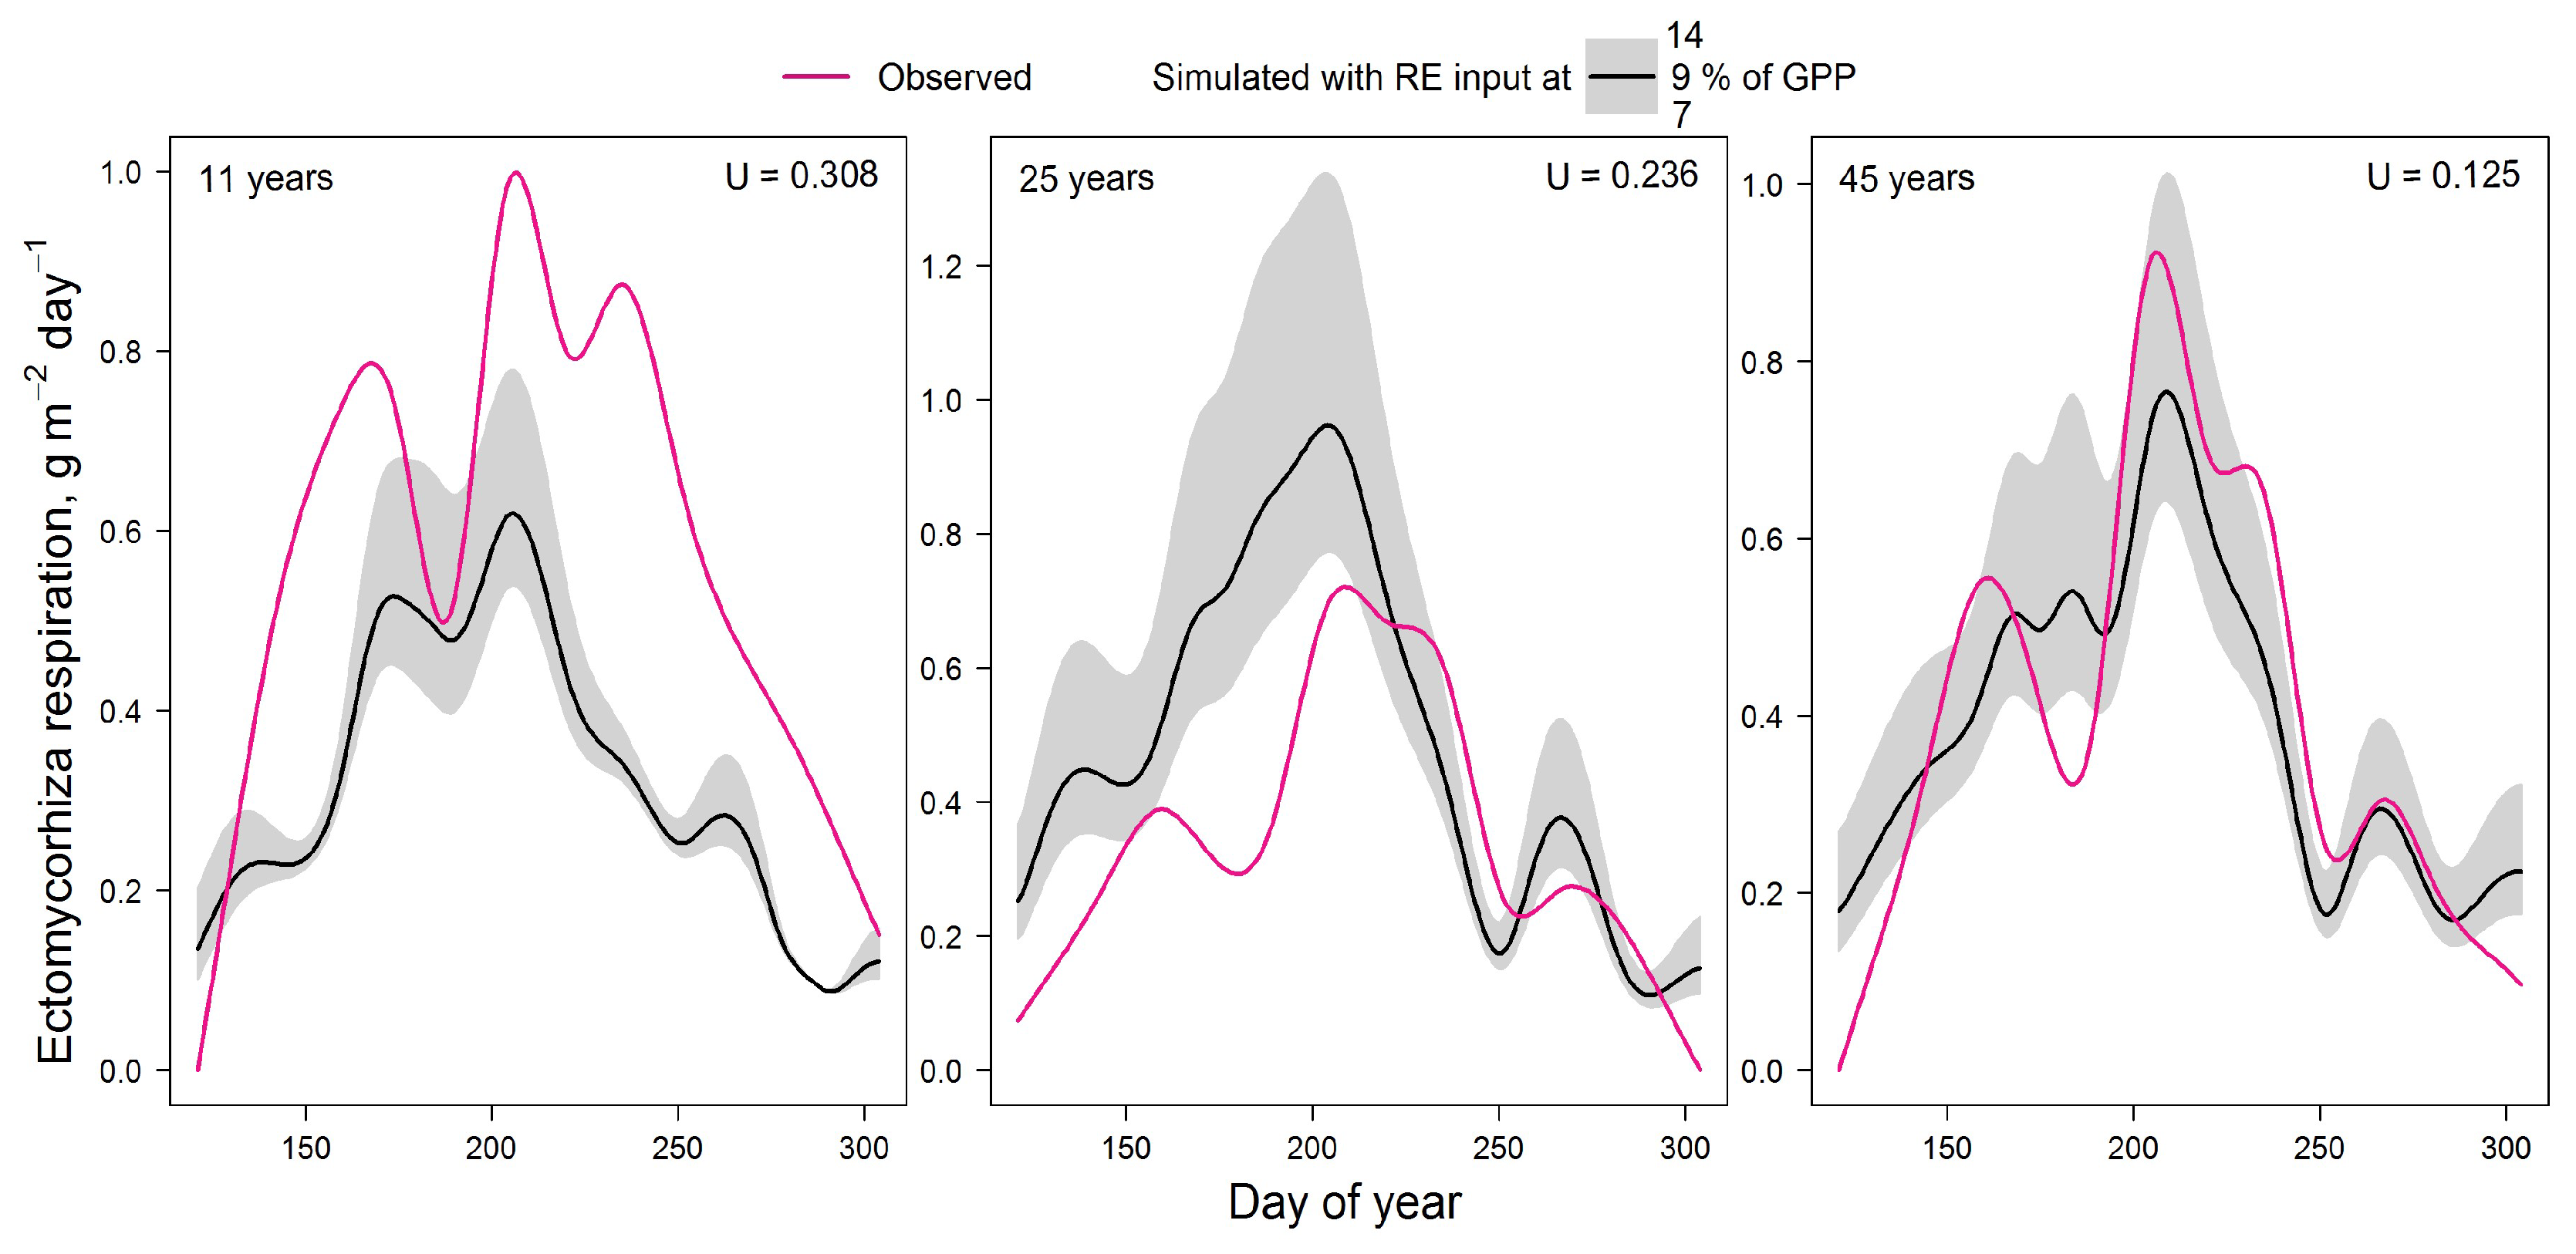
The validation results (Fig. 2) showed that the model underestimates EMM respiration in very young plantation with low stand density. However, the model overestimates respiration in dense 25-year-old forest. The best agreement between experimental and simulated data was obtained for 45-year-old larch forest. The low Theil’s U index in all cases indicates the satisfactory results of this validation.
5. Testing the EMR model
The EMR model was tested using data from the 1 ha (100×100 m) permanent sample plot in a mixed uneven-aged forest on Albic Luvisol dominated by Pinus sylvestris L., Betula spp. and Picea abies L. The forest community is located in the Prioksko-Terrasny Biosphere Reserve, south of the Moscow region, Russia (54.88876° N, 37.56273° E). Information on the vegetation and soils of this site are presented in publications [68,85].
The vegetation composition and soil conditions vary considerably within the plot, which was taken into account in the simulations. According to the formulation of the EFIMOD3 model, the computational experiments took into account the spatial heterogeneity of the distribution of tree roots, depending on species-specific features, location, size and age of the trees. The spatial distribution of root biomass in turn determined spatial differences in the autotrophic respiration rates calculated in EFIMOD3 and the amount of root exudates input into the EMR model. In addition, the spatial structure, species composition and size class distribution of the simulated stand determined spatial differences in the input of species-specific fractions of above- (needles and leaves, branches, stems) and belowground (fine and coarse roots) litter, as well as soil hydrothermal conditions, which influenced the pools and mineralisation rates of SOM in EFIMOD3.
We compared the values of autotrophic (tree roots) and heterotrophic (bacteria and non-mycorrhizal fungi) soil respiration calculated by EFIMOD3 and ectomycorrhizal respiration calculated by the EMR model. In addition, we compared the amount of available nitrogen from SOM decomposition calculated by EFIMOD3 and the amount of ammonium nitrogen (N-NH4) calculated by the EMR model as a pool of micro- and mesofauna excreta.
All calculations were performed on a simulation grid of 100×100 m, divided into 10,000 cells of 1×1 m, for a period of 5 years with a daily time step. This allowed us to assess the possible variation of the indicators (components of soil respiration and nitrogen formed in FWs) both in time and in space. The first (temporal) is reflected in the variation of values between different dates of specific years or terms of the growing season. The second (spatial) is related to the distribution of the fine roots of the trees over the simulation plot and is reflected in the ranges between minimum and maximum values for each specific day of the simulation period.
The calculation of the amount of root exudates for the EMR model was carried out similarly to the validation and the same C:N ratio of RE (equal to 40) was used. Temperature and moisture dynamics of the organic layer and mineral soil were simulated using the observed data on air temperature and humidity and precipitation for 2016–2020 measured at the EMEP station “Danki” located in the reserve [86,87].
The results of the estimation of the 5-year cycle of soil C-CO2 emission fluxes (autotrophic, mycorrhizal and heterotrophic) are presented in Fig. 3. All calculated fluxes show a remarkable temporal and spatial variation. The maximum of all fluxes corresponds to the middle of the growing season (July). The main contribution to the total soil respiration is made by heterotrophic respiration, whose share varies from 45% in summer to 95% in winter, against the background of a corresponding decrease in the average total flux of C-CO2 from 3.5 to 0.4 g m−2 day−1 from July to December (Fig. 4).
In the first half of the growing season (April–June), ectomycorrhizal respiration is estimated by the EMR model at an average of 0.25–0.3 g m−2 day−1 (in terms of C), and at 0.35–0.4 g m−2 day−1 in the second half (July–September). The dynamics of ectomycorrhizal respiration rates correlate with autotrophic (stand) respiration rates, which follows from the general statements of the EMR model. The 5-year average estimates for the growing season (April–October) show that EM respiration can reach 35–60% of the autotrophic C-CO2 flux and up to 15% of the respiration of soil bacteria and non-mycorrhizal fungi.
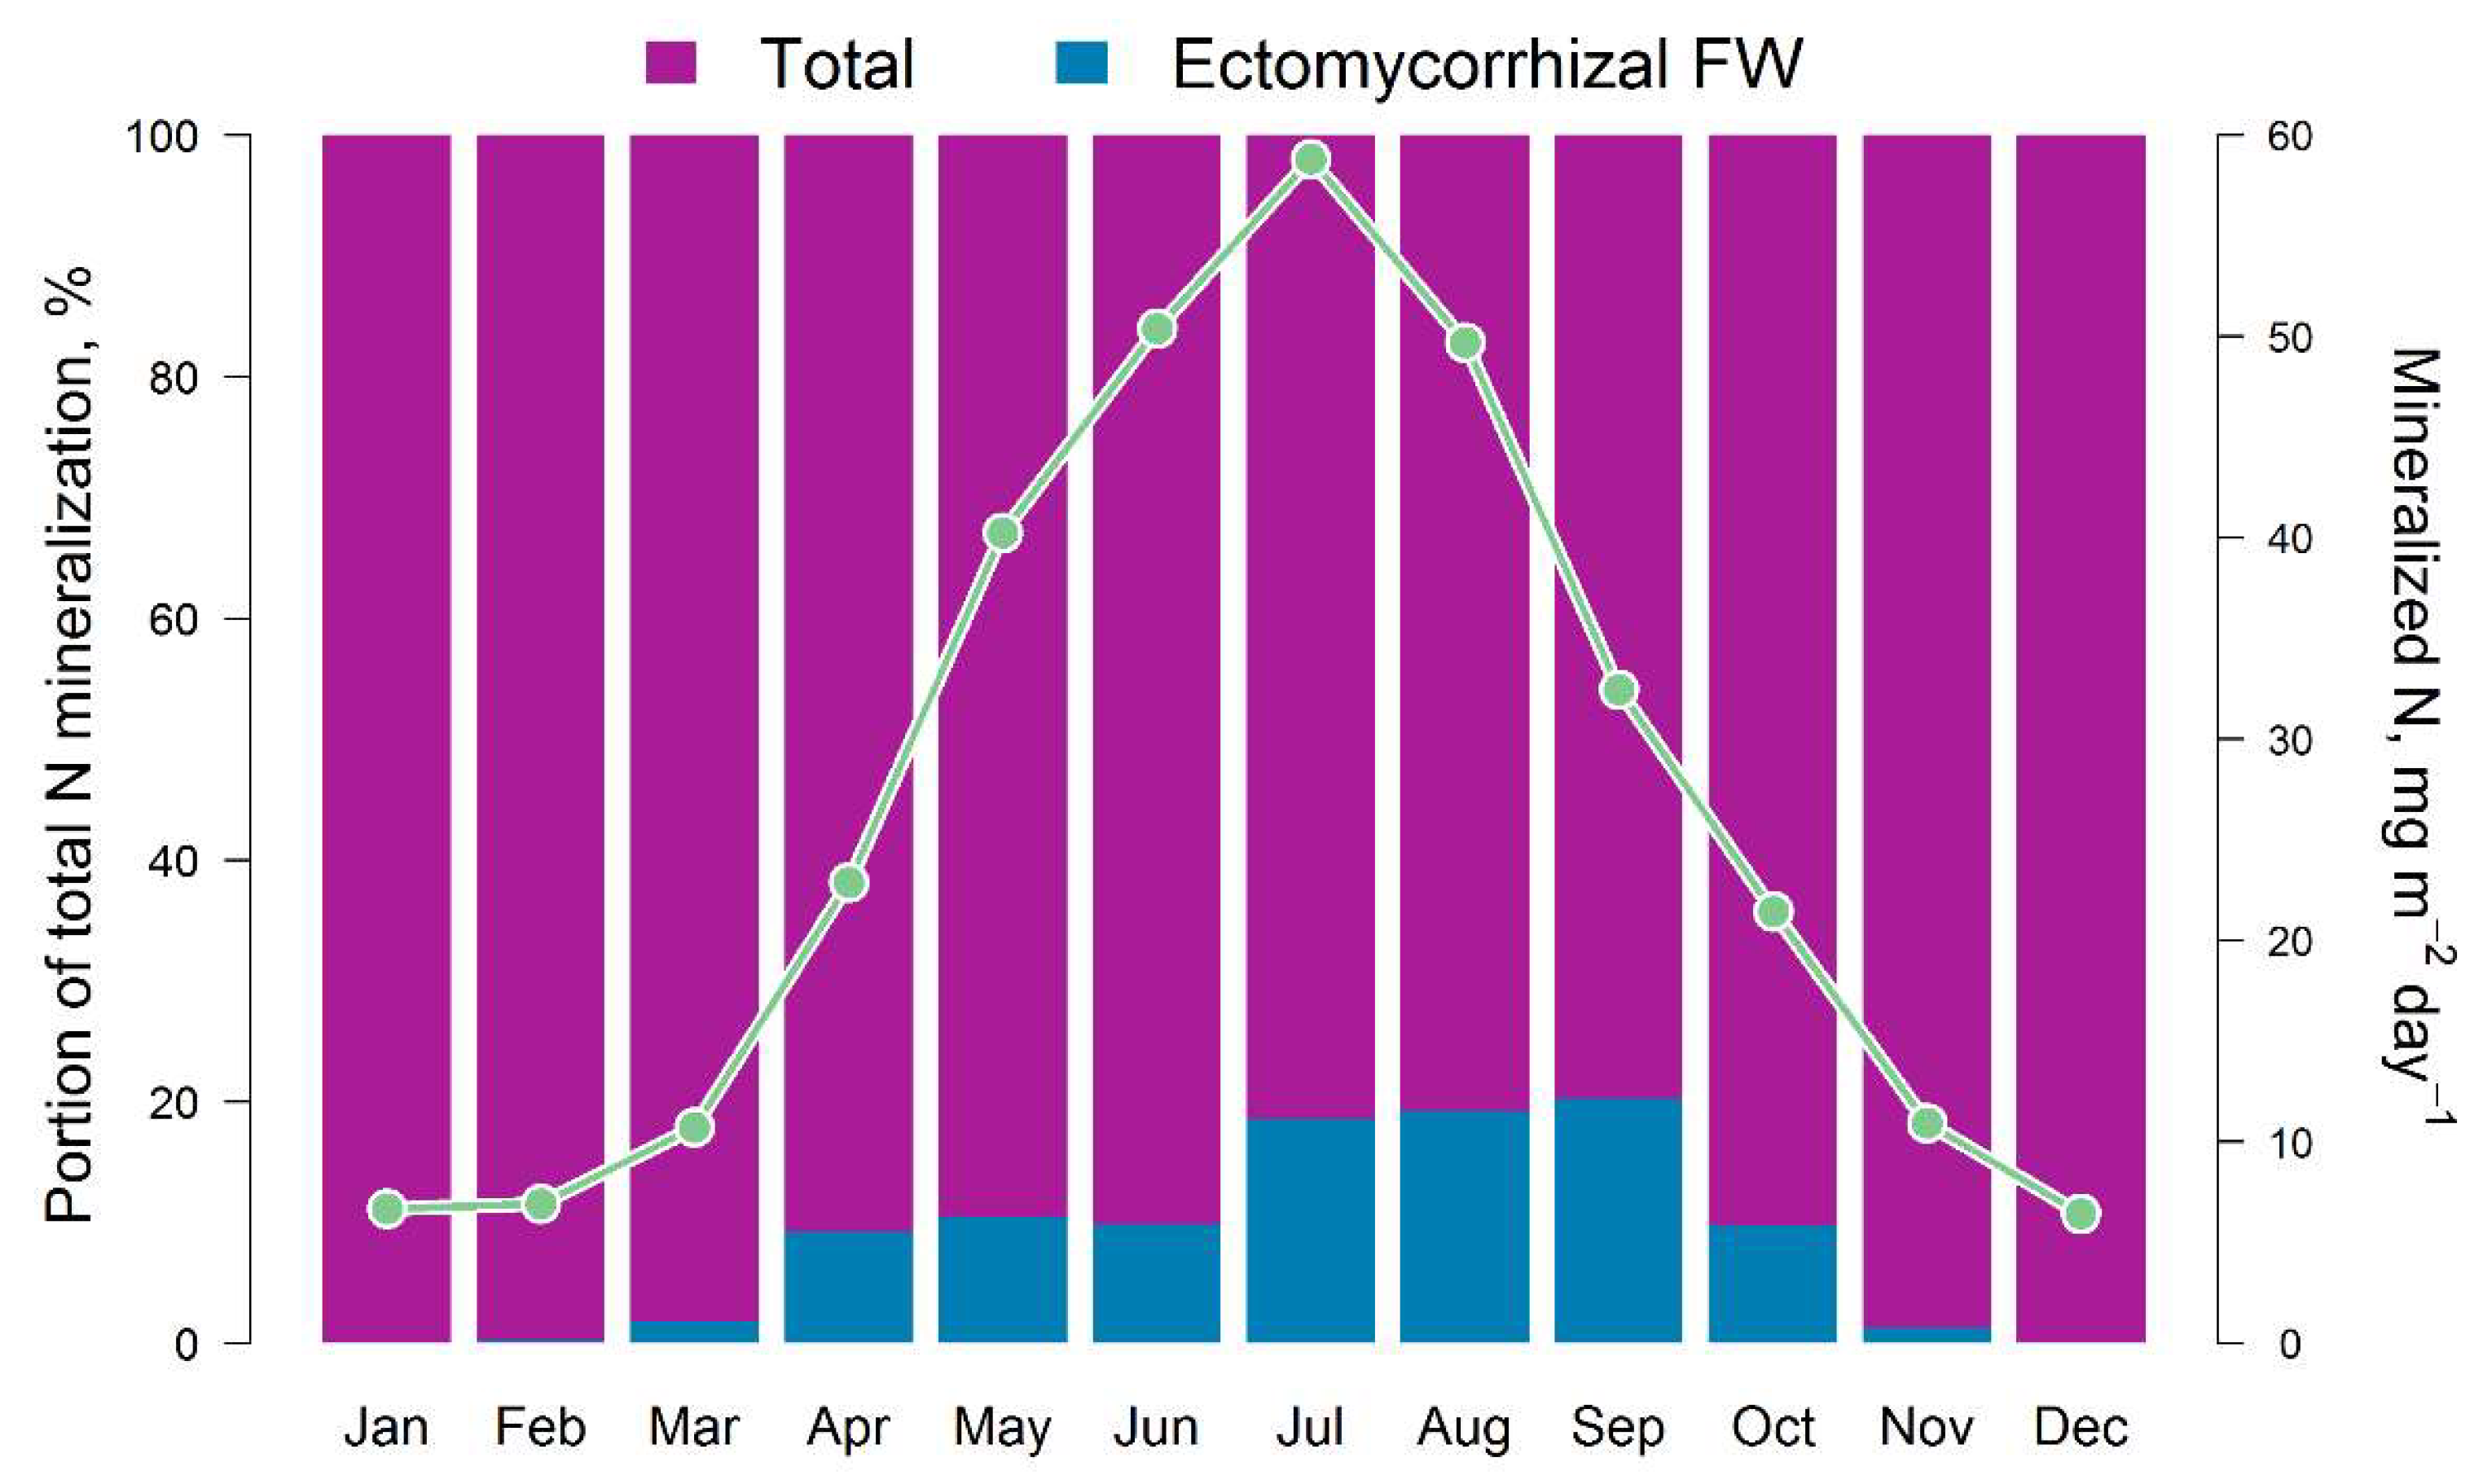
The results of the comparison of the N pools available to plants calculated by the EFIMOD3 and EMR models are shown in Fig. 5. The obtained patterns of dynamics of these indicators are similar to the dynamics of C-CO2 fluxes mentioned above. The amount of ammonium nitrogen (N-NH4) formed in soil food webs during the summer months (June–August) is estimated by the EMR model to be 5–10 mg m−2 day−1 on average (in terms of N) with a range of variation from close to zero values to 40 mg m−2 day−1. The 5-year average estimates for the growing season (April–October) show that the pool of ammonium N formed as by-products of micro- and mesofauna activity in soil food webs can reach 10–12% of the total pool of available N formed during SOM mineralisation (Fig. 6). It should be noted that another noticeable fraction of the EMR-derived N comes to trees via the decomposition of the labile SOM pool of faunal excreta. In addition, we found that the total C of the EMM-derived casts of micro- and mesofauna of the food webs varied between 0.1 and 0.3 t ha−1 for 3 months of summer.
Figure 3.
Simulated soil fluxes of C-CO2 for the simulation plot (10,000 cells, light grey): Rh is the heterotrophic respiration, Ra is the autotrophic respiration (tree roots), Rm is the ectomycorrhizal respiration. Bold lines indicate mean values over the simulation plot.
Figure 3.
Simulated soil fluxes of C-CO2 for the simulation plot (10,000 cells, light grey): Rh is the heterotrophic respiration, Ra is the autotrophic respiration (tree roots), Rm is the ectomycorrhizal respiration. Bold lines indicate mean values over the simulation plot.
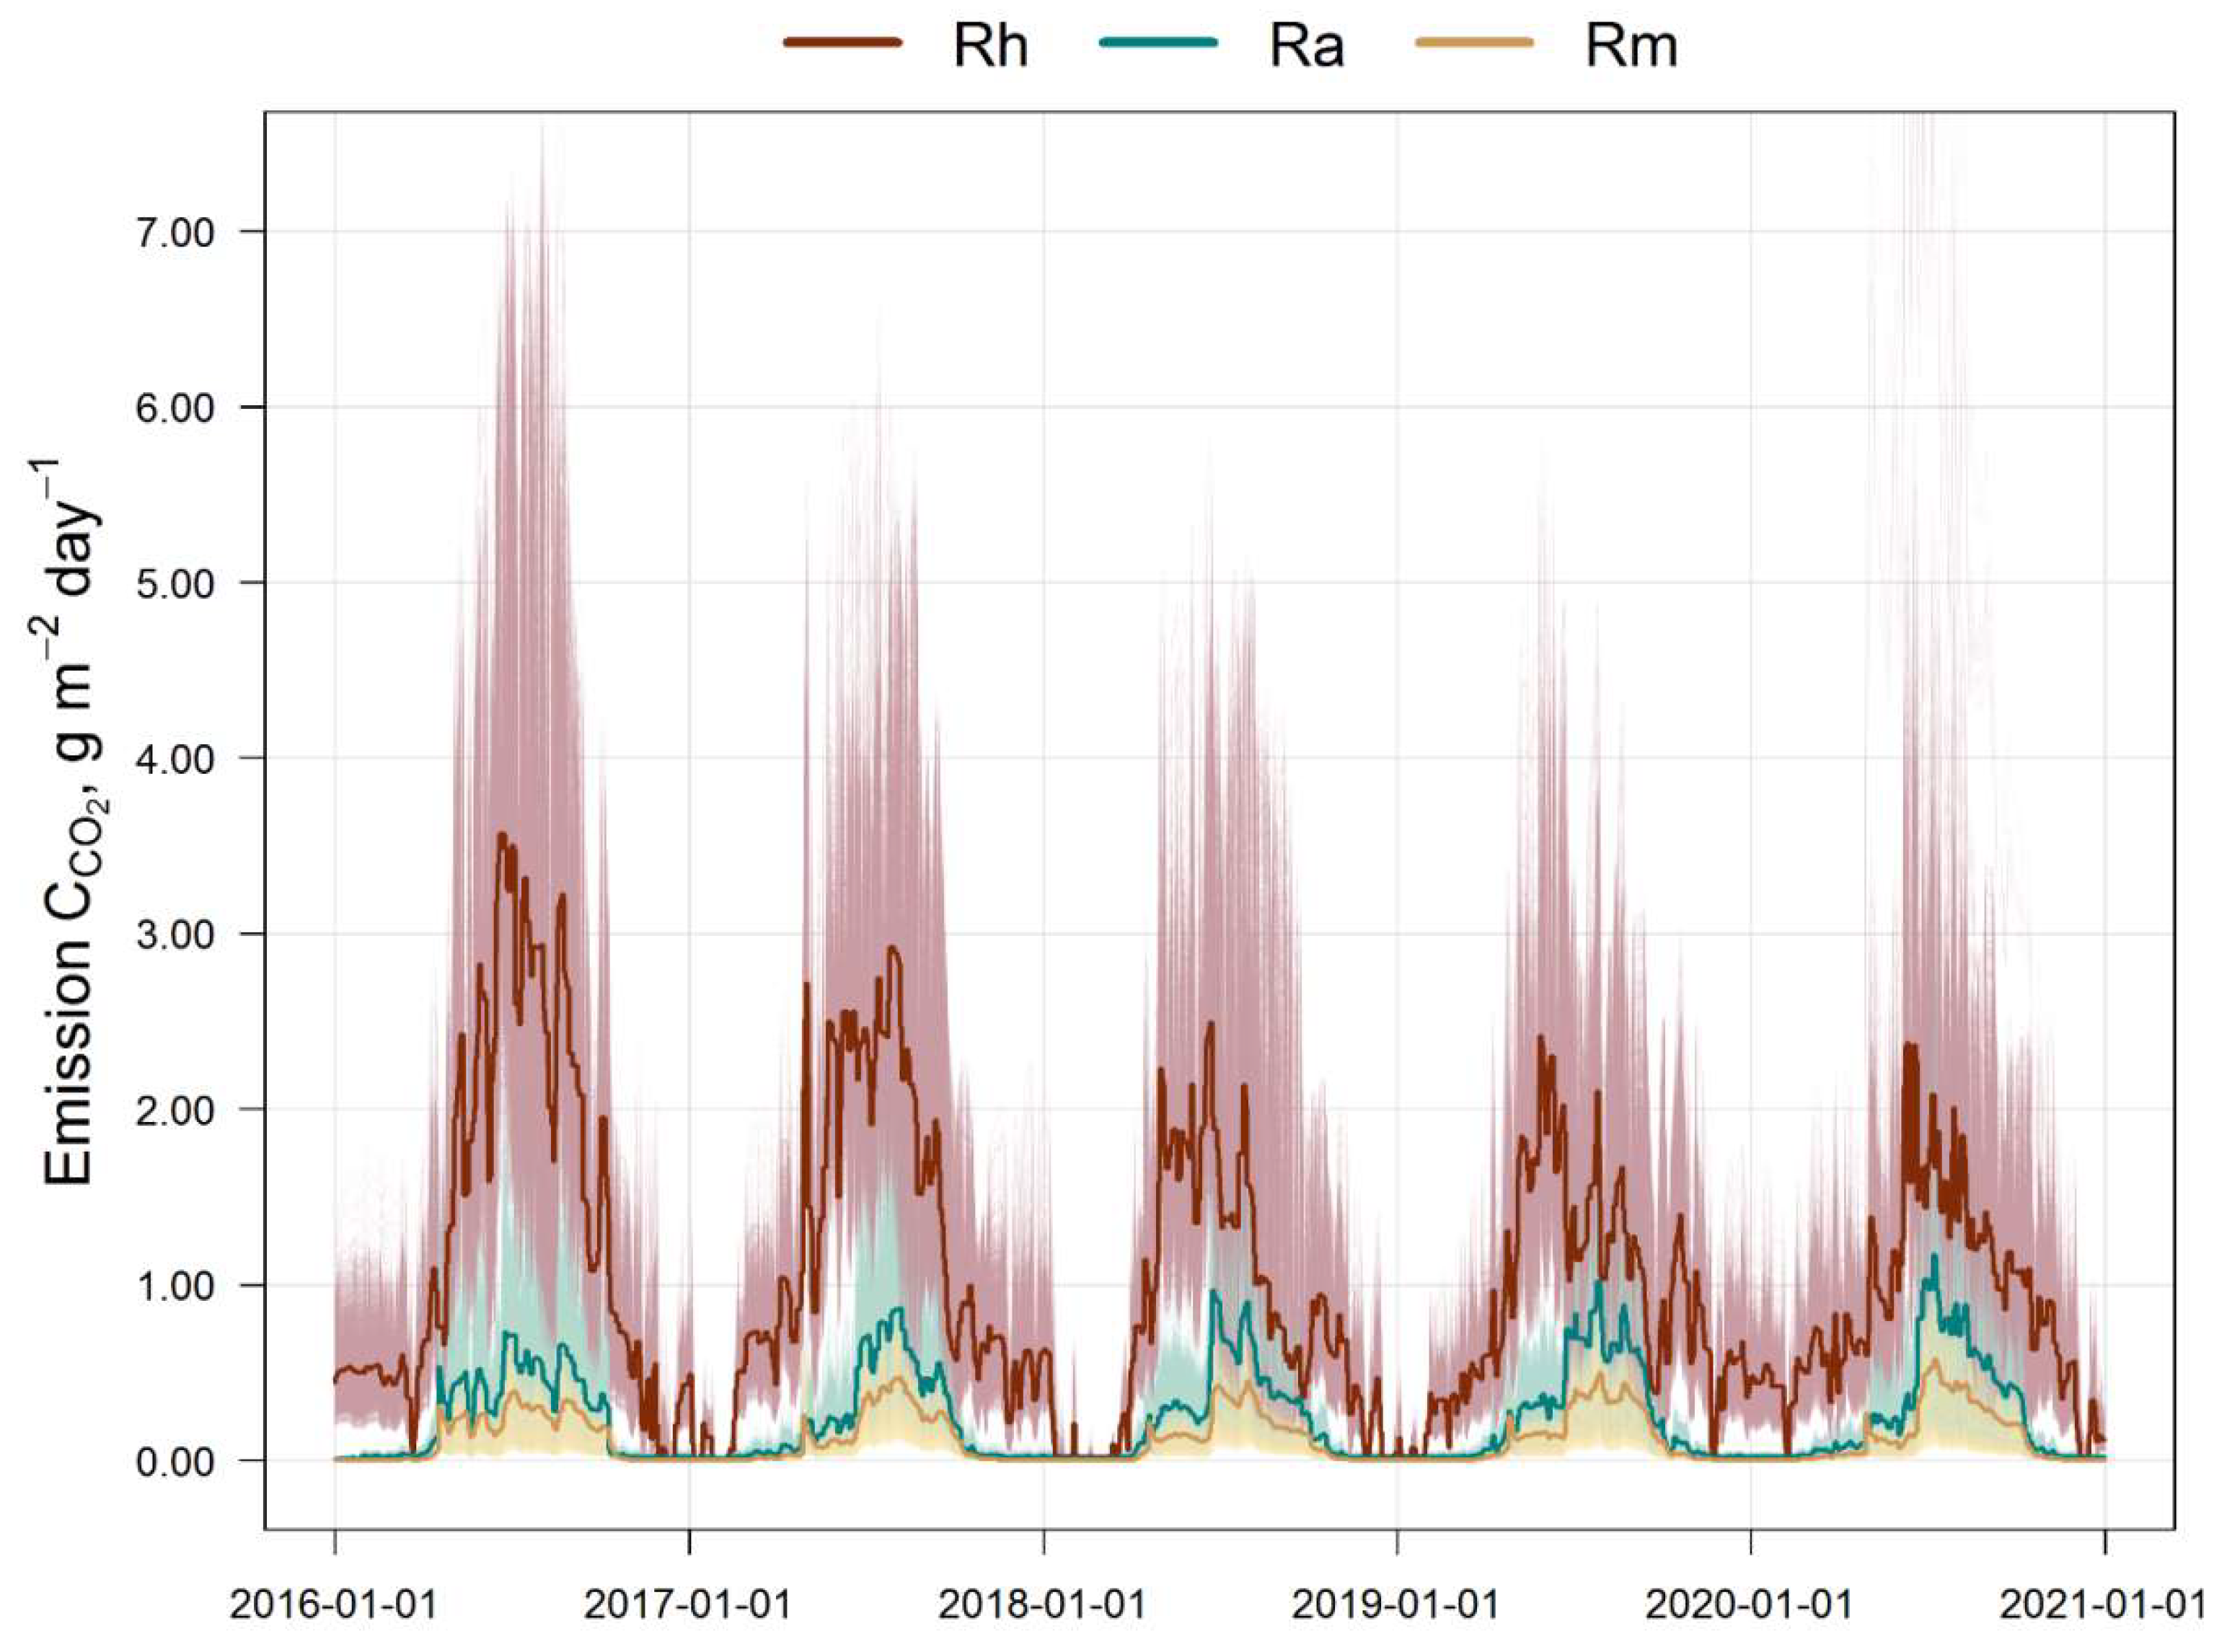
Figure 4.
Simulated intra-annual dynamics of total soil respiration (monthly averages for 5 years) and the ratio of mycorrhizal (Rm), autotrophic (Ra) and heterotrophic (Rh) fluxes of C-CO2.
Figure 4.
Simulated intra-annual dynamics of total soil respiration (monthly averages for 5 years) and the ratio of mycorrhizal (Rm), autotrophic (Ra) and heterotrophic (Rh) fluxes of C-CO2.
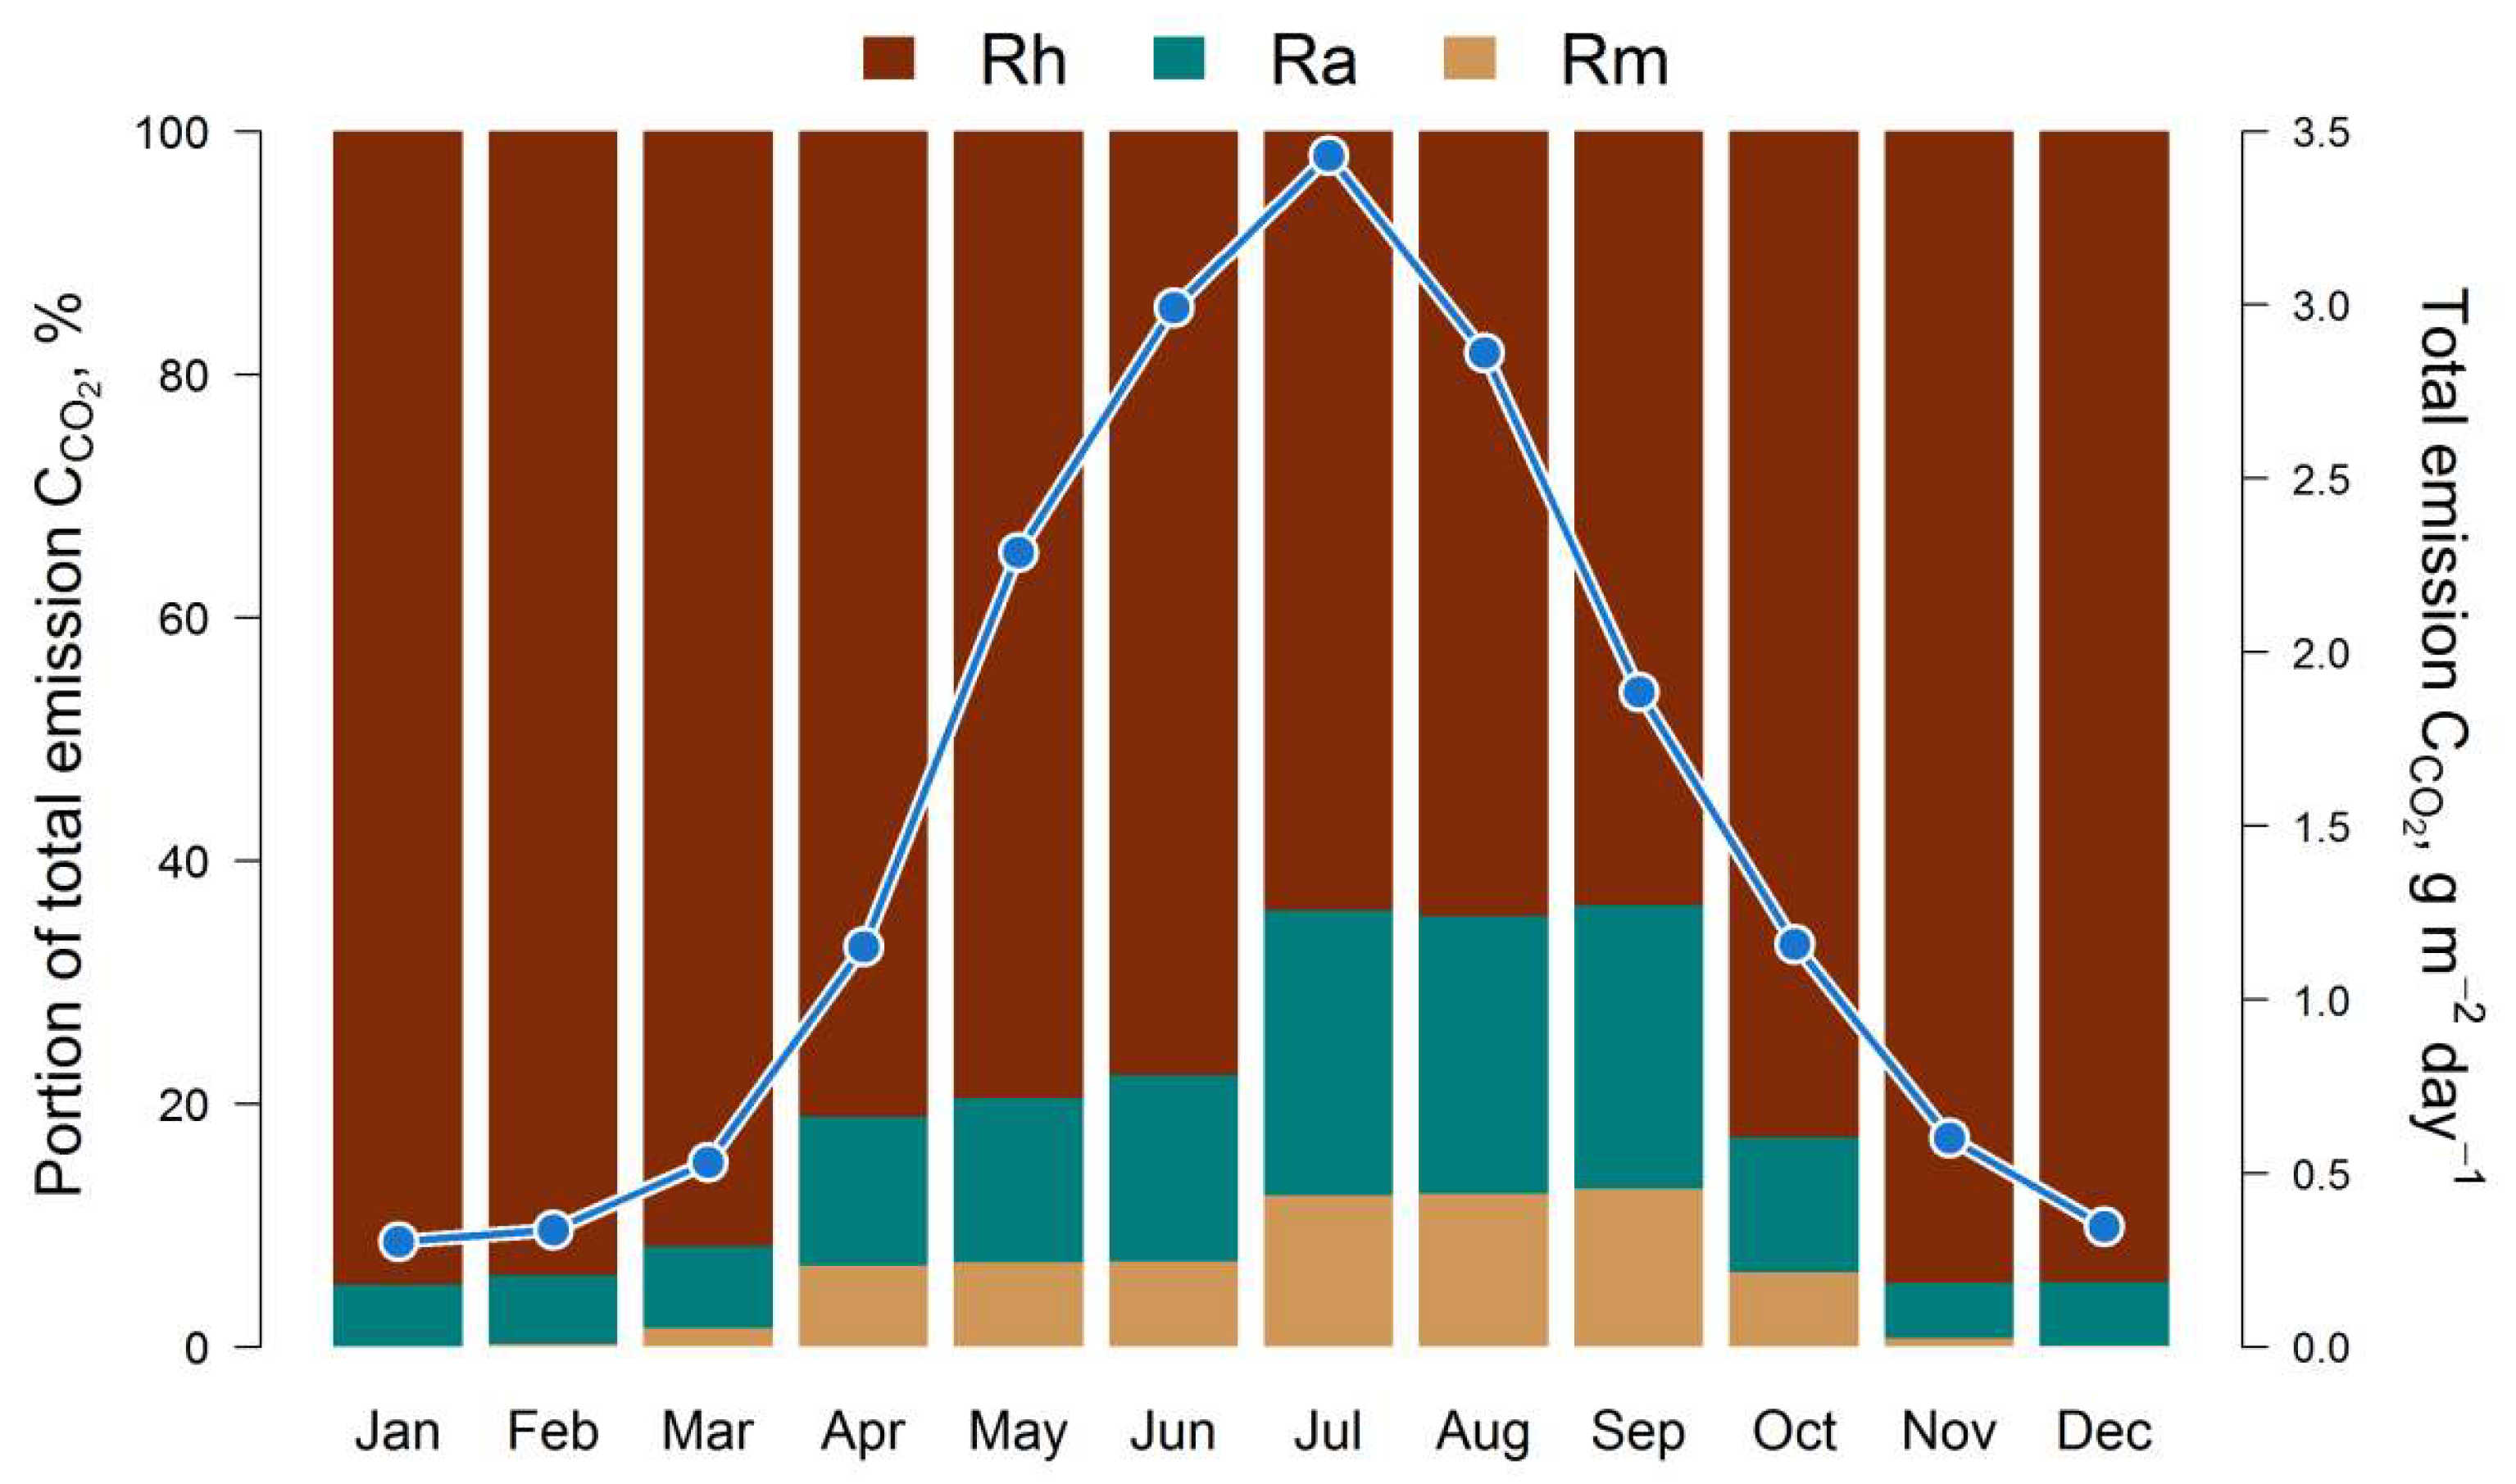
Figure 5.
Simulated dynamics and variation of the total pool of available nitrogen calculated by EFIMOD3 (Total) and N-NH4 calculated by the EMR model (Ectomycorrhizal FW) for the simulation plot (10,000 cells).
Figure 5.
Simulated dynamics and variation of the total pool of available nitrogen calculated by EFIMOD3 (Total) and N-NH4 calculated by the EMR model (Ectomycorrhizal FW) for the simulation plot (10,000 cells).
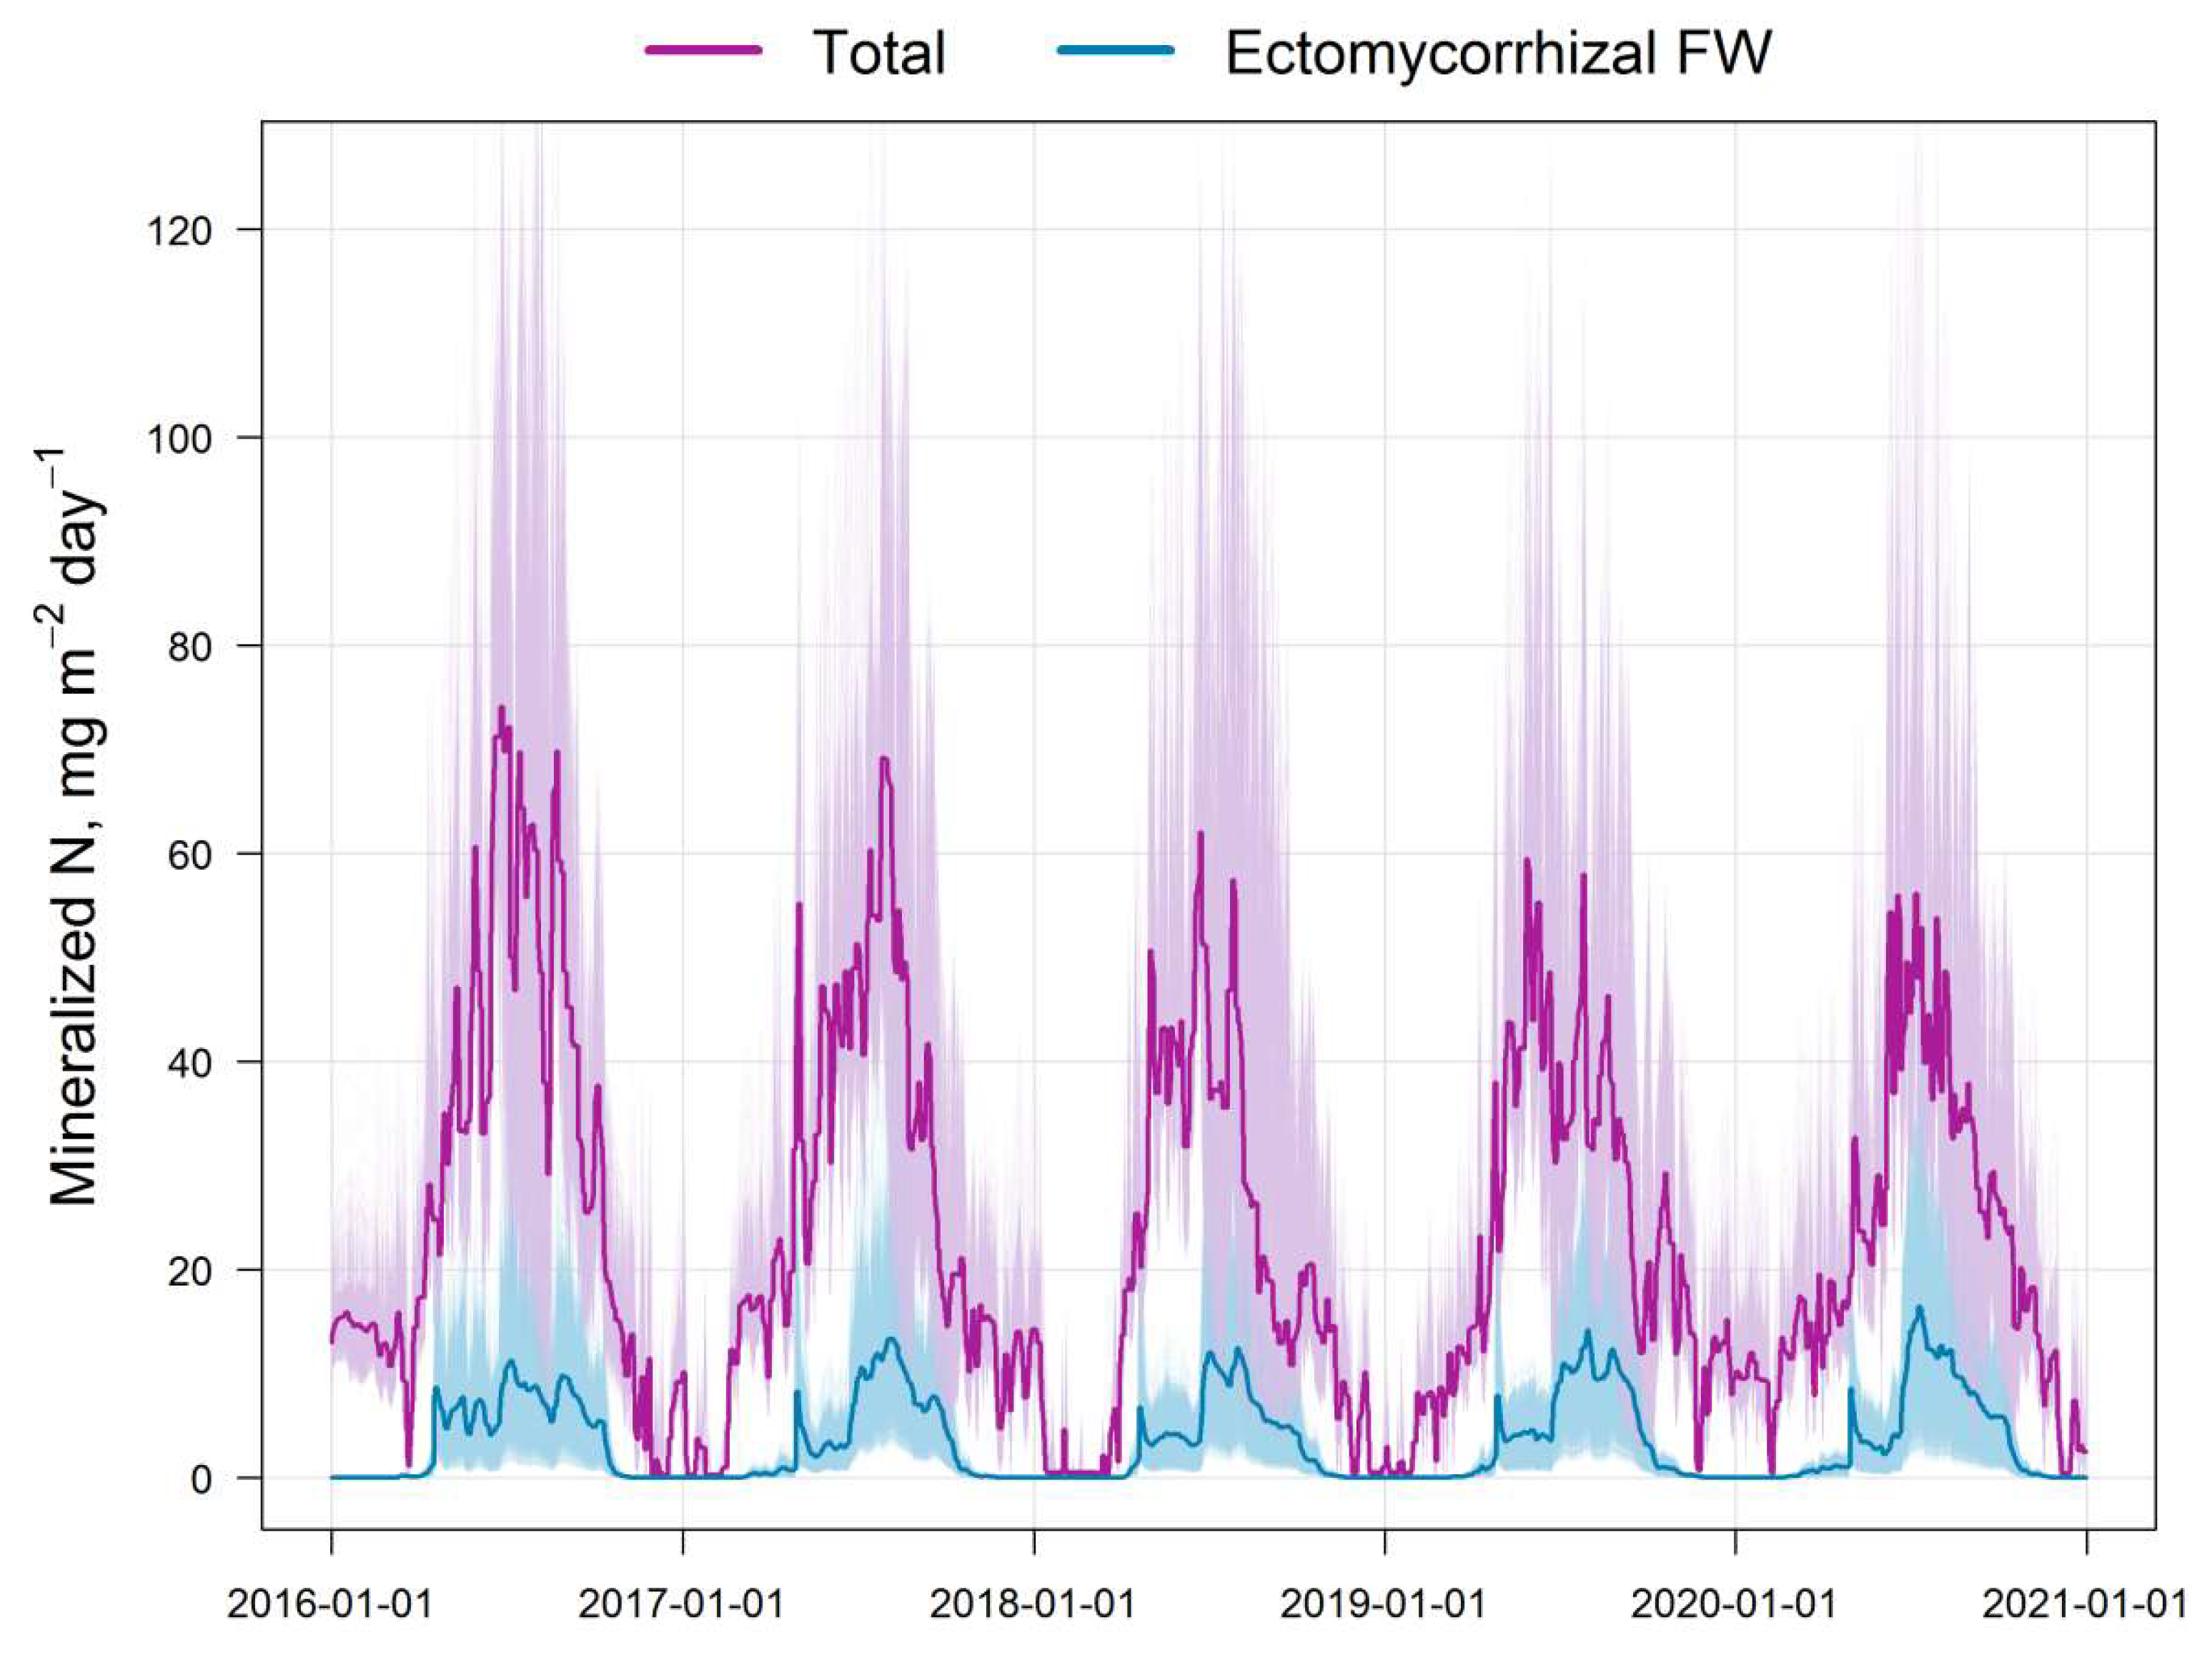
Figure 6.
Intra-annual dynamics of the total pool of available N in the soil (monthly averages for 5 years) and the ratio of available (Total) and ammonium N fluxes (Ectomycorrhizal FW) calculated by EFIMOD3 and EMR models, respectively.
Figure 6.
Intra-annual dynamics of the total pool of available N in the soil (monthly averages for 5 years) and the ratio of available (Total) and ammonium N fluxes (Ectomycorrhizal FW) calculated by EFIMOD3 and EMR models, respectively.
6. Discussion
Currently, there are two main concepts of the symbiotic interaction between plant and EMR [28,88]: (i) mutualistic with direct exchange of resources between plant and fungi (“carbon by nitrogen”), and (ii) indirect effect of EMR on the host plant with a specific pathway of N return from EMM to plant roots via EMM decomposition. The proposed model is an attempt to quantify the second approach, with EMR as an obligate biotroph that consumes all C, N and, moreover, SOM-derived additional “mined” N from RE for its own growth only, thus actually acting as a commensal. N return to the plant occurs through the fast cycle of EMM transformation and decomposition by the biota of the soil food webs, including the activity of microorganisms, micro- and mesofauna [40]. The majority of recent EMR models describe EMM growth without this N feedback to the plant, with the exception of [4], which calculates different pathways of N acquisition.
The structure of the proposed model has been developed for integration into the forest ecosystem model EFIMOD3. Therefore, the model is focussed on N production for tree growth and C turnover and sequestration in the soil. Both tasks were solved by incorporating food webs into the model structure by establishing a previously missing N-rich “fresh and free” SOM pool of faunal excreta with a solid phase organic matter not yet bound to R2O3, Ca and clay minerals.
The sensitivity analysis revealed a leading role of C:N ratio in root exudates, EMM and soil fauna biomass. In principle, the same effect has already been described in the simulation model of the rhizosphere priming effect [21].
In the model validation, the underestimation of simulated EMM respiration (compared to observed values) in sparse tree plantations (aged 11 years), where soil patches without tree roots may occur, can be a result of an overestimation of respiration for the entire experimental plot. The other reasons could be both high metabolic activity of young trees and differences between actual and simulated soil properties on the study plot, as the soil was assumed to be the same in all simulation scenarios. The overestimation of simulated respiration in the 25-years-old stand was apparently related to an unaccounted effect of a colder microclimate in dense stands of this age [89,90]. The overestimation of simulated respiration in early spring and late autumn may be related to the unaccounted influence of short daylight hours.
The results of the test simulations in a frame of the EFIMOD3 system also showed the same order of magnitude as the experimental data [91,92,93].
The excess carbon of root exudates forces EMM to mine N for biomass growth from protected stable SOM with a low C:N ratio. The model allows the calculation of the amount of N mined for the growth of short-living EMM. It provides an opportunity for a more accurate assessment of the EMR contribution to the N budget of the forest ecosystem.
EMM produces a lot of DOC during N mining [24]. This occurs because EMM first depolymerises large polymer molecules into soluble OM with low molecular weight. Then, EMM extracts and uses only N-rich OM, and does not consume the rest as other saprotrophic microorganisms do. The proposed model is, to our best knowledge the first to include this specific EMR-derived DOC pool in the calculation of SOM dynamics.
A significant detail is that the concept prevailing now assumes that microbial-derived DOC is a significant source of SOC sequestration on minerals surfaces [94]. However, soil microorganisms produce DOC for their own use at a first stage of nutrient consumption, i.e. during SOM decomposition [41]. Therefore, microorganisms have a limited capacity for free DOC production and consequently for SOM formation (in a process of SOM decomposition). Logically, DOC in forest soils can be mainly represented by the mycorrhiza-derived substances obtained from the specific SOM depolymerisation during N mining.
Furthermore, if the activity of food webs fauna is excluded from the processes of EMM transformation and decomposition (as in the vast majority of biogeochemical and microbiological SOM decomposition models), the capacity of EMR for SOM sequestration will be significantly reduced. In this case, the intermediate product of decomposition will be the small amount of DOC that is bound only by clay minerals. Soil minerals have a limited sorption capacity with the possibility of “carbon saturation” [94] compared to the unlimited potential of the coprolite formation (excretes, casts) of micro- and mesofauna. These are micromorphologically visible structures [95,96] that can be further protected in soil by R2O3 or Ca2+.
The calculated total production of faunal casts (in terms of С) can reach 0.1–0.3 t ha−1 for 3 summer months in a temperate broadleaved-coniferous forest, as was found in the model experiments. This value is only three times lower than the cast production by earthworms, which varies from 0.1 to 1.0 t ha−1 (in terms of С) during the growing season (adopted from [97,98]). The casts from EMM-derived litter are processed by the gut microbiomes of soil micro- and mesofauna. Apparently, they play the same role as the “carbon trap” mediated by earthworms [99].
EMM was rather rapidly consumed by soil biota [45,100], with C being returned to SOM as the above-mentioned solid-phase pool of faunal metabolites. They are used for organic C sequestration and also to increase the amount of N available to roots in the case of this young N-rich organic matter mineralisation. The balance between these two processes depends on biological and environmental factors. This cycle has not yet been considered in mycorrhizal models and is therefore a task for future research.
The formation of available ammonia N in food webs is an additional factor in the positive effect of EMR with the significant increase in tree growth. This occurs because some excess N is produced during the consumption of microorganisms (including EMM) by soil fauna, as a significant proportion of food C is used for faunal respiration [48,49,51].
From an ecological point of view, the results of this model validation and test prove that the representation of mycorrhiza as a “commensalist” can be a main pattern to describe the functioning of EMR in forest ecosystems. EMR “works for itself”, but its positive effect on tree growth can be explained by the rapid transformation and decomposition of EMM by all soil biota, including microorganisms and fauna of soil food webs. In other words, the mycorrhizal symbiosis can be represented as a triad of biological actors: “roots – mycorrhiza – all soil biota” [40]. They are functionally and perhaps evolutionally linked in the forest ecosystem. New data are needed to specify the processes of N mining, DOC formation, food web activity and natural mortality of EMM.
In the described model, there are no pathways for direct resource exchange between host plant and ectomycorrhiza (carbon from plant for nitrogen from ectomycorrhiza). Nevertheless, the satisfactory results of the model validation show that the positive effect of EMR on the plant with the production of additional nitrogen and SOM sequestration by faunal casts can only be achieved during the fast cycle of transformation and decomposition of EMM litter by all soil biota.
7. Conclusion
The proposed model of ectomycorrhiza in forest ecosystems is designed to be incorporated into the EFIMOD3 forest ecosystem model and possibly other forest models. Therefore, the role of EMR in the nitrogen budget and SOM dynamics in forest ecosystems is emphasized. The model is based on the concept of an indirect positive effect of EMR on plant growth due to the rapid decomposition of short-living EMM, which represents a dominant belowground litter pool in forest soils. The model allows the assessment of EMM growth, N mining and release for plant nutrition, and SOM formation. The growth of EMM is determined by the input and the C:N ratio of root exudates. Mycorrhizal N mining of SOM is calculated in the model only for EMM own use, with a significant amount of dissolved organic matter as a by-product. The decomposition of EMM by all soil biota of food webs allowed the estimation of (i) the available N-NH4 that can be directly used by plants and (ii) the solid-phase by-product of faunal metabolism, which is a pool of fresh N-rich organic matter that has never been represented in EMR models. The validation and testing of this model demonstrated the adequacy of the theoretical background used in this model.
Author Contributions
Conceptualisation, O.C.; data curation, I.P. and P.F.; formal analysis, V.S. and P.F.; investigation, O.C., I.P. and A.G.; methodology, O.C., V.S. and P.F.; algorithm, O.C.; software, P.F.; sensitivity, V.S., validation, P.F., V.S. and S.B.; test, I.P., S.B. and P.F.; visualisation, P.F.; writing—original draft, O.C., P.F., V.S., I.P. and A.G; writing—review & editing, O.C. and I.P.; funding acquisition, V.S.; project administration, I.P.; resources, I.P. and P.F. All authors have read and agreed to the published version of the manuscript.
Funding
The research was carried out as part of the most important innovative project of national importance "Development of a system for ground-based and remote monitoring of carbon pools and greenhouse gas fluxes in the territory of the Russian Federation, ensuring the creation of recording data systems on the fluxes of climate-active substances and the carbon budget in forests and other terrestrial ecological systems" (Registration number: 123030300031-6). This work was also supported in the frames of the Basic Scientific Research Theme of Pushchino Scientific Center for Biological Research (Registration number: 122040500037-6).
Data Availability Statement
The data are available from authors by reasonable request.
Conflicts of Interest
The authors declare no conflict of interests.
References
- Smith, P.; Smith, J.U.; Powlson, D.S.; McGill, W.B.; Arah, J.R.M.; Chertov, O.G.; Coleman, K.; Franko, U.; Frolking, S.; Jenkinson, D.S.; et al. A Comparison of the Performance of Nine Soil Organic Matter Models Using Datasets from Seven Long-Term Experiments. Geoderma 1997, 81, 153–225. [Google Scholar] [CrossRef]
- Chertov, O.G.; Komarov, A.S. SOMM — a model of soil organic matter dynamics. Ecological Modelling 1997, 94, 177–189. [Google Scholar] [CrossRef]
- Braakhekke, M.C.; Beer, C.; Hoosbeek, M.R.; Reichstein, M.; Kruijt, B.; Schrumpf, M.; Kabat, P. SOMPROF: A Vertically Explicit Soil Organic Matter Model. Ecological Modelling 2011, 222, 1712–1730. [Google Scholar] [CrossRef]
- Brzostek, E.R.; Fisher, J.B.; Phillips, R.P. Modeling the Carbon Cost of Plant Nitrogen Acquisition: Mycorrhizal Trade-Offs and Multipath Resistance Uptake Improve Predictions of Retranslocation. J. Geophys. Res. Biogeosci. 2014, 119, 1684–1697. [Google Scholar] [CrossRef]
- Huang, Y.; Guenet, B.; Ciais, P.; Janssens, I.A.; Soong, J.L.; Wang, Y.; Goll, D.; Blagodatskaya, E.; Huang, Y. ORCHIMIC (v1.0), a Microbe-Mediated Model for Soil Organic Matter Decomposition. Geosci. Model Dev. 2018, 11, 2111–2138. [Google Scholar] [CrossRef]
- Berardi, D.; Brzostek, E.; Blanc-Betes, E.; Davison, B.; DeLucia, E.H.; Hartman, M.D.; Kent, J.; Parton, W.J.; Saha, D.; Hudiburg, T.W. 21st-century Biogeochemical Modeling: Challenges for Century-based Models and Where Do We Go from Here? GCB Bioenergy 2020, 12, 774–788. [Google Scholar] [CrossRef]
- Fitch, A.A.; Goldsmith, S.B.; Lankau, R.A.; Wurzburger, N.; Shortt, Z.D.; Vrattos, A.; Laurent, E.N.; Hicks Pries, C.E. Mycorrhizal Associations of Temperate Forest Seedlings Mediate Rhizodeposition, but Not Soil Carbon Storage, under Elevated Nitrogen Availability. Global Change Biology 2024, 30. [Google Scholar] [CrossRef] [PubMed]
- Komarov, A.; Chertov, O.; Bykhovets, S.; Shaw, C.; Nadporozhskaya, M.; Frolov, P.; Shashkov, M.; Shanin, V.; Grabarnik, P.; Priputina, I.; Zubkova, E. Romul_Hum model of soil organic matter formation coupled with soil biota activity. I. Problem formulation, model description, and testing. Ecological Modelling 2017, 345, 113–124. [Google Scholar] [CrossRef]
- Parton, W.J. The CENTURY model. In Evaluation of Soil Organic Matter Models; Powlson, D.S., Smith, P., Smith, J.U., Eds.; Springer Berlin Heidelberg, 1996; ISBN 9783642646928. pp. 283–293.
- Komarov, A.; Chertov, O.; Nadporozhskaya, M.; Mikhailov, A.; Bykhovets, S.; Zudina, E.; Zoubkova, E. EFIMOD 2—a Model of Growth and Cycling of Elements in Boreal Forest Ecosystems. Ecological Modelling 2003, 170, 373–392. [Google Scholar] [CrossRef]
- Komarov, A.S.; Chertov, O.G.; Nadporozhskaya, M.A.; Priputina, I.V.; Bykhovets, S.S.; Larionova, A.A.; Grabarnik, P.Ya.; Zudin, S.L.; Mikhailov, A.V.; Zubkova, E.V.; Zudina, E.V.; Shanin, V.N.; Andrienko, G.; Andrienko, N.; Martynkin, A.V.; Mohren, G.; Abakumov, E.V.; Loukianov, A.M.; Kubasova, T.S.; Bhatti, J.; Shaw, S.; Apps, M.; Bobrovsky, M.V.; Khanina, L.G.; Smirnov, V.E.; Glukhova, E.M. Modelling the Organic Matter Dynamics in Forest Ecosystems; Kudeyarov, V.N., Ed.; Nauka Publishing: Moscow, 2007; 380 p. ISBN: 5-02-034053-7 [In Russian with English content].
- Blagodatskaya, Е.; Kuzyakov, Y. Mechanisms of Real and Apparent Priming Effects and Their Dependence on Soil Microbial Biomass and Community Structure: Critical Review. Biol Fertil Soils 2008, 45, 115–131. [Google Scholar] [CrossRef]
- Bastida, F.; García, C.; Fierer, N.; Eldridge, D.J.; Bowker, M.A.; Abades, S.; Alfaro, F.D.; Asefaw Berhe, A.; Cutler, N.A.; Gallardo, A.; et al. Global Ecological Predictors of the Soil Priming Effect. Nat Commun 2019, 10, 3481. [Google Scholar] [CrossRef] [PubMed]
- Smith, S.E.; Read, D. Mycorrhizal Symbiosis; 3th ed.; Elsevier: Amsterdam, 2008; 787 pp. ISBN 978-0-12-370526-6.
- Martin, F. (Ed.) ; Molecular Mycorrhizal Symbiosis; John Wiley & Sons Inc.: Hoboken, NJ, 2016; p. 506. ISBN 978-1-118-95144-6. [Google Scholar]
- Zhou, J.; Zang, H.; Loeppmann, S.; Gube, M.; Kuzyakov, Y.; Pausch, J. Arbuscular Mycorrhiza Enhances Rhizodeposition and Reduces the Rhizosphere Priming Effect on the Decomposition of Soil Organic Matter. Soil Biology and Biochemistry 2020, 140, 107641. [Google Scholar] [CrossRef]
- Lukina, N.V., Ed.; Carbon Accumulation in Forest Soils and Forest Successional Status; KMK Scientific Press Ltd., Moscow, 2018, 232 p. ISBN 978-5-907099-47-0. In Russian with English Contents.
- Aasfar, A.; Bargaz, A.; Yaakoubi, K.; Hilali, A.; Bennis, I.; Zeroual, Y.; Meftah Kadmiri, I. Nitrogen Fixing Azotobacter Species as Potential Soil Biological Enhancers for Crop Nutrition and Yield Stability. Front. Microbiol. 2021, 12, 628379. [Google Scholar] [CrossRef]
- Threatt, S.D.; Rees, D.C. Biological Nitrogen Fixation in Theory, Practice, and Reality: A Perspective on the Molybdenum Nitrogenase System. FEBS Letters 2022, 597, 45–58. [Google Scholar] [CrossRef] [PubMed]
- Blagodatsky, S.; Blagodatskaya, E.; Yuyukina, T.; Kuzyakov, Y. Model of Apparent and Real Priming Effects: Linking Microbial Activity with Soil Organic Matter Decomposition. Soil Biology and Biochemistry 2010, 42, 1275–1283. [Google Scholar] [CrossRef]
- Chertov, O.; Kuzyakov, Y.; Priputina, I.; Frolov, P.; Shanin, V.; Grabarnik, P. Modelling the Rhizosphere Priming Effect in Combination with Soil Food Webs to Quantify Interaction between Living Plant, Soil Biota and Soil Organic Matter. Plants 2022, 11, 2605. [Google Scholar] [CrossRef] [PubMed]
- Tunlid, A. , Floudas D., Koide R., Rineau F. Soil organic matter decomposition mechanisms in ectomycorrhizal fungi. In Molecular Mycorrhizal Symbiosis; Martin F., Ed.; John Wiley & Sons, Hoboken, New Jersey, 2016; pp. 257–275. ISBN 978-1-118-95144-6.
- Nehls, U.; Das, A.; Neb, D. Carbohydrate Metabolism in Ectomycorrhizal Symbiosis. In Molecular Mycorrhizal Symbiosis. Martin, F., Ed.; John Wiley & Sons Inc.: Hoboken, NJ, USA, 2016; pp. 159–177. ISBN 978-1-118-95144-6. [Google Scholar]
- Högberg, M.N.; Högberg, P. Extramatrical Ectomycorrhizal Mycelium Contributes One-third of Microbial Biomass and Produces, Together with Associated Roots, Half the Dissolved Organic Carbon in a Forest Soil. New Phytologist 2002, 154, 791–795. [Google Scholar] [CrossRef] [PubMed]
- Kuzyakov, Y.; Hill, P.W.; Jones, D.L. Root Exudate Components Change Litter Decomposition in a Simulated Rhizosphere Depending on Temperature. Plant Soil 2006, 290, 293–305. [Google Scholar] [CrossRef]
- Pena, R. Nitrogen Acquisition in Ectomycorrhizal Symbiosis. In Molecular Mycorrhizal Symbiosis. Martin, F., Ed.; John Wiley & Sons Inc.: Hoboken, NJ, USA, 2016; pp. 179–196. ISBN 978-1-118-95144-6. [Google Scholar]
- Chalot, M.; Brun, A. Physiology of Organic Nitrogen Acquisition by Ectomycorrhizal Fungi and Ectomycorrhizas. FEMS Microbiology Reviews 1998, 22, 21–44. [Google Scholar] [CrossRef]
- Stuart, E.K.; Plett, K.L. Digging Deeper: In Search of the Mechanisms of Carbon and Nitrogen Exchange in Ectomycorrhizal Symbioses. Front. Plant Sci. 2020, 10. [Google Scholar] [CrossRef] [PubMed]
- Agerer, R.; Hartmann, A.; Pritsch, K.; Raidl, S.; Schloter, M.; Verma, R.; Weigt, R. Plants and Their Ectomycorrhizosphere: Cost and Benefit of Symbiotic Soil Organisms. In Ecological Studies; Springer Berlin Heidelberg, 2012; pp. 213–242 ISBN 9783642306440.
- Talbot, J.M.; Bruns, T.D.; Smith, D.P.; Branco, S.; Glassman, S.I.; Erlandson, S.; Vilgalys, R.; Peay, K.G. Independent Roles of Ectomycorrhizal and Saprotrophic Communities in Soil Organic Matter Decomposition. Soil Biology and Biochemistry 2013, 57, 282–291. [Google Scholar] [CrossRef]
- Rineau, F.; Shah, F.; Smits, M.M.; Persson, P.; Johansson, T.; Carleer, R.; Troein, C.; Tunlid, A. Carbon Availability Triggers the Decomposition of Plant Litter and Assimilation of Nitrogen by an Ectomycorrhizal Fungus. The ISME Journal 2013, 7, 2010–2022. [Google Scholar] [CrossRef]
- van Breemen, N.; Finlay, R.; Lundström, U.; Jongmans, A.G.; Giesler, R.; Olsson, M. Biogeochemistry, 2000; 49, 53–67. [CrossRef]
- Gadd, G.M. Geomycology: Biogeochemical Transformations of Rocks, Minerals, Metals and Radionuclides by Fungi, Bioweathering and Bioremediation. Mycological Research 2007, 111, 3–49. [Google Scholar] [CrossRef]
- Staddon, P.L.; Ramsey, C.B.; Ostle, N.; Ineson, P.; Fitter, A.H. Rapid Turnover of Hyphae of Mycorrhizal Fungi Determined by AMS Microanalysis of 14C. Science 2003, 300, 1138–1140. [Google Scholar] [CrossRef] [PubMed]
- Gorka, S.; Dietrich, M.; Mayerhofer, W.; Gabriel, R.; Wiesenbauer, J.; Martin, V.; Zheng, Q.; Imai, B.; Prommer, J.; Weidinger, M.; et al. Rapid Transfer of Plant Photosynthates to Soil Bacteria via Ectomycorrhizal Hyphae and Its Interaction With Nitrogen Availability. Front. Microbiol. 2019, 10. [Google Scholar] [CrossRef] [PubMed]
- Godbold, D.L.; Hoosbeek, M.R.; Lukac, M.; Cotrufo, M.F.; Janssens, I.A.; Ceulemans, R.; Polle, A.; Velthorst, E.J.; Scarascia-Mugnozza, G.; De Angelis, P.; et al. Mycorrhizal Hyphal Turnover as a Dominant Process for Carbon Input into Soil Organic Matter. Plant Soil 2006, 281, 15–24. [Google Scholar] [CrossRef]
- Ekblad, A.; Wallander, H.; Godbold, D.L.; Cruz, C.; Johnson, D.; Baldrian, P.; Björk, R.G.; Epron, D.; Kieliszewska-Rokicka, B.; Kjøller, R.; et al. The Production and Turnover of Extramatrical Mycelium of Ectomycorrhizal Fungi in Forest Soils: Role in Carbon Cycling. Plant Soil 2013, 366, 1–27. [Google Scholar] [CrossRef]
- Klink, S.; Keller, A.B.; Wild, A.J.; Baumert, V.L.; Gube, M.; Lehndorff, E.; Meyer, N.; Mueller, C.W.; Phillips, R.P.; Pausch, J. Stable Isotopes Reveal That Fungal Residues Contribute More to Mineral-Associated Organic Matter Pools than Plant Residues. Soil Biology and Biochemistry 2022, 168, 108634. [Google Scholar] [CrossRef]
- Li, T.; Zhang, J.; Wang, X.; Hartley, I.P.; Zhang, J.; Zhang, Y. Fungal Necromass Contributes More to Soil Organic Carbon and More Sensitive to Land Use Intensity than Bacterial Necromass. Applied Soil Ecology 2022, 176, 104492. [Google Scholar] [CrossRef]
- Chertov, O.G.; Priputina, I.V.; Shanin, V.N.; Frolov, P.V. Role of woody plants’ ectomycorrhiza in the dynamic of forest soil organic matter: synthesis and conceptualization of available data. Forest Sci. Issues 2024, 7, 141, In Russian with English summary. [Google Scholar] [CrossRef]
- Manzoni, S.; Porporato, A. Soil Carbon and Nitrogen Mineralization: Theory and Models across Scales. Soil Biology and Biochemistry 2009, 41, 1355–1379. [Google Scholar] [CrossRef]
- Cotrufo, M.F.; Lavallee, J.M. Soil Organic Matter Formation, Persistence, and Functioning: A Synthesis of Current Understanding to Inform Its Conservation and Regeneration. In Advances in Agronomy; Elsevier, 2022; pp. 1–66; ISBN 9780323989534.
- King, A.E.; Amsili, J.P.; Córdova, S.C.; Culman, S.; Fonte, S.J.; Kotcon, J.; Liebig, M.; Masters, M.D.; McVay, K.; Olk, D.C.; et al. A Soil Matrix Capacity Index to Predict Mineral-Associated but Not Particulate Organic Carbon across a Range of Climate and Soil pH. Biogeochemistry 2023, 165, 1–14. [Google Scholar] [CrossRef]
- Zhou, Z.; Ren, C.; Wang, C.; Delgado-Baquerizo, M.; Luo, Y.; Luo, Z.; Du, Z.; Zhu, B.; Yang, Y.; Jiao, S.; et al. Global Turnover of Soil Mineral-Associated and Particulate Organic Carbon. Nat Commun 2024, 15. [Google Scholar] [CrossRef] [PubMed]
- Geisen, S.; Koller, R.; Hünninghaus, M.; Dumack, K.; Urich, T.; Bonkowski, M. The Soil Food Web Revisited: Diverse and Widespread Mycophagous Soil Protists. Soil Biology and Biochemistry 2016, 94, 10–18. [Google Scholar] [CrossRef]
- Lukac, M.; Godbold, D.L. Soil Ecology in Northern Forests. A belowground view of a changing world. Cambridge University Press, 2011. ISBN: 9780511976100.
- Zanella, A.; Ponge, J.-F.; Gobat, J.-M.; Juilleret, J.; Blouin, M.; Aubert, M.; Chertov, O.; Rubio, J.L. Humusica 1, Article 1: Essential Bases – Vocabulary. Applied Soil Ecology 2018, 122, 10–21. [Google Scholar] [CrossRef]
- Holtkamp, R.; van der Wal, A.; Kardol, P.; van der Putten, W.H.; de Ruiter, P.C.; Dekker, S.C. Modelling C and N Mineralisation in Soil Food Webs during Secondary Succession on Ex-Arable Land. Soil Biology and Biochemistry 2011, 43, 251–260. [Google Scholar] [CrossRef]
- Moore, J.C.; de Ruiter, P.C.; McCann, K.S.; Wolters, V., Eds.; Adaptive Food Webs; Cambridge University Press, 2018, 416 p.; ISBN: 9781316871867.
- Odum, E.P.; Barrett, G.W. Fundamentals of Ecology; Thomson Brooks/Cole, 2005. 598 pp.; ISBN 0534420664, 9780534420666.
- Moore, J.C.; de Ruiter, P.C. Energetic Food Webs: An Analysis of Real and Model Ecosystems; Oxford University Press, 2012, 352 pp. ISBN: 978-0-19-856618-2.
- de Vries, F.T.; Thébault, E.; Liiri, M.; Birkhofer, K.; Tsiafouli, M.A.; Bjørnlund, L.; Bracht Jørgensen, H.; Brady, M.V.; Christensen, S.; de Ruiter, P.C.; et al. Soil Food Web Properties Explain Ecosystem Services across European Land Use Systems. Proceedings of the National Academy of Sciences 2013, 110, 14296–14301. [Google Scholar] [CrossRef]
- Chertov, O.; Komarov, A.; Shaw, C.; Bykhovets, S.; Frolov, P.; Shanin, V.; Grabarnik, P.; Priputina, I.; Zubkova, E.; Shashkov, M. Romul_Hum—A Model of Soil Organic Matter Formation Coupling with Soil Biota Activity. II. Parameterisation of the Soil Food Web Biota Activity. Ecological Modelling 2017, 345, 125–139. [Google Scholar] [CrossRef]
- Zelenev, V.V.; van Bruggen, A.H.C.; Semenov, A.M. ``BACWAVE,’’ a Spatial–Temporal Model for Traveling Waves of Bacterial Populations in Response to a Moving Carbon Source in Soil. Microbial Ecology 2000, 40, 260–272. [Google Scholar] [CrossRef]
- Zelenev, V.V.; van Bruggen, A.H.C.; Leffelaar, P.A.; Bloem, J.; Semenov, A.M. Oscillating Dynamics of Bacterial Populations and Their Predators in Response to Fresh Organic Matter Added to Soil: The Simulation Model ‘BACWAVE-WEB. ’ Soil Biology and Biochemistry 2006, 38, 1690–1711. [Google Scholar] [CrossRef]
- DeForest, J.L.; Snell, R.S. Tree Growth Response to Shifting Soil Nutrient Economy Depends on Mycorrhizal Associations. New Phytologist 2019, 225, 2557–2566. [Google Scholar] [CrossRef] [PubMed]
- Anthony, M.A.; Crowther, T.W.; van der Linde, S.; Suz, L.M.; Bidartondo, M.I.; Cox, F.; Schaub, M.; Rautio, P.; Ferretti, M.; Vesterdal, L.; et al. Forest Tree Growth Is Linked to Mycorrhizal Fungal Composition and Function across Europe. The ISME Journal 2022, 16, 1327–1336. [Google Scholar] [CrossRef] [PubMed]
- Jones, M.D.; Durall, D.M.; Tinker, P.B. Fluxes of Carbon and Phosphorus between Symbionts in Willow Ectomycorrhizas and Their Changes with Time. New Phytologist 1991, 119, 99–106. [Google Scholar] [CrossRef]
- Read, D.J.; Perez-Moreno, J. Mycorrhizas and Nutrient Cycling in Ecosystems – a Journey towards Relevance? New Phytologist 2003, 157, 475–492. [Google Scholar] [CrossRef] [PubMed]
- Wright, W.; Fitter, A.; Meharg, A. Reproductive Biomass in Holcus Lanatus Clones That Differ in Their Phosphate Uptake Kinetics and Mycorrhizal Colonization. New Phytologist 2000, 146, 493–501. [Google Scholar] [CrossRef]
- Brunner, I.; Børja, I.; Dalsgaard, L.; Deckmyn, G.; Ekblad, A.; Godbold, D.L.; Guerra Avalos, I.; Lukac, M.; Kalbitz, K.; Kriiska, K. , Ostonen, I.; Schnepf, A., Simončič, P., Vanguelova, E. Belowground carbon turnover in European forests: Fine roots, mycorrhizal mycelia, Eds.; Birmensdorf: WSL, 2013; p. 67. ISBN 978-3-905621-54-9. [Google Scholar]
- Deckmyn, G.; Meyer, A.; Smits, M.M.; Ekblad, A.; Grebenc, T.; Komarov, A.; Kraigher, H. Simulating Ectomycorrhizal Fungi and Their Role in Carbon and Nitrogen Cycling in Forest Ecosystems. Canadian Journal of Forest Research 2014, 44, 535–553. [Google Scholar] [CrossRef]
- Cagnarini, C.; Blyth, E.; Emmett, B.A.; Evans, C.D.; Griffiths, R.I.; Keith, A.; Jones, L.; Lebron, I.; McNamara, N.P.; Puissant, J.; et al. Zones of Influence for Soil Organic Matter Dynamics: A Conceptual Framework for Data and Models. Global Change Biology 2019, 25, 3996–4007. [Google Scholar] [CrossRef]
- Simard, S.W.; Beiler, K.J.; Bingham, M.A.; Deslippe, J.R.; Philip, L.J.; Teste, F.P. Mycorrhizal Networks: Mechanisms, Ecology and Modelling. Fungal Biology Reviews 2012, 26, 39–60. [Google Scholar] [CrossRef]
- Shao, S.; Wurzburger, N.; Sulman, B.; Hicks Pries, C. Ectomycorrhizal Effects on Decomposition Are Highly Dependent on Fungal Traits, Climate, and Litter Properties: A Model-Based Assessment. Soil Biology and Biochemistry 2023, 184, 109073. [Google Scholar] [CrossRef]
- Meyer, A.; Grote, R.; Polle, A.; Butterbach-Bahl, K. Simulating Mycorrhiza Contribution to Forest C- and N Cycling-the MYCOFON Model. Plant and Soil 2009, 327, 493–517. [Google Scholar] [CrossRef]
- Meyer, A.; Grote, R.; Butterbach-Bahl, K. Integrating Mycorrhiza in a Complex Model System: Effects on Ecosystem C and N Fluxes. European Journal of Forest Research 2012, 131, 1809–1831. [Google Scholar] [CrossRef]
- Shanin, V.N.; Frolov, P.V.; Priputina, I.V.; Chertov, O.G.; Bykhovets, S.S.; Zubkova, E.V.; Portnov, A.M.; Frolova, G.G.; Stamenov, M.N.; Grabarnik, P.Y. Modeling forest ecosystems dynamic taking into account their structural heterogeneity at different functional and spatial levels. Forest Sci. Issues 2023, 6, 112. [Google Scholar] [CrossRef]
- Bengtson, P.; Barker, J.; Grayston, S.J. Evidence of a Strong Coupling between Root Exudation, C and N Availability, and Stimulated SOM Decomposition Caused by Rhizosphere Priming Effects. Ecology and Evolution 2012, 2, 1843–1852. [Google Scholar] [CrossRef] [PubMed]
- Phillips, R.P.; Erlitz, Y.; Bier, R.; Bernhardt, E.S. New Approach for Capturing Soluble Root Exudates in Forest Soils. Functional Ecology 2008, 22, 990–999. [Google Scholar] [CrossRef]
- Liu, T.; Chen, X.; Gong, X.; Lubbers, I.M.; Jiang, Y.; Feng, W.; Li, X.; Whalen, J.K.; Bonkowski, M.; Griffiths, B.S.; et al. Earthworms Coordinate Soil Biota to Improve Multiple Ecosystem Functions. Current Biology 2019, 29, 3420–3429e5. [Google Scholar] [CrossRef]
- Ostonen, I.; Lõhmus, K. Proportion of Fungal Mantle, Cortex and Stele of Ectomycorrhizas in Picea Abies (L.) Karst. in Different Soils and Site Conditions. Plant and Soil 2003, 257, 435–442. [Google Scholar] [CrossRef]
- Balestrini, R.; Kottke, I. Structure and Development of Ectomycorrhizal Roots. In Molecular Mycorrhizal Symbiosis. Martin, F., Ed.; John Wiley & Sons Inc.: Hoboken, NJ, USA, 2016; ISBN 978-1-118-95144-6. [Google Scholar]
- Lukac, M.; Calfapietra, C.; Godbold, D.L. Production, Turnover and Mycorrhizal Colonization of Root Systems of Three Populus Species Grown under Elevated CO2 (POPFACE). Global Change Biology 2003, 9, 838–848. [Google Scholar] [CrossRef]
- Anderson, T.-H.; Domsch, K.H. Ratios of Microbial Biomass Carbon to Total Organic Carbon in Arable Soils. Soil Biology and Biochemistry 1989, 21, 471–479. [Google Scholar] [CrossRef]
- Saltelli, A.; Annoni, P. How to Avoid a Perfunctory Sensitivity Analysis. Environmental Modelling & Software 2010, 25, 1508–1517. [Google Scholar] [CrossRef]
- Yan, T.; Qu, T.; Song, H.; Sun, Z.; Zeng, H.; Peng, S. Ectomycorrhizal Fungi Respiration Quantification and Drivers in Three Differently-Aged Larch Plantations. Agricultural and Forest Meteorology 2019, 265, 245–251. [Google Scholar] [CrossRef]
- Ma, Y.; Piao, S.; Sun, Z.; Lin, X.; Wang, T.; Yue, C.; Yang, Y. Stand Ages Regulate the Response of Soil Respiration to Temperature in a Larix Principis-Rupprechtii Plantation. Agricultural and Forest Meteorology 2014, 184, 179–187. [Google Scholar] [CrossRef]
- R. , J.; de Boor, C. A Practical Guide to Splines. Mathematics of Computation 1980, 34, 325. [Google Scholar] [CrossRef]
- Sun, Z.; Liu, L.; Peng, S.; Peñuelas, J.; Zeng, H.; Piao, S. Age-Related Modulation of the Nitrogen Resorption Efficiency Response to Growth Requirements and Soil Nitrogen Availability in a Temperate Pine Plantation. Ecosystems 2016, 19, 698–709. [Google Scholar] [CrossRef]
- Chari, N.R.; Tumber-Dávila, S.J.; Phillips, R.P.; Bauerle, T.L.; Brunn, M.; Hafner, B.D.; Klein, T.; Obersteiner, S.; Reay, M.K.; Ullah, S.; et al. Estimating the Global Root Exudate Carbon Flux. Biogeochemistry 2024, 167, 895–908. [Google Scholar] [CrossRef]
- Waring, R.H.; Landsberg, J.J.; Williams, M. Net Primary Production of Forests: A Constant Fraction of Gross Primary Production? Tree Physiology 1998, 18, 129–134. [Google Scholar] [CrossRef] [PubMed]
- Landsberg, J.J.; Waring, R.H.; Williams, M. The Assessment of NPP/GPP Ratio. Tree Physiology 2020, 40, 695–699. [Google Scholar] [CrossRef]
- Theil, H. Applied Economic Forecasting. Rand McNally: Chicago, 1966; 474 p.
- Priputina, I.V.; Frolova, G.G.; Shanin, V.N.; Myakshina, T.N.; Grabarnik, P.Ya. Spatial Distribution of Organic Matter and Nitrogen in the Entic Podzols of the Prioksko-Terrasnyi Reserve and Its Relationship with the Structure of Forest Phytocenoses. Eurasian Soil Sc. 2020, 53, 1021–1032. [Google Scholar] [CrossRef]
- The Prioksko-Terrasny biosphere reserve: Environmental Monitoring; URL: https://pt-zapovednik.org/nauchnaya-deyatelnost/ (accessed 03.12.2024).
- Kurganova, I.N.; Lopes de Gerenyu, V.O.; Khoroshaev, D.A.; Myakshina, T.N.; Sapronov, D.V.; Zhmurin, V.A.; Kudeyarov, V.N. Analysis of the Long-Term Soil Respiration Dynamics in the Forest and Meadow Cenoses of the Prioksko-Terrasny Biosphere Reserve in the Perspective of Current Climate Trends. Eurasian Soil Sc. 2020, 53, 1421–1436. [Google Scholar] [CrossRef]
- Pena, R.; Tibbett, M. Mycorrhizal Symbiosis and the Nitrogen Nutrition of Forest Trees. Appl Microbiol Biotechnol 2024, 108. [Google Scholar] [CrossRef] [PubMed]
- Vanwalleghem, T.; Meentemeyer, R.K. Predicting Forest Microclimate in Heterogeneous Landscapes. Ecosystems 2009, 12, 1158–1172. [Google Scholar] [CrossRef]
- Díaz-Calafat, J.; Uria-Diez, J.; Brunet, J.; De Frenne, P.; Vangansbeke, P.; Felton, A.; Öckinger, E.; Cousins, S.A.O.; Bauhus, J.; Ponette, Q.; Hedwall, P.-O. From broadleaves to conifers: The effect of tree composition and density on understory microclimate across latitudes. Agricultural and Forest Meteorology 2023, 341, 109684. [Google Scholar] [CrossRef]
- Heinemeyer, A.; Hartley, I.P.; Evans, S.P.; Carreira De La Fuente, J.A.; Ineson, P. Forest Soil CO2 Flux: Uncovering the Contribution and Environmental Responses of Ectomycorrhizas. Global Change Biology 2007, 13, 1786–1797. [Google Scholar] [CrossRef]
- Heinemeyer, A.; Wilkinson, M.; Vargas, R.; Subke, J.-A.; Casella, E.; Morison, J.I.L.; Ineson, P. Exploring the Overflow Tap Theory: Linking Forest Soil CO2 Fluxes and Individual Mycorrhizosphere Components to Photosynthesis. Biogeosciences 2012, 9, 79–95. [Google Scholar] [CrossRef]
- Hughes, J.K.; Hodge, A.; Fitter, A.H.; Atkin, O.K. Mycorrhizal Respiration: Implications for Global Scaling Relationships. Trends in Plant Science 2008, 13, 583–588. [Google Scholar] [CrossRef] [PubMed]
- Wiesmeier, M.; Urbanski, L.; Hobley, E.; Lang, B.; von Lützow, M.; Marin-Spiotta, E.; van Wesemael, B.; Rabot, E.; Ließ, M.; Garcia-Franco, N.; et al. Soil Organic Carbon Storage as a Key Function of Soils - A Review of Drivers and Indicators at Various Scales. Geoderma 2019, 333, 149–162. [Google Scholar] [CrossRef]
- Harris, C. Geomorphological Applications of Soil Micromorphology with Particular Reference to Periglacial Sediments and Processes. In Geomorphology and Soils; Routledge, 2020; pp. 219–232 ISBN 9780429320781.
- Longhi, A.; Trombino, L.; Guglielmin, M. Soil Micromorphology as Tool for the Past Permafrost and Paleoclimate Reconstruction. CATENA 2021, 207, 105628. [Google Scholar] [CrossRef]
- Bouché, M.B.; Al-Addan, F. Earthworms, Water Infiltration and Soil Stability: Some New Assessments. Soil Biology and Biochemistry 1997, 29, 441–452. [Google Scholar] [CrossRef]
- Kim, G.; Jo, H.; Kim, H.-S.; Kwon, M.; Son, Y. Earthworm Effects on Soil Biogeochemistry in Temperate Forests Focusing on Stable Isotope Tracing: A Review. Appl Biol Chem 2022, 65. [Google Scholar] [CrossRef]
- Zhang, W.; Hendrix, P.F.; Dame, L.E.; Burke, R.A.; Wu, J.; Neher, D.A.; Li, J.; Shao, Y.; Fu, S. Earthworms Facilitate Carbon Sequestration through Unequal Amplification of Carbon Stabilization Compared with Mineralization. Nat Commun 2013, 4. [Google Scholar] [CrossRef] [PubMed]
- Pausch, J.; Kramer, S.; Scharroba, A.; Scheunemann, N.; Butenschoen, O.; Kandeler, E.; Marhan, S.; Riederer, M.; Scheu, S.; Kuzyakov, Y.; et al. Small but Active – Pool Size Does Not Matter for Carbon Incorporation in Below-ground Food Webs. Functional Ecology 2015, 30, 479–489. [Google Scholar] [CrossRef]
Table 1.
Input and output parameters of the ectomycorrhiza model
| Parameters | Dimension |
|---|---|
| Input parameters | |
| Total soil C | kg m−2 |
| Total soil N | kg m−2 |
| Root exudate input, in terms of C | kg m−2 day−1 |
| Root exudate C:N ratio | dimensionless |
| Extramatrical mycelium biomass, in terms of C | kg m−2 |
| Ectomycorrhiza C:N ratio | dimensionless |
| Microfauna biomass, in terms of C | kg m−2 |
| Microfauna C:N ratio | dimensionless |
| Output parameters | |
| Total C-CO2 emission at ectomycorrhiza functioning | kg m−2 day−1 |
| N produced at SOC mining by ectomycorrhiza | kg m−2 day−1 |
| DOC produced at SOC mining by ectomycorrhiza | kg m−2 day−1 |
| Sum of microfauna excreta and all necromass C for labile SOC pool | kg m−2 |
| Sum of N produced for labile SOC pool | kg m−2 |
| N-NH4 excreted by food webs fauna | kg m−2 |
Table 2.
Variables of the ectomycorrhiza model
| Parameters | Valid range | Default value |
|---|---|---|
| RE assimilation rate by EMM | 0.00–1.00 | 1.00 |
| Coefficient of competition for RE between EMR (fungi) and rhizosphere priming (bacteria) | 0.00–1.00 | 1.00 |
| EMM C:N ratio | 9.00–25.00 | 13.10 |
| EMM respiration coefficient | 0.50–0.90 | 0.70 |
| EMM production/growth coefficient | 0.10–0.50 | 0.30 |
| EMM consumption coefficient | 0.00–0.25 | 0.24 |
| EMM mortality coefficient | 0.00–0.25 | 0.01 |
| Micro- and mesofauna C:N ratio | 8.00–11.00 | 10.00 |
| Macrofauna C:N ratio | 6.00–10.00 | 8.00 |
| Micro- meso, and macrofauna respiration coefficient | 0.50–0.80 | 0.60 |
| Soil fauna* consumption coefficient | 0.00–0.25 | 0.20 |
| Soil fauna* excretion coefficient | 0.10–0.40 | 0.20 |
| Soil fauna* mortality coefficient | 0.00–0.25 | 0.01 |
Note: Data from [5,21,48,52,53,69,70,71] were used. Production coefficient (production efficiency in food web terminology) corresponds to Carbon Use Efficiency (CUE, microbiological terminology). All variables are dimensionless. * The same coefficients are used for soil micro-, meso- and macrofauna.
Disclaimer/Publisher’s Note: The statements, opinions and data contained in all publications are solely those of the individual author(s) and contributor(s) and not of MDPI and/or the editor(s). MDPI and/or the editor(s) disclaim responsibility for any injury to people or property resulting from any ideas, methods, instructions or products referred to in the content. |
© 2024 by the authors. Licensee MDPI, Basel, Switzerland. This article is an open access article distributed under the terms and conditions of the Creative Commons Attribution (CC BY) license (http://creativecommons.org/licenses/by/4.0/).
Copyright: This open access article is published under a Creative Commons CC BY 4.0 license, which permit the free download, distribution, and reuse, provided that the author and preprint are cited in any reuse.


