Submitted:
15 December 2024
Posted:
16 December 2024
You are already at the latest version
Abstract
The growth of rock structural surfaces makes the deformation and stability analysis of rock pits more complex and challenging than that of soil pits. This study investigated the deformation characteristics and failure evolution laws of rocky foundation in strata with parallel development of structural surfaces through the physical model test based on the similarity principle and numerical computational analysis. The results of the study revealed the deformation evolution law and damage mechanism of rocky foundation pit: when the rocky pit excavation depth is less than its critical self-stabilizing height the rocky foundation is still stable. If the pit continues to be excavated or new loads are applied, the pit will go through a phase of overburden crack development, a phase of cumulative deformation of the structural face, and collapse of the sliding body. At this point the rocky foundation undergoes wedge damage and the sliding body will collapse along the structural face of the first excavation. The results of the studies can serve as a useful reference and guide for the excavation and support design of real-world rock foundation projects that are similar.
Keywords:
rocky foundation pit
; damage mechanism
; parallel development of structural surfaces
1. Introduction
Pit support engineering has always been a popular topic in the field of civil engineering. Scholars and engineers are dedicated to investigating or developing idealistic pit support structures due to the range of challenging environmental conditions in pits and the increasingly desirable engineering economic performance requirements (Hadi and Reza, 2022) (Ter-Martirosyan, et al., 2022) (Hendrik, et al., 2020). The main issue with the foundation pit excavation project is the steady deformation and damage progression of the supporting structure. However, the primary issue for the rocky pit's ability to stabilize itself should be the deformation damage mechanism of the pit excavation. Wei Yan (Wei Yan, et al., 2015) used the myopic plane damage method for soil-rocky foundation excavation stability calculations. Yan reckoned the maximum permissible vertical excavation depth of the pit, Hmax, was calculated theoretically and it was noted that Hmax was not only related to its (cohesion) c, (angle of internal friction) , (volumetric weight) γ, and (upper load) q, but also inversely proportional to the soil-rock ratio. However, rock formations of rocky foundation pits often have developed structural surfaces and rich yield in practice, which leads to complex calculations of the deformation and stability of rocky foundation pits. Some scholars had gone from uniaxial and shear tests of pore-size dilated rock mass, nonpersistent and persistent jointed rock to study their mechanical behavior and to characterize them accurately in terms of rock mechanics (Asadizadeh M, et al., 2023) (Vaziri MR, et al., 2022) (Jintong Zhang, et al., 2022). Other scholars had considered the more realistic development of rock masses in reality, mainly from sophisticated modeling tools. Mariam Al-E'Bayat et al (Mariam, et al., 2024) used a Lattice Spring-Based Synthetic Rock Mass Model to analyze the effect of the inclination of the structural face on the stability factor of safety, and the structural face spacing on the damage region influence mechanism. Huajin Zhang (Huajin Zhang, et al., 2023) innovated a robust method for rock slope stability assessment which employed Latin hypercubes to realistically fit the characteristic parameters of the actual geotechnical structural surfaces; Dongjie Hua (Dongjie Hua, et al., 2023) conducted an in-depth study on the elastic wave velocity of nodular rock bulk. At the same time, scholars have undertaken a lot of research on the damage mechanism of complex rock bodies with different conditions. Jintao Wang (Jintao Wang and Jianpin, Zuo, 2020) revealed the damage mechanism of rock mass under tension; Linfeng Zhu (Linfeng Zhu, et al., 2023) elucidated the mechanism by which anchors controlled the shear creep behavior of rock joints; Jin Xu (Jin Xu and Yansen Wang, 2022) (Jin Xu, et al., 2022) derived an analytical equation for the upper limit stability coefficient of a large inclined rocky upright pit slope containing a cavern. However, there is not much in-depth research on the damage mechanism of rocky foundation pits in strata with parallel development of structural surfaces.
For the study of pit slope engineering, in addition to numerical computational analysis (Chengwen Wang, et al., 2023) (Po-Tsun Yeh, et al., 2022) (Hui Guo, et al., 2024), the Physical model test is also a highly reliable and widely used method (Pajalic Sara, et al., 2021) (Lozada Catalina, et al., 2022) (Benemaran RS, et al., 2022). Xiongyu Hua (Xiongyu Hua, et al., 2019) analyzed the behavior of a new type of support system in anisotropic joints by conducting physical modeling tests on tunnel tube sheet lining; Nader Moussaeia (Nader Moussaeia, et al., 2019) classified the damage mechanisms of laminated rock tunnels into nine categories using both physical modeling and numerical simulation; Jutao Qiu (Jutao Qiu, et al., 2023) investigated the mechanical behavior and damage characteristics of subway tunnels under mixed strata at burial depths of 50-500 m through physical model tests; Jiong Wang (Jiong Wang, et al., 2023) revealed the mechanical properties of NPR cords in soft rock through large-scale physical modeling tests and obtained the mechanical properties of steel-reinforced rock bodies; Gang Wei (Gang Wei, et al., 2022) used a self-developed loading device to accomplish the internal force response law of Hangzhou subway shield structure section under pit unloading.
The mentioned findings provide ideas for studying the damage mechanism of rocky foundation pits in strata with parallel development of structural surfaces. In this paper, physical modeling tests and Midas GTS numerical simulations will be used to investigate the stress-strain relationship, horizontal and vertical deformation patterns, and the damage evolution of the rocky pit with the development of parallel structural surfaces.
2. Physical Model Test
In the team's previous study (Ziguang Zhang, et al., 2024), we used the deep foundation pit of the Ningxia Road subway in Qingdao as a prototype and simplified this rocky foundation pit into a planar model. Then the self-stabilizing control effect modeling tests were conducted for FPVRW. In addition, the modeling tests made the assumption that the 3D effect of the foundation pit corners was not taken into account, and the orthogonal tests were used to determine similar materials and similar ratios. The above assumptions and experimental practices apply equally to the physical modeling tests in this thesis. Distinguishing from the previous study, this thesis considers the role of the influence of the upper soil layers of rocky foundation. This is due to the uneven thickness of the upper soil layer of a rocky foundation in an actual deep foundation project.
2.1. Similar Ratios and Similar Material
Based on the similarity principle, a dimensionless analysis was used to derive similar indicators. The specific projection process was as follows:
The parameters involved in this physical modeling test: geometric dimension (l), density (ρ), acceleration(g), volumetric weight (γ), cohesion (c), angle of internal friction (), Young's modulus (E), Poisson's ratio (v) and line load (q). The similarity ratio of the parameters (l, ρ, g, , c, , E, v, q) are the ratio of the model to the prototype's parameters, respectively denoted as Cl, Cρ, C, Cγ, Cc, C, CE, Cv, Cq.
According to the second law of similarity principle, the functional equation of these physical quantities is expressed in the general functional equation (1).
Assume that l, ρ, and g are fundamental physical quantities. According to π-theorem equation (1) can be written as:
Convert the function equation (2) into a power series. Take as an example:
Since is a dimensionless quantity, it follows that
Substituting the calculations of a, b, and c into equation (3) yields equation (4).
The similarity indicator, Cγ=CρC, can be obtained from equation (4). Similarly, it is known that Cc=CE=ClCρC, Cq=CρC, and C=Cv. Since the cohesion c and Poisson's ratio v are dimensionless quantities, it is assumed that C=Cv=1. As needed for the physical modeling tests, it is assumed that Cl=50, Cρ=1, C=1.2, thus Cγ=1.2, Cc=CE=60, Cq=8.5.
The mechanical parameters of the prototype pit rock formation were shown in Table 1 for raw material. Uniaxial compression and straight shear tests were performed on similar materials in the previous study of our team (Ziguang Zhang, et al., 2024), and so the specific physico-mechanical parameters of the similar material were obtained, as shown in Table 1. The ratio of the mechanical parameters of the raw material and similar material was its corresponding similarity ratio.
The material used in this test is a composite material commonly employed in geotechnical physical modeling tests which comprised medium sand (fineness specification: 30 mesh; density: 2.73g/cm3), barite powder (fineness specification: 400 mesh; density: 4.2g/cm3), gypsum (fineness specification: 400 mesh; density: 2.33g/cm3), concrete (C42.5), and water. The physical modeling tests in this thesis used the same similar materials, material ratios and similar ratios as in the team's previous study. Table 2 gives the material ratios of the rock structure (R-S) and structural surface (S-S) in the physical model.
2.2. Physical Model Test Setup
The dimensions of the test model box are 1.5 meters in length, 1 meter in width and 1.2 meters in height. And the box consists of four iron plates and a piece of tempered glass. The type of strain gauges used in the test was BX120-30AA geotechnical foil resistance strain gauges. These strain gauges were pasted on the 10 points (A0, A, B, C, D, G, H, L, M, N, while Ao is the compensation point) as depicted in Figure 1. The loading test of the foundation pit was conducted using an electro-hydraulic servo pressurization system. The loading system can apply a load of 500kN, with a test force resolution of 0.01kN and a displacement resolution of 0.01mm.
In Figure 1, the physical test model consists of three main components: the overburden layer, parallel structural surfaces, and rock structure. The overburden is made of medium sand, which is used to transfer the upper loads uniformly to the rock strata. Structural surfaces (a), (b), (c), and (d) are parallel to each other, 2 centimeters thick, spaced 10 centimeters apart, and inclined at 60° (This refers to an angle of 60° between the structural plane and the horizontal plane). There is a 10 centimeters thick rock structure between the two structural surfaces.
The process of constructing the model of rocky pit in strata with parallel development of structural surfaces was presented below:
(1) A 60° side slope (The material type and material ratio for slope were the same as those for rock structures)was constructed first. The formwork was then installed according to the thickness of the structural surface and the rock structure. To prevent shifting of the formwork position, wooden sticks and iron pads were used to hold the formwork in place, as shown in Figure 2a;
(2) According to the material ratios provided in Table 2, a certain amount of medium sand, barite powder, cement, gypsum and water were measured using an electronic scale and then poured into the mixing box and mixed thoroughly as shown in Figure 2b;
(3) To ensure uniform density and prevent “honeycomb” problems, it must be mixed several times before pouring similar materials into the formwork. As seen in Figure 2c, rubber hammer and wooden stick were used to compact similar material, ensuring that each component had the same density;
(4) Once the structural surface and rock structure were likely strengthened and formed, the formwork was gradually taken off. The newly poured structure should not be touched;
(5) Soil was removed from the surface of the structure and rock structure using cutting rings. The cutting rings with the soil removed were then placed into the pit model box so that it cured in the same condition as the model. The model was heated and dried using a hot air blower as shown in Figure 2e. (The drying time was evaluated and regulated by a real-time check of the quality of the cutting rings with the soil).
(6) When the structural surface had reached a certain strength, a groove was dug in the structural surface. A drop of 502 glue was applied to this groove and strain gauge was attached, followed by covering the strain gauge with Calvert's waterproofing adhesive and finally backfilling the groove. Point L was located inside the structural surface (a) and its distance along the structural surface (a) to the top surface was 25 cm as shown in Fig. 2(f). Similarly, points M, and N were located inside structural surfaces (b), and (c), respectively, and their distances along the structural surface to the top surface were all 25 cm. By repeating steps 1 through 6 above, the modeling of the rock strata can be completed. Strain gauges at other points were subsequently pasted. As depicted in Figure 1, points A0, A, B, C, and D, were arranged on the lateral plane of the structural surface. Points G, and H were arranged on the surface of the rock layer, and above them was the sandy soil layer. Finally, a layer of medium sand was laid on the rock strata.
2.3. Test Process
The tests included excavation test of rocky foundation and foundation loading test.
Figure 3a–c illustrate the excavation procedure of the model excavation test. The pit model was excavated in three steps, each of which was 15 centimeters deep, with a 10-minute interval between excavations. In the first excavation step, the soil layer was excavated, but the structural surface was not excavated. In the second excavation step, the structural surface (a) was completely excavated through. The depth of the pit model after the third excavation was -45 cm, at which point the structural surface (b) had just been excavated through. Photos were captured during the excavation to document and analyze the deformation and settling of the foundation pit. Additionally, strain gauges were utilized to collect strain data from various positions throughout the excavation operation.
Figure 4 depicts a simplified analytical model of the self-stabilizing height of the upright rock wall of foundation pit with parallel development of structural surfaces (Ziguang Zhang et al., 2019). The application of Equation (5) is to calculate the theoretical value of the self-stabilizing height (Hcr) of the vertical rock wall of the foundation.
Where: c is the cohesion of the S-S, kN/m2; K is the safety coefficient; is the internal friction angle of the S-S, °; α is the angle of the structural surface and the horizontal plane of the stratum, °; L is the length of the compressed edge, m; q is the equivalent distributed load, kN/m.
Equation 6 can be converted from Equation 5.
In order to better observe and analyze the damage pattern of the pit model, the foundation model was loaded after excavation using an electro-hydraulic servo pressurization system. Based on Equations 5 and 6, and taking into account the mass of the sand layer and the timber matting, calculations show that the vertical rock wall of the foundation pit can reach a critical self-stabilizing state by providing a force of 3.1kN. The whole loading procedure was to first pre-pressurize the test model (its purpose was to compact the soil layer so that it can better transfer the force exerted by the upper electro-hydraulic servo jacks to the lower rock body uniformly), and then load the force to 3.1kN, and then load it to 5kN, 7kN, and 9kN sequentially in 2-minute intervals, until the physical model was completely destroyed.
2.4. Physical Test Results
2.4.1. Pit physical Model Excavation Test
As reflected in Figure 3a–c, the settlement deformation of the pit was not readily apparent during the excavation process. Nevertheless, a fissure was discovered on the ground's surface surrounding the pit in Figure 3a. This is due to the concentrated tensile stress at the junction of the sandy soil layer and the rock, and the tensile cracks extend from the structural surface to the sandy soil layer. However, the slip resistance of the structural surface was bigger than the sliding force, which could prevent the occurrence of pit instability and the stability of the pit was guaranteed.
Figure 5 depicts the strain changes at nine points during excavations. In the figure, “X” refers to the direction perpendicular to the S-S and “Y” refers to the direction parallel to the S-S. In the test, the excavation was carried out in steps of 15 cm, and the duration of each excavation was 10 minutes. In Figure 5a: the strains at points A, B, C, and D rise and fall once in the first excavation, twice in the second excavation, and once in the third excavation. In the three excavations, the modes of strain are approximately -50, -125, and -250 (Mode refers to the number that appears the most frequently); In Figure 5b: the strains at points G and H rise and fall once in the first excavation, twice in the second excavation, and once in the third excavation. In the three excavations, the modes of strain are approximately -50, -125, and -225; In Figure 5c: the strains at points L, M, and N rise and fall once in the first excavation, twice in the second excavation, and once in the third excavation. In the three excavations, the modes of strain are approximately -50, -125, and -250. It can be seen that the strain change rule of these 9 points is basically the same, and the final value of strain is basically around -250. In addition, a strain mutation occurred both at the pit surface and within the structural surface during a single excavation (here the “mutation” is the “rise and fall” described above). However, during the second excavation, the number of strain mutations in strain was more than once as the structural surface was excavated. This can indicate that the presence of structural surface makes it easier for strain mutation to occur during the excavation of foundation pits.
The points on the structural surface had strain mutation, but the plastic zone of the structural surface was not penetrated, which allowed the rocky foundation to remain safe from damage under the self-stabilizing capacity. That was, when the excavation depth of a rocky pit was less than Her, the pit would not destabilize. During the excavation of rocky foundation pits, strains range from -50 to -250, and deformation of the structural surface accumulated.
2.4.2. Pit physical Model Load Test
Figure 6a–d record the damage process of the foundation under loading, and Figure 6e is a graph of the time-force-displacement relationship made from the electro-hydraulic servo system data. As seen in Figure 6: (1) When the test model was loaded to 3.1kN, the displacement value was 3.81 mm. At the same time, the cracks in the soil layer were developing and the cracks were concentrated toward the joint between the S-S (a) and the R-S; (2) When the upper load was increased to 5kN, the displacement was 4.43mm. The joint between the structural surface (a) and the rock structure developed into a sliding surface and the sliding block collapsed along this joint; (3) When the load reached 7kN, the displacement was 5.89 mm. The number of cracks in the soil layer increased and all the cracks were also concentrated towards the joint between the S-S (b) and the R-S (this joint became a potential sliding surface); (4) When the load reached 9kN not long after, the potential sliding surface, the joint between the S-S (b) and the R-S, collapsed along the S-S.
In the excavation test of the rocky foundation with parallel development of structural surfaces, the excavation depth was less than the critical safe height Her of the rocky foundation, and the foundation was not destabilized under the self-stabilizing capacity. Cracks in the sandy soil layer extended toward the potential sliding surface. And the deformation within the S-S was accumulating. In the loading test of the rocky foundation with parallel development of structural surfaces, the load was increased from 0 to 3.1kN, and the displacement of the pit surface increased abruptly. In this process, the deformation of the S-S (a) proceeded with considerable accumulation and the internal plastic zone developed rapidly. Although the pit model had reached a critical state, the potential sliding surface (the joint between the S-S (a) and R-S) had not yet been fully penetrated, and the points on the potential sliding surface had not been subjected to displacement mutation. When the load was increased by 5kN, the points on this sliding surface quickly underwent displacement mutation. The rock structure above the S-S) became a sliding block and suddenly collapsed, and destabilization damage occurred in the rocky foundation. In three dimensions, this destabilizing damage would be constrained by the surrounding geotechnical body and form a wedge-shaped damage. When the load changed from 5kN to 7kN, the number of cracks in the sandy soil layer increased and all of them extended towards the potential sliding surface (the joint between the S-S (b) and R-S). At the same time a large displacement of the pit surface occurred at this stage (displacement increment of 1.46 mm) and a considerable accumulation of deformation of the structural surface (b) was carried out. When the load reaches 9kN, the plastic zone of the potential sliding surface was penetrated and displacement mutation occurred, and then the sliding block collapsed along the S-S (b). Therefore, we divided the damage process of rocky foundation with parallel development of structural surfaces into three stages: soil crack development stage, structural surface deformation accumulation stage and sliding block collapse.
3. Numerical Simulation and Analysis
3.1. Numerical Simulation Model
Numerical calculation was performed using the Midas GTS NX software. The Midas GTS program was used to compute the pit numerically. Numerical modeling was performed as a two-dimensional model. The width of the pit was 30m and the depth was 22.5m (45cm×50=22.5m). The structural planes in the strata developed parallel, with a dip angle of 60 ° and a thickness of 1m(2cm×50=1m). The thickness of the rock mass structure was 5m (10cm×50=5m). The boundary dimensions of the model were 320m×140m, as shown in Figure 7. The model materials were all modeled using Mohr-Coulomb model with property of 2D plane strain type. The specific parameters of the model material were given in Table 1 for raw material. Grid sizes of 0.5m and 1.2m were used for excavated S-S and R-S, and 0.9m and 1.6m for unexcavated S-S and R-S. In this way, the whole model was divided into 42495 2D grid cells. The boundary constraints of the model were automatic boundary constraints, and the model was assigned self-weight load (gravity) and line loads. Other factors such as groundwater and seismic effects were not taken into account.
The numerical simulation was divided into two distinct working conditions: the calculation model for pit excavation and the calculation model for loads after pit excavated.
The model was constructed using the following 6 steps in sequence: Step 1 was to create a 3D wireframe representation of the model, starting from the origin (0,0,0) in the spatial interface of the Midas GTS software. After the pit model wireframe was drawn, the cross-segmentation command was used to segment all the cross-lines so that later meshing could proceed smoothly; Step 2 was to define the model material and model property; Step 3 was to divide the mesh. The depth of the pit model was 22.5m, and the excavation was carried out in 3 times, as shown in the lower right corner
In Figure 7. The three rock layers that were excavated were first meshed sequentially, and then the unexcavated rock layers were meshed. All 2D grid cells must be meshed in order to avoid that the model does not operate properly; Step 4 was to assign automatic boundary constraints, gravity and line loads. In the physical modeling tests, the applied loads were 3.1kN, 5kN, 7kN and 9kN. These loads were converted into line loads and multiplied by Cq to obtain 43.92kN/m, 70.83kN/m, 99.17kN/m and 127.5kN/m, i.e., that were the line loads imposed by the numerical simulation; Step 5 was to define the construction phases. The construction phases were defined as 8 phases, which were initial stress field equilibrium (this included activating the gravity and automatic boundary constraints, and setting the displacement to 0), Excavation 1 (pit depth -7.5 m), Excavation 2 (pit depth 15 m), Excavation 3 (pit depth 22.5 m), applying line load 1 (43.92kN/m), applying line load 2 (70.83kN/m), applying line load 3 (99.17kN/m) and applied line load 4 (127.5kN/m); Step 6 was to create the construction phase analysis and perform the computational analysis.
3.2. Result of Computational Analysis
The variation of maximum displacement values of rocky foundation pits during excavation is depicted in Figure 8a. From excavation 0m to excavation to -22.5m, the maximum displacement value of the rocky pit increased from 0 to 58.57mm. The depth of all three excavations was 7.5 m. The increment of the maximum displacement value of the first two excavations was about 18 mm, but the maximum displacement value of the latter excavation was 5.56 mm bigger than 18 mm. This was due to the fact that one of the structural surfaces was fully excavated, and its presence would have caused larger displacements in the pit excavation. This is similar to the results of the excavation tests in the physical model tests: as the structural surface (a) is excavated, the number of mutations in the strain of the rocky foundation is increased. The variation of maximum displacement values of rocky foundation pit during loading is demonstrated in Figure 8b. The linear load increased from 43.92kN/m to 127.5kN/m and the maximum displacement value of the pit increased from 58.57mm to 92.26mm. The increments of the maximum displacement values of the pit in the four loadings were 1.67mm, 3.99mm, 12.37mm and 15.65mm respectively. After both the second and fourth loadings, the change in the maximum displacement value of the pit was much larger than the previous one. This is because the pit has sliding blocks collapsing at these two times.
Figure 9 depicts the change in the plastic zone of the foundation pit during loading. The plastic zone of the S-S of the pit was not penetrated when the applied load was 43.92kN/m; The plastic zone of the first excavated S-S was penetrated when the applied load was 70.83kN/m. The maximum displacement value of the rocky foundation was larger than the previous one, and the point where the maximum displacement occurred was on the first excavated S-S. This means that the point on the potential sliding surface undergoes displacement mutation, the pit undergoes destabilizing damage, and the rock structure on the sliding surface collapses along the first excavated S-S; When the applied load was increased to 99.17kN/m, the plastic zone of the second excavated structural surface gradually developed, but the plastic zone was not completely penetrated; When the applied load was increased to 127.5kN/m, the plastic zone of the second excavated S-S was completely penetrated, displacement mutation occurred at points on the potential sliding surface, and the rock structure on the sliding surface collapsed along the second excavated S-S.
4. Discussion
In this paper, physical modeling of excavation and loading of rocky foundation in strata with parallel developed structural surfaces is carried out and numerically simulated. In the results of tests and numerical simulations: 1) The rock wall of a rocky pit has a good self-stabilizing ability. However, due to the presence of the structural surface, it makes the rock foundation pit more prone to strain mutations or displacement mutations during excavation; 2) The destabilizing damage of rocky foundation in strata with parallel developed structural surfaces can be divided into three stages: soil crack development stage, structural surface deformation accumulation stage and sliding block collapse. When the pit excavation was completed, cracks developed within the soil layer and propagated in the direction of the potential sliding surface (the joint between the first excavated S-S and the R-S). When the foundation pit was loaded to critical safety, the plastic zone of the first excavated structural surface was not penetrated (as shown in Figure 9a), and the deformation of this S-S was accumulating. This plastic zone was penetrated when the load was applied in further (as shown in Figure 9b). A displacement mutation occurred at the upper point of the potential sliding surface, and the rock structure on the upper part of the first excavated S-S turned into a sliding block, which collapsed along the S-S (as shown in Figure 6b). As the load reloading continues to increase, the deformation of the second excavated structural surface accumulated and its plastic zone developed (as shown in Figure 9c). When the load was increased in further, the plastic zone was completely penetrated (as shown in Figure 9d). A displacement mutation occurred at the point on the potential sliding surface (the joint between the second excavated S-S and the R-S) and the sliding block collapsed along the S-S; 3) In the actual rocky foundation project, this type of foundation pit is recommended to use the support form of steel pipe pile with soil nail wall. If the upper part of the rock strata has different thicknesses of soil layer, the combination support form of steel pipe pile + bored pile + high pressure rotary spray pile can be adopted. A current instability criterion for foundation pits and slopes: the plastic zone of the potential sliding surface is penetrated, displacement mutation occurs at points on the surface, and then the destabilizing damage occurs to the foundation or slope. Furthermore, damage to rocky foundations with structural surfaces present tends to occur suddenly. This study reflects both well. The research in this thesis has some limitations that need to be improved in future projects. Also, only steeply dipping formations (45° < β < 85°) are considered in the numerical analysis of this paper, and the other five types, such as horizontal formations (0° < β < 5°), gently dipping formations (5° < β < 20°), sharply dipping formations (20° < β < 45°), upright formations (85° < β < 90°), and anticlinal formations (β greater than 90°), are not taken into account. In three dimensions, the foundation instability damage in this study is the wedge-like damage. Our next step will be to follow the basic assumptions of the Hoek-Bray method regarding the direction of the resisting sliding force on the structural surface, and then to establish the kinematic conditions for the sliding mode based on the block kinematics, and to derive the corresponding safety coefficient solution equations.
5. Conclusions
In this thesis, physical model tests and numerical simulations of rocky foundation in strata with parallel developed structural surfaces are carried out to obtain the following conclusions:
(1) Due to the influence of the self-stabilizing capacity of the foundation, the excavation of rocky foundation in strata with parallel developed structural surfaces can basically satisfy the stability requirements if the depth of foundation excavation is less than the critical height of foundation self-stabilization.
(2) It makes rocky foundation more susceptible to strain mutations or displacement mutations during excavation because of the presence of structural surfaces.
(3) The damage mechanisms of rocky foundation in strata with parallel developed structural surfaces: The soil in the upper part of the rock strata will crack first, and the cracks will extend toward the potential sliding surface (the joint between the excavated structural surface and the rock structure). The deformation within the structural surface then accumulates and the plastic zone of the structural surface develops. When the plastic zone is penetrated, the points on the potential sliding surface undergo displacement mutations, and the sliding block collapses along the structural surface. The instability and failure of this type of foundation pit can be divided into three stages: soil crack development stage, structural surface deformation accumulation stage and sliding block collapse.
Author’s Contribution
Ziguang Zhang was the person in charge of the paper and completed the construction of the thesis framework system; Wanyu Li completed the related work of numerical calculation and thesis writing; Ankang Hu and Liang Wu: completed the related work of the model test in the paper.
Data Availability
The data used to support the findings of this study are available from the corresponding author upon request.
Acknowledgments
This study was funded by the Provincial Natural Science Research Project of colleges and universities in Anhui Province-Key projects (KJ2021A0611), the Science and Technology Plan of Housing and Urban-Rural Construction in Anhui Province (2022-YF096, 2020-YF038), and Science and technology development project (HYB20240110, HYB20190152, HYB20220092, HYB20220162).
Conflicts of Interest
The authors declare that they have no conflicts of interest.
References
- Asadizadeh M, Moosavi M, Hossaini MF, et al. Numerical modeling of rock blocks with nonpersistent rough joints subjected to uniaxial compressive and shear loadings. International Journal of Geomechanics 2023, 23, 7858. [Google Scholar] [CrossRef]
- Benemaran, R.S.; Esmaeili-Falak, M.; Katebi., H. Physical and numerical modelling of pile-stabilised saturated layered slopes. Proceeding of the International Journal of Civil Engineers-Geotechnical Engineering 2022, 175, 523–538. [Google Scholar] [CrossRef]
- Chengwen Wang, Xiaoli Liu, Danqing Song, et al. Elasto-plastic analysis of the surrounding rock mass in circular tunnel using a new numerical model based on generalized nonlinear unified strength theory. Computers and Geotechnics 2023, 154, 105163. [Google Scholar] [CrossRef]
- Dongjie Hua, Qinghui Jiang. A general equivalent continuum model and elastic wave velocity analysis of jointed rock masses. International Journal of Rock Mechanics and Mining Sciences 2023, 170, 105500. [Google Scholar] [CrossRef]
- Gang Wei, Yongjie Qi, Chunlai Chen, et al. Analysis of the protective effect of setting isolation piles outside the foundation pit on the underpass tunnel side. Transportation Geotechnics 2022, 35, 100791. [Google Scholar] [CrossRef]
- Hadi Sabermahany; Reza Attarnejad. Seismic performance of buildings supported by a shallow doubly-curved shell raft foundation. Structures 2022, 36, 619–634. [Google Scholar] [CrossRef]
- Hendrik Ramm; Oliver Reul; Axel Ruiken, et al. Hochhaus Omniturm – Baugrube und Gründung unter komplexen innerstädtischen Randbedingungen. Bautechnik 2020, 97, 656–663. [Google Scholar] [CrossRef]
- Huajin Zhang, Shunchuan Wu, Zhongxin Zhang, et al. Reliability analysis of rock slopes considering the uncertainty of joint spatial distributions. Computers and Geotechnics 2023, 161, 105566. [Google Scholar] [CrossRef]
- Hui Guo, Chengzeng Yan, Guohua Zhang, at al. Mechanical analysis of toppling failure using FDEM: A case study for soft-hard interbedded anti-dip rock slope. Computers and Geotechnics 2024, 165, 105883. [Google Scholar] [CrossRef]
- Jin Xu, Yansen Wang, Changchun Li. Stability analysis of rock slope and calculation of rock lateral pressure in foundation pit with structural plane and cave development. Scientific reports 2022, 12, 8710. Available online: https://www.nature.com/articles/s41598-022-12765-6. [CrossRef] [PubMed]
- Jin Xu, Yansen Wang. Stability Analysis and Support Design Methods for Rock Foundation Pit with Combination of Structural Plane and Karst Cave. Advances in Civil Engineering 2022, 1155, 5662079. [Google Scholar]
- Jintao Wang, Jianpin, Zuo. Numerical simulation on effect of heterogeneity on mode Ι fracture characteristics of rock. Journal of Central South University 2020, 27, 3063–3077. [Google Scholar] [CrossRef]
- Jintong Zhang, Mamoru Kikumoto, Hideaki Yasuhara, et al. Modeling the shearing behavior of discontinuous rock mass incorporating dilation of joint aperture. International Journal of Rock Mechanics and Mining Sciences 2022, 153, 105101. [Google Scholar] [CrossRef]
- Jiong Wang, Peng Liu, Chuangzhou Wu, et al. Mechanical behavior of soft rock roadway reinforced with NPR cables: A physical model test and case study. Tunnelling and Underground Space Technology 2023, 138, 105203. [Google Scholar] [CrossRef]
- Jutao Qiu, Xiaojun Zhou, Yu-Sheng Shen, et al. Failure mechanism of the deep-buried metro tunnel in maxed strata: Physical model test and numerical investigation. Tunnelling and Underground Space Technology 2023, 139, 105224. [Google Scholar] [CrossRef]
- Linfeng Zhu, Liangqing Wang, Luobin Zheng, et al. Shear creep characteristics and creep constitutive model of bolted rock joints. Engineering Geology 2023, 327, 107368. [Google Scholar] [CrossRef]
- Lozada Catalina, Mendoza Cristhian, Amortegui Vicente Jose, at al. Physical and Numerical Modeling of Clayey Slopes Reinforced with Roots. International Journal of Civil Engineering 2022, 20, 1115–1128. [Google Scholar] [CrossRef]
- Mariam Al-E’Bayat, Dogukan Guner, Taghi Sherizadeh, et al. Numerical Investigation for the Effect of Joint Persistence on Rock Slope Stability Using a Lattice Spring-Based Synthetic Rock Mass Model. Sustainability 2024, 16, 894–921. [Google Scholar] [CrossRef]
- Nader Moussaeia, Mostafa Sharifzadeh, Kourosh Sahriarc, et al. A new classification of failure mechanisms at tunnels in stratified rock masses through physical and numerical modeling. Tunnelling and Underground Space Technology 2019, 91, 103017. [Google Scholar] [CrossRef]
- Pajalic Sara, Peranic J, Maksimovic Sandra, at al. Monitoring and Data Analysis in Small-Scale Landslide Physical Model. Applied Sciences-Basel 2021, 11, 5040. Available online: https://www.mdpi. [CrossRef]
- Po-Tsun Yeh, I-Hui Chen, Kevin Zeh-Zon Lee, et al. Graphical comparison of numerical analysis, slope mass rating, and kinematic analysis for the effects of weak plane orientations on rock slope stability. Engineering Geology 2022, 311, 103900. [Google Scholar] [CrossRef]
- Ter-Martirosyan, Z.; Ter-Martirosyan, A.; Vanina, Y.V. Mathematical analysis for the evaluation of settlement and load-bearing capacity of a soil base adjacent to an excavation pit. Axioms 2022, 11, 353. [Google Scholar] [CrossRef]
- Vaziri MR, Tavakoli H, Bahaaddini M, et al. 2D numerical study of the mechanical behaviour of non-persistent jointed rock masses under uniaxial and biaxial compression tests. Geomechanics and Engineering 2022, 28, 117–133. [Google Scholar] [CrossRef]
- Wei Yan, Chao Yang, Jiaoming Zuo, et al. Stability calculation of soil excavation in soil and rock foundation pits. Journal of Underground Space and Engineering 2015, 11, 246–250. [Google Scholar]
- Xiongyu Hua, Yong Fang, Gabriel Walton, et al. Analysis of the behaviour of a novel support system in an anisotropically jointed rock mass. Tunnelling and Underground Space Technology 2019, 83, 113–134. [Google Scholar] [CrossRef]
- Zhang Ziguang, Xuping You, Cheng Zhang, et al. Study on the critical stable height of vertical excavation in rocky foundation pit within layered structural plane. Scientific reports 2024, 14, 12191. [Google Scholar] [CrossRef] [PubMed]
- Zhang Ziguang, Yihang Li, Jiesheng Zhang; et al. Study on the characteristics of self-stabilizing height distribution for deep foundation pit vertical sidewall in binary strata of upper soil and lower rock. Advances in Civil Engineering 2021, 5411703, 17 pages. [Google Scholar] [CrossRef]
Figure 1.
Design scheme of pit physical modeling test.
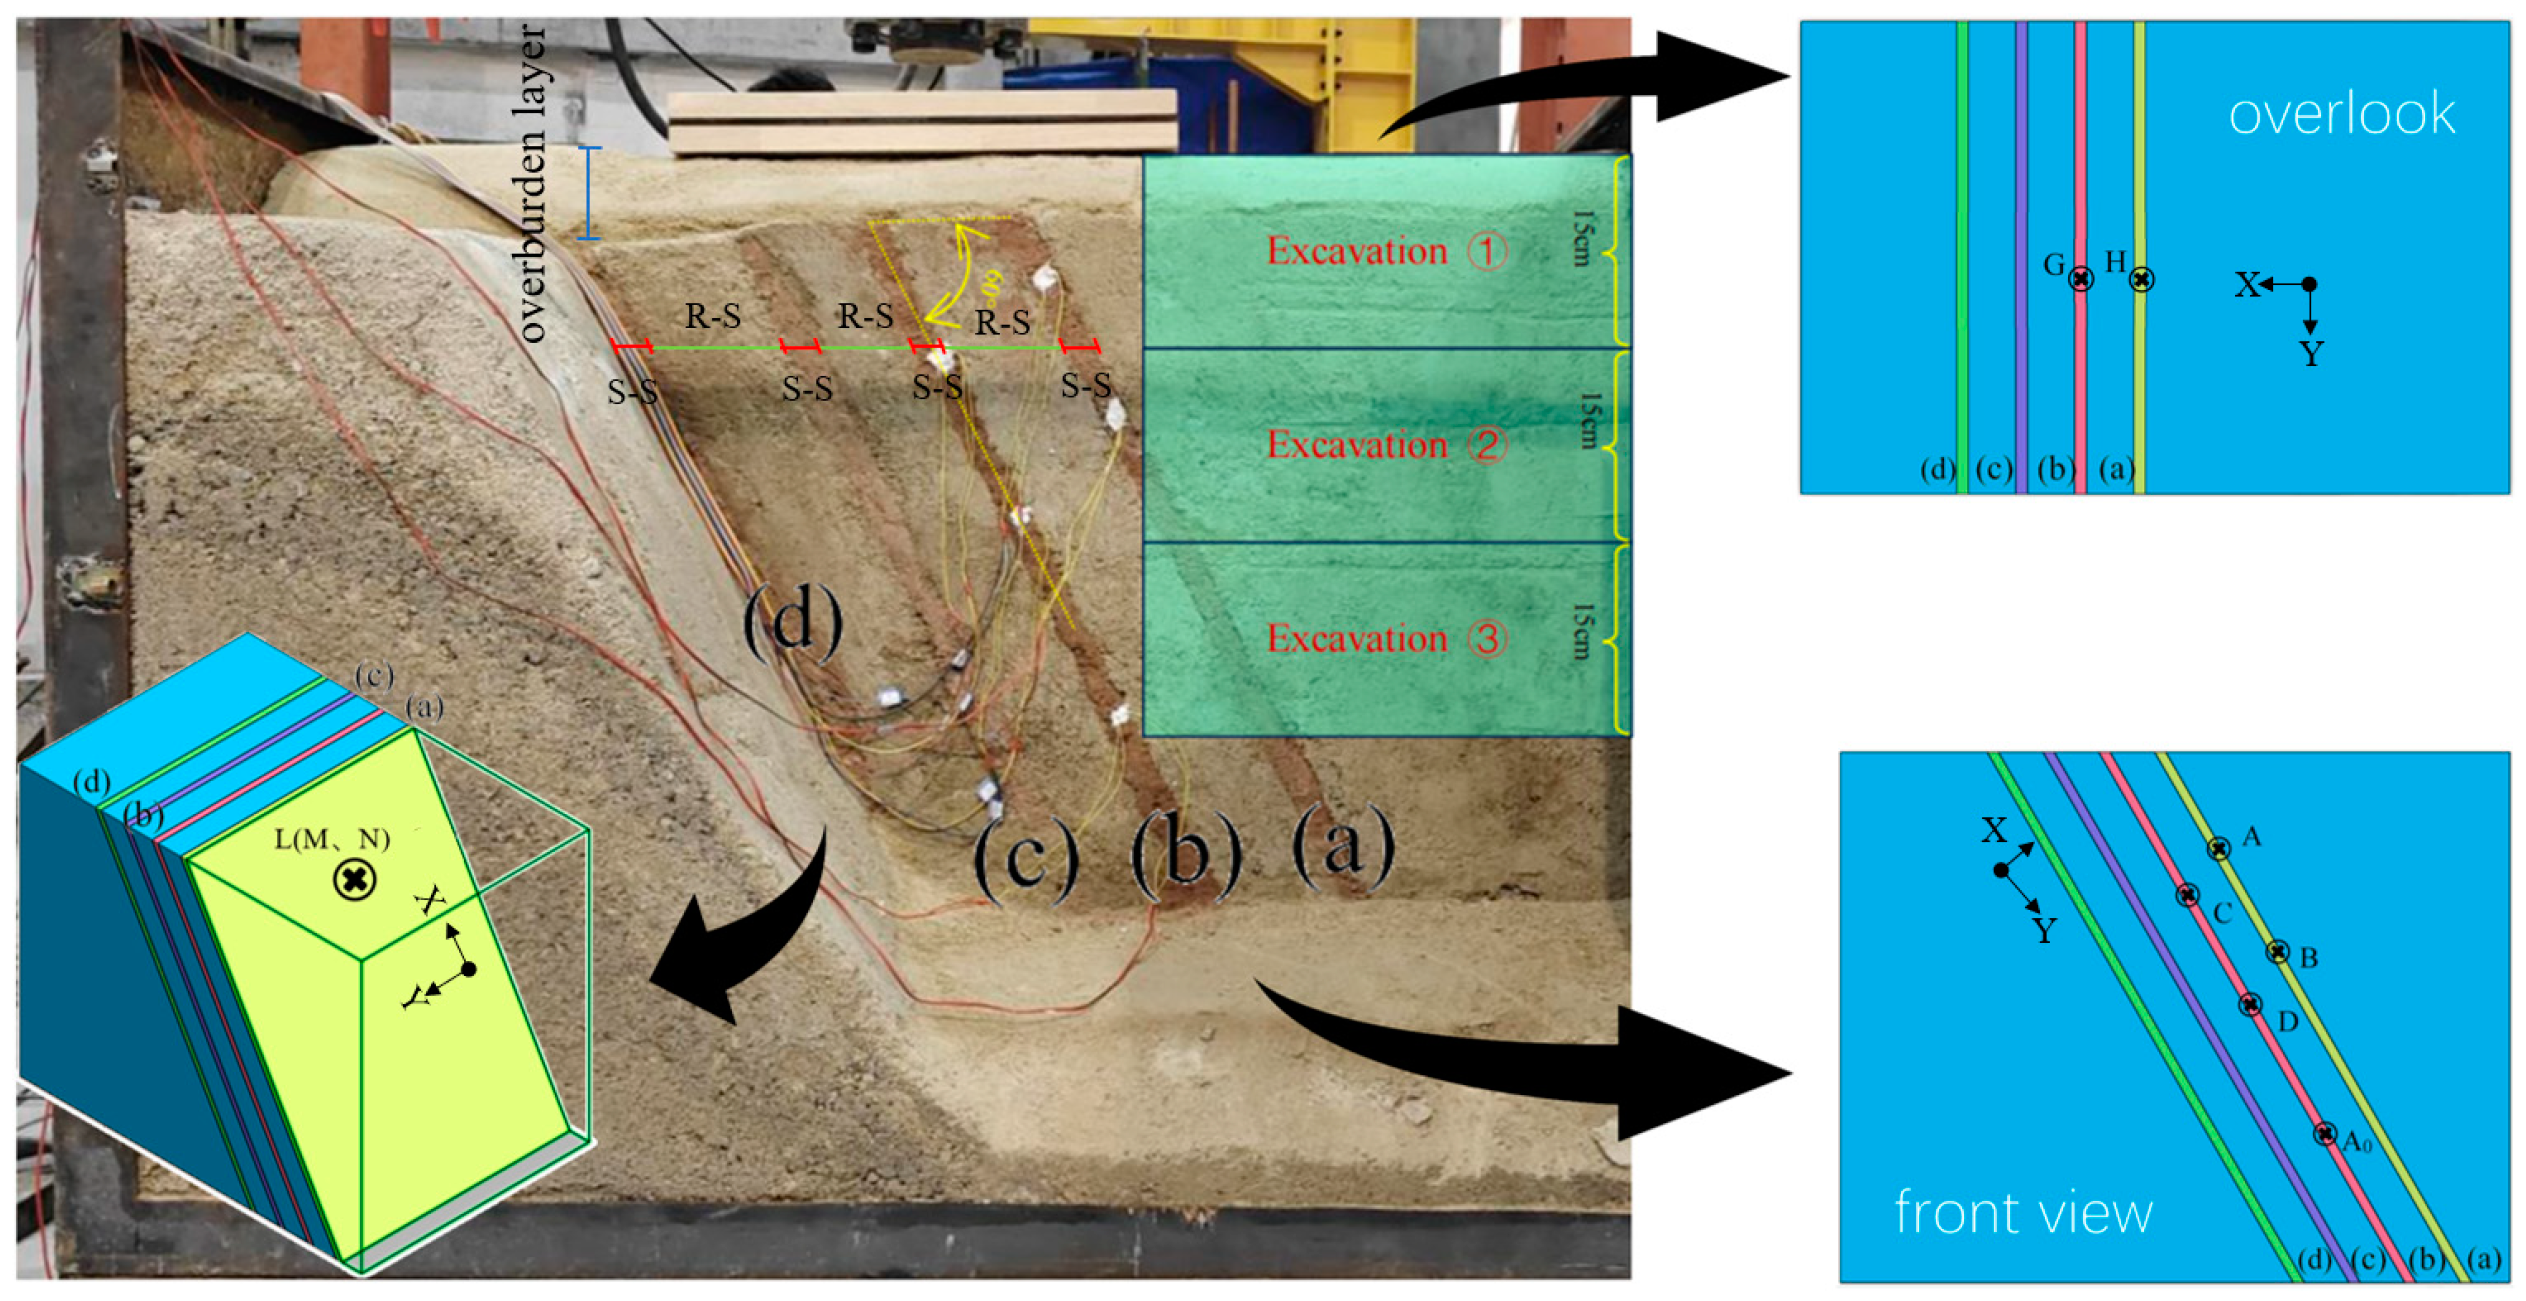
Figure 2.
Physical modeling process: (a) installed formwork; (b) mixed material; (c) compacted material; (d) taken off formwork; (e) cured structure; (f) attached strain gauges.
Figure 2.
Physical modeling process: (a) installed formwork; (b) mixed material; (c) compacted material; (d) taken off formwork; (e) cured structure; (f) attached strain gauges.

Figure 3.
Foundation excavation: (a) excavation 1: -15cm; (b) excavation 2: -30cm; (c) excavation 3: -45cm.
Figure 3.
Foundation excavation: (a) excavation 1: -15cm; (b) excavation 2: -30cm; (c) excavation 3: -45cm.
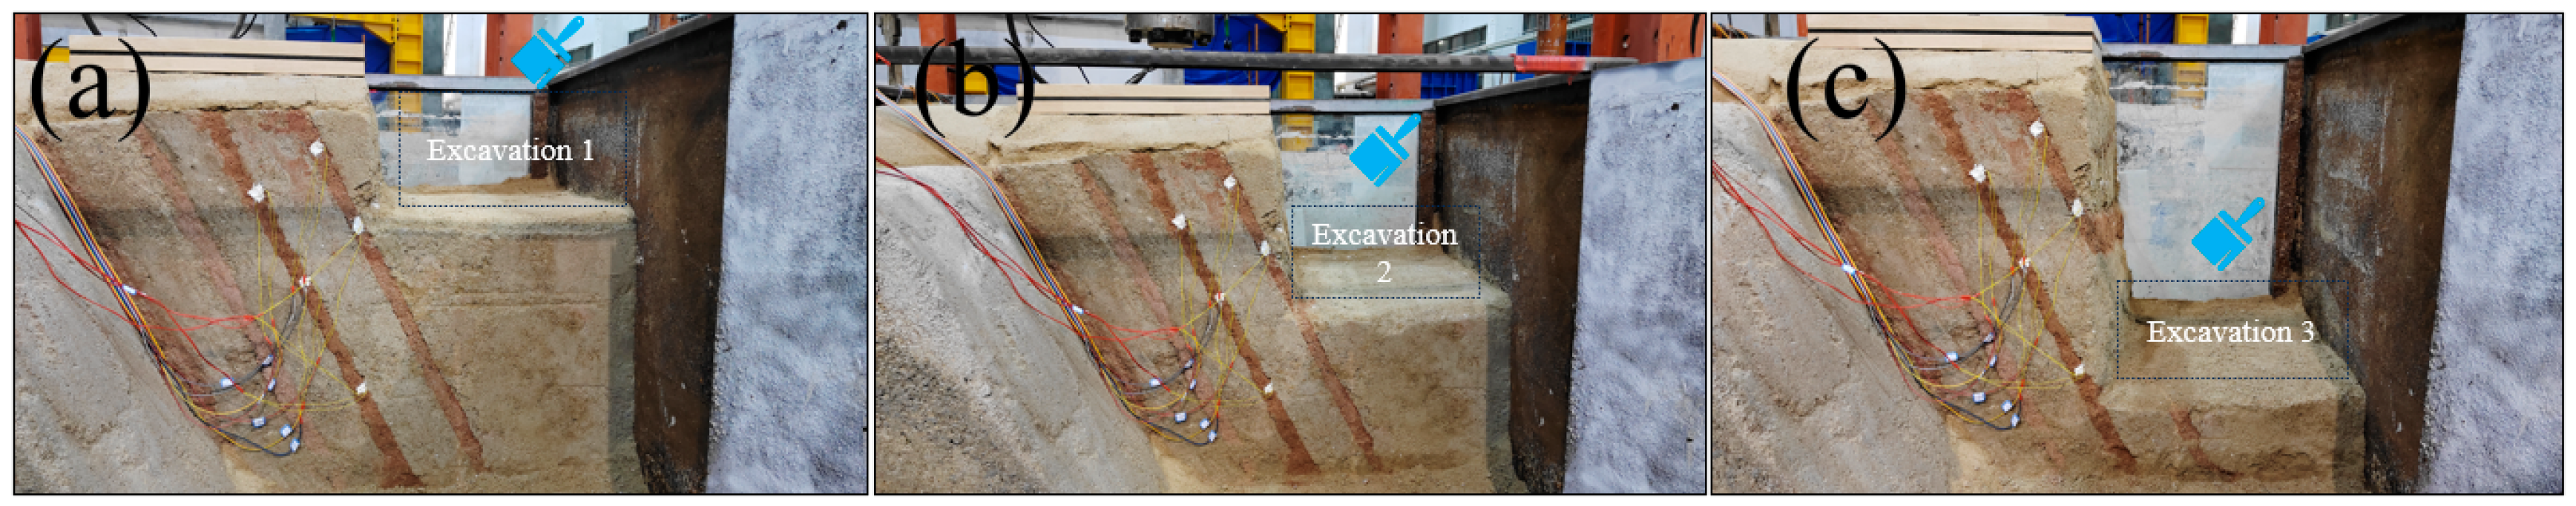
Figure 4.
Simplified analytical model.
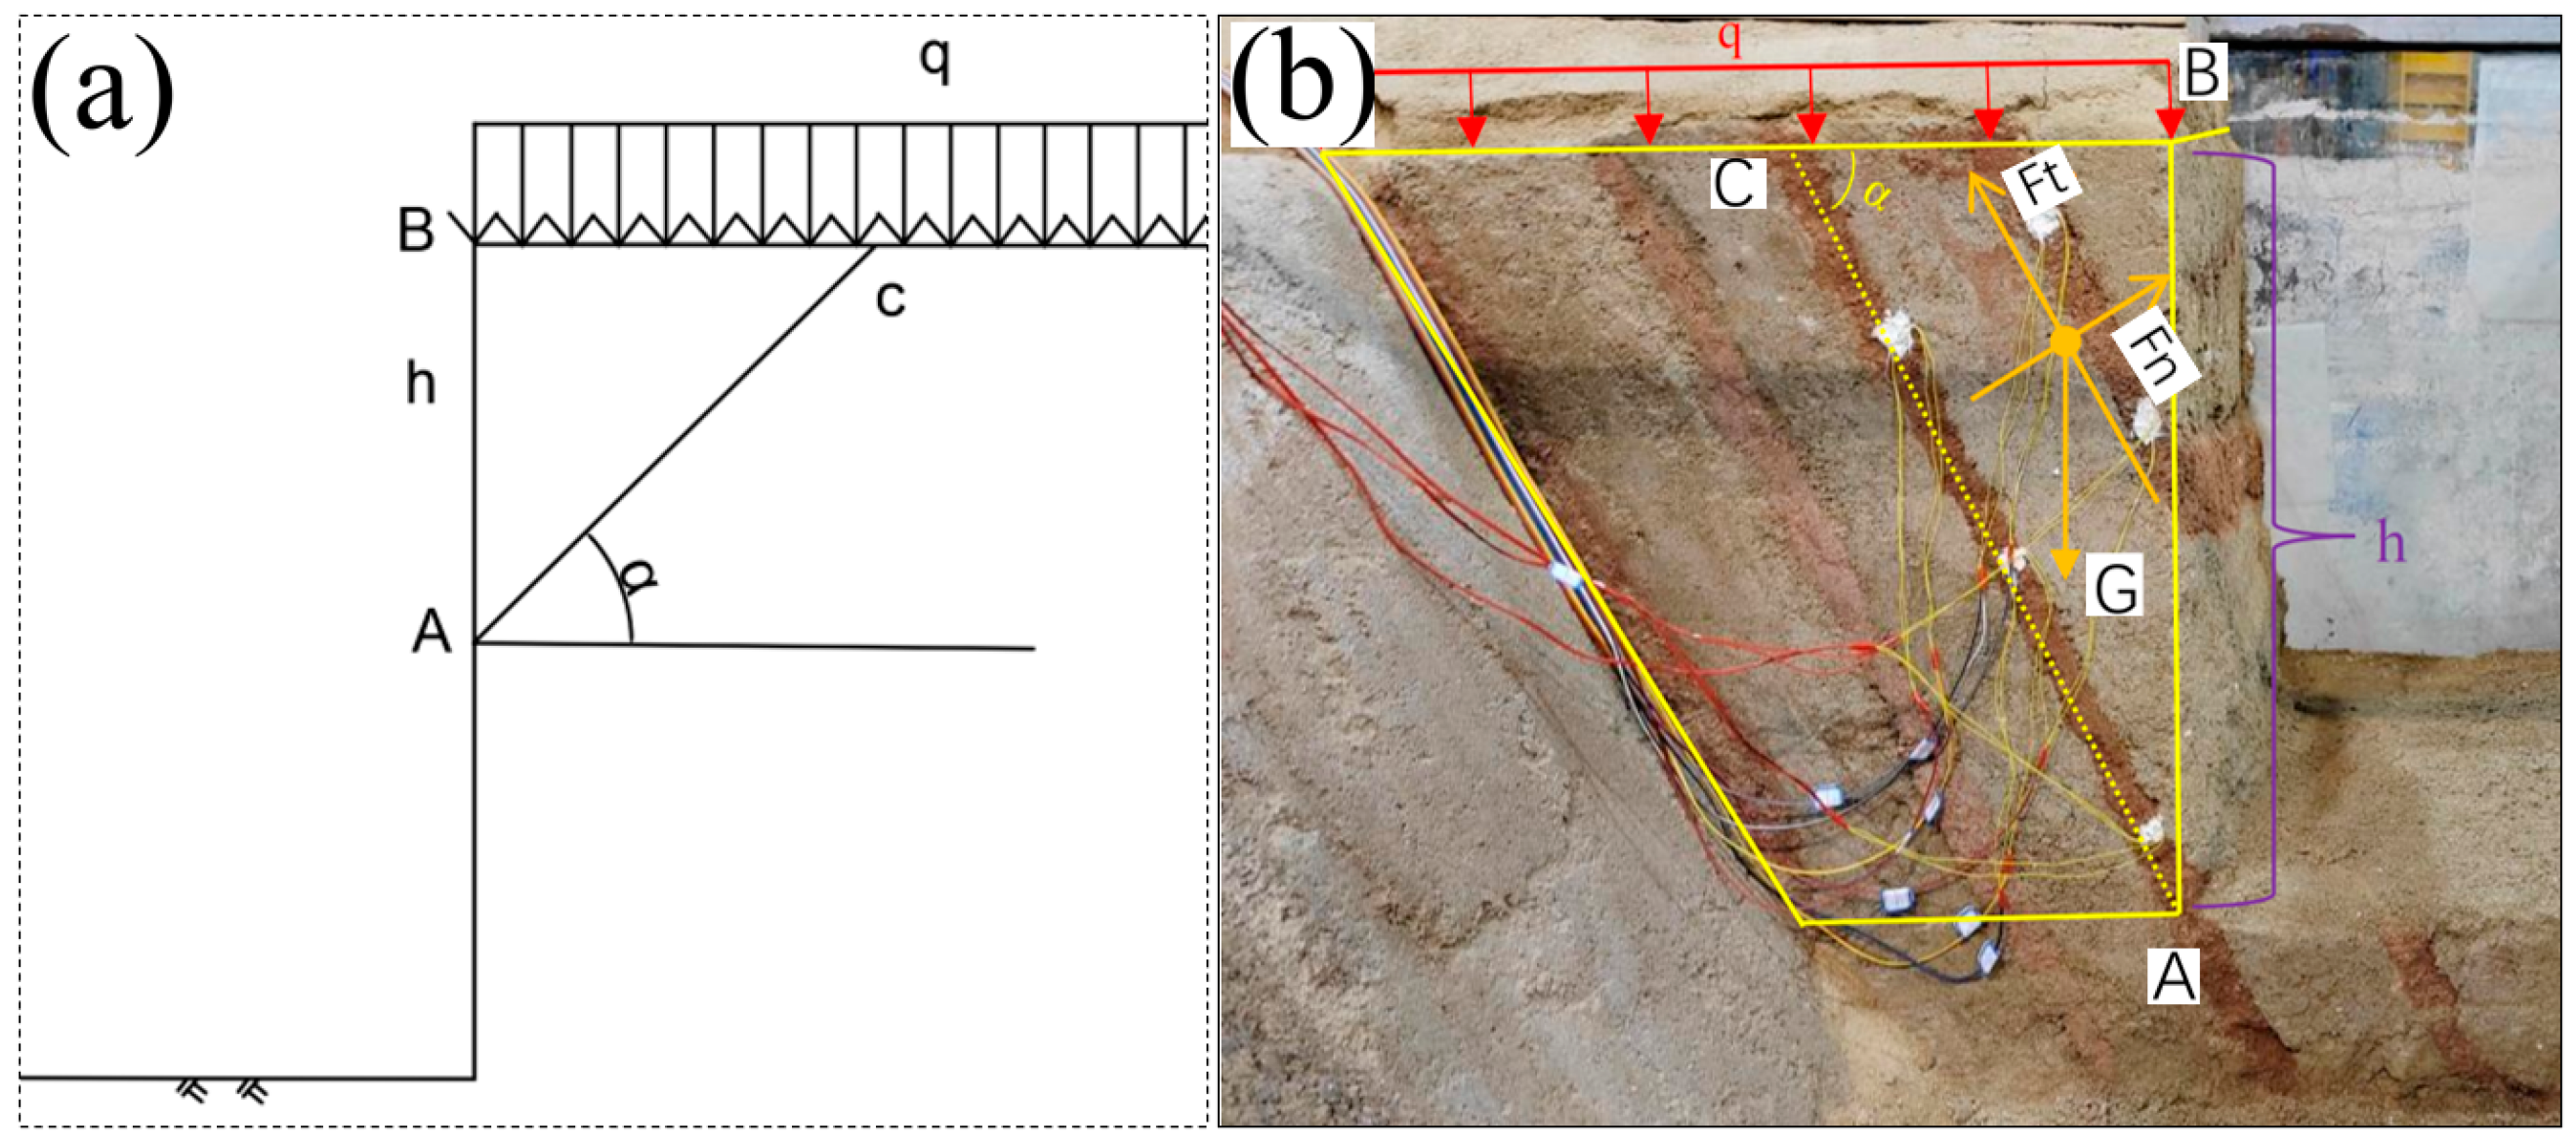
Figure 5.
Data on strain gauges in excavation tests: (a) data for the points A, B, C, and D; (b) data for the points G, and H; (c) data for the points L, M, and N.
Figure 5.
Data on strain gauges in excavation tests: (a) data for the points A, B, C, and D; (b) data for the points G, and H; (c) data for the points L, M, and N.
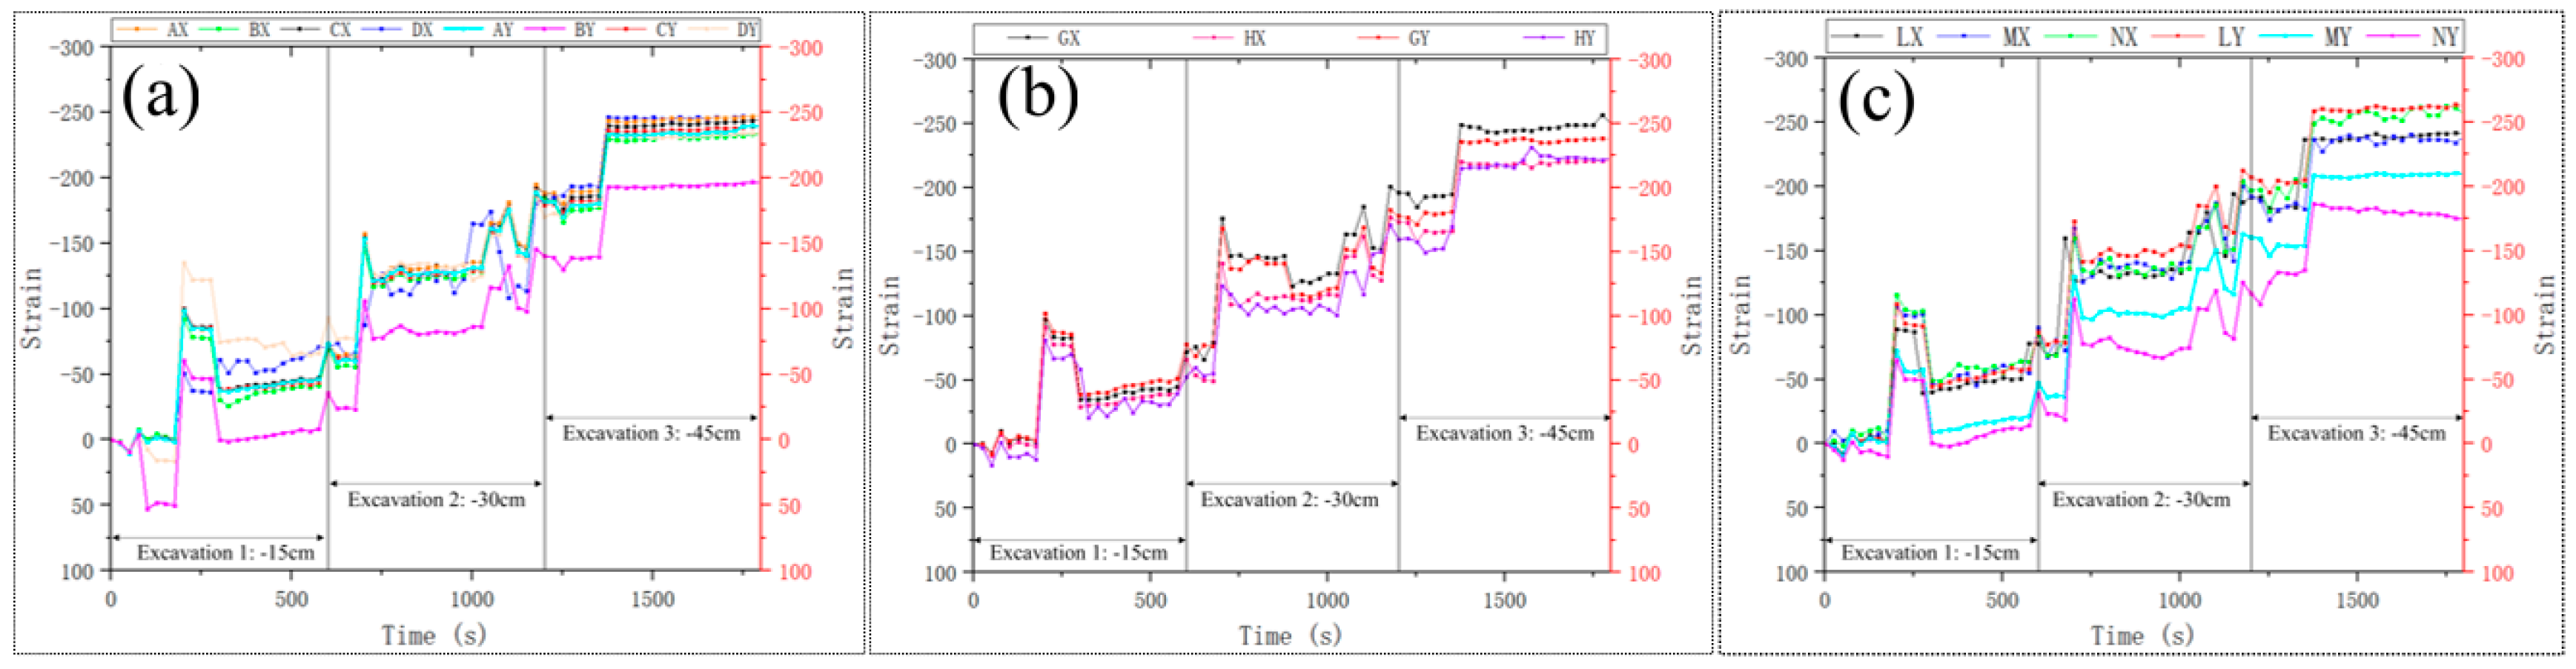
Figure 6.
Foundation loading test: (a) load 3.1kN; (b) load 5kN; (c) load 7kN; (d) load 9kN, (e) load and displacement data from electrohydraulic servo system.
Figure 6.
Foundation loading test: (a) load 3.1kN; (b) load 5kN; (c) load 7kN; (d) load 9kN, (e) load and displacement data from electrohydraulic servo system.
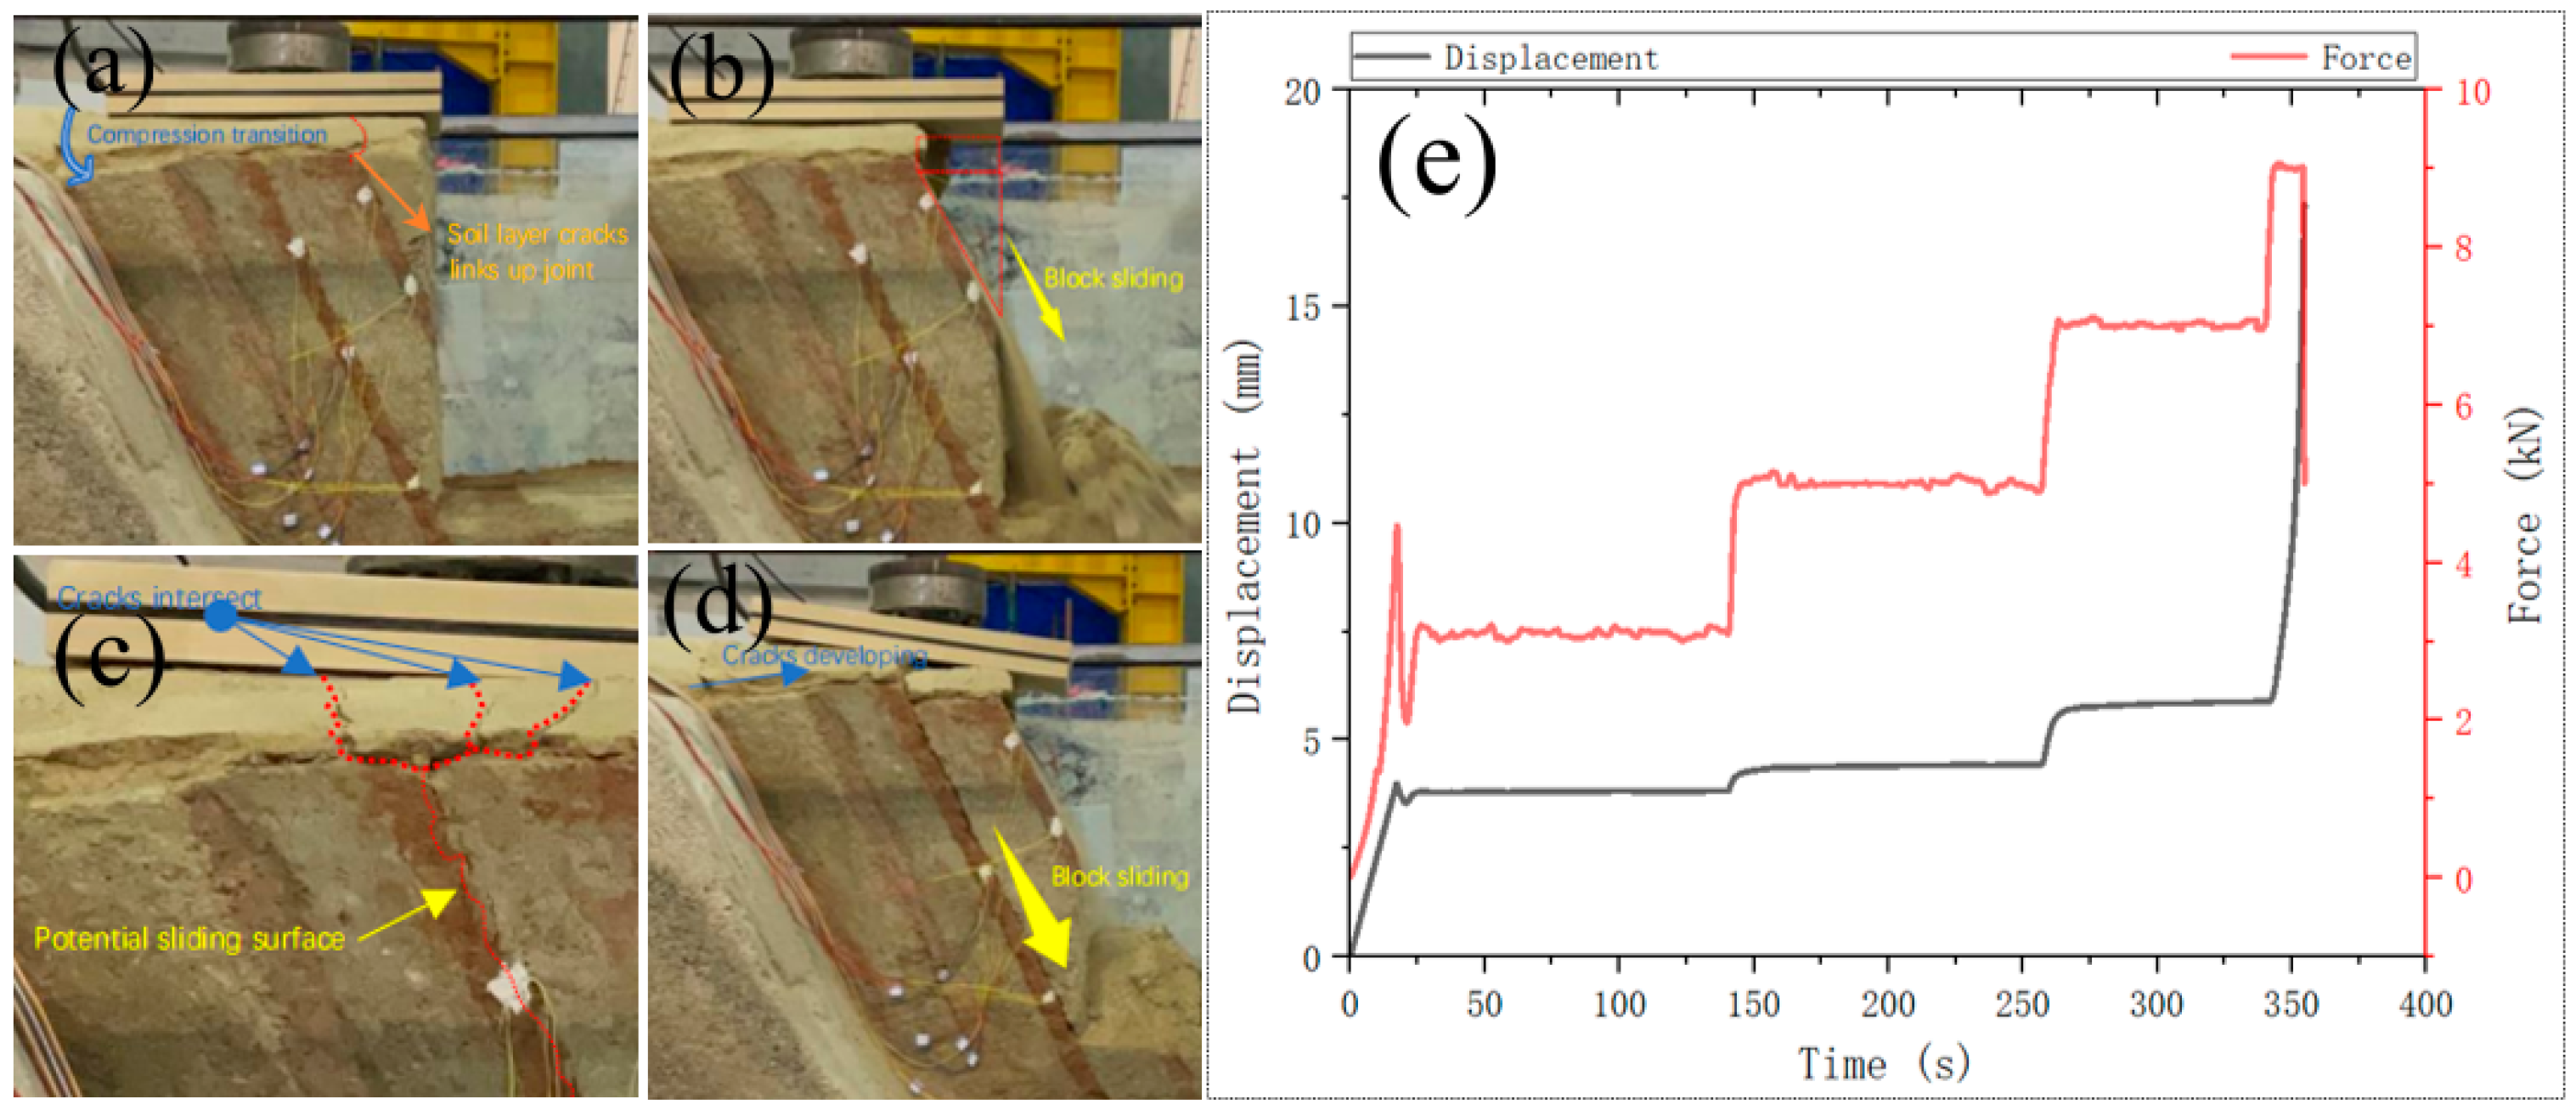
Figure 7.
Numerical simulation model.
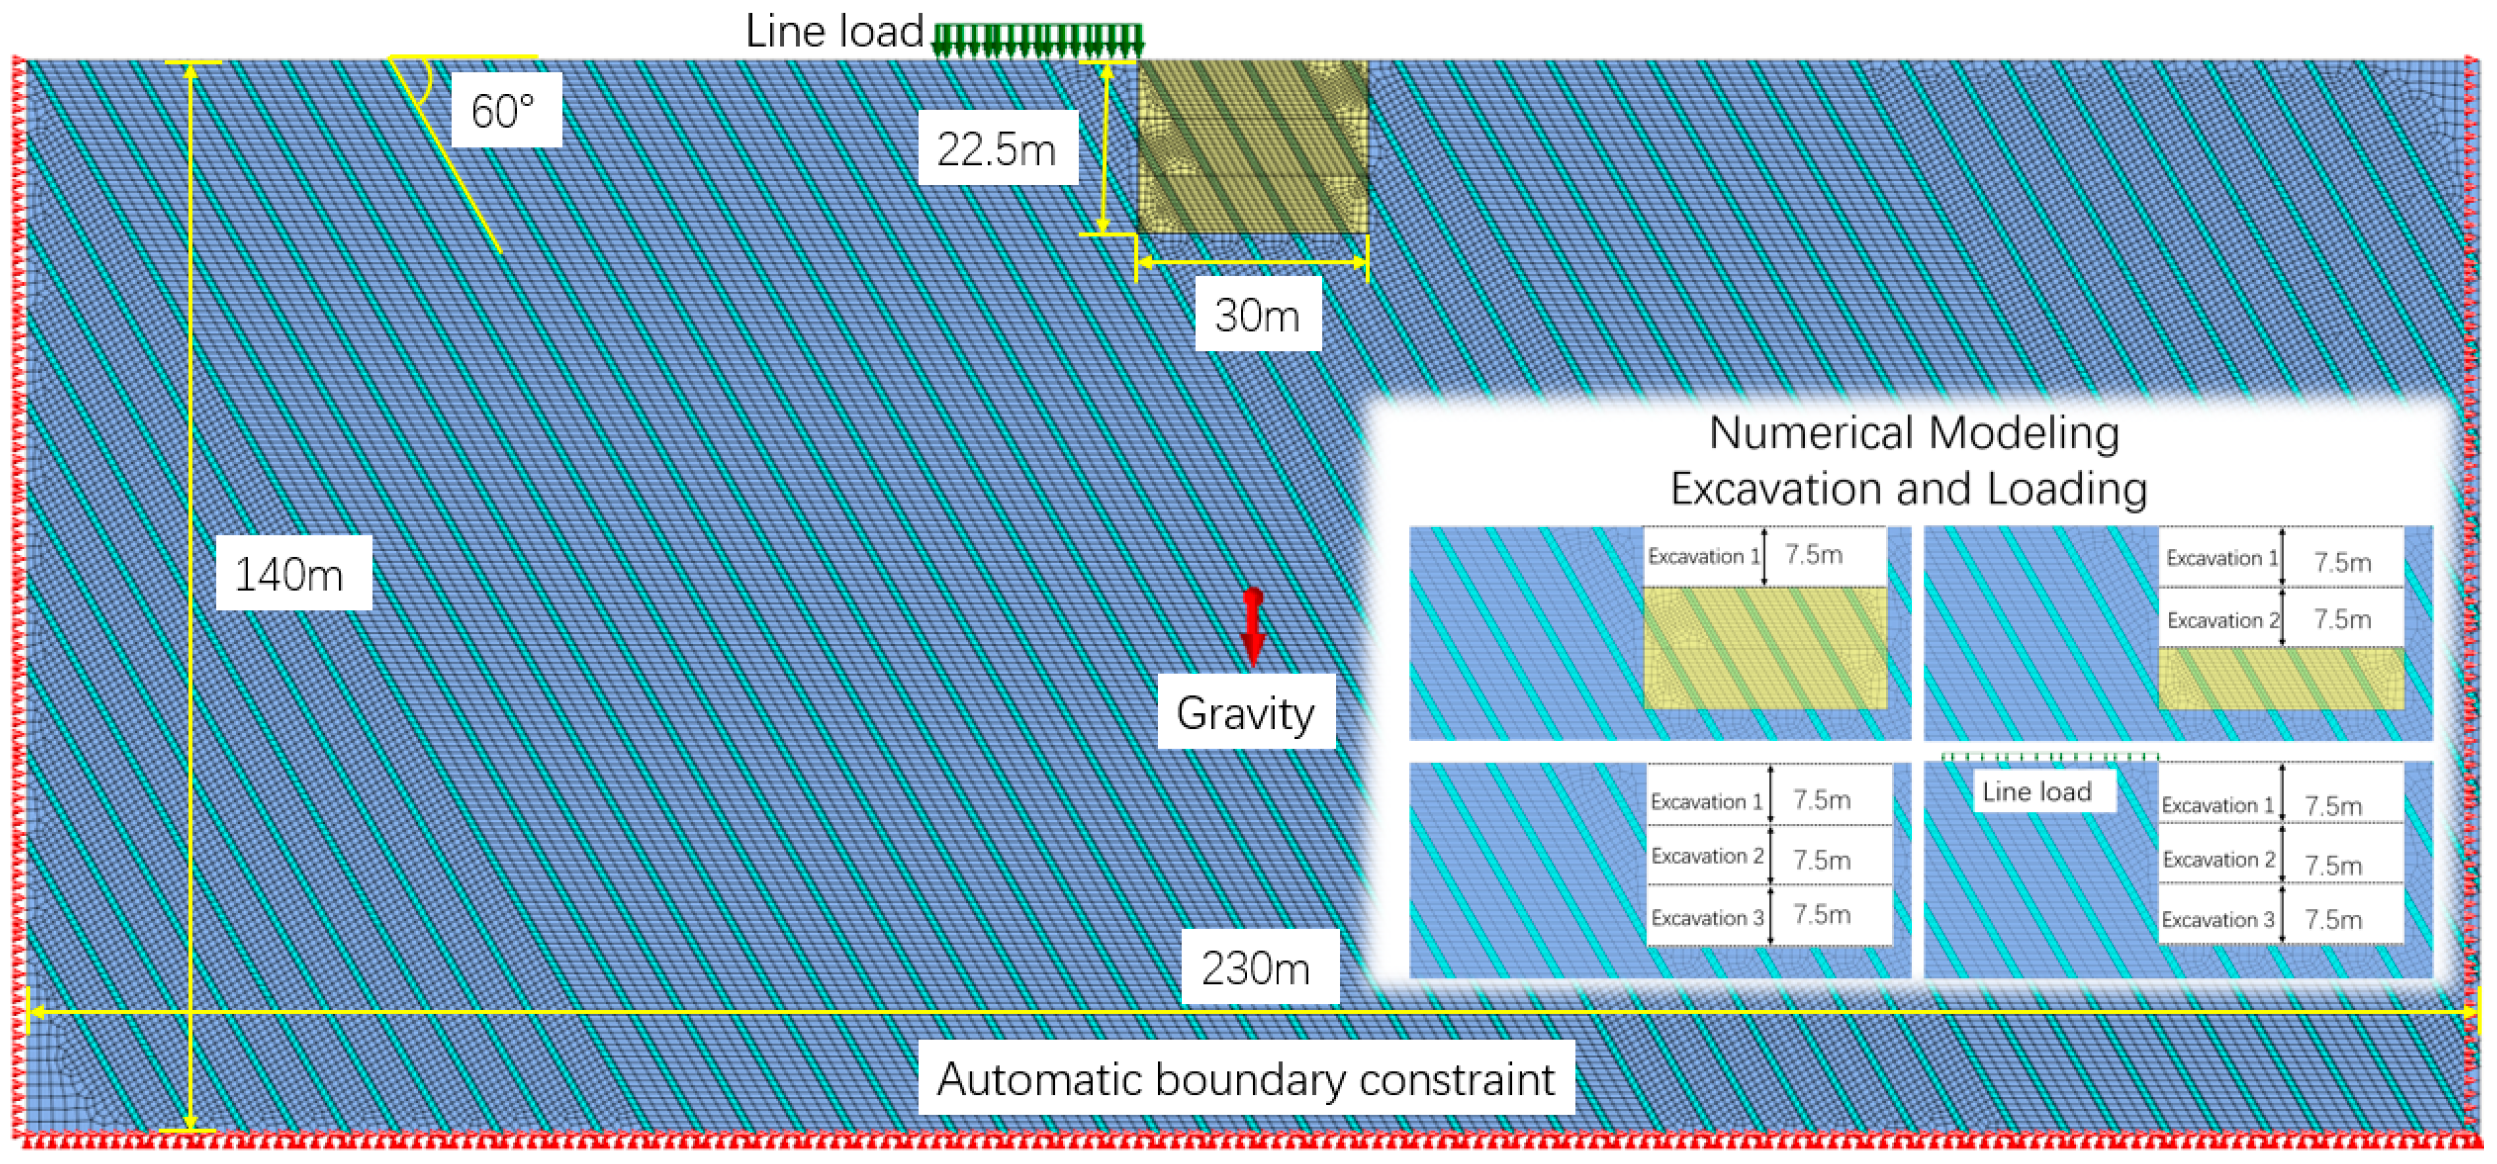
Figure 8.
Maximum displacement values for rocky foundation excavation and loading.
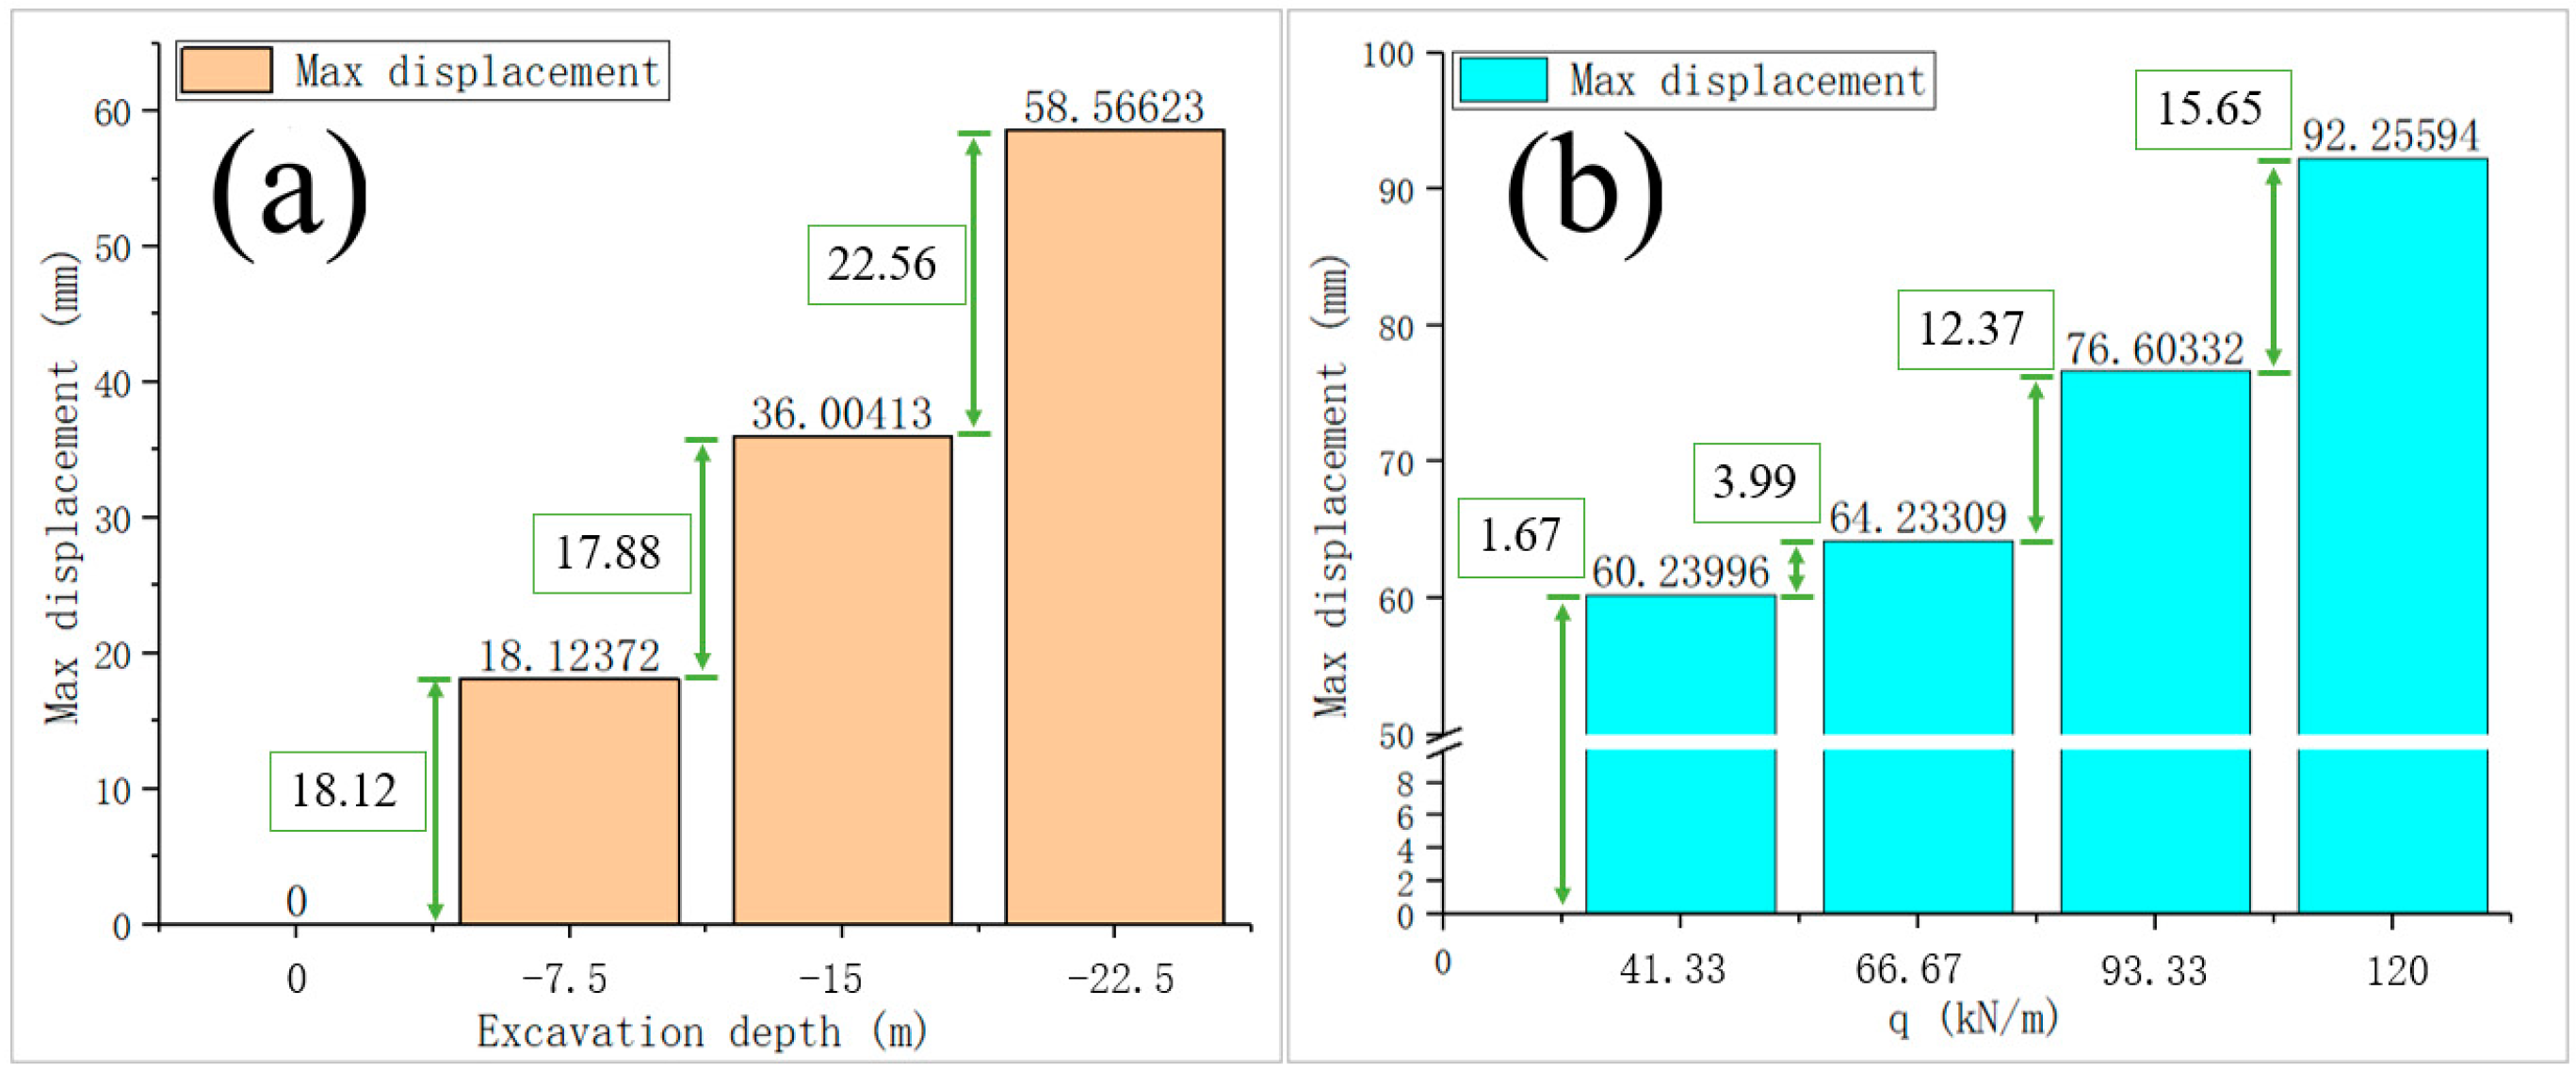
Figure 9.
Foundation plasticity zone development diagram:(a) load 43.92kN/m; (b) load 70.83kN/m; (c) load 99.17kN/m; (d) load 127.5kN/m.
Figure 9.
Foundation plasticity zone development diagram:(a) load 43.92kN/m; (b) load 70.83kN/m; (c) load 99.17kN/m; (d) load 127.5kN/m.
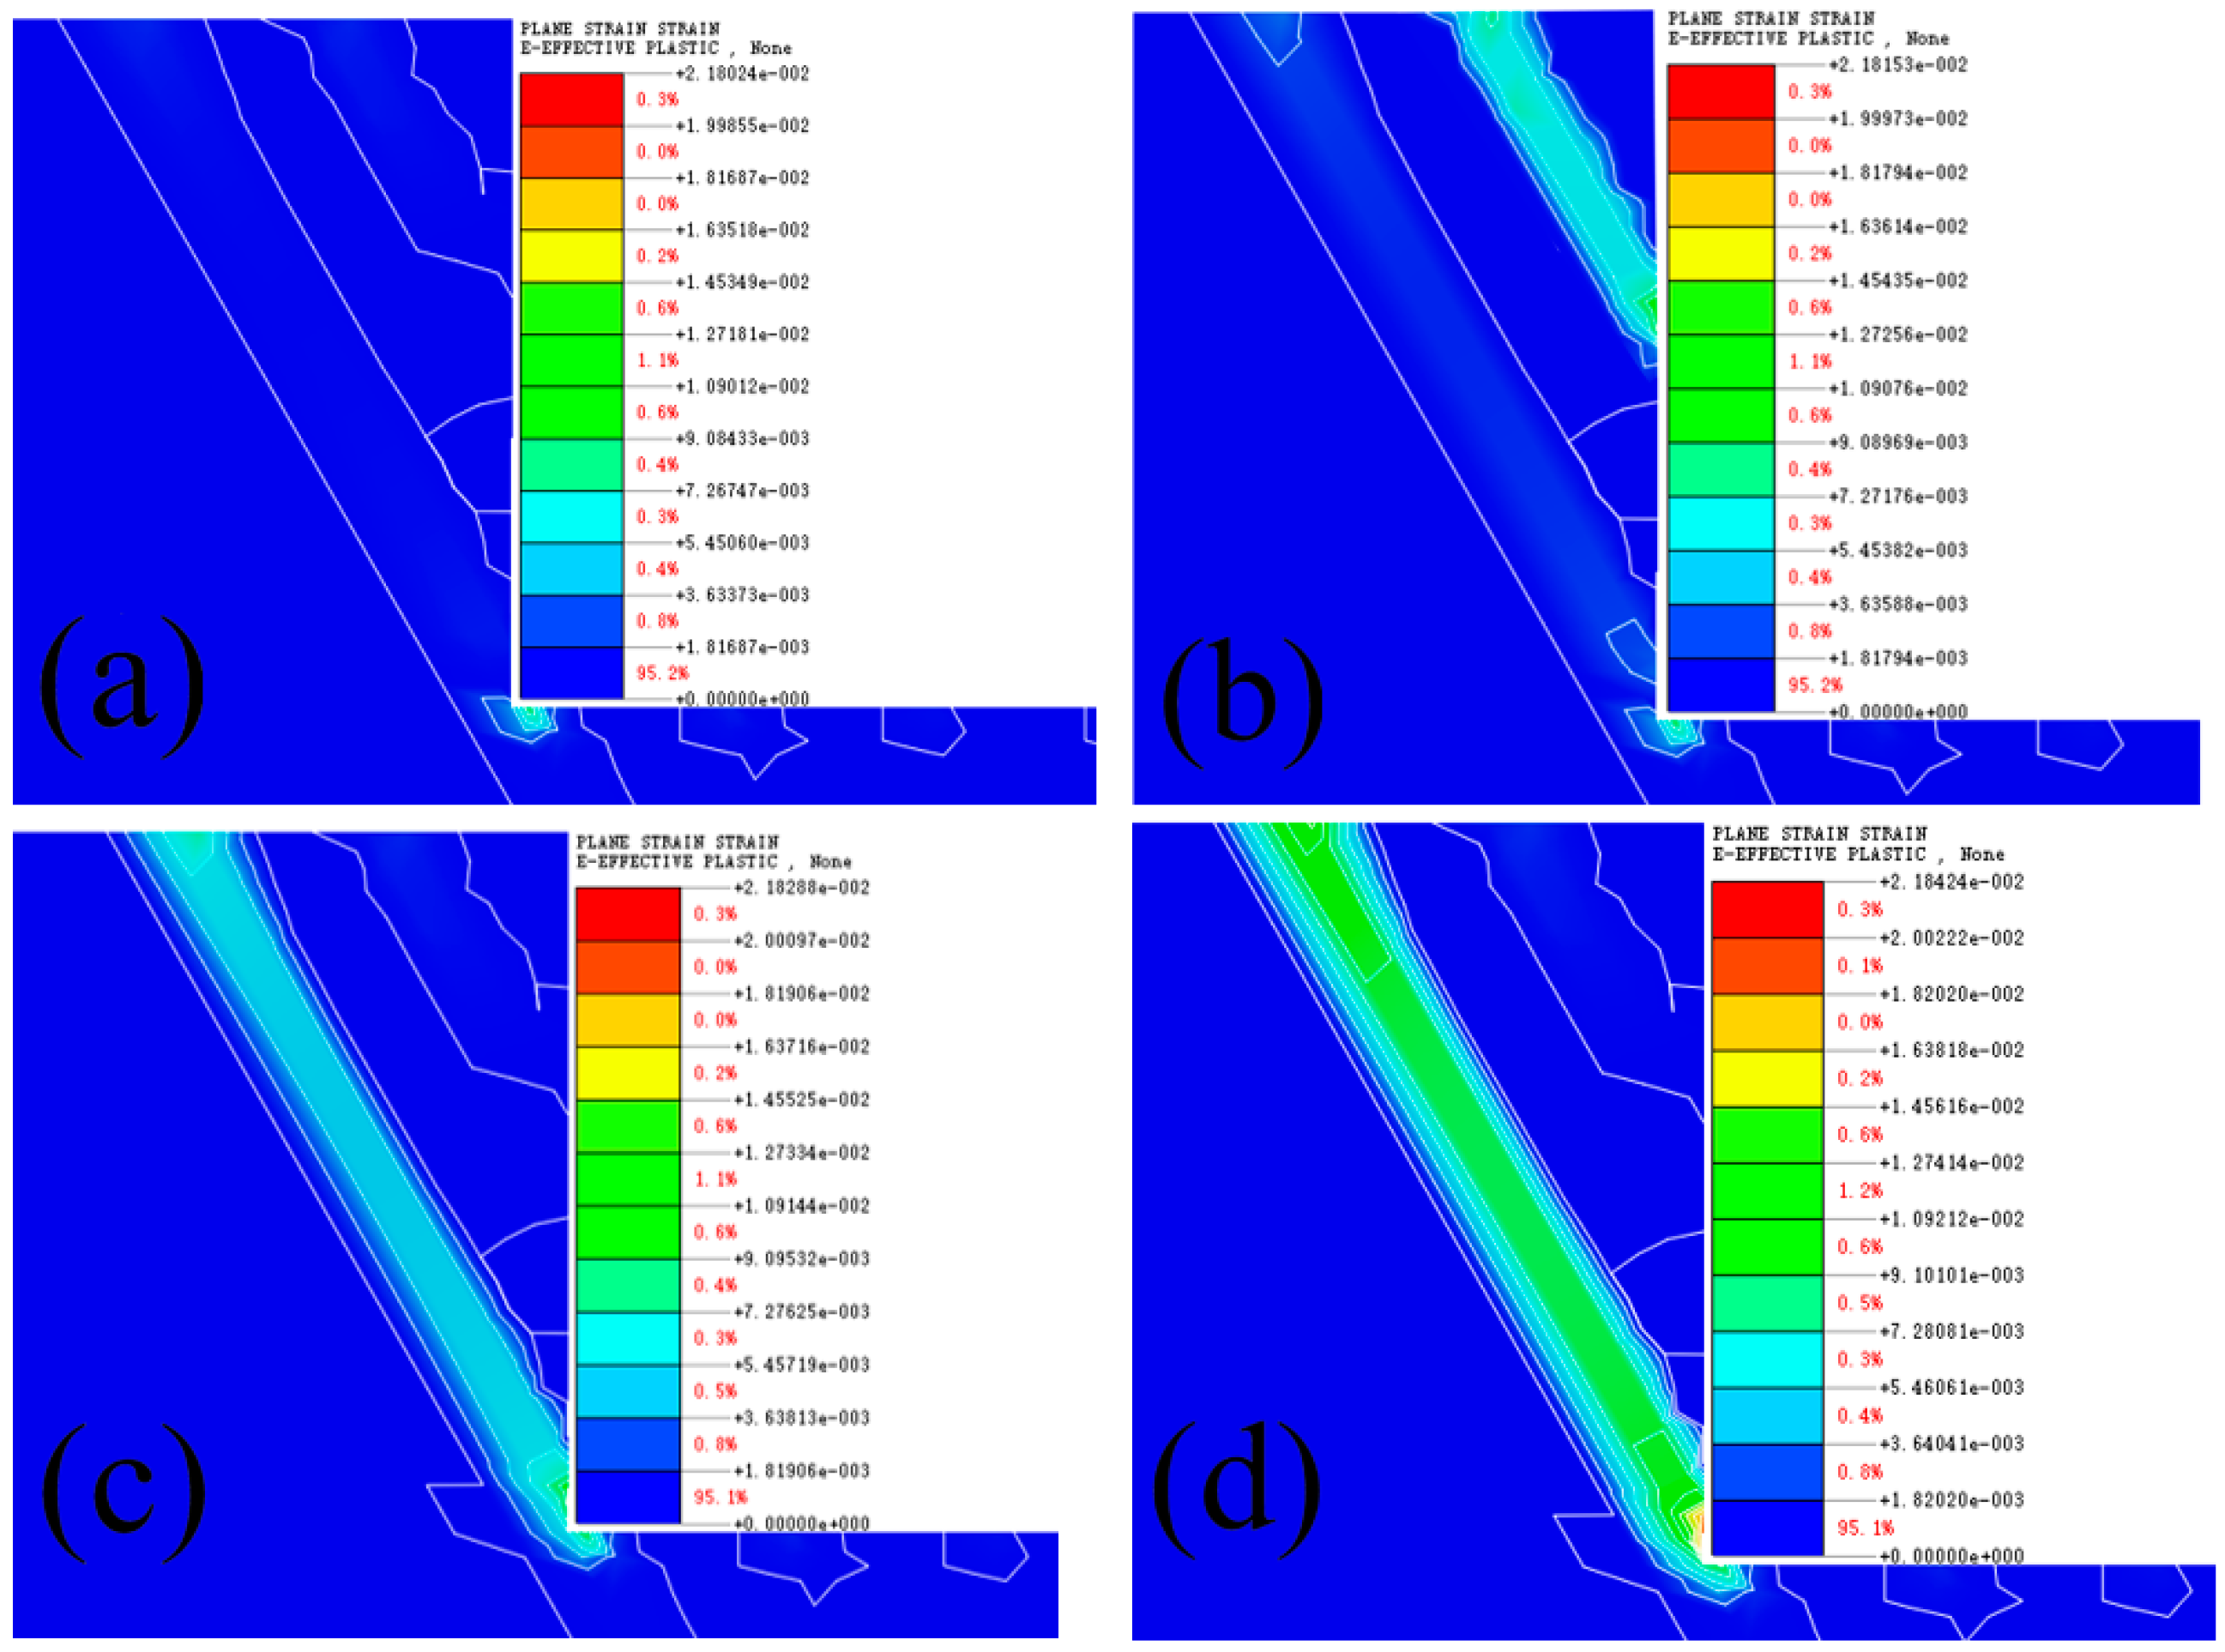

Table 1.
The mechanical parameters of the raw material and similar material.
| Parameter type | v | φ/(°) | γ/(kN/m3) | E/(MPa) | c/(kPa) | |
|---|---|---|---|---|---|---|
| Similarity ratio | Cv=1 | Cφ=1 | Cγ=1.2 | CE=60 | Cc=60 | |
| Rock structure(R-S) | raw material | 0.25 | 35 | 22.5 | 5000 | 600 |
| similar material | 0.25 | 35 | 18.75 | 83.33 | 10 | |
| Structural surface(S-S) | raw material | 0.38 | 30 | 20.5 | 50 | 100 |
| similar material | 0.38 | 30 | 17.08 | 0.83 | 1.67 | |
Table 2.
The material ratio of the rock structure(R-S) and structural surface(S-S).
| Classification | Ratio of concrete and gypsum | Ratio of water and solid material | Ratio of cementitious material and B-P&S | Ratio of barite powder and sand |
|---|---|---|---|---|
| Rock structure(R-S) | 1:1 | 1:7 | 1:30 | 1:10 |
| Structural surface(S-S) | 1:1 | 1:7 | 1:30 | 0:10 |
Note: the B-P&S is barite powder and sand.
Disclaimer/Publisher’s Note: The statements, opinions and data contained in all publications are solely those of the individual author(s) and contributor(s) and not of MDPI and/or the editor(s). MDPI and/or the editor(s) disclaim responsibility for any injury to people or property resulting from any ideas, methods, instructions or products referred to in the content. |
© 2024 by the authors. Licensee MDPI, Basel, Switzerland. This article is an open access article distributed under the terms and conditions of the Creative Commons Attribution (CC BY) license (http://creativecommons.org/licenses/by/4.0/).
Copyright: This open access article is published under a Creative Commons CC BY 4.0 license, which permit the free download, distribution, and reuse, provided that the author and preprint are cited in any reuse.


