
Submitted:
14 December 2024
Posted:
16 December 2024
You are already at the latest version
Abstract
Nitrogen (N) is an essential determinant of strawberry growth and productivity. However, plants exhibit varying preferences for nitrogen sources, which ultimately affects its use efficiency. Thus, it is imperative to determine the preferred N source for the optimization of indoor strawberry production. This study employed the ¹⁵N-tracer technique to investigate the effects of N sources on N uptake, distribution, use efficiency and growth of 'Praratchatan 80' strawberries in a greenhouse. Five treatments were applied: T1 (5.0 mM ¹⁵NO₃⁻), T2 (2.5 mM ¹⁵NO₃⁻ + 2.5 mM NH₄⁺), T3 (5.0 mM ¹⁵NH₄⁺), T4 (2.5 mM ¹⁵NH₄⁺ + 2.5 mM NO₃⁻), and T5 (N-free, control) in a completely randomized design. Significant (p < 0.05) differences were observed in N uptake, distribution, and total N concentration among treatments. Sole NH₄⁺ promoted early N uptake and accelerated flowering, while NO₃⁻ enhanced vegetative growth and later-stage N use efficiency (NUE). The combined NO₃⁻ and NH₄⁺ application was most efficacious, balancing the benefits of both N forms. NO₃⁻ treatment enhanced ¹⁵NUE by 46% compared to NH₄⁺, and mixed N sources demonstrated superior and consistent ¹⁵NUE over time. NH₄⁺ alone or with NO₃⁻ expedited flowering by 20 days compared to sole NO₃⁻ and N-free treatments. This study elucidates the importance of N sources for optimizing strawberry growth and flowering, providing a foundation for developing tailored N management strategies. Future research should focus on refining mixed N application ratios and timings, exploring molecular mechanisms of N metabolism, and evaluating long-term impacts on strawberry production sustainability.
Keywords:
Nitrate
; ammonium
; nitrogen sources
; uptake
; distribution
; 15N-tracer
; Praratchatan 80
1. Introduction
Strawberry (Fragaria × ananassa Duch.) is an important horticultural fruit crop. Its fruits are revered by consumers worldwide owing to their distinctive taste, appearance, and nutritional value [1]. The total global annual farm gate value of strawberries and other temperate berry crops is approximately USD 3.7 billion, accounting for more than 50% of this value [2]. Moreover, the global production of strawberries was 14.5 million metric tons in 2019, reflecting their widespread cultivation and consumption [3]. The major producers of strawberries include the USA, Mexico, Turkey, Spain, and China, with China leading in both area and yield [4]. Strawberries are rich in health-promoting compounds, such as antioxidants, including vitamin C, polyphenols, and flavonoids, which can combat oxidative stress and reduce the risk of chronic diseases, such as cancer, cardiovascular diseases, and neurodegenerative disorders [5,6,7]. Strawberry fruits are rich in essential vitamins and minerals that support overall health [8]. They provide a good amount of dietary fiber, which aids in digestion and helps maintain a healthy gut [8]. Hence, the high nutritional value and adaptability of strawberries contribute to their global popularity and demand.
Nitrogen is the primary nutrient that determines strawberry productivity [9]. Adequate nitrogen feeding is essential for optimal strawberry plant growth indices, including leaf area, shoot and root biomass, and overall plant height. Studies have shown that nitrogen application enhances these growth parameters, leading to healthier and more robust plants [10,11]. Optimal nitrogen levels correlated with maximum fruit yield. However, insufficient and excessive nitrogen can reduce yield, indicating the need for balanced nitrogen application [10,11,12]. Nitrogen also affects various aspects of fruit quality, such as size, sugar content, acidity, and phenolic compounds. For example, higher nitrogen levels can increase the total soluble sugar and anthocyanin content, enhancing the sweetness and color of the fruit [10,11,12,13].
Nitrogen availability is critical for crop production because it plays a crucial role in photosynthesis, protein synthesis, and other essential metabolic processes [14,15,16]. Nitrogen is also a critical component of chlorophyll that captures light energy. It also affects the synthesis of photosynthetic enzymes and proteins that are essential for photosynthesis [17,18]. Nitrogen is a fundamental element in the metabolism of amino acids, which are the building blocks of proteins. Enzymes involved in nitrogen metabolism, such as nitrate reductase and glutamine synthetase, facilitate the conversion of absorbed nitrogen into amino acids, which are then used to synthesize proteins necessary for plant growth and development [19,20]. It also enhances plant resistance to environmental stress by regulating hormone levels and other metabolic processes. Plant hormones such as cytokinin and ethylene play roles in root-shoot development and stress responses. Nitrogen availability and ethylene interactions can modulate various physiological processes, including leaf gas exchange and root architecture [21,22]. Nitrogen deficiency can lead to reduced leaf area, early senescence, and lower biomass, ultimately affecting crop yield and quality [20,23,24,25].
However, excess nitrogen application adversely affects crop production, quality, and the environment (Jing et al., 2020). Understanding the mechanism of N uptake is essential to optimize strawberry plant consumption efficiency of nitrogen [26]. Typically, plants acquire nitrogen from the soil in the form of ammonium (NH₄⁺) and nitrate (NO₃⁻), which are essential for overall plant growth and productivity [27,28,29,30,31,32]; some plant species prefer one source over another. This preference is typically linked to the physiological adaptation of plants to their habitat [33]. NO₃⁻ is generally more abundant in soils and less likely to cause toxicity. It is often the preferred form for many crops because of its mobility in soil and ease of uptake [27,28,29,30,31,32]. NH₄⁺, on the other hand, can be beneficial in small amounts but may cause toxicity at high concentrations, leading to root inhibition and shoot chlorosis [27,28,29,30,31,32]. Thus, combining nitrate and ammonium can enhance plant growth more effectively than either form alone can. This combination can improve nitrogen uptake, growth, and overall crop productivity [27,28,29,30,31,32,34]. An essential method for regulating the relative absorption of nitrogen is to alter the ratio of NH4+ to NO3- in the plant nutrient solution [35]. For instance, in their 15N tracer study on hippeastrum, Inkham, Panjama [26] found that plants fed a combination of NH4+ and NO3- had higher total dry weight, higher total nitrogen concentration, and broader nitrogen dispersion in the foliage.
Numerous studies have been conducted on the uptake and movement of nitrogen in plants and to explore the 15N tracer technique [26,36,37,38,39,40,41,42]. The 15N tracer technique is a powerful tool for investigating the absorption and transport of nitrogen in plants. It allows researchers to trace the fate of nitrogen, including its uptake by roots, translocation to leaves, and distribution within the plant [42,43]. Previous studies have suggested that the uptake and utilization of nitrogen by strawberry plants is a complex process that can be affected by the type of nitrogen source [44]. Current research provides limited insights into how different nitrogen sources, particularly ammonium (NH4+) and nitrate (NO3-), influence nitrogen uptake, distribution, and utilization in strawberry plants. This knowledge gap hinders the development of optimized fertilization strategies that can enhance strawberry yield and quality. Despite the recognized importance of nitrogen, the specific influence of different nitrogen sources on uptake and allocation patterns in strawberry plants, particularly in the 'Praratchatan 80' cultivar under evaporative greenhouse conditions, remains poorly understood. Thus, more research is needed to increase our understanding of the effects of nitrogen sources on nitrogen uptake and utilization in strawberry plants. Therefore, the present study aimed to evaluate the effects of sources on the uptake and distribution of nitrogen in cultivar ‘Praratchatan 80' strawberries under evaporative greenhouse conditions using the 15N-tracer technique. The findings of this study will guide the judicious application of nitrogenous fertilizers in strawberry production and form the basis for further empirical research in this domain.
2. Results
2.1. Growth
2.1.1. Growth Indices of Strawberry in Response to Varying Nitrogen Sources
The growth response of 'Praratchatan 80' strawberry plants to varying nitrogen sources was evaluated in terms of leaf number, plant height, and crown formation at 8 weeks after treatment (Table 1). The results showed significant variations (p < 0.05) attributable to the nitrogen source.
The nitrate-only treatment (5 mM 15NO₃⁻) produced the plants with the highest leaf number (x = 17.00). Conversely, plants receiving mixed nitrogen sources (2.5 mM 15NO₃⁻ + 2.5 mM NH₄⁺ and 2.5 mM 15NH₄⁺ + 2.5 mM NO₃⁻) exhibited significantly lower leaf numbers, with the N-free treatment recording the lowest number of leaves throughout the observation period.
Plant height (cm) was also significantly influenced by the nitrogen source (Table 1). At 4 WAT, the 15NO3-/NH4+ mixed-source treatment (2.5 mM 15NO₃⁻ + 2.5 mM NH₄⁺) resulted in the tallest plants (22.94 cm), followed by the nitrate-only and ammonium-only treatments (21.50 and 21.30 cm, respectively). At 6 WAT, the nitrate-only treatment achieved the greatest plant height (23.71 cm), whereas the control treatment exhibited the shortest plants (17.65 cm). At 8 WAT, all the nitrogen treatments equalized; however, plants treated with 2.5 mM 15NH₄⁺ + 2.5 mM NO₃⁻ attained the greatest height of 24.60 cm.
Another critical vegetative growth parameter in strawberries is crown formation, which was notably higher in the 15Nitrate-only treatment, with a mean of 1.20 crowns per plant. However, this was comparable to other treatments, with an average of 1.00–1.16 crowns per plant.
2.1.2. Effects of Nitrogen Source on Stolon Production
The influence of nitrogen source on stolon production per plant in 'Praratchatan 80' strawberry is summarized in Table 1. Nitrogen availability significantly (p < 0.05) influenced the number of stolons per plant. The 15NH₄⁺ mixed with regular NO3- (2.5 mM 15NH₄⁺ + 2.5 mM NO₃⁻) yielded the highest stolon production (2.62 stolons per plant); however, this result is not statistically different from other treatments except the control. Stolon production was absent in the control group, indicating that nitrogen was necessary for stolon production.
2.1.3. Fresh and Dry Weights of Strawberry Plants
The effects of different nitrogen sources on the fresh and dry biomass accumulation of 'Praratchatan 80' strawberries are represented in Figure 1. The results indicated significant (p < 0.05) effects of the nitrogen source treatments on biomass production. In terms of fresh weight, significant differences were observed (p < 0.05), with the nitrate-only treatment (5 mM 15NO₃⁻) producing the highest mean fresh weight (73.32 g, which was significantly higher than 2.5 mM 15NO3- + 2.5 mM NH4+. The control treatment resulted in a lower mean fresh weight of 23.16 g. Similarly, significant differences were observed in the dry weights of the strawberry plants (p < 0.05). The nitrate-only treatment (5 mM 15NO₃⁻) produced plants with the highest dry biomass (x̄ = 19.39 g), which was statistically similar to that of the other nitrogen treatments. However, N-free treatment resulted in the lowest dry weight (x̄ = 7.05 g).
2.2. Nitrogen Distribution and Utilization in Strawberry in Response to Nitrogen Sources
2.2.1. Total Nitrogen Concentration in Strawberry Parts at 30 and 60 DAT
The total nitrogen concentration exhibited significant variation (p < 0.05) among strawberry plant parts at 30 and 60 days after treatment (DAT), as presented in Table 2. At 30 DAT, plants supplied with 5 mM 15NH4+ exhibited the highest total nitrogen concentration (68.36 mg N/gDW), significantly (p < 0.05) higher than all other treatments. Plants treated with 5 mM 15NO3- had the second-highest total nitrogen concentration (40.28 mg N/gDW). Those treated with 2.5 mM 15NO3 + 2.5 mM NH4 and 2.5 mM 15NH4+ + 2.5 mM NO3 showed similar total nitrogen concentrations (23.18 and 22.67 mg N/gDW, respectively). The control group had the lowest total nitrogen concentration (3.77 mg N/gDW).
At 60 DAT, the total nitrogen concentration decreased in all treatments except for the control group. Plants treated with 2.5 mM 15NH4 + 2.5 mM NO3 had the highest total nitrogen concentration (19.41 mg N/gDW), followed by those treated with 5 mM 15NO3 (20.26 mg N/gDW). Plants treated with 2.5 mM 15NO3 + 2.5 mM NH4 and 5 mM 15NH4 had similar total nitrogen concentrations (17.68 and 17.17 mg N/gDW, respectively). The control group showed a significant increase in total nitrogen concentration (10.37 mg N/gDW) compared to 30 DAT. The control treatment consistently displayed the lowest total nitrogen concentrations across all time points and plant parts.
2.2.2. Nitrogen Distribution (%) in Strawberry Organs
The nitrogen distribution (%) among the strawberry plant parts exhibited significant variation (p < 0.05) with the treatment and sampling stages (Table 3, Figure 2). At 30 DAT, the proportion of nitrogen allocated to leaves and roots differed significantly. The 2.5 mM 15NO3- + 2.5 mM NH4+ treatment demonstrated the highest proportion of nitrogen in leaves (51.70%), while the 2.5 mM 15NH4+ + 2.5 mM NO3- treatment exhibited the highest root nitrogen allocation (52.29%). In contrast, the 5 mM 15NH4+ treatment resulted in a relatively balanced nitrogen distribution between the leaves (49.61%) and roots (50.40%).
At 60 DAT, notable shifts in nitrogen allocation patterns were observed in leaves, roots, stolons, and fruits. The 5 mM 15NH4+ and 2.5 mM 15NH4+ + 2.5 mM NO3- treatments and the control exhibited the highest nitrogen distribution to leaves (33.37%, 32.92% and 32.64%, respectively). Concurrently, the control treatment allocated a significantly higher proportion of nitrogen to fruits (40.65%) than the other treatments did. The 2.5 mM 15NO3- + 2.5 mM NH4+ treatment maximized root nitrogen allocation (31.91%), indicating a distinct partitioning strategy compared to the nitrate or ammonium-only treatments. Stolon nitrogen allocation was highest in the 2.5 mM 15NH4+ + 2.5 mM NO3- treatment (26.27%), while the nitrogen-free control exhibited no stolon production.
2.2.3. Labeled N Concentration in Leaves, Roots, Fruits, and Stolons
The results indicate significant (p < 0.05) among the treatments in terms of labeled N concentration in strawberry plant parts (Table 4). At 30 DAT, the highest 15N concentration was observed in the leaves of strawberry plants treated with 5 mM 15NO3 (13.11 mg 15N/g DW), followed by those treated with 5 mM 15NH4 (9.25 mg 15N/g DW). Plants treated with 2.5 mM 15NO3 + 2.5 mM NH4 and 2.5 mM 15NH4 + 2.5 mM NO3 showed lower 15N concentrations (7.41 and 5.67 mg 15N/g DW, respectively). After correcting for the nitrogen dose, the 15N concentration was highest in plants treated with 2.5 mM 15NO3 + 2.5 mM NH4 (14.82 mg 15N/g DW), followed by those treated with 5 mM 15NO3 (13.11 mg 15N/g DW).
At 60 DAT, the 15N concentration in leaves was highest in plants treated with 5 mM 15NO3 (3.58 mg 15N/g DW), while the concentration in fruits was highest in those treated with 5 mM 15NH4 (2.91 mg 15N/g DW). The total 15N concentration was highest in plants treated with 5 mM 15NO3 (3.58 mg 15N/g DW), followed by those treated with 5 mM 15NH4 (3.28 mg 15N/g DW). After correcting for the nitrogen dose, the total 15N concentration was highest in plants treated with 2.5 mM 15NO3 + 2.5 mM NH4 and 2.5 mM 15NH4 + 2.5 mM NO3 (3.98 and 3.94 mg 15N/g DW, respectively).
2.2.4. 15N-Use Efficiency
The labeled nitrogen-use efficiency exhibited significant variation (p < 0.05) across treatments at 30 and 60 days after treatment (Table 5). At 30 DAT, the highest 15NUE was observed in T2 (91.42%), followed by T1 (87.91%). Conversely, T3 demonstrated the lowest efficiency of 39.37%, indicating reduced nitrogen utilization efficiency under ammonium conditions compared with nitrate or mixed nitrogen sources.
At 60 DAT, a general decline in 15NUE was observed across all treatments because the labeled N application was terminated after 30 days of treatment. T2 maintained its highest efficiency (51.04%), reflecting its superior nitrogen assimilation capacity over time, whereas T3 remained the lowest (27.77%). The average NUE across both sampling stages followed a similar trend (Figure 3), with T2 exhibiting the highest overall efficiency (71.23 %) and T3 the lowest (33.57%).
2.2.5. 15N Concentration Decrement Percentage
Furthermore, the 15N decrement (%) was significantly (p < 0.05) different among the treatments (Table 5). As the 15N treatments ceased at 30 days, the difference between the 15N concentrations at the two-time points indicated a marked reduction. The decrease was most pronounced in T1 (-57.89%) and lowest in T4 (-24.91%), highlighting the stabilizing effect of mixed nitrogen sources on nitrogen utilization efficiency.
2.3. Flowering
2.3.1. Time Taken to Flowering
The effect of nitrogen sources on the progression of blooming stages in 'Praratchatan 80' strawberry plants is presented in Table 6. The results indicated significant differences (p < 0.05) among treatments for all flowering phases.
Plants treated with ammonium-based or mixed ammonium and nitrate sources (5 mM 15NH4+, 2.5 mM 15NH4+ + 2.5 mM NO3-, and 2.5 mM 15NO3- + 2.5 mM NH4+) initiated blooming significantly earlier (about 22 days) than plants treated with nitrate alone or the control. Similar trends were observed for 50%, 75%, and 100% blooms. Treatments with ammonium or mixed nitrogen sources consistently resulted in faster blooming progression than nitrate-only or N-free conditions. For instance, 50% blooming was achieved in 31.13–33.25 days for ammonium-dominant treatments, whereas nitrate-only and N-free treatments required more than 52 days.
2.3.2. Flowering Characteristics of Strawberry Plants
The effects of different nitrogen sources on the flowering characteristics of 'Praratchatan 80' strawberry plants are shown in Figure 4. The results showed significant differences (p < 0.05) among treatments in terms of the number of inflorescences, number of florets per inflorescence, and total number of florets per plant. The data on the number of inflorescences and florets per inflorescence were subjected to cube root transformation.
Treatments incorporating ammonium (5 mM 15NH4+ and 2.5 mM 15NH4+ + 2.5 mM NO3-) yielded significantly (p < 0.05) more inflorescences than the sole nitrate or in combination with ammonium treatments and the control, with the highest value observed in the 5 mM 15NH4+ treatment (1.30). Similarly, the highest number of florets per inflorescence was observed in the 5 mM 15NH4+ treatment (7.63), which was significantly (p < 0.05) higher than that of all other treatments. The lowest number of florets per inflorescence was observed in the control (4.10). Furthermore, the application of 5 mM 15NH4+ resulted in the highest total number of florets per plant (9.78), which was significantly higher (p < 0.05) than that of the other treatments.
3. Discussion
This study investigated the effects of varying nitrogen sources, NO3- and NH4+, and their combinations on the uptake, distribution, and utilization efficiency of nitrogen, as well as the growth and flowering of 'Praratchatan 80' strawberry plants under greenhouse conditions, using the 15N tracer technique. The results revealed that nitrogen forms significantly influenced all measured parameters, underscoring the critical role of nitrogen dynamics in strawberry production.
3.1. Nitrogen Uptake and Distribution
The findings from this experiment indicated that ammonium application alone increased the early nitrogen concentration in both the leaves and roots of strawberry plants. Ammonium uptake often leads to acidification of the rhizosphere, which can enhance nutrient availability and uptake in the short term. This rapid uptake is why ammonium application results in higher early nitrogen concentrations in both the leaves and roots [45]. Ammonium uptake is energetically more efficient than nitrate uptake because it does not require reduction before assimilation into amino acids. This efficiency can lead to faster initial growth responses [46]. This indicated the rapid action of ammonium and its suitability for topdressing applications. Nitrate, on the other hand, must be reduced to ammonium before it can be assimilated into organic compounds. Nitrate is reduced to nitrite (NO2-) by nitrate reductase (NR) and to ammonium by nitrite reductase (NiR) [47], a process that occurs primarily in leaves and roots. Unlike ammonium, nitrate can be stored in the vacuoles. This storage capability allows plants to maintain a reserve of nitrate that can be utilized when the external supply is limited or during periods of high demand [48,49]. This delay can explain why the nitrate treatments in our experiment resulted in higher total nitrogen concentrations. It was also reported that molecular processes such as gene expression, pH modulation, transport mechanisms, and root hydraulic conductivity can significantly enhance or deter nitrate uptake in plants [30].
Regarding the labeled N concentration, combining NO3- and NH4+ maximized the total 15N (g/DW), as shown by the dose-corrected values. As nitrate is more mobile within the plant, it allows for better distribution to various plant parts over time, which could contribute to higher total nitrogen concentrations at later stages of plant growth. Moreover, combining ammonium and nitrate can maximize the efficiency of nitrogen use and enhance plant growth by balancing the benefits of both forms. The presence of both forms allows plants to optimize nitrogen uptake according to their immediate needs and environmental conditions [30,45].
Our finding that ammonium promotes early nitrogen uptake and assimilation in strawberries is corroborated by [36,45], while NO3- is more persistent and fairly distributed in plant parts. This has been corroborated [50]. Balanced co-application of NO3- and NH4+ has proved to be the best for many crops [30,45]. Overall, the nitrogen source and concentration significantly influenced nitrogen accumulation patterns, with ammonium-dominated treatments leading to higher early nitrogen uptake but showing reduced partitioning efficiency at later stages. The results highlight the dynamic interplay between nitrogen form and strawberry plant part-specific allocation over time.
3.2. Nitrogen Use Efficiency
Our findings indicate that labeled nitrate-nitrogen (15NO3-) enhances 15N utilization efficiency (15NUE) by approximately 46% compared to labeled ammonium (15NH4+). Additionally, a drastic reduction in 15N concentration was observed at 60 DAT in the nitrate treatments, signifying more effective and long-run nitrogen utilization in strawberry plants under nitrate-based fertilization. Increased 15NUE in nitrate treatments can significantly improve nitrogen use efficiency in strawberry plants, leading to reduced nitrogen loss and increased crop productivity. This is likely due to the enhanced activity of nitrate transporters and related metabolic pathways and the preference of strawberries for nitrate-N at the vegetative stage [36]. The current findings agree with [26,37], emphasizing the influence of nitrogen forms and concentration on plant nitrogen uptake and retention, with mixed nitrogen treatments demonstrating superior and more consistent 15NUE over time compared to the single nitrogen form.
3.3. Growth and Flowering Response of Strawberry to Nitrogen Sources
3.3.1. Vegetative Growth Parameters
Sole nitrate application increased the number of leaves of strawberry plants by approximately 30% compared with the sole application of ammonium. All nitrogen treatments equally increased plant height compared with that of the control. Nitrogen sources play a critical role in biomass accumulation, particularly during later stages of growth. Nitrate, as the sole nitrogen source, promoted both fresh and dry biomass production. Nitrate acts as a signaling molecule that regulates various physiological processes that are essential for plant growth and development. This includes the activation of nitrate transporters and genes involved in nitrate uptake, transport, and remobilization, which enhances nitrogen use efficiency and ultimately improves crop yields [51,52]. Nitrate generally promotes better growth and higher nitrogen use efficiency than ammonium [53]. Nitrate treatment also induces the expression of nitrate transporter genes (FaNRTs) in strawberry plants and their associated transcription factors, which are involved in nitrogen uptake and metabolism. This regulation enhances nitrogen use efficiency (NUE) and promotes growth [54]. However, this effectiveness may be limited by the decreased net assimilation rate and growth inhibition by excessive nitrate compared with mixed nitrogen sources [55,56].
Mixed nitrate-ammonium treatments also supported robust strawberry growth. This synergistic effect enhances nitrogen metabolism, photosynthesis, and auxin synthesis, promotes leaf growth, and creates a large sink for carbon and nitrogen use [28,30]. These results are supported by previous findings [30,57]. The absence of nitrogen drastically reduced biomass accumulation, highlighting its essential role in optimizing strawberry growth and development.
3.3.2. Flowering Performance
This study demonstrated significant variations in strawberry plant responses, contingent on the type of nitrogen treatment administered. The application of nitrate alone resulted in delayed flowering in 'Praratchatan 80' strawberry plants. Conversely, treatments incorporating ammonium, either independently or in combination with nitrate, expedited flowering by approximately 20 days relative to nitrate-only and the control treatments. Ammonium treatment had a pronounced effect on floral production. Plants subjected to ammonium treatment in isolation exhibited the highest number of florets per plant compared to the other treatments. The observed acceleration of flowering with ammonium treatment was consistent with the findings of Cárdenas-Navarro, López-Pérez [58]. However, there is contrasting evidence in the literature. [41], Shi, Hernández [59] reported that ammonium reduced flowering in strawberry plants. These discrepancies might be explained by the faster assimilation of NH4+ than NO3− or by cultivar-specific adaptations to different nitrogen forms. The varying responses highlight the complex interplay between nitrogen form, plant species, and flowering mechanisms. However, ammonium influences the levels of plant hormones such as abscisic acid (ABA), cytokinins (CTKs), gibberellins (GAs), and indole-3-acetic acid (IAA). For example, higher ABA and CTK levels, along with lower GA and IAA levels, are associated with flower bud differentiation in strawberries [60], which might promote flowering at the early stages of strawberry growth.
4. Materials and Methods
4.1. Experimental Design, Treatments, Plant Growth Conditions, and Sampling
The experiment was conducted between November 2023 and January 2024 in an evaporative greenhouse at the King's Initiative Center for Flower and Fruit Propagation, Ban Rai, Chiang Mai, Thailand (18° 42' 50.148″' 'N, 98° 55' 15.06" E). The trial was laid out in a completely randomized design with five treatments and four (4) replications. Each replicate consisted of three plants. The five treatments are as follows; T1:2.5 mM 15NO3 + 2.5 mM NH4+, T2:2.5 mM NO3 + 2.5 mM 15NH4+, T3:5.0 mM 15NO3, T4:5.0 mM 15NH4+, and T5: N-free (control).
Young and uniform 'Praratchatan 80' strawberry daughter plants, previously propagated in sterile and autoclaved sand, were obtained from Wongwan Farms in the Samoeng District, Chiang Mai. The plants were vernalized for 14 d in a growth chamber at 5 °C. The daughter plants were then transferred to 7-inch plastic pots containing a rooting medium made of vermiculite and perlite (2:1). The plants were subsequently placed in an evaporative greenhouse under the following climatic conditions: temperature = 25±2 °C, relative humidity = 75-80%, and photosynthetic photon flux density (PPFD) = 241 µmol m-2s-1.
The plants were established for two weeks before beginning the treatments. Each plant was then supplied with 1250 ml (15 L per 12 plants) of treatment solution (pH = 6.00) for the first 30 days. The treatment solution comprised the 15N amounts per treatment and the N-free solution, based on the nutrient recipe in Table 7. The control treatment received only the N-free solution. This was followed by the application of 100 ml of CMU-S2 solution (Table 7) (pH = 6.00, EC = 1.2 dS/m) per plant per day for the remaining 30 days of the experiment.
Three sampling regimens were employed. On day zero, four plants were randomly selected as pre-treatment samples. The first sample was collected 30 DAT. The second sampling was performed 60 DAT (leaves, roots, daughter plants, and fruits per treatment). Following harvest, the strawberry plants were thoroughly cleaned with tap water to remove extraneous elements. The plants were then rinsed with deionized (DI) water to ensure comprehensive cleaning. Then, they were placed in a shaded area to allow the remaining water to evaporate naturally. Once the plants attained sufficient dryness, they were split into leaves and roots, and their weights were determined before being transferred to an oven for additional drying at 70 °C for 72 hours. All samples were powdered and processed for further analysis.
4.2. 15N Abundance Analysis
An element analyzer (Flas 2000 HT type) and an isotope mass spectrometer (DELTA V Advantage, Thermo Fisher Scientific, USA) were used to determine 15N abundance and total nitrogen (%) in the strawberry plant materials. The amount of labeled N in the plants was compared to the amount of labeled N provided to determine the 15N use efficiency, which was expressed as a percentage [61]:
The percentage distribution of total N in each organ was determined using the following equation:
The labeled nitrogen in the plants each day after treatment (DAT) was equivalent to the 15N concentration (in mg per plant). The labeled nitrogen supplied at each DAT represents the total amount of fertilizer 15N applied. To make it possible for a direct comparison of nitrogen concentrations across treatments with differing initial application rates, the measured concentrations for the 2.5 mM 15N treatments were multiplied by 2 to normalize the data to a 5 mM application basis effectively.
The 15N increment/decrement (Δ) percentage was determined by calculating the percentage change in 15N concentration (in micrograms per gram dry weight) accumulated or exhausted between 30 and 60 DAT using the following formula:
4.3. Statistical Analyses
Data analyses were conducted using the relevant Python program libraries. Statistically significant means among the treatments were separated using Fisher's Least Significant Difference (LSD) test (p < 0.05).
5. Conclusions
The current study highlights the critical role of nitrogen sources in optimizing the nitrogen use efficiency, growth and flowering, of 'Praratchatan 80' strawberry plants under greenhouse conditions. This study also examined the nitrogen uptake, distribution, and use efficiency of strawberries using the 15N tracer technique. The sole ammonium treatment accelerated early nitrogen uptake and flower production because of the rapid and efficient assimilation of ammonium. Conversely, nitrate treatment supported robust vegetative growth and higher nitrogen use efficiency at later stages, which are crucial for sustained development.
Moreover, these findings illustrate the dynamic interplay between nitrogen sources, plant nitrogen allocation, and crop performance. They revealed a trade-off between vegetative growth and flowering traits influenced by nitrogen form and timing. Mixed nitrogen treatments demonstrated superior nitrogen use efficiency, consistent with evidence that balanced nitrogen applications optimize plant responses to diverse growth demands and environmental conditions.
Furthermore, this study provides a foundation for tailoring nitrogen management strategies to enhance strawberry production. Future research should refine the ratios and timing of mixed nitrogen applications, explore the molecular mechanisms of nitrogen assimilation, and evaluate their long-term impacts on soil health and crop sustainability. Such efforts will improve productivity, support sustainable agricultural practices, and ensure efficient nitrogen use in strawberry cultivation.
Lastly, this work is limited to examining the effects of nitrate-nitrogen and ammonium-nitrogen at specific concentrations—5 mM labeled NO₃⁻ and NH₄⁺, and 2.5 mM of each combined with 2.5 mM of the alternate nitrogen source (14N nitrate or ammonium) on 'Praratchatan 80' strawberry under controlled greenhouse conditions. The 10-week experiment focused on growth, flowering, and nitrogen concentrations in strawberry plant parts without exploring molecular mechanisms or involving natural field conditions.
Future research should address these limitations by extending the experimental duration, incorporating a range of strawberry cultivars, and using field or mesocosm setups to simulate natural growth conditions. Further investigations into the molecular mechanisms that regulate nitrogen use efficiency under different nitrogen sources and combinations will provide deeper insights into the processes that influence strawberry growth and productivity.
Author Contributions
Conceptualization, SR and KP; methodology, SR, CI, and KP; software, SSJ; validation, SR, CI, and KP; formal analysis, SSJ; investigation, SSJ; resources, SR; data curation, SSJ; writing—original draft preparation, SSJ; writing—review and editing, SR, CI, and KP; visualization, SSJ; supervision, SR and KP; project administration, SR; funding acquisition, SR. All authors have read and agreed to the published version of the manuscript.
Funding
This study received no external funding.
Data Availability Statement
All data upon which the conclusions of this study are based are made available upon request. Requests should be directed to the corresponding authors.
Acknowledgments
We acknowledge Chiang Mai University for granting a full scholarship, CMU Presidential Scholarship, to the first author to study for a PhD. Horticulture Program at the Faculty of Agriculture, Chiang Mai University, Thailand. We also acknowledge and appreciate the support of the H. M. The King's Initiative Center for Flower and Fruit Propagation, Ban Rai, Chiang Mai, made its facilities available, thus making this research a success. Our profound gratitude to Mr. Chockchai Thanamatee for his insightful contributions to the automatic control and monitoring of the greenhouse atmosphere.
Conflicts of Interest
The authors declare no conflict of interest.
References
- Shamsudin, R., et al., From farm to fork: Cultivation, postharvest and processing of strawberry in japan. Food Research, 2021. 5: p. 175-181. [CrossRef]
- Hummer, K.E., K.A. Williams, and J.M. Bushakra, North American crop wild relatives of temperate berries (Fragaria L., Ribes L., Rubus L., and Vaccinium L.), in North American Crop Wild Relatives: Important Species. 2019, Springer International Publishing. p. 283-327. [CrossRef]
- Hummer, K.E., et al., Phenotypic characterization of a strawberry (Fragaria ×ananassa Duchesne ex Rosier) diversity collection. Plants People Planet, 2023. 5(2): p. 209-224. [CrossRef]
- Trejo-Téllez, L.I. and F.C. Gómez-Merino, Nutrient management in strawberry: Effects on yield, quality and plant health, in Strawberries: Cultivation, Antioxidant Properties and Health Benefits. 2014, Nova Science Publishers, Inc. p. 239-268.
- Afrin, S., et al., Promising Health Benefits of the Strawberry: A Focus on Clinical Studies. Journal of Agricultural and Food Chemistry, 2016. 64(22): p. 4435-4449. [CrossRef]
- Kafkas, E. and S. Kafkas. Preliminary results on the polyphenol content of strawberry (Fragaria × ananassa Duch. 'Florida Fortuna') fruits during ripening. in Acta Horticulturae. 2017. International Society for Horticultural Science. [CrossRef]
- Padmanabhan, P., et al., Strawberries, in Encyclopedia of Food and Health. 2015, Elsevier Inc. p. 193-198. [CrossRef]
- Yuan, B.Z. and J. Sun, Bibliometric analysis of strawberry (Fragaria × ananassa Duch.) research publications from horticulture category based on Web of Science. Journal of Berry Research, 2021. 11(4): p. 721-738. [CrossRef]
- Menzel, C.M., Changes in the concentration of leaf nitrogen over the season affect the diagnosis of deficiency or sufficiency in strawberries in the subtropics. Agriculture (Switzerland), 2018. 8(8). [CrossRef]
- Chandramohan Reddy, G. and R.K. Goyal, Growth, yield and quality of strawberry as affected by fertilizer N rate and biofertilizers inoculation under greenhouse conditions. Journal of Plant Nutrition, 2020. 44(1): p. 46-58. [CrossRef]
- Marcellini, M., et al., Growth and Yield of Strawberry Cultivars under Low Nitrogen Supply in Italy. Horticulturae, 2023. 9(11). [CrossRef]
- Preciado-Rangel, P., et al., Interactive effects of the potassium and nitrogen relationship on yield and quality of strawberry grown under soilless conditions. Plants, 2020. 9(4). [CrossRef]
- Weber, N.C., et al., Influence of nitrogen, calcium and nano-fertilizer on strawberry (Fragaria × ananassa duch.) fruit inner and outer quality. Agronomy, 2021. 11(5). [CrossRef]
- Karthika, K.S., I. Rashmi, and M.S. Parvathi, Biological Functions, Uptake and Transport of Essential Nutrients in Relation to Plant Growth, in Plant Nutrients and Abiotic Stress Tolerance, M. Hasanuzzaman, et al., Editors. 2018, Springer Singapore: Singapore. p. 1-49. [CrossRef]
- Mengesha, M., Effect and Roles of Nitrogen Supply on Photosynthesis. International Journal of Photochemistry and Photobiology, 2021.
- Pandey, N., Role of Plant Nutrients in Plant Growth and Physiology, in Plant Nutrients and Abiotic Stress Tolerance, M. Hasanuzzaman, et al., Editors. 2018, Springer Singapore: Singapore. p. 51-93. [CrossRef]
- Artins, A., et al., Sensing and regulation of C and N metabolism – novel features and mechanisms of the TOR and SnRK1 signaling pathways. Plant Journal, 2024. 118(5): p. 1268-1280. [CrossRef]
- Evans, J.R. and V.C. Clarke, The nitrogen cost of photosynthesis. Journal of Experimental Botany, 2018. 70(1): p. 7-15. [CrossRef]
- Gojon, A., Nitrogen nutrition in plants: Rapid progress and new challenges. Journal of Experimental Botany, 2017. 68(10): p. 2457-2462. [CrossRef]
- Kishorekumar, R., et al., An Overview of Important Enzymes Involved in Nitrogen Assimilation of Plants, in Methods in Molecular Biology. 2020, Humana Press Inc. p. 1-13. [CrossRef]
- Gu, J., et al., Roles of nitrogen and cytokinin signals in root and shoot communications in maximizing of plant productivity and their agronomic applications. Plant Science, 2018. 274: p. 320-331. [CrossRef]
- Khan, M.I.R., et al., Role of ethylene in responses of plants to nitrogen availability. Frontiers in Plant Science, 2015. 6(OCTOBER). [CrossRef]
- Mahpara, S., et al., Nitrogen fertilization induced drought tolerance in sunflower: a review. Pesquisa Agropecuaria Brasileira, 2019. 8(2): p. 1675-1683. [CrossRef]
- Wang, Q., et al., The Utilization and Roles of Nitrogen in Plants. Forests, 2024. 15(7). [CrossRef]
- Wen, B., et al., How does nitrate regulate plant senescence? Plant Physiology and Biochemistry, 2020. 157: p. 60-69. [CrossRef]
- Inkham, C., et al., Effect of N Source on Growth and N Uptake of Hippeastrum Using 15N Tracers. The Horticulture Journal, 2022. 91(1): p. 85-93. [CrossRef]
- Coleto, I., et al., New insights on arabidopsis thaliana root adaption to ammonium nutrition by the use of a quantitative proteomic approach. International Journal of Molecular Sciences, 2019. 20(4). [CrossRef]
- da Cunha, J.G., et al., Ammonium and nitrate distinctly regulate photosynthetic and growth performance, eliciting antagonistic responses in yellow passion fruit plants. Scientia Horticulturae, 2024. 330: p. 113022. [CrossRef]
- George, J., et al., Small amounts of ammonium (NH+ 4) can increase growth of maize (Zea mays). Journal of Plant Nutrition and Soil Science, 2016. 179(6): p. 717-725. [CrossRef]
- Hachiya, T. and H. Sakakibara, Interactions between nitrate and ammonium in their uptake, allocation, assimilation, and signaling in plants. Journal of Experimental Botany, 2017. 68(10): p. 2501-2512. [CrossRef]
- Jana, S. and B.R. Jeong, Uptake, metabolism, toxicity, and effect on growthof different nitrogen forms in horticultural plants, in Ammonium Nitrate: Synthesis, Chemical Properties and Health Hazards. 2014, Nova Science Publishers, Inc. p. 41-86.
- Xiao, C., et al., Nitrate transporter NRT1.1 and anion channel SLAH3 form a functional unit to regulate nitrate-dependent alleviation of ammonium toxicity. Journal of Integrative Plant Biology, 2022. 64(4): p. 942-957. [CrossRef]
- Marschner, H., Marschner's Mineral Nutrition of Higher Plants. 1995, London: Academic Press.
- Chen, J., et al., The optimal ammonia-nitrate ratio for various crops : A Meta-analysis. Field Crops Research, 2024. 307. [CrossRef]
- Sonneveld, C., Composition of nutrient solution, in Hydroponic Production of Vegetable and Ornamentals, D. Savvas and H.C. Passam, Editors. 2002, Embryo Publications: Athens. p. 179 - 210.
- Jia, Z., et al., Different nitrogen concentrations affect strawberry seedlings nitrogen form preferences through nitrogen assimilation and metabolic pathways. Scientia Horticulturae, 2024. 332. [CrossRef]
- Panjama, K., et al., Nitrogen Uptake and Translocation in Vanda Orchid after Roots and Leaves Application of Different Forms 15N Tracer. Horticulturae, 2022. 8(10). [CrossRef]
- Panjama, K., et al., Identifying N sources that affect N uptake and assimilation in Vanda hybrid using 15N tracers. Horticulture Environment and Biotechnology, 2018. 59(6): p. 805-813. [CrossRef]
- Ruamrungsri, S., et al., Determination of the uptake and utilization of nitrogen in Curcuma alismatifolia Gagnep. using 15N isotope. Soil Science and Plant Nutrition, 2006. 52(2): p. 221-225. [CrossRef]
- Tobar, R., R. Azcon, and J.M. Barea, Improved nitrogen uptake and transport from 15N-labelled nitrate by external hyphae of arbuscular mycorrhiza under water-stressed conditions. New Phytologist, 1994. 126(1): p. 119-122. [CrossRef]
- Yamasaki, A., et al. Tracer studies on the allocation of carbon and nitrogen during flower induction of strawberry plants as affected by the nitrogen level. in IV International Strawberry Symposium 567. 2000.
- Zhu, F., et al., Quantifying nitrogen uptake and translocation for mature trees: an in situ whole-tree paired 15N labeling method. Tree Physiology, 2021. 41(11): p. 2109-2125. [CrossRef]
- Anuwong, C., et al., Uptake and translocation of nitrogen in patumma (Curcuma alismatifolia) by leaves or root. Journal of Plant Nutrition, 2017. 40(8): p. 1204-1212. [CrossRef]
- Tagliavini, M., et al., Dynamics of nutrients uptake by strawberry plants (Fragaria×Ananassa Dutch.) grown in soil and soilless culture. European Journal of Agronomy, 2005. 23(1): p. 15-25. [CrossRef]
- Song, J., J. Yang, and B.R. Jeong, Decreased Solution pH and Increased K+ Uptake Are Related to Ammonium Tolerance in Hydroponically Cultured Plants. Horticulturae, 2022. [CrossRef]
- Cassim, B., et al., Nitrogen Fertilizers Technologies for Corn in Two Yield Environments in South Brazil. Plants (Basel), 2022. 11(14). [CrossRef]
- Williams, K., et al., Estimation of tissue construction cost from heat of combustion and organic nitrogen content. Plant, Cell & Environment, 1987. 10(9): p. 725-734. [CrossRef]
- Kasper, K., et al., Multi-omics analysis of xylem sap uncovers dynamic modulation of poplar defenses by ammonium and nitrate. The Plant Journal, 2022. 111(1): p. 282-303. [CrossRef]
- Martinoia, E., U. Heck, and A. Wiemken, Vacuoles as storage compartments for nitrate in barley leaves. Nature, 1981. 289(5795): p. 292-294. [CrossRef]
- Liang, G. and Z. Zhang, Reducing the Nitrate Content in Vegetables Through Joint Regulation of Short-Distance Distribution and Long-Distance Transport. Frontiers in Plant Science, 2020. 11. [CrossRef]
- Iqbal, A., et al., Untangling the molecular mechanisms and functions of nitrate to improve nitrogen use efficiency. Journal of the Science of Food and Agriculture, 2020. 100(3): p. 904-914. [CrossRef]
- Kant, S., Understanding nitrate uptake, signaling and remobilisation for improving plant nitrogen use efficiency. Seminars in Cell and Developmental Biology, 2018. 74: p. 89-96. [CrossRef]
- Guo, S., et al., Effect of ammonium and nitrate nutrition on some physiological processes in higher plants - Growth, photosynthesis, photorespiration, and water relations. Plant Biology, 2007. 9(1): p. 21-29. [CrossRef]
- Hao, F., et al., Transcriptome analysis reveals the involvement of nitrate transporters in regulating strawberry fruit development. Scientia Horticulturae, 2022. 296. [CrossRef]
- Alves Negrini, A.C., et al., Effect of N supply on the carbon economy of barley when accounting for plant size. Functional Plant Biology, 2020. 47(4): p. 368-381. [CrossRef]
- Saiz-Fernández, I., et al., The imbalance between C and N metabolism during high nitrate supply inhibits photosynthesis and overall growth in maize (Zea mays L.). Plant Physiology and Biochemistry, 2017. 120: p. 213-222. [CrossRef]
- Jesus, G.L.d., et al., Strawberry quality affected by the nitrate: ammonium ratio in the nutrient solution. Revista mexicana de ciencias agrícolas, 2021. 12(5): p. 753-763. [CrossRef]
- Cárdenas-Navarro, R., et al., Effects of Nitrogen Source on Growth and Development of Strawberry Plants. Journal of Plant Nutrition, 2006. 29(9): p. 1699-1707. [CrossRef]
- Shi, X., R. Hernández, and M. Hoffmann, The influence of stolon harvest frequency and nitrate: Ammonium ratio on asexual reproduction of day-neutral strawberries. Acta Horticulturae, 2021. 1309: p. 283-288. [CrossRef]
- Wan, C., et al., Effects of nitrogen during nursery stage on flower bud differentiation and early harvest after transplanting in strawberry. Revista Brasileira de Botanica, 2018. 41(1): p. 1-10. [CrossRef]
- Sandrock, D.R., T.L. Righetti, and A.N. Azarenko, Isotopic and Nonisotopic Estimation of Nitrogen Uptake Efficiency in Container-grown Woody Ornamentals. HortScience HortSci, 2005. 40(3): p. 665 - 669. https://journals.ashs.org/hortsci/view/journals/hortsci/40/3/article-p665.xml. [CrossRef]
Figure 1.
Total (a) fresh and (b) dry weights of strawberry plants as affected by nitrogen sources at 60 DAT. 1; 5 mM 15NO3-, 2; 2.5 mM 15NO3- + 2.5 mM NH4+, 3; 5 mM 15NH4+, 4; 2.5 mM 15NH4+ + 2.5 mM NO3-, 5: control. Bars represent average ± standard deviation. The different letters on the top of the plots indicate significant differences among the concentration of each treatment based on LSD test (p < 0.05). N = 4.
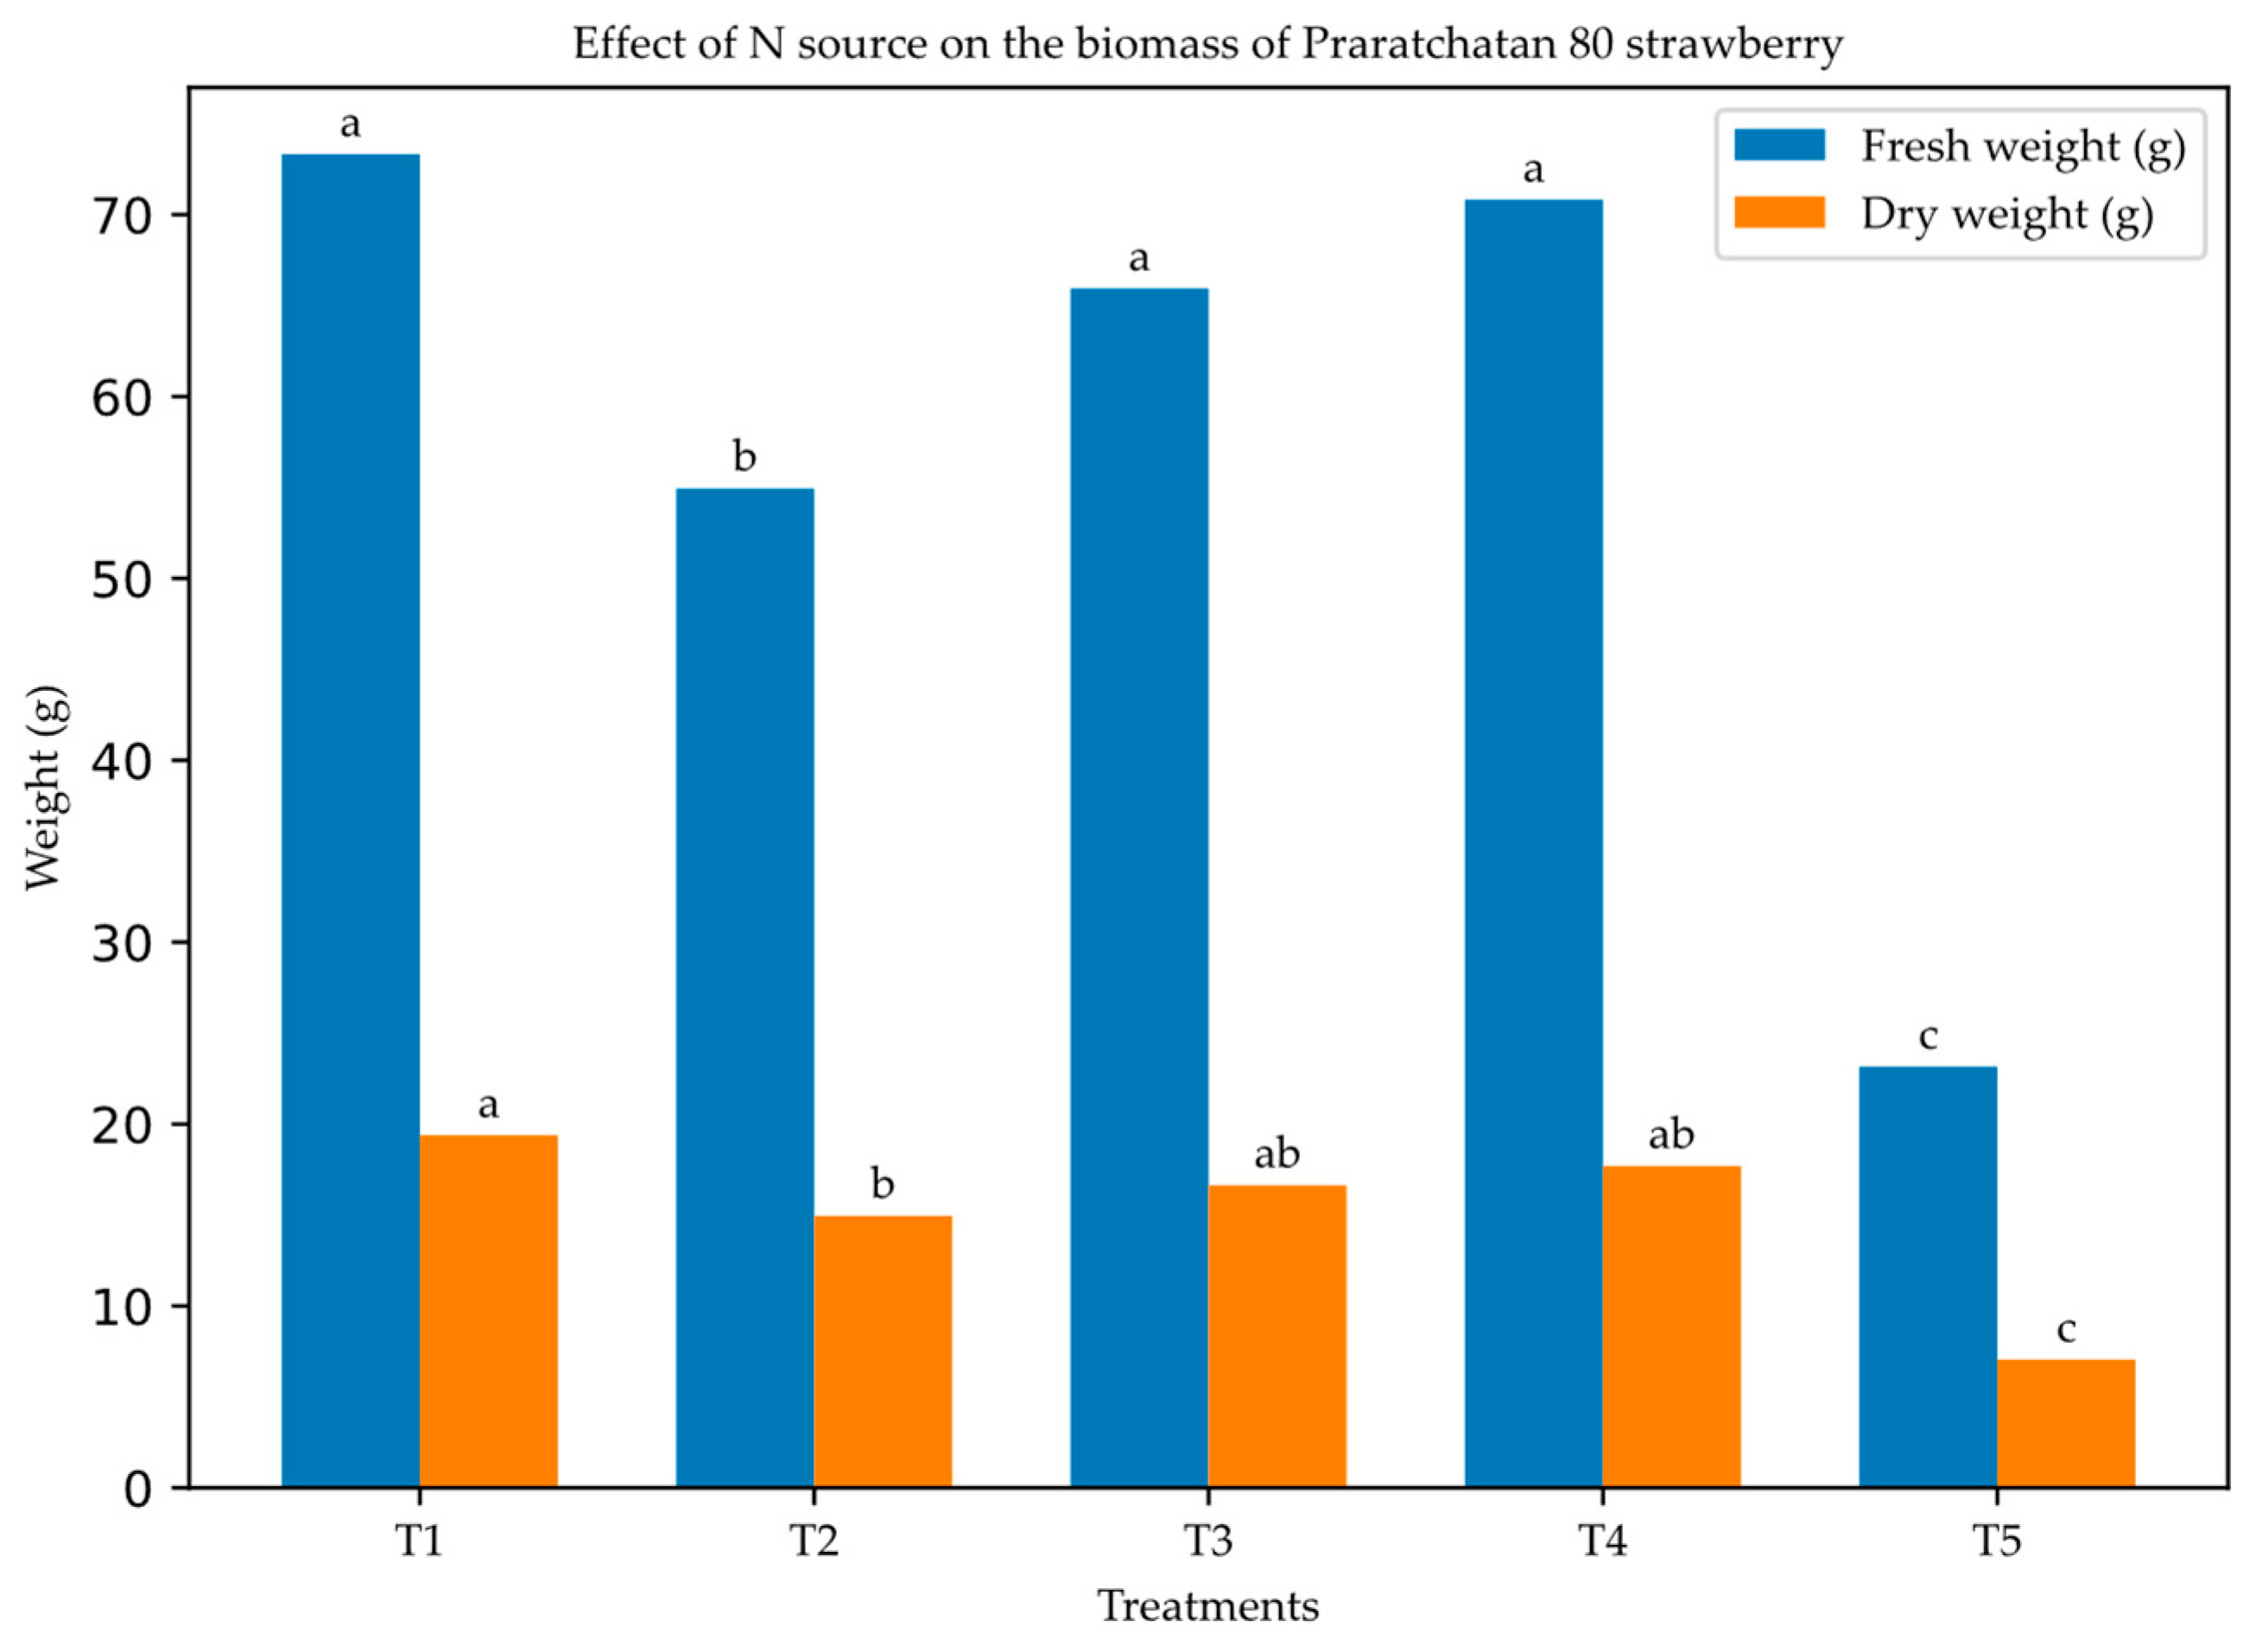
Figure 2.
Percentage distribution of nitrogen in strawberry parts at 30 and 60 days after treatment with varying N-sources. T1; 5 mM 15NO3-,T2; 2.5 mM 15NO3- + 2.5 mM NH4+,T3; 5 mM 15NH4+, T4; 2.5 mM 15NH4+ + 2.5 mM NO3-.
Figure 2.
Percentage distribution of nitrogen in strawberry parts at 30 and 60 days after treatment with varying N-sources. T1; 5 mM 15NO3-,T2; 2.5 mM 15NO3- + 2.5 mM NH4+,T3; 5 mM 15NH4+, T4; 2.5 mM 15NH4+ + 2.5 mM NO3-.
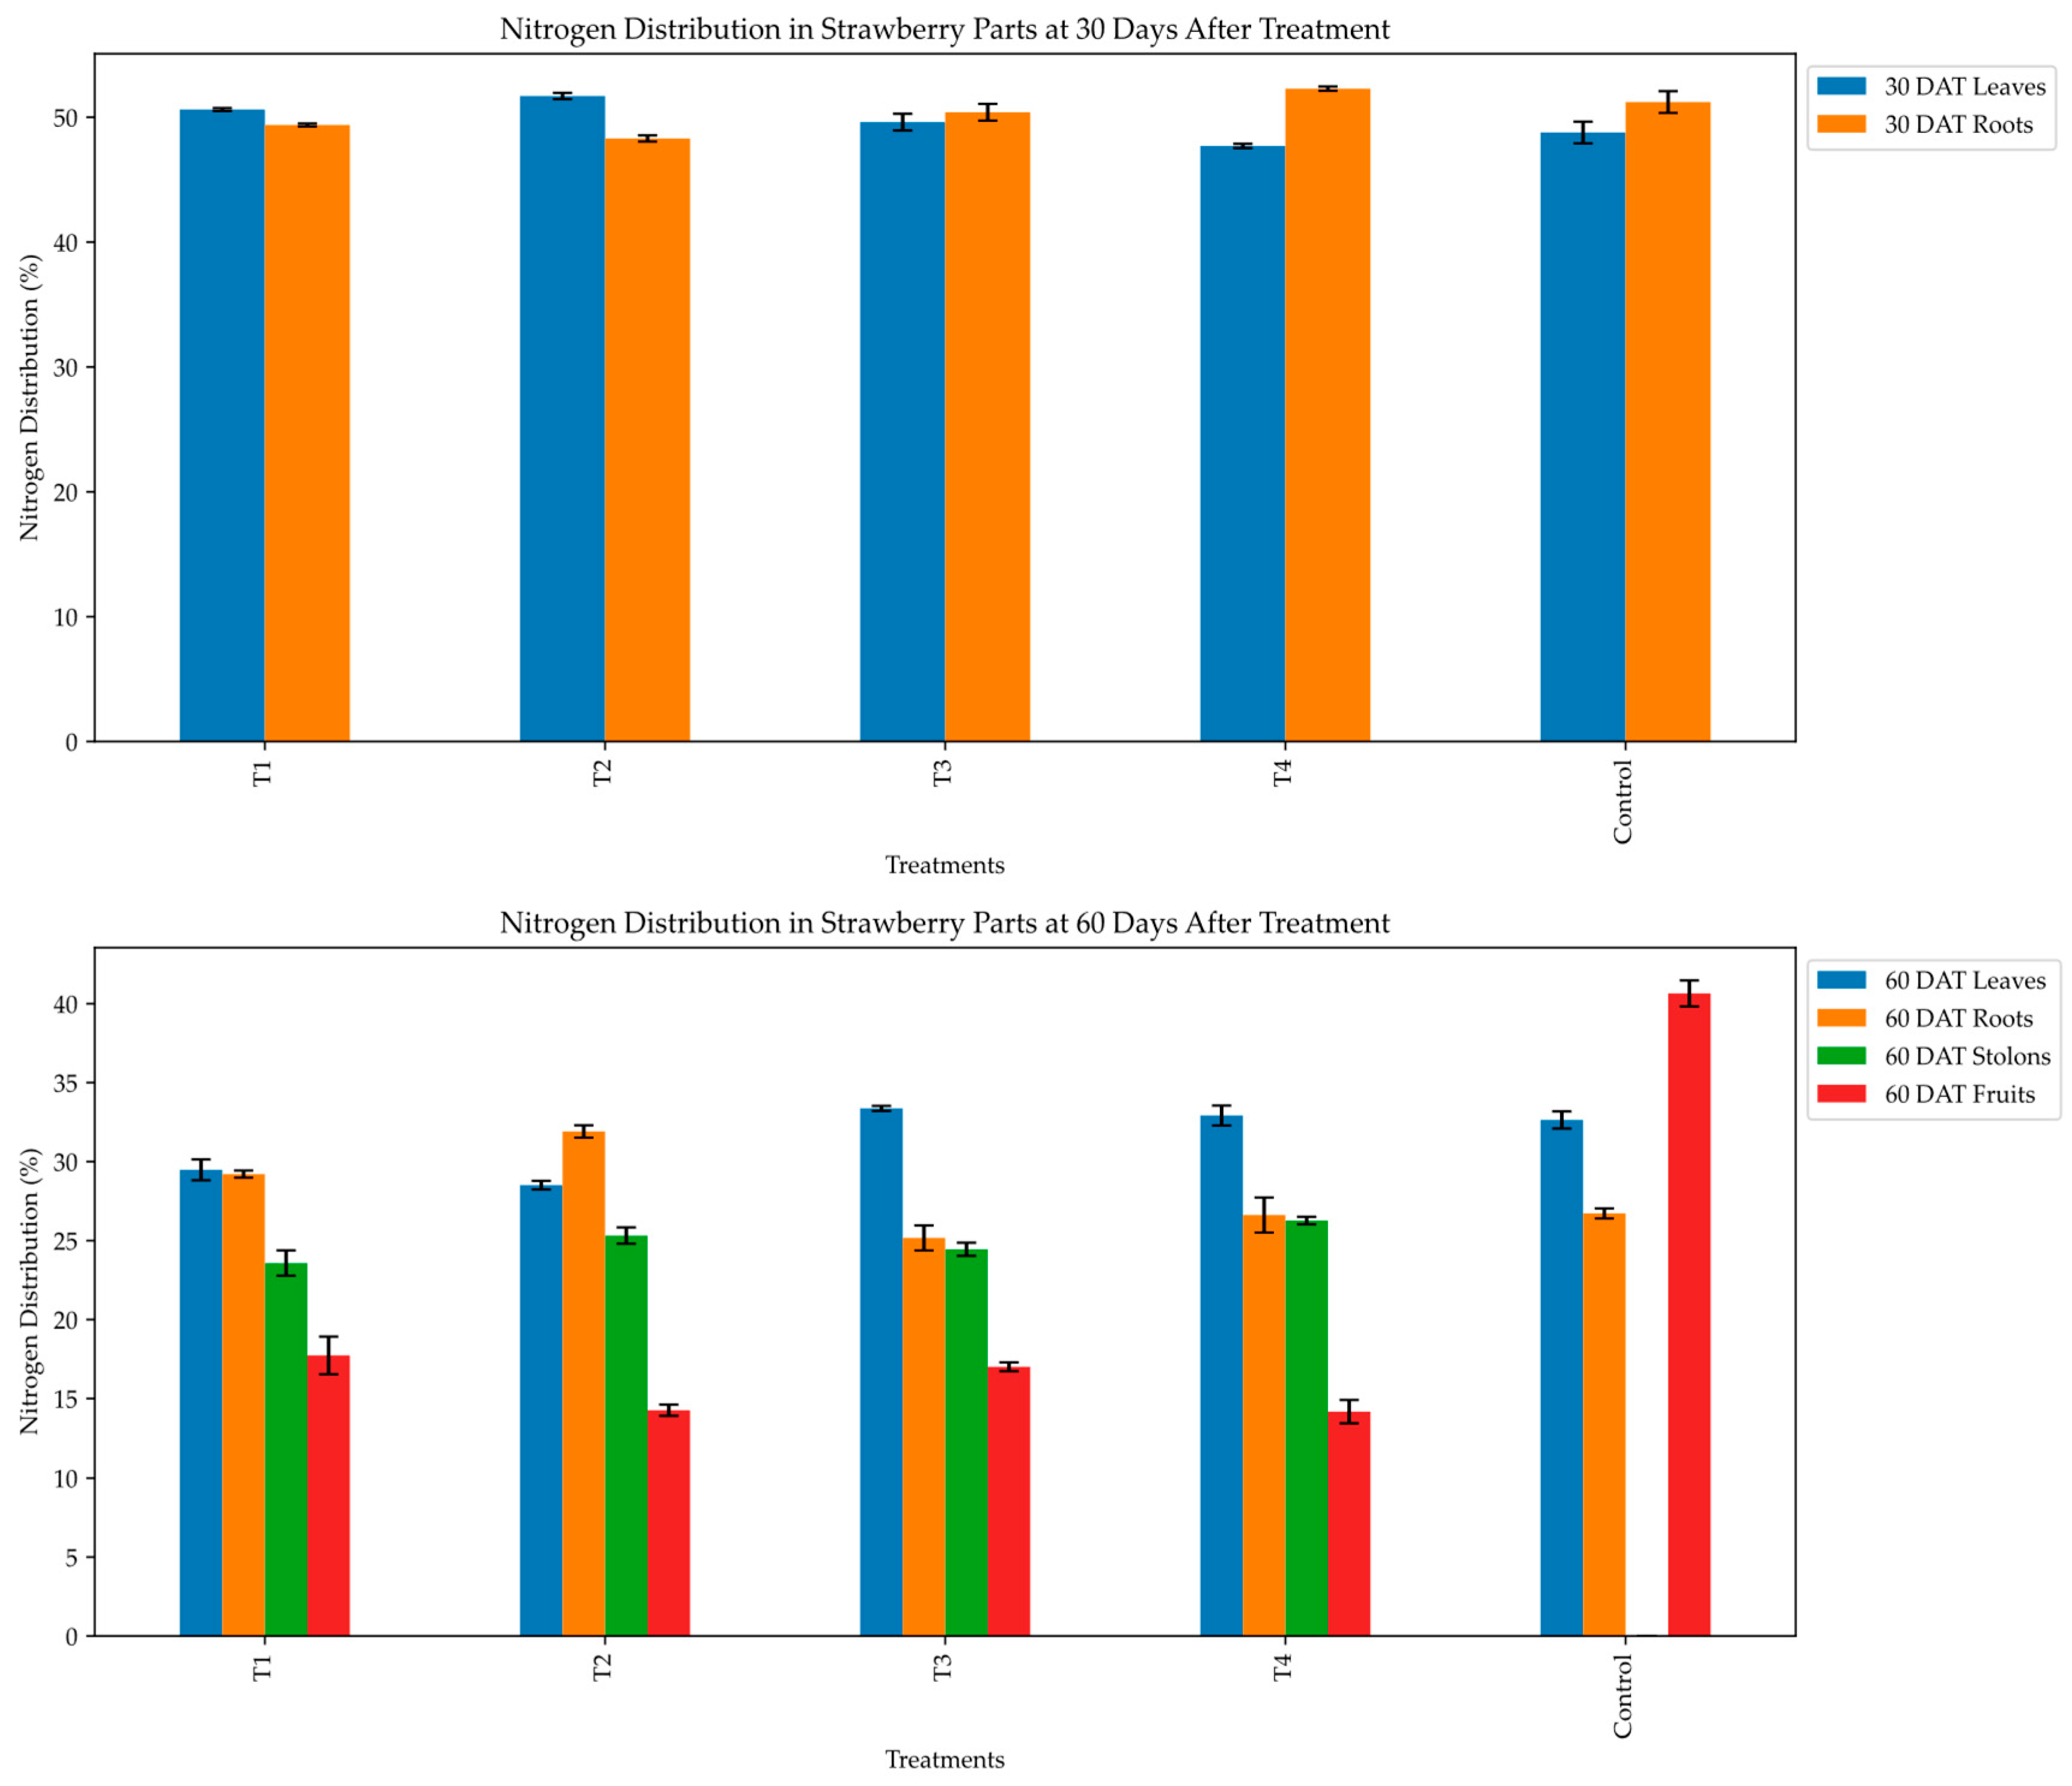
Figure 3.
Nitrogen use efficiency of strawberry plants due to varying nitrogen source treatments at 30 and 60 DAT. T1; 5 mM 15NO3-, T2; 2.5 mM 15NO3- + 2.5 mM NH4+, T3; 5 mM 15NH4+, T4; 2.5 mM 15NH4+ + 2.5 mM NO3-,.
Figure 3.
Nitrogen use efficiency of strawberry plants due to varying nitrogen source treatments at 30 and 60 DAT. T1; 5 mM 15NO3-, T2; 2.5 mM 15NO3- + 2.5 mM NH4+, T3; 5 mM 15NH4+, T4; 2.5 mM 15NH4+ + 2.5 mM NO3-,.
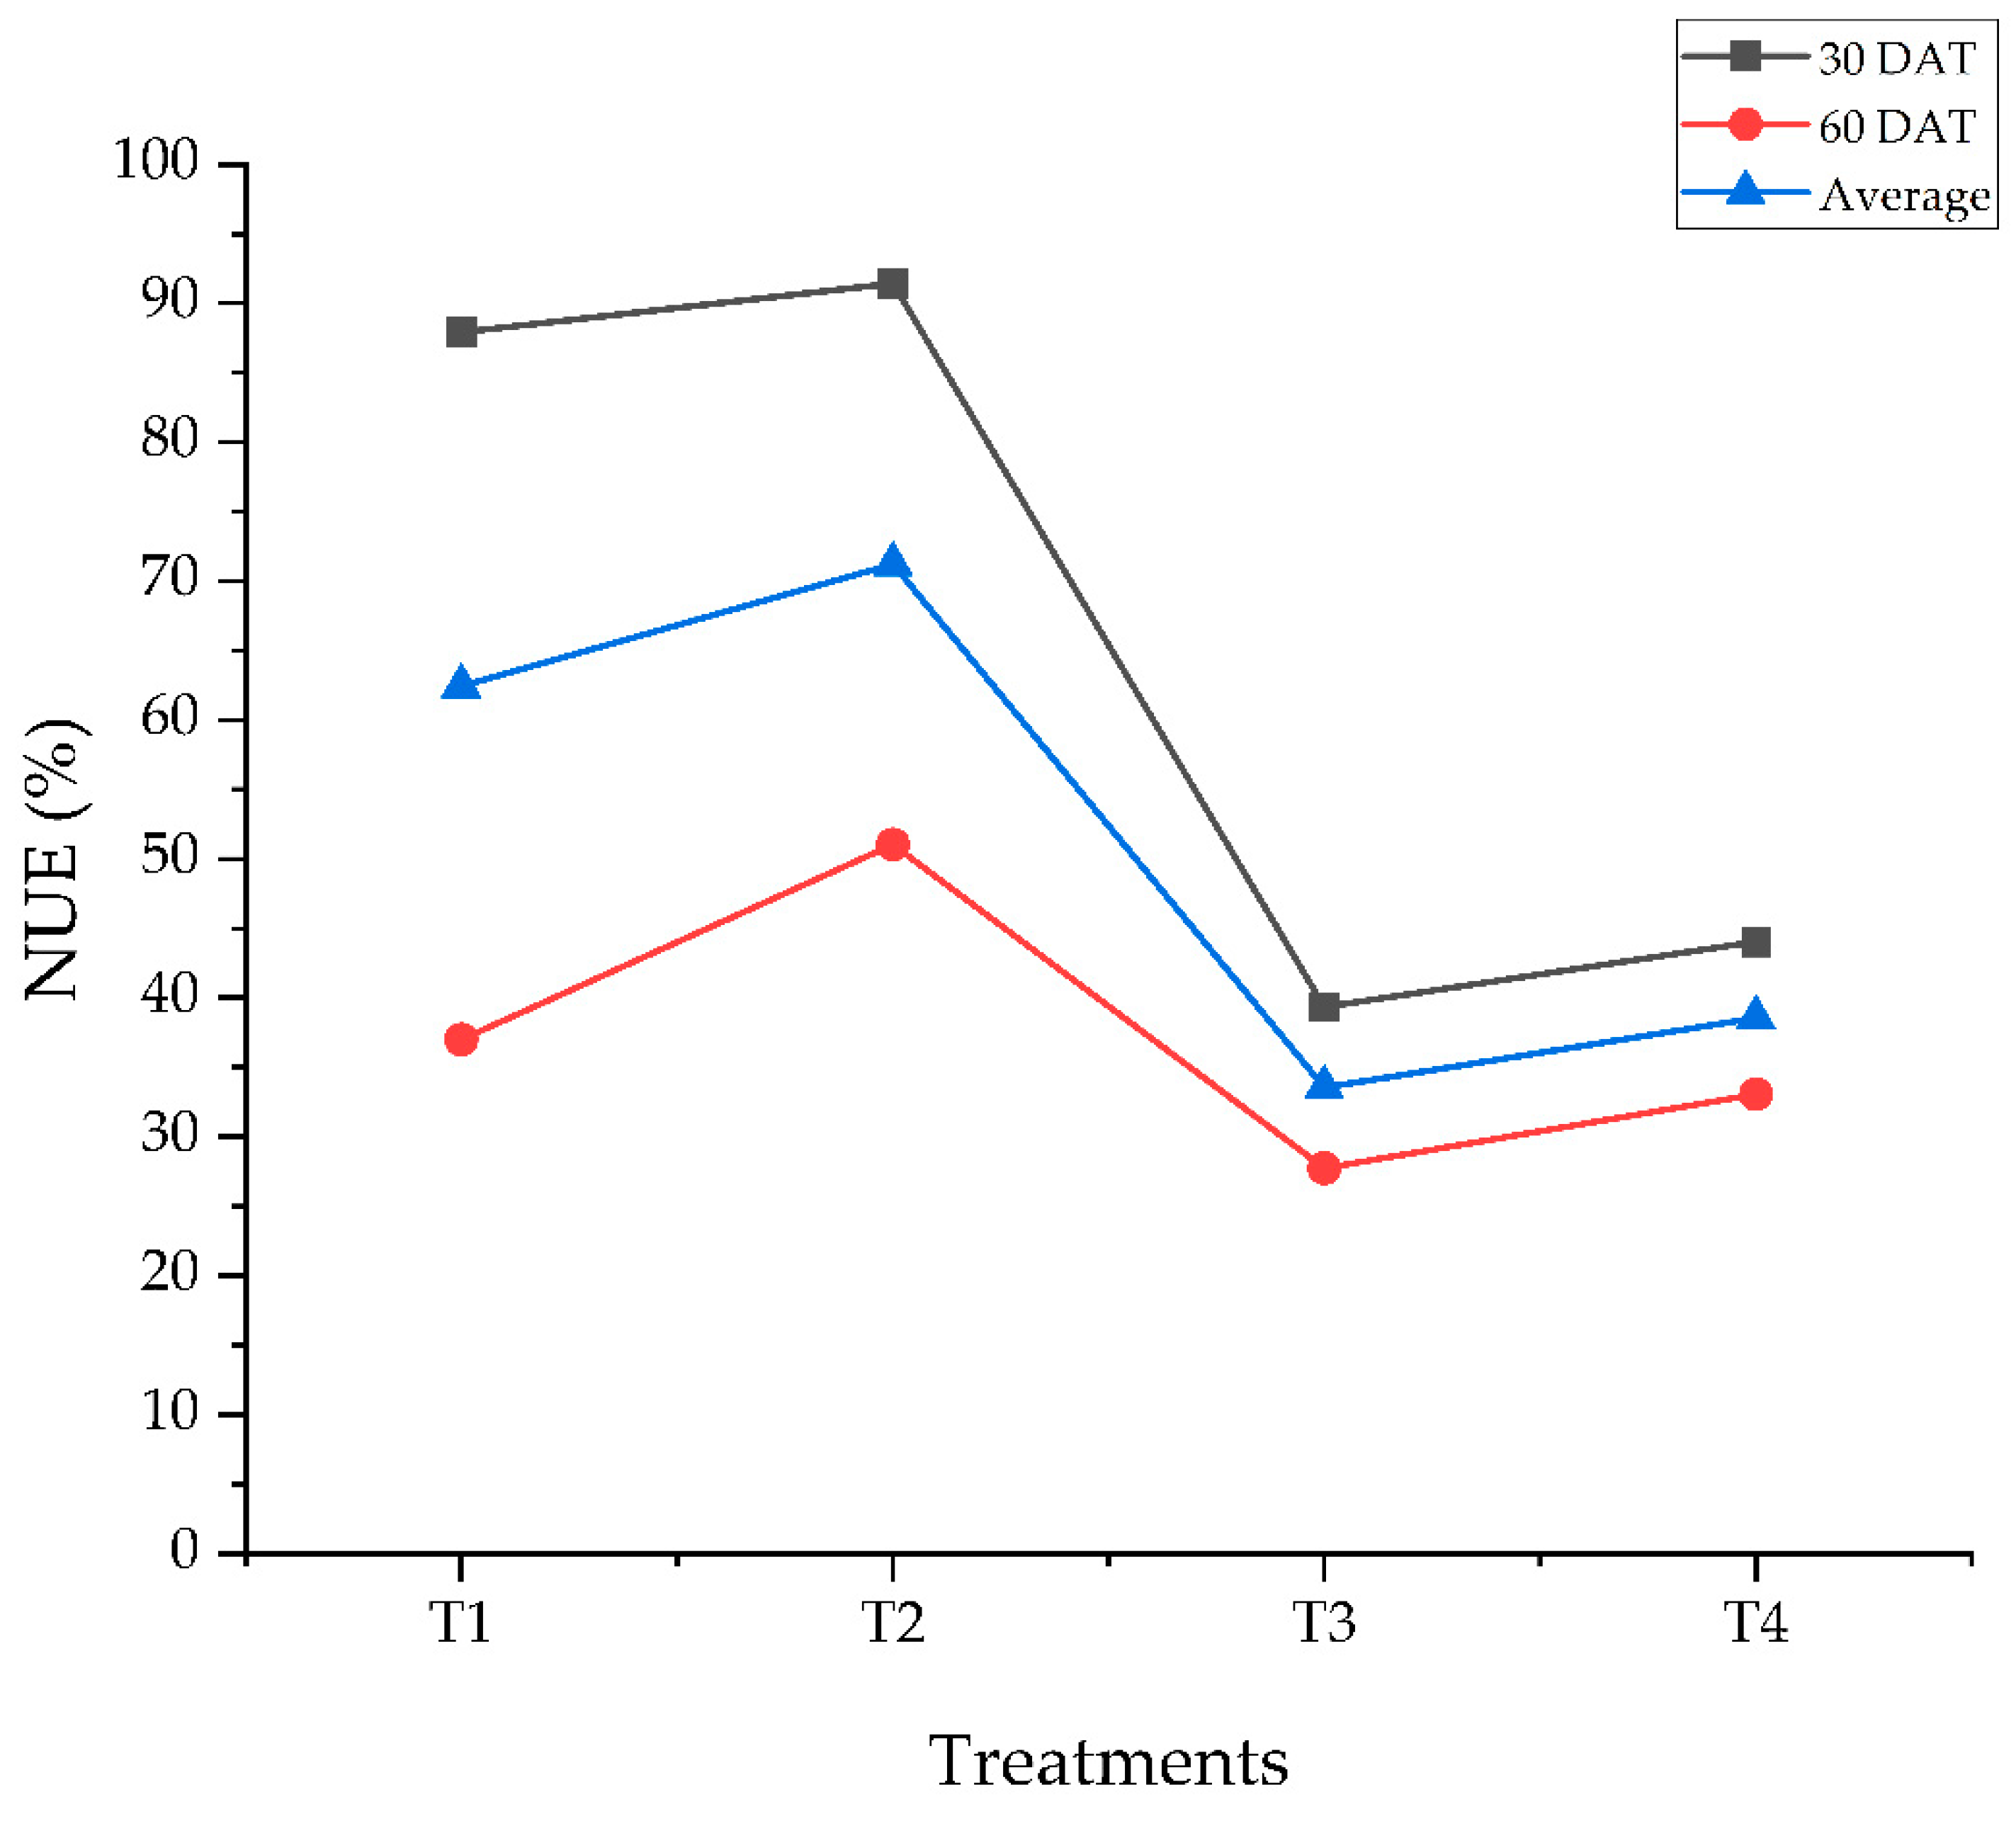
Figure 4.
Boxplot depicting the response of strawberry flowering attributes to varying nitrogen source treatments. 1; 5 mM 15NO3-, 2; 2.5 mM 15NO3- + 2.5 mM NH4+, 3; 5 mM 15NH4+, 4; 2.5 mM 15NH4+ + 2.5 mM NO3-, 5: control. ANOVA (p < 0.05) reveals significant differences among treatments for the following parameters: Number of Inflorescences: F = 9.79, p = 0.00042, Number of Florets per Inflorescence: F = 65.16, p = 2.67e-09, Number of Florets per Plant: F = 15.69, p = 3.08e-05.
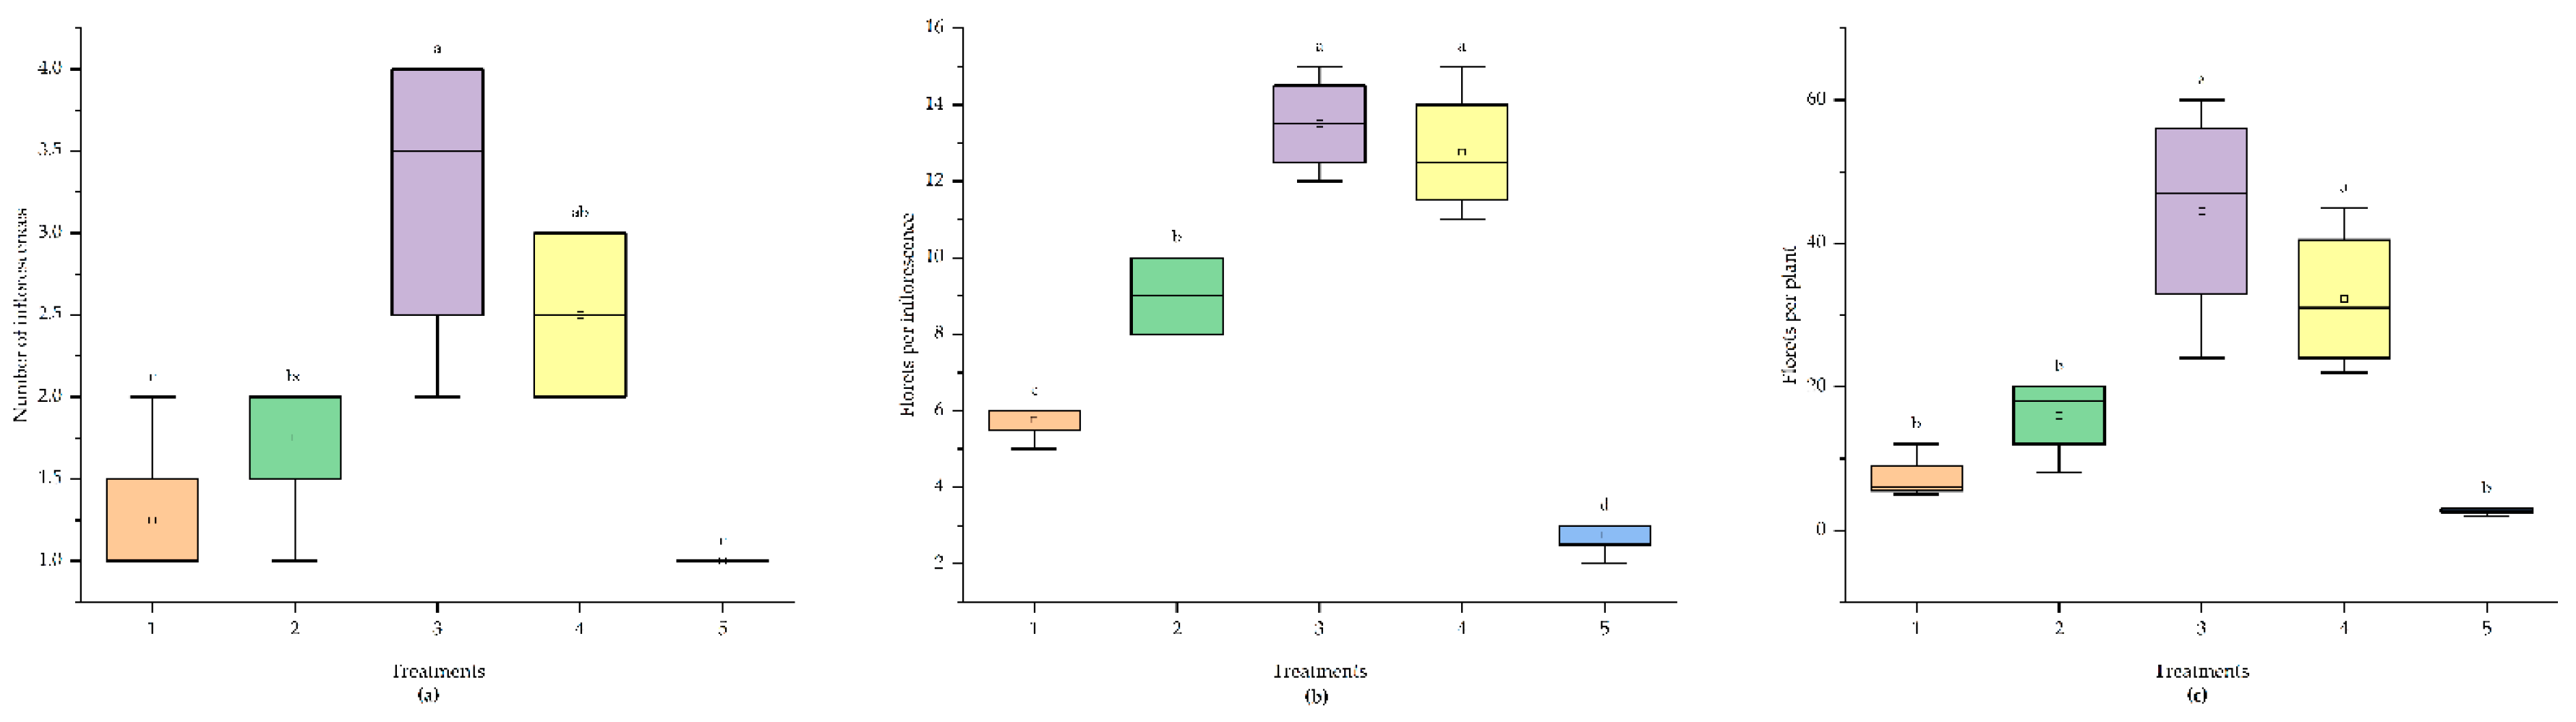

Table 1.
Effect of N source on growth of 'Praratchatan 80' strawberry.
| Treatments | Number of leaves | Plant height (cm) | Number of crowns | Stolon per plant |
| 5 mM 15NO3- (T1) | 17.00a | 24.09a | 1.20a | 2.44ab |
| 2.5 mM 15NO3 + 2.5 mM NH4+ (T2) | 10.25c | 24.49a | 1.00b | 2.15b |
| 5 mM 15NH4+ (T3) | 11.88b | 23.66a | 1.00b | 2.18b |
| 2.5 mM 15NH4 + 2.5 mM NO3- (T4) | 10.88c | 24.60a | 1.16ab | 2.62a |
| Control (N-Free) | 8.00d | 19.66b | 1.00b | - |
| Sig. (P< 0.05) | * | * | * | * |
| LSD | 0.90 | 1.80 | 0.34 | 0.54 |
| CV (%) | 7.61 | 7.63 | 14.95 | 15.47 |
*, significant (p < 0.05); WAT, weeks after treatment; abc, means denoted by different letters within a column are significantly different according to the LSD test (p < 0.05) -; no value recorded.
Table 2.
Total nitrogen concentration in strawberry parts at 30 and 60 days after treatment.
| Treatments | 30 DAT (mg N/gDW) | 60 DAT (mg N/gDW) | ||||||
| Leaves | Roots | Total | Leaves | Roots | Stolons | Fruits | Total | |
| T1 | 40.45b | 39.46b | 40.28b | 21.52b | 21.33a | 17.21b | 12.96a | 20.26a |
| T2 | 23.50c | 21.97d | 23.18c | 19.87d | 22.23a | 17.64b | 9.94b | 17.68c |
| T3 | 68.16a | 69.24a | 68.36a | 20.93c | 15.79c | 15.33c | 10.67b | 17.17c |
| T4 | 22.24c | 25.79c | 22.67c | 23.12a | 18.71b | 18.46a | 9.95b | 19.41b |
| Control | 3.71d | 3.90e | 3.77d | 9.99e | 8.18d | 0.00d | 12.44a | 10.37d |
| Sig. (P< 0.05) | * | * | * | * | * | * | * | * |
| LSD | 1.97 | 1.61 | 1.80 | 0.37 | 0.61 | 0.61 | 1.03 | 1.9 |
| CV (%) | 3.43 | 2.76 | 3.13 | 1.05 | 3.81 | 2.46 | 5.07 | 2.02 |
*, significant (p < 0.05); abc, means denoted by different letters within a column are significantly different according to the LSD test (p < 0.05). DAT: days after treatment, T1; 5 mM 15NO3, T2; 2.5 mM 15NO3- + 2.5 mM NH4+, T3; 5 mM 15NH4+, T4; 2.5 mM 15NH4+ + 2.5 mM NO3-.
Table 3.
Nitrogen distribution (%) in strawberry parts at different sampling stages.
| Treatments | 30 DAT (%) | 60 DAT (%) | |||||
| Leaves | Roots | Leaves | Roots | Stolons | Fruits | ||
| T1 | 50.62b | 49.38c | 29.48b | 29.21b | 23.58c | 17.73b | |
| T2 | 51.70a | 48.30d | 28.51c | 31.91a | 25.32b | 14.26c | |
| T3 | 49.61c | 50.40b | 33.37a | 25.17d | 24.45b | 17.01b | |
| T4 | 47.7d | 52.29a | 32.92a | 26.62c | 26.27a | 14.17c | |
| Control | 48.78c | 51.22b | 32.64a | 26.72c | - | 40.65a | |
| Sig. (P< 0.05) | * | * | * | * | * | * | |
| LSD | 0.93 | 0.93 | 0.9 | 1.19 | 0.87 | 1.37 | |
| CV (%) | 1.03 | 1.02 | 1.58 | 2.35 | 2.4 | 3.63 | |
*, significant (p < 0.05); abc, means denoted by different letters within a column are significantly different according to the LSD test (p < 0.05). DAT: days after treatment, T1; 5 mM 15NO3, T2; 2.5 mM 15NO3- + 2.5 mM NH4+, T3; 5 mM 15NH4+, T4; 2.5 mM 15NH4+ + 2.5 mM NO3-.
Table 4.
15N concentration in strawberry parts at 30 and 60 days after treatment.
| Treatments | 30 DAT (mg 15N/g DW) | 60 DAT (mg 15N/g DW) | |||||||||
| Leaves | Roots | Total | Dose-corrected | Leaves | Roots | Stolon | Fruits | Total | Dose-corrected | ||
| T1 | 13.61a | 10.86a | 13.11a | 13.11b | 4.32a | 3.55a | 2.19a | 0.23c | 3.58a | 3.58b | |
| T2 | 8.17c | 4.56c | 7.41c | 14.82a | 2.30c | 1.91c | 1.43b | 1.46b | 2.00c | 3.98a | |
| T3 | 9.85b | 6.42b | 9.25b | 9.25c | 3.89b | 2.56b | 2.12a | 2.91a | 3.28b | 3.28c | |
| T4 | 5.60d | 3.50d | 2.84d | 5.67d | 2.25c | 1.85c | 1.07c | 1.66b | 1.97c | 3.94a | |
| Sig. | * | * | * | * | * | * | * | * | * | * | |
| LSD | 0.53 | 0.69 | 0.52 | 0.87 | 0.136 | 0.18 | 0.09 | 0.29 | 0.18 | 0.18 | |
| CV (%) | 3.04 | 5.8 | 3.39 | 4.31 | 2.26 | 3.88 | 2.98 | 9.94 | 3.48 | 2.58 | |
*, significant (p < 0.05); abc, means denoted by different letters within a column are significantly different according to the LSD test (p < 0.05). T1; 5 mM 15NO3,T2; 2.5 mM 15NO3 + 2.5 mM NH4,T3; 5 mM 15NH4, T4; 2.5 mM 15NH4 + 2.5 mM NO3-.
Table 5.
Labeled nitrogen use efficiency of strawberry at 30 and 60 days after treatment.
| Treatments | 15N-Use efficiency (%) | 15N increment/decrement (%) | ||
| 30 DAT | 60 DAT | Average | ||
| T1 | 87.91b | 37.00b | 62.46b | -57.89d |
| T2 | 91.42a | 51.04a | 71.23a | -44.16c |
| T3 | 39.37d | 27.77d | 33.57d | -29.39b |
| T4 | 44.07c | 33.09c | 38.58c | -24.91a |
| Sig. (P< 0.05) | * | * | * | * |
| LSD | 2.64 | 1.4 | 1.55 | 3.41 |
| CV (%) | 2.13 | 1.99 | 1.6 | -4.64 |
*, significant (p < 0.05); abc, means denoted by different letters within a column are significantly different according to the LSD test (p < 0.05). DAT: days after treatment, T1; 5 mM 15NO3, T2; 2.5 mM 15NO3- + 2.5 mM NH4+, T3; 5 mM 15NH4+, T4; 2.5 mM 15NH4+ + 2.5 mM NO3-.
Table 6.
Time taken to initiate and progress through blooming stages by 'Praratchatan 80' strawberry plants treated with varying nitrogen sources.
Table 6.
Time taken to initiate and progress through blooming stages by 'Praratchatan 80' strawberry plants treated with varying nitrogen sources.
| Treatments | Days to blooming | |||
| Initial (%) | 50% | 75% | 100% | |
| T1 | 46.13a | 53.13a | 58.13a | 66.13a |
| T2 | 24.25b | 31.25b | 36.25b | 44.25b |
| T3 | 24.13b | 31.13b | 36.13b | 44.13b |
| T4 | 26.75b | 33.25b | 38.38b | 46.13b |
| Control | 46.38a | 52.25a | 57.25a | 65.25a |
| Sig. (P< 0.05) | * | * | * | * |
| LSD | 2.62 | 2.60 | 2.63 | 2.60 |
| CV (%) | 7.70 | 6.44 | 5.60 | 4.82 |
*, significant (p < 0.05); ns, not significant; abc, means denoted by different letters within a column are significantly different according to the LSD test (p < 0.05). T1; 5 mM 15NO3, T2; 2.5 mM 15NO3- + 2.5 mM NH4+, T3; 5 mM 15NH4+, T4; 2.5 mM 15NH4+ + 2.5 mM NO3-.
Table 7.
Concentrations of essential nutrients (mg/L) in CMU-S2 and the N-free nutrient recipe used in the experiment.
Table 7.
Concentrations of essential nutrients (mg/L) in CMU-S2 and the N-free nutrient recipe used in the experiment.
| Nutrient elements | CMU-S2 (mg/L) | N-Free Recipe (mg/L) |
| Major element | ||
| N | 147.85 | - |
| P | 39.75 | 55.75 |
| K | 255.31 | 70.39 |
| Mg | 28.51 | 30.29 |
| Ca | 73.23 | 40.65 |
| S | 38.44 | 60.00 |
| Minor element | ||
| Zn | 1.37 | 0.60 |
| Mn | 0.61 | 0.25 |
| B | 1.05 | 0.60 |
| Mo | 0.18 | 0.045 |
| Fe | 3.99 | 4.00 |
| Cu | 0.23 | 0.09 |
CMU; Chiang Mai University.
Disclaimer/Publisher’s Note: The statements, opinions and data contained in all publications are solely those of the individual author(s) and contributor(s) and not of MDPI and/or the editor(s). MDPI and/or the editor(s) disclaim responsibility for any injury to people or property resulting from any ideas, methods, instructions or products referred to in the content. |
© 2024 by the authors. Licensee MDPI, Basel, Switzerland. This article is an open access article distributed under the terms and conditions of the Creative Commons Attribution (CC BY) license (http://creativecommons.org/licenses/by/4.0/).
Copyright: This open access article is published under a Creative Commons CC BY 4.0 license, which permit the free download, distribution, and reuse, provided that the author and preprint are cited in any reuse.


