
Submitted:
17 December 2024
Posted:
18 December 2024
You are already at the latest version
Abstract
Diabetic retinopathy is the most common diabetic complication of the microvasculature, and one of the leading causes of acquired vision loss worldwide. Yet, the current treatments for this blinding disease are futile to many diabetics. Accordingly, new biomarkers and therapeutics for diabetic retinopathy is needed. We discovered that STEAP4 (Six-Transmembrane Epithelial Antigen of the Prostate 4) is significantly increased in peripheral blood mononuclear cells of diabetics. STEAP4 expression was gradiently increased from low levels in diabetics without retinopathy to successively higher levels in diabetics with more severe disease. Although the role of STEAP4 in the diabetic retina is unclear, these results provide strong evidence that this metabolic enzyme could be a potential biomarker for diabetic retinopathy progression. Thus, the central goal of this study was to evaluate if this potential biomarker impacts the intrinsic pathologies that lead to the development of diabetic retinopathy. In diabetic mice, STEAP4 was significantly increased and co-localized with 4-Hydroxy-2-nonenal in the Müller glia and photoreceptor layers of the retina. STEAP4 inhibition significantly decreased reactive oxygen species in murine photoreceptor cells, human Müller glia, and retinas of diabetic mice. Administering an intravitreal injection of anti-STEAP4 to diabetic mice halted Occludin degradation in the retinal vasculature. Similarly, anti-STEAP4 treatment of human retina endothelial cells halted cell death mediated by diabetic donor sera. Collectively, our findings provide strong evidence that STEAP4 impacts the intrinsic pathologies that initiate the development of diabetic retinopathy. Suggesting that STEAP4 could be a novel biomarker and clinically relevant therapeutic target for this diabetic complication and blinding disease.
Keywords:
diabetic retinopathy
; STEAP4
; oxidative stress
1. Introduction
More than 10% of the US population is diabetic, while more than half suffer from (DR) diabetic retinopathy [1,2]. However, there is no treatment for non-proliferative DR (NPDR), there are no biomarkers for the progression of DR, and treatments for late-stage proliferative diabetic retinopathy (PDR) is futile to ~30% of the diabetics receiving care [3,4]. With such a significant healthcare issue, new biomarkers and therapeutic targets are required to halt the progression of this incurable microvascular disease.
The etiology of DR is multifactorial. Yet, multiple studies provide strong evidence that hyperglycemia enhances retinal oxidative stress, which leads to the development of DR [5,6,7,8,9]. One of the diabetes-mediated mechanisms of oxidative stress is Ferrous iron (Fe2+) accumulation in the retina [10]. Diabetes initiates Fe2+ uptake in the retina [10]. The retina’s compensatory mechanism for this iron overload is to oxidize the excess Fe2+ to elicit extracellular release of (Fe3+) ferric iron [11]. Through the Fenton reaction, ferrous iron is oxidized by hydrogen peroxide, which generates ferric iron and hydroxyl radicals [12]. These hydroxyl radicals are toxic reactive oxygen species that exacerbate oxidative stress in the diabetic retina. Enhanced oxidative stress causes retinal endothelial cell death and tight junction protein degradation in the retinal microvasculature. This can lead to retinal vascular leakage, capillary non-perfusion, and the development of NPDR and/or diabetic macular edema [13,14,15].
Per the literature, Steap4 is upregulated in the retina of diabetic rats [16]. This is of interest because STEAP4 is a ferroxidase that catalyzes the reduction of extracellular Fe3+ to Fe2+ for cellular uptake [17,18]. Since STEAP3 maintains iron homeostasis in the thriving retina [19,20], it is unknown why only STEAP4 is upregulated in the diabetic retina. When extracellular Fe3+ binds to the C-terminal transmembrane domain of STEAP4, NADPH oxidoreductase binds to the cytosolic N-terminal domain of STEAP4 [21]. This induces extracellular iron reduction, intracellular iron uptake, and cellular production of reactive oxygen species (ROS). In this current study, we discovered that STEAP4 is upregulated in the blood of diabetic patients, and that levels of STEAP4 correlates to the severity of DR. Suggesting that STEAP4 could be a clinically relevant biomarker for the progression of DR. Since STEAP4 produces ROS while catalyzing iron, we postulated that STEAP4 would enhance oxidative stress in the diabetic retina. Consequently, increased oxidative stress should impel vascular damage in the diabetic retina, which can lead to the onset of DR. Thus, we hypothesized that STEAP4 inhibition in the diabetic retina would decrease retinal oxidative stress and arrest vascular impairment. Thus, it is the overarching goal of this study to define the role of this potentially novel biomarker in the development of DR.
2. Materials and Methods
2.1. Blood Collection and PBMC Sample Preparation from Non-Diabetic and Diabetic Patients
Non-diabetic and Type II diabetic male patients were enrolled in this IRB-approved clinical study at Louis Stokes Cleveland VA Medical Center; during routine eye exams. Written patient consent was provided prior to blood and patient record collection. Non-diabetic patients, and diabetic patients: without diabetic retinopathy, with moderate (ETDRS score = 43) non-proliferative diabetic retinopathy (NPDR) without macular edema, or with diabetic macular edema (DME) were enrolled. Patients’ records and blood samples were de-identified and numerically coded, to protect patient privacy. Sera were isolated through centrifugation of whole blood collected in vacutainer serum separator tubes (BD SST#367985, Franklin Lakes, NJ, USA). Blood was also collected in vacutainer sodium heparin tubes (BD #236874 Franklin Lakes, NJ, USA) for isolation of PBMC. PBMC were negatively selected by magnetic bead separation; using RoboSep-S (Stemcell Technologies, Vancouver, Canada), and the EasySep human PBMC isolation kit (Stemcell Technologies #19654, Vancouver, Canada).
2.2. Quantitative PCR Analysis of STEAP4 Expression in PBMC of Diabetics
According to the manufacturer’s directions, RNA was extracted from PBMC using the RNeasy kit (Qiagen, Hilden, Germany). Samples with an OD260/280 ratio of 2.0 were used to generate cDNA using qScript (Quanta Bio, Beverly, MA, USA). Quantitative PCR was performed on a Lightcycler 96 System (Roche, Basel, Switzerland), using Fast Start Universal SYBR green (Roche, Basel, Switzerland) as the detecting probe. STEAP4 expression was quantified using human STEAP4 primers (NM_024636), and human ACTB primers (NM_001101) as the loading control. The ΔΔCt score was equated to quantify the levels of STEAP4 mRNA expression in human donor PBMC.
2.3. Streptozotocin Induced Diabetes in C57BL/6 Mice
Male C57BL/6 mice (strain no. 000664, The Jackson Laboratory, Bar Harbor, ME, USA) received IP injections of 60 mg/Kg of BW (STZ) streptozotocin (MP Biomedicals, Irvine, CA, USA) in 0.1M citrate buffer (pH 4.5) for five consecutive days; after a 6-hour fast. Food was returned to the mice immediately after each injection, and water was provided ad lib. Diabetes was confirmed by a 6-hour fasted blood glucose (FBG), with concentrations greater than 275 mg/dL. Diabetic conditions were verified by 3 separate FBG measures 14-21 days after the last STZ injection. Blood glucose was measured using a conventional consumer glucose testing meter and strips (FBG of non-diabetic mice were 150 + 40 mg/dL). Diabetic conditions were further confirmed by quantifying the hemoglobin A1C percentage, using the Crystal Chem Mouse A1C kit and Controls (Elk Grove Village, IL, USA). Mice were weighed weekly. When body weight loss exceeded 10% per week, 0-0.2 Units of insulin (Humulin N, NPH, Eli Lilly, Indianapolis, IN, USA) was administered on an as-needed basis to maintain body weight.
2.4. Anti-STEAP4 Neutralizing Antibodies and Treatment Regimen
The anti-STEAP4 neutralizing antibody is an antagonist that blocks Fe3+ binding to the STEAP4 C-terminal domain. Human STEAP4 neutralizing peptide was conjugated to STEAP4 antibody (PEP-0524-neutralizing peptide + PA5-20407-antibody, Thermo Fisher, Waltham, MA, USA) per manufacturer’s instructions; and used to block STEAP4 activity in human Müller glia and human retina endothelial cells (hREC). Neutralizing peptide (CVDNTLTRIRQGWERN of NP_078912.2) was conjugated to STEAP4 antibody, per the manufacturer’s instructions (MyBioSource, San Diego, CA, USA); and used to inhibit STEAP4 activity in 661W mouse cells and mouse retinas. For intravitreal injections, anti-STEAP4 was further conjugated to keyhole limpet hemocyanin (Imject mcKLH, Thermo Fisher, Waltham, MA, USA). Non-diabetic controls and diabetic C57BL/6 mice received one intravitreal injection of 1 μl saline containing 5 μg of KLH conjugated with anti-STEAP4 (MBS421017-neutralizing peptide + MBS426997-STEAP4 antibody); 1-week after diabetic conditions were confirmed.
Anti-STEAP4 was administered through intravitreal injections to anesthetized mice that received an IP injection of Ketamine: Xylazine cocktail. Proparacaine was applied to numb the eye, and tropicamide was applied to dilate the pupil. A beveled needle (34-gauge NanoFil, World Precision Instruments, Sarasota, FL, USA) was used to establish a route to the vitreous cavity. The needle was immediately replaced with a blunt-tip 34-gauge needle, attached to a micro-syringe (Sub-Microliter Injection System, and World Precision Instruments, Sarasota, FL) filled with saline containing 5 μg of anti-STEAP4. After anti-STEAP4 was administered through an intravitreal injection of one eye, eyes were covered with GenTeal 0.3% Hypromellose gel (Alcon, Fort Worth, TX, USA); to protect the corneas from drying. To prevent infection, ophthalmic bacitracin-neomycin-polymyxin triple antibiotic ointment was applied to the procedure eye once daily for 3 consecutive days after the anti-STEAP4 injection was administered.
2.5. Western Immunoblot and Automated WES Analysis of Retina Lysates
Retinas were pooled (n = 6), and homogenized in RIPA buffer (Thermo Fisher, Rockland, IL). Levels of protein was quantified in each sample using a BCA assay (Pierce, Waltham, MA, USA), and normalized in buffer to generate equal amounts of protein in samples. Samples of protein lysates were loaded onto SDS Tris-glycine gels and transferred to a PVDF membrane using the BioRad Trans-blot Turbo system (BioRad, Hercules, CA). Western immunoblots were incubated in Intercept blocking buffer (Li-Cor, Lincoln, Nebraska) for 1 hour at room temperature, and further incubated in blocking buffer containing 1:1000 of STEAP4 antibody (ABS998, Millipore, Burlington, MA, USA) for 18 hours at 4°C. Western immunoblots were washed, and incubated with the secondary antibody, and imaged on a Li-Cor Odyssey Imaging System using studio software (LiCor, Lincoln, NE, USA). Quantification was determined by normalizing samples to levels of β-actin in each sample (#8827, Abcam, Cambridge, MA, USA).
Alternatively, levels of Occludin in protein lysates was quantified using automated WES (Protein Simple, Biotechne, Minneapolis, MN, USA). Samples were loaded on WES cartridges and run according to manufacturer’s instructions, using anti-mouse Occludin antibody (DSHB, Iowa City, IA, USA). Occludin was quantified by an electropherogram generated by WES software; the area under the curve quantitates the level of Occludin in each protein lysate sample.
2.6. Immunofluorescence and Microscopy Analysis of Retina Cross Sections
Slides of retina cryostat sections from non-diabetic and diabetic mouse were blocked in 5% goat serum (R&D Systems Normal Goat Serum #DY005, Minneapolis, MN, USA), for 2 hours at room temperature. For iron analysis, anti-Ferritin antibody (Abcam #ab75973, Cambridge, UK) was diluted 1:100 in PBS + 0.05% TWEEN-20 (Promega #H5152, Madison, WI, USA), applied to slides and incubated for 18h at 4°C. Slides were washed in 3x PBS + 0.05% TWEEN-20 and incubated with goat secondary antibody conjugated to Alexa Fluor 488 fluorochrome (Jackson Immuno Research Labs, West Grove, PA) for 2 hours at room temperature. Slides were mounted using DAPI-Fluor mount-G (Southern Biotech #0100-20, Birmingham, AL, USA). Alternatively, cross sections were incubated with primary antibodies; anti-STEAP4 and/or anti-Vimentin (anti-STEAP4 #ABS988, Millipore, Burlington, MA, USA or anti-Vimentin #ab92547, Abcam, Waltham, MA, USA) for 18h at 4°C. Slides were washed with PBS + 0.05% TWEEN-20 and then stained with secondary antibodies (Alexa Fluor 488 or 647, Jackson Immuno Research Labs, West Grove, PA). Since both antibodies were generated from a rabbit host, rabbit serum and Fab fragments were used to prevent non-specific staining.
Lipid peroxidation was examined using 4-Hydroy-2-nonenal (4HNE) staining in retina cryostat sections of diabetic mice. Sections were blocked in 5% normal goat serum, stained with rabbit anti-serum directed against 4HNE (HNE11-S, Alpha Diagnostic, San Antonio, TX, USA), and anti-STEAP4 or anti-Vimentin. Slides were then incubated with Alexa 488 or 647 conjugated secondary antibodies. Images were then viewed on a Leica DMI 6000B widefield microscope, and the Olympus Fluoview FV1200 Laser Scanning Confocal Microscope for 4HNE colocalization analyses.
2.7. Retina Cell Lines
Human retina endothelial cells (hREC) of the microvasculature were purchased from Cell Systems (Catalog #ACBRI, Kirkland, WA, USA). Purity of cells were verified by Cell System to have cytoplasmic uptake of Di-I-Ac-LDL, and positivity of cytoplasmic VWF/Factor VII and CD31. Cells were cultured in manufacturer’s recommended media.
Human Müller glia were isolated from the posterior section of retinal globes from human cadaver eyes (Eversight, Cleveland, OH, USA). Müller glia were mechanically isolated, cultured in DMEM/HAM F12 media at 37°C with 5% CO2, and collected after 3 passages. Cell purity was confirmed by flow cytometry analysis (>99% Vimentin+/GS+).
2.8. Detection of Reactive Oxygen Species
Human Müller glia or 661W cells (1x10⁵ cells/well) were cultured in euglycemic or hyperglycemic conditioned media. All treated cells were cultured in optimal conditions (media containing 5mM of glucose) with 1, 2, or 5 μg of anti-human or anti-mouse STEAP4 neutralizing antibody. Cells were incubated at 37°C for 2 hours. Untreated and anti-STEAP4 treated cells either remained in media containing 5mM of glucose or media was changed, and cells were cultured in hyperglycemic conditions (media containing 25mM of glucose) for 18 hours. Cells were collected and incubated with 10μM H2CFDA (Invitrogen # D399, Carlsbad, CA, USA) at 37°C for 30 minutes in the dark. Levels of ROS were quantified by measuring H2CFDA (ROS fluorescent indicator) on a BD Accuri C6 flow cytometer (BD, San Jose, CA, USA).
Alternatively, retina cells were isolated as previously described [24]. Briefly, cells were isolated from retinas using the Worthington papain dissociation kit (Worthington Biochemical #LK003150, Lakewood, NJ, USA), followed by collagenase incubation for 1 hour at 37°C. Retina cells were washed in PBS, and incubated in H2CFDA (Invitrogen #D399, Carlsbad, CA, USA) for 30 minutes in the dark at 37°C. Levels of ROS- H2CFDA were quantified on a BD Accuri C6 flow cytometer (BD, San Jose, CA, USA).
2.9. Human Sera Induced Retinal Vascular Cell Death Analysis
Human vascular cell death assays were performed, as previously described [25]. Briefly, 1x10⁶ hREC/well were cultured in a 6-well plate containing 2 ml of Cell Systems’ media with or without 5 μg of anti-STEAP4 for 2 hours at 37°C with 5% CO2. After cells reached 80% confluency, 1 ml of media was removed and replaced with 1 ml of human serum of non-diabetic patients or diabetics with NPDR+DME. Cells were incubated with media containing sera for 18 hours at 37°C with 5% CO2. Cells were collected, stained with 7-AAD (eBioscience #00-6993-50, San Diego, CA), and analyzed for cell death by flow cytometry analyses of 7-AAD positivity.
3. Results
3.1. Clinical Data of Non-Diabetic and Diabetic Patient Donors
In concurrence to IRB #1588931 Protocol, clinical data and blood were collected from non-diabetic and Type II diabetic patients at Louis Stokes Cleveland VA Medical Center; after written consent was provided by all enrolled donors. Patient samples were acquired from Caucasian (55%) and African American (45%) men, with an age range of 25-75 years old. Patients were enrolled during their annual eye exams. Donors were not diagnosed with any other retinal disease. Severity of retinopathy was determined by ETDRS scoring during their eye exams. Per the donors’ patient records, there were no significant differences in cholesterol levels amongst each group. NFBG (non-fasted blood glucose) was measured at the time of sample collection, to affirm non-diabetic or diabetic conditions of the donors. As shown in Table 1, NFBG levels were significantly higher in all diabetics than non-diabetics (n=15/group).
Hemoglobin A1C percentages (HbA1C) of all mice and patient donors were used to affirm diabetic conditions. Because HbA1C scores have less variation over an elongated period of time than NFBG and FBG scores. In both human and mice, non-diabetics have HbA1C scores below 5.7% and diabetics have HbA1C scores above 6.5% [26]. Patients with pre-diabetes have HbA1C scores between 5.7-6.4%; any mouse or human donor that had HbA1C scores in this range were excluded from this study. As shown in Table 1, all non-diabetic donors had HbA1C scores below 5.7%, and all diabetic donors had HbA1C scores above 6.5%. Thus, all diabetic human donors had significantly higher HbA1C scores than non-diabetic donors.
3.2. Clinical Data of Non-Diabetic and Diabetic Mice
Diabetes was induced in mice through 5 consecutive STZ injections. Diabetes in mice was confirmed 3-weeks after mice received the last STZ injection. FBG measures greater than 275 mg/dL confirmed diabetic conditions, while non-diabetic mice had FBG concentrations of 150 + 40 mg/dL. To affirm diabetes at the time of harvest, HbA1C scores were measured 2-months after the last FBG analysis. As shown in Table 2, all diabetic mice had A1C scores above 6.5%, and all non-diabetic mice had A1C scores below 5.7%. Thus, all diabetic mice had significantly higher HbA1C scores than non-diabetic mice. But there were no significant differences in HbA1C scores of untreated than treated diabetic mice. Finally, STZ-diabetic mice normally have significantly lower body weights than non-diabetic mice [27]. As shown in Table 2, all diabetic mice had significantly lower body weights than all non-diabetic mice. However, there were no significant differences in body weights of the treated diabetic mice than the untreated diabetic mice (Table 2).
3.3. STEAP4 Expression is Upregulated in PBMC of Diabetic Patients
The STEAP4 gene is constitutively expressed in PBMC [28]. In rheumatoid arthritis and sepsis, upregulated STEAP4 expression in PBMC initiated ROS production that caused pathologic oxidative stress [28,29]. As shown in Figure 1, STEAP4 is expressed in human PBMC and is significantly increased in PBMC of all diabetic donors. It is further notable that there is a gradient increase of STEAP4 from low levels in non-diabetics to successively higher levels in diabetics with more severe disease (Figure 1). This correlation of STEAP4 expression to the severity of diabetic retinopathy suggests that STEAP4 could be a clinically relevant biomarker for the progression of diabetic retinopathy.
3.4. STEAP4 and Iron Is Significantly Increased in the Retinas of Diabetic Mice
STEAP4 protein is upregulated in retinal mitochondria in STZ-diabetic male rats [14]. To affirm that STEAP4 is upregulated in the retinas of diabetic mice, protein lysates of 6 pooled retinas per sample (n=3/group) from non-diabetic and diabetic mice were examined by Western immunoblot; 2-months post-diabetes. As shown in Figure 2A, STEAP4 was detected in retinal protein of both non-diabetic and diabetic mice. Per Licor quantification, STEAP4 is significantly increased in the retinas of diabetic mice than non-diabetic mice (Figure 2B). STEAP4 is activated when iron is upregulated [30,31]. Per the literature, diabetes upregulates ferric iron in the serum that induces ferrous iron uptake in the retina [18]. When ferrous iron accumulates in the retina, an iron storage protein known as ferritin is upregulated [12]. Thus, ferritin staining is used as an indicator of iron accumulation in cells, tissue, and in the retina [12,32]. As shown in Figure 2C, only negligible levels of ferritin are detected in the retinas of non-diabetic mice. Yet, there are detectable levels of ferritin in the retinas of diabetic mice; 2-months post-diabetes. Per Metamorph quantification, levels of ferritin are significantly increased in the retinas of diabetic mice when compared to non-diabetic mice (Figure 2D). These results provide evidence that STEAP4 and iron are simultaneously upregulated in diabetic retinas.
3.5. STEAP4 Is Upregulated in the Photoreceptor and Müller Glia Layers in Retinas of Diabetic Mice
To further determine where STEAP4 is upregulated in the retina, cross sections of retinas from non-diabetic and diabetic male mice were stained with anti-STEAP4 (green) and DAPI (blue) for microscopy analyses. As shown in Figure 3A, STEAP4 (green) was prevalently upregulated in the retina layers where photoreceptor (PRL: red arrows) cells and Müller glia (INL stretching to IPL and OPL: red box) reside. Per Metamorph analyses of all retinas (n=5/group), levels of STEAP4 is significantly increased in the entire retina of diabetic than non-diabetic mice; 2-months post-diabetes (Figure 3B). Notably, STEAP4 is significantly increased in the layers of the retinas where photoreceptors (Figure 3C) and Müller glia (Figure 3D) reside in diabetic mice; compared to retinas of non-diabetic mice. These data provide strong evidence that diabetes-mediates STEAP4 upregulation in the neural retina layers where photoreceptor cells and Müller glia reside.
3.6. STEAP4 and 4HNE Colocalize in Photoreceptors and Müller Glia of Diabetic Mice
Diabetes-mediates reactive oxygen species (ROS) to be produced by photoreceptor cells and Müller glia and enhances retinal oxidative stress [5,6]. To determine if STEAP4 impacts retinal oxidative stress, lipid peroxidation (4-Hydroxy-2-nonenal (4HNE)) was examined in the neural retina of diabetic mice; 2-months after diabetes was confirmed. Retina cross sections from diabetic mice were stained for STEAP4 and 4-HNE for microscopy analysis. As shown in Figure 4A, colocalization (yellow) of 4-HNE and STEAP4 was detected in the photoreceptor layer and inner nuclear layer (INL; where Müller glia reside). Further confocal analysis confirmed colocalization (yellow) of STEAP4 (green) and 4-HNE (red) in photoreceptors (Figure 4B). While Vimentin (red) stained Müller glia in the INL of the retina was colocalized (yellow) with STEAP4 (green in Figure 4C) and 4HNE (green in Figure 4D). Suggesting STEAP4 impacts oxidative stress in photoreceptors and Müller glia in the retinas of diabetic mice.
3.7. Anti-STEAP4 Halts ROS Production in Müller Glia and Photoreceptor Cells
Neutralizing anti-STEAP4 antibody is an antagonist that binds to the C-terminal portion of STEAP4, causing a conformational change in the transmembrane binding groove of STEAP4. This inhibits the biological activity of STEAP4 and halts STEAP4-dependent ROS production [30]. To validate anti-STEAP4, 1 x 10⁵ Müller glia or 661W photoreceptor-like cone cells were incubated with varying concentrations of anti-STEAP4 in euglycemic conditions (5mM of glucose in media) for 2 hours at 37°C. Cells were then cultured in hyperglycemic conditions (25mM of glucose in media) for 18 hours at 37°C, which induces these cells to produce ROS [33,34,35]. Only negligible levels of ROS were detected in Müller glia (Figure 5A) and photoreceptors (Figure 5B) cultured in euglycemic conditions (media containing 5 mM of glucose). However, Müller glia and photoreceptors produced high levels of ROS when cultured in hyperglycemic conditions (25 mM of glucose). ROS production was significantly decreased when retina cells were cultured with anti-STEAP4 (αSTEAP4). A dose-dependent response to anti-STEAP4 was induced in both Müller glia (Figure 5A) and 661W-photoreceptor cells (Figure 5B). ROS levels were inversely decreased when retina cells were treated with 1 μg, 2 μg, and 5 μg of anti-STEAP4. While similar (no significant difference) levels of ROS was produced by Müller glia and photoreceptor cells treated with 5 μg of anti-STEAP4 as cells cultured in optimal euglycemic conditions. These results provide evidence that STEAP4 induces Müller glia and photoreceptors to produce ROS under hyperglycemic conditions. While elucidating that 5 μg of anti-STEAP4 is sufficient to halt hyperglycemia-mediated ROS.
3.8. Anti-STEAP4 Treatment Halts Retinal Oxidative Stress in Diabetic Mice
To further ascertain a role for STEAP4 in diabetes-mediated retinal oxidative stress, non-diabetic (ND) and diabetic (DB) C57BL/6 mice received one intravitreal injection of 5 μg of anti-STEAP4; 1-week after diabetes was confirmed. Retinas were collected, processed, and incubated with H2CFDA to quantify levels of ROS in retina cells of individual retinas by flow cytometry analysis; 2-months post-diabetes. As shown in Figure 6, there was no difference in the level of ROS in retinas of untreated (grey) than anti-STEAP4 treated (grey striped) non-diabetic mice. Levels of ROS were significantly higher in the retinas of untreated (red) and KLH treated (carrier protein KLH-control: black and red checkered) diabetic mice compared to non-diabetic mice. While diabetes-mediated ROS was significantly decreased in the retinas of anti-STEAP4 treated (red striped) diabetic mice when compared to the untreated and KLH treated diabetic mice. Notably, there were no significant differences in the levels of ROS detected in the anti-STEAP4 treated diabetic mice and the non-diabetic controls. These data provide strong evidence that STEAP4 impacts oxidative stress in diabetic retinas.
3.9. Anti-STEAP4 Treatment Impedes Diabetes-Mediated Occludin Degradation in Murine Retinas
Tight junction protein degradation is the earliest vascular impairment detectable in diabetic mice [36]. Hyperglycemia impairs the expression of Occludin (a tight junction protein) in the retinal vasculature during the onset of diabetic retinopathy [36]. To define the impact of STEAP4 on Occludin degradation, diabetic mice remained untreated or received one intravitreal injection of saline containing 5 μg of anti-STEAP4; 1-week after diabetes was confirmed. Levels of Occludin were examined in protein lysates of retina vasculature of untreated and anti-STEAP4 treated diabetic mice by automated Western immunoblot (WES) analysis. As shown in Figure 7A-B, levels of Occludin were higher in the lysates of the retinal vasculature from anti-STEAP4 treated diabetic mice than untreated diabetic mice. Additionally, Occludin was significantly increased in all protein samples of retinal vasculature from anti-STEAP4 treated than untreated diabetic mice (n=5/group); 2-months post-diabetes. These results provide strong evidence that STEAP4 impacts the integrity of the retinal microvasculature in diabetic mice.
3.10. Anti-STEAP4 Inhibits Diabetes-Mediated Human Retina Endothelial Cell Death
Retina endothelial cell (REC) death can be induced ex vivo when RECs are cultured with cytokines, sera, or immune cells of diabetic donors [25,37,38]. This proof of concept assay models the interactions that occur between endothelial cells in the vasculature of the retina and inflammatory processes circulating through the retinal vasculature. To determine if STEAP4 impacts cell death in human retina endothelial cells (hREC), untreated or anti-STEAP4 treated hREC were incubated with sera of non-diabetics (ND; n=15) or sera of patients with diabetic macular edema (DME; n=15) for 18 hours at 37°C with 5% CO2. Cells were collected and stained with 7-AAD for flow cytometry analysis of cellular death. As shown in Figure 8, retina endothelial cell death was significantly increased when untreated hREC (black) were cultured with sera of patients with DME than sera of non-diabetics. Conversely, cell death was significantly decreased when hREC were treated with anti-STEAP4 (red) prior to being cultured with sera of patients with DME. These findings provide proof of principle that diabetes-mediated STEAP4 impacts the integrity of the retinal vasculature in patients with diabetic macular edema.
4. Discussion
Taken together, the results from this study provide strong evidence that STEAP4 is upregulated in diabetic humans and mice. In the diabetic retina, both iron and STEAP4 are increased, which enhances retinal oxidative stress. This then initiates tight junction protein degradation and endothelial cell death in the diabetic retina. These subtle vascular impairments can lead to the development of diabetic retinopathy and vision loss [13]. When retina cells and mice were treated with anti-STEAP4 these intrinsic pathologies of diabetic retinopathy were halted.
STEAP 1- 4 isoforms are metalloreductases that promote and regulate cellular uptake of iron to maintain homeostasis. All of these STEAP isoforms are expressed in the retina, but only STEAP3 regulates iron homeostasis in the thriving retina [18,19]. However, STEAP4 is the only isoform upregulated in the diabetic retina [16]. In murine models of colon cancer, systemic ablation of STEAP4 halted iron overload and disease pathogenesis in mice [18,19]. Analogous to these findings, we discovered both iron and STEAP4 were upregulated in the diabetic retina, and that STEAP4 impelled photoreceptor cells and Müller glia to produce ROS. Consequently, STEAP4 enhances retinal oxidative stress, which is a pivotal precursor to the retinal pathogenesis and the development of diabetic retinopathy [5,6,7,8,9].
The etiology of diabetic retinopathy is multifactorial. Yet, multiple studies provide strong evidence that oxidative stress leads to the development of diabetic retinopathy [5]. Diabetes mediates chronic inflammation and oxidative stress, which causes gradual changes in the retinal microvasculature. These early-stage changes cause tight junction protein degradation and retina endothelial cell death [36]. Leading to capillary non-perfusion, vascular leakage, and the onset of non-proliferative diabetic retinopathy (NPDR). In some cases, these intrinsic pathologies mediate macular edema in the diabetic retina; altering vision [3]. Here we discovered that STEAP4 expression was significantly increased in PBMC of diabetics with NPDR and edema than patients with less severe NPDR and no edema. Subsequently, vascular cell death was halted when human retina endothelial cells were treated with anti-STEAP4 prior to the addition of sera from patients with NPDR and edema. Providing strong evidence that STEAP4 impacts the pathogenesis of diabetic retinopathy by exacerbating oxidative stress in the diabetic retina.
There is lacking consensus on the role of STEAP4 in adipocytes and diabetes onset [32,39,40,41,42,43]. Opposing results of the impact of STEAP4 on insulin resistance and glucose intolerance in humans than in mice have been reported [39,43]. The mechanistic basis for these reported inhibitory and inductive roles of STEAP4 in diabetes onset remains unclear. Defining the impact of STEAP4 in diabetes onset, rather than its role in the onset of a diabetic complication (diabetic retinopathy) is beyond the scope of this study. Since there have been reported discrepancies between human results and Type II diabetic mice, we used the STZ-Type I diabetic mouse model to mechanistically examine our clinical finding. Thus, defining the role of STEAP4 in the development of diabetic retinopathy in STZ-diabetic mice removes the extrinsic factors that could impede the onset of diabetes; thus, halting the onset of diabetic retinopathy in wild-type diabetic mice.
Collectively, the results from the human ex vivo and murine in vivo studies reveal the relevance of our original discovery that levels of STEAP4 significantly increasing in correlation to the severity of diabetic retinopathy. Thus, suggesting that STEAP4 could be a clinically relevant biomarker for the progression of diabetic retinopathy, and a novel therapeutic target for the development of diabetic retinopathy.
Author Contributions
The authors contributions to this study are as follows: conceptualization, B.E.T., S.J.H., C.L., and P.R.T.; methodology, B.E.T., S.J.H., C.L., Z.T., K.B., and P.R.T.; validation, B.E.T., S.J.H., C.L., Z.T., K.B., and P.R.T.; formal analysis, B.E.T., S.J.H., C.L., Z.T., K.B., and P.R.T.; investigation, B.E.T., S.J.H., C.L., Z.T., K.B., and P.R.T.; resources, P.R.T.; data curation, B.E.T., S.J.H., C.L., Z.T., K.B., and P.R.T.; writing—original draft preparation, B.E.T., S.J.H., C.L., Z.T., K.B., and P.R.T.; writing—review and editing, P.R.T.; project administration, P.R.T.; and funding acquisition, P.R.T. All authors have read and agreed to the published version of the manuscript.
Funding
This research was funded by VA-I01 CX002204, VA-I01 BX006424, NIH NEI-R01 EY030487, NIH NEI-P30 EY011373, The Ohio Lions Eye Research Foundation, and The Cleveland Eye Bank Foundation.
Institutional Review Board Statement
The human study was conducted in accordance with the Declaration of Helsinki, and approved by the Institutional Review Board of Louis Stokes Cleveland VA Medical Center (IRB# 1588931 approved August 12, 2021) for studies involving humans. The animal study protocol was approved by the Institutional Animal Care and Use Committee of Case Western Reserve University (IACUC# 2020-0001 approved January 31, 2020, and IACUC# 2024-0003 approved March 20, 2024). Also, the Animal Component of Research Protocol was approved by the Institutional Animal Care and Use Committee of Louis Stokes Cleveland VA Medical Center (1804268-MS-C approved May 8, 2024).
Informed Consent Statement
Informed consent was obtained from all subjects involved in the study. No identifiable patient information is contained in this publication.
Data Availability Statement
The datasets generated during and/or analyzed during the current study are available from the corresponding author upon reasonable request.
Acknowledgments
We would like to thank Timothy Kern for providing us with the 661W cells. We would also like to thank Dawn Smith, John Denker, Maryanne Pendergast, Heather Butler, and Catherine Doller for their outstanding technical assistance.
Conflicts of Interest
All authors declare no conflict of interest.
References
- Saeedi, P.; Petersohn, L.; et al. Global and regional diabetes prevalence estimates for 2019 and projections for 2030 and 2045: Results from the International Diabetes Federation Diabetes Atlas. Diabetes Res Clin Pract 2019, 157, 107843. [Google Scholar] [CrossRef]
- Bloomfield, H.E.; Greer, N.; et al. Predictors and consequences of severe hyperglycemia in adults with diabetes – a systemic review of the evidence. Washington DC: Veterans Affairs 2012. [Google Scholar]
- Duh, E.J.; Sun, J.K.; et al. Diabetic retinopathy: Current understanding, mechanisms, and treatment strategies. JCI Insight 2017, 2, e93751. [Google Scholar] [CrossRef] [PubMed]
- Zhao, Y.; Singh, R.P. The role of anti-vascular endothelial growth factor (anti-VEGF) in the management of proliferative diabetic retinopathy. Drugs Context 2018, 7, 212532. [Google Scholar] [CrossRef] [PubMed]
- Kowluru, R.A.; Chan, P.-S. Oxidative stress and diabetic retinopathy. Exp Diabetes Res 2007, 2007, 43603. [Google Scholar] [CrossRef]
- Du, Y.; Veenstra, A.; et al. Photoreceptor cells are major contributors to diabetes-induced oxidative stress and local inflammation in the retina. Proc Natl Acad Sci USA 2013, 110, 16586–16591. [Google Scholar] [CrossRef] [PubMed]
- Doganay, S.; Evereklioglu, C.; et al. Comparison of serum NO, TNF-alpha, IL-1beta, sIL-2R, IL-6 and IL-8 levels with grades of retinopathy in patients with diabetes mellitus. Eye (Lond) 2002, 16, 163–170. [Google Scholar] [CrossRef] [PubMed]
- Didion, S.P. Cellular and oxidative mechanisms associated with interleukin-6 signaling in the vasculature. Int J Mol Sci 2017, 12, 2563. [Google Scholar] [CrossRef]
- Howell, S.J.; Lee, C.A.; et al. Retinal inflammation, oxidative stress, and vascular impairment is ablated in diabetic mice receiving XMD8-92 treatment. Front Pharmacol 2021, 12, 732630. [Google Scholar] [CrossRef] [PubMed]
- Chaudhary, K.; Promsote, W.; et al. Iron overload accelerates the progression of diabetic retinopathy in association with increased retinal renin expression. Sci Rep 2018, 8, 3025. [Google Scholar] [CrossRef]
- Chen, Y.J.; Chen, J.T.; et al. Serum iron and risk of diabetic retinopathy. Nutrients 2020, 8, 2297. [Google Scholar] [CrossRef]
- Loh, A.; Hadziahmetovic, M.; et al. Iron homeostasis and eye disease. Biochim Biophys Acta 2008, 7, 637–649. [Google Scholar] [CrossRef] [PubMed]
- Hammes, H.P.; Feng, Y.; et al. Diabetic retinopathy: targeting vasoregression. Diabetes 2011, 60, 9–16. [Google Scholar] [CrossRef] [PubMed]
- Wang, W.; Lo, A.C.Y. Diabetic retinopathy: Pathophysiology and treatments. Int J Mol Sci 2018, 19, 1816. [Google Scholar] [CrossRef] [PubMed]
- Sinclair, S.H.; Schwartz, S.S. Diabetic retinopathy-An underdiagnosed and undertreated inflammatory, neuro-vascular complication of diabetes. Front Endocrinol 2019, 10, 843. [Google Scholar] [CrossRef]
- Wang, J.J.; Park, K.S.; et al. Proteomic analysis of retinal mitochondria-associated ER membrane identified novel proteins of retinal degeneration on long-term diabetes. Cells 2022, 18, 2819. [Google Scholar] [CrossRef] [PubMed]
- Jin, Y.; Wang, L.; et al. STAMP2 increases oxidative stress and is critical for prostate cancer. EMBO Mol Med 2015, 3, 315–331. [Google Scholar] [CrossRef]
- Xue, X.; Bredell, B.X.; et al. Quantitative proteomics identifies STEAP4 as a critical regulator of mitochondrial dysfunction linking inflammation and colon cancer. Proc Natl Acad Sci USA 2017, 45, E9608–E9617. [Google Scholar] [CrossRef]
- Liao, Y.; Zhao, J.; et al. Inflammation mobilizes copper metabolism to promote colon tumorigenesis via an IL-17-STEAP4-XIAP axis. Nat Commun 2020, 1, 900. [Google Scholar] [CrossRef]
- Pihlstrom, N.; Jin, Y.; et al. STAMP2 expression mediated by cytokines attenuates their growth-limiting effects in prostate cancer cells. Cancers 2021, 13, 1579. [Google Scholar] [CrossRef]
- Oosterheert, W.; van Bezouwen, L.S.; et al. Cryo-EM structures of human STEAP4 reveal mechanism of iron (III) reduction. Nat Commun 2018, 1, 4337. [Google Scholar] [CrossRef] [PubMed]
- Al-Ubaidi, M.R.; Font, R.L.; et al. Bilateral retinal and brain tumors in transgenic mice expressing simian virus 40 large T antigen under control of the human interphotoreceptor retinoid-binding protein promoter. J Cell Biol 1992, 119, 1681–1687. [Google Scholar] [CrossRef]
- Tan, E.; Ding, X.-Q.; et al. Expression of cone-photoreceptor-specific antigens in a cell line derived from retinal tumors in transgenic mice. Invest Ophthalmol Vis Sci 2010, 45, 764–768. [Google Scholar] [CrossRef] [PubMed]
- Sigurdardottir, S.; Zapadka, T.E.; et al. Diabetes-mediated IL-17A enhances retinal inflammation, oxidative stress, and vascular permeability. Cell Immunol 2019, 341, 103921. [Google Scholar] [CrossRef] [PubMed]
- Lindstrom, S.I.; Sigurdardottir, S.; et al. Diabetes induces IL-17A-Act1-FADD-dependent retinal endothelial cell death and capillary degeneration. J Diabetes Complications 2019, 33, 668–674. [Google Scholar] [CrossRef]
- Zhang, X.; Gregg, E.W.; et al. A1Cc level and future risk of diabetes: A systemic review. Diabetes Care 2010, 33, 1665–1673. [Google Scholar] [CrossRef] [PubMed]
- Kern, T.S.; Tang, J.; et al. Validation of structural and functional lesions of diabetic retinopathy in mice. Mol Vis 2010, 16, 2121–2131. [Google Scholar]
- Jiang, H.; Dong, Y.; et al. The expression of STEAP4 in peripheral blood predicts the outcome of septic patients. Ann Transl Med 2021, 9, 1519. [Google Scholar] [CrossRef]
- Li, W.; Yin, X.; et al. STEAP4 knockdown inhibits the proliferation of prostate cancer cells by activating the cGMP-PKG pathway under lipopolysaccharide-induced inflammatory microenvironment. Int Immunopharmacol 2021, 101, 108311. [Google Scholar] [CrossRef]
- Zhou, J.; Ye, S.; et al. Steap4 plays a critical role in osteoclastogenesis in vitro by regulating cellular iron/reactive oxygen species (ROS) levels and cAMP reponse element-binding protein (CREB) activation. J Biol Chem 2013, 288, 30064–30074. [Google Scholar] [CrossRef] [PubMed]
- Giannou, A.D.; Kleinschmidt, D.; et al. A critical role of the IL-22-IL-22 binding protein axis in hepatocellular carcinoma. Cancers 2022, 14, 6019. [Google Scholar] [CrossRef] [PubMed]
- Catalan, V.; Gomez-Ambrosi, J.; et al. Six-transmembrane epithelial antigen of prostate 4 and neutrophil gelatinase-associated lipocalin expression in visceral adipose tissue is related to iron status and inflammation in human obesity. Eur J Nutr 2013, 6, 1587–1595. [Google Scholar] [CrossRef]
- Albert-Garay, J.S.; Riesgo-Escovar, J.F.; et al. High glucose concentrations induce oxidative stress by inhibiting Nrf2 expression in rat Muller retinal cells in vitro. Sci Rep 2022, 12, 1261. [Google Scholar] [CrossRef] [PubMed]
- Du, Y.; Miller, C.M.; et al. Hyperglycemia increases mitochondrial superoxide in retina and retinal cells. Free Radic Biol Med 2003, 35, 1491–1499. [Google Scholar] [CrossRef] [PubMed]
- Zhang, T.; Zhu, L.; et al. Human macular Muller cells rely more on serine biosynthesis to combat oxidative stress than those from the periphery. Elife 2019, 8, e43598. [Google Scholar] [CrossRef]
- Barber, A.J.; Antonetti, D.A.; et al. Altered expression of retinal occludin and glial fibrillary acidic protein in experimental diabetes. The Penn State Retina Research Group. Invest Ophthalmol Vis Sci 2000, 41, 3561–3568. [Google Scholar]
- Liu, H.; Tang, J.; et al. Transducin 1, phototransduction and the development of early diabetic retinopathy. Invest Ophthalmol Vis Sci 2019, 5, 1538–1546. [Google Scholar] [CrossRef] [PubMed]
- Veenstra, A.; Liu, H.; et al. Diabetic Retinopathy: Retina-Specific Methods for Maintenance of Diabetic Rodents and Evaluation of Vascular Histopathology and Molecular Abnormalities. Curr Protoc Mouse Biol 2015, 5, 247–270. [Google Scholar] [CrossRef] [PubMed]
- Arner, P.; Stenson, B.M.; et al. Expression of six transmembrane protein of prostate 2 (STAMP2) in human adipose tissue associates with adiposity and insulin resistance. J Clin Endocrinol Metab 2008, 93, 2249–2254. [Google Scholar] [CrossRef]
- Shayo, S.C.; Ogiso, K.; et al. Dietary obesity and glycemic excursions cause a parallel increase in STEAP4 and pro-inflammatory gene expression in murine PBMCs. Diabetol Int 2022, 13, 358–371. [Google Scholar] [CrossRef]
- Sharma, P.R.; Mackey, A.J.; et al. An islet-targeted genome-wide association scan identifies novel genes implicated in cytokine-mediated islet stress in Type 2 diabetes. Endocrinology 2015, 156, 3147–3156. [Google Scholar] [CrossRef]
- Wellen, K.E.; Fucho, R.; et al. Coordinated regulation of nutrient and inflammatory responses by STAMP2 is essential for metabolic homeostasis. Cell 2007, 129, 537–548. [Google Scholar] [CrossRef] [PubMed]
- Chuang, C.T.; Guh, J.Y.; et al. Steap4 attenuates glucose and S100B-induced effects in mesangial cells. J Cell Mol Med 2015, 19, 1234–1244. [Google Scholar] [CrossRef] [PubMed]
Figure 1.
STEAP4 expression in PBMC of non-diabetic and diabetic patients. Fold increase of STEAP4 expression in PBMC (n=15/group) from non-diabetic patients (grey), diabetics without retinopathy (Diabetic: green), and diabetics with non-proliferative diabetic retinopathy (NPDR: blue) without and with diabetic macular edema (NPDR+DME: red). * = p < 0.01 calculated by 1-way nested ANOVA and Tukey’s post-hoc unpaired student t-test.
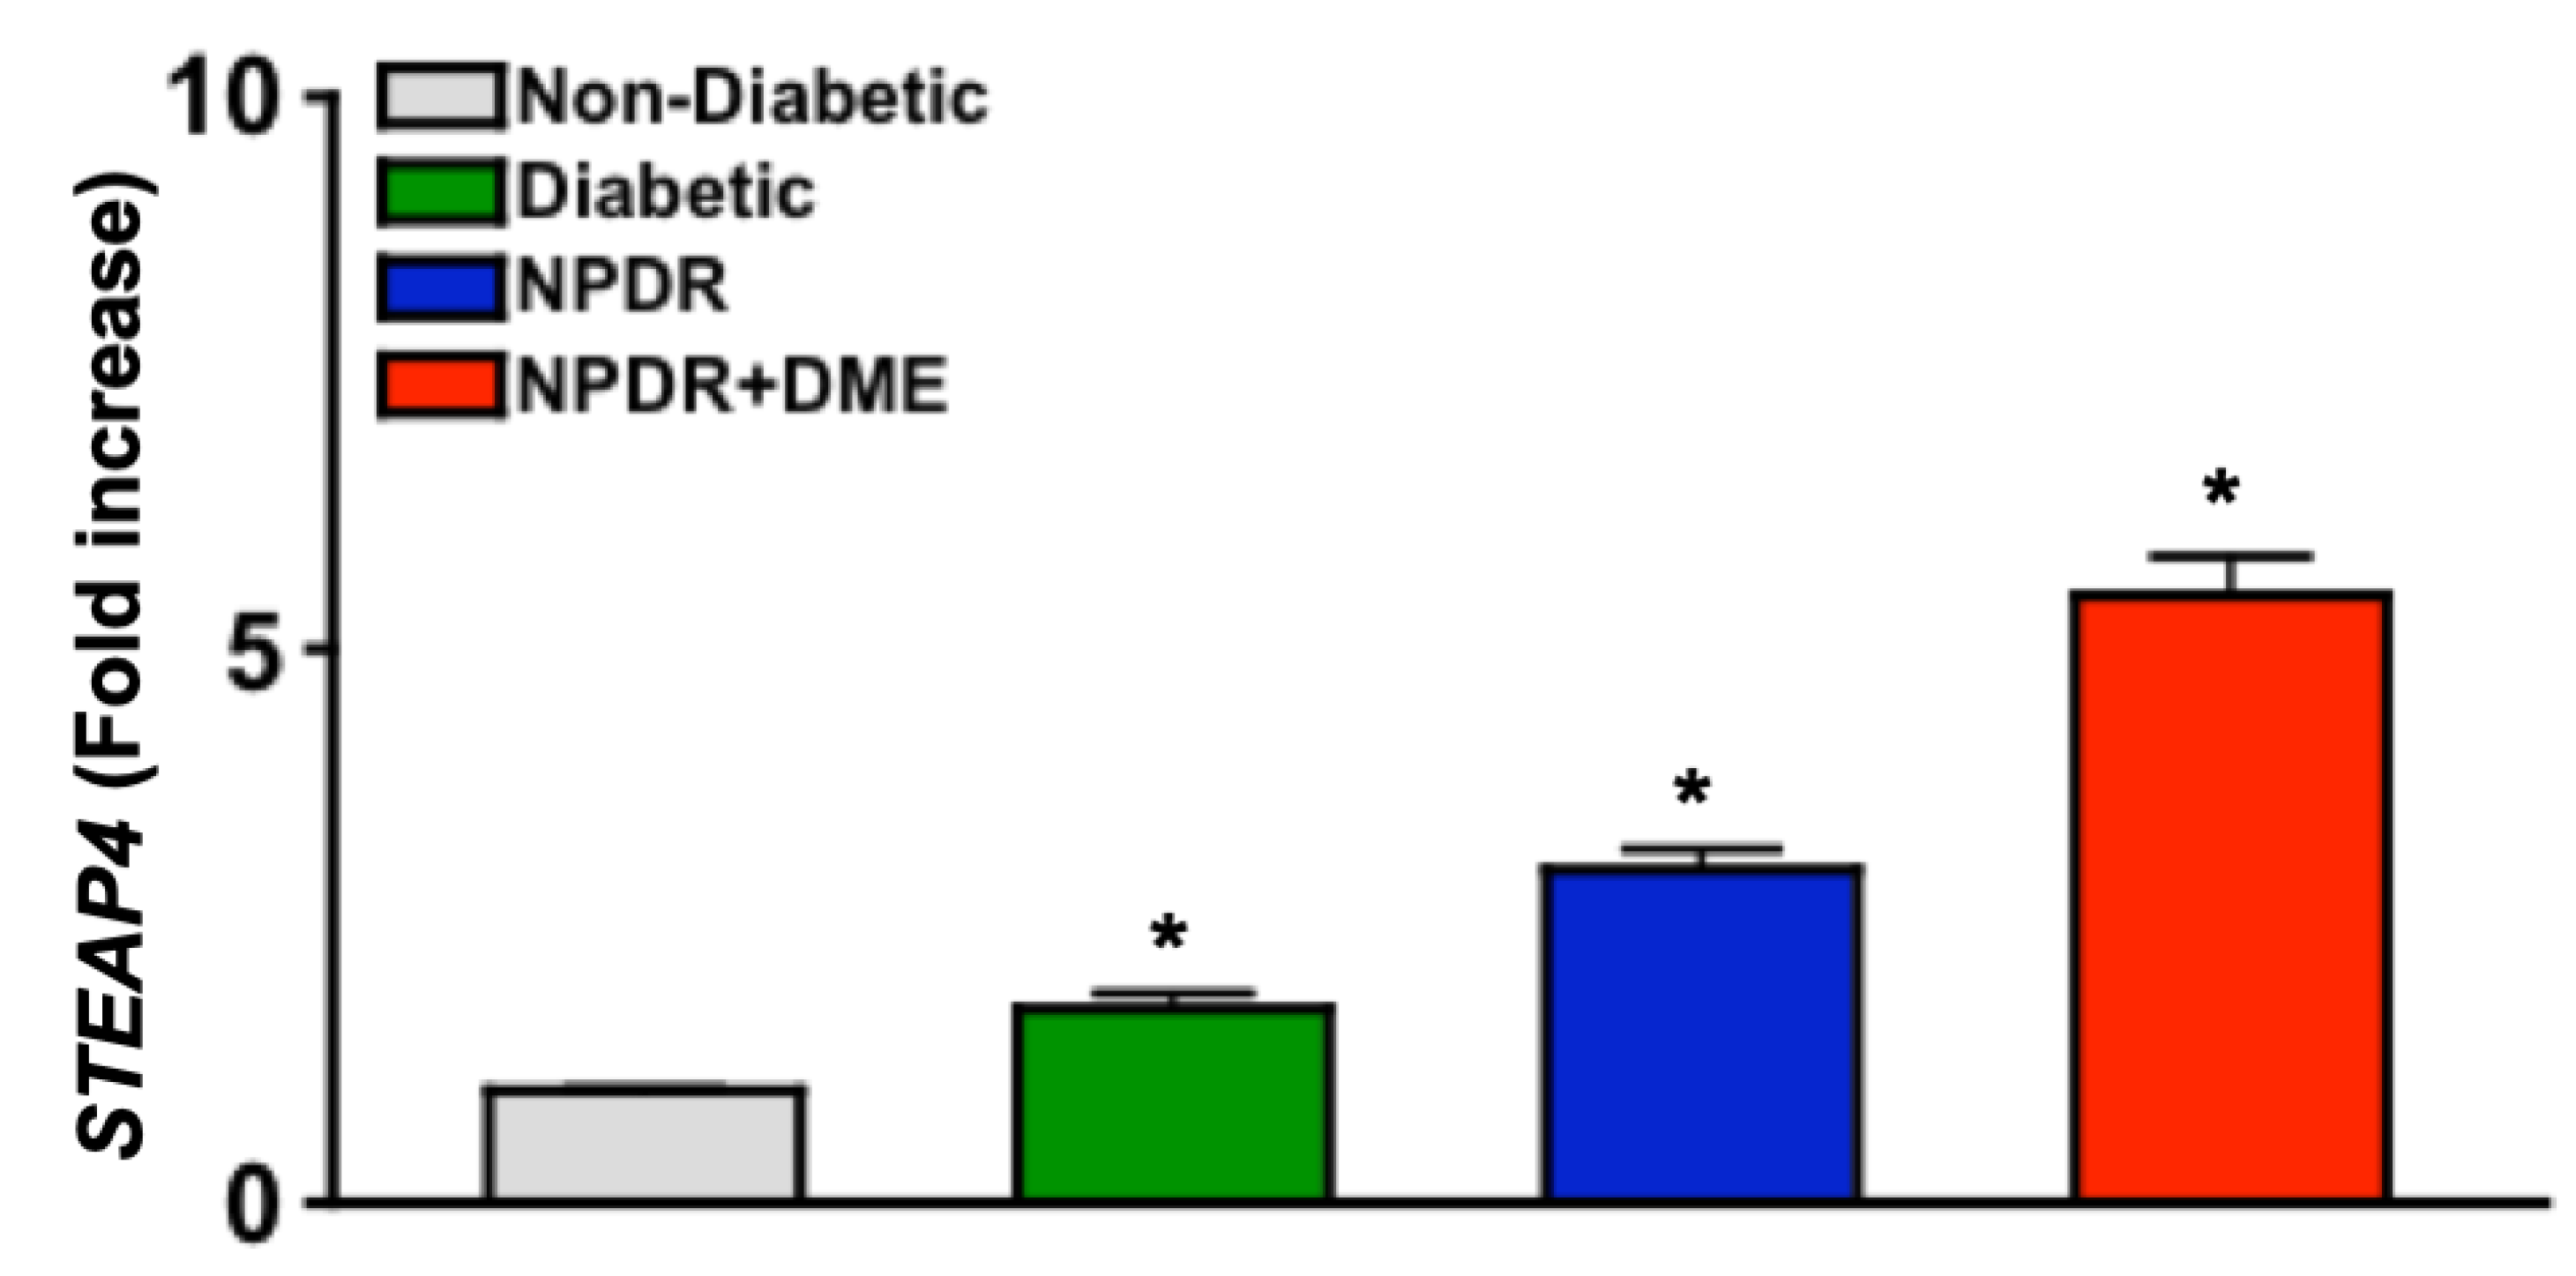
Figure 2.
STEAP4 and iron in the retinas of non-diabetic and diabetic mice. A) Representative immunoblot of STEAP4 (52 kDa: green) and β-actin (42 kDa: red) of protein lysates, and B) FIU (fluorescent intensity) quantification of all protein samples (n=3/group) from non-diabetic (grey) and diabetic (black) mice; 2-months post-diabetes. C) Representative images of ferritin (green) and DAPI (blue) stained retina cross sections of non-diabetic (ND) and diabetic (DB) mice. D) Metamorph quantification of relative ferritin fluorescence in all retinas examined (n=5/group) of non-diabetic (grey) and diabetic (green) mice; 2-months post diabetes. *=p< 0.01 per ANOVA and t-test.
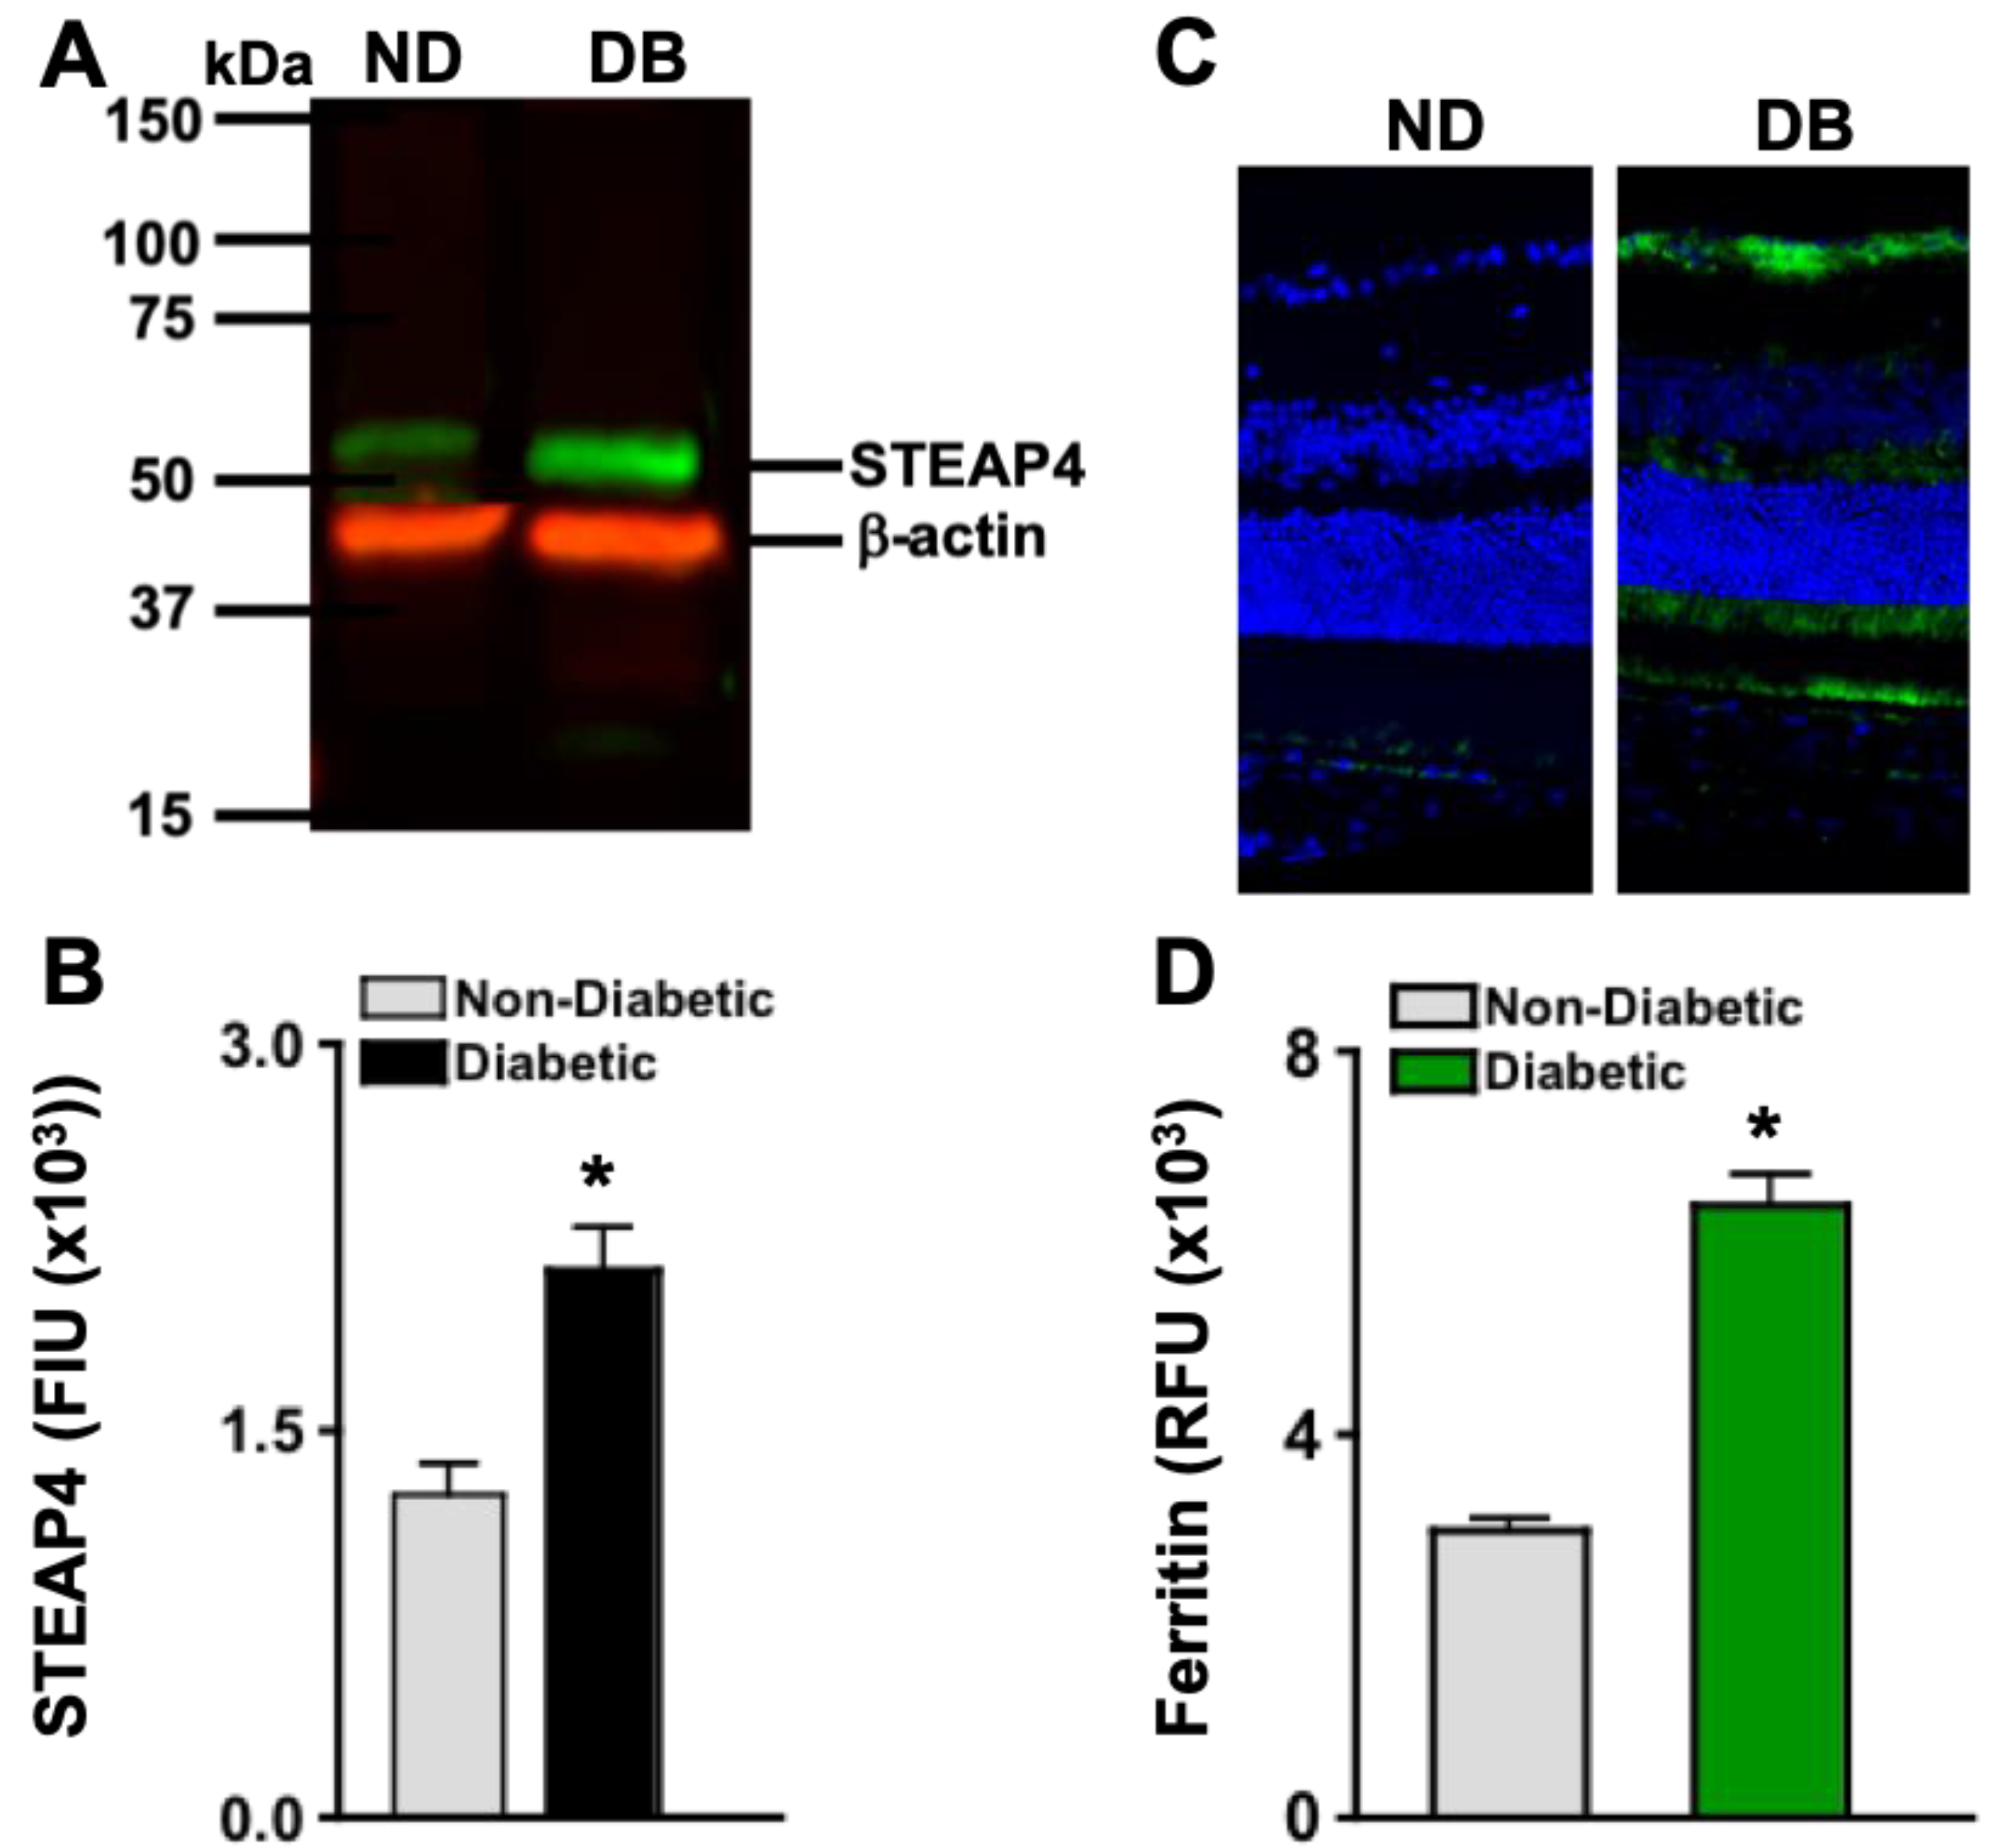
Figure 3.
STEAP4 in photoreceptor and Müller glia layers of murine retinas. A) Images of STEAP4 (green) and DAPI (blue) in 8 μM cross sections of retinas from non-diabetic and diabetic mice. STEAP4 in the photoreceptor layer is outlined by red arrows, and in the Müller glia layers is highlighted by a red box. Levels of STEAP4-fluorescence (FIU) in the total retina (B), photoreceptor layer (C), and retina layers where Müller glia reside (D) of non-diabetic (grey) and diabetic (green) mice (n=5/group); 2-months post-diabetes. *=p<0.01 per ANOVA and unpaired student t-test.
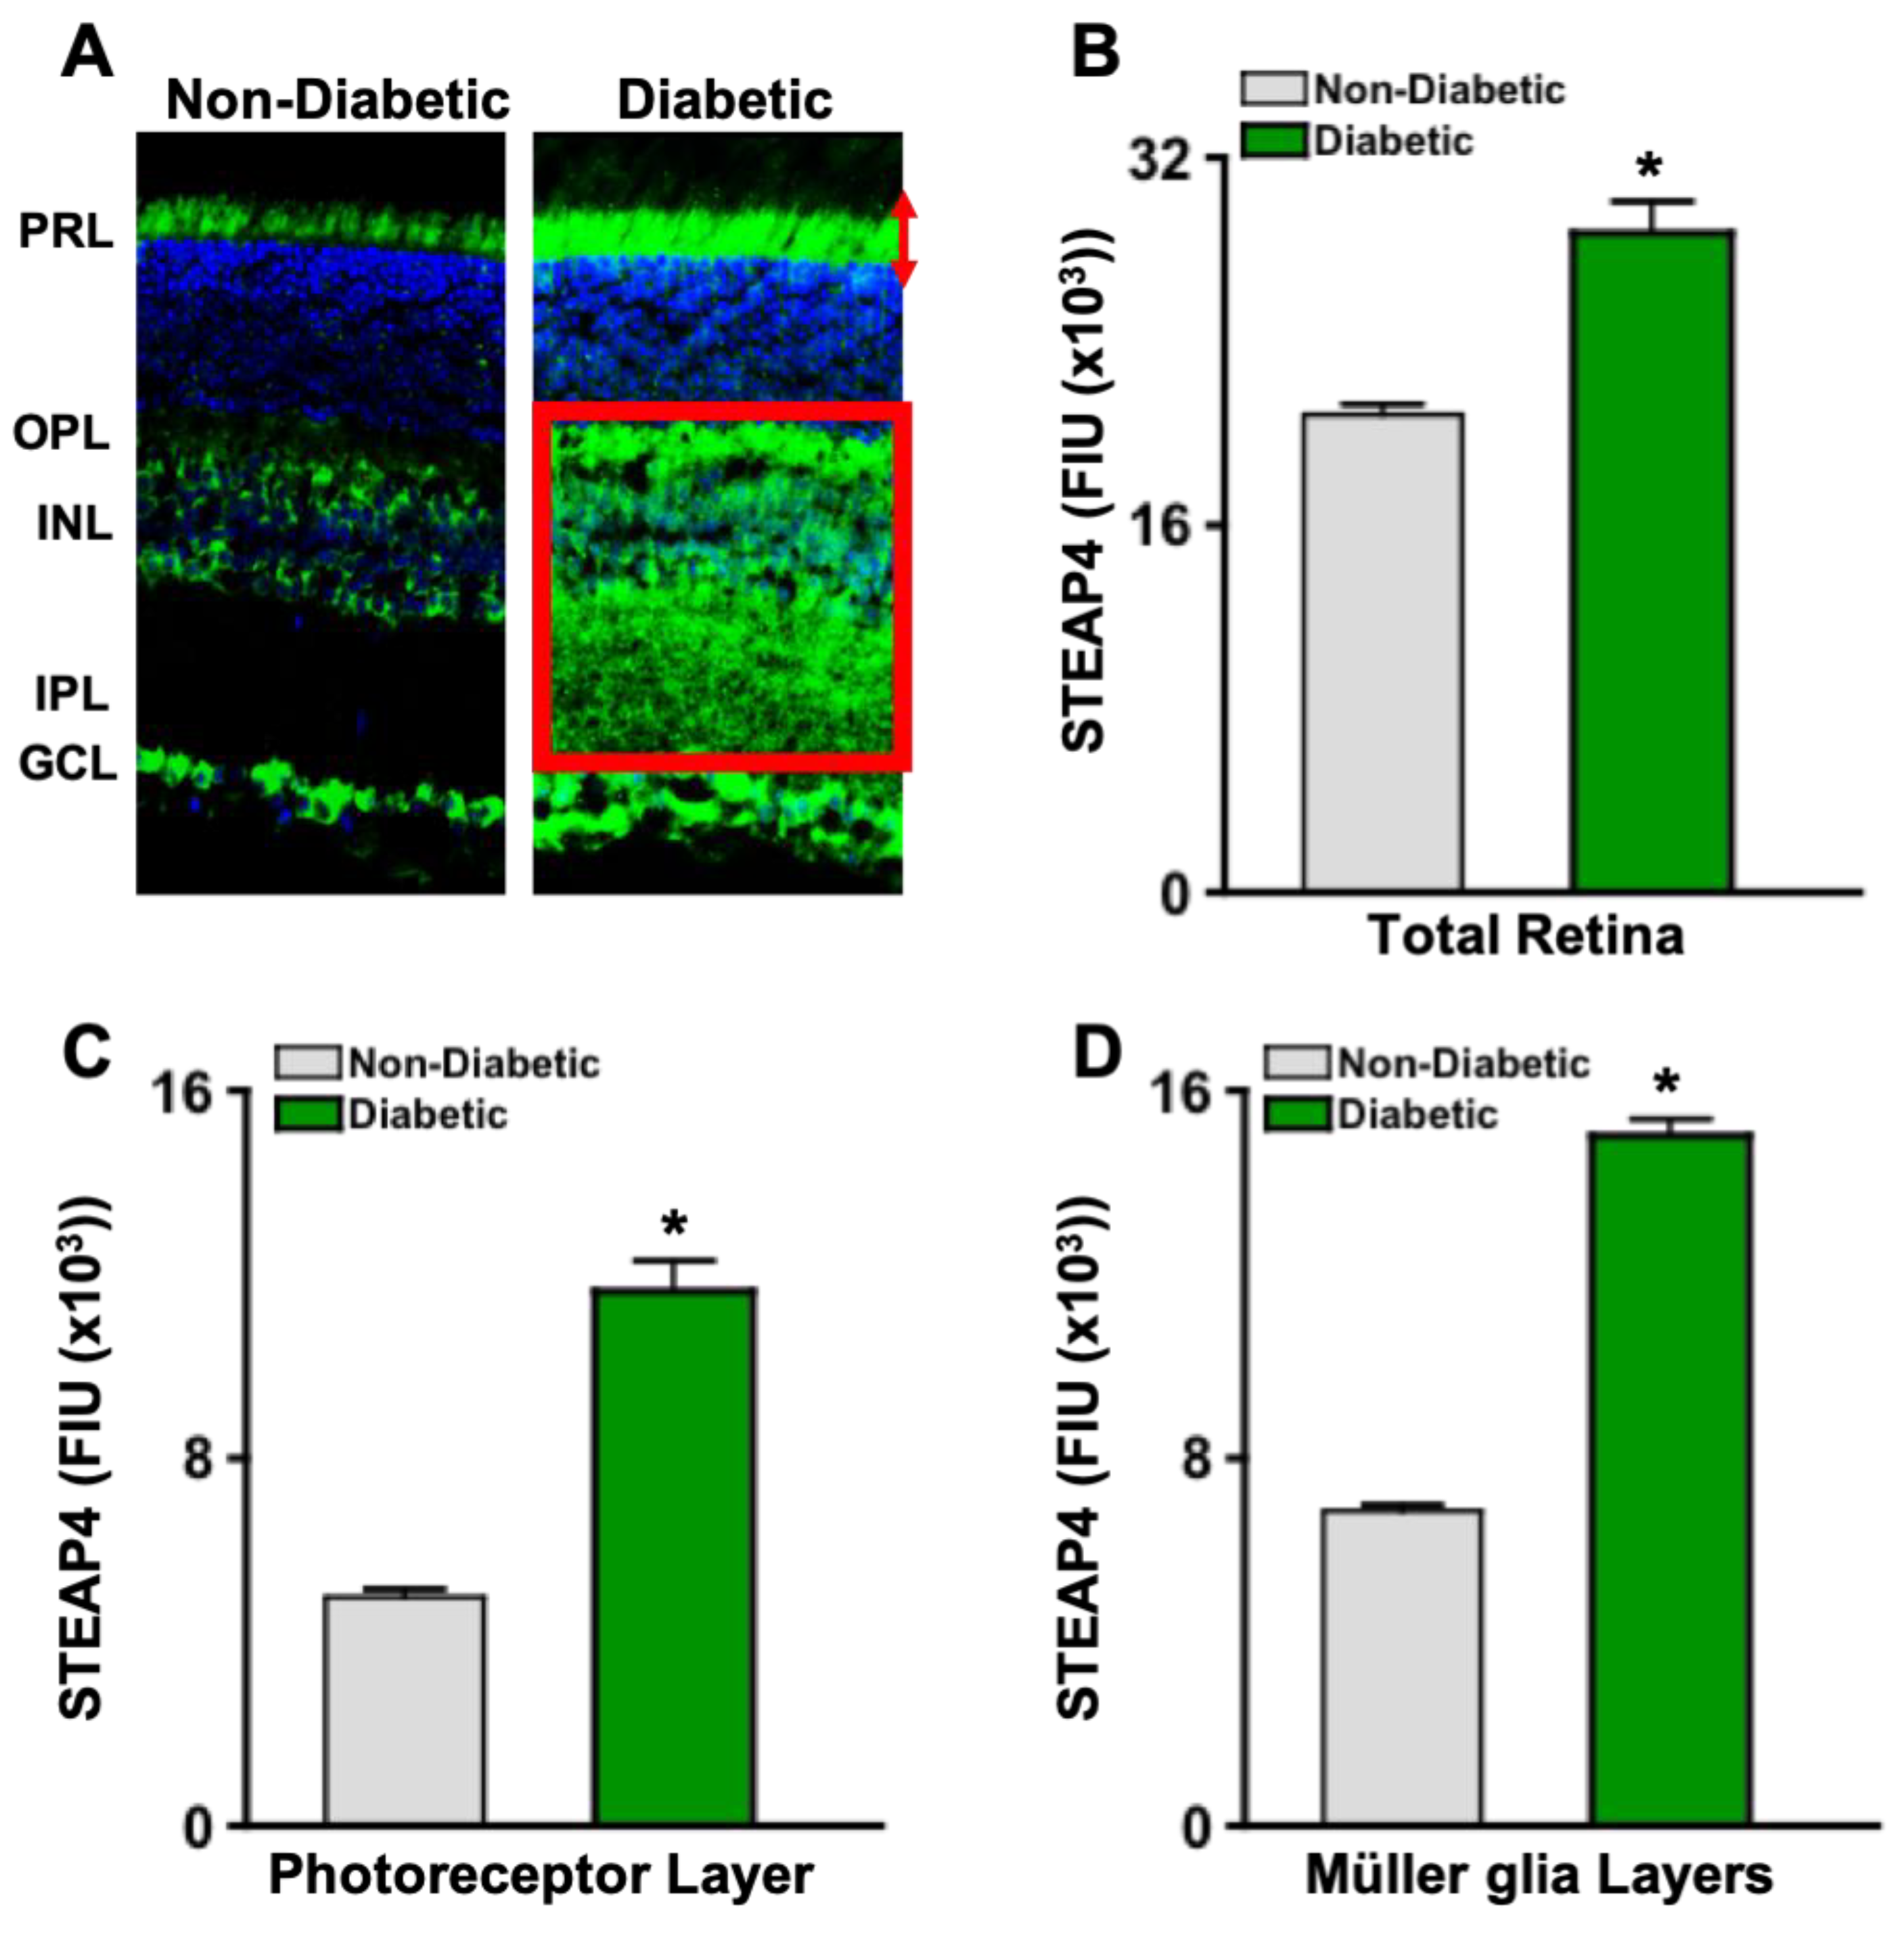
Figure 4.
STEAP4 and 4HNE in photoreceptors and Müller glia of diabetic mice. A) Widefield image of merged (yellow) STEAP4 (green) and 4HNE (red) in a retinal cross section from a diabetic mouse. B) Representative confocal images of photoreceptor outer segment, displaying STEAP4 (green) and 4HNE (red) colocalization (yellow). C) Confocal images of STEAP4 (green) colocalized in Vimentin (red) stained Müller glia. D) Confocal images of 4HNE (green) colocalization (yellow) in Vimentin (red) stained Müller glia. All images are representative of retina cross sections from diabetic mice analyzed (n=5) 2-months after diabetic conditions were confirmed.
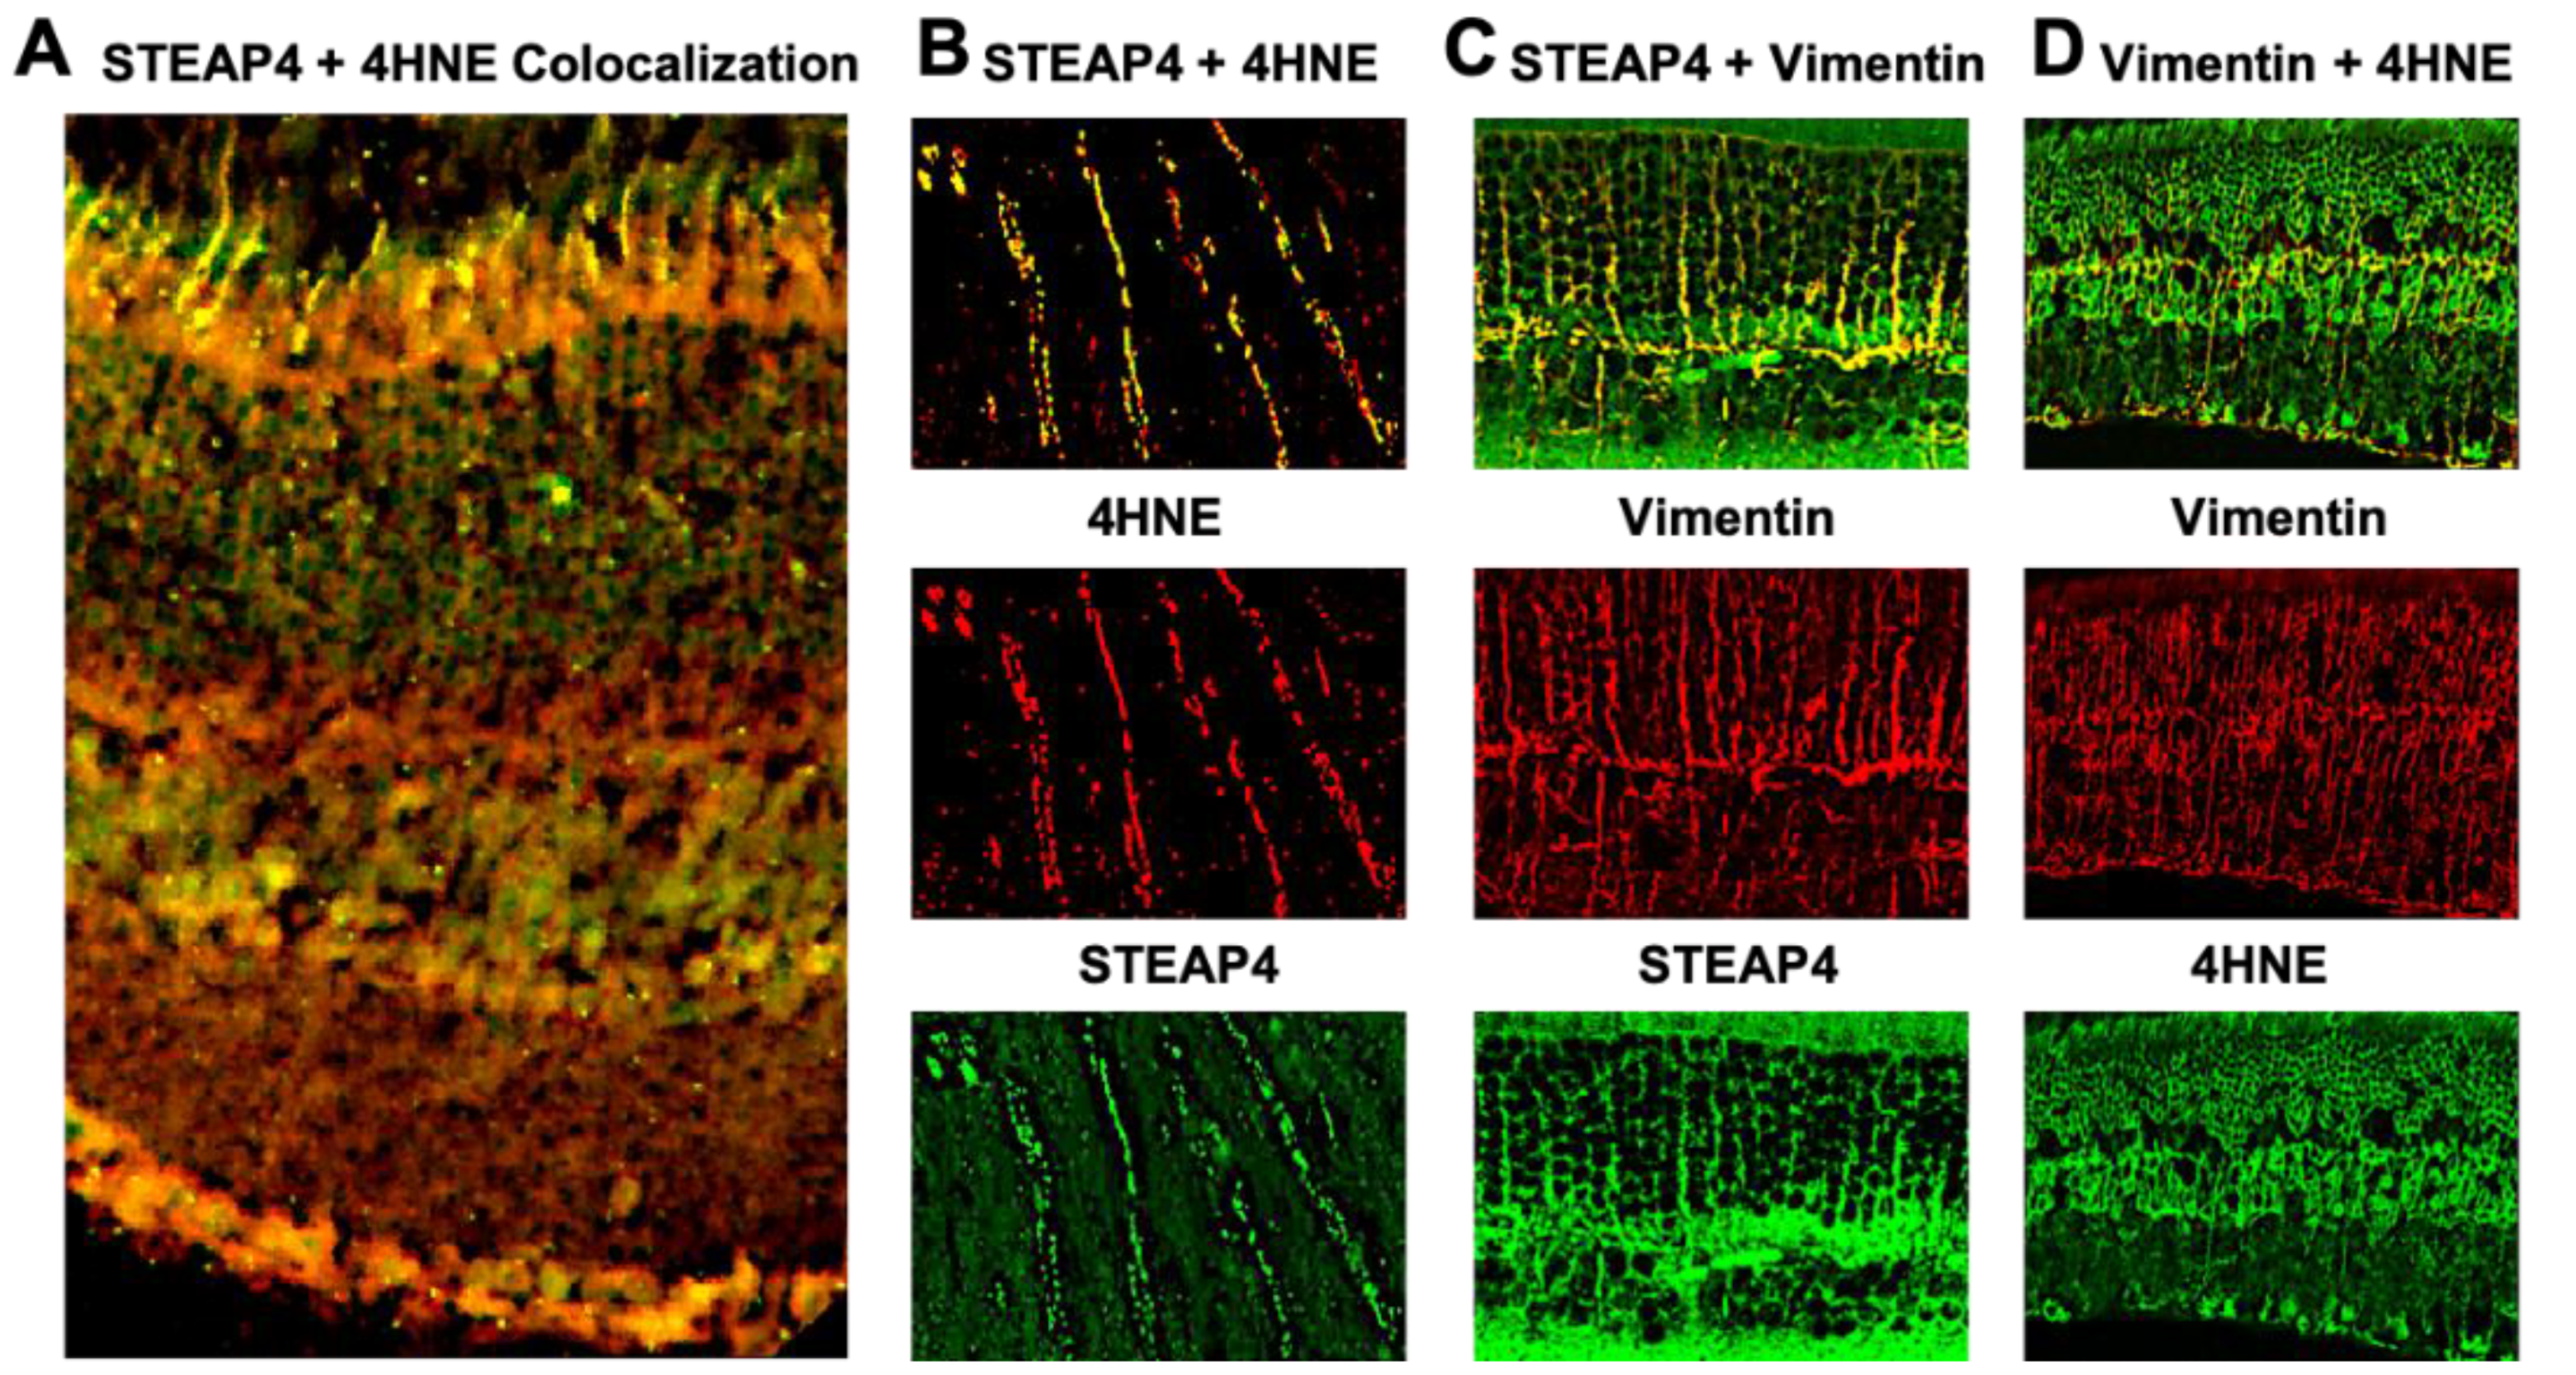
Figure 5.
ROS production in anti-STEAP4 treated photoreceptors and Müller glia. Müller glia (A) (n=6) and (B) 661W photoreceptor-like cone cells (n=6) were incubated in euglycemic conditioned media containing 5mM of glucose (white), or hyperglycemic conditioned media containing 25mM of glucose without (grey) or with: 1 μg (blue), 2 μg (red), or 5 μg (black) of anti-STEAP4 for 18h. Human Müller glia (A) and mouse 661W cells (B) were collected and incubated with H2CFDA (ROS indicator) for flow cytometry quantification of ROS. * =p < 0.01, which was equated by 2-way ANOVA and Tukey’s post-hoc unpaired student t-test. .
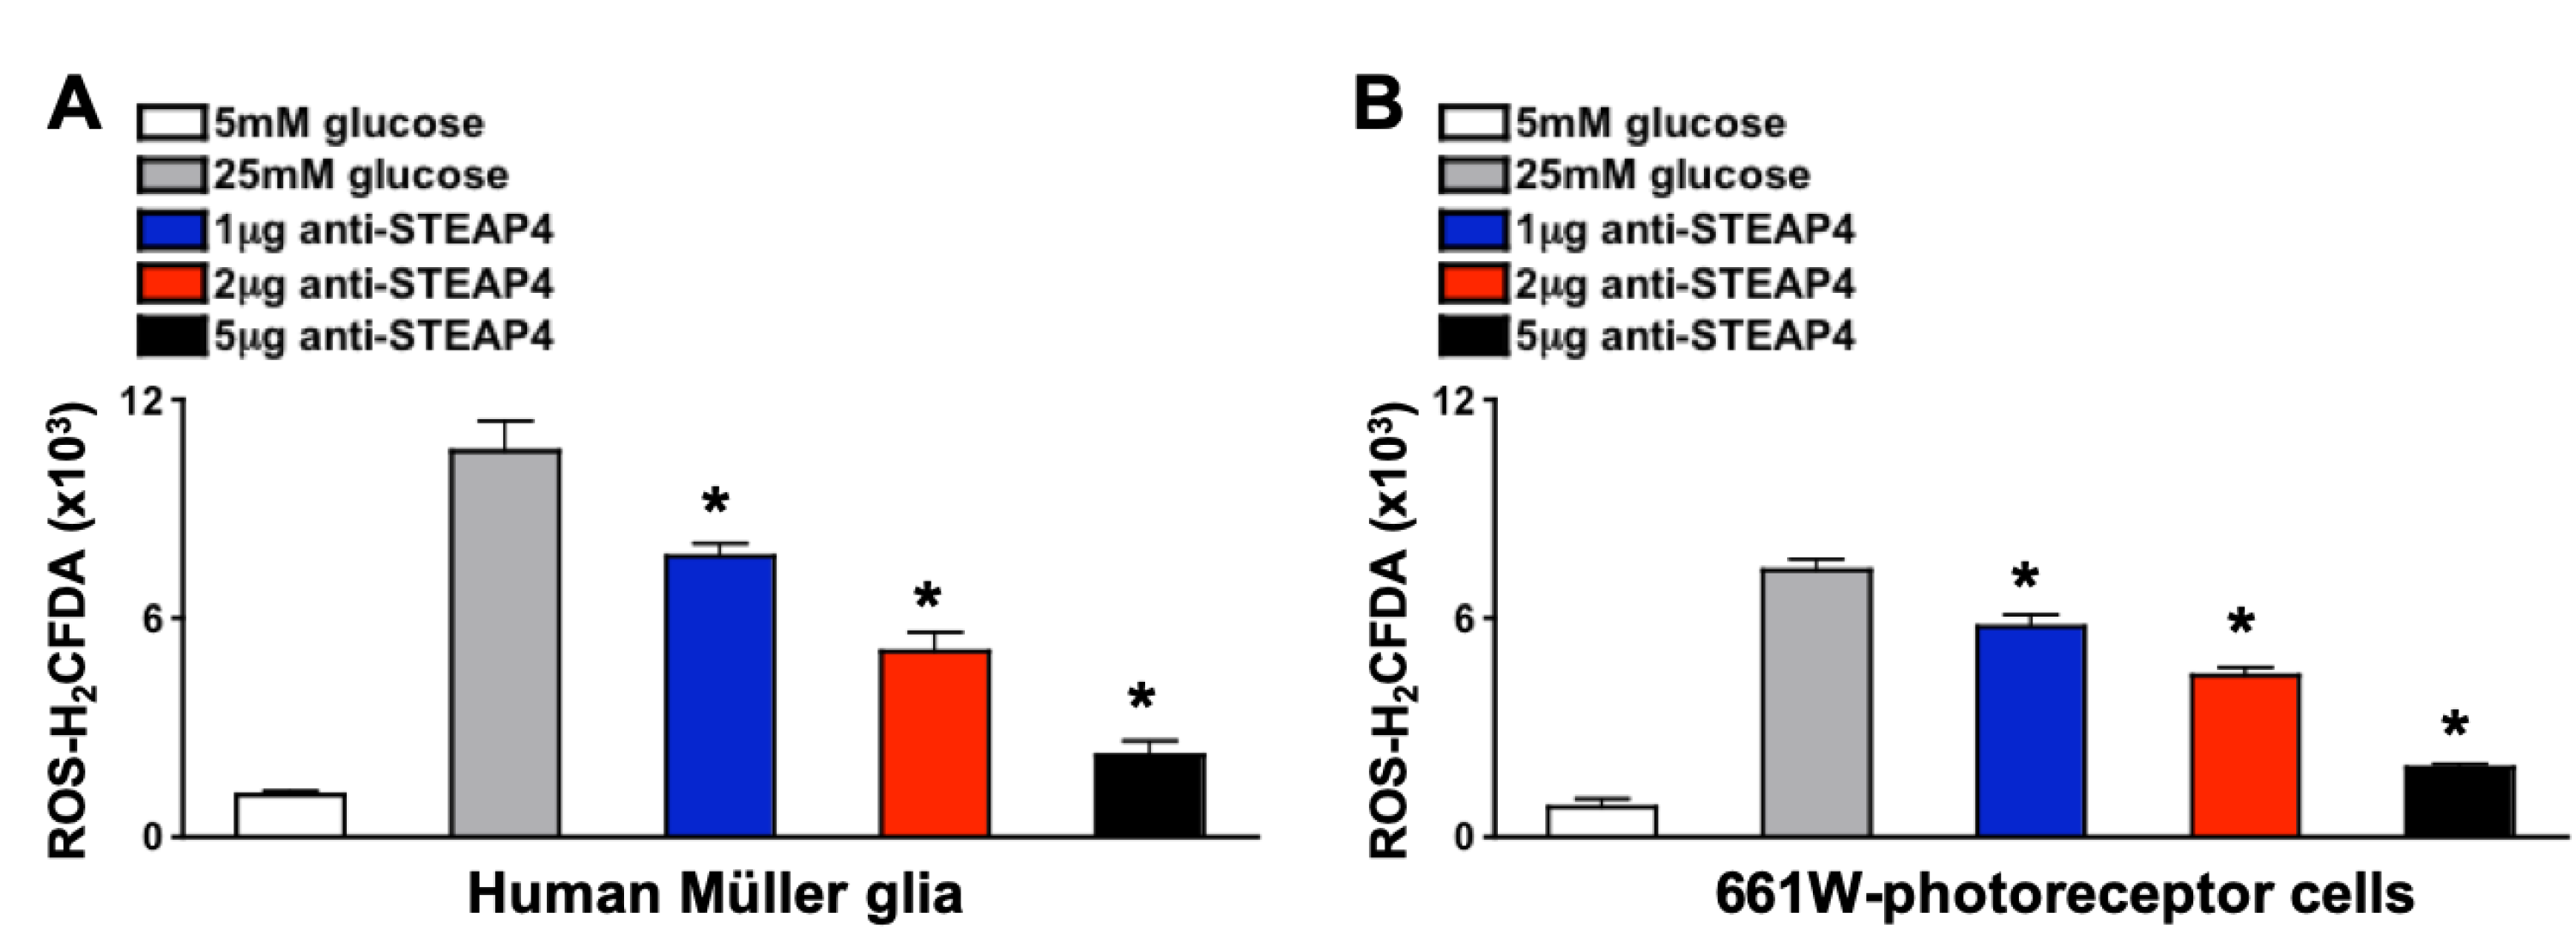
Figure 6.
ROS in anti-STEAP4 treated murine retinas. Non-diabetic (ND) and diabetic (DB) mice remained untreated or received one intravitreal injection of 5 μg of anti-STEAP4+KLH; 1-week after diabetes was confirmed. Isolated retina cells were incubated with H2CFDA for flow cytometry analysis of ROS in retinas of untreated non-diabetic (grey), anti-STEAP4 treated non-diabetic (grey striped), untreated diabetic (red), KLH treated diabetic controls (black and red checkered), and anti-STEAP4 treated diabetic (red striped) C57BL/6 mice (n=5/group); 2-months post-diabetes. p-values were equated using 2-way ANOVA and Tukey’s post-hoc unpaired student t-tests.
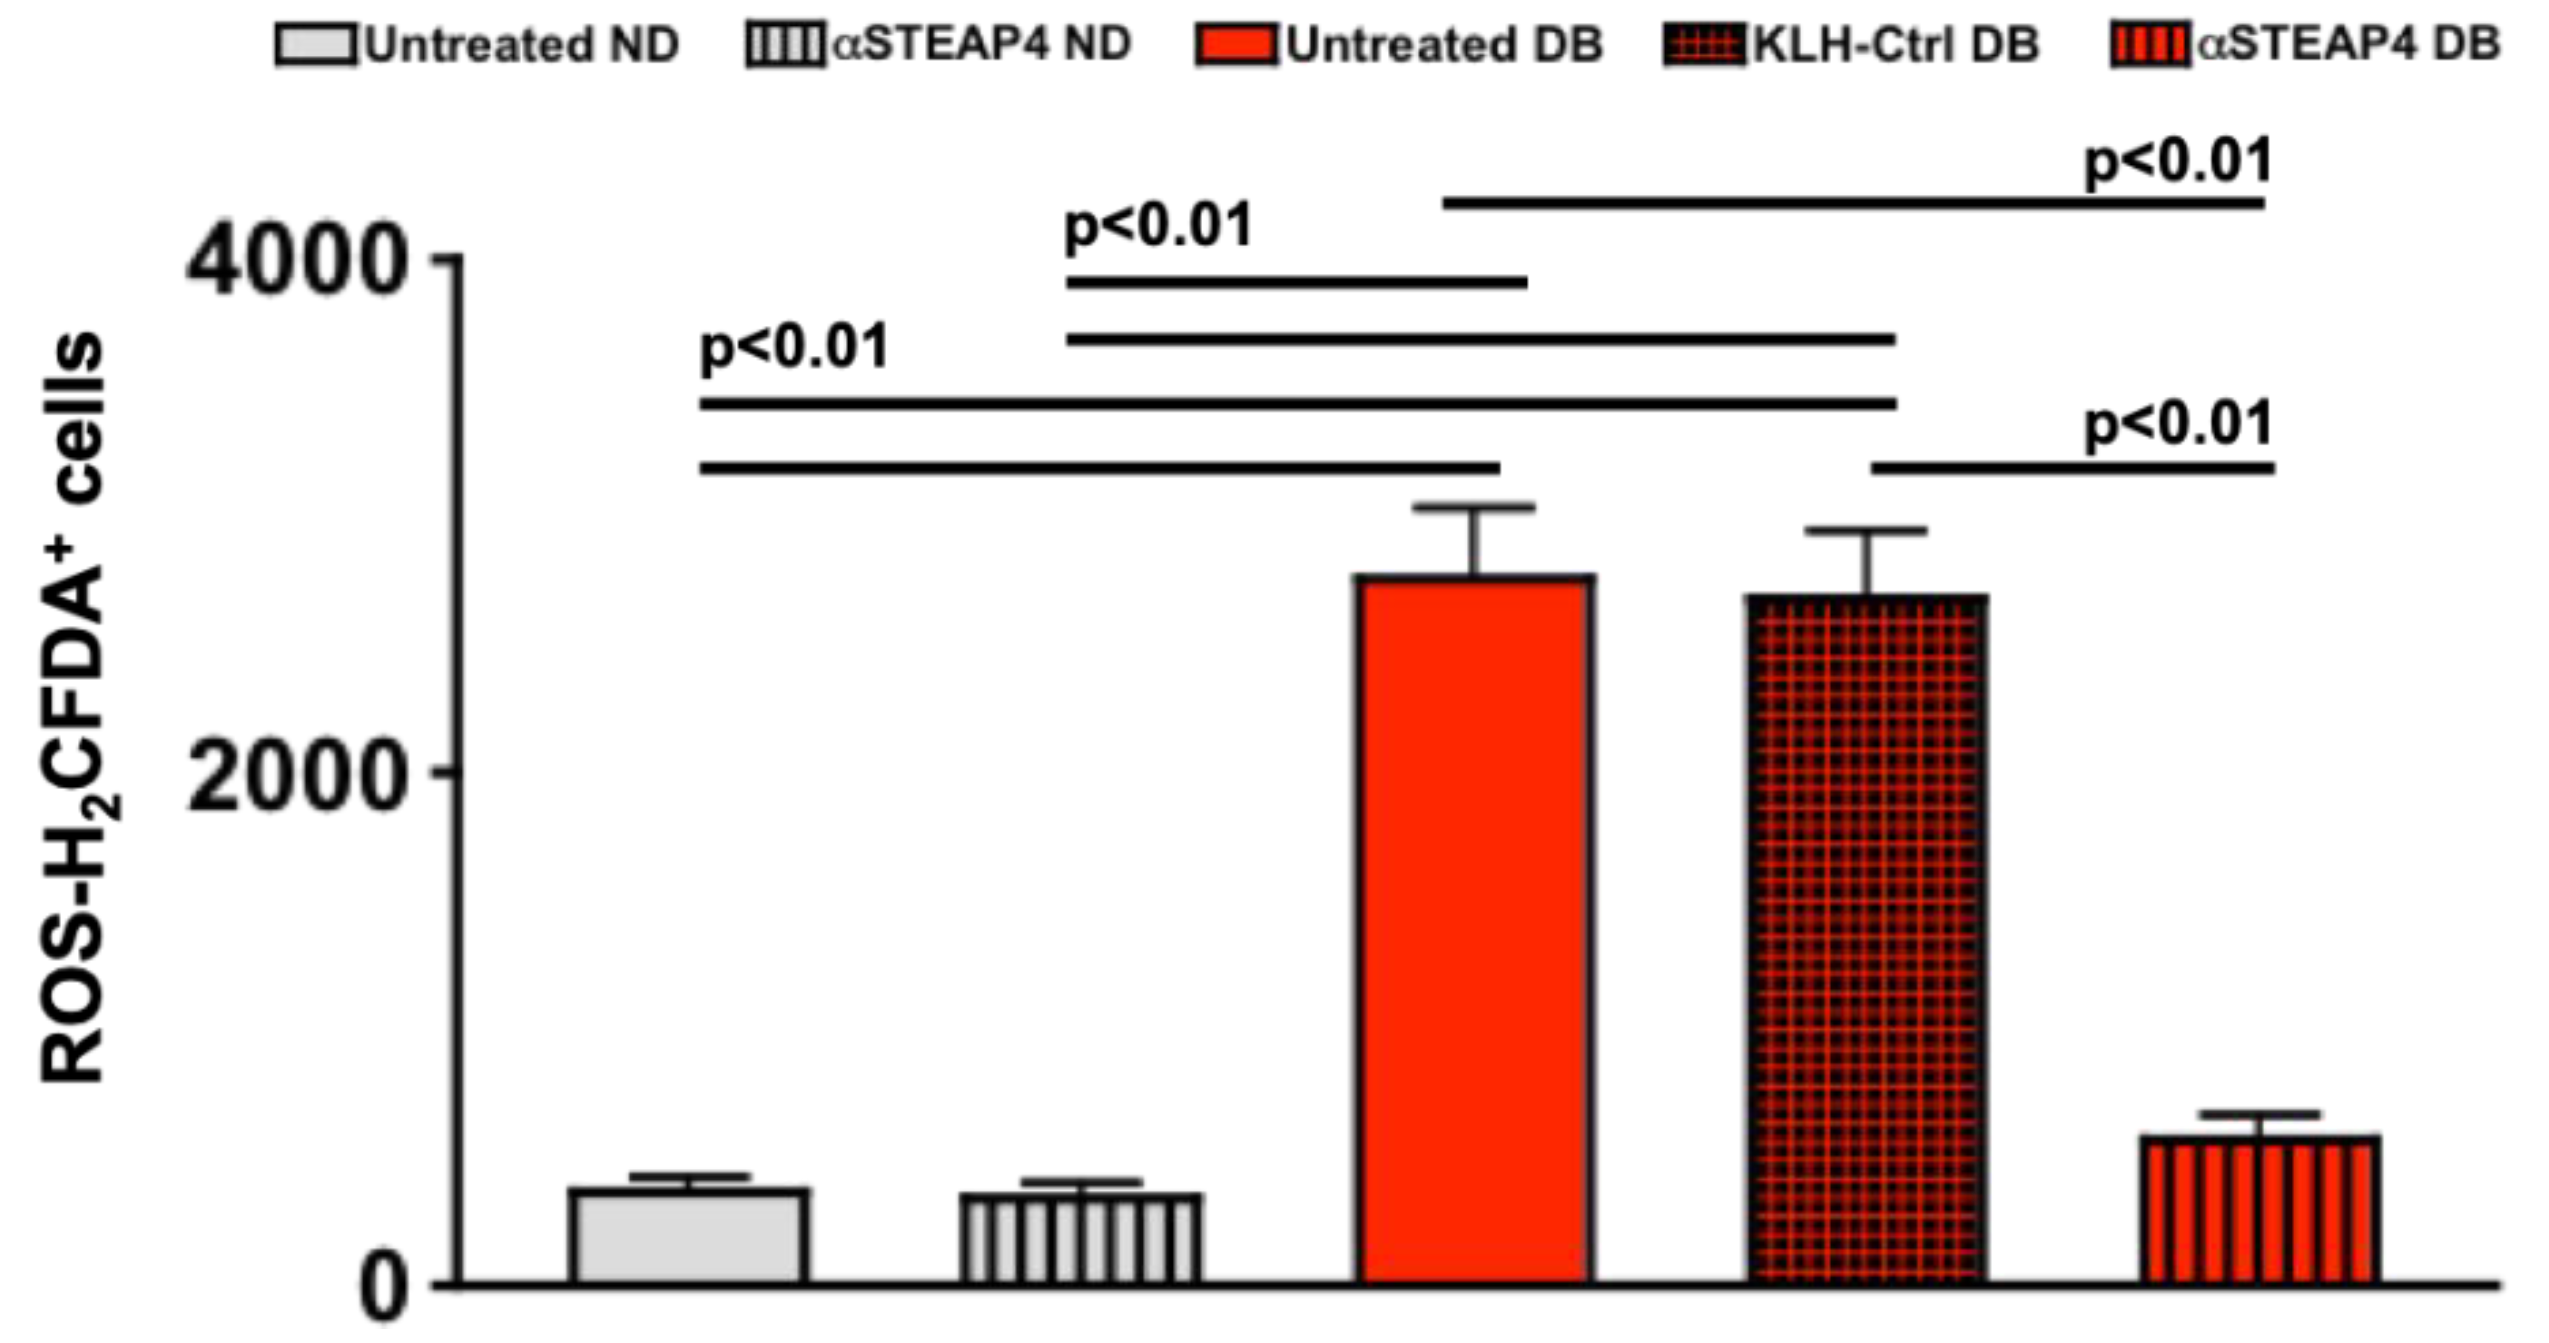
Figure 7.
Levels of Occludin in protein lysates from murine retinal vasculature. Representative WES gel (A) and electropherogram (B) of Occludin (65 kDa) in protein lysates of retinal vasculature of untreated (DB CTRL: blue) and anti-STEAP4 treated (αSTEAP: red) diabetic mice. C) Occludin quantifications in all protein lysate samples (n=5/group) analyzed from retinas of untreated (blue) and anti-STEAP4 treated (red) diabetic mice; 2-months post-diabetes. * = p < 0.01 per 2-way ANOVA and Tukey’s post-hoc unpaired student t-test analyses. .
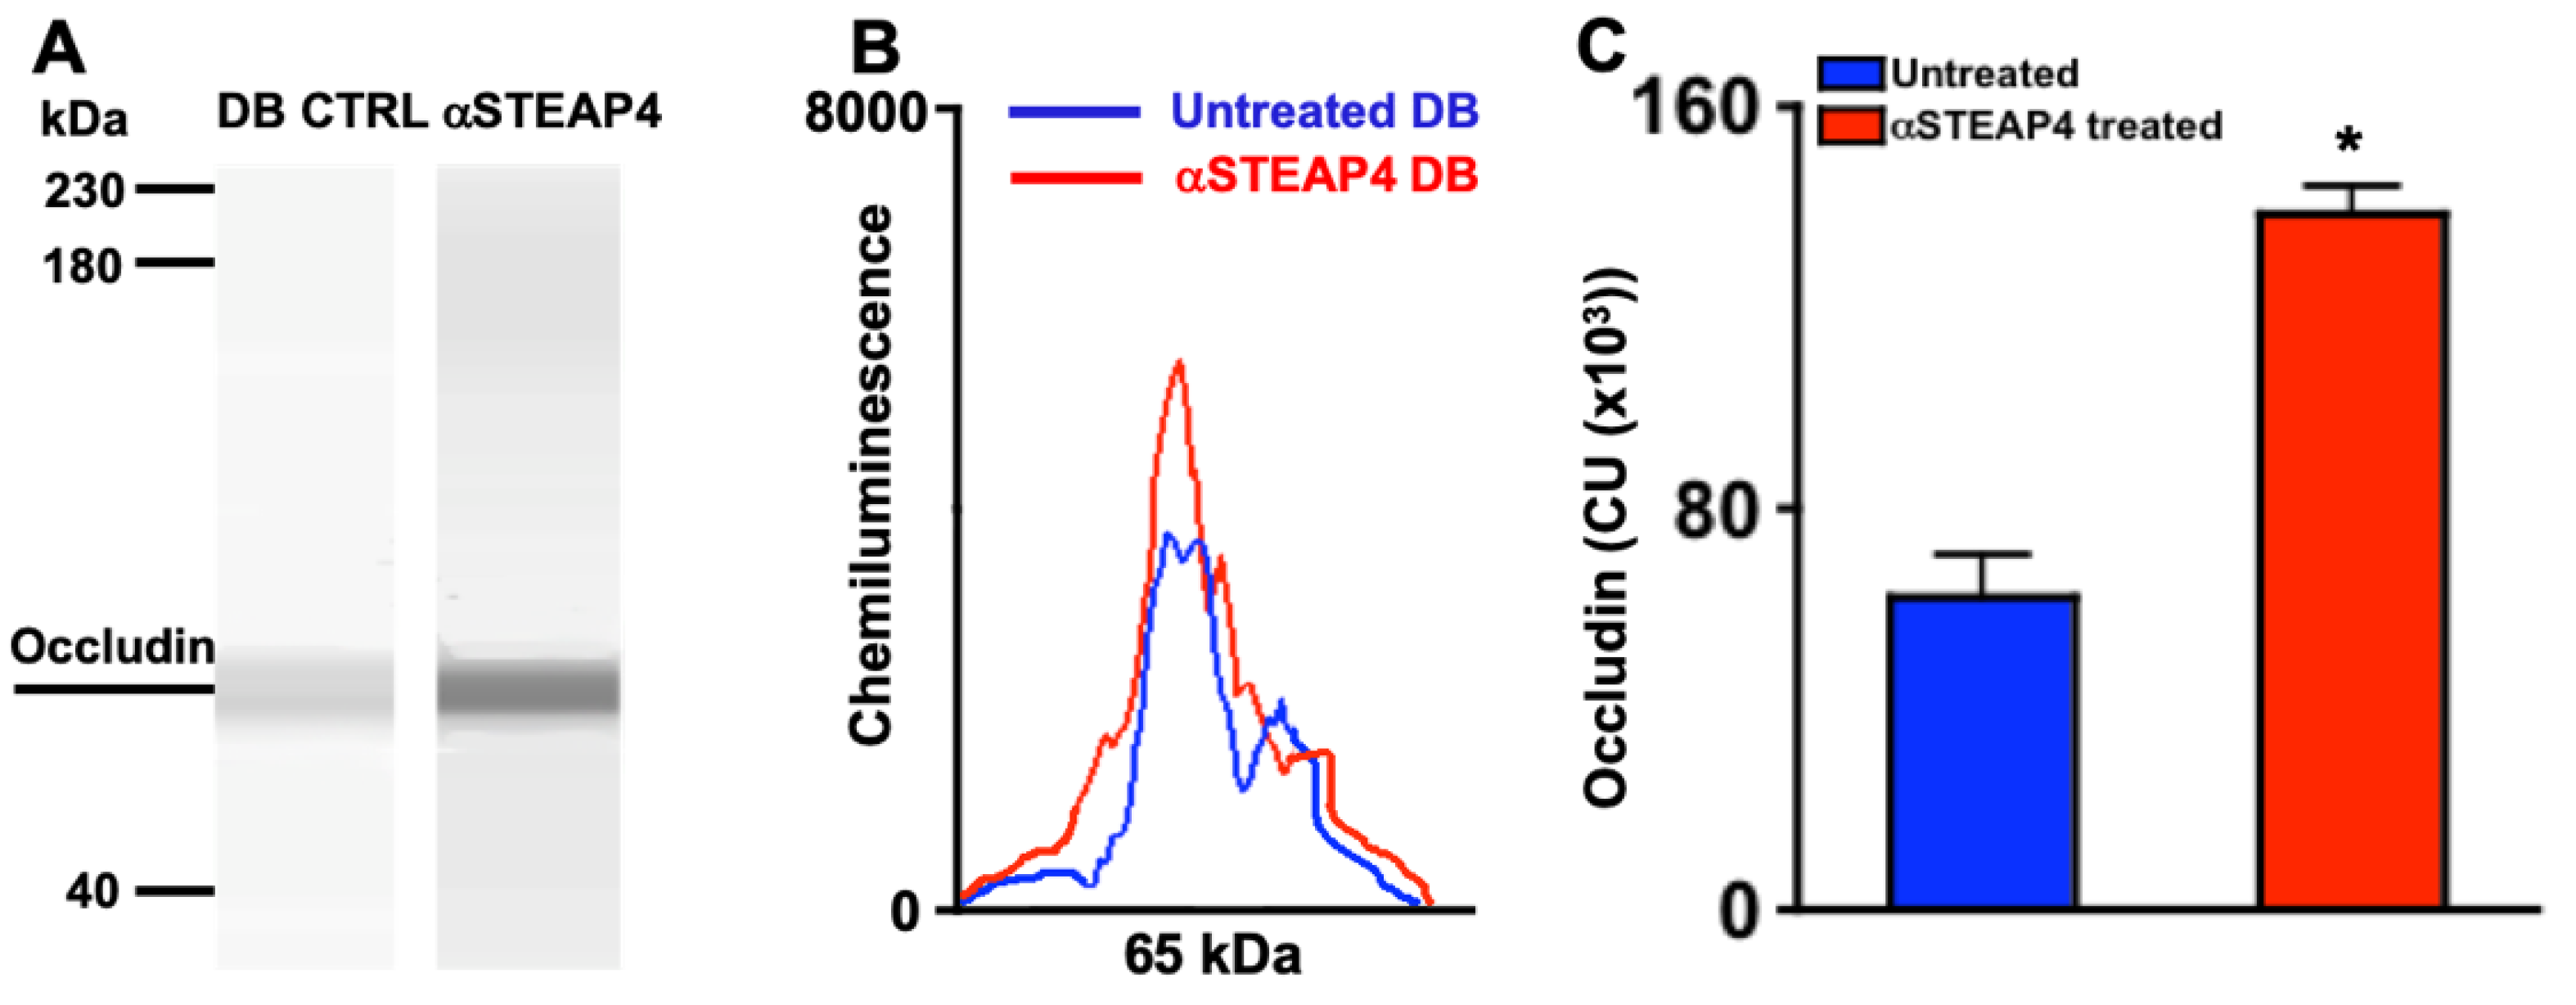
Figure 8.
Human retina endothelial cell death in cells cultured with patient sera. Untreated (black) or anti-STEAP4 treated (red) hREC (1 x 10⁶) were cultured with sera of non-diabetics (ND) or sera of patients with NPDR and diabetic macular edema (DME) for 18h. Cells were collected and incubated with 7-AAD for flow cytometry analysis of hREC cell death (n=15/group). p-value was calculated using 2-way ANOVA analysis and Tukey’s post-hoc unpaired student t-tests. .
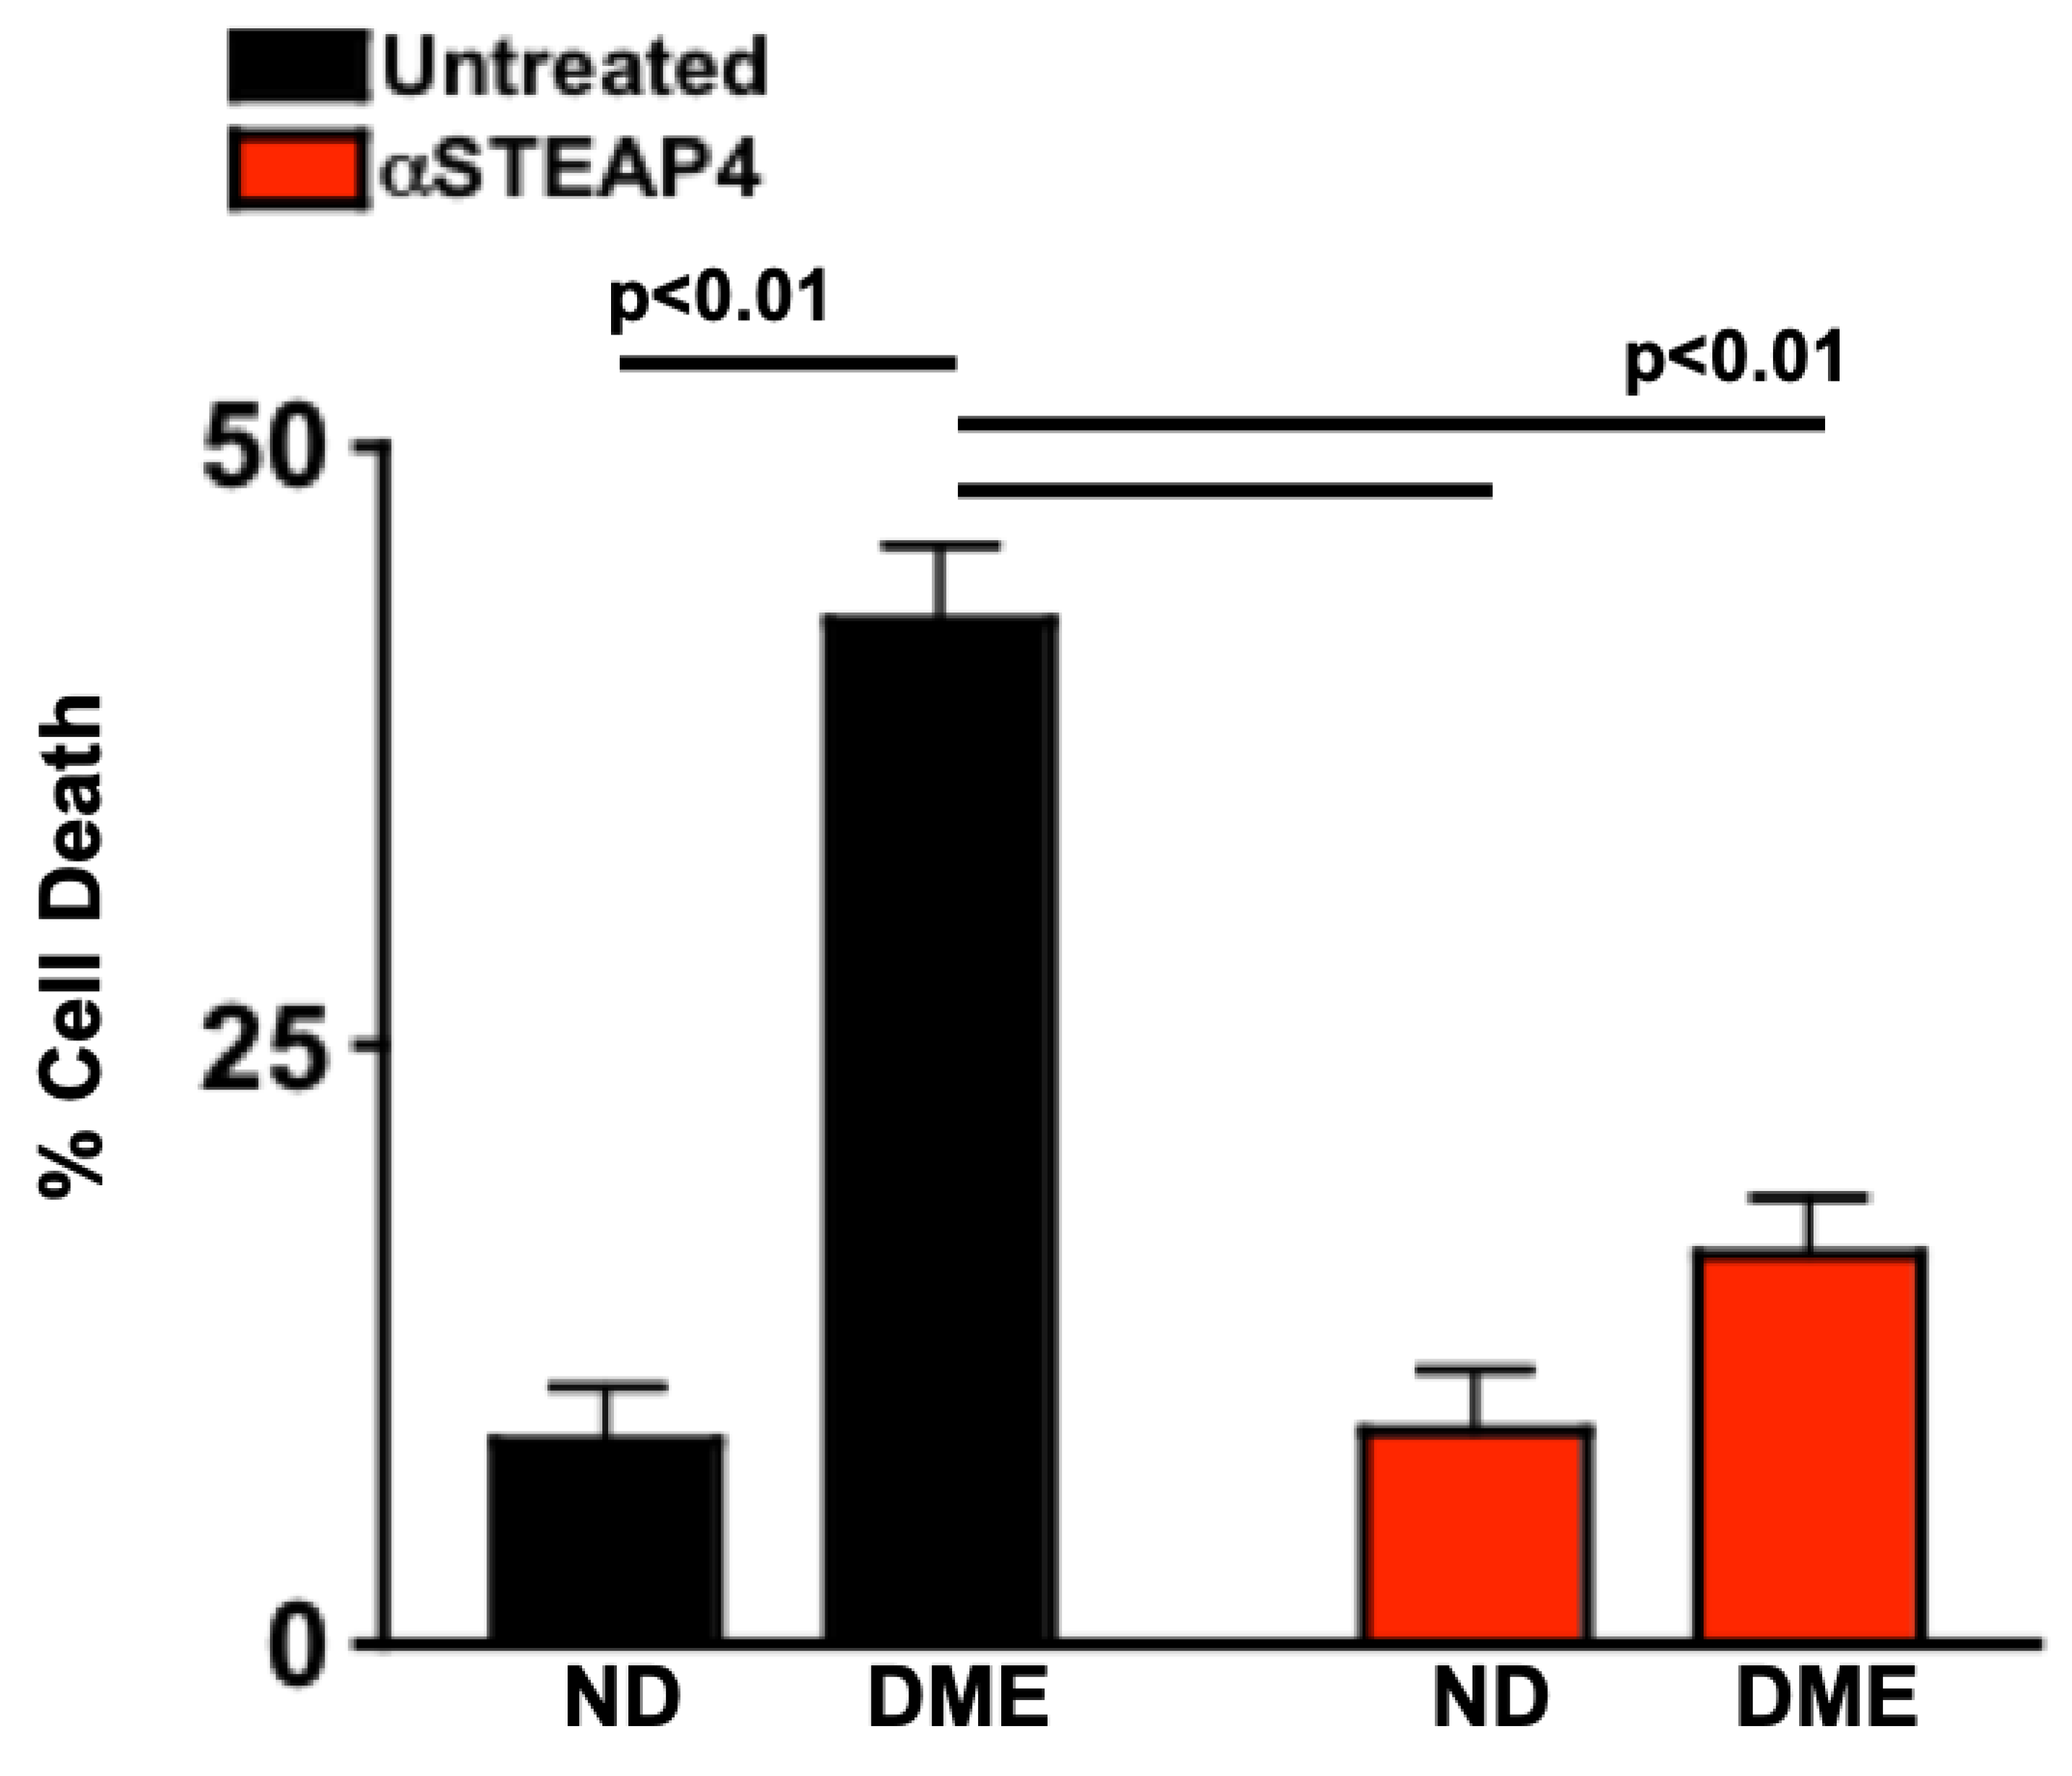

Table 1.
Clinical Data of Non-Diabetic and Diabetic Patient Donors.
| Group | HbA1C (%) | Cholesterol (mg/dL) | NFBG (mg/dL) |
|---|---|---|---|
| Non-Diabetic | 5.53 + 0.12 | 135.08 + 22.61 | 90.27 + 13.54 |
| Diabetic without Retinopathy | 7.78 + 0.85 * | 136.53 + 23.83 | 203.33 + 23.83 * |
| NPDR | 7.59 + 1.49 * | 130.07 + 21.72 | 201.27 + 24.13 * |
| NPDR+DME | 9.39 + 1.89 * | 135.21 + 20.21 | 224.07 + 22.79 * |
* p = < 0.01 per 2-way ANOVA and post-hoc unpaired student t-test analysis. Data are mean + SD.
Table 2.
Clinical data of non-diabetic and STZ-diabetic mice receiving anti-STEAP4 treatment.
| Group | HbA1C (%) | Body Weight (g) |
|---|---|---|
| Untreated Non-Diabetic | 3.91 + 0.26 | 35.22 + 4.18 |
| Untreated Diabetic | 10.51 + 2.02 * | 27.56 + 2.13 * |
| αSTEAP4-Treated Non-Diabetic | 3.82 + 0.25 | 36.01 + 4.42 |
| αSTEAP4-Treated Diabetic | 11.05 + 1.55 * | 26.51 + 1.01 * |
| KLH-Treated Non-Diabetic | 3.89 + 0.29 | 35.98 + 4.07 |
| KLH-Treated Diabetic | 10.85 + 1.11 * | 27.09 + 2.17 * |
* p = < 0.01 of diabetic compared to non-diabetic per treatment group. Data are mean + SD.
Disclaimer/Publisher’s Note: The statements, opinions and data contained in all publications are solely those of the individual author(s) and contributor(s) and not of MDPI and/or the editor(s). MDPI and/or the editor(s) disclaim responsibility for any injury to people or property resulting from any ideas, methods, instructions or products referred to in the content. |
© 2024 by the authors. Licensee MDPI, Basel, Switzerland. This article is an open access article distributed under the terms and conditions of the Creative Commons Attribution (CC BY) license (http://creativecommons.org/licenses/by/4.0/).
Copyright: This open access article is published under a Creative Commons CC BY 4.0 license, which permit the free download, distribution, and reuse, provided that the author and preprint are cited in any reuse.


