
Submitted:
19 December 2024
Posted:
20 December 2024
You are already at the latest version
Abstract
This research examines the impact of Social Media Marketing on preserving local wisdom on Lombok Island. By employing quantitative methods and multiple linear regression, the study evaluated five independent variables: social media marketing content (X1), user interaction on social media (X2), paid advertising on social media (X3), entertainment and trends on social media (X4), and Electronic Word-of-Mouth (e-WOM) (X5), on the preservation of local traditions and culture (Y). Data from 108 randomly selected participants revealed that user interaction on social media (X2) exerted the most significant influence on the preservation of local traditions and culture, with a coefficient of 0.532 and a t-value of 5.108, significant at p < 0.001. The other variables—content marketing, paid advertising, entertainment, and e-WOM—did not exhibit significant effects. These results indicate that marketing strategies emphasizing active user engagement on social media are more effective in promoting the preservation of local wisdom. Consequently, it is advised that programs aimed at preserving local traditions and culture should prioritize enhancing user interaction on social media, complemented by a holistic approach integrating diverse marketing and community engagement techniques.
Keywords:
social media
; cultural preservation
; user interaction
; digital marketing
; e-WOM
1. Introduction
Social media marketing employs social media platforms to promote products, services, or brands to a broader audience [1]. Its primary goals include building brand awareness, enhancing customer interaction, and boosting sales [2]. This practice involves crafting engaging and shareable content, directly interacting with users, and analyzing data to gauge campaign effectiveness [3]. Frequently utilized platforms for this strategy include Facebook, Instagram, Twitter, LinkedIn, and TikTok [4]. Moreover, social media marketing enables companies to more effectively target specific demographics through paid advertising [5]. Therefore, social media marketing has become a crucial component of the contemporary digital marketing ecosystem.
Local wisdom is knowledge, values, and practices that grow within a community and are passed down from generation to generation [6,7]. It reflects the distinctive way of life, traditions and culture of a region, often linked to the natural and social environment [8]. These values include habits, beliefs, customs and knowledge systems that help communities face challenges and maintain balance with nature [9]. Examples include traditional agricultural practices, customary rituals and sustainable natural resource management methods [10]. Local wisdom is an important basis for sustainable development and cultural preservation, as it contains solutions that have been proven effective [11]. Therefore, understanding and appreciating local wisdom is an important step in maintaining the identity and sustainability of a community.
Haudi et al. [12] demonstrate that social media marketing activities significantly impact brand awareness, brand image, and brand loyalty. Similarly, Samarah et al. [13] found that the positive and significant effect on brand trust reaches 61.5%. According to Kalinová & Kovaříková [14], social networks are predominantly used by women, particularly within the 18-24 age group. Mude & Undale [15] discovered that Gen Z utilizes social media more frequently than Gen Y for information searches. Zhu [16] noted that interactive word-of-mouth marketing can significantly contribute to brand development.
Ngo & Nguyen [17] highlight the crucial role of education in preserving and promoting the traditional cultural identity values of local ethnic minorities in the Central Highlands. Similarly, Adyatma et al. [18] emphasized the positive and significant relationship between community empowerment, local wisdom, and sustainable tourism development. Bris et al. [19] found that local wisdom values can be integrated into all aspects of life. Nizamova [20] underscores the importance of preserving cultural diversity in the Chechen Republic as a priority for the country's cultural policy, emphasizing the role of cultural values in education, science, and community cooperation.
Social media marketing has a positive influence on brand loyalty, brand awareness, and value awareness, with brand awareness acting as a mediator in enhancing brand loyalty [21,22]. Additionally, aspects of social media marketing such as entertainment and trends have been shown to positively impact brand awareness, subsequently increasing customer loyalty [23]. Research on iPhone users highlighted the significant effects of social media marketing, social interactivity, and perceived quality on brand loyalty, underscoring the importance of effective social media strategies and high product quality in boosting user loyalty [24]. Studies on herbal products demonstrated that social media marketing, e-WOM, brand awareness, and brand image positively and significantly affect brand loyalty, highlighting the importance of these factors in cultivating customer loyalty [25].
Local wisdom, rooted in cultural practices and environmental preservation, contributes greatly to the sustainability of tourism development through preserving cultural heritage, ensuring community safety, and attracting tourists through unique experiences [26]. Community empowerment positively influences sustainable tourism development, with local wisdom acting as a mediator that strengthens this relationship [27]. However, challenges exist in achieving collaborative governance for local wisdom-based sustainable tourism villages, with gaps in institutional agreements and stakeholder commitment identified [28].
Existing research indicates that social media marketing and local wisdom are two significant concepts in their respective domains. Studies by Simona Vinerean [29], Li et al. [30], and Jacobson et al. [31] emphasize the importance of social media marketing in building brand awareness, enhancing customer interaction, and driving sales. On the other hand, research by Suardana et al. [32] highlights the role of local wisdom in maintaining community harmony with nature and in cultural preservation. Although these concepts focus on different areas, both acknowledge the importance of interaction and knowledge in optimizing their respective outcomes.
The existing research gap lies in the lack of studies connecting social media marketing with the preservation of local wisdom. Previous research typically separates these two concepts, failing to explore their potential integration. A novel research proposal titled "The Influence of Social Media Marketing on Local Wisdom" could address this gap by examining how social media marketing strategies can be utilized to promote, preserve, and develop local wisdom. This research aims to introduce a new approach in digital marketing that goes beyond commercial gain, contributing to the preservation of local culture and traditions, thereby creating a more holistic and sustainable value for the community.
2. Methods
This quantitative study aims to investigate the impact of Social Media Marketing on Local Wisdom. It involved 108 participants, comprising 40 men and 68 women. Respondents were selected using a random sampling technique to ensure adequate representation of the target population related to the tourism industry. The research tool employed was a questionnaire containing 37 questions divided into six variables: variable X1 (Social Media Marketing Content) with 7 questions, variable X2 (User Interaction on Social Media) with 7 questions, variable X3 (Paid Advertising on Social Media) with 7 questions, variable X4 (Entertainment and Trends on Social Media) with 5 questions, variable X5 (Electronic Word-of-Mouth) with 6 questions, and variable Y (Preservation of Local Tradition and Culture) related to sustainable tourism with 5 questions. This questionnaire was designed to evaluate respondents' perceptions and reactions to the variables under investigation. Detailed information on the indicators for each variable is presented in Table 1.
The research procedure consists of several stages as shown in Figure 1.
Figure 1 outlines the research process. Data collection commenced after the research instruments were tested and validated. Respondents completed the questionnaires either online or in person, based on their availability and conditions. The data collection was supervised to ensure a high response rate and minimize potential bias. The collected data was analyzed using descriptive statistical techniques to provide an overview of the distribution of respondents' answers. To test the hypothesis regarding the influence of social media marketing on local wisdom, multiple linear regression analysis was performed. This analysis determined the extent of the influence of each independent variable on the dependent variable. Additionally, an in-depth analysis of the indicators for each variable was conducted to gain a detailed understanding of the influential factors. Following the data analysis, the results were interpreted to draw conclusions and provide recommendations about the influence of social media marketing on local wisdom. This interpretation considered the context of the tourism industry under study and relevant literature.
3. Results
During the data collection process, questionnaires were distributed to predetermined respondents. The collected data was then analyzed to identify any outliers, a crucial step to ensure the accuracy of the subsequent analysis. This validation process filters the data, ensuring its reliability for further analysis. Information regarding the results of this data validation is presented in Figure 2.
Figure 2 illustrates the distribution of respondents by gender and employment/education status in line form. Based on gender, there are significantly more female respondents (68) compared to male respondents (40). This disparity suggests that women are more engaged or interested in the survey topic. The notable gap may indicate varying levels of participation or interest between men and women regarding the issue under study.
Table 2 presents the descriptive statistics for the six variables: X1, X2, X3, X4, X5, and Y. The mean values for these variables range from 73.73 to 85.29, with variable Y having the highest mean of 85.29. The standard deviation, indicating the spread of data from the mean, ranges from 12.46 for variable X2 to 17.04 for variable X3, showing that variable X3 has the highest variability among all variables. The variance, which is the square of the standard deviation, confirms this observation, with variable X3 having the highest variance at 290.42 and variable X2 having the lowest variance at 155.40.
In addition, this table also provides the minimum and maximum values for each variable. All variables have the same maximum value of 100.00, indicating that each variable reaches the highest possible value on this scale. However, the minimum values vary from 22.86 for variable X3 to 42.86 for variable X1. This difference between the minimum and maximum values indicates that there is a wide range of values in the data, especially for variable X3 which has the lowest minimum value. The overall data shows significant variation among the variables, with variable Y having the highest mean but also a high variance, indicating consistent variation in the dataset.
Table 3 displays the model summary of the regression analysis for the dependent variable Preservation of Local Tradition and Culture (Y). Model H₀ shows the base model with no independent variables with an R² value of 0.000, meaning no variation in the Preservation of Local Traditions and Culture is explained by this model. The RMSE (Root Mean Square Error) value for model H₀ is 13.56, indicating the large average prediction error by this base model.
In contrast, the H₁ model, which includes the independent variables, has an R value of 0.83, indicating a strong correlation between the independent and dependent variables. The R² value of 0.69 suggests that 69.2% of the variation in the Preservation of Local Tradition and Culture can be explained by this model, with an adjusted R² of 0.67, accounting for the number of independent variables. The RMSE value for model H₁ is 7.70, indicating that this model has a smaller prediction error compared to model H₀. The R² change of 0.69 signifies a significant increase in the model's predictive ability when the independent variables are included. The F Change value of 45.84 with p < 0.001 demonstrates that model H₁ is significantly better at explaining the variation in the Preservation of Local Tradition and Culture than model H₀.
Table 4 presents the ANOVA (Analysis of Variance) results for the regression model assessing the impact of the five independent variables on the dependent variable, Preservation of Local Traditions and Culture. The regression sum of squares is 13,615,788 with 5 degrees of freedom (df), resulting in a mean square of 2,723,158. The F value is 45,845 with a p value of <0.001, indicating that this regression model significantly explains the variation in Preservation of Local Traditions and Culture compared to a model without independent variables. Additionally, the residual sum of squares is 6,058,731 with 102 degrees of freedom (df), leading to a mean square of 59,399. The total sum of squares, which combines the regression and residual sum of squares, is 19,674,519 with 107 degrees of freedom (df). This total sum of squares indicates that the majority of the variation in Preservation of Local Traditions and Culture is explained by the regression model, given the substantial contribution of the regression sum of squares compared to the residual sum of squares. These results confirm that the regression model incorporating the independent variables is significantly more effective at explaining the variation in the dependent variable than the base model without independent variables.
Table 5 presents the results of the regression coefficient analysis for two models: the base model (H₀) Y = 85.296 and the model with independent variables (H₁), which examines the impact of five independent variables on the dependent variable, Preservation of Local Traditions and Culture. In the base model (H₀), the intercept value is 85.296 with a standard error of 1.305 and a t value of 65.371 with p < .001, indicating that the average Preservation of Local Traditions and Culture is 85.296 when all independent variables are excluded from the model.
In the model with independent variables (H₁) Y = 13.239 + 0.132X1 + 0.532X2 + 0.071X3 + 0.161X4 + 0.009X5, the intercept value decreases to 13.239 with a standard error of 4.968 and a t-value of 2.665 (p = 0.009), showing lower significance compared to the base model. Among the independent variables, User Interaction on social media (X2) has the most significant impact on the Preservation of Local Tradition and Culture, with a coefficient of 0.532, a standard error of 0.104, a t-value of 5.108, and p < .001. Other variables, including Social Media Marketing Content (X1), Paid Advertising on social media (X3), Entertainment and Trends on social media (X4), and e-WOM (X5), did not demonstrate significant influence, with p values of 0.152, 0.377, 0.083, and 0.924, respectively. These results indicate that while some independent variables are not significant, User Interaction on social media is crucial for the preservation of local traditions and culture.
3.1. Response by Indicator Level of Influence of Social Media Marketing Content on Local Wisdom Preservation
Figure 3 illustrates the influence of social media marketing content on local wisdom preservation in seven different categories, identified by labels 1 to 7. The highest mean value is found in category 4 with a score of 85.37, indicating that social media marketing content in this category is most effective in supporting local wisdom preservation. Categories 2 and 1 also showed positive results with mean scores of 82.04 and 80.93 respectively, indicating that marketing content in these categories is also moderately successful in encouraging local wisdom preservation.
In contrast, category 7 had the lowest mean score of 70.56, followed by categories 3 and 6 with mean scores of 75.19 and 74.44, respectively. Category 5 recorded a mean score of 78.15, positioning it midway between the highest and lowest scoring categories. These differences suggest variations in the effectiveness of social media marketing content on local wisdom preservation, potentially influenced by factors such as content type, delivery method, and user interaction levels. Further analysis is necessary to understand the factors affecting the success of each category, thereby enabling the development of more effective marketing strategies to optimally support local wisdom preservation.
3.2. The Level of Influence of User Interaction in Social Media on the Preservation of Local Wisdom
Figure 4 shows the effect of user interactions on social media on the preservation of local wisdom in seven different categories, labeled from 1 to 7. From the figure, it can be seen that category 6 has the highest mean value of 87.59, followed by categories 7 and 5 which each have a mean value of 86.67. This indicates that user interactions on social media in these categories are highly effective in supporting the preservation of local wisdom. Categories 4 and 3 also showed fairly high mean scores of 83.52 and 81.11, indicating significant but slightly lower effectiveness compared to categories 5, 6 and 7.
In contrast, category 1 has the lowest mean score of 64.26, indicating that user interactions on social media in this category are less effective in supporting the preservation of local wisdom. Category 2 has a mean score of 77.41, which is higher than category 1 but still lower than the other categories. This variation suggests significant differences in the effectiveness of users' interactions on social media towards local wisdom preservation. These differences may be influenced by factors such as the intensity of interactions, the type of content shared, and the manner in which users participate in discussions and activities on social media. Further analysis is required to understand the factors that influence the success of user interactions in each category, enabling the development of more effective strategies to optimally support the preservation of local wisdom.
3.3. The Level of Influence of Paid Advertising on Social Media on the Preservation of Local Wisdom
Figure 5 illustrates the effect of paid social media advertising on local wisdom preservation across seven different categories, labeled from 1 to 7. Category 6 has the highest mean score of 78.89, followed by categories 7 and 2 with mean scores of 77.96 and 77.41, respectively. This suggests that paid advertising on social media in these categories is more effective in supporting the preservation of local wisdom compared to the other categories. These relatively high scores indicate that paid advertising can enhance awareness and participation in local wisdom preservation.
In contrast, category 1 has the lowest mean score of 61.11, indicating that paid advertising on social media in this category is less effective in supporting the preservation of local wisdom. Categories 5 and 3 also have lower mean scores than the other categories, at 71.85 and 73.89, respectively. Category 4 exhibited a mean score of 75.00, placing it in the middle of the effectiveness spectrum. These differences in mean scores suggest variations in the effectiveness of paid advertising on social media towards local wisdom preservation, potentially influenced by factors such as the target audience, type of ad content, and marketing strategy used. Further analysis is necessary to understand the factors that contribute to the success of paid advertising in each category, allowing for the development of more effective advertising strategies to support the preservation of local wisdom.
3.4. Level of Influence of Entertainment and Trends in Social Media on the Preservation of Local Wisdom
Figure 6 illustrates the effect of entertainment and trends on social media on the preservation of local wisdom in five different categories, labeled from 1 to 5. Category 1 has the highest mean score of 81.85, followed by category 2 with a mean score of 81.30. This shows that entertainment and trends on social media in this category are most effective in supporting the preservation of local wisdom. Category 3 also showed good effectiveness with an average score of 80.19, although it was slightly lower than categories 1 and 2.
In contrast, categories 4 and 5 had lower mean scores of 75.74 and 75.93 respectively. This suggests that entertainment and trends on social media in this category are less effective in supporting the preservation of local wisdom compared to the other three categories. This difference in mean scores could be due to variations in the type of entertainment and trending content presented on social media, as well as the level of user engagement and participation in each category. Further analysis is needed to understand the factors that influence the effectiveness of entertainment and trends on social media in supporting local wisdom preservation, therefore, more effective strategies can be developed to increase awareness and participation in local wisdom preservation through social media.
3.5. Level of Influence of Electronic Word-of-Mouth (e-WOM) on Local Wisdom
Figure 7 illustrates the effect of Electronic Word-of-Mouth (e-WOM) on local wisdom in six different categories, labeled from 1 to 6. Category 6 has the highest mean value of 79.26, indicating that e-WOM in this category is most effective in supporting the preservation of local wisdom. Categories 1 and 5 also show similarly high values of 79.07, indicating that e-WOM in these categories is also highly effective. Category 3 shows fairly good effectiveness with a mean score of 77.41, although it is slightly lower than categories 1, 5, and 6.
In contrast, category 4 has the lowest mean value of 70.74, indicating that e-WOM in this category is less effective in supporting the preservation of local wisdom. Category 2 has a mean score of 74.63, which is higher than category 4 but still lower than the other categories. This difference in mean scores indicates variation in the effectiveness of e-WOM towards local wisdom preservation, which may be due to factors such as the intensity of information dissemination, the quality of content shared, and the level of user engagement in the discussion. Further analysis is needed to understand the factors that influence the success of e-WOM in each category, therefore, more effective strategies can be developed to support the preservation of local wisdom through e-WOM.
3.6. Level of Preservation of Local Traditions and Culture
Figure 8 displays the average scores for preserving local traditions and culture in five different categories labeled from 1 to 5. Category 1 has the highest average score of 88.15, indicating that initiatives or programs in this category are highly effective in supporting the preservation of local traditions and culture. Categories 2 and 5 show almost equal effectiveness with a mean score of 86.85 each, indicating that these two categories also contribute significantly to the preservation of local traditions and culture.
In contrast, category 3 has the lowest mean score of 80.19, indicating that initiatives or programs in this category are less effective than the other categories. Category 4 had a mean score of 84.44, indicating better effectiveness than category 3, but still lower than categories 1, 2, and 5. These differences in mean scores reflect variations in the success of programs or initiatives to preserve local traditions and culture, which may be due to differences in methods, community involvement, and resource support. Further analysis is needed to identify the specific factors that influence the effectiveness of each category, therefore, more effective strategies can be developed to support the preservation of local traditions and culture.
This study demonstrates that the variable of user interaction on social media (X2) has the most significant impact on the preservation of local traditions and culture. The coefficient value for this variable is 0.532 with a significance level of p < 0.001, indicating a strong positive correlation. In comparison, other variables such as social media marketing content (X1), paid advertising on social media (X3), entertainment and trends on social media (X4), and e-WOM (X5) did not show significant influence, with p values of 0.152, 0.377, 0.083, and 0.924, respectively. This suggests that marketing strategies emphasizing active user interaction on social media are more effective in supporting local wisdom preservation compared to other marketing strategies.
The results of this study align with previous findings that social media marketing activities can enhance brand awareness, brand loyalty, and brand image [33]. Kelliher et al., (2018) emphasized the importance of social interaction in building user engagement, which in turn contributes to the preservation of local culture. However, the findings of this study contradict previous research conducted by van der Bend et al., (2022), [36], and [37], which showed that social media marketing strategies are not always effective in all contexts. These studies found that, in some cases, social media interactions do not significantly influence brand loyalty or cultural awareness, and traditional marketing approaches can be more effective. This suggests that traditional methods involving direct interaction may be more suitable for certain contexts than social media marketing strategies.
4. Conclusions
Based on the results of this study, user interaction on social media (X2) exhibits the most significant influence on the preservation of local traditions and culture. With a coefficient of 0.532 and a significance level of p < 0.001, user interaction is demonstrated to increase awareness and participation in preserving local wisdom. This aligns with theories suggesting that active user involvement on social media can strengthen social ties and enhance the transfer of cultural knowledge. However, the results of this study contradict previous research indicating that social media marketing strategies are not always effective in all contexts. Some studies have found that social media interactions do not significantly influence brand loyalty or cultural awareness, and that traditional marketing approaches can sometimes be more effective. This suggests that traditional methods involving direct interaction may be more appropriate for certain contexts than social media marketing strategies. To improve the effectiveness of programs aimed at preserving local traditions and culture, it is recommended that marketing strategies focus more on increasing user interaction on social media. An approach that combines various marketing and community engagement methods, such as content that encourages active participation and discussion on social media, may be more effective. Additionally, further research is needed to better understand the factors influencing the success of these strategies.
References
- S. Shawky, K. Kubacki, T. Dietrich, and S. Weaven, “Using social media to create engagement: a social marketing review,” J. Soc. Mark., vol. 9, no. 2, pp. 204–224, 2019. [CrossRef]
- E. A. Kuzmin, M. V. Faminskaya, E. A. Rodionova, and E. R. Zinatullina, “Digital Effect: Relationship Between Brand Media Image and Company Performance,” J. Ilm. Peuradeun, vol. 10, no. 2, pp. 491–508, 2022. [CrossRef]
- V. Kumar and S. Mittal, “Mobile marketing campaigns: Practices, challenges and opportunities,” Int. J. Bus. Innov. Res., vol. 21, no. 4, pp. 523–539, 2020. [CrossRef]
- Y. Ahuja and K. Chadha, “Content Sharing and Communication on Social Media Platforms: A Review,” 2022.
- R. Sundaram, R. Sharma, and A. Shakya, “Power of digital marketing in building brands: A review of social media advertisement,” International Journal of Management, vol. 11, no. 4. pp. 244–254, 2020.
- F. K. PUTRI et al., “Review: Local wisdom of the Tengger Tribe, East Java, Indonesia in environmental conservation,” Asian J. Ethnobiol., vol. 5, no. 1, 2022. [CrossRef]
- L. A. Simabur, “Exploring Local Wisdom-Based Marketing Communication Models in Tomalou Fishermen’s Village Festival,” Procur. J. Manaj. Bisnis, vol. 3, no. 1, pp. 22–29, 2024.
- O. Sng, S. L. Neuberg, M. E. W. Varnum, and D. T. Kenrick, “The behavioral ecology of cultural psychological variation,” Psychol. Rev., vol. 125, no. 5, pp. 714–743, 2018. [CrossRef]
- C. Sada, Y. Alas, and M. Anshari, “Indigenous people of Borneo (Dayak): Development, social cultural perspective and its challenges,” Cogent Arts and Humanities, vol. 6, no. 1. 2019. [CrossRef]
- S. K. Patel, A. Sharma, and G. S. Singh, “Traditional agricultural practices in India: an approach for environmental sustainability and food security,” Energy, Ecology and Environment, vol. 5, no. 4. pp. 253–271, 2020. [CrossRef]
- S. Zuhri, T. Herawan, N. Wening, and M. Harsono, “A review on human resource management based on local wisdom,” Journal of Advanced Research in Law and Economics, vol. 10, no. 6. pp. 1746–1768, 2019.
- Haudi et al., “The effect of social media marketing on brand trust, brand equity and brand loyalty,” Int. J. Data Netw. Sci., vol. 6, no. 3, pp. 961–972, 2022. [CrossRef]
- T. Samarah, P. Bayram, H. Y. Aljuhmani, and H. Elrehail, “The role of brand interactivity and involvement in driving social media consumer brand engagement and brand loyalty: the mediating effect of brand trust,” J. Res. Interact. Mark., vol. 16, no. 4, pp. 648–664, 2022. [CrossRef]
- E. Kalinová and H. Kovaříková, “Using social networks in business,” SHS Web Conf., 2023. [CrossRef]
- G. Mude and S. Undale, “Social Media Usage: A Comparison Between Generation Y and Generation Z in India,” Int. J. E-bus. Res., vol. 19, no. 1, 2023. [CrossRef]
- H. Zhu, “How Social Media Marketing Strategies Drive Brand Development in the Digital Age?,” BCP Bus. Manag., vol. 38, pp. 2047–2053, 2023. [CrossRef]
- Q. S. Ngo and V. S. Nguyen, “Managing and Developing an Educational Model That Preserves and Promotes the Traditional Cultural Identity of Local Ethnic Minorities in the Central Highlands,” Tạp chí Nghiên cứu Khoa học và Phát triển, pp. 18–25, 2022. [CrossRef]
- I. W. C. Adyatma, D. R. P. P. Nida, and I. G. A. A. M. Suariedewi, “The Effect of Community Empowerment on the Sustainability of Ecotourism Based Tourism through Moderation of Local Wisdom Variables in Bongkasa Village, Abiansemal District,” Int. J. Curr. Sci. Res. Rev., vol. 06, no. 07, 2023. [CrossRef]
- A. Bris et al., “KNIGHTS, RAIDERS, AND TARGETS - THE IMPACT OF THE HOSTILE TAKEOVER - COFFEE,JC, LOWENSTEIN,L, ROSEACKERMAN,S,” J. Bank. Financ., 2021.
- L. R. Nizamova, “Ethnic Tatars in contention for recognition and autonomy: bilingualism and pluri-cultural education policies in Tatarstan,” Natl. Pap., vol. 44, no. 1, pp. 71–91, 2016. [CrossRef]
- S. Gholamveisy, A. Momen, M. Hatami, M. Sekhavat, and S. Homayooni, “The effect of perceived social media marketing activities on brand loyalty,” Apunt. Univ., vol. 13, no. 3, pp. 105–118, 2023. [CrossRef]
- D. Iswanto, T. Handriana, A. H. N. Rony, and S. S. Sangadji, “Influencers in Tourism Digital Marketing: A Comprehensive Literature Review,” Int. J. Sustain. Dev. Plan., vol. 19, no. 2, pp. 739–749, Feb. 2024. [CrossRef]
- Y. N. Zafira and A. Hartono, “The Effect of Somethinc’s Instagram Social Media Marketing Activities on Brand Awareness and Customer Loyalty,” Asian J. Econ. Bus. Account., vol. 23, no. 15, pp. 121–136, 2023. [CrossRef]
- R. S. Ebrahim, “The Role of Trust in Understanding the Impact of Social Media Marketing on Brand Equity and Brand Loyalty,” J. Relatsh. Mark., vol. 19, no. 4, pp. 287–308, 2020. [CrossRef]
- Z. Zhang and L. Zheng, “Consumer community cognition, brand loyalty, and behaviour intentions within online publishing communities: An empirical study of Epubit in China,” Learn. Publ., vol. 34, no. 2, pp. 116–127, 2021. [CrossRef]
- H. Azwar, M. H. Hanafiah, A. A. Ghani, M. Azinuddin, and N. S. M. Shariffuddin, “Community-Based Tourism (Cbt) Moving Forward: Penta Helix Development Strategy Through Community Local Wisdom Empowerment,” Plan. Malaysia, vol. 21, no. 1, pp. 72–88, 2023. [CrossRef]
- N. Shafieisabet and S. Haratifard, “The empowerment of local tourism stakeholders and their perceived environmental effects for participation in sustainable development of tourism,” J. Hosp. Tour. Manag., vol. 45, pp. 486–498, 2020. [CrossRef]
- G. Bitton, J. L. Fox, and H. G. Strickland, “Removal of algae from Florida lakes by magnetic filtration,” Appl. Microbiol., vol. 30, no. 6, pp. 905–908, 1975. [CrossRef]
- S. Vinerean, “Importance of Strategic Social Media Marketing,” Expert J. Mark., vol. 5, no. 1, pp. 28–35, 2017.
- F. Li, J. Larimo, and L. C. Leonidou, “Social media marketing strategy: definition, conceptualization, taxonomy, validation, and future agenda,” J. Acad. Mark. Sci., vol. 49, no. 1, pp. 51–70, 2021. [CrossRef]
- J. Jacobson, A. Gruzd, and Á. Hernández-García, “Social media marketing: Who is watching the watchers?,” J. Retail. Consum. Serv., vol. 53, 2020. [CrossRef]
- I. W. Suardana, I. P. Gelgel, and I. W. Watra, “Traditional villages empowerment in local wisdom preservation towards cultural tourism development,” Int. J. Soc. Sci., vol. 5, no. 1, pp. 74–81, 2022. [CrossRef]
- Y. BİLGİN, “the Effect of Social Media Marketing Activities on Brand Awareness, Brand Image and Brand Loyalty,” Bus. Manag. Stud. An Int. J., vol. 6, no. 1, pp. 128–148, 2018. [CrossRef]
- F. Kelliher, L. Reinl, T. G. Johnson, and M. Joppe, “The role of trust in building rural tourism micro firm network engagement: A multi-case study,” Tour. Manag., vol. 68, pp. 1–12, 2018. [CrossRef]
- D. L. M. van der Bend, T. Jakstas, E. van Kleef, V. A. Shrewsbury, and T. Bucher, “Making sense of adolescent-targeted social media food marketing: A qualitative study of expert views on key definitions, priorities and challenges,” Appetite, vol. 168, 2022. [CrossRef]
- Z. Li and Y. Yu, “The Impact of Nike’s Social Media Marketing Strategy on Consumer Demand,” Adv. Econ. Manag. Polit. Sci., vol. 38, no. 1, pp. 172–178, 2023. [CrossRef]
- D. Y. Kim and H. Y. Kim, “Trust me, trust me not: A nuanced view of influencer marketing on social media,” J. Bus. Res., vol. 134, pp. 223–232, 2021. [CrossRef]
Figure 1.
Research Prosedure.
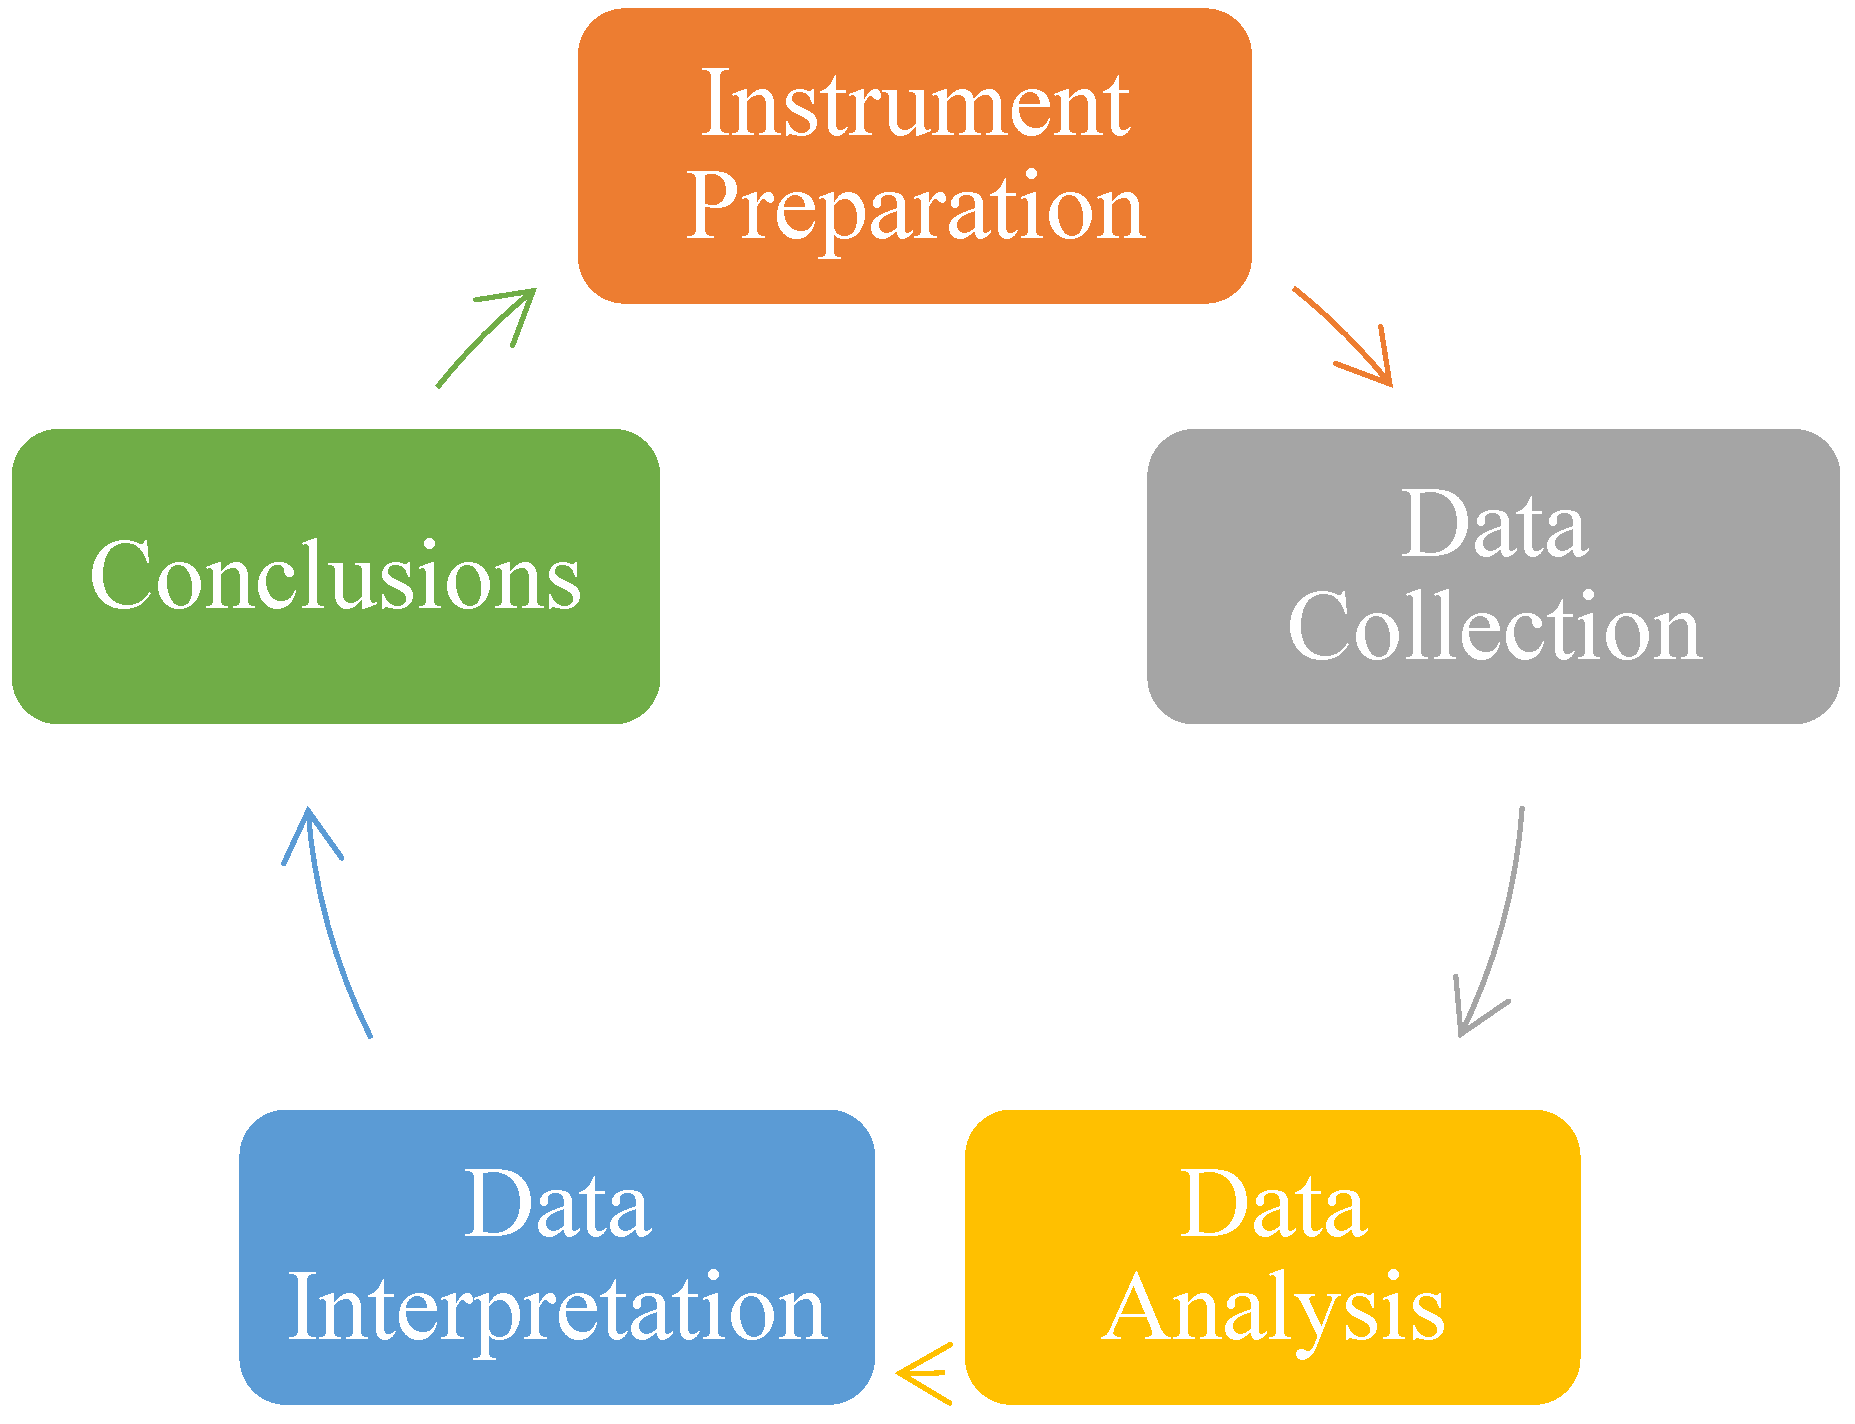
Figure 2.
Responses Based on Gender and Status.
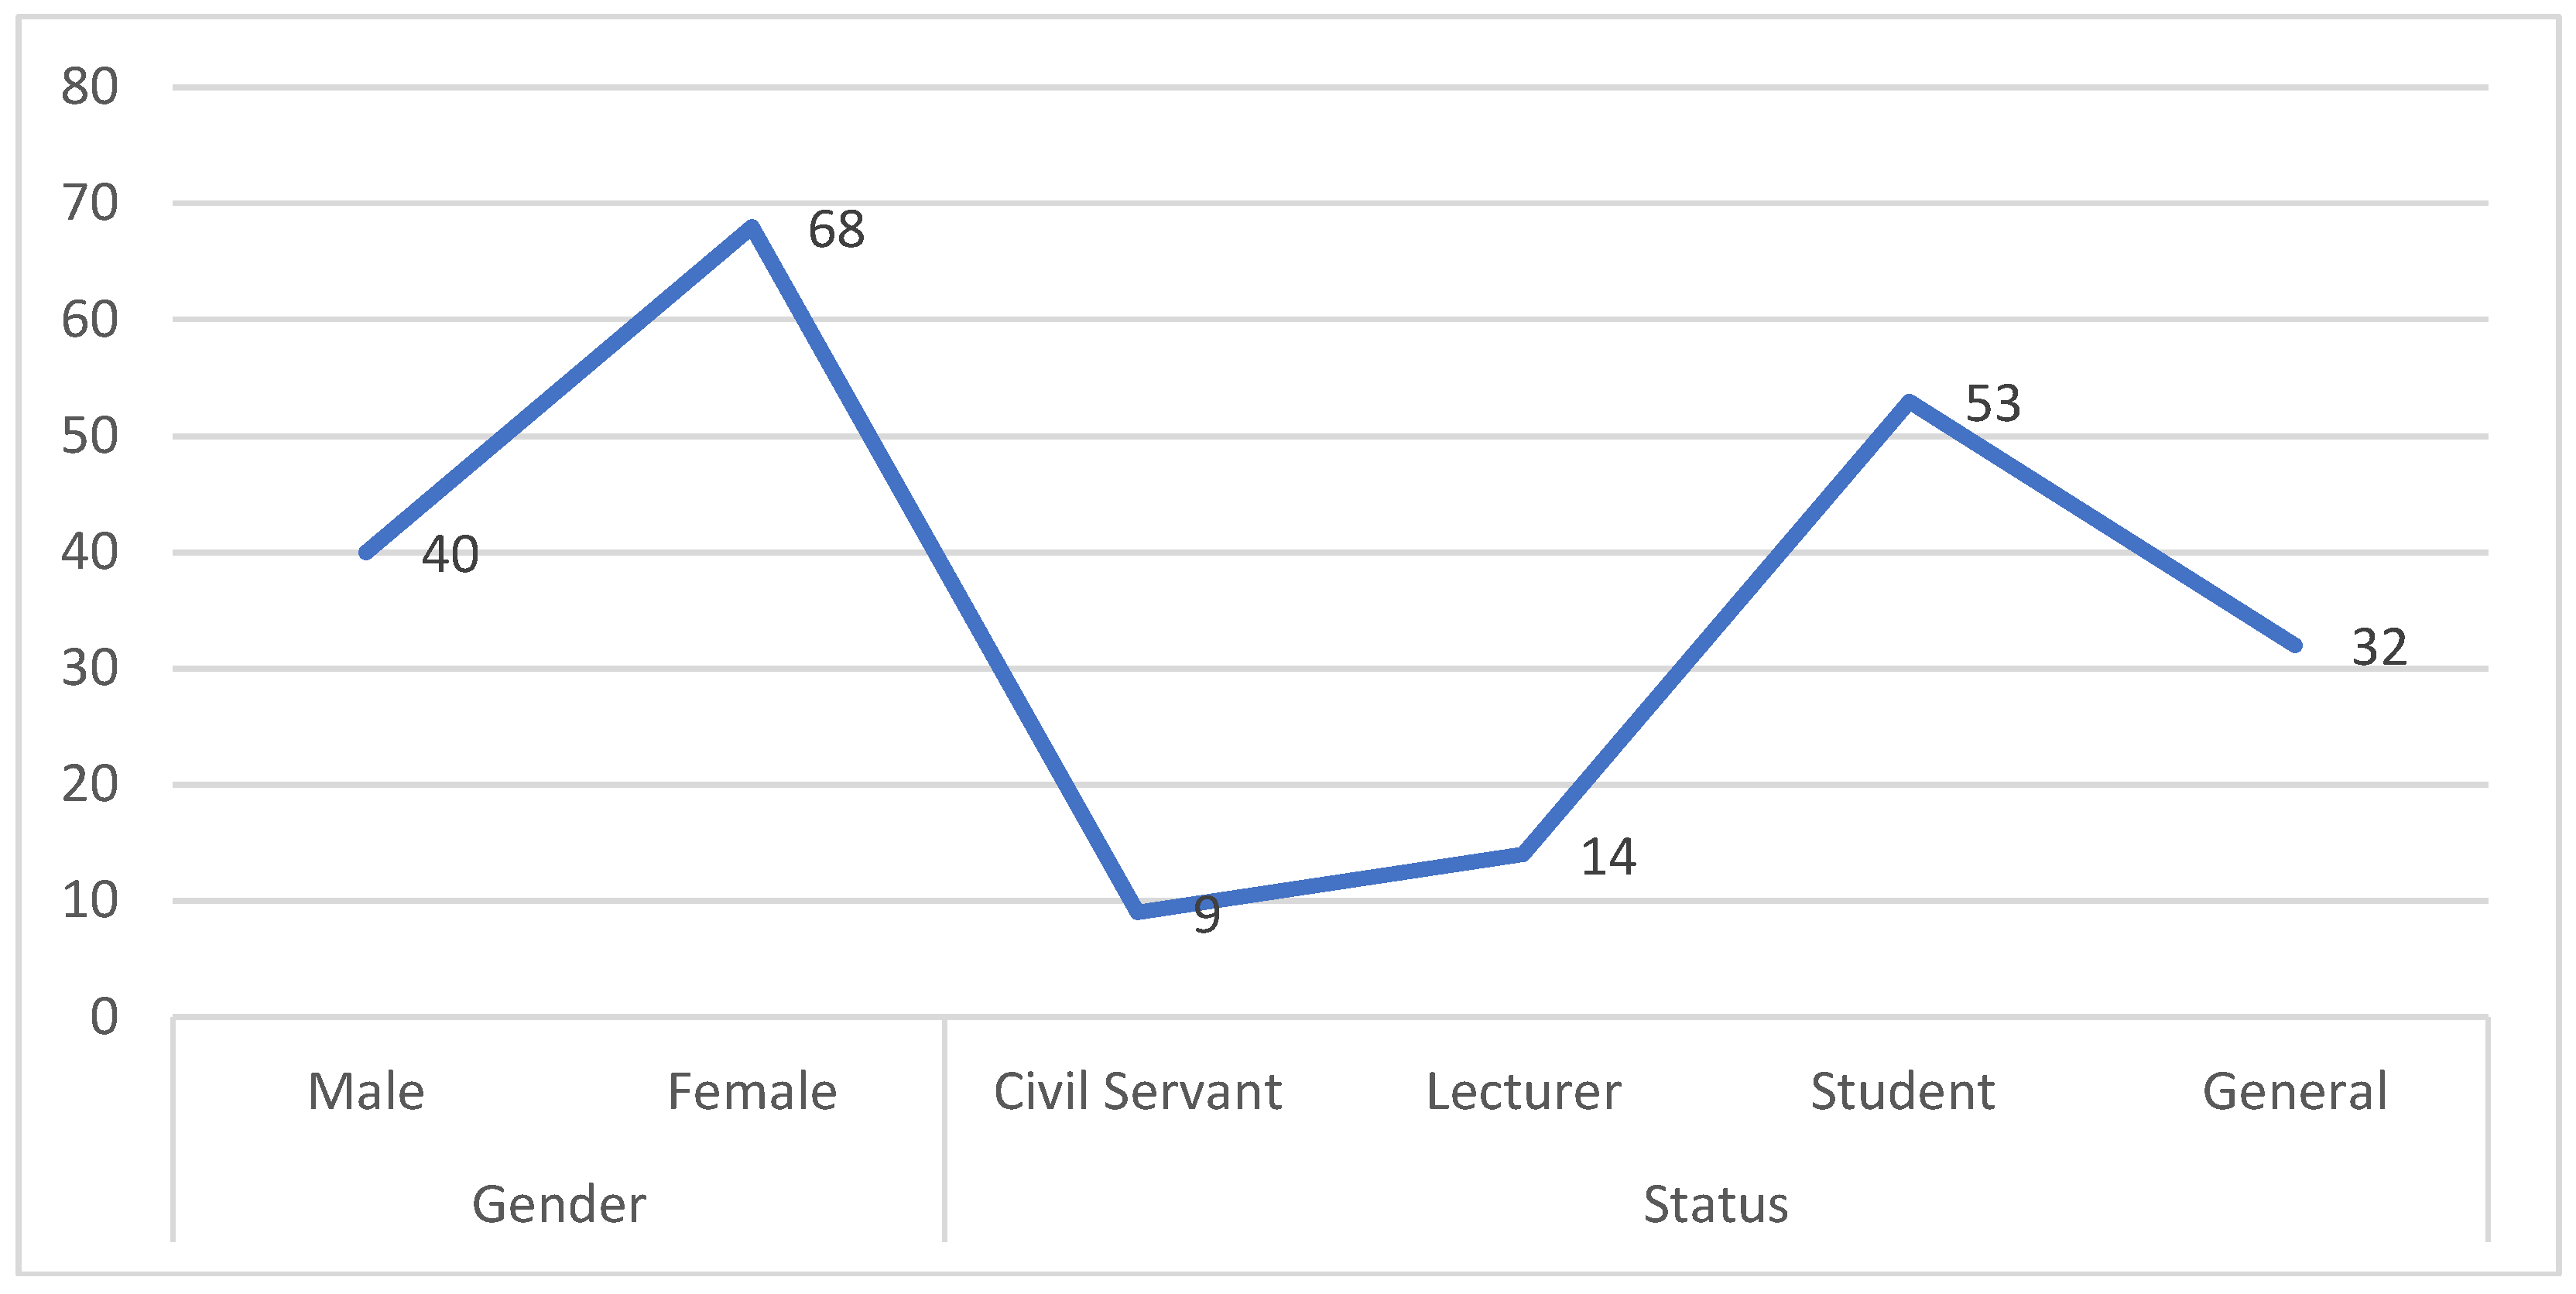
Figure 3.
Response of social media marketing content to local wisdom preservation.
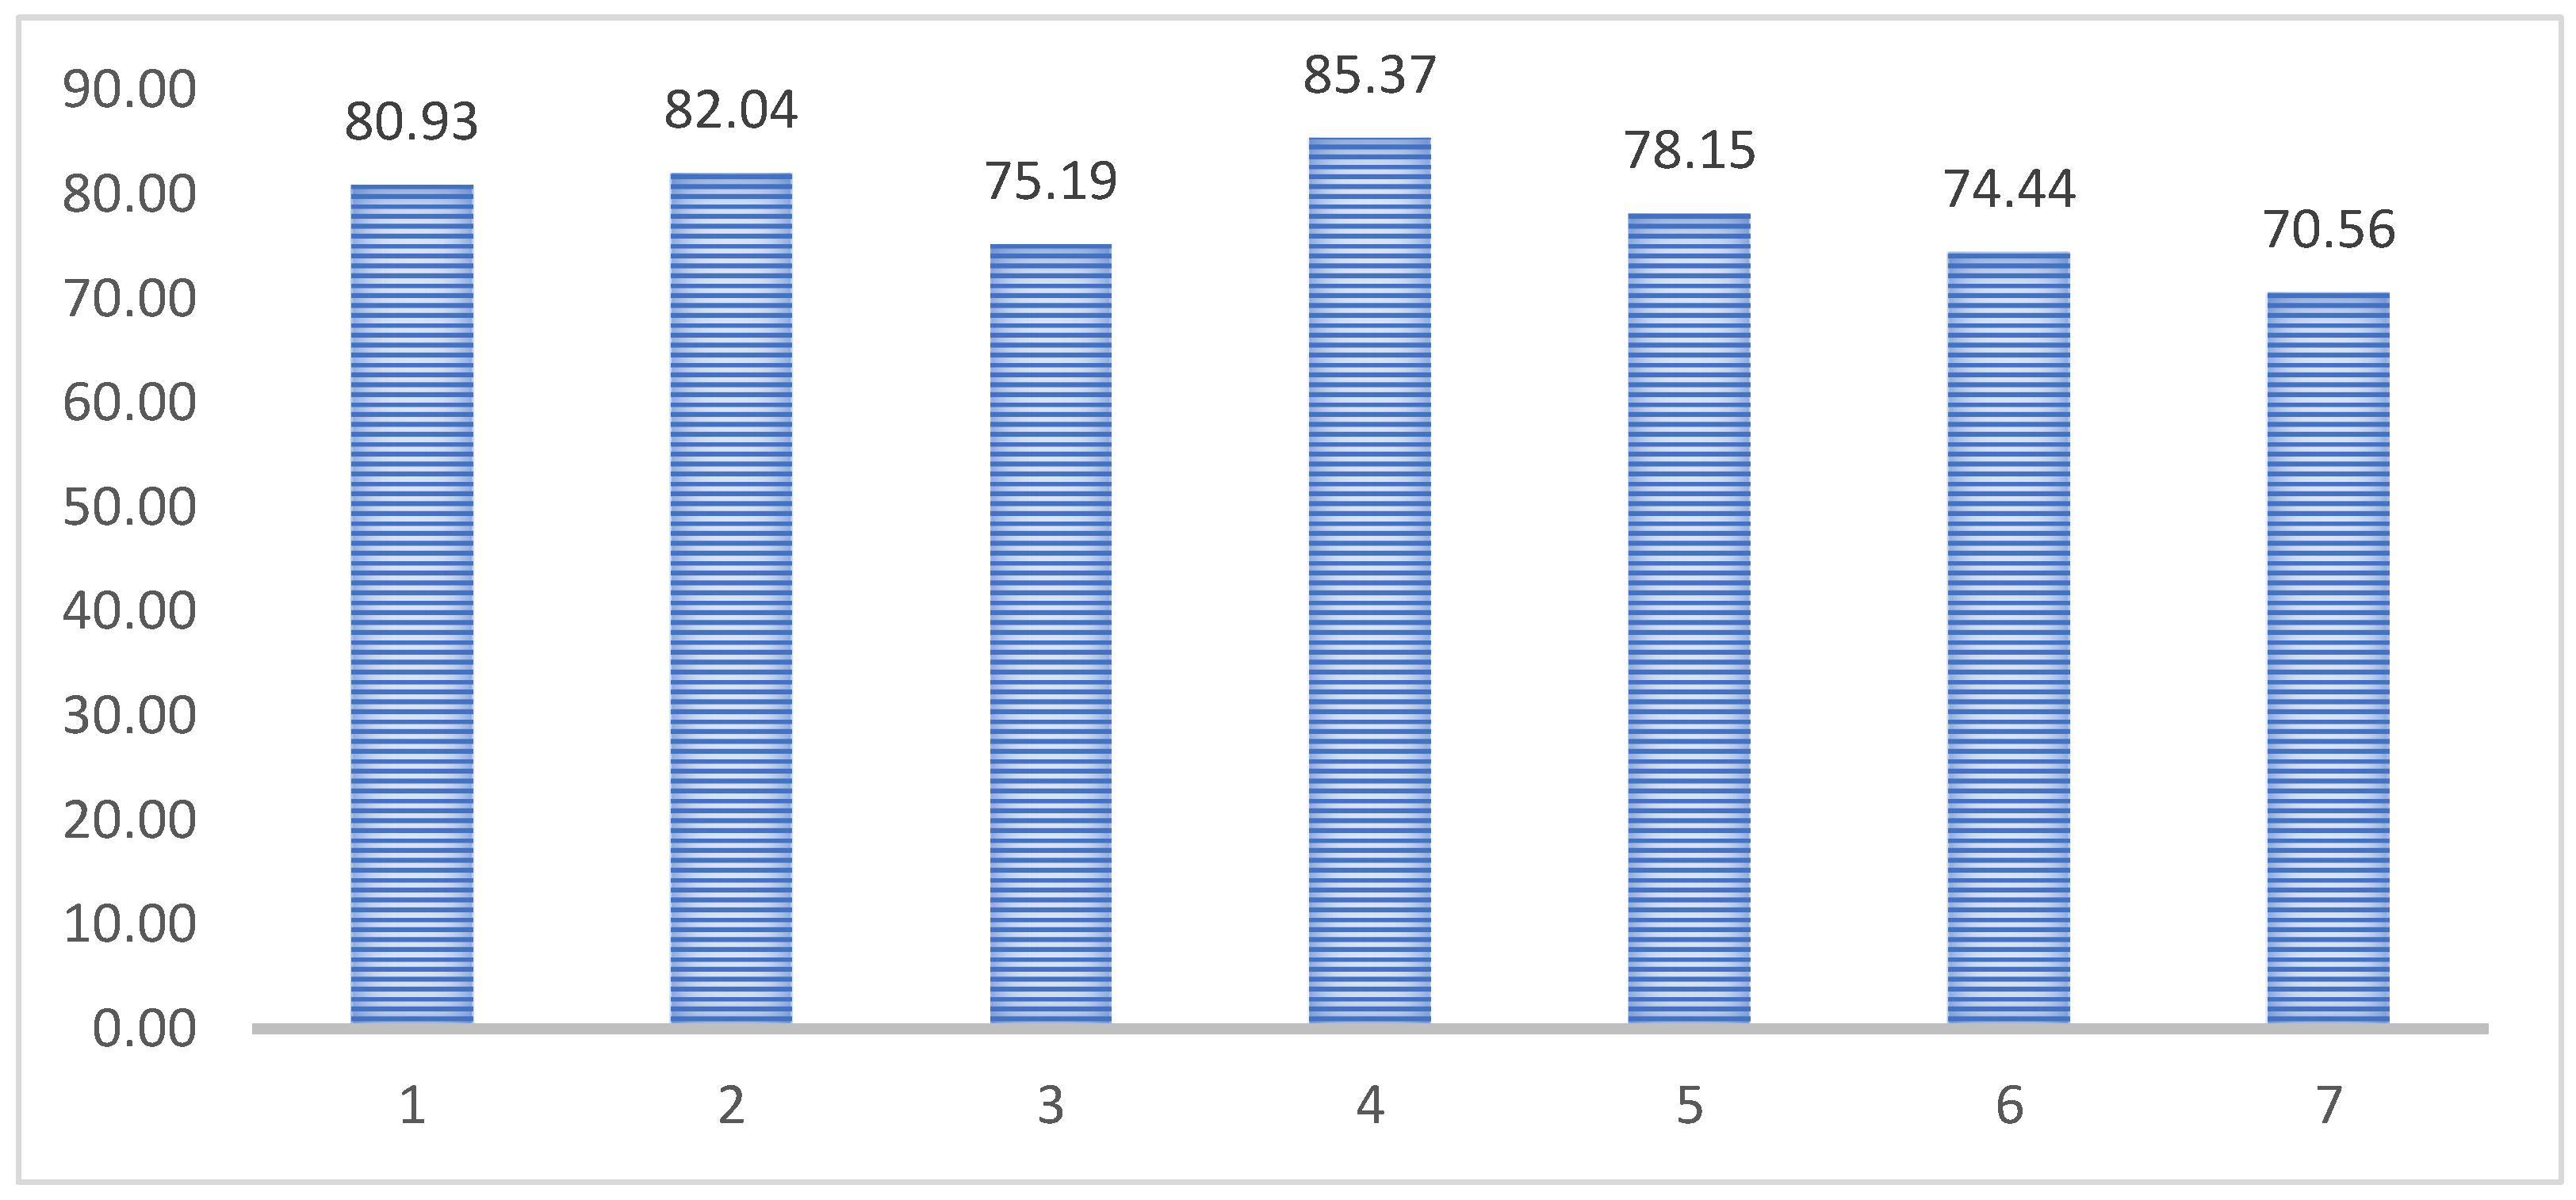
Figure 4.
Response of user interactions on social media to the preservation of local wisdom.
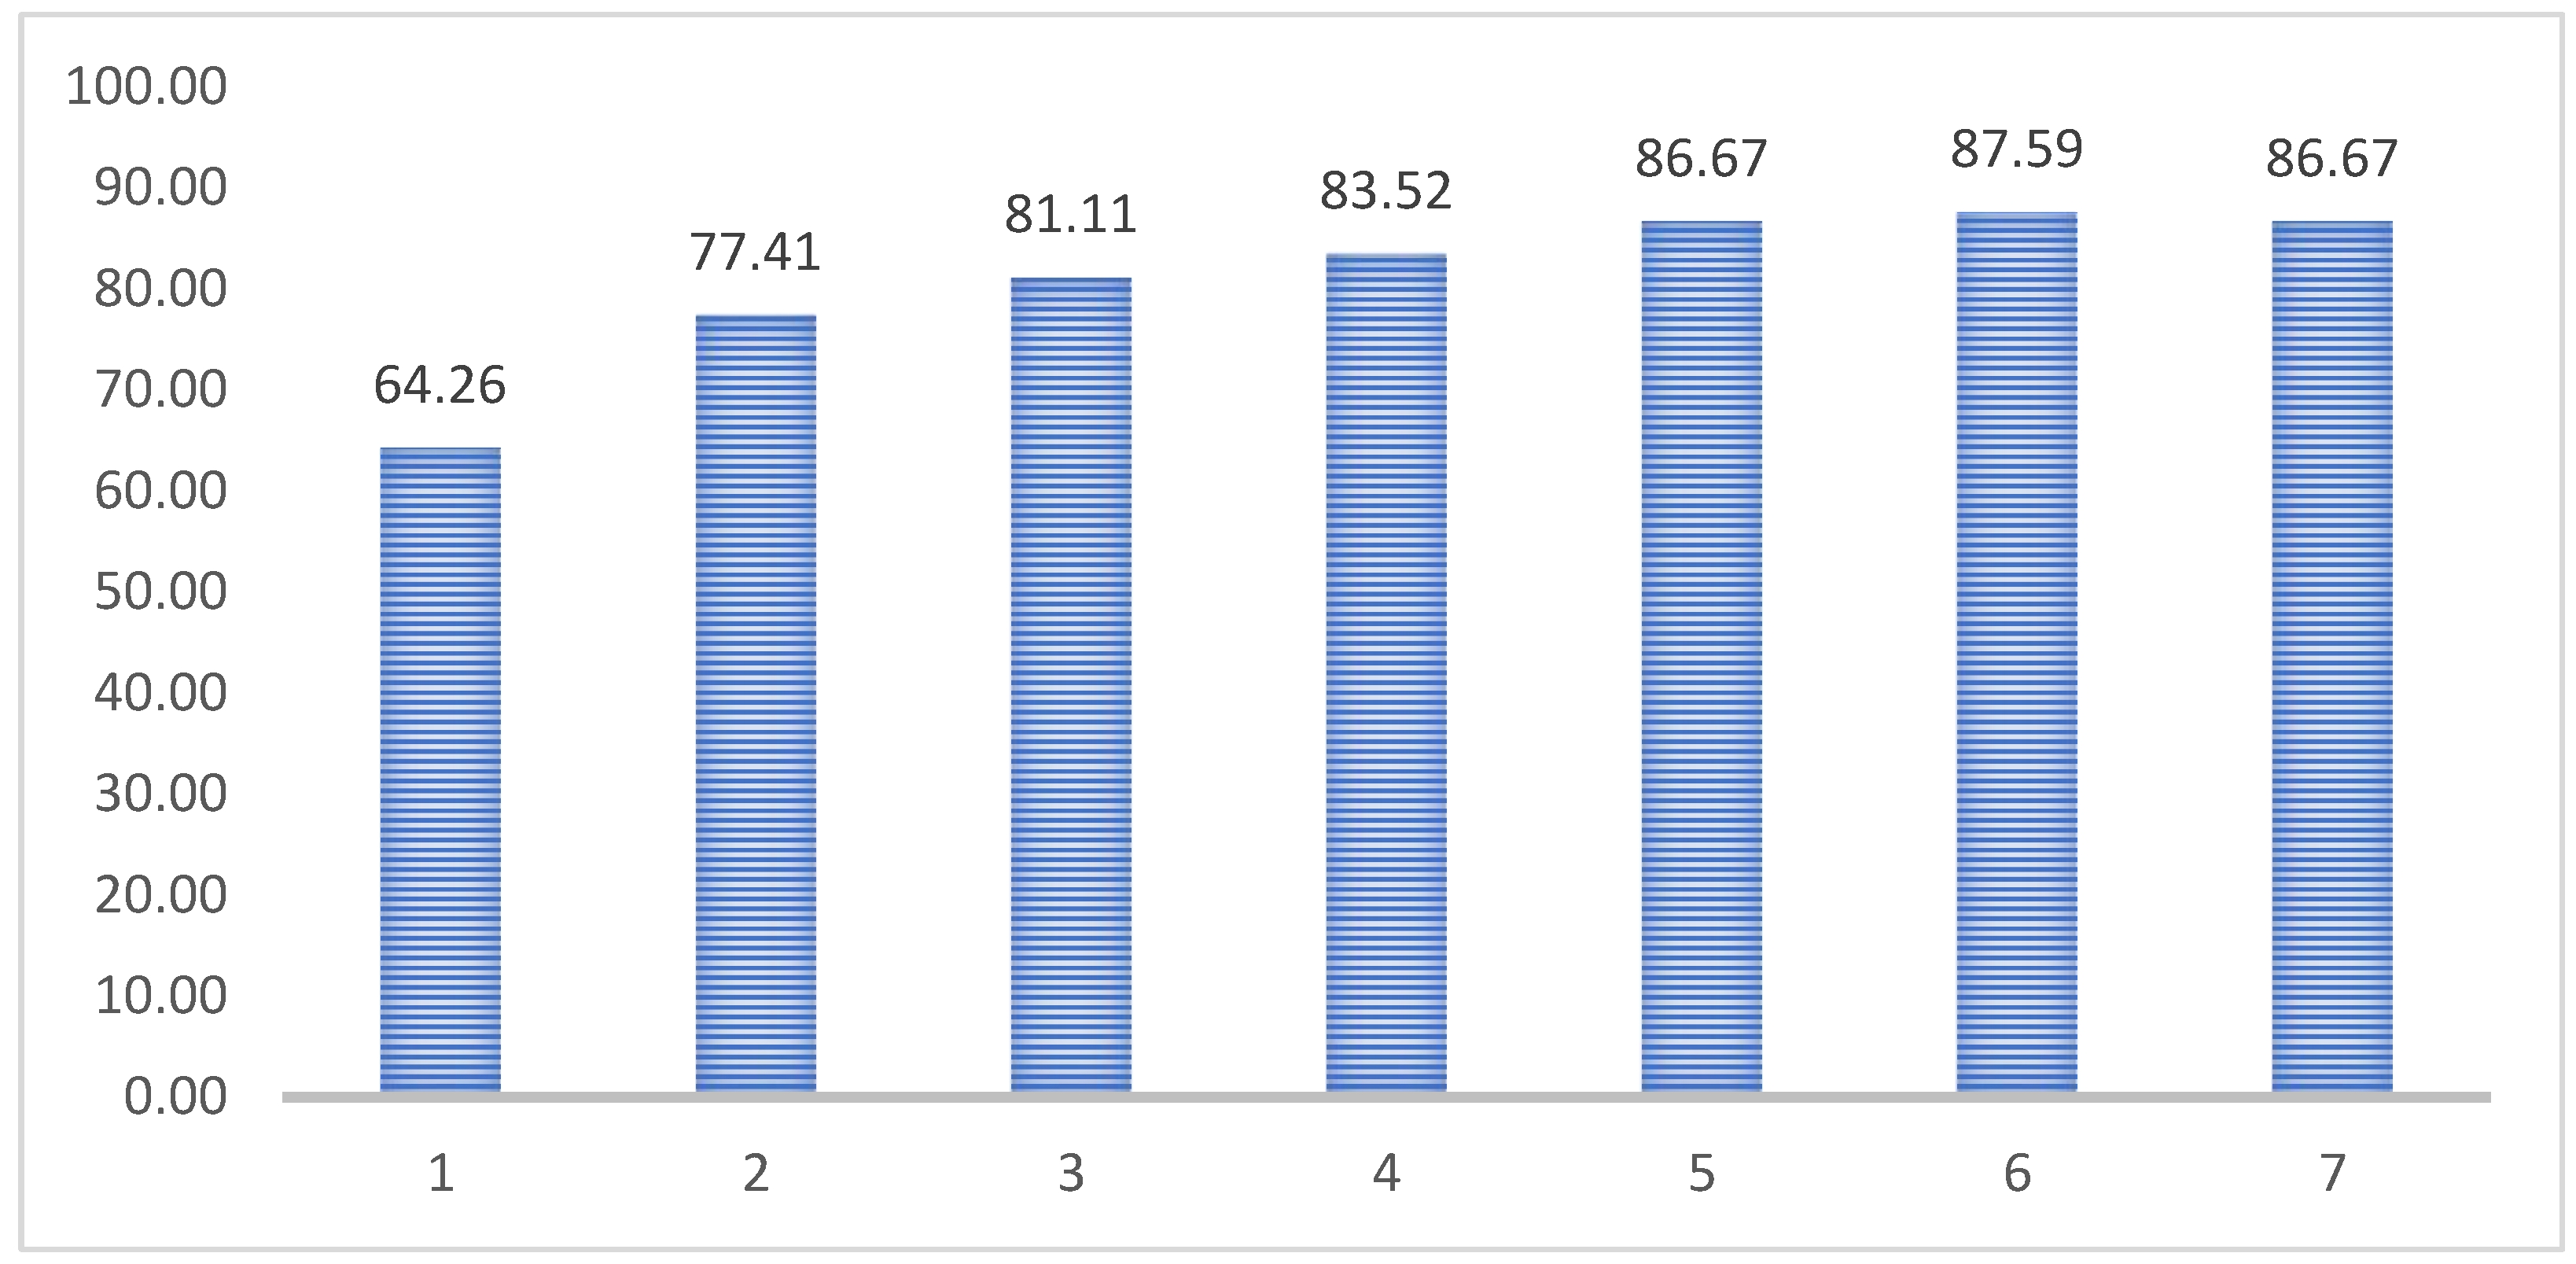
Figure 5.
Response of paid advertising on social media to the preservation of local wisdom.
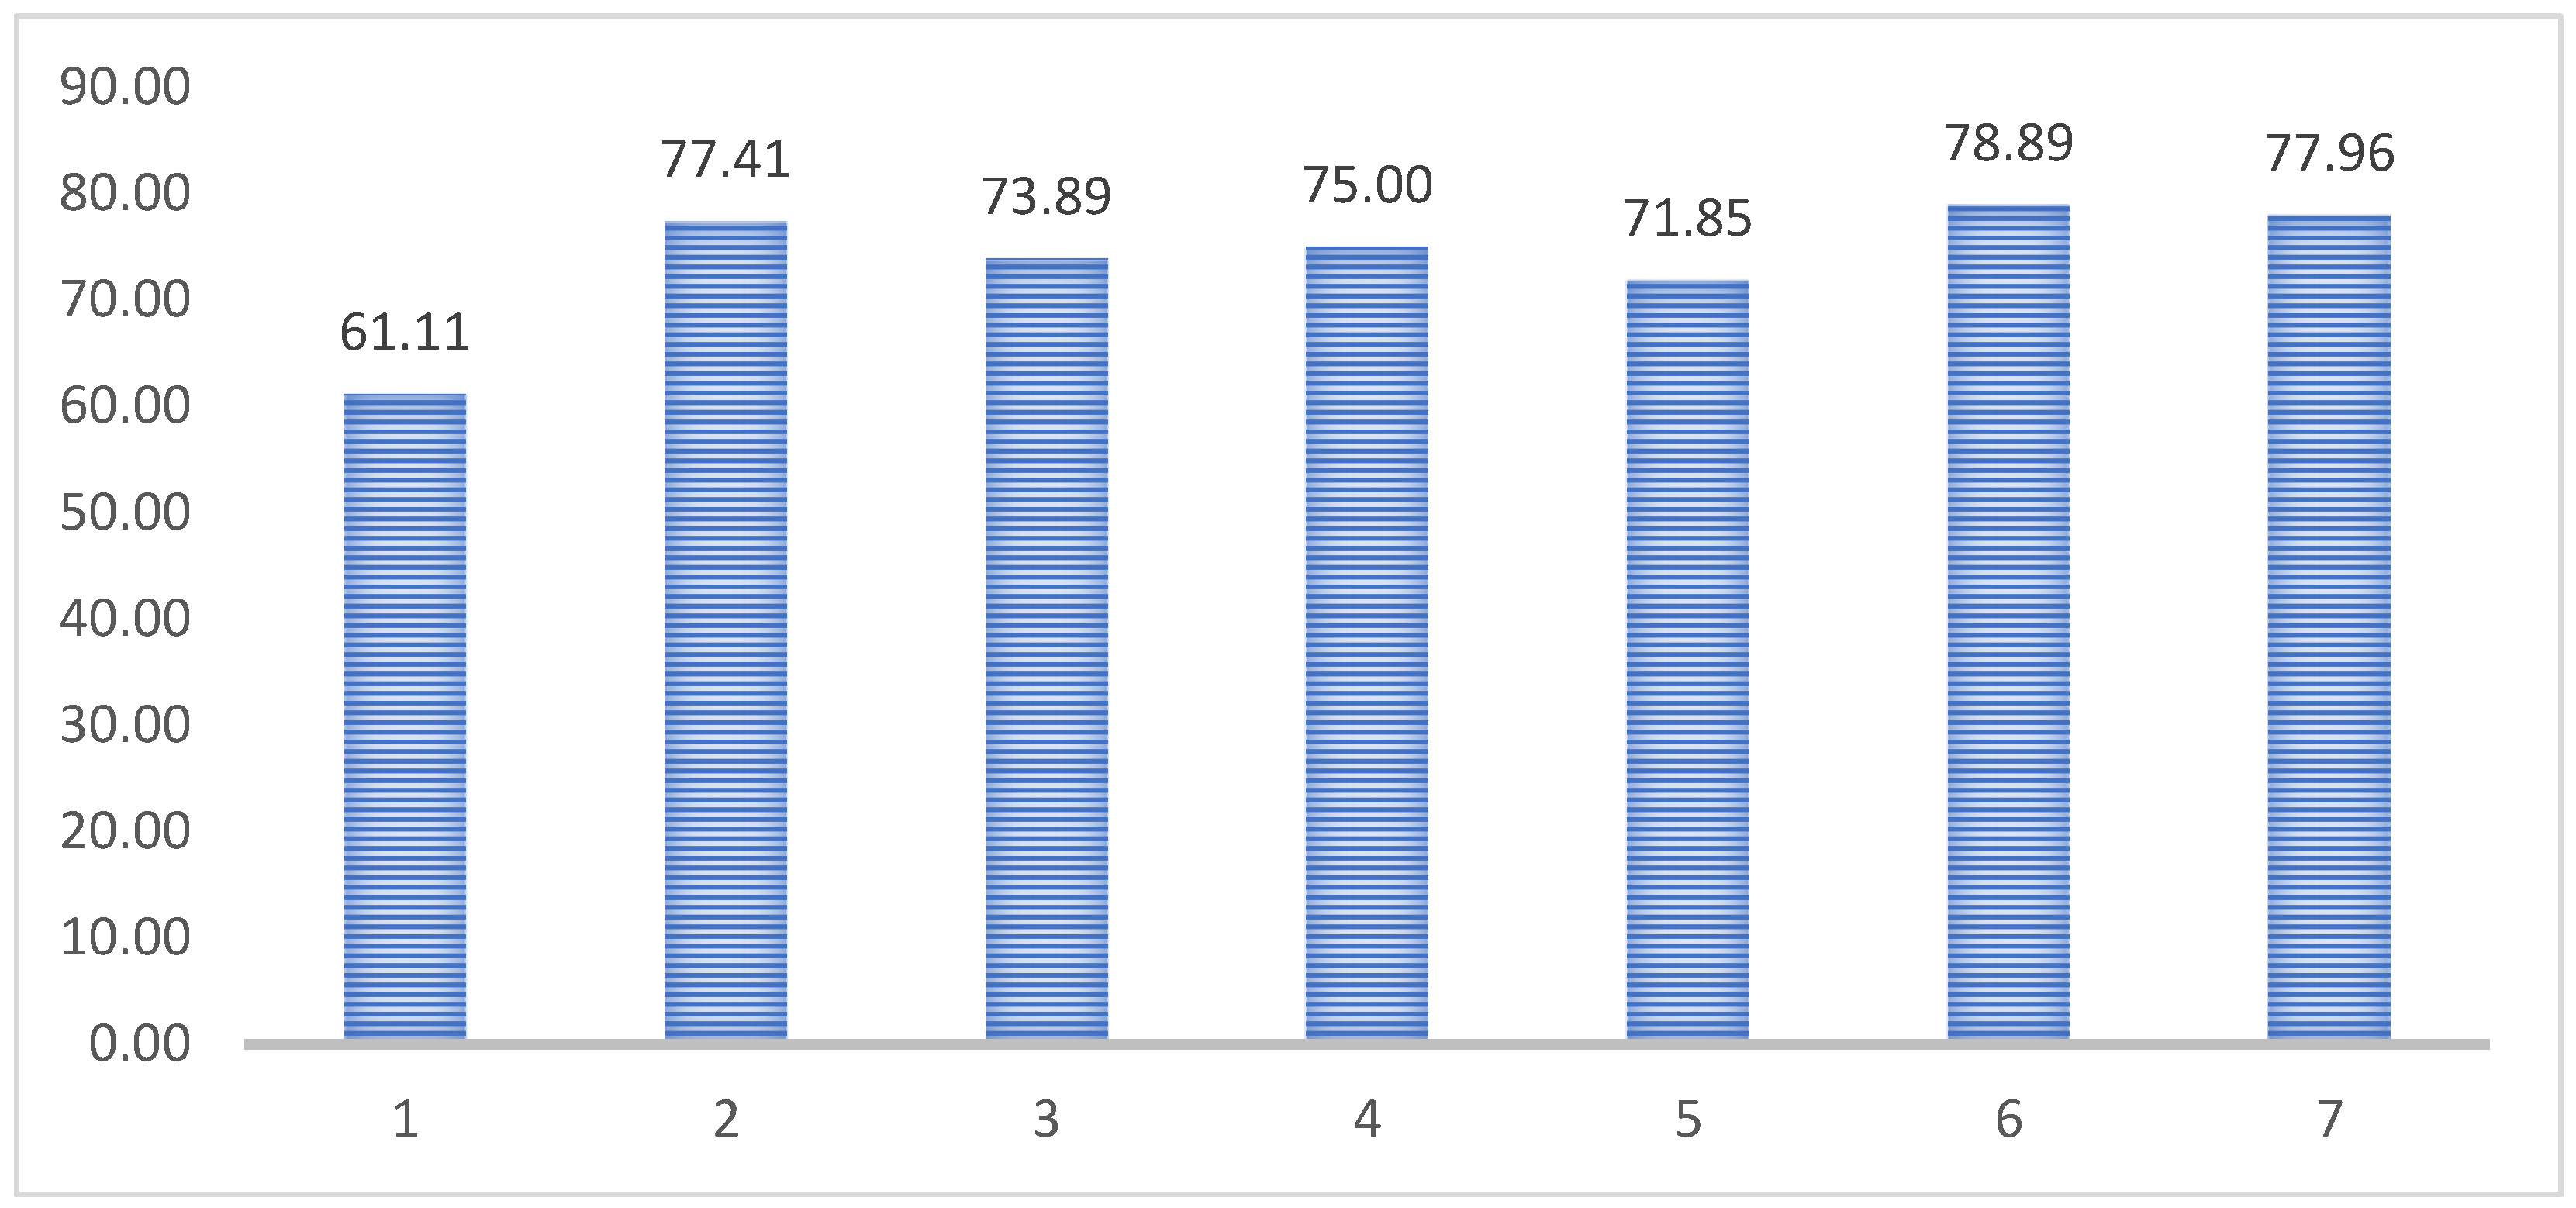
Figure 6.
Response of entertainment and trends in social media to the preservation of local wisdom.
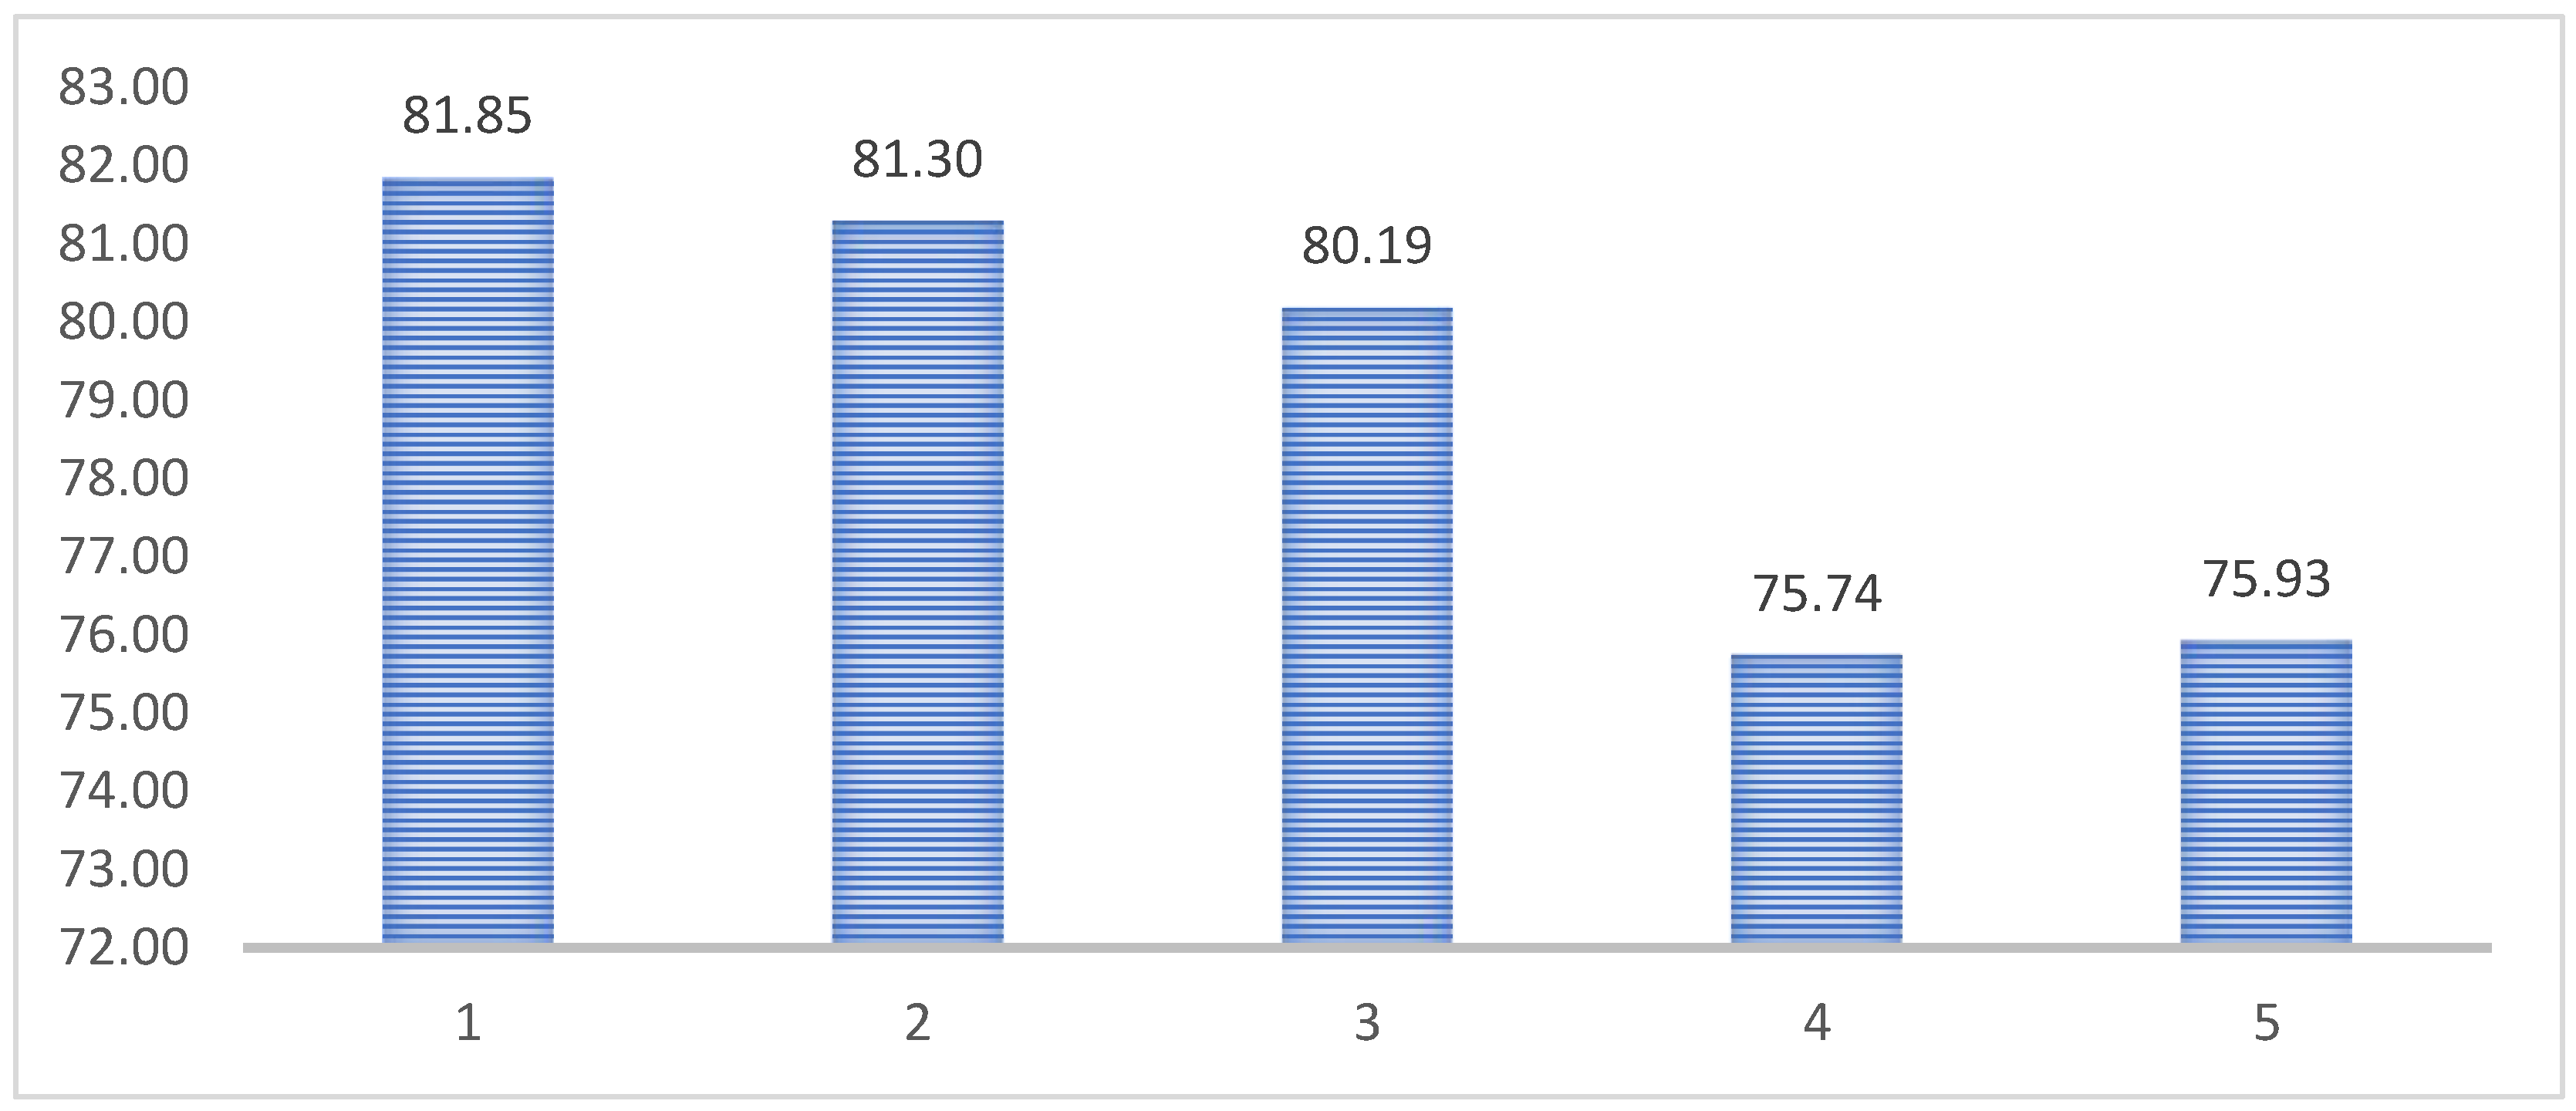
Figure 7.
Electronic Word-of-Mouth (e-WOM) response to local wisdom.
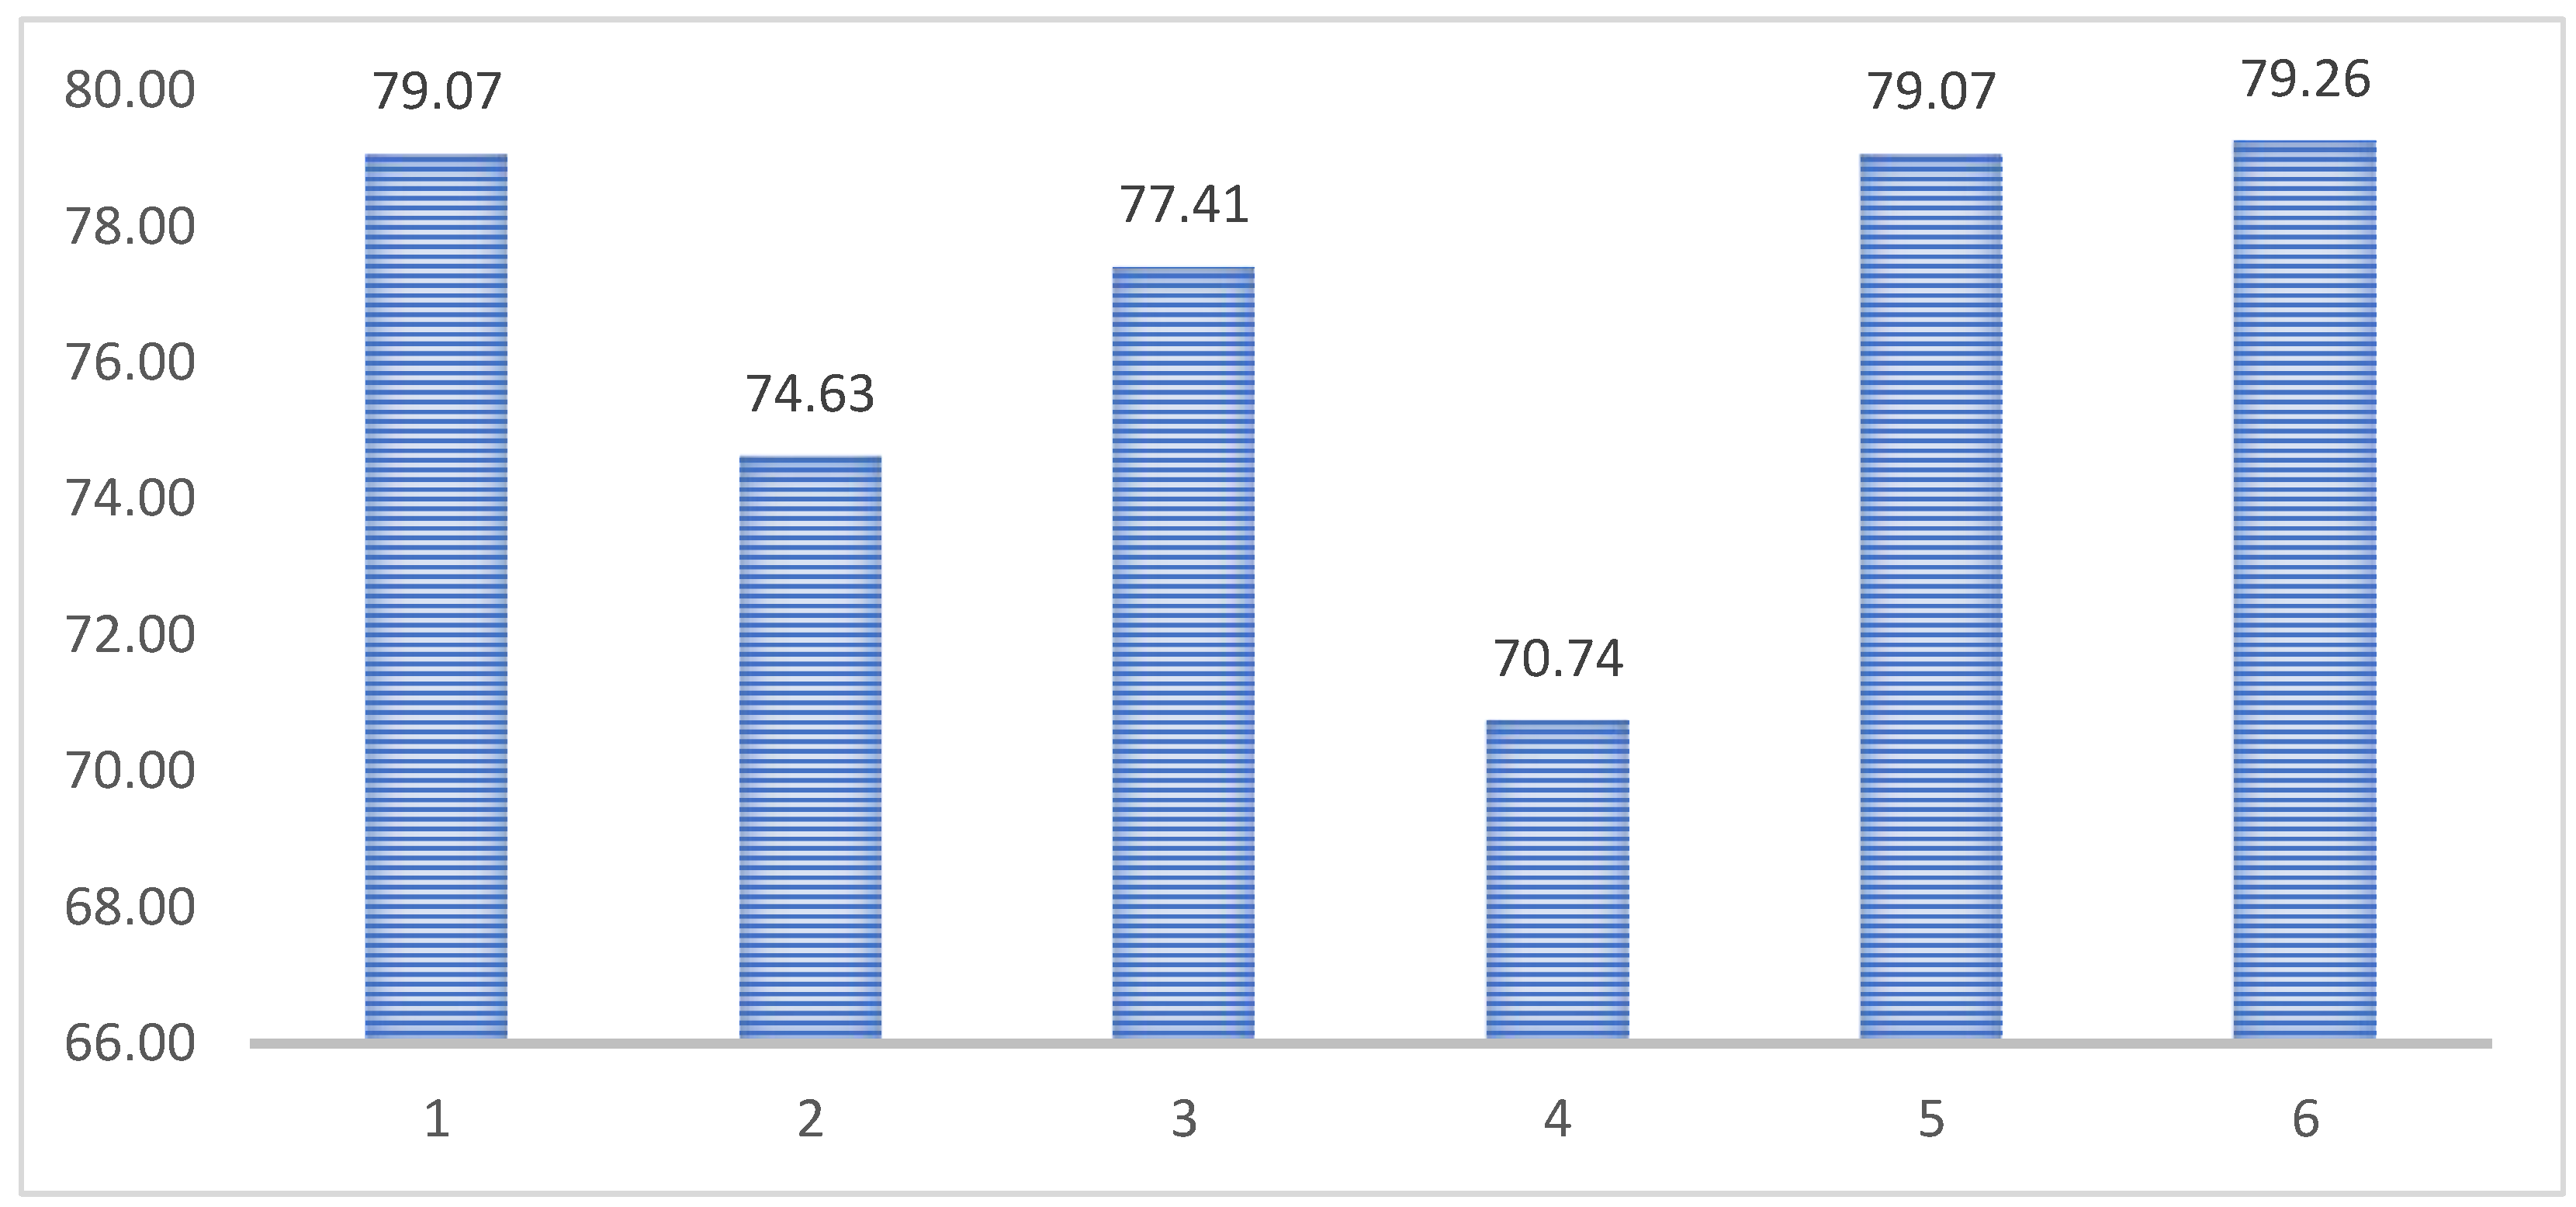
Figure 8.
Response to preservation of local traditions and culture.
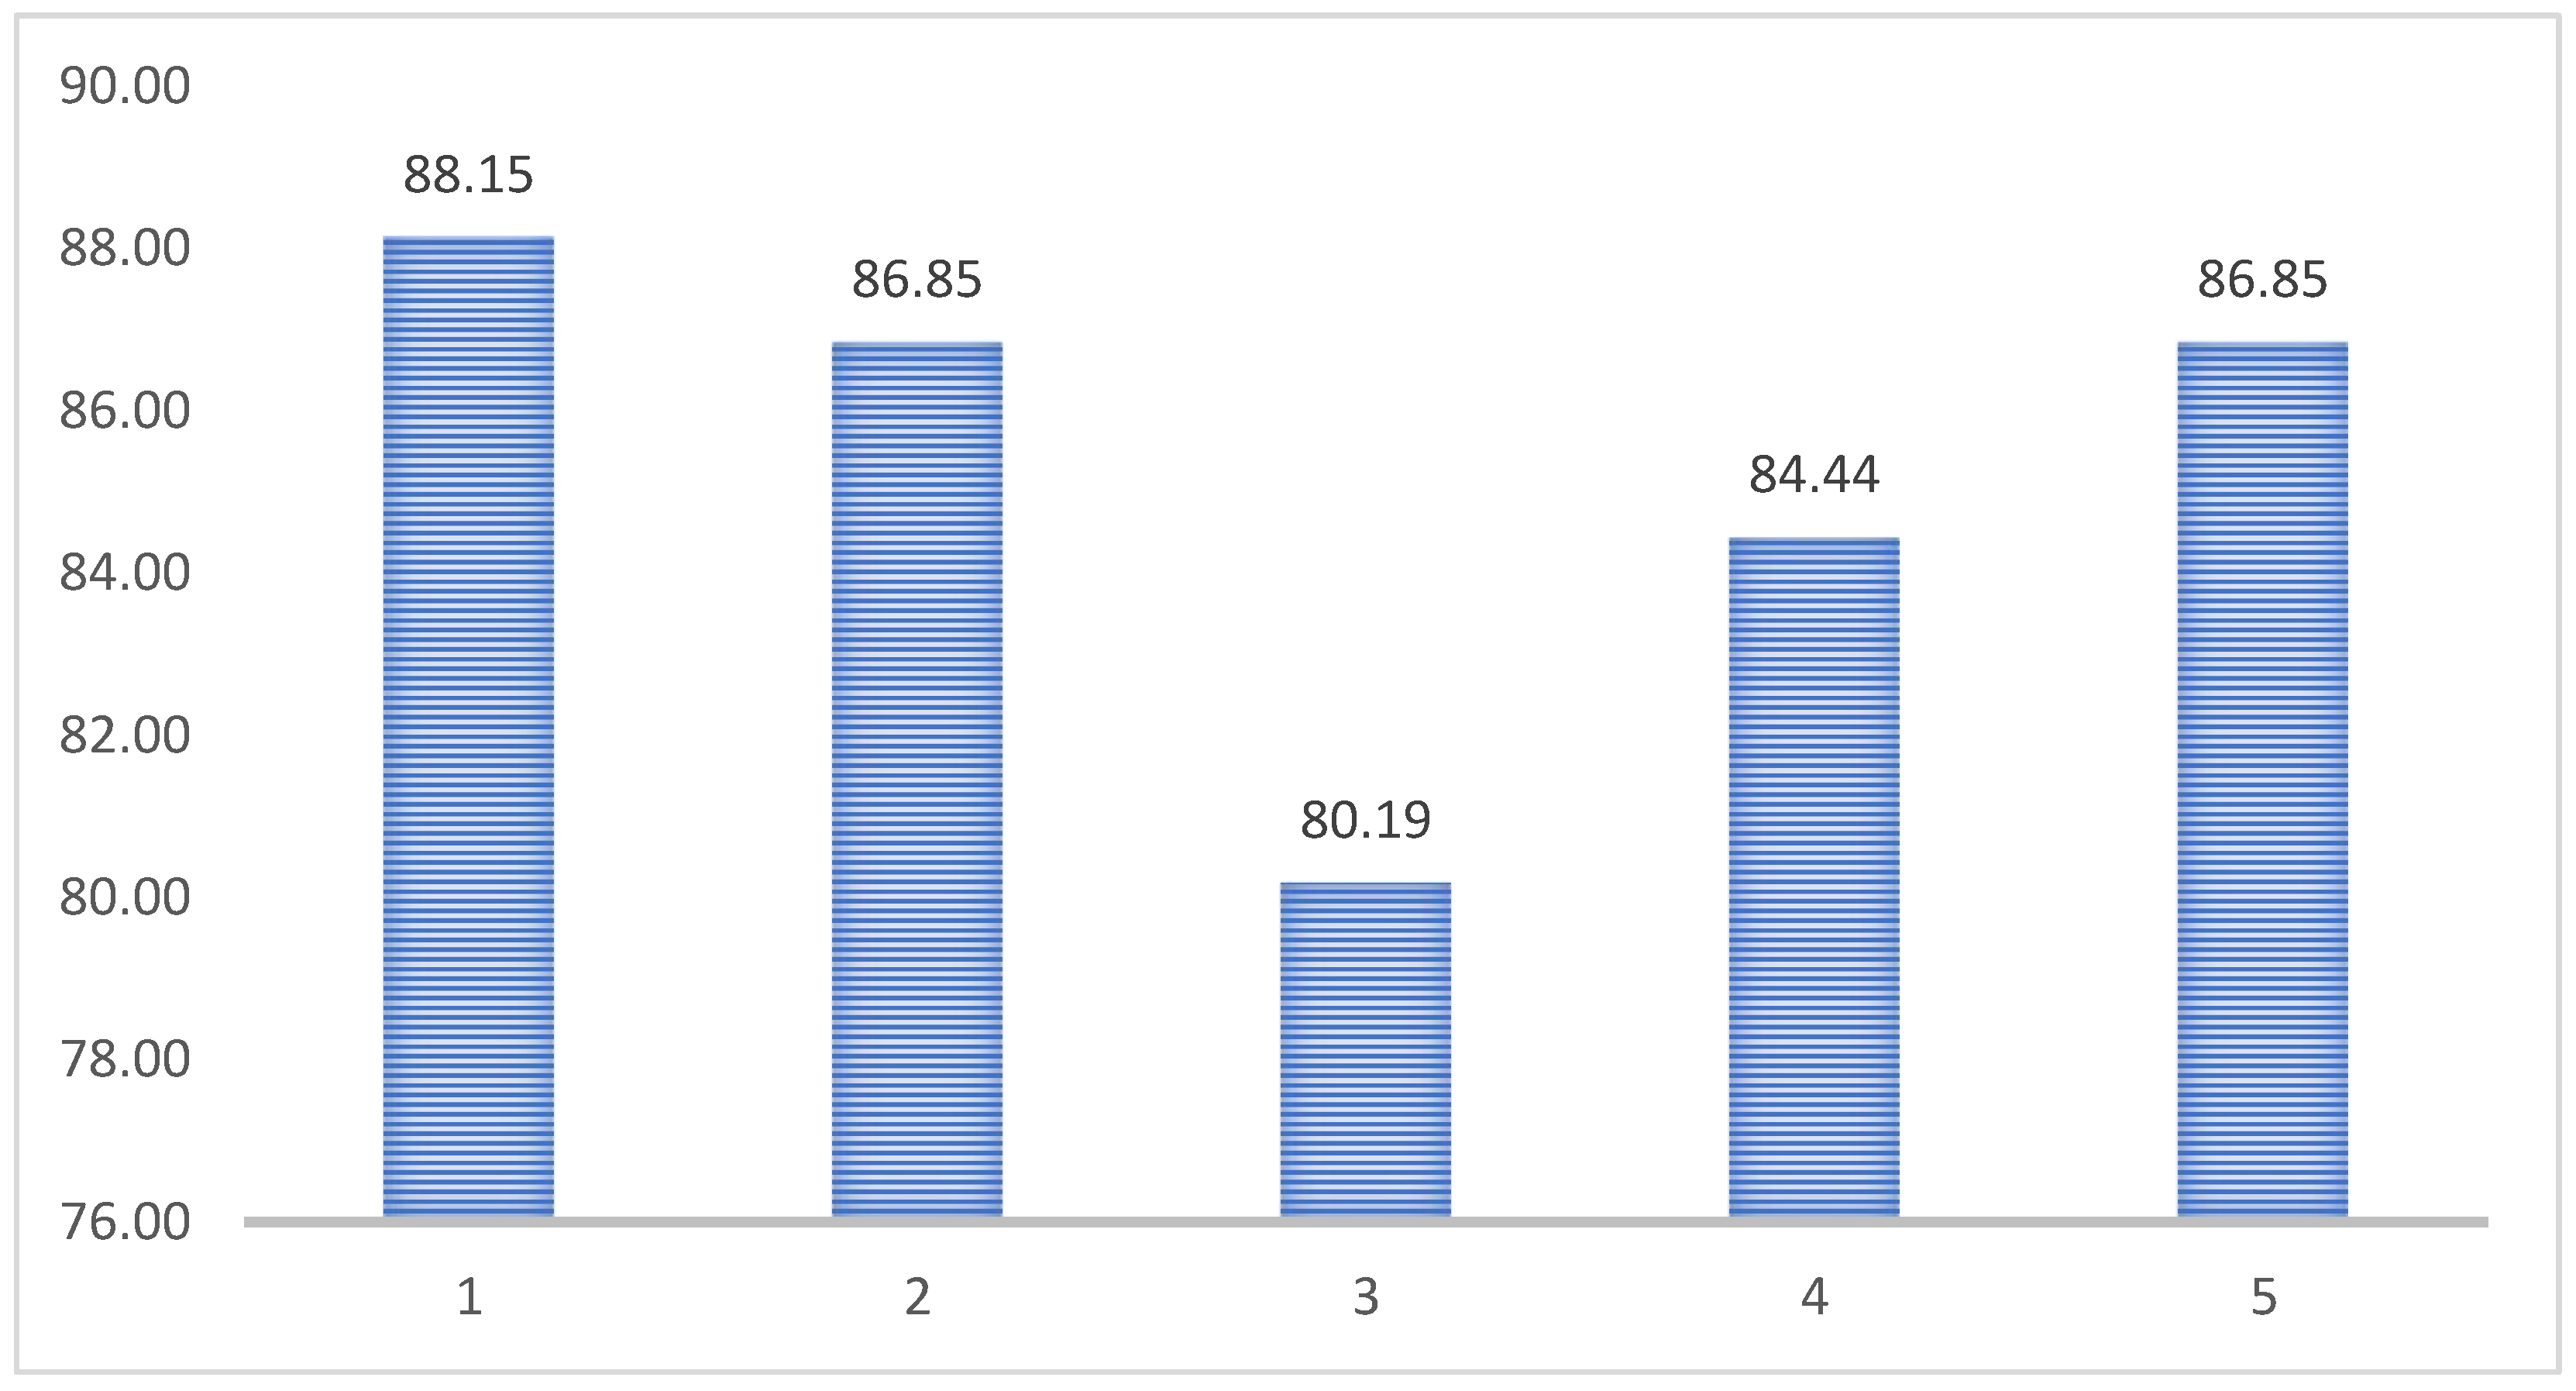

Table 1.
Variables and Indicators.
| No | Variable | Indicators |
| 1 | Social Media Marketing Content (X1) | (1) Social media content helps increase knowledge about local traditions. (2) Often find information about local culture through social media content. (3) Marketing content on social media often highlights cultural heritage (4) social media is effective in promoting local cultural events. (5) Appreciate local traditions more after seeing them on social media. (6) Feel closer to the local community after viewing content on social media. (7) Tend to share local cultural content found on social media. |
| 2 | User Interaction on Social Media (X2) | (1) Frequently discussing local culture with other users on social media. (2) Interaction on social media increases knowledge about local traditions. (3) Comments and discussions on social media facilitate understanding the importance of cultural preservation. (4) Social media offers an excellent platform for sharing cultural experiences. (5) Social media expands access to local cultural information that may not have been known before. (6) Perceive social media as an effective tool for educating the younger generation about local culture. (7) More interested in visiting cultural tourism destinations after seeing positive reviews on social media. |
| 3 | Paid Advertising on Social Media (X3) | (1) Paid advertisements on social media frequently highlight local culture. (2) Interest in advertisements that promote local traditions on social media. (3) Paid advertisements on social media are effective in increasing awareness about local culture. (4) Paid advertisements on social media contribute to the preservation of local traditions. (5) Paid advertisements on social media make want to participate in cultural events. (6) Paid ads on social media motivate to visit historical places. (7) More likely to buy local products after seeing attractive paid ads on social media. |
| 4 | Entertainment and Trends on Social Media (X4) | (1) Social media trends play an important role in keeping local culture relevant. (2) Entertainment on social media boosts my interest in local traditions. (3) Gained significant knowledge about local traditions through entertainment content on social media. (4) Viral content on social media often promotes cultural heritage. (5) Entertainment content on social media often contains elements of local culture. |
| 5 | Electronic Word-of-Mouth (e-WOM) (X5) | 1. User reviews on social media help me get to know the local culture better. (2) e-WOM on social media encourages me to attend local cultural events. (3) Recommendations from social media users increase my interest in local traditions. (4) I trust user reviews about local culture more than official information. (5) e-WOM plays an important role in spreading information about local culture. (6) Other people's experiences on social media inspire me to learn about local traditions. |
| 6 | Preservation of Local Tradition and Culture (Y) | (1) Social media can serve as an effective tool for introducing local traditions and cultures to the younger generation. (2) The use of local culture-based content on social media can help preserve traditions and cultures that are on the verge of extinction. (3) I often see content on social media that promotes traditional ceremonies and local traditions. (4) The use of local folklore and legends in social media content can help preserve culture. (5) Social media can be an effective tool in introducing local traditions and cultures to the younger generation. |
Table 2.
Descriptive Statistics.
| X1 | X2 | X3 | X4 | X5 | Y | |
|---|---|---|---|---|---|---|
| Mean | 78.095 | 81.031 | 73.730 | 79.000 | 76.698 | 85.296 |
| Std. Deviation | 14.611 | 12.466 | 17.042 | 15.898 | 15.571 | 13.560 |
| Variance | 213.469 | 155.408 | 290.421 | 252.748 | 242.467 | 183.874 |
| Minimum | 42.860 | 37.140 | 22.860 | 40.000 | 30.000 | 40.000 |
| Maximum | 100.000 | 100.000 | 100.000 | 100.000 | 100.000 | 100.000 |
Table 3.
Model Summary - Y.
| Model | R | R² | Adjusted R² | RMSE | R² Change | F Change | df1 | df2 | p |
|---|---|---|---|---|---|---|---|---|---|
| H₀ | 0.000 | 0.000 | 0.000 | 13.560 | 0.000 | 0 | 107 | ||
| H₁ | 0.832 | 0.692 | 0.677 | 7.707 | 0.692 | 45.845 | 5 | 102 | < .001 |
Table 4.
ANOVA.
| Model | Sum of Squares | df | Mean Square | F | p | |
|---|---|---|---|---|---|---|
| H₁ | Regression | 13615.788 | 5 | 2723.158 | 45.845 | < .001 |
| Residual | 6058.731 | 102 | 59.399 | |||
| Total | 19674.519 | 107 | ||||
Note. The intercept model is omitted, as no meaningful information can be shown.
Table 5.
Coefficients.
| Model | Unstandardized | Standard Error | Standardized | t | p | |
|---|---|---|---|---|---|---|
| H₀ | (Intercept) | 85.296 | 1.305 | 65.371 | < .001 | |
| H₁ | (Intercept) | 13.239 | 4.968 | 2.665 | 0.009 | |
| X1 | 0.132 | 0.091 | 0.142 | 1.443 | 0.152 | |
| X2 | 0.532 | 0.104 | 0.489 | 5.108 | < .001 | |
| X3 | 0.071 | 0.080 | 0.090 | 0.888 | 0.377 | |
| X4 | 0.161 | 0.092 | 0.188 | 1.750 | 0.083 | |
| X5 | 0.009 | 0.098 | 0.011 | 0.096 | 0.924 | |
Disclaimer/Publisher’s Note: The statements, opinions and data contained in all publications are solely those of the individual author(s) and contributor(s) and not of MDPI and/or the editor(s). MDPI and/or the editor(s) disclaim responsibility for any injury to people or property resulting from any ideas, methods, instructions or products referred to in the content. |
© 2024 by the authors. Licensee MDPI, Basel, Switzerland. This article is an open access article distributed under the terms and conditions of the Creative Commons Attribution (CC BY) license (http://creativecommons.org/licenses/by/4.0/).
Copyright: This open access article is published under a Creative Commons CC BY 4.0 license, which permit the free download, distribution, and reuse, provided that the author and preprint are cited in any reuse.


