
Submitted:
20 December 2024
Posted:
20 December 2024
You are already at the latest version
Abstract
Alginate hydrogels are integral of many cell-based models in tissue engineering and regenerative medicine. As a natural biomaterial, the properties of alginates can vary and be widely adjusted through the gelation process, making them versatile additives or bulk materials for scaffolds, microcarriers or encapsulation matrices in tissue engineering and regenerative medicine. The requirements for alginates used in biomedical applications differ significantly from those for technical applications. Particularly, the generation of novel niches for stem cells requires reliable and predictable properties of the resulting hydrogel. Ultra-high viscosity (UHV) alginates possess alginates with special physicochemical properties, and thus far, numerical simulations for the gelation process are currently lacking but highly relevant for future designs of stem cell niches and cell-based models. In this article, the gelation of UHV alginates is studied using a microscopic approach for disc- and sphere-shaped hydrogels. Based on the collected data, a multiphase continuum model was implemented to describe the cross-linking process of UHV alginate polysaccharides. The model utilizes four coupled kinetic equations based on mixture theory, which are solved using finite element software. A good agreement between simulation results and experimental data was found, establishing a foundation for future refinements in the development of an interactive tool for cell biologists and material scientists.

Keywords:
Alginate hydrogels
; tissue engineering
; scaffolds
; cross-linking
; multi-phase modeling
; finite element method (FEM)
1. Introduction
1.1. Alginate Hydrogels
Alginate polysaccharides derived from brown algae are often used as excipients or bulk materials in biotechnological and biomedical products. In biomedical applications, these anionic polymers are applied as immobilization matrix of enzymes or cells, carriers for controlled release of pharmaceutical active compounds, wound dressings and tooth impression materials in dentistry.
In medical biotechnology, alginate hydrogels and their derivatives are used as scaffolds, microcarriers and immobilization matrices generating defined cell niches for physiologic cell-based models [1], e.g. for disease modeling [2]] or drug discovery [3]. Furthermore, alginate beads can be modified with extracellular matrix proteins and used in suspension bioreactors for the expansion of anchorage-dependent stem cells [4].
The versatile industrial use of alginates is attributed to their unique physico-chemical properties: they are non-toxic, biocompatible and gel in very mild conditions (ambient temperature, physiological pH, low concentrated and non-toxic cross-linking compounds).
Chemically, alginates are composed of unbranched polymers of the monomers β-D-mannuronate (M) and α-L-guluronate (G) which are linked via glycosidic bonds. The variation of the G/M ratio and the composition of homogeneous MMM- and GGG-polymer blocks or heterogeneous GMG/MGM polymer blocks are characteristic of different algae species and are influenced, e.g., by their local habitats or seasons. During cross-linking, mainly G-blocks interact with multivalent cations such as Ca2+, Ba2+, and Fe2+, forming the so-called egg-box structure. This interaction results in hydrophilic hydrogels with a water content of more than 98% [5]. The mechanical properties (e.g. stiffness, general stability) of gelled hydrogels depend on a variety of parameters such as the type of the cross-linking ion, its concentration, or overall cross-linking time. In the past decades, ultra-high viscosity (UHV) alginates [6,7] have been extensively studied and established as promising biomaterials in regenerative medicine and tissue engineering [8]. In contrast to other commercially available alginates, UHV-alginates differ mainly by having tenfold longer polymers while possessing the same chemistry and cross-linking mechanisms [8]. Furthermore, some special UHV-alginates are characterized by sterility, low endotoxin levels and overall high purity [9].
These special characteristics of the biomaterial result in low immunogenicity, high cell compatibility, high mechanical stability, higher chemical resistance, and higher elastic modulus, making this biomaterial suitable for applications in medical biotechnology.
1.2. Simulation/Model of Alginate Hydrogel Formation
Throughout the past few decades, simulations have provided a valuable and insightful way to gain insight into the formation of alginate hydrogels. For simplification, these mathematical models tend to focus on a few, or sometimes a single, aspect of this process. Stewart et al. [10] created a molecular dynamics (MD) simulation to investigate the complexation of poly-M and poly-GM oligomers with sodium and calcium ions, resulting in an alginate gel. Previous studies focused primarily on poly-G sequences [11,12,13]. They observed that all conducted simulations resulted in complexation with Na+ and Ca2+ ions, regardless of the used oligomer sequence. The formation of the „egg-box” structure appeared to follow the order of GG > MM > GM in terms of reaction preference. These findings suggest that poly-M regions may play a role in secondary cross-linking interactions.
Nair et al. [14] determined the mechanical properties of alginate-based 3D scaffolds using an in silico model, created from experimental data. They found that the Ogden hyperelastic model was the most suitable to describe the nonlinear behavior of alginates, compared to other hyperelastic material models. This model was then modified, so that the material constants became a function of alginate concentration and viscosity, which allowed them to analyze the effects of physical and geometric parameters such as porosity on the stress-strain curve. All their tests were validated against experimental data and showed a good level of agreement.
A micro-mechanical constitutive model was developed by Külcü et al. [15] to describe the nonlinear inelastic properties of alginate double network hydrogels by characterizing the elongation of the polysaccharide polymer chain after it has been fully stretched. They employed the Arruda-Boyce eight-chain model [16], the network decomposition approach [17,18] and the network alteration concept [19] to create a new energy function, describing the enthalpic and entropic behavior of a single polymer chain. This approach yielded good agreement with experimental results.
Mikkelsen et al. [20] proposed a mathematical model that describes calcium-induced 3D alginate gel formation using a set of coupled chemical reaction-diffusion equations. They used measurements from 1D gels to provide the necessary parameter values. Thu et al. [21] took experimentally determined gradients, gathered through MR-microimaging and SRIXE, from 3D gels to reevaluate these previous parameter estimates, e.g. the relative alginate diffusion coefficient and the reaction rate constant. The updated simulation model was then capable of producing results in good agreement with both 3D and 1D experimental data, obtained under various experimental conditions. Data comparisons supporting these claims were not included. Bjørnøy et al. presented an experimental framework for the gelation of low viscosity alginate with calcium concentrations higher than 50 mM. The main focus of their work is on the experimental toolbox to understand the gelation and mineralization of alginate hydrogels, only minor emphasis placed on the numerical modeling of this process [22].
1.3. Analysis of Hydrogel Cross-Linking Process
So far, numerous in vitro studies have been conducted to understand the correlation between type and concentration of the cross-linker and the resulting hydrogels. Since it is very challenging to differentiate between the transition of sol and gel states of hydrogels, researchers have found several approaches to quantify this process. Huynh et al. studied the gelation kinetics of polygalacturonate with four different divalent cations by using the changes of turbidity during sol-gel transition. With this method, they were able to determine, for examples, the diffusion coefficients of different cross-linker concentrations [23]. Despite the promising results of this method, it depends on the changing turbidity during gelation and is thus not universally applicable to hydrogels. Another approach for visual analysis of ion occurrence was presented by Cheng et al. In the context of an electro-induced gelation mechanism, they utilized a pH-dependent release of Ca2+ ions from CaCO3 and monitored the gelation process with a Ca2+-dependent fluorescent dye. Although this method delivers data to follow the alginate cross-linking kinetics, it is primarily limited to Ca2+ induced gelation processes due to the specificity of available ion or metal indicators [24,25]. Photon Correlation Imaging was employed to investigate the cross-linking process in small volumes of alginates by Secchi et al. [26]. Hajikhani et al. proposed a chemo-mechanical model for alginate cross-linking based on their experimental data with commercial sodium alginate for bioprinting applications. They focused on diffusion and reaction kinetics, incorporating the resulting finite strains and shrinkage effects caused by syneresis. Additionally, they accounted for the crosslinking reaction rate dependence on internal gelling mechanics, establishing a two-way coupling between chemistry and mechanics [27,28]. Stößlein et al. proposed a method that allows the in-situ determination of alginate cross-linking by mechanical texture analysis. In their study, they compressed large alginate beads until rupture after different cross-linking times and measured the applied forces. They demonstrated a strong correlation between guluronate content and applied pressure of different types of alginates [29]. Cesewski et al. described in their study a cantilever-based method for real-time monitoring of alginate cross-linking process [30], while Potter et al. studied the cross-linking of alginate with Ca2+ process by magnetic resonance imaging [31]. Bjørnøy et al. analyzed the cross-linking kinetics of low-viscosity alginates in the presence of Ca2+. In their work, they imaged the cross-linking front by dark field and confocal laser scanning microscopy of regularly formed alginate discs or beads [32]. In their study, they used a modified numerical model originally presented by Thu et al. [21]. Furthermore, they studied only low- and medium- viscosity alginates and used cross-linker concentrations higher than 50 mM [32]. Hu et al. investigated the diffusion properties of various alginate formulations using different gelation baths. However, they performed experiments and tested the diffusion properties of the resulting beads with fluorophore-labeled bovine serum albumin but did not conduct any numerical simulation [33]. Li et al. [34] studied the gelation of alginate using different cross-linker concentrations and measured, for example, the swelling behavior, transparency, or FT-IR spectra. However, despite the new insights gained in alginate interaction with Ca2+, only low or medium-viscosity alginates were used, and numerical modeling has not been performed.
Besiri et al. used a rheometer approach with a modified rheometric setup to analyze the gelation of technical low viscous alginate using CaCl2 [35].
An assessment of the polymer gradients using synchrotron radiation-induced x-ray emission, magnetic resonance microimaging, and mathematical modeling [21] was conducted by Thu et al. The study primarily focused on the inhomogeneity of alginate microbeads and not on the gelation kinetics. Furthermore, ultra-high-viscosity alginates were not considered in the study and gelation conducted with Ca2+-ions.
The numerical model presented in this study employs a reaction-diffusion approach to the gelation process. While others [22,28] have taken, modified and expanded on the framework developed by Mikkelsen and Elgsaeter [20], this work aims to explore a different numerical approach. Additionally, this study focuses on barium instead of calcium as the crosslinking ion in the process of egg-box formation.
1.4. Alginate Hydrogels in Tissue Engineering and Regenerative Medicine
In biotechnological applications, alginate hydrogels have been used for several decades primarily as an immobilization matrix for therapeutically relevant cells [36,37,38,39]. The discovery of induced pluripotency [40,41] with the possibility of deriving virtually any somatic cell type of the human body in vitro was a game-changer for regenerative medicine and tissue engineering. With the availability of these cell systems, there has been a growing demand for cell type-specific environments that replicate in vivo conditions more accurately compared to standard plastic dishes [42,43,44].
The rational design of the stem cell niche to provide tissue-specific environments combines soluble factors, adjacent cell types, specific proteins of the extracellular matrix, the topography of the adhesion site, and the mechanical properties of the bulk material. Cell-type adapted niches lead to in vivo-like behavior of the cells and, in consequence, to valuable data when these cells are used as models for drug screening, cytotoxicity and disease modelling. If these properties differ from the native environment, e.g. the cultivation on (stiff) 2D surfaces instead of the actual 3D environment [42,45], it could consequently lead to incorrect dose responses if these models are used in drug testing screenings, e.g., for personalized medicine, as shown for breast cancer drugs by Imamura et al. [46].
The mechanical properties of native tissue vary from very soft (e.g., brain) to ultra -stiff (e.g., bone) [47]. In alginates, gelation is the fundamental mechanism responsible for the mechanical properties. As described in section 1.1. multivalent cations interact with adjacent guluronic acid blocks and form the hydrogel. Depending on the chemical composition of the alginates used as well as the reaction conditions (time, cation concentration), softer or stiffer hydrogels can be produced. The alginate hydrogels can be used as a soft growth surface for stem cells [1,4] or as immobilization matrix for therapeutically relevant cells [8]. The mechanical stimuli, either from the surface or the surroundings, are linked through cell-matrix contacts to the interior of the cell and can trigger molecular pathways (mechanotransduction) [48,49]. In pluripotent stem cells, the so-called rigidity-dependent YAP/TAZ signaling pathway influences the cell during neural differentiation [50].
1.5. Rationale Predicting Alginate Hydrogel Gelation
In cell biology, protocols for generating soft 2D and 3D environments are available but are primarily driven by concentration and time. Furthermore, the final properties of the hydrogels are often characterized empirically, and changes in gelation conditions can only lead to a relative characterization of the hydrogel (“softer”, “stiffer”). Besides the chemical conditions of the reaction, the volume of the alginate to be gelled can be altered, e.g., if the cell culture substrate must be changed. Higher volumes with the same gelling conditions lead to inhomogeneous or only partailly gelled hydrogels. In general, the produced hydrogels must be reliable and their mechanical properties comparable, but an intensive quality control and characterization is often not feasible, require special hardware and expertise, and is in addition time consuming.
Gelation is also affected by encapsulated cells, whether single cells or multicellular aggregates. In the worst case, this influence can lead to critical structures or inhomogeneous gelation, which potentially triggering biological responses. A possible example of this is immuno-transplantation [9]. Overall, a predictive tool for the gelation of hydrogels is in high demand and would also be useful for cell biologists producing tissue-specific hydrogel surfaces or for quality control in regenerative medicine. In this study, the fundamental gelation kinetics will be modeled based on experimental data and validated in initial real-world scenarios.
The gelation history also significantly impacts the resulting properties of a cross-linked alginate construct [51]. For example, the diffusion properties of cross-linkers change noticeably after the alginate solution undergoes the cross-linking process [52]. This also affects the availability of open alginate cross-linking sites [53]. Both of these factors may result in irregular cross-linking within a gelled alginate structure, as well as mobility, concentration, and mechanical gradients, which conversely impact local cross-linking rates [51].
Overall, a numerical model that can predict the gelation behavior and the mechanical properties of alginate hydrogels is still lacking. Furthermore, a tool that can assist scientists to gel alginates for distinct biological cell models is currently unavailable. In this work, the fundamental numerical simulation for a software tool will be presented. This tool will be further enhanced in the future to provide biologists and material scientists with a virtual supervisor to produce highly defined alginate hydrogels for their applications.
2. Materials and Methods
2.1. Disc-Shaped Alginate Gelation Kinetics Study
Alginate hydrogels from brown algae Lessonia nigrescens and Lessonia trabeculata were purchased from alginatec GmbH (Riedenheim, Germany). In this study, a 1:1 mixture (vol%/vol%) of both alginate species were used. The alginates were solved in saline (0.9%, B. Braun Melsungen AG, Melsungen, Germany). The dynamic viscosity of the mixture was characterized using the rheometer MCR 92 (Anton Paar GmbH, Ostfildern, Germany) and was 3306 (± 78 mPa∙s). The different cross-linking solutions were prepared with 115 mM NaCl and 10, 20, and 40 mM BaCl2 (Merck KGaA, Darmstadt, Germany). The osmolarity of all cross-linking solutions were adjusted to 270 mOsm/l. Alginate sol were pipetted on Nunc EasYDish dishes (ThermoFisher Scientific GmbH, Dreieich, Germany) and covered with silicone spacer (Grace Bio Labs, Merck KGaA, Darmstadt, Germany, CoverWell incubation chamber, 20 μl volume, 13 mm diameter and 200μm height). To facilitate the injection of cross-linking solutions, two thin channels were punched into the silicone wall. Dishes and silicone spacer were cleaned with desalted water in an ultrasonic bath and air dried before usage. One droplet of alginate (4 μl) has been carefully pipetted in the middle of the petri dish and covered with the silicone spacer. Enclosed air bubbles occurred rarely and did not influence the gelation process. Image acquisition has been started and 20 μl of the cross-linker solution has been pipetted through the inlet to fill the whole chamber and start the gelation process. Time lapse movies were acquired using a standard phase contrast microscope (Eclipse Ts2, Nikon Instruments, Duesseldorf, Germany) with 4x magnification. Images were captured automatically with a mounted camera (DMK 33UX174 and software IC capture 2.4, both The Imaging Source Europe GmbH, Bremen, Germany) in the following intervals: 0 to 5 min: each 10 s, 5 min to 15 min: each 20 s and for the rest: each 40 s. Captured images were analyzed using the IC Measure software (The Imaging Source Europe GmbH, Bremen, Germany).
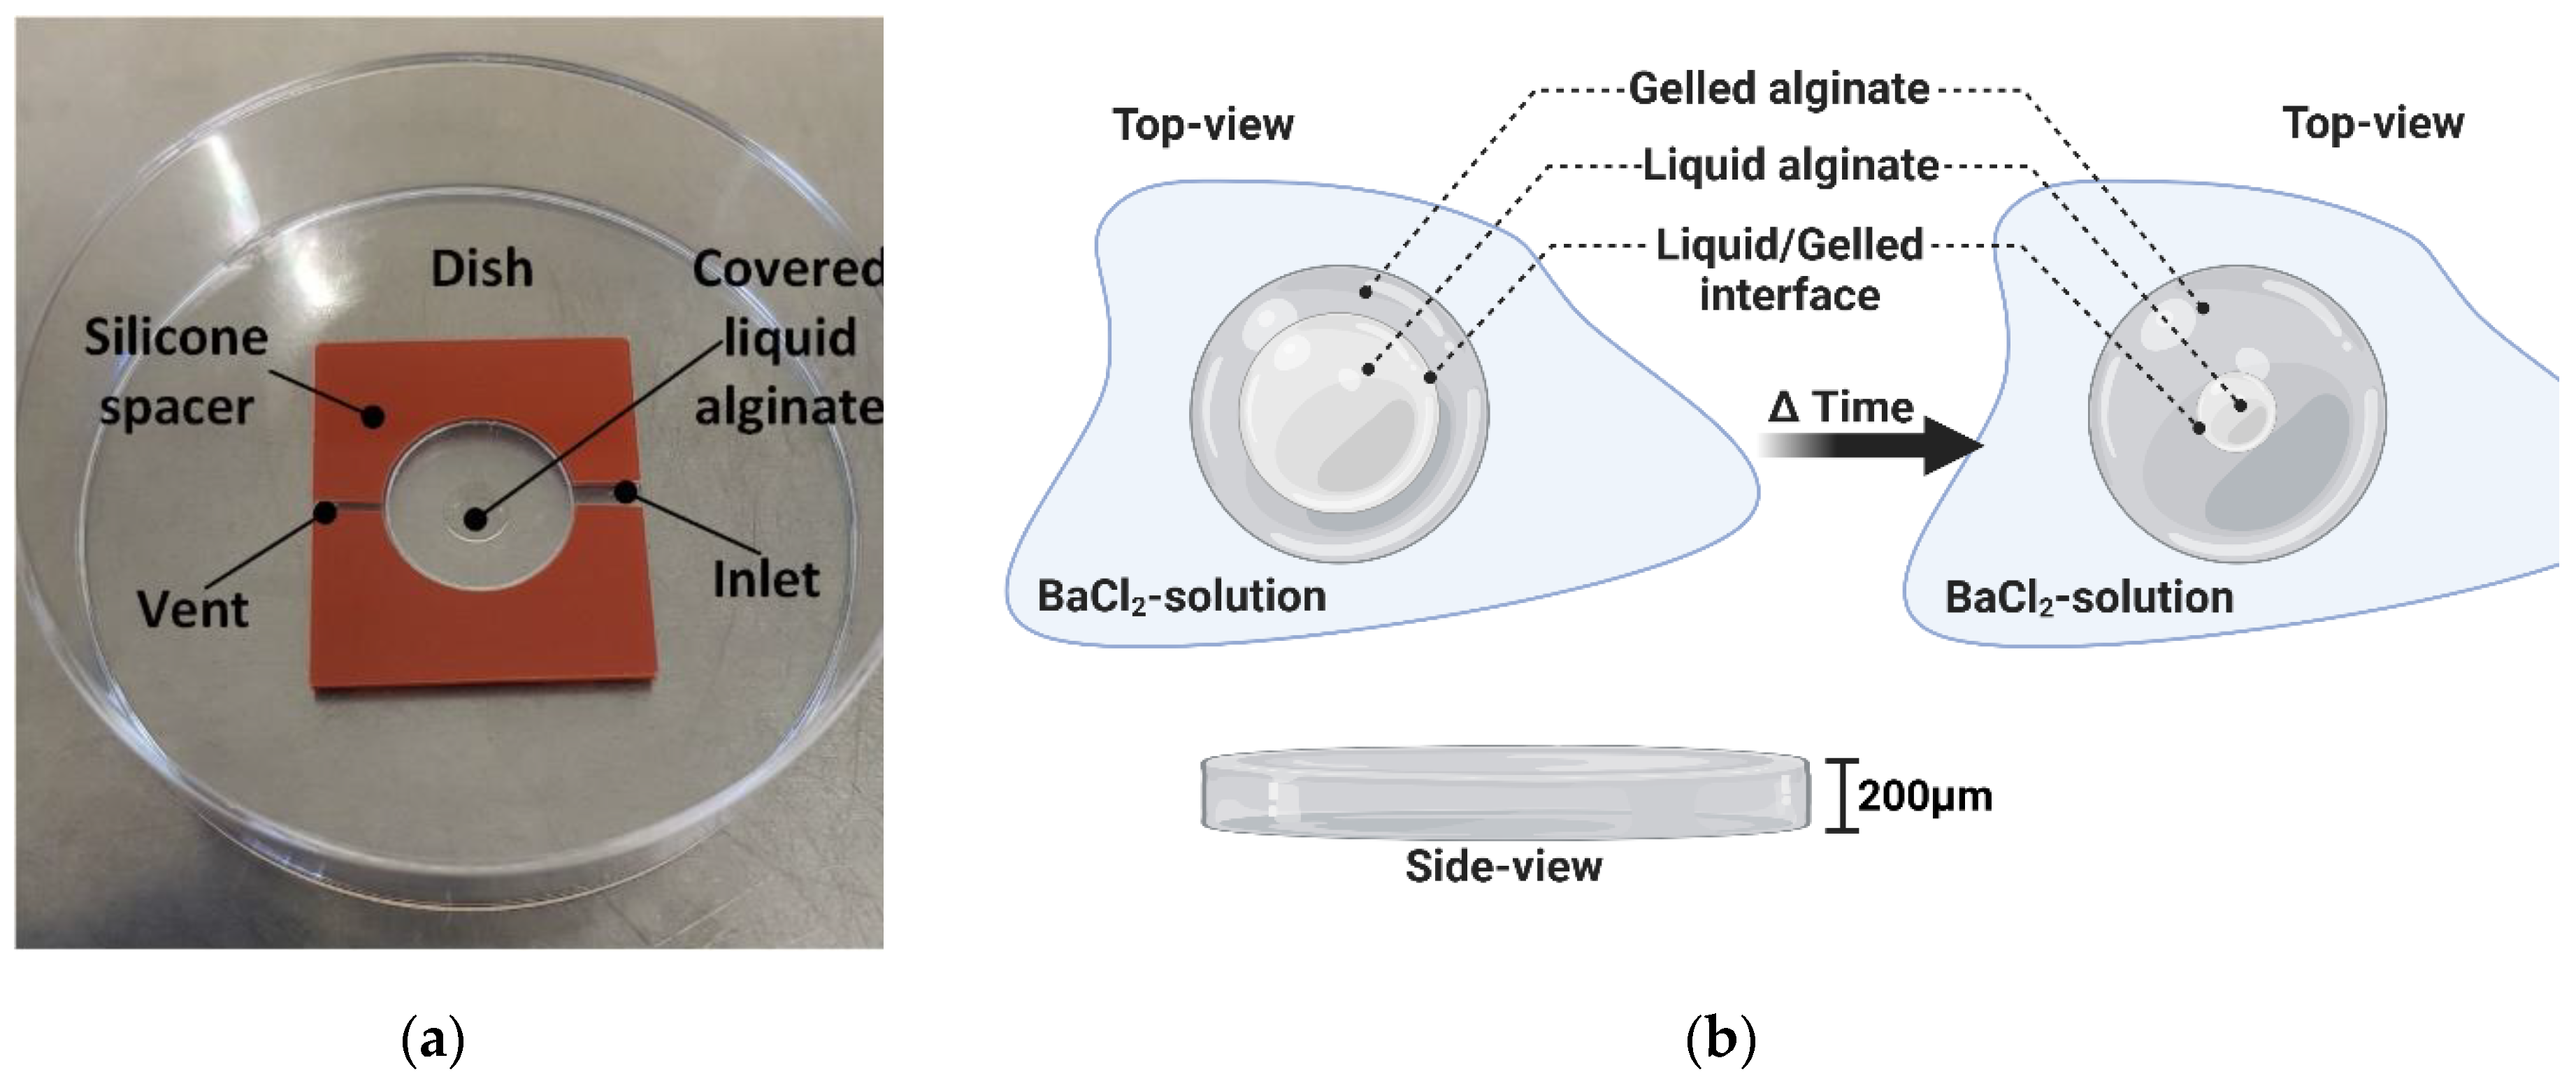
Figure 1.
Setup and principle of observing the gelation process. (a) A thin disc-like volume of alginate is poured into a dish and covered by a thin silicone spacer for gelation with different BaCl2-solutions. This process can be observed using phase contrast microscopy and a concentric decrease in the travelling liquid/gelled interface can be tracked and used for quantification of the gelation process. (b) Schematic drawing in two different time points of alginate gelation. The disc-like volume of alginate is surrounded by the BaCl2 cross-linker solutions and, consequently, barium (and chloride) ions diffuse into the alginate sol triggering the gelation that can be tracked by the traveling liquid/gelled interface over time. The diameters of the circular interfaces decrease over time and disappear after complete gelation of the alginate discs. (b) generated with BioRender.com.
2.1. Sphere-Shaped Alginate Gelation
Alginate hydrogels from the brown algae Lessonia nigrescens and Lessonia trabeculata were purchased from alginatec GmbH (Riedenheim, Germany). For the disc-shaped alginates, a 1:1 mixture (vol%/vol%) of both alginate species were used. The alginates were dissolved in saline (0.9%, B. Braun Melsungen AG, Melsungen, Germany). The dynamic viscosity of the mixture was characterized using a rheometer (MCR 102, Anton Paar GmbH, Ostfildern, Germany) and was 2041 (± 12) mPa∙s.
To determine the crosslinking kinetics of alginate beads, different crosslinking solutions of barium chloride (Merck KGaA, Darmstadt, Germany) were prepared at concentrations of 10 mM, 20 mM, and 40 mM. The osmolarity ranged from 291 to 301 mOsmol/l. 100 µL of each crosslinking solution was transferred into a 96 U-bottom well plate (Greiner Bio-One GmbH, Frickenhausen, Germany). The addition of alginate to the crosslinking solution was performed by dropping 5 µL with a pipette. Video sequences of the crosslinking process were captured using a 4x phase contrast objective. For observation of shrinkage, additional images were acquired after 180 min, while the samples remained in their respective barium chloride solutions. A Nikon Eclipse microscope TS2 coupled with a DS-Ri2 camera (Nikon Instruments, Duesseldorf, Germany) was used for this analysis. The samples were kept at room temperature. Video sequences and images were processed using NIS-Elements Advanced Research (NIS AR 5.41.00, Nikon Instruments, Duesseldorf, Germany).
The cross-linking progress was analyzed every five seconds, starting from 15 to 20 seconds after dropping the alginate into the cross-linking bath. The cross-linking progress was observed as long as the cross-linking front was visible, for a maximum of 290 seconds. The diameters of the cross-linking fronts were plotted for all five replicates over time, and the speed of the cross-linking front was determined by linear fit.
2.2. Modelling
2.2.1. Basic Assumptions
In the following investigation it is assumed that the alginate hydrogel consists of a polymer , an aqueous solvent and barium ions . During the cross-linking the barium ions form bonds between the molecules of the polymer resulting in the cross-linked polymer (see also Figure 2a). The model is developed on the basis of a multi-phase continuum description, i.e. a mixture theory is chosen as starting point. Therefore, not the individual molecules or ions are investigated but certain amounts of them occupying a representative volume element.
The amount of mass of the individual molecules is represented by the partial densities where {poly, w, ba, cross} indicates the above-mentioned constituents.
Figure 2b shows a representative volume of size (RVE) which contains mols of polymer molecules each of molar mass , free barium ions of molar mass and water molecules of molar weight . Only one cross-linked polymer molecule is present in the RVE. Its molar mass is increasing during the cross-linking according to the number of polymers being added to the cross-linked one and the required number of barium ions. In consequence the number of polymers and of barium ions is decreasing during cross-linking. The water content is not influenced by the cross-linking because it is acting as a solvent only.
The partial density of the constituents inside the RVE is defined as the ratio of its mass to the occupied volume . Using the number of molecules per volume and the molar weight the partial density of the constituent in the RVE is expressed as
While the total mass in the RVE is equal to the sum of the partial masses the mixture density is obtained as
2.2.2. Mixture Theory
In the following a continuum mixture theory is applied as the basis of the model. The concept assumes that the RVE introduced in section 2.3 is small compared to the macroscopic dimensions and, therefore, it is treated as a spatial point in the continuum description located at a position x. This leads to the concept of superimposed continua because the RVE is simultaneously filled by all constituents, each of them described by its partial mass density.
In addition to the mass exchange between the constituents , and the mass in the RVE can also change due to the flux of molecules/ions of the individual constituents over the boundary of the RVE. Balancing the mass flux over the boundary of the RVE with the change of mass inside the volume and the mass exchange leads to the local formulation of the mass balance of the constituent
Here, is the macroscopic velocity of the constituent and the operator div is the divergence with respect to the spatial position x. The situation is captured in Figure 2b, where a magnification of the point at location x shows the RVE.
Following Truesdell’s metaphysical principles of mixture theory the balance of total mass is obtained by summing up the mass balances of the individual constituents. Furthermore, the format of this balance must be identical to the balance equation of a single-phase continuum. Summation of (3) yields
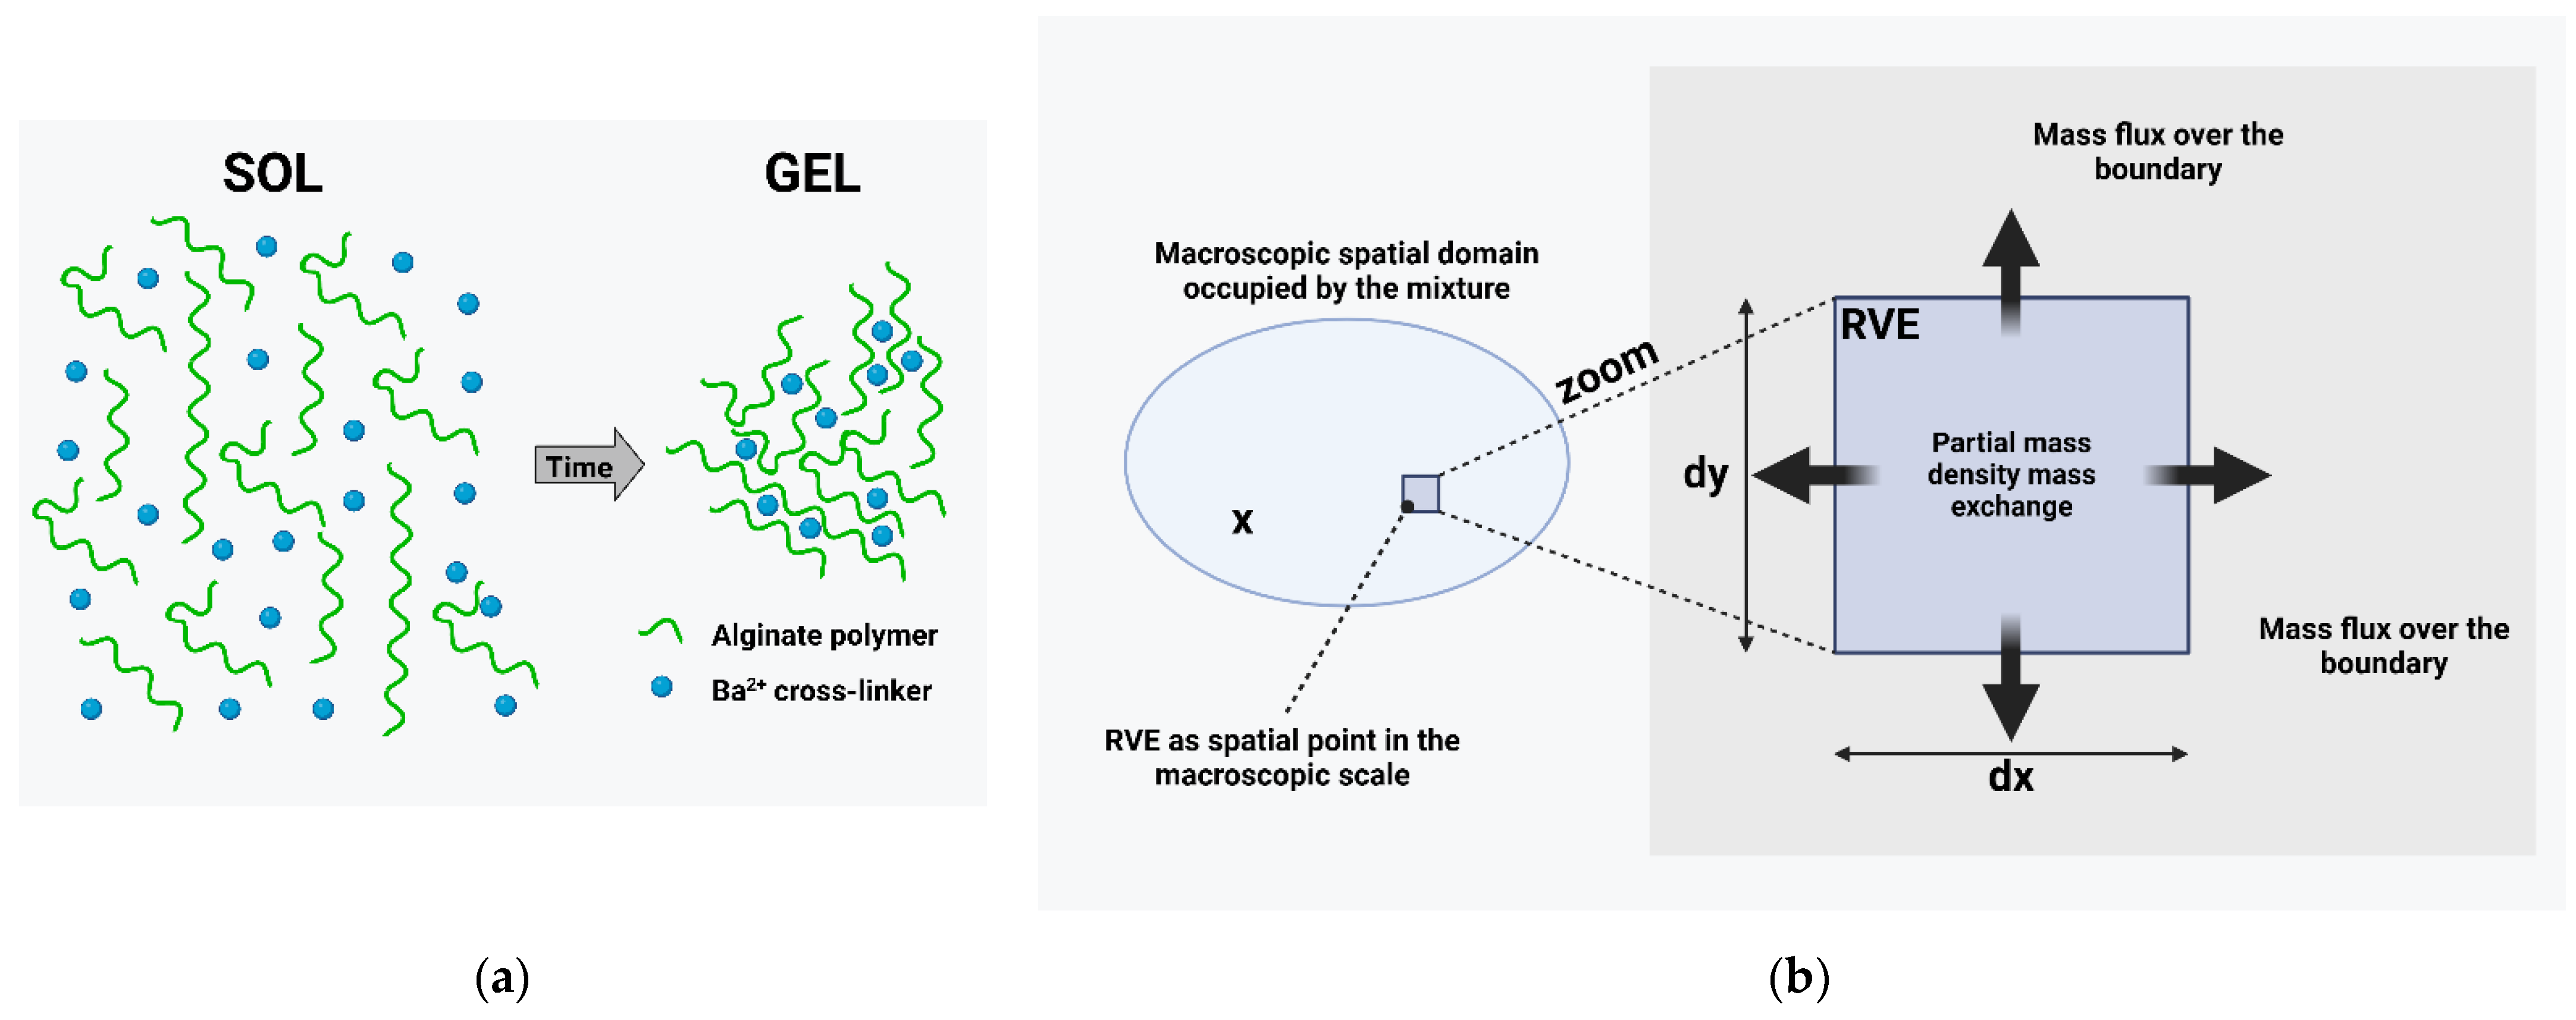
Figure 2.
(a) Representative volume filled with the free polymer, barium ions and cross-linked polymer and water (not shown). (b) Macroscopic domain and RVE as magnification of a spatial point. The mass of constituent φα inside the RVE changes due to the flux over the boundary and the mass exchange. Created with BioRender.com.
This result is identical with the mass balance of a single-phase continuum if (2) is substituted into the first term and if the barycentric velocity or mixture velocity is defined according to
Furthermore, the total mass is conserved. This requires that the sum of the mass exchange terms is zero
In the same manner further balance equations can be derived, e.g. the balances of momentum and of energy, cf. e.g. Truesdell [54], Bowen [55], etc. As a simplification it is assumed that during the cross-linking process the barycentric velocity is zero, i.e. there is no average macroscopic motion. But the individual constituents may move. To describe this relative motion of with respect to the center of mass of the mixture, which stays at rest, the diffusion velocities are introduced by
Using the definition (2) of the mixture mass density and the definition (5) of the barycentric velocity it can be proven that
With the definition of the barycentric velocity (5) and the diffusion velocity (7) the mass balances can be re-written as
In further investigations it is assumed that the diffusion velocities and their changes are small. Therefore, the associated change of momentum is small. This avoids a detailed study of the balances of momentum for the individual constituents and the diffusive mass fluxes
can be prescribed by constitutive equations. In the present case diffusion is the main driving force. Therefore, the flux terms are governed by Fick’s second law. For simplicity the barycentric motion is not further investigated during the cross-linking, i.e. no external loads are applied to the mixture,
Based on the above-mentioned assumptions the cross-linking model consists of the four balance of mass equations
and the constraints
2.2.3. Constitutive Equations
For the following investigations the aqueous suspension is neglected, and the polymer, cross-linked polymer and barium constituents are investigated only. During the cross-linking the mass density of the cross-linked polymer is increasing while the densities of the barium ions and the polymers are decreasing. Considering the constraint (6), the mass production for the cross-linked polymer is given by
The probability for the formation of a new node in the cross-linked polymer network is increasing with the amount of available barium ions and with the amount of free polymers. These effects are reflected by the constitutive assumptions
While one polymer can link several ions to the network, a second term is introduced in (20) with the following interpretation: While describes the initial connection of one polymer to the cross-linked polymer, which requires one barium ion, a further cross-linking can take place. After the polymer became part of the cross-linked polymer, the remaining free positions can absorb further ions until all possible positions are occupied by barium ions and the maximum amount of cross-links is formed in the cross-linked polymer. This effect is described by the additional internal variable defined as the ratio of occupied bindings to possible bindings. The term is a measure of the free binding positions. The evolution of κ is driven by a reaction equation
During the formation of the polymer network, the diffusion motion of the cross-linked polymer is neglected, i.e.
This assumption implies that a swelling of the cross-linked polymer is currently not included in the model for simplicity. In contrast the polymer constituent and the barium ions move with respect to the stationary cross-linked polymer. When the motion is mainly driven by diffusion an appropriate choice for the mass fluxes is Fick’s law
The size of ions is much smaller than the size of the polymers, therefore, the diffusion constant is several orders of magnitude bigger than
During the cross-linking the mesh size of the cross-linked polymer is decreasing. This drastically hinders the diffusion motion of the polymers but also the diffusion motion of the barium ions. For both diffusing constituents an exponential function is chosen relating the current value of the diffusion constant to its initial value
Due to the different sizes of the ions and the polymers the constants are different.
2.3. Implementation
A set of kinetic differential equations based on the previous chapter is used to describe the local accumulation and depletion of mobile alginate, cross-linked alginate and cross-linking cations [54]. These kinetic differential equations are given as a set of diffusion-reaction equations (27-30).
This numerical model was implemented using the FEM software COMSOL Multiphysics® v6.2. (COMSOL AB, Stockholm, Sweden) The simulations are run on a workstation containing a 16-core 11th Gen Intel® Core™ i9-11900K CPU and 64 GB of RAM.
The model parameters, which are given in Table 1, were optimized to achieve the best fit between the simulation results and the experimental data.
3. Results
3.1. Alginate Gelation
The gelation process from the alginate sol to the alginate hydrogel was analyzed by tracking a thin traveling front line from the outer edge to the center of the alginate disc. In a non-invasive analytical approach, this process was quantified using phase contrast microscopy and subsequent manual image analysis. Representative time-lapse sequences of cross-linking experiments are illustrated in Figure 3a (10 mM BaCl2), Figure 3b (20 mM BaCl2), and Figure 3c (40 mM BaCl2). Due to the low contrast of the gelation interface, images in these figures were enhanced for better visibility by FFT Bandpass Filter of ImageJ (Fiji, parameters “filter large structures down to” 50 pixels, filter small structure up to 3 pixels, tolerance of direction 5%, with activated autoscaling and saturate image option).
The data reveal that the general course of the traveling liquid/gelled interface is comparable for all studied cross-linker concentrations (10 mM, 20 mM, and 40 mM, Figure 4a). The kinetics of all studied concentrations can be classified into two phases: the first phase at the beginning with a fast-traveling visible front line followed by a phase with a slower but also linear course. In addition, we observed a more decreasing slope/velocity in Figure 4a with increased cross-linker concentration, resulting in a faster gelation time of the alginate drop (Figure 4b). The velocity of gelation in this work is defined as reduction of ungelled core and negative.
The investigation of the cross-linking kinetics of three different BaCl2 concentrations with comparable osmolarities was performed using UHV-alginate microcarriers by dropping 5 µL into the cross-linking bath. The cross-linking front was observed microscopically, and the advance of the front was measured by analyzing the diameter of the front over time. Since the sizes of the spheres differ from 1210 to 1705 µm, the initial sizes of the cross-linking fronts differ as well and require accordingly more or less time to reach the core of the spheres. The cross-linking fronts in the replicates with 10 mM BaCl2 need 145 to 290 seconds to reach the core and are strongly dependent on the sphere’s diameter.
Figure 5b shows the diameter of the cross-linking front over time for a 20 mM BaCl2 cross-linking concentration. In all five replicates, the decrease in size over time was observed, with a steeper decrease than in Figure 5a. Since the sizes of the spheres differ from 1124 to 1885 µm in size the initial size of the cross-linking front differs as well and needs accordingly more or less time to reach the core of the spheres. The cross-linking fronts in replicates with 20 mM BaCl2 require 100 to 200 seconds to reach the core and are strongly dependent on the sphere’s diameter.
Figure 5c shows the diameter of the cross-linking front over time for 40 mM BaCl2 cross-linking concentration. In all five replicates, the decrease in size over time was observed, with the steepest decrease compared to Figure 5a and Figure 5b. The sizes of the spheres have comparable diameters (1790 to 1940 µm). Accordingly, the initial sizes of the cross-linking fronts are comparable as well and require accordingly almost the same time to reach the core of the spheres. The cross-linking fronts in replicates with 40 mM BaCl2 need 120 to 150 seconds to reach the core and are also strongly dependent on the sphere’s diameter.
Overall, the tendency of cross-linking velocities of discs and spheres is comparable (Figure 4b and Figure 5d). The velocity of gelation in this work is defined as reduction of ungelled core and negative. The gelation results for spheres show the fastest cross-linking front for 40 mM BaCl2 with a subsequent decrease with decreasing BaCl2 concentration (40 mM > 20 mM > 10 mM, Figure 5d).
3.2. Numerical Solution
A time lapse sequence of the obtained simulation results for each cross-linker concentration (10 mM, 20 mM and 40 mM) is depicted in Figure 6, analogue to Figure 3. As previously mentioned, there is currently no shrinking behavior implemented in the model, leaving the alginate discs at the same diameter throughout the gelation process. These simulations are completed in similar amounts of time as the experimental tests, with 10 mM being slightly slower (3 min difference) and 20 mM and 40 mM being slightly faster (3 min and 4 min difference respectively). This difference, however, is mostly caused at the end of the simulation, when the gelation front shows an increase in speed, which does not happen in the experiments (see Figure 7). Otherwise, the two phases of fast front propagation followed by a slower linear phase are also present here.
The simulation results of gelation in Figure 7 are also available in the Supplemental Information as video sequences (Alginate-Disc_gelation_sim_10mM.avi, Alginate-Disc_gelation_sim_20mM.avi and Alginate-Disc_gelation_sim_40mM.avi).
4. Discussion
4.1. Alginate Gelation
In this study, the gelation kinetics were investigated using an image-based approach and a numerical model created based on the chemical reaction and the collected data. The experimental data reveal a correlation between the cross-linker concentration, the velocity of the traveling gelation front, and the overall gelation time. For the first time, the gelation kinetics of UHV-alginates were analyzed in detail using the described optical approach. In the literature, the general phenomenon is described for low-viscosity alginates [22], but no systematic study for UHV-alginates with a barium concentration lower than 50 mM had been conducted so far. In this study, the shape of the alginate was disc-like, as this allowed for higher throughput and better analysis. Although our preliminary data suggest that this kind of analysis is also feasible for sphere-like, free-floating alginates, it requires higher effort for analysis. The gelation kinetics reveal a strong dependency on the cross-linker concentration used. The main driver of this observation may be the diffusion of the barium ions through the alginate network. The greater the initial cross-linking concentration, the higher the gradient from the outside to the interior of the hydrogel. Due to the high concentration, barium is available in excess for the gelation reaction, and in consequence, no slowdown of the gelation front occurred in the linear phase. The approach described in this study is furthermore capable of analyzing the influence of small cargo (cells or organoids) or debris (protein agglomerates) on gelation behavior.
The data also suggest shrinkage of the alginate discs, probably caused by syneresis (the release of water during gelation). This shrinkage is not yet accounted for in the current numerical model. Since shrinkage (or syneresis, respectively) provides additional insights into the gelation kinetics, especially when two different alginate species are used. Alginates from LN contain more flexible heterogeneous MG/GM blocks, which enable coiling of polymers during gelation leading to shrinkage of the hydrogel. Syneresis in alginates is complex and the influence of the different components of gelation must be taken into account [55]. In further studies, the alginate composition, concentration of the cross-linking agent, and shrinkage will be studied in detail to further enhance the current numerical model.
The course of alginate gelation in spheres is strongly dependent of barium concentration. This observation was expected since a in a higher barium-concentrated solution, more ions are available to cross-link the alginate and the time, in which an ion finds a spot to cross-link a G-monomer is shorter. Therefore, it diffuses the fastest to the core of the UHV-alginate sphere. At the lowest concentrated BaCl2 solution, the availability of barium ions is lower, and it takes more time to find a cross-linking spot; therefore, it takes more time for the cross-linker to reach the core of the UHV-alginate sphere.
Overall, it seems that the optical observation of gelation kinetics is independent of the shape and volume of the alginates. Therefore, it will serve as a powerful and user-friendly experimental tool to further enhance the numerical model.
4.2. Layer-Wise Gelation
The microscopic images reveal a layer-like structure of the alginate discs. Over time, the number of layers at the outer surface increases. Similar structures have been described by Ehrhart et al. [56] and Jeong et al. [57]. In both studies, the depot of multivalent cations was the gelled alginate bead itself, which was suspended in liquid alginate. Thin alginate layers formed during gelation due to the diffusion of multivalent cations from the bead to the bead-alginate interface. A shell-wise gelation of alginate beads was also described in a review by Leong et al. [58] and Voo et al. [59]. In their study, Voo et al. found that highly concentrated (10% w/v) low-viscosity (LV) alginates form a multi-layer internal structure. Interestingly, this structure differs from low-concentrated (2% w/v) LV-alginates. Low-concentrated LV alginates resemble a more sponge-like structure with small cavities (pores). The different structures and arying degrees of homogeneity can be explained by the relative diffusion rate of alginate and the multivalent cation [59].
The experiments in this study were not designed to reveal the mechanism of layer formation during the gelation of UHV-alginates. However, initial interesting findings were made, indicating that such layer formation can be observed non-invasively during gelation with phase contrast microscopy (Figure 8a). In the given example, the thickness of the adjacent layers was approximately 15 to 30 µm for the 10 mM condition. These initial findings were summarized in Figure 8b. It can be hypothesized that the layer formation of UHV-alginates differs from the findings of LV-alginates, as polymers with higher molecular weight lead to differences in layer thickness.
For a detailed analysis and correlation with crosslinker concentration, alginate composition, and alginate concentration, a microscopic analysis with higher resolution and magnification must be conducted in further studies. By using alginates with different interactions with multivalent cations, these layers could help to understand the diffusion rates of the cations and polymers in UHV-alginates. In this context, future models will also consider the step-wise interaction of barium ions with alginate chains as presented for calcium by Zhou et al in a population balance model [60]. This model will be integrated and combined with the findings of layer-wise gelation to more precisely project the properties of the alginate gels at the hydrogel’s surface.
4.3. Numerical Simulation
Overall, the presented model achieves a satisfactory level of agreement with the experimental data and offers a strong starting point for subsequent improvement and expansion.
The sudden acceleration towards the end of Figure 7 could be due to variations in mesh refinement between the center and the outer rim of the circular domain. These adjustments may also help resolve the formation of steps observed in simulation results at smaller cross-linker concentrations. However, both issues are still being actively investigated. The spikes or abrupt increased at the very end of the graphs result from the automated front calculations detecting minor movements and simulation artifacts, as the primary reaction front has nearly dissipated.
Computation time can vary significantly depending on model parameters and the size, complexity and refinement of the used geometry mesh.
5. Conclusion and Outlook
In addition to the gelation of perfect hydrogels without any cells, cargo, or air bubbles, the experiments conducted also revealed the behavior of the cross-linking front after passing through some inclusions (debris). The acquired images revealed some swirling structures of the cross-linked hydrogels directly after the gelation front hits the object (data not shown). These structures, especially in high cell density immobilization applications such as bioprinting, must be further studied to understand the mechanical stability of the entire construct. Furthermore, the numerical model in this study, based on optical observations of the gelation and stoichiometry, serves as a solid foundation for a framework to optimize gelation properties. In the next step, the model will be refined by integrating nanoindentation data to project and predict the Young’s modulus of the hydrogels to be produced. By integrating this data in the numerical model, a prediction tool (e.g. as a mobile app) for the generation of tissue of interest can be implemented that will supervise cell biologists as well as material scientist to produce e.g. artificial cell niches for the applications in tissue engineering.
Supplementary Materials
The following supporting information can be downloaded at the website of this paper posted on Preprints.org, Video S1: Alginate-Disc_gelation_sim_10mM.avi, Video S2: Alginate-Disc_gelation_sim_20mM.avi, Video S3: Alginate-Disc_gelation_sim_40mM.avi.
Author Contributions
Conceptualization, S.D. and H.Z.; methodology, M.M.G.; M.R. and A.B.; software, A.B.; resources, S.D. and H.Z.; validation, M.M.G., A.B., H.Z., S.D. and M.R.; formal analysis, B.N.; J.M.B., M.M.G. and A.B.; investigation, B.N.; J.M.B. and A.B. data curation, A.B and M.M.G; writing—original draft preparation, A.B. and M.M.G.; writing—review and editing, S.D.; H.Z. and M.R. visualization, M.M.G. and A.B; supervision, M.R. and M.M.G. All authors have read and agreed to the published version of the manuscript.
Funding
This research received no external funding.
Institutional Review Board Statement
Not applicable.
Informed Consent Statement
Not applicable.
Data Availability Statement
The original contributions presented in the study are included in the article/Supplementary Materials, further inquiries can be directed to the corresponding author.
Acknowledgments
The authors would like to thank Kai Herrmann for documenting and conducting gelling experiments with alginate discs.
Conflicts of Interest
The authors declare no conflicts of interest.
References
- Schulz, A.; Gepp, M.M.; Stracke, F.; Briesen, H. von; Neubauer, J.C.; Zimmermann, H. Tyramine-conjugated alginate hydrogels as a platform for bioactive scaffolds. J. Biomed. Mater. Res. A 2019, 107, 114–121. [Google Scholar] [CrossRef]
- Almari, B.; Brough, D.; Harte, M.; Tirella, A. Fabrication of Amyloid-β-Secreting Alginate Microbeads for Use in Modelling Alzheimer’s Disease. JOVE 2019. [Google Scholar] [CrossRef]
- Svanström, A.; Rosendahl, J.; Salerno, S.; Leiva, M.C.; Gregersson, P.; Berglin, M.; Bogestål, Y.; Lausmaa, J.; Oko, A.; Chinga-Carrasco, G.; et al. Optimized alginate-based 3D printed scaffolds as a model of patient derived breast cancer microenvironments in drug discovery. Biomed. Mater. 2021, 16, 45046. [Google Scholar] [CrossRef]
- Gepp, M.M.; Fischer, B.; Schulz, A.; Dobringer, J.; Gentile, L.; Vásquez, J.A.; Neubauer, J.C.; Zimmermann, H. Bioactive surfaces from seaweed-derived alginates for the cultivation of human stem cells. J. Appl. Phycol. 2017, 29, 2451–2461. [Google Scholar] [CrossRef]
- Zimmermann, U.; Mimietz, S.; Zimmermann, H.; Hillgärtner, M.; Schneider, H.; Ludwig, J.; Hasse, C.; Haase, A.; Rothmund, M.; Fuhr, G. Hydrogel-based non-autologous cell and tissue therapy. Biotechniques 2000, 29, 564–581. [Google Scholar] [CrossRef]
- Storz, H.; Müller, K.J.; Ehrhart, F.; Gómez, I.; Shirley, S.G.; Gessner, P.; Zimmermann, G.; Weyand, E.; Sukhorukov, V.L.; Forst, T.; et al. Physicochemical features of ultra-high viscosity alginates. Carbohydr. Res. 2009, 344, 985–995. [Google Scholar] [CrossRef] [PubMed]
- Storz, H.; Zimmermann, U.; Zimmermann, H.; Kulicke, W.-M. Viscoelastic properties of ultra-high viscosity alginates. Rheol. Acta 2010, 49, 155–167. [Google Scholar] [CrossRef]
- Zimmermann, H.; Shirley, S.G.; Zimmermann, U. Alginate-based encapsulation of cells: Past, present, and future. Curr. Diab. Rep. 2007, 7, 314. [Google Scholar] [CrossRef] [PubMed]
- Zimmermann, H.; Zimmermann, D.; Reuss, R.; Feilen, P.J.; Manz, B.; Katsen, A.; Weber, M.; Ihmig, F.R.; Ehrhart, F.; Geßner, P.; et al. Towards a medically approved technology for alginate-based microcapsules allowing long-term immunoisolated transplantation. J. Mater. Sci.: Mater. Med. 2005, 16, 491–501. [Google Scholar] [CrossRef]
- Stewart, M.B.; Gray, S.R.; Vasiljevic, T.; Orbell, J.D. The role of poly-M and poly-GM sequences in the metal-mediated assembly of alginate gels. Carbohydr. Polym. 2014, 112, 486–493. [Google Scholar] [CrossRef]
- Braccini, I.; Pérez, S. Molecular basis of Ca2+-induced gelation in alginates and pectins: The egg-box model revisited. Biomacromolecules 2001, 2, 1089–1096. [Google Scholar] [CrossRef] [PubMed]
- Li, L.; Fang, Y.; Vreeker, R.; Appelqvist, I.; Mendes, E. Reexamining the egg-box model in calcium-alginate gels with X-ray diffraction. Biomacromolecules 2007, 8, 464–468. [Google Scholar] [CrossRef] [PubMed]
- Plazinski, W. Molecular basis of calcium binding by polyguluronate chains. Revising the egg-box model. J. Computat. Chem. 2011, 32, 2988–2995. [Google Scholar] [CrossRef]
- Nair, K.; Yan, K.C.; Sun, W. A computational modeling approach for the characterization of mechanical properties of 3D alginate tissue scaffolds. J. Appl. Biomater. Biomech. 2008, 6, 35–46. [Google Scholar] [PubMed]
- Külcü, İ.D. A Constitutive Model for Alginate-Based Double Network Hydrogels Cross-Linked by Mono-, Di-, and Trivalent Cations. Gels 2020, 7. [Google Scholar] [CrossRef] [PubMed]
- Arruda, E.M.; Boyce, M.C. A three-dimensional constitutive model for the large stretch behavior of rubber elastic materials. J. Mech. Phys. Solids 1993, 41, 389–412. [Google Scholar] [CrossRef]
- Dargazany, R.; Itskov, M. A network evolution model for the anisotropic Mullins effect in carbon black filled rubbers. Int. J. Solids Struct. 2009, 46, 2967–2977. [Google Scholar] [CrossRef]
- Govindjee, S.; Simo, J. A micro-mechanically based continuum damage model for carbon black-filled rubbers incorporating Mullins’ effect. J. Mech. Phys. Solids 1991, 39, 87–112. [Google Scholar] [CrossRef]
- Marckmann, G.; Verron, E.; Gornet, L.; Chagnon, G.; Charrier, P.; Fort, P. A theory of network alteration for the Mullins effect. J. Mech. Phys. Solids 2002, 50, 2011–2028. [Google Scholar] [CrossRef]
- Mikkelsen, A.; Elgsaeter, A. Density distribution of calcium-induced alginate gels. A numerical study. Biopolymers 1995, 36, 17–41. [Google Scholar] [CrossRef]
- Thu, B.; Gåserød, O.; Paus, D.; Mikkelsen, A.; Skjåk-Bræk, G.; Toffanin, R.; Vittur, F.; Rizzo, R. Inhomogeneous alginate gel spheres: An assessment of the polymer gradients by synchrotron radiation-induced x-ray emission, magnetic resonance microimaging, and mathematical modeling. Biopolymers 2000, 53, 60–71. [Google Scholar] [CrossRef]
- Bjørnøy, S.H.; Mandaric, S.; Bassett, D.C.; Slund, A.K.O.; Ucar, S.; Andreassen, J.-P.; Strand, B.L.; Sikorski, P. Gelling kinetics and in situ mineralization of alginate hydrogels: A correlative spatiotemporal characterization toolbox. Acta Biomater. 2016, 44, 243–253. [Google Scholar] [CrossRef] [PubMed]
- Huynh, U.T.; Chambin, O.; Du Poset, A.M.; Assifaoui, A. Insights into gelation kinetics and gel front migration in cation-induced polysaccharide hydrogels by viscoelastic and turbidity measurements: Effect of the nature of divalent cations. Carbohydr. Polym. 2018, 190, 121–128. [Google Scholar] [CrossRef] [PubMed]
- Lee, B.-B.; Bhandari, B.R.; Howes, T. Quantification of calcium alginate gel formation during ionic cross-linking by a novel colourimetric technique. Colloids Surf. A Physicochem. Eng. Asp. 2017, 533, 116–124. [Google Scholar] [CrossRef]
- Cheng, Y.; Luo, X.; Betz, J.; Payne, G.F.; Bentley, W.E.; Rubloff, G.W. Mechanism of anodic electrodeposition of calcium alginate. Soft Matter 2011, 7, 5677–5684. [Google Scholar] [CrossRef]
- Secchi, E.; Roversi, T.; Buzzaccaro, S.; Piazza, L.; Piazza, R. Biopolymer gels with “physical” cross-links: gelation kinetics, aging, heterogeneous dynamics, and macroscopic mechanical properties. Soft Matter 2013, 9, 3931. [Google Scholar] [CrossRef]
- Hajikhani, A.; Scocozza, F.; Conti, M.; Marino, M.; Auricchio, F.; Wriggers, P. Experimental characterization and computational modeling of hydrogel cross-linking for bioprinting applications. IJAO 2019, 42, 548–557. [Google Scholar] [CrossRef] [PubMed]
- Hajikhani, A.; Marino, M.; Wriggers, P. Computational modeling of hydrogel cross-linking based on reaction-diffusion theory. Proc. Appl. Math. Mech. 2019, 19. [Google Scholar] [CrossRef]
- Stößlein, S.; Grunwald, I.; Stelten, J.; Hartwig, A. In-situ determination of time-dependent alginate-hydrogel formation by mechanical texture analysis. Carbohydr. Polym. 2019, 205, 287–294. [Google Scholar] [CrossRef] [PubMed]
- Cesewski, E.; Singh, M.; Liu, Y.; Zhang, J.; Haring, A.P.; Johnson, B.N. Real-time monitoring of hydrogel rheological property changes and gelation processes using high-order modes of cantilever sensors. J. Appl. Phys. 2020, 128, 174502. [Google Scholar] [CrossRef]
- Potter, K.; Balcom, B.J.; Carpenter, T.; Hall, L.D. The gelation of sodium alginate with calcium ions studied by magnetic resonance imaging (MRI). Carbohydr. Res. 1994, 257, 117–126. [Google Scholar] [CrossRef]
- Bjørnøy, S.H.; Mandaric, S.; Bassett, D.C.; Slund, A.K.O.; Ucar, S.; Andreassen, J.-P.; Strand, B.L.; Sikorski, P. Gelling kinetics and in situ mineralization of alginate hydrogels: A correlative spatiotemporal characterization toolbox. Acta Biomater. 2016, 44, 243–253. [Google Scholar] [CrossRef]
- Hu, M.; Zheng, G.; Zhao, D.; Yu, W. Characterization of the structure and diffusion behavior of calcium alginate gel beads. J. Appl. Polym. Sci. 2020, 137, 48923. [Google Scholar] [CrossRef]
- Li, J.; Wu, Y.; He, J.; Huang, Y. A new insight to the effect of calcium concentration on gelation process and physical properties of alginate films. J. Mater. Sci. 2016, 51, 5791–5801. [Google Scholar] [CrossRef]
- Besiri, I.N.; Goudoulas, T.B.; Fattahi, E.; Becker, T. In situ evaluation of alginate-Ca 2+ gelation kinetics. J. Appl. Polym. Sci. 2023, 140. [Google Scholar] [CrossRef]
- Smidsrød, O.; Skjåk-Bræk, G. Alginate as immobilization matrix for cells. Trends Biotechnol. 1990, 8, 71–78. [Google Scholar] [CrossRef] [PubMed]
- Kosseva, M.R. Immobilization of Microbial Cells in Food Fermentation Processes. Food Bioprocess Technol. 2011, 4, 1089–1118. [Google Scholar] [CrossRef]
- Groboillot, A.; Boadi, D.K.; Poncelet, D.; Neufeld, R.J. Immobilization of Cells for Application in the Food Industry. Crit. Rev. Biotechnol. 1994, 14, 75–107. [Google Scholar] [CrossRef] [PubMed]
- Fraser, J.E.; Bickerstaff, G.F. Entrapment in Calcium Alginate. Immobilization of Enzymes and Cells; Springer, 1997; pp 61–66.
- Takahashi, K.; Tanabe, K.; Ohnuki, M.; Narita, M.; Ichisaka, T.; Tomoda, K.; Yamanaka, S. Induction of pluripotent stem cells from adult human fibroblasts by defined factors. Cell 2007, 131, 861–872. [Google Scholar] [CrossRef] [PubMed]
- Takahashi, K.; Yamanaka, S. Induction of pluripotent stem cells from mouse embryonic and adult fibroblast cultures by defined factors. Cell 2006, 126, 663–676. [Google Scholar] [CrossRef]
- Chaicharoenaudomrung, N.; Kunhorm, P.; Noisa, P. Three-dimensional cell culture systems as an in vitro platform for cancer and stem cell modeling. WJSC 2019, 11, 1065–1083. [Google Scholar] [CrossRef] [PubMed]
- Mirbagheri, M.; Adibnia, V.; Hughes, B.R.; Waldman, S.D.; Banquy, X.; Hwang, D.K. Advanced cell culture platforms: a growing quest for emulating natural tissues. Mater. Horiz. 2019, 6, 45–71. [Google Scholar] [CrossRef]
- Georges, P.C.; Janmey, P.A. Cell type-specific response to growth on soft materials. J. Appl. Physiol. (1985) 2005, 98, 1547–1553. [Google Scholar] [CrossRef] [PubMed]
- Jensen, C.; Teng, Y. Is It Time to Start Transitioning From 2D to 3D Cell Culture? Front. Mol. Biosci. 2020, 7, 33. [Google Scholar] [CrossRef] [PubMed]
- Imamura, Y.; Mukohara, T.; Shimono, Y.; Funakoshi, Y.; Chayahara, N.; Toyoda, M.; Kiyota, N.; Takao, S.; Kono, S.; Nakatsura, T.; et al. Comparison of 2D- and 3D-culture models as drug-testing platforms in breast cancer. Oncol. Rep. 2015, 33, 1837–1843. [Google Scholar] [CrossRef] [PubMed]
- Higuchi, A.; Ling, Q.-D.; Chang, Y.; Hsu, S.-T.; Umezawa, A. Physical Cues of Biomaterials Guide Stem Cell Differentiation Fate. Chem. Rev. 2013, 113, 3297–3328. [Google Scholar] [CrossRef] [PubMed]
- Li, D.; Zhou, J.; Chowdhury, F.; Cheng, J.; Wang, N.; Wang, F. Role of mechanical factors in fate decisions of stem cells. Regen. Med. 2011, 6, 229–240. [Google Scholar] [CrossRef] [PubMed]
- Yeung, T.; Georges, P.C.; Flanagan, L.A.; Marg, B.; Ortiz, M.; Funaki, M.; Zahir, N.; Ming, W.; Weaver, V.; Janmey, P.A. Effects of substrate stiffness on cell morphology, cytoskeletal structure, and adhesion. Cell Motil. Cytoskeleton 2005, 60, 24–34. [Google Scholar] [CrossRef]
- Sun, Y.; Yong, K.M.A.; Villa-Diaz, L.G.; Zhang, X.; Chen, W.; Philson, R.; Weng, S.; Xu, H.; Krebsbach, P.H.; Fu, J. Hippo/YAP-mediated rigidity-dependent motor neuron differentiation of human pluripotent stem cells. Nat. Mater. 2014, 13, 599–604. [Google Scholar] [CrossRef]
- Tirella, A.; Orsini, A.; Vozzi, G.; Ahluwalia, A. A phase diagram for microfabrication of geometrically controlled hydrogel scaffolds. Biofabrication 2009, 1, 45002. [Google Scholar] [CrossRef]
- Holte, O.; Tønnesen, H.H.; Karlsen, J. Measurement of diffusion through calcium alginate gel matrices. Pharmazie 2006, 61, 30–34. [Google Scholar] [PubMed]
- Rui Rodrigues, J.; Lagoa, R. Copper Ions Binding in Cu-Alginate Gelation. J. Carbohydr. Chem. 2006, 25, 219–232. [Google Scholar] [CrossRef]
- Diebels, S.; Gepp, M.M.; Meiser, I.; Roland, M.; Stracke, F.; Zimmermann, H. A multiphase model for the cross-linking of ultra-high viscous alginate hydrogels. Proc. Appl. Math. Mech. 2021, 20, e202000254. [Google Scholar] [CrossRef]
- Draget, K.I.; Gåserød, O.; Aune, I.; Andersen, P.O.; Storbakken, B.; Stokke, B.T.; Smidsrød, O. Effects of molecular weight and elastic segment flexibility on syneresis in Ca-alginate gels. Food Hydrocoll 2001, 15, 485–490. [Google Scholar] [CrossRef]
- Ehrhart, F.; Mettler, E.; Böse, T.; Weber, M.M.; Vásquez, J.A.; Zimmermann, H. Biocompatible coating of encapsulated cells using ionotropic gelation. PLoS ONE 2013, 8, e73498. [Google Scholar] [CrossRef] [PubMed]
- Jeong, Y.; Irudayaraj, J. Multi-layered alginate hydrogel structures and bacteria encapsulation. Chem. Commun. (Chemical communications) 2022, 58, 8584–8587. [Google Scholar] [CrossRef] [PubMed]
- Leong, J.-Y.; Lam, W.-H.; Ho, K.-W.; Voo, W.-P.; Lee, M.F.-X.; Lim, H.-P.; Lim, S.-L.; Tey, B.-T.; Poncelet, D.; Chan, E.-S. Advances in fabricating spherical alginate hydrogels with controlled particle designs by ionotropic gelationas encapsulation systems. Particuology 2015. [Google Scholar] [CrossRef]
- Voo, W.-P.; Ooi, C.-W.; Islam, A.; Tey, B.-T.; Chan, E.-S. Calcium alginate hydrogel beads with high stiffness and extended dissolution behaviour. Eur. Polym. J. 2016, 75, 343–353. [Google Scholar] [CrossRef]
- Zhao, Y.; Hu, F.; Evans, J.J.; Harris, M.T. Study of sol–gel transition in calcium alginate system by population balance model. Chem. Eng. Sci. 2011, 66, 848–858. [Google Scholar] [CrossRef]
Figure 3.
Time-lapse sequence of alginate gelation with different concentrations of cross-linking agents. (a) 10 mM BaCl2 solution, (b) 20 mM BaCl2 solution and (c) 40 mM BaCl2 solution. The gelation kinetics of the alginate are derived from the course of the traveling gelled/liquid interface. Due to low contrast, dashed white lines are used to indicate segments of the gelled/liquid interface. Scale bar indicates 1000 μm. Images are enhanced using a bandpass filter in ImageJ.
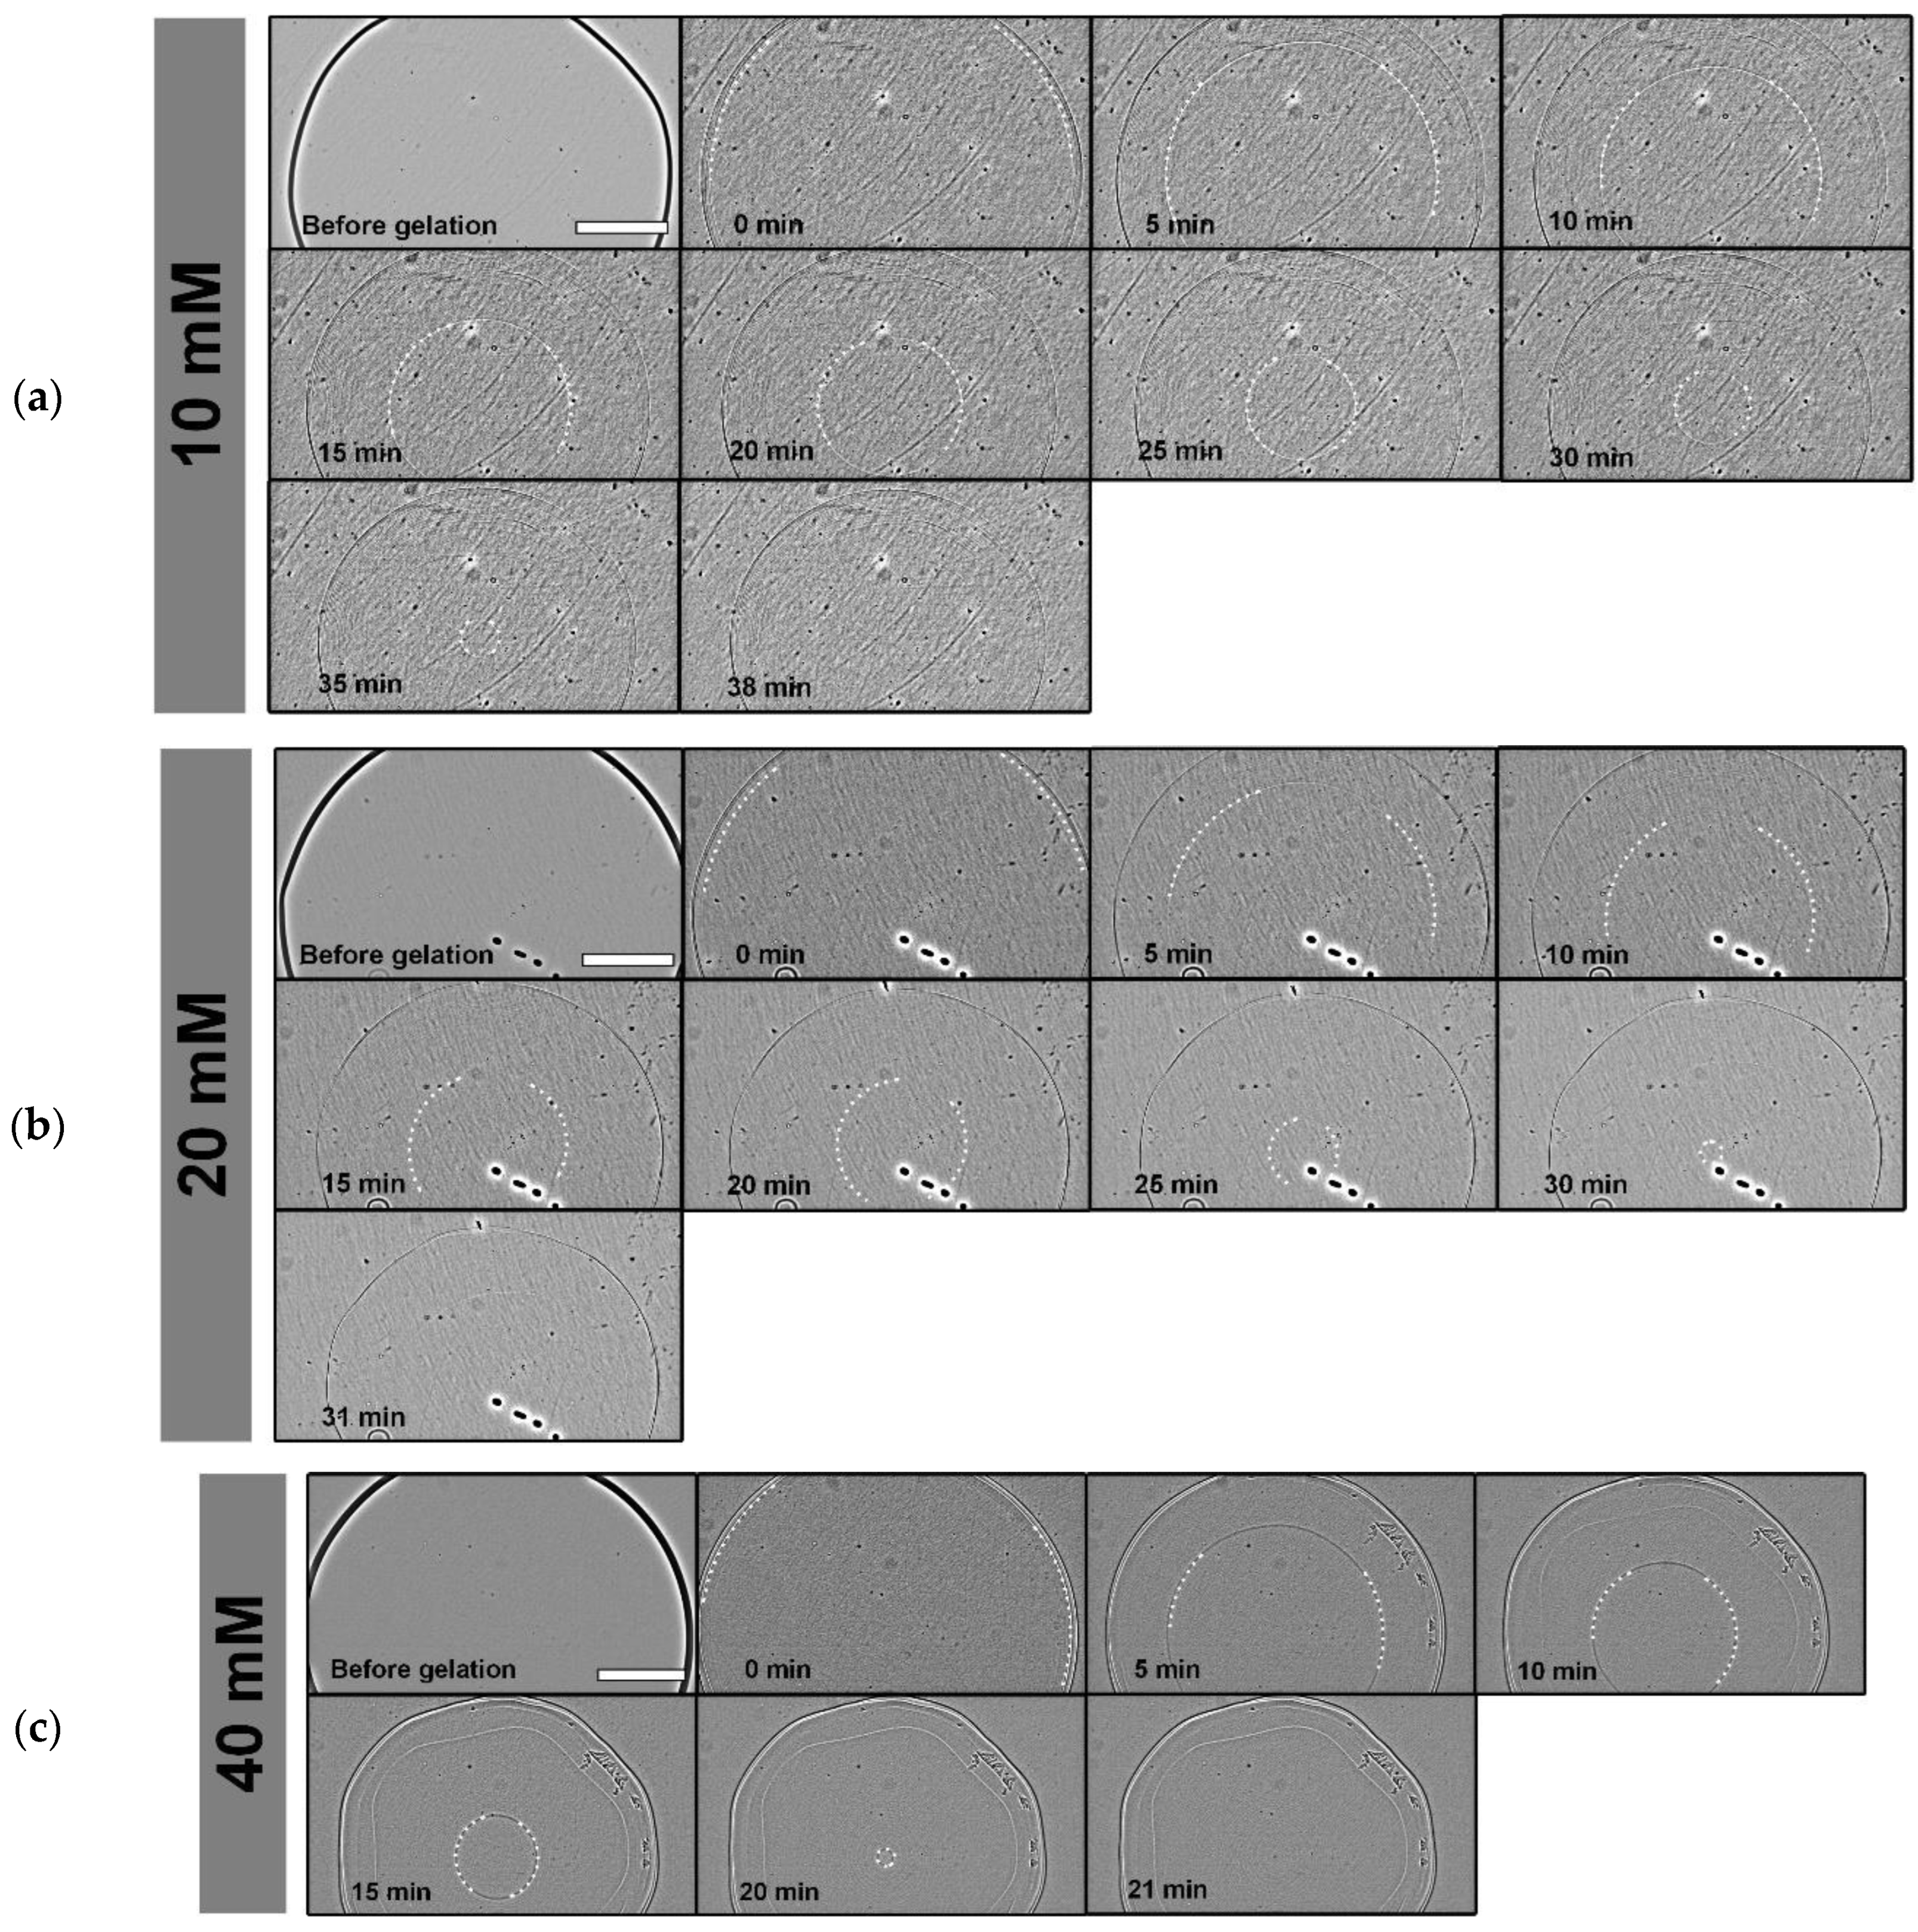
Figure 4.
Analysis of the gelation process of alginate discs. (a) Gelation kinetics analyzed by the decreasing diameter of the gelation front. The kinetics of gelation depend strongly on the applied cross-linker concentration: the higher the BaCl2 concentration, the faster the overall gelation of the alginate droplet. (b) Velocity of the gelation front of alginates. Doubling the cross-linker concentration leads to a linear increase in gelation velocity. The velocity of gelation in this work is defined as reduction of ungelled core and negative. Data are expressed as mean value ± standard deviation (n=5 gelation experiments). Standard deviation in (a) is shown as ribbon for visualization purposes.
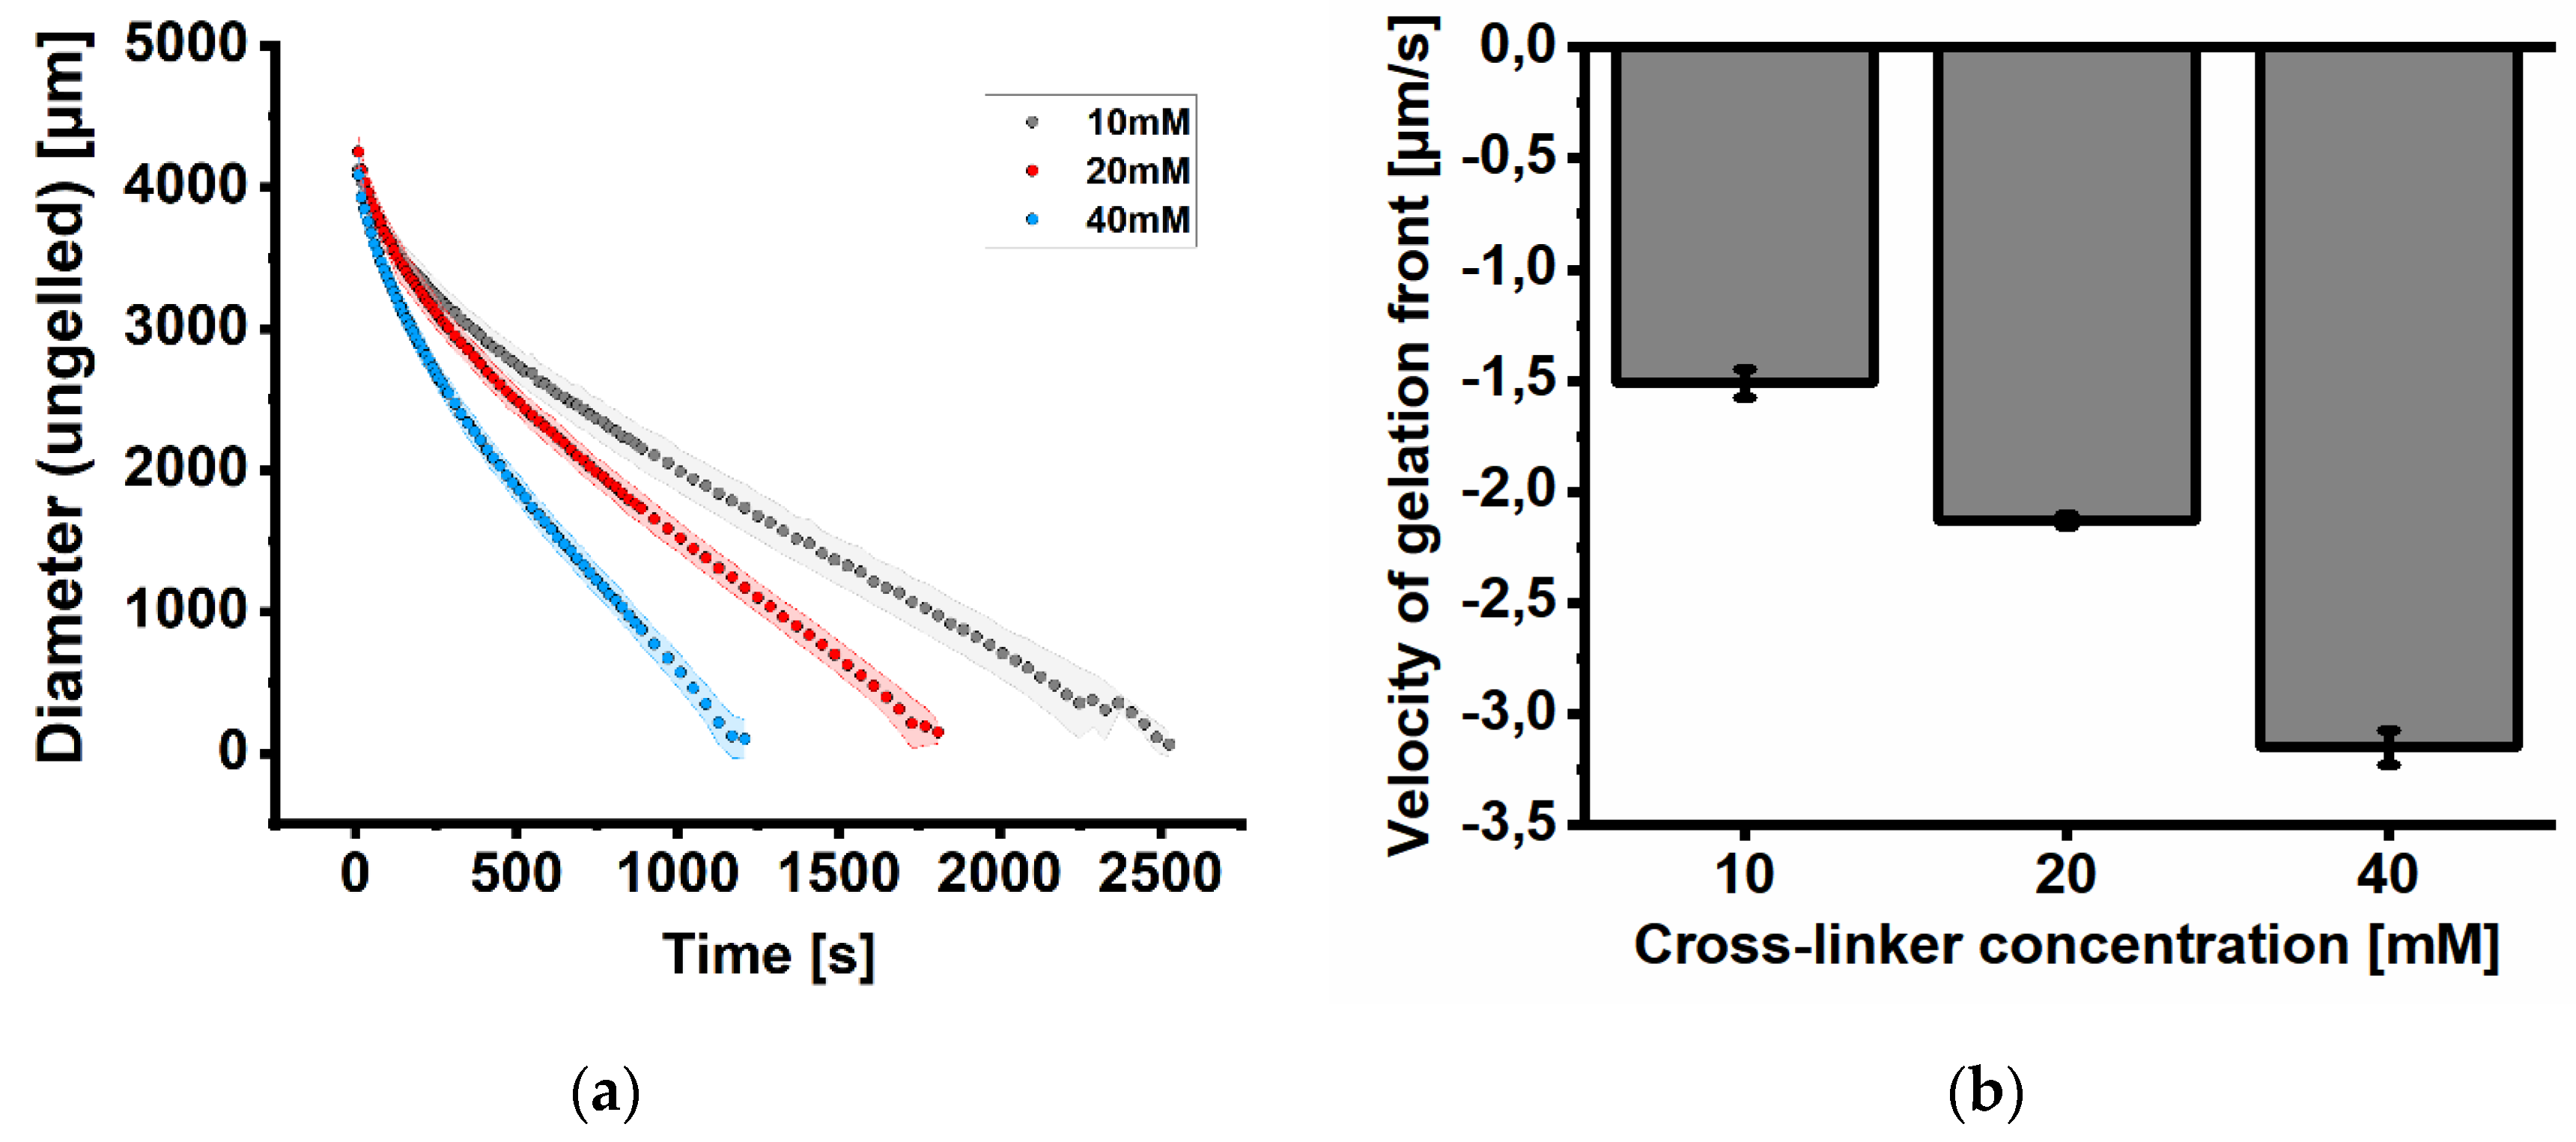
Figure 5.
Analysis of the alginate gelation process of alginate spheres (beads, microcarriers). Gelation kinetics analyzed by the decreasing diameter of the gelation front. The kinetics of gelation depend strongly on the applied cross-linker concentration: the higher the BaCl2 concentration, the faster the overall gelation of the alginate droplet. (a) Single gelation experiments using 10 mM BaCl2 solution (b) Single gelation experiments using 20 mM BaCl2 solution (c) Single gelation experiments using 40 mM BaCl2 solution (d) Velocity of gelation front of alginates from (a) to (c) extracted by linear curve fitting. The velocity of gelation in this work is defined as reduction of ungelled core and negative. Doubling the cross-linker concentration leads to a linear increase in gelation velocity. Data in (d) are expressed as mean value ± standard deviation (n=5 gelation experiments).
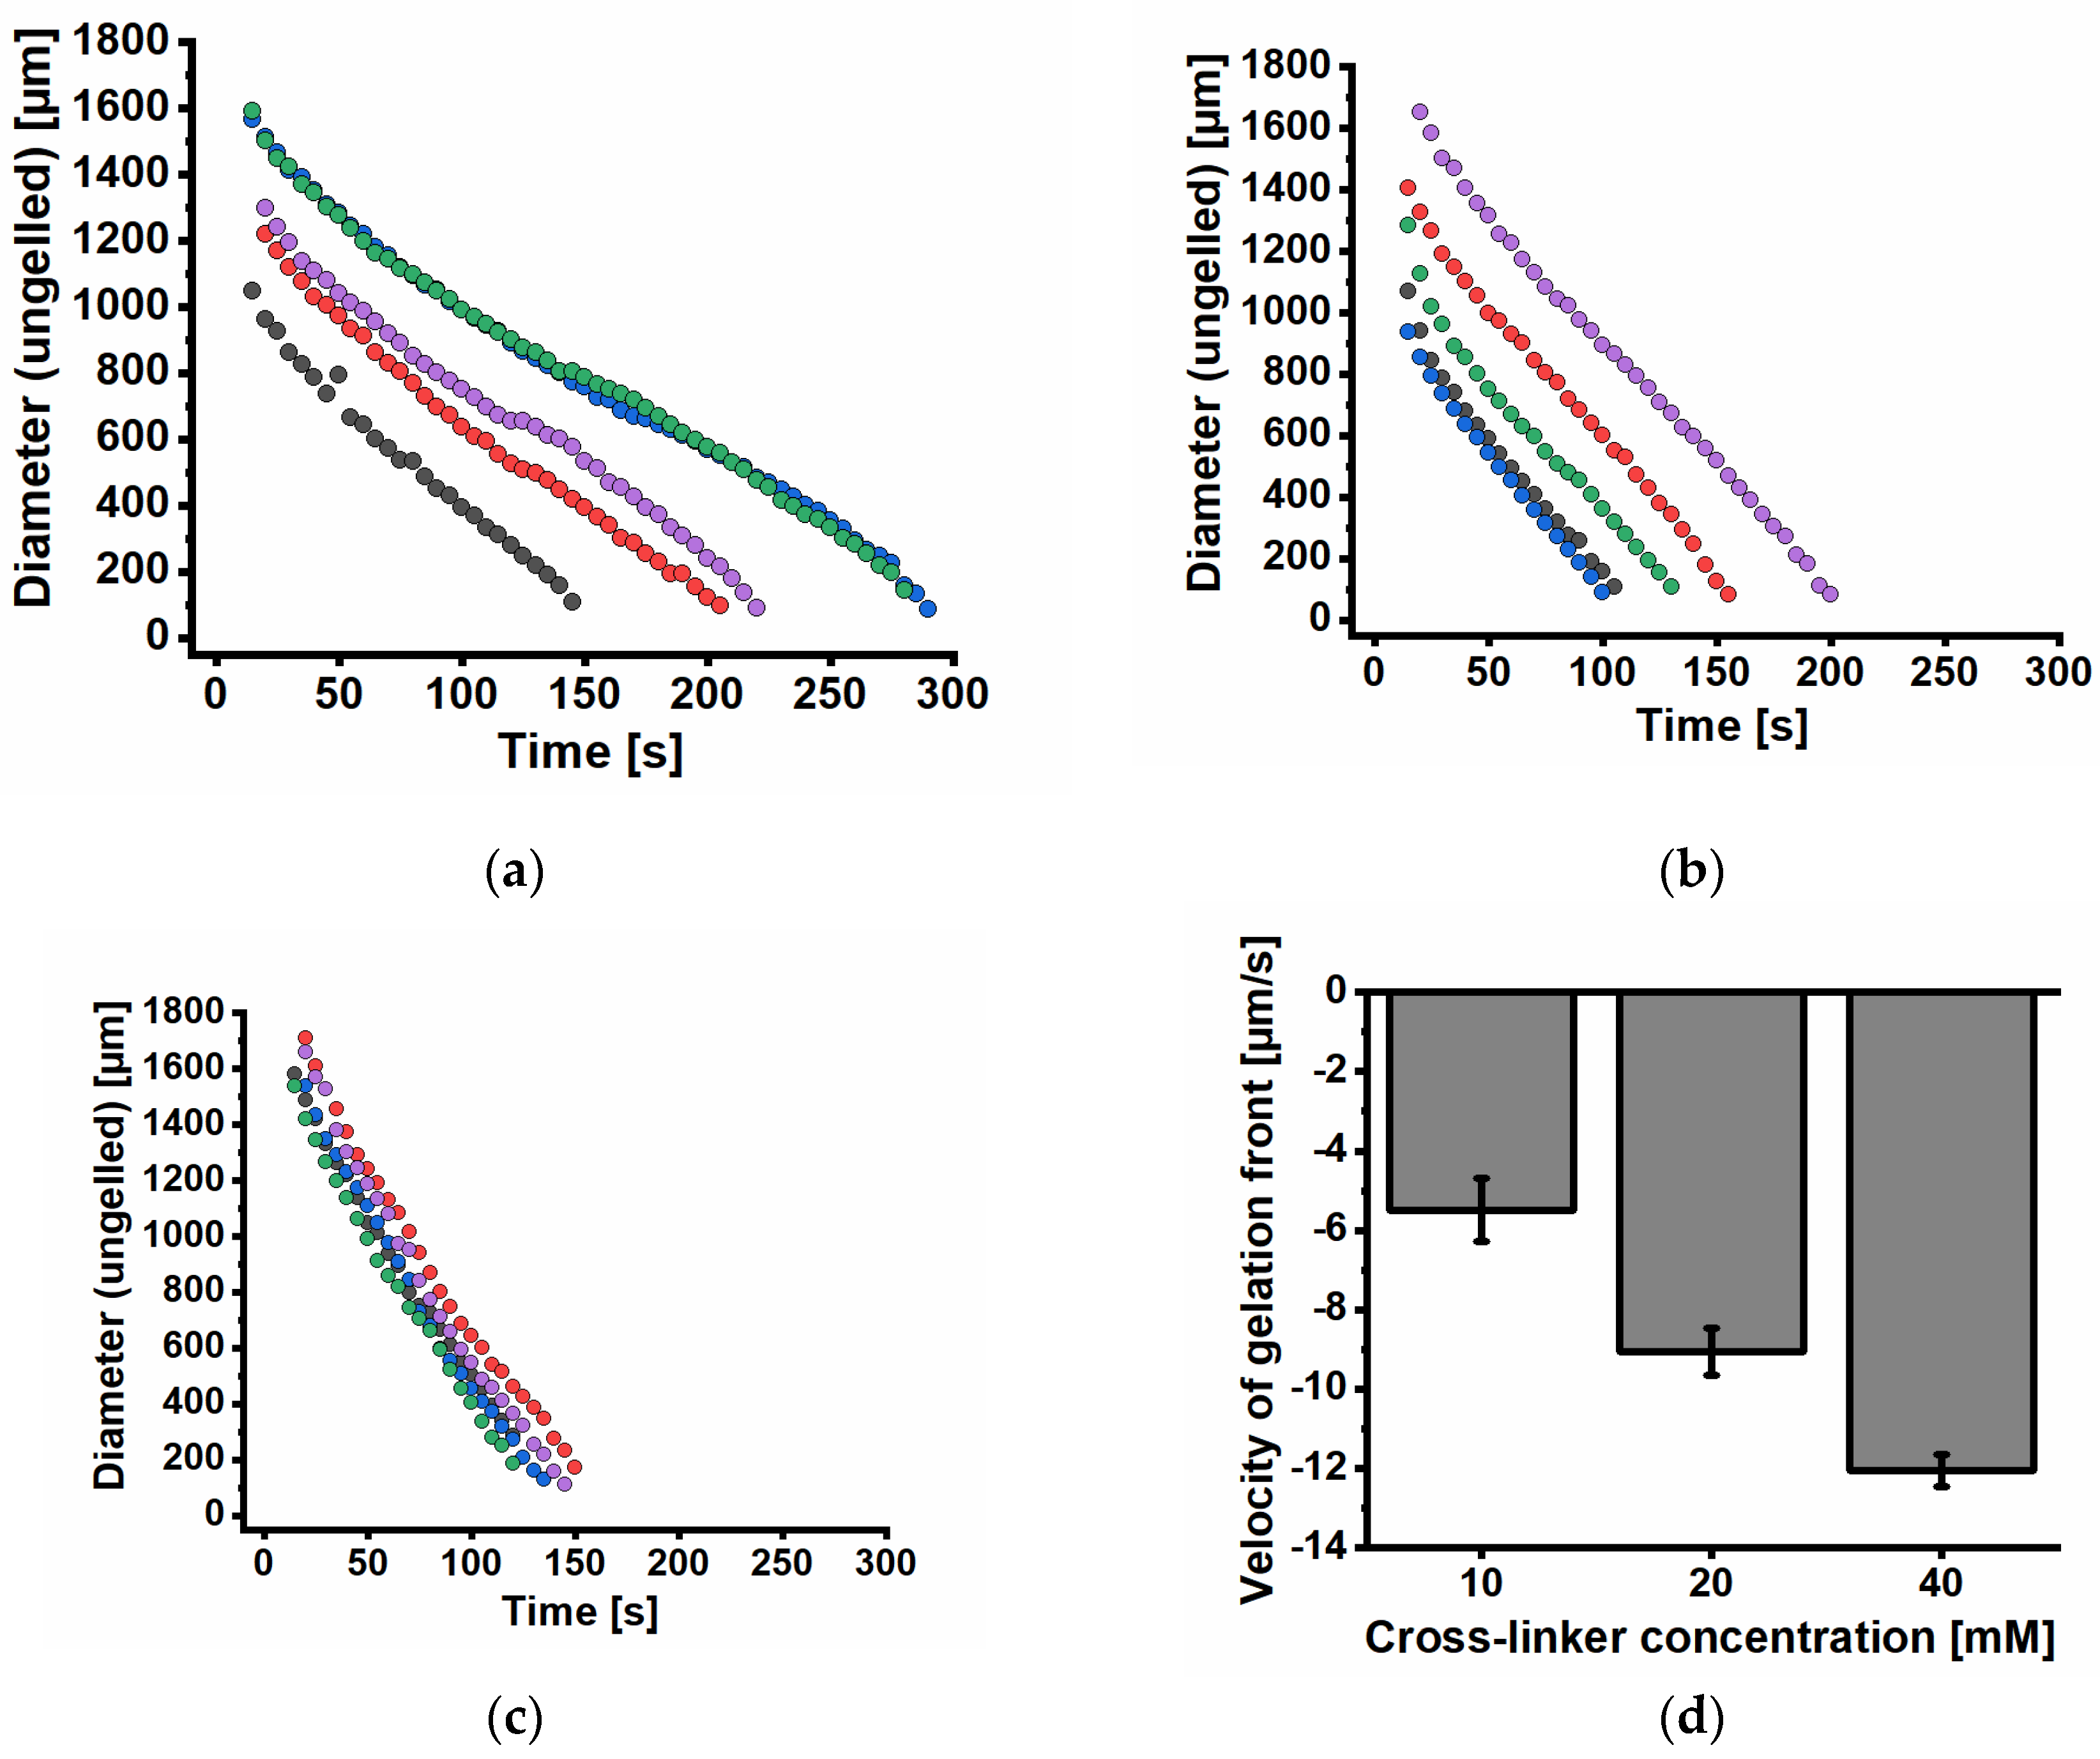
Figure 6.
Time-lapse of alginate gelation simulation with different concentration boundary conditions of the cross-linking agent. The left half of each time point shows the visualization of the numeric model, the right half shows the microscopic image of one experimental replicate. (a) 10 mM BaCl2 solution, (b) 20 mM BaCl2 solution and (c) 40 mM BaCl2 solution. Brighter areas indicate a higher amount of the ongoing gelling reaction. Scale bar indicates 1000 µm.
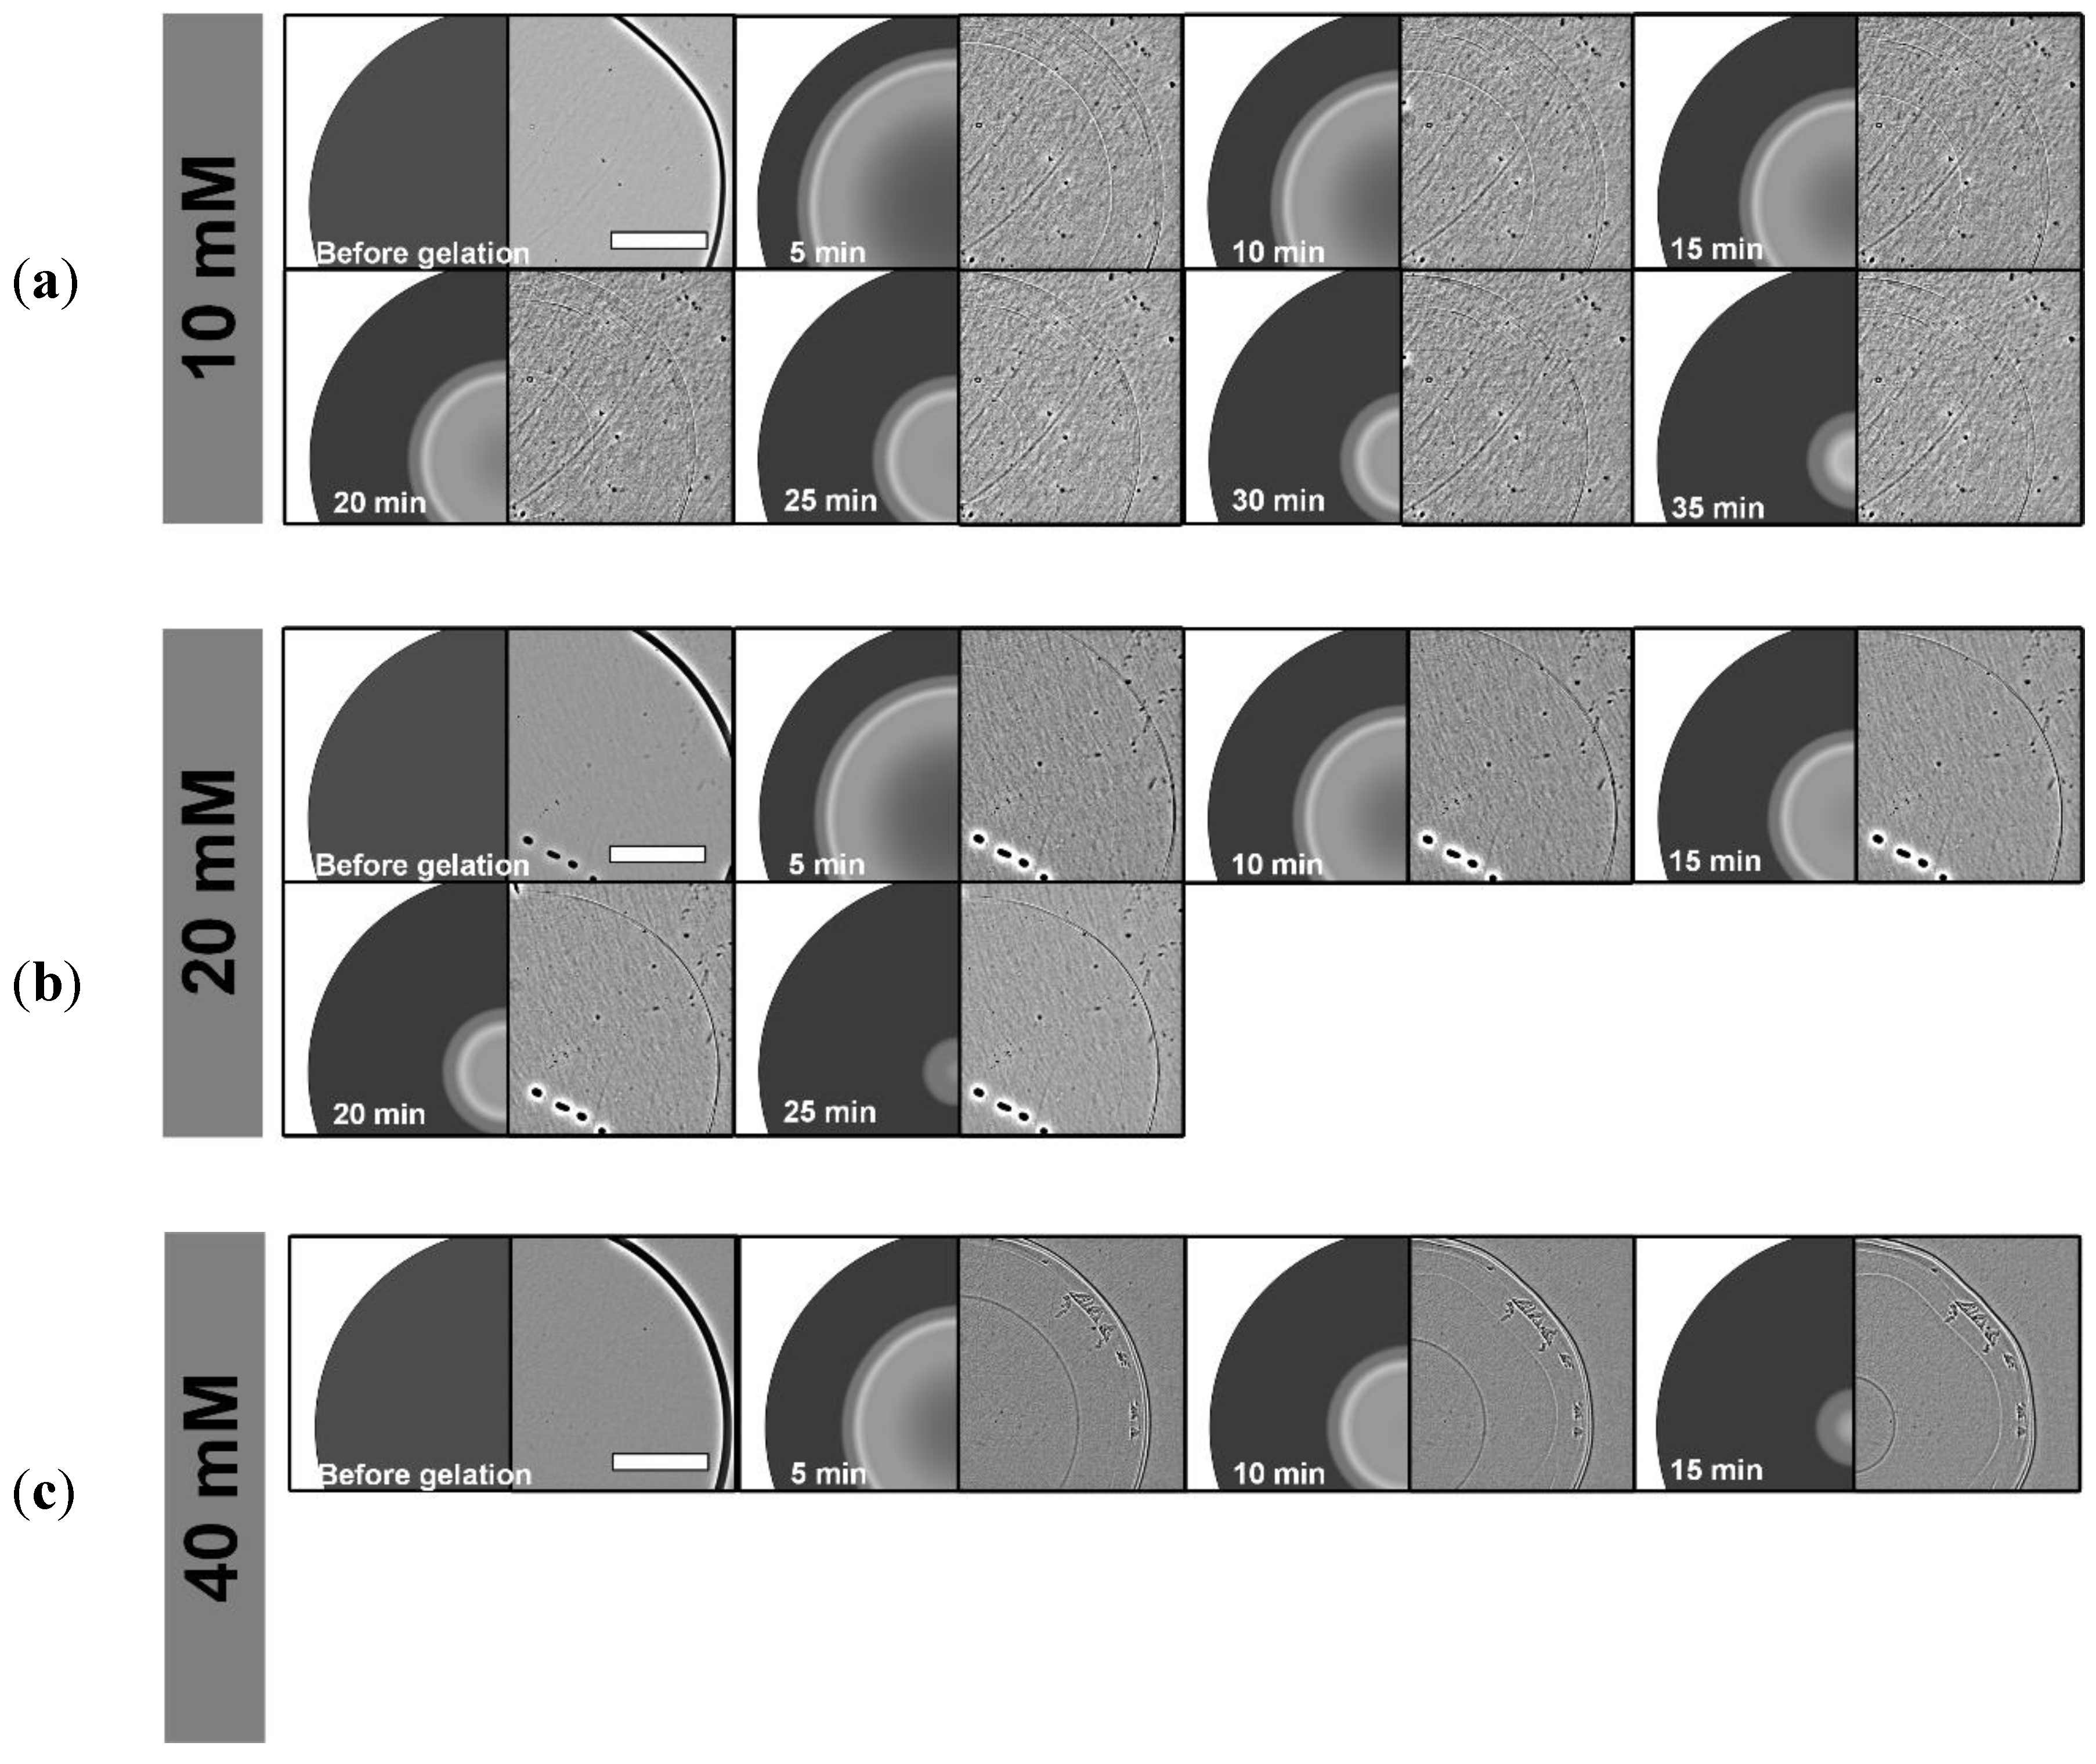
Figure 7.
Comparison of experimental data (solid line) and numerical modeling (dotted lines).
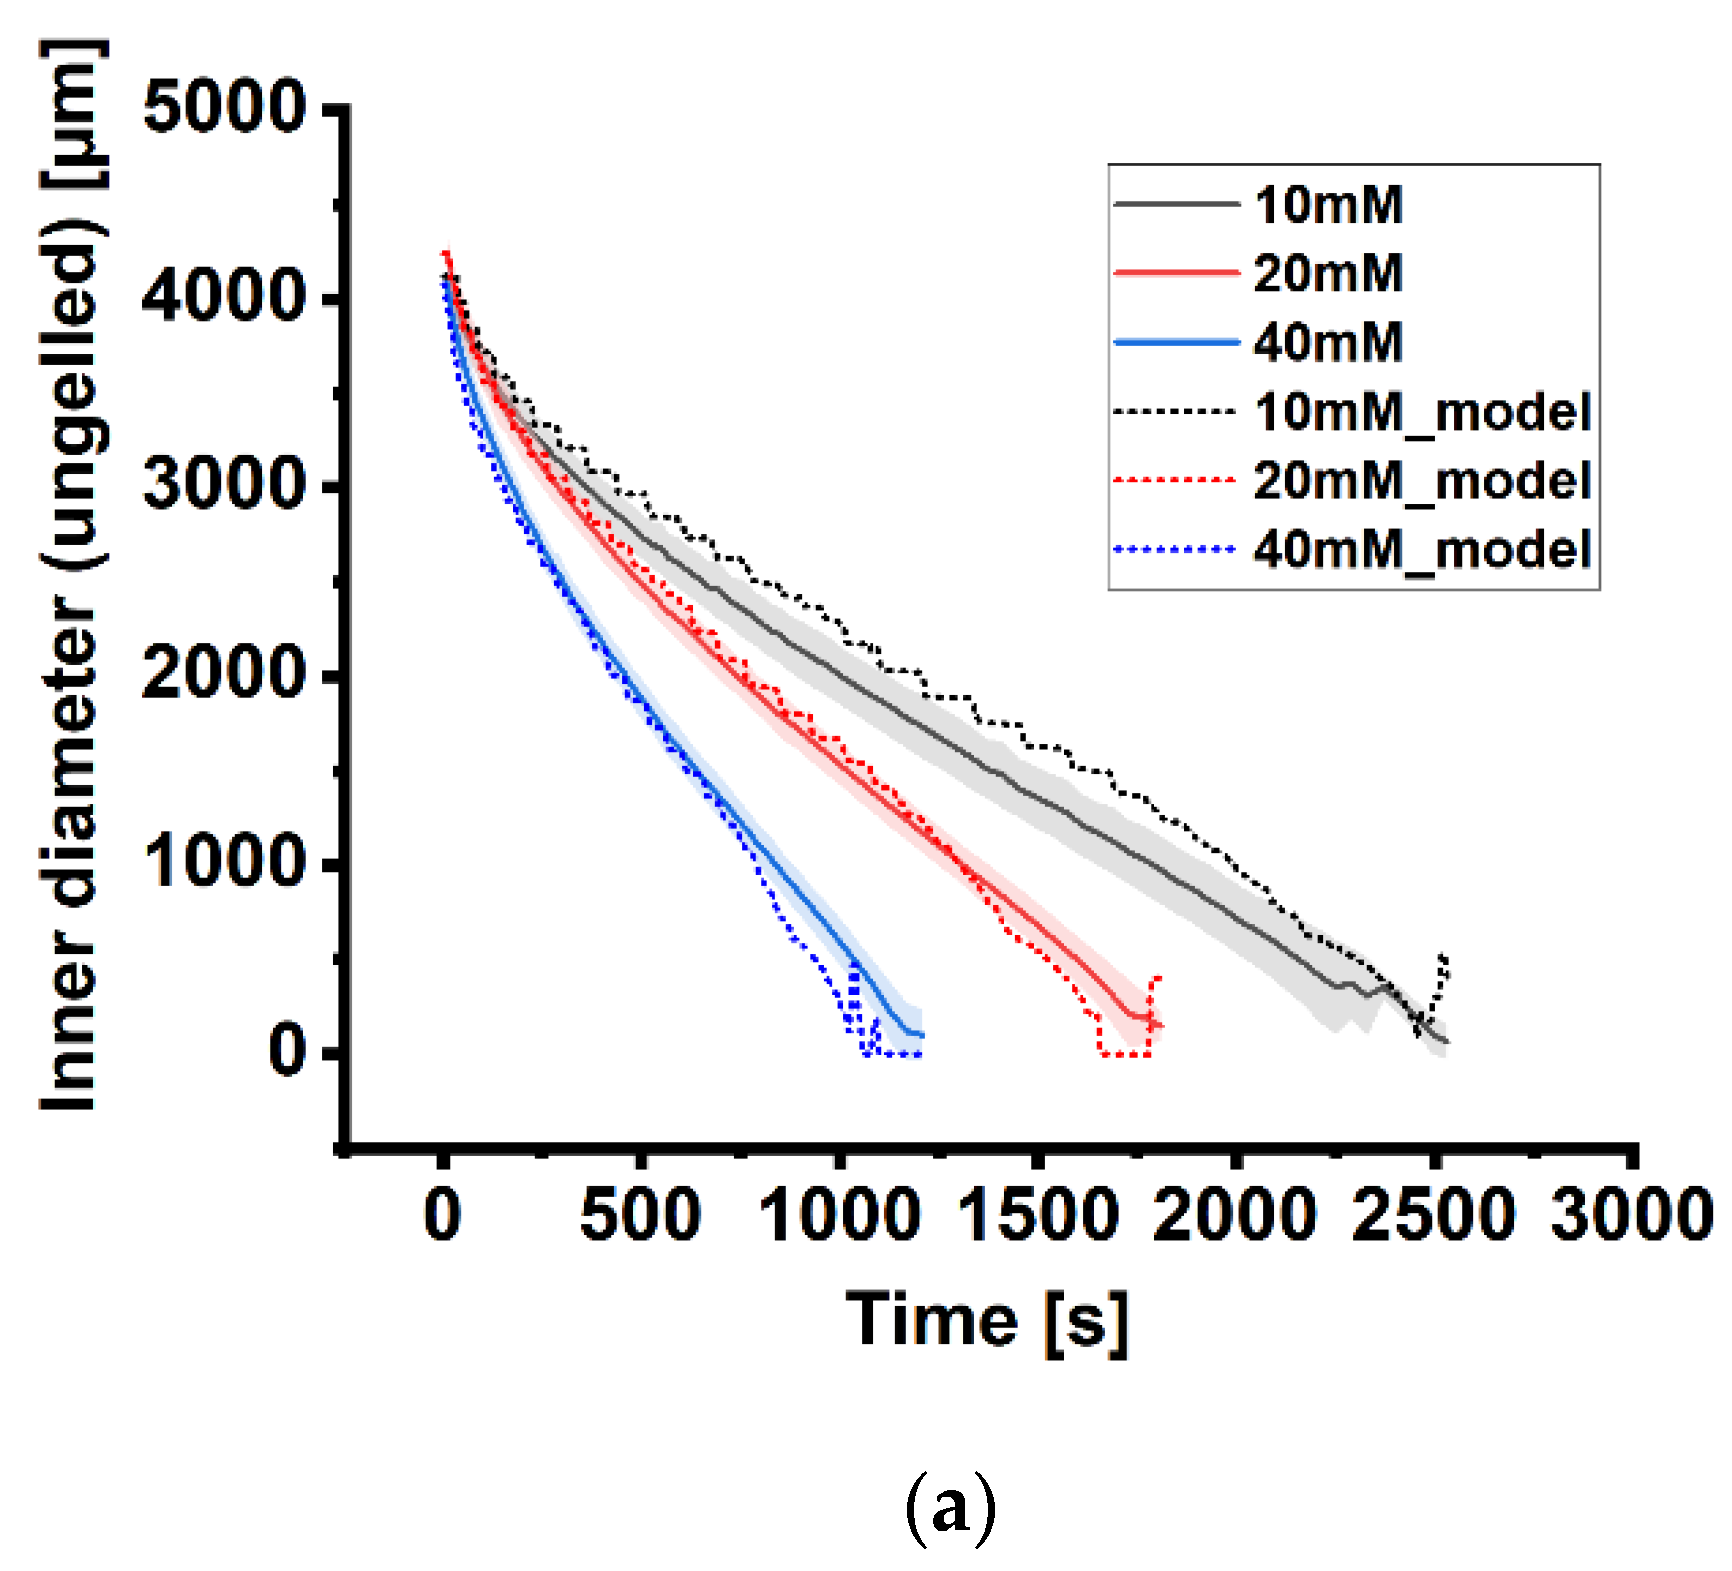
Figure 8.
Alginate micro-layer formation during gelation. (a) Top: microscopic image of the formed layer at the outer border of the alginate disc, scale bar: 200 µm. Inset: Lower magnification of the area indicated by the black dashed line. Black arrow: Line scan of intensity in the graph. Bottom: The graph illustrates the data from the line scan of intensity. (b) Schematic illustration of layer formation in alginate disc-like hydrogels (adapted from [57], created with BioRender.com).
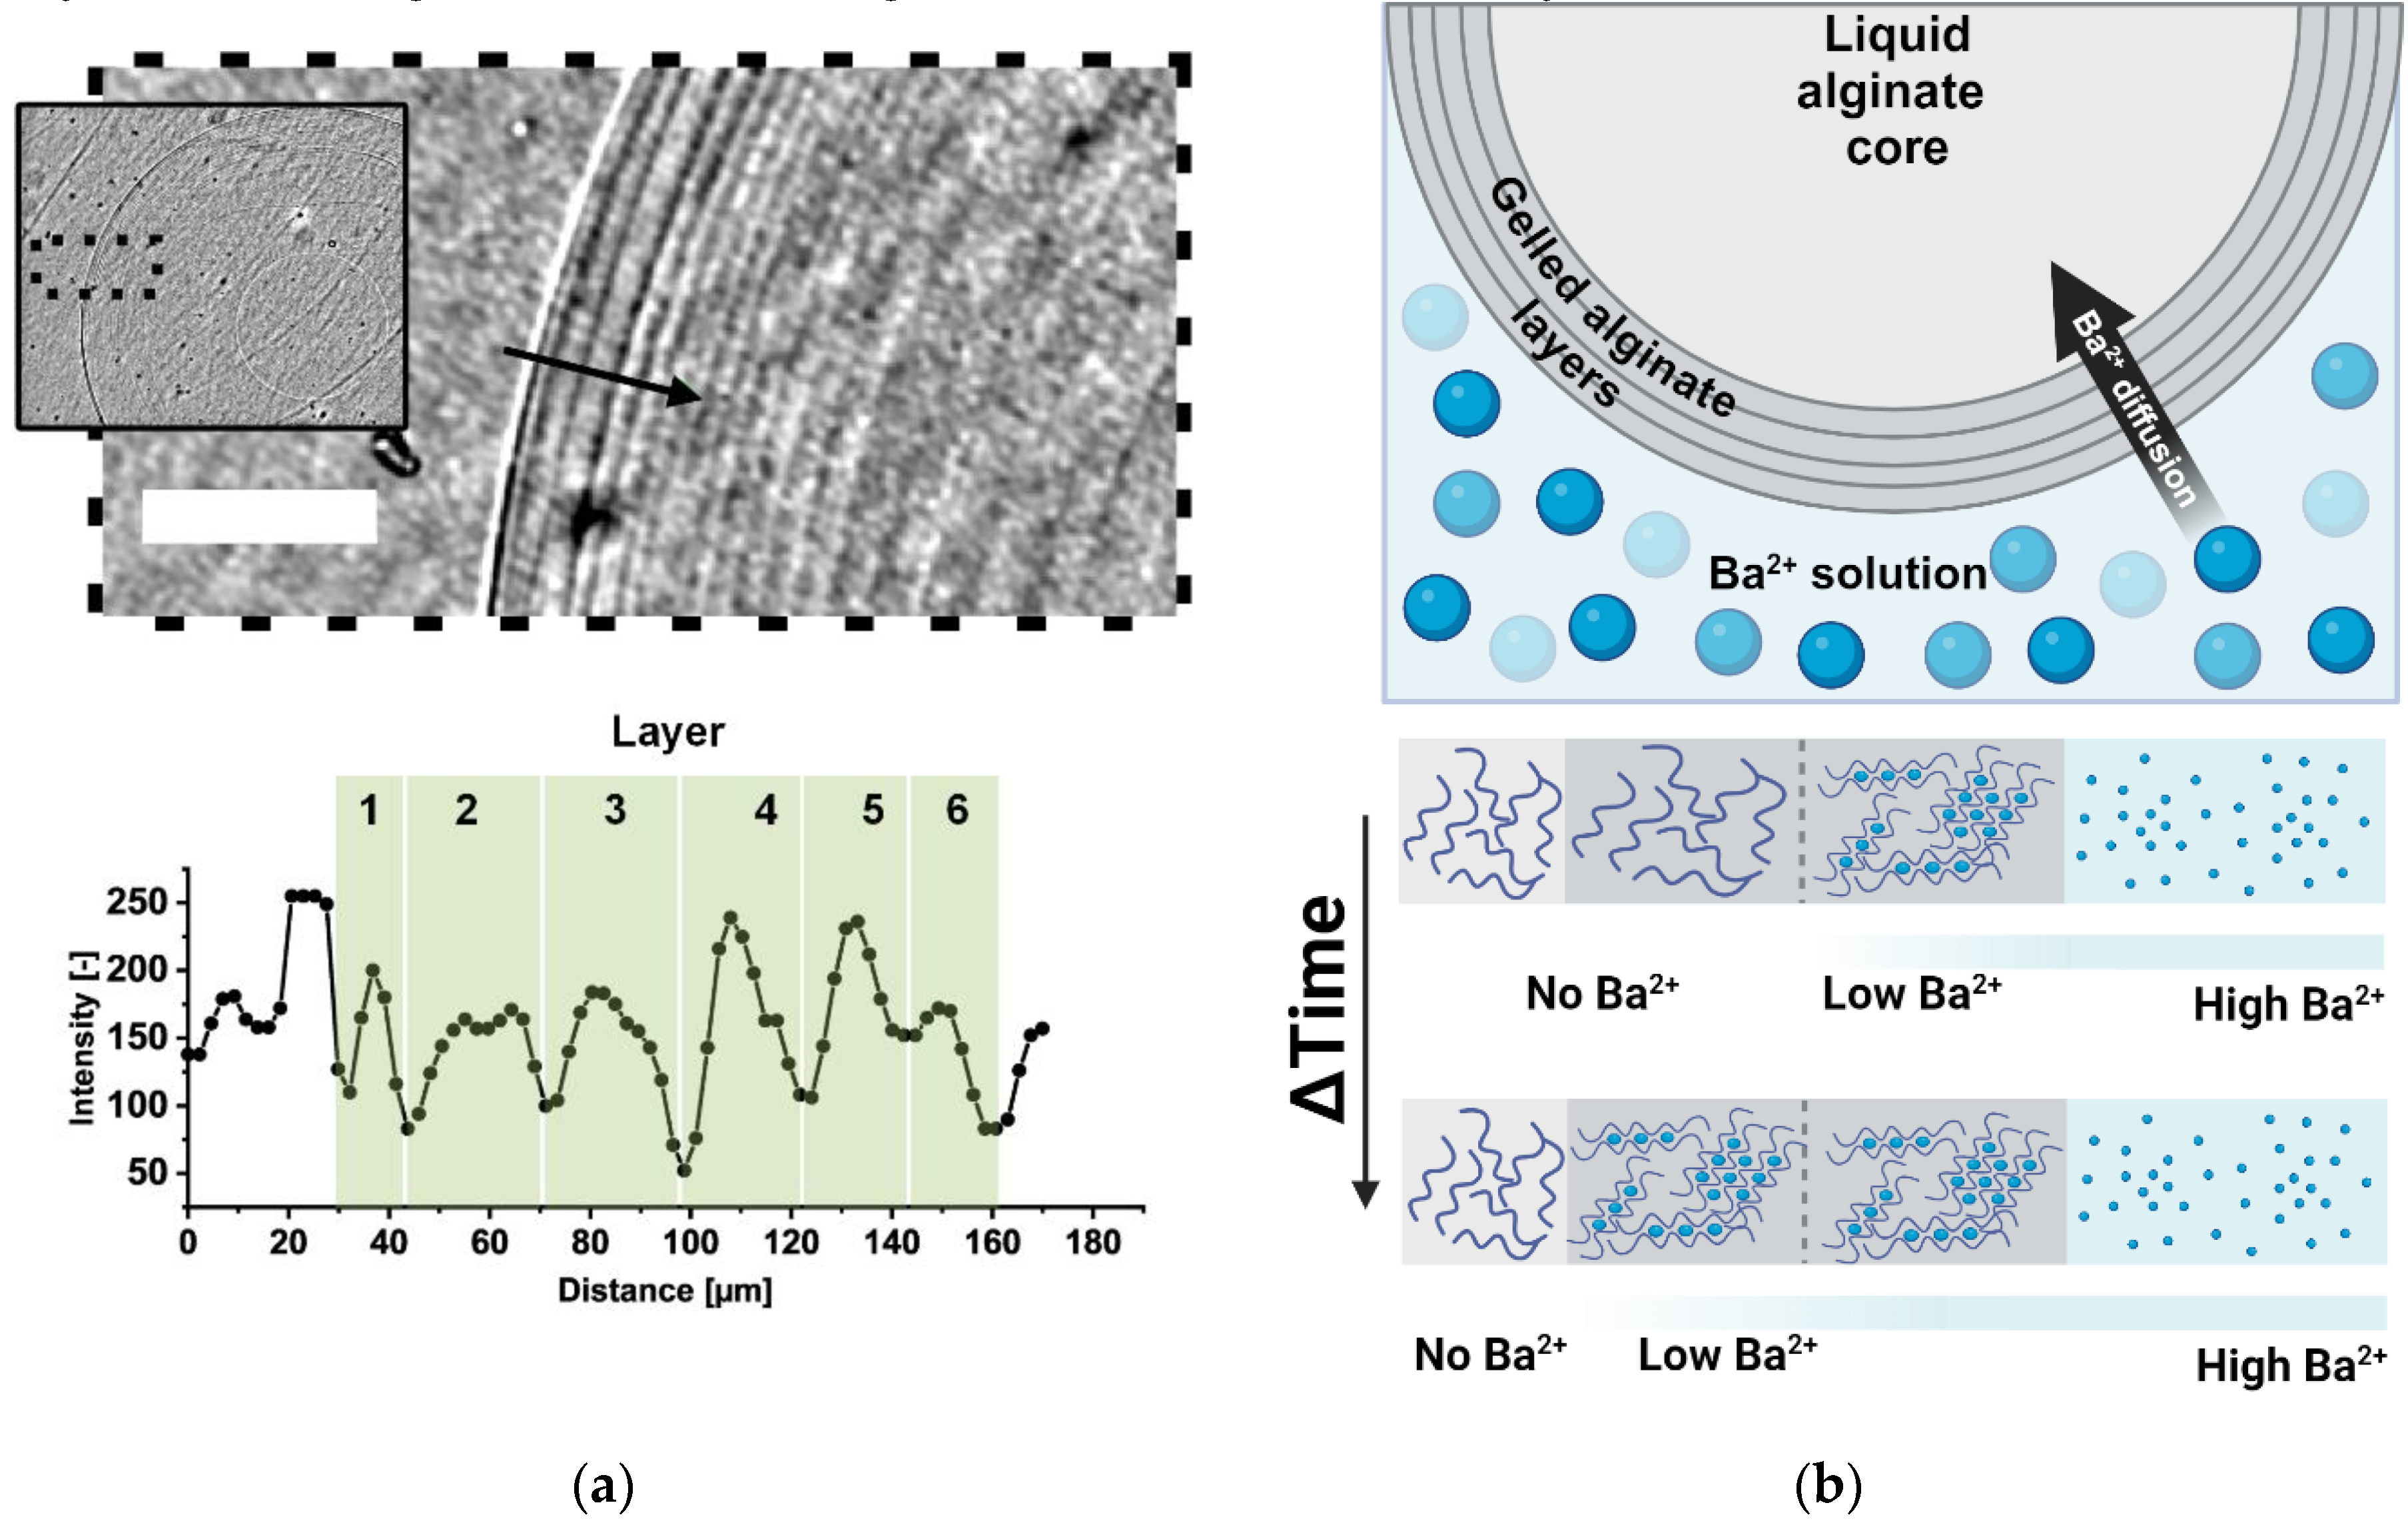

Table 1.
Model parameters.
| Variable | Parameter |
| 6.78E-12 m2/s | |
| 6.78E-9 m2/s | |
| 2.5 | |
| 2.3 | |
| 1.6E-1 | |
| 8.0E-2 | |
| 2.5E-2 | |
| 2.5E-2 |
Disclaimer/Publisher’s Note: The statements, opinions and data contained in all publications are solely those of the individual author(s) and contributor(s) and not of MDPI and/or the editor(s). MDPI and/or the editor(s) disclaim responsibility for any injury to people or property resulting from any ideas, methods, instructions or products referred to in the content. |
© 2024 by the authors. Licensee MDPI, Basel, Switzerland. This article is an open access article distributed under the terms and conditions of the Creative Commons Attribution (CC BY) license (http://creativecommons.org/licenses/by/4.0/).
Copyright: This open access article is published under a Creative Commons CC BY 4.0 license, which permit the free download, distribution, and reuse, provided that the author and preprint are cited in any reuse.


