
Submitted:
25 December 2024
Posted:
27 December 2024
You are already at the latest version
Abstract
Based on the panel data of 12 major cotton-producing provinces in China from 2000 to 2021, the green total factor productivity of cotton is calculated and decomposed by super efficiency EBM-GML index. On this basis, FGLS model is used to analyze the impact of environmental regulation on cotton GTFP and its mechanism. The results show that: First, the cotton GTFP in China has been rising in the undulation during the sample period, with an annual rate of 1.5%, and it is mainly driven by the green technology progress, with the deterioration of scale efficiency the main restricting factor. Secondly, agricultural environmental regulation contributes to improve the cotton GTFP. With the strengthening of environmental regulation, government increases the agricultural scientific research investments, which stimulates the innovation and improves the green production efficiency of cotton. Thirdly, there is a nonlinear reversed U-shaped relationship between agricultural environmental regulation and the cotton’s GTFP. Since the intensity of environmental regulation in each major cotton-producing province in China has not hit the optimal value yet, we recommend local governments to institute flexible environmental regulation policies that adapt more closely to each region to promote the green development of cotton industry.
Keywords:
cotton
; environmental regulation
; super efficiency EBM-GML
; FGLS model
1. Introduction
China's agricultural economy has grown rapidly at the the cost of serious environmental large environmental pollution for a long time since 2000. In order to reduce the double pressure from sustained economic growth and resource and environmental restrictions, China put forward the concept of "green development", providing a supportive macro-policy for the green transformation of agriculture (Yu, 2018). Subsequently, the government has led to explore a green development path, strengthen the prevention and control of agricultural non-point pollution, and legislate a series of policy regulations to promote the green and sustainable development of agriculture (Zhan and Xu, 2019). As the largest cotton consumer and the second largest major producer in the world, cotton farming occupies an important position in China's agricultural production (Yuan and Zhu, 2015). However, it is alarming that the ecological pollution in cotton fields has been increasingly serious in China due to excessive application of chemical fertilizers and pesticides, and residuals of production wastes such as mulch film (Ma et al., 2016; Qi et al., 2021). As is estimated, the cost of negative environmental externality in cotton production amounted to 7.61 billion yuan in 2012, which accounted for about 5.5% of its gross output value (Ma and Wang, 2015). The carbon emission of cotton production is on the rise with a peaking at 243,400 tons in 2018 (Wu et al., 2023), making it to be an important object of energy conservation and emission reduction in the crop industry. Therefore, this paper is of great practical significance to accurately grasp the current situation of green production of cotton in China and formulating strategies for green and efficient cotton production.
The green production efficiency is generally evaluated in terms of green total factor productivity (GTFP). GTFP in agriculture has received extensive attention from scholars. The previous research focuses on two aspects: first and foremost, the measurement of green total factor productivity and study on its spatio-temporal characteristics. As for the research object, the sub-industry studies have covered almost all of agriculture, forestry, animal husbandry and fishery (Liu et al., 2021; Tan, 2022; Xu et al., 2019; Yang et al., 2023). When it comes to the indicator selection, some studies regard carbon emissions as non-desired outputs, others use environmental costs, very few studies comprehensively consider the both to calculate green total factor productivity (Xu et al., 2019; Chen et al., 2019; Wang et al., 2017; Tan, 2022; Liu et al., 2021; Yang et al., 2023). In terms of the research methodologies, the improved SBM-ML index or GML index has been the most popular approaches to measure green total factor productivity in recent years. With respect to the cotton industry, scholars focus on the spatial variations and dynamic evolution of GTFP in cotton (Sun and Wang, 2020; Li et al., 2022).
The second hot research topic is put on the influencing factors of GTFP in agriculture. The mechanisms of factors such as land transfer, socialization of agricultural services, environmental regulation, and rural digitization are mainly explored (Ji et al., 2023; Cheng et al., 2022; Tao, 2015; Jin and Ren, 2022), among which, the impact of environmental regulation on GTFP of agriculture has not reached a consensus conclusion. Although the proponents of the "Porter hypothesis" believes that moderate environmental regulation could promote the growth of GTFP (Tao, 2015), there are still scholars verifying a negative, phased or non-linear relationship between the two (Liang et al., 2012; Huang et al., 2021).
By reviewing the literature, there is still room to improve the measurement of cotton’s green production efficiency. What’s more, there are few researches exploring the factors influencing GTFP of cotton. As the most powerful means for the government to guide the green development of agriculture, does agricultural environmental regulation promote the green production of cotton? And what is the mechanism? We believe that in-depth discussion of these questions will help to improve the policy effectiveness and efficiency. In view of this, this paper considers the carbon emissions and non-point pollution in cotton fields comprehensively, and employs the super-efficient EBM-GML index to calculate the green productive efficiency of cotton. We also test the impact and its mechanism of environmental regulations on the green productivity of cotton through FGLS regression. We hope that this research can draw out the basis for policy making for the green and low-carbon development of China's cotton plantation industry.
2. Theoretical Analysis, Methods and Data
2.1. Theoretical Analysis
Neo-Classical economics considers environmental regulation can only increase the operation cost of producers and crowd out input of technology innovation, and thus reduce the probability that producers engage in green innovative research and development (Barbera and McConnell, 1990). However, strict but reasonable environmental regulation can stimulate the "innovation compensation" effect in the long run (Porter and Vander, 1995). The scientific and technological progress driven by environmental regulation can promote agricultural productivity enhancement, and the benefits generated can partially or even completely offset the environmental costs (Ma and Tan, 2021). Unlike the industrial sector, the mainstay of agricultural scientific research and innovation is the government as well as its affiliated research institutions, that is, the subject conducting ER and that leading agricultural R&D are of the same. Considering the objectives of maximizing social welfare and optimizing economic benefits comprehensively, the government is bound to increase the investment in agricultural R&D under certain environmental regulation conditions, so as to enhance the productive efficiency of agriculture through green technology innovation (Tao, 2015). Based on the analysis above, the following two hypotheses are proposed.
Hypothesis 1: Agricultural environmental regulation positively affects green productivity of cotton.
Hypothesis 2: The positive impact of agri-environmental regulation on green productivity of cotton is realized mainly through technological innovation.
The relationship between ER and technological innovation is regulated by the degree of government intervention (Guo et al., 2018). When the intensity of ER is at a relatively low level, the cost of pollution control and technological innovation increases, but pollution emissions reduce at the same time. In this case, the "innovation compensation" effect is sufficient to offset the "cost of compliance"; when the intensity of ER exceeds the level of "appropriate policy design", the "cost of compliance" increases continuously until exceeds the "compensation for innovation" effect, at which point ER becomes detrimental to productive efficiency (Lanoie et al., 2008). Accordingly, the third hypothesis is proposed.
Hypothesis 3: The relationship between the intensity of ER in agriculture and green productivity of cotton is nonlinear.
2.2. Methods
2.2.1. Super-Efficient EBM-GML Modeling
The EBM model incorporates both radial and non-radial distance functions, effectively addressing the shortcomings of traditional radial DEA model and non-radial SBM model (Tone and Tsutsui, 2010; Yang et al., 2023). Therefore, the super-efficient, non-oriented EBM model was selected as the distance function to measure the green total factor productivity of cotton, which was used to characterize the green productivity of cotton in this paper. Suppose if there aredecision units, each withinputs andoutputs, the EBM model planning equation can be expressed as follows:
where and represent the slack variables of the input and output indicators, respectively; and denote the indicator weights of inputs and outputs; and represent the input and output matrices, respectively; and denote the efficiency values under the input and output orientations, respectively; is the degree of combinations of the different slack variables; and denote the non-radial weights of the input and output perspectives.
The growth index of GTFP is measured by the Global Malmquist-Luenberger (GML) index, which can be further decomposed into green technological change (GTC) and green efficiency change (GEC). The calculation formula is expressed as (Donghyun, 2010):
It can be further decomposed into Green Technology Progress (GTC) and Green Technology Efficiency (GEC):
where denotes the full directional distance function that depends on the set of global production possibilities ; signifies an increasing GTFP of cotton. On the contrary, indicates a decrease in the green total factor productivity. Similarly, and represent the improvement of green production efficiency and the advancement of green production technology, respectively. And if or , it implies that the green technological efficiency deteriorates and the green technology regresses.
2.2.2. Basic Regression Modeling
In order to examine the impact of agricultural environmental regulations on the green total factor productivity of cotton, and verify whether there is a mediating mechanism of agricultural research investment mediated the impact, we construct a basic regression model as follows:
where and represent the previous period of agricultural environmental regulation and the intensity of agricultural research investment, respectively. Taking into account the lagged effect of environmental regulation and research inputs, the lag variables of one period are substituted into the model here. is the set of control variables; and are individual and time fixed effects, respectively; is the error term; the interaction term between ER and RD is introduced to test the "innovation compensation" effect of environmental regulation. Additionally, we perform logarithmic processing on all variables for more accurate estimation results. According to the hypotheses proposed earlier, the coefficients and are taken as the basis for the subsequent analysis.
2.3. Selection of Variables
2.3.1. Measurement of GTFP
- (1)
- Input indicators. Land, labor and material and services inputs in cotton production are selected as input variables, among them the land input is measured by the cost per mu of land; the man-days devoted per mu is in token of labor input; the material and service inputs are measured by the cost of materials and services per mu (Sun and Wang, 2020).
- (2)
- Output indicators. The output of cotton production can be categorized to desired and non-desired parts. The former is expressed by the average yield per mu, while the latter can be represented by the carbon emissions per mu of cotton and the environmental cost of non-point source pollution in this research. The major carbon sources in cotton production include pesticides, fertilizers, plastic mulch, diesel, irrigation and seeding (Li et al., 2022). The carbon emissions from cotton production are calculated according to the carbon emission coefficients published by IPCC, which are shown in Table 1.
The environmental cost of cotton production refers to the environmental loss of soil pollution, water pollution and air pollution caused by the use of fertilizer, pesticide and mulch film (Ma and Wang, 2015). It can be calculated using the formula:
where is the environmental cost of chemical pollution in cotton production; is the input of chemical substance ; is unit environmental cost of .
2.3.2. Variable Setting of the Basic Regression Model
The green total factor productivity of cotton is the explained variable in this study, which is expressed by the cumulative GTFP measured in the previous section.
The agricultural environmental regulation (ER) is the core explanatory variable. Restricted by the obstacles in data acquisition and measurement, the fertilizer price excluding inflation is taken as a proxy variable for the intensity of ER in this paper (Hille and Moblus 2019). The intensity changes of environmental regulatory policies can be reflected in the prices of such inputs to some extent. From the perspective of "following costs", using fertilizer prices can better overcome the measurement challenge of policy intensity (Brunel and Levinson, 2016).
The intensity of agricultural research investment (RD) is an important mechanism variable. After estimating the stock of agricultural science and research in each province by the perpetual inventory method (Xiao and Li, 2013), the ratio of the stock to the regional agricultural GDP is used to express the input intensity of agricultural research.
Meanwhile, ten variables closely related to green cotton production are selected as control variables for this study. ① Regional industrial structure (Indus), represented by the index of industrial structure upgrading (Xu and Jiang, 2015). The improvement of GTFP results from better disposing resources, which is affected by economic, social and policy factors. The difference of regional industrial structure leads to differences in agricultural environmental constraints. ② Urbanization rate (Urbni), expressed by the proportion of urban population. Changes in the relative factor prices induced by urbanization can accelerate the mutual substitution among factors of agricultural production, which affects agricultural production efficiency ultimately. ③ Disposable income per capita of rural residents (Incom). The mode of agricultural production and green technologies selected are closely related to the income of peasant household. ④ Degree of crop damage (Disas), that is, the ratio of crop-affected area to sown area, a yardstick of natural talent of agriculture. ⑤ Irrigation condition (Irri), measured by the ratio of the area irrigated effectively to that sown. ⑥ Rural electricity level (Elec), expressed as the overall rural power consumption. Electricity is the main power for agricultural production and peasant’ living. ⑤ and ⑥ can reflect the condition of agricultural infrastructure comprehensively, which is essential to technology diffusion. ⑦ Intensity of fiscal support for agriculture (Finac). It refers to the share of local fiscal expenditure on supporting agriculture, forestry and water affairs in the general budget. Typically, the government supports the green development of agriculture by investing in agricultural technology research and development. ⑧ Rural human capital (Edu), represented by the average schooling years of farmers here. Theoretically, the higher the degree of education is, the easier it is for farmers to accept and master green production technology. ⑨ Planting scale of cotton per capita (Scale). ⑩ Situation of land transfer (Trans), expressed by land rent per mu. Moderate scale operation of ploughland is conducive to the promotion of green technology.
2.4. Data Sources
The sample for this study consists of cross-period panel data from 12 major cotton-producing provinces in China from 2000 to 2021. The data comes from the Compilation of National Agricultural Product Cost-Benefit Data, China Statistical Yearbook, China Rural Statistical Yearbook, and China Population and Employment Statistical Yearbook. Missing values are imputed using the arithmetic mean of the values from the previous and following years. Additionally, all price-related indicators are adjusted to constant 1999 prices using price indices. The statistical characteristics of variables were shown in Table 2.
3. Results and Discussion
3.1. Characteristics of Changes in GTFP of Cotton
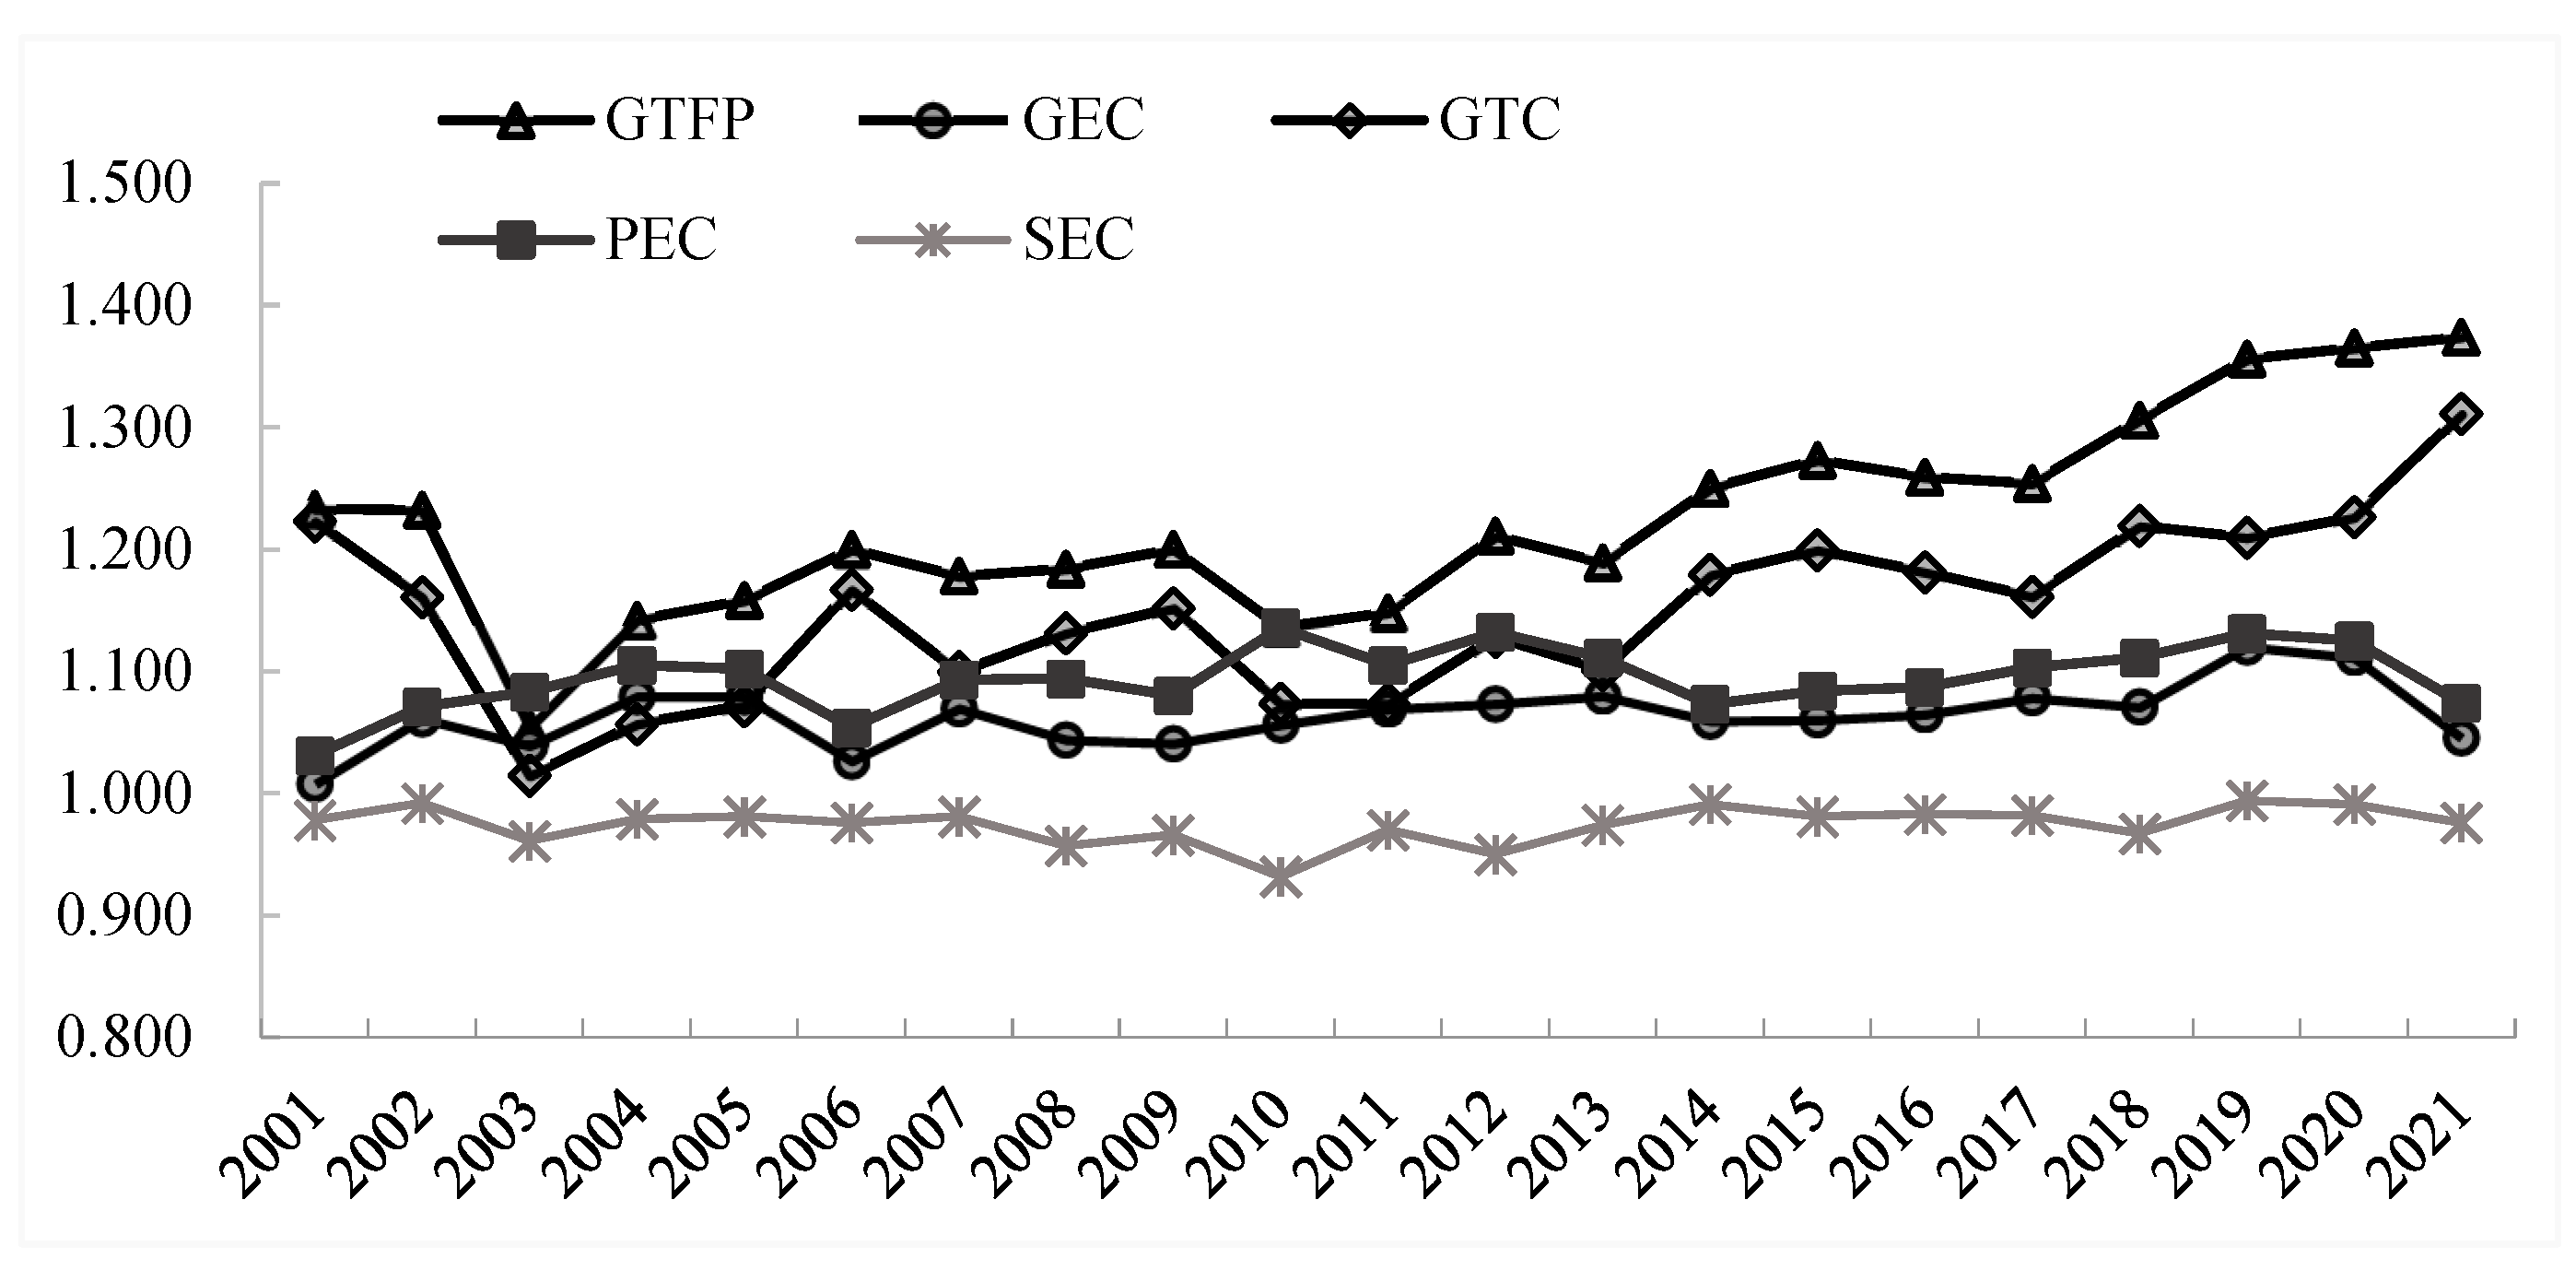
Using Matlab software, the green total factor productivity (GTFP), green technical efficiency index, green technological progress index, pure technical efficiency, and scale efficiency index for each major cotton-producing province from 2001 to 2021 are calculated. For ease of comparison, the data are converted into cumulative indices based on the year 2000 and averaged for each year. The mean values and decomposition results are listed in Table 3.
As is shown in Table 3 and Figure 1, China's green production efficiency of cotton exhibits an overall fluctuating upward trend, with an average of 1.015 and an annual growth rate of 1.5%. The trend of the green technological progress index aligns with the change in GTFP, with an average annual growth of 1.3%. However, green technical efficiency grows slowly, with an annual growth rate of only 0.2%. The decomposed pure technical efficiency grows at an annual average rate of 0.3%, while the growth rate of scale efficiency is less than 1%. The above results implies that the growth of China's cotton GTFP is mainly driven by the progress of green technology rather than the enhancement of green technical efficiency. At the current technological level, cotton farmers are using resources such as pesticides, fertilizers, plastic mulch, and machinery efficiently. The root cause of the inefficiency in green technical efficiency lies in the ineffectiveness of scale, suggesting that there is an urgent need to improve the promotion and application of green technologies in cotton production.
3.2. Results of Basic Regression
The model perturbation terms may suffer from heteroskedasticity, serial correlation, or contemporaneous correlation between groups due to the large time span of the empirical data. In this regard, we firstly estimate the model with two methods, the fixed effects model (FE) and the feasible generalized least squares regression (FGLS), respectively. The results are shown in Table 4. The comparison reveals that the core explanatory variables and control variables act in essentially the same direction. Then, we conduct several tests to select a more appropriate and accurate model. The existence of heteroskedasticity is demonstrated through the Greene Wald test. The Wooldridge Wald test indicated there is a first-order intra group autocorrelation and the Frees test reveals the existence of between-group contemporaneous correlation. Therefore, the results of FGLS estimation are finally selected for the subsequent analysis in this paper.
As is shown in Table 4, environmental regulations in agriculture substantially contributes to cotton green total factor productivity over the sample period. For every 1 unit increase in the intensity of ER, the cotton GTFP has improved by 0.574 units, a result that passes the significance test at the 1% level. It is concluded that ER helps to enhance economic efficiency ultimately while inducing the cotton production process to reduce resource depletion and pollution emissions. The theoretical hypothesis 1 is confirmed.
The coefficient of the cross terms of agricultural ER and RD is positive and significant at the 1% level, indicating that with the strengthening of environmental regulation, the government invests more on RD of green technology to the end of social welfare maximization, which effectively promotes the progress of green technology. At the same time, ER pushes farmers to carry out technological innovations in farming, fertilizing and handling of plants by ordering, exhorting, or guiding them. At this point, the innovation effect of ER is sufficient to compensate for the negative externality of pollution and thus the GTFP goes up. The theoretical hypothesis 2 is confirmed.
After adding the square term of ER, the coefficient of the quadratic term is significantly negative with a positive coefficient of primary term, both of which are significant at the 1% level. This reveals an obvious “inverted-U” relationship between ER and cotton’s GTFP. That is to say, there must be an optimal value for the intensity of ER in cotton production, at which the cotton GTFP would be the highest. If the intensity of ER is lower than the optimal value, the "innovation compensation" effect surpasses the "cost of compliance" effect, and thus the cotton GTFP can be improved. However, once the optimal value is exceeded, continuously increasing expenditures in environmental protection can crowd out the resources of green technological innovation. At this point, cotton’s GTFP begins to decline with strengthened ER. The theoretical hypothesis 3 is confirmed.
3.3. Further Discussion
The most commonly used environmental regulatory policies in cotton’s production in China can be classified into broad categories as command-based, incentive-based and guidance-based. Command-based regulation refers to direct intervention in the use of environmental resources through administrative orders, and once the relevant actors break the law, they will be punished according to the rules or laws (Hu, 2022). The command-based regulations dominate in the field of agriculture (Yuan and Zhu, 2015). For example, in order to curb “white pollution” in farmland, the Regulations on the Management of Agricultural Mulch has been implemented in Xinjiang Uygur Autonomous Region since 2016, which specifies the punishment standards for actors who produce, sell or use mulch films that does not meet the standards. Incentive-based regulations are mainly manifested in the form of subsidies, such as subsidies for residual film recycling and the purchase of machinery for residual film recycling, aiming at mobilizing farmers to participate in the remediation of waste film; subsidies for the protection of cultivated land fertility that encouraged the adoption of green production technologies such as straw returning, soil deep loosening, applying organic fertilizers and so on. Providing technical training is a typical guidance-based regulation. It can not only promote efficient, green, and simplified cotton planting methods through teaching and field guidance, but also strengthen the producers’ awareness of green production. The regression results show that combined environmental regulations have significantly increased the green productivity of cotton.
The effect of investment in agricultural RD on cotton’s GTFP turns out to be negative but not that significant. As is well-known, due to the quasi-public goods attribute of agricultural technology, technical investment in agriculture is basically led by the government or scientific research institutions. Endogenous growth theory regarded endogenous technological progress as the source of sustained economic growth, and the increasing RD investment becomes a primary path to promote the technological advances in agriculture. However, on the one hand, the impact of technical is not instantly apparent. It takes quite a long time from research investment to the generation of results and then to the effective diffusion of technology. On the other hand, China's agriculture has not yet fundamentally transformed from the rough mode that relies on resource consumption. The government did not put forward the concept of "green development" until 2015 (Yu, 2018), which guides the practices of green transformation in agricultural technical research and development in the ensuing years. This may be the reason why agricultural RD does not play a significant and positive role in the sample period. In order to verify the conjecture, we try to adjust the sample period to 2016-2021, and after re-regression, it is found that the coefficient of agricultural RD is 0.180, which passes the significance test at the 1% level.
In addition, we make further research to explore the inverted U-shaped effect of ER and attempt to find its optimal value. The "threshold value" of ER intensity on cotton’s GTFP is about 1.9397 after taking the logarithm. Taking the data in 2021 for an example, the intensity of ER in all major producing provinces locate on the left side of the inflection point, which means that strengthening the environmental regulation moderately will still be effective to improve the cotton’s GTFP.
3.4. Robustness Test
In order to test the robustness of above results, this paper employs three ways of replacing the core explanatory variables, shortening the sample period and shrink-tailed regression. First, pollution emission intensity is most commonly used as a proxy variable for agricultural ER (Shi and Yi, 2020). In general, the greater the intensity of ER, the corresponding decrease in the amount of pollution. We find that the effect of ER on cotton GTFP remains significant after replacing the core explanatory variables from the results shown in Column (1) of Table 5. Secondly, to exclude the external impact such as Covid-19 on cotton production and other related industries, we adjust the study period to 2000-2019 and find that the estimation results remain robust, as is shown in Column (2) of Table 5. Finally, the core explanatory variables are subjected to before and after 1% shrinkage so as to reduce the impact of outliers. Results in Column (3) of Table 5 shows that no fundamental changes occur in the effect of ER on cotton’s GTFP after shrinking.
4. Conclusions
This study is based on the panel data from the major cotton-producing provinces from 2000 to 2021, attempting to explore the impact of agricultural environmental regulation on the green development of cotton industry and its mechanism. The main conclusions are as follows:
First, the green development level of cotton production in China turns out to be a fluctuating upward trend from 2000 to 2021. It is primarily driven by green technological progress, with a smaller contribution from green technical efficiency. Ineffective scale operations constrained the improvement of green technical efficiency, indicating that the promotion and application of green technologies is a pressing issue under current conditions.
Second, environmental regulations have promoted the green development of the cotton industry, mainly through increasing the inputs on green technology innovation. Due to the same dominant position in environmental regulation and agricultural research and development, the government has gradually increased the investment in agricultural research while strengthening environmental regulation. This promotes the progress of green technology and pushes farmers to adopt innovative technologies in production, ultimately improving the green productivity of cotton.
Third, there is a non-linear "inverted U-shaped" relationship between environmental regulation and efficiency of cotton green production. When the intensity of regulation does not reach the optimal value, cotton green productivity increases; when it exceeds the optimal value, further strengthening environmental regulation is not conducive to cotton’s green production.
Based on these findings, we put forward recommendations from three aspects to better utilize environmental regulatory measures to promote cotton’s green production:
First, to crackle the chronic problem of low green technical efficiency, it is necessary to continue cultivating new types of agribusinesses and developing specialized agricultural service providers, creating an environment enabling the promotion and transformation of the green technological achievements by the large-scale and industrialized development of cotton.
Second, to increase investment in science and technology focusing on research and development of high-effective and environment-friendly agricultural chemicals, as well as technologies suitable for small-scale cotton production, especially small machinery suitable for hilly and mountainous areas. In that way, the technical level of cotton production for small farmers in inland cotton areas can be improved.
Finally, to formulate flexible environmental regulatory policies based on the level of local economic development and the environmental regulatory intensity of each province at the position of the "inverted U-shaped" curve. For example, in Shaanxi and Gansu, where farmers have relatively low incomes, incentive-based regulatory measures may be more effective in guiding the green behavior of cotton producers.
Author Contributions
Qingjun Wu: Formal analysis, Methodology, Software, Writing—original draft. Yue Sun: Methodology, Data curation, Visualization. Xiaodi Zhao: Conceptualization, Funding acquisition, Formal analysis, Writing- review & editing.
Funding
This research was funded by the Fundamental Research Funds of Chinese Academy of Forestry, Theoretical Framework and Method for Accurate Estimation of the Full Life-Cycle Carbon Sink Potential in Masson Pine Artificial Monoculture Forests (CAFYBB2023MB019), and the Fundamental Research Funds of Chinese Academy of Forestry, Precision Estimation Study of Carbon Sink Potential in Deciduous Forests in the Yellow River Basin (CAFYBB2023PA006-02).
Conflicts of Interest
The authors declare that they have no conflict of interest.
Appendix A

Table A1.
Main carbon sources and carbon emission coefficients in arable land utilization.
| Carbon source | Carbon emission coefficient | Data sources |
| Fertilizer | 0.8956kg/kg(C) | Oak Ridge National Laboratory, USA |
| Pesticide | 4.9341kg/kg(C) | Oak Ridge National Laboratory, USA |
| Plastic Mulch | 5.18kg/kg(C) | Institute of Agricultural Resources and Ecological Environment, Nanjing Agricultural University |
| Diesel | 0.5927kg/kg(C) | IPCC |
| Irrigation | 266.48kg/hm2(C) | West and Marland, 2011 |
| Seeding | 312.6kg/km2(C) | College of Biological Sciences and Technology, China Agricultural University (Wu et al., 2007) |
Table A2.
Descriptive statistic of the variables.
| Variable | Mean | Std | Min | Max |
| GTFP | 1.254 | 0.288 | 0.762 | 2.078 |
| ER | 3.623 | 0.771 | 2.011 | 9.368 |
| RD | 0.462 | 0.647 | 0.079 | 3.959 |
| Indus | 2.305 | 0.083 | 2.116 | 2.481 |
| Urbni | 47.022 | 10.704 | 24.430 | 73.940 |
| Incom | 8010.751 | 5279.509 | 1529.100 | 26790.800 |
| Disas | 21.653 | 13.747 | 0.993 | 69.520 |
| Irri | 42.828 | 14.635 | 26.620 | 92.810 |
| Elec | 268.662 | 387.565 | 25.500 | 2010.960 |
| Finac | 9.296 | 4.100 | 2.120 | 20.380 |
| Edu | 8.554 | 0.640 | 6.690 | 9.910 |
| Scale | 1.009 | 2.058 | 0.001 | 12.310 |
| Trans | 95.293 | 48.371 | 9.820 | 260.950 |
Table A3.
GTFP of cotton and its decomposition (from 2000 to 2021).
| Periods | GTFP | GEC | GTC | PEC | SEC | Cumulative GTFP |
| 2000~2001 | 1.233 | 1.008 | 1.223 | 1.031 | 0.978 | 1.233 |
| 2001~2002 | 0.999 | 1.053 | 0.949 | 1.039 | 1.014 | 1.232 |
| 2002~2003 | 0.856 | 0.979 | 0.874 | 1.011 | 0.969 | 1.054 |
| 2003~2004 | 1.083 | 1.039 | 1.042 | 1.020 | 1.019 | 1.142 |
| 2004~2005 | 1.014 | 1.000 | 1.014 | 0.998 | 1.002 | 1.158 |
| 2005~2006 | 1.036 | 0.951 | 1.089 | 0.956 | 0.995 | 1.200 |
| 2006~2007 | 0.982 | 1.042 | 0.942 | 1.037 | 1.005 | 1.178 |
| 2007~2008 | 1.005 | 0.976 | 1.029 | 1.001 | 0.975 | 1.184 |
| 2008~2009 | 1.014 | 0.997 | 1.018 | 0.987 | 1.010 | 1.200 |
| 2009~2010 | 0.946 | 1.015 | 0.932 | 1.052 | 0.965 | 1.136 |
| 2010~2011 | 1.011 | 1.012 | 1.000 | 0.973 | 1.040 | 1.148 |
| 2011~2012 | 1.055 | 1.004 | 1.051 | 1.024 | 0.980 | 1.211 |
| 2012~2013 | 0.982 | 1.006 | 0.976 | 0.982 | 1.025 | 1.189 |
| 2013~2014 | 1.051 | 0.981 | 1.071 | 0.965 | 1.017 | 1.250 |
| 2014~2015 | 1.018 | 1.001 | 1.017 | 1.011 | 0.990 | 1.273 |
| 2015~2016 | 0.989 | 1.004 | 0.985 | 1.002 | 1.002 | 1.259 |
| 2016~2017 | 0.996 | 1.013 | 0.983 | 1.015 | 0.999 | 1.254 |
| 2017~2018 | 1.042 | 0.993 | 1.050 | 1.007 | 0.985 | 1.306 |
| 2018~2019 | 1.038 | 1.046 | 0.992 | 1.018 | 1.028 | 1.356 |
| 2019~2020 | 1.007 | 0.992 | 1.014 | 0.995 | 0.997 | 1.365 |
| 2020~2021 | 1.006 | 0.941 | 1.069 | 0.955 | 0.985 | 1.374 |
| Mean | 1.015 | 1.002 | 1.013 | 1.003 | 0.999 | - |
Note: PEC and SEC denote pure technical efficiency and scale efficiency, respectively.
Table A4.
The estimated values of coefficients in base regression.
| Variables | FE | FGLS | ||
| Coefficient | Std | Coefficient | Std | |
| lnER | 0.741** | 0.278 | 0.574*** | 0.065 |
| ln2ER | -0.166** | 0.069 | -0.148*** | 0.017 |
| lnER×lnRD | 0.064 | 0.044 | 0.044*** | 0.008 |
| lnRD | -0.062 | 0.056 | -0.014 | 0.013 |
| Indus | 1.597** | 0.593 | 0.630*** | 0.094 |
| Urbni | -0.244* | 0.111 | -0.144** | 0.060 |
| Incom | 0.079 | 0.063 | -0.100*** | 0.025 |
| Disas | -0.016 | 0.014 | -0.003 | 0.002 |
| Irri | 0.215* | 0.107 | 0.054*** | 0.020 |
| Elec | -0.065 | 0.040 | 0.003 | 0.006 |
| Finac | 0.014 | 0.028 | 0.084*** | 0.005 |
| Edu | -0.014 | 0.446 | 1.563*** | 0.084 |
| Scale | -0.041 | 0.014 | -0.040*** | 0.004 |
| Trans | -0.126** | 0.025 | -0.145*** | 0.002 |
| Constant | -1.434*** | 0.278 | -2.379*** | 0.191 |
| Wald Test | - | 5655.15 | ||
Note: *, **, and ***, significant at the 0.1,0.05, and 0.01 levels, respectively.
Table A5.
Results of robustness test.
| Variable | (1) | (2) | (3) |
| FE | FE | FE | |
| lnER | -1.580** (-3.04) |
0.714*** (2.91) |
0.662*** (3.04) |
| ln2ER | 0.264*** (3.18) |
-0.167** (-2.50) |
-0.143* (-1.88) |
| lnER×lnRD | 0.070 (1.60) |
0.045* (1.81) |
0.038 (1.15) |
| Z | Control | Control | Control |
| Constant | 1.900 (1.67) |
-1.544*** (-2.91) |
-1.047** (-2.87) |
| N | 252 | 228 | 239 |
| R2 | 0.4419 | 0.4273 | 0.4408 |
Figure A1.
Cumulative indices of cotton GTFP and its decomposition (from 2000 to 2021).
References
- Barbera, A.J. , McConnell, V.D., 1990. The impact of environmental regulations on industry productivity: Direct and indirect effects. Journal of Environmental Economics and Management 18(1), 50-65.
- Brunel, C. , Levinson, A., 2016. Measuring the stringency of environmental regulations. Review of Environmental Economics & Policy 10(1), 47-67.
- Chen, Z.K. , Zhang, J.B., Cheng, L.L., He, K., 2019. How carbon emission affect rice total factor productivity. Journal of China Agricultural University 24, 197-213.
- Cheng, Y.S. , Zhang, D.Y., Wang, X., 2022. Green development effect of agricultural socialized services: An analysis based on farming households’ perspective. Resources Science 44, 1848-1864. [CrossRef]
- Dong-hyun, O. , 2010. A global Malmquist-Luenberger productivity index. Journal of Productivity Analysis 34(3), 183-197.
- Duan, H.P. , Zhang, Y., Zhao, J.B., Bian, X.M., 2011. Carbon footprint analysis of farmland ecosystem in China. Journal of Soil and Water Conservation 25, 203-208.
- Guo, Y.Y. , Zhang, S., Zhang, D.P., 2018. The impacts of environmental regulation and governmental R&D funding on green technology innovation: suppressing or promoting? -A Literature Review. East China Economic Management 32, 40-47.
- Hille, E. , Mobius, P., 2019. Do energy prices affect employment? Decomposed international evidence. Journal of Environmental Economics & Management 96, 1-21.
- Hu, Z.C. , 2022. Research on the path of different types of environmental regulations to promote carbon emission reduction—Structural change and clean technology innovation. Journal of Industrial Technological Economics 41, 61-67.
- Huang, W.H. , Qi, C.J., Fang, G.Z., Lei, Q.Y., 2021. Does the agricultural environment regulation promote the improvement of wheaten GTFP? Resources and Environment in the Yangtze Basin 30, 459-471.
- Jin, S.R. , Ren, Z.J., 2022. The impact of rural digitalization on agricultural green total factor productivity. Reform 346, 102-118.
- Ji, X.Q. , Li, Z.Q., Zhang, Y.S., 2023. Influence of rural land transfer on agricultural carbon emissions and its spatial characteristics. Resources Science 45, 77-90.
- Lanoie, P. , Party, M., Lajeunesse, R., 2008. Environmental regulation and productivity: Testing the Porter Hypothesis. Journal of Productivity Analysis 30, 121-128.
- Li, Q.N. , Yao, J., Tang, H.S., Xiong, C.J., 2022. Low carbon productivity, regional differences and dynamic evolution of cotton in Xinjiang. Journal of Arid Land Resources and Environment 36, 1-8.
- Liang, L.T. , Qu, F.T., Feng, S.Y., 2012. Agricultural technical efficiency measurement under the environmental constraints. Journal of Natural Resources 27, 1580-1589.
- Liu, Y.W. , Ou, Y.Y., Cai, H.Y., 2021. Evaluation of China’s agricultural green TFP and its spatial-temporal evolution characteristics. The Journal of Quantitative & Technical Economics 38, 39-56.
- Ma. G.Q., Tan, Y.W., 2021. Impact of environmental regulation on agricultural green total factor productivity—Analysis based on the panel threshold model. Journal of Agrotechnical Economics 5, 77-92.
- Ma, Q. , Wang, Y.P., 2015. Evaluating the externally environmental cost of cotton production in Xinjiang. Journal of Arid Land Resources and Environment 29, 63-68.
- Ma, Y.L.T.P.X. , Fu, Q.N.Y.Y.L.W.S., A, S.Y.T.H.T., 2016. Impact factors of excessive household fertilization: A case study of cotton growing in Xinjiang, China. Cotton Science 28, 619-627.
- Porter, M.E. , Vander, Linde C., 1995. Reply. Harvard Business Review, 206.
- Qi, H. , Zhao, G.Y., Wang, Y., Liu, J.G., Geng, Z., Dou, H.K., Zhang, H.S., Wang, Y.Q., 2021. Research progress on pollution hazards and prevention measures of residual film in cotton field in China. Cotton Science 33, 169-179.
- Shi, H.P. , Yi, M.L., 2020. Environmental regulation, non-farm part-time employment and non-point agricultural pollution—the case of fertilizer application. Rural Economy 453, 127-136.
- Sun, L.Y. , Wang, L., 2020. Measurement and regional differences of environmental total factor productivity of cotton in China—Based on a new Malmquist—Luenberger index approach. Journal of Arid Land Resources and Environment 34, 9-15.
- Tan, S.P. , 2022. Measurement and influencing factors of the total green factor productivity of forestry in China. Journal of Central South University of Forestry & Technology 42, 202-210.
- Tao, Q.S. , 2015. Empirical analysis on the conductive mechanism of environmental regulation to innovation of agricultural science and technology. Science and Technology Management Research 35, 254-258.
- Tone, K. , Tsutsui, M., 2010. An epsilon-based measure of efficiency in DEA: a third pole of technical efficiency. European Journal of Operational Research 207, 1554-1563.
- Wang, H. , Mu, Y.Y., Hou, L.L., 2017. Research on temporal and spatial evolution of environmental cost and total factor productivity of maize production in China. Journal of Natural Resources 32, 1204-1216.
- West, T.O. , Marland, G., 2002. A synthesis of carbon sequestration, carbon emissions, and net carbon flux in agriculture: Comparing tillage practices in the United States. Agriculture, Ecosystems and Environment 91(1), 217-232.
- Wu, F.Q. , Huang, W.B., Chen, J.L., Han, Y.C., Feng, L., Wang, G.P., Li, X.F., Li, Y.B., Wang, Z.B., 2023. Carbon emission accounting and carbon peak prediction for cotton production in China. Journal of AgroEnvironment Science 42, 692-704.
- Wu, L.F. , Li, L., Zhang, H.L., Chen, F., 2007. Effects of conservation tillage on net carbon flux from farmland ecosystems. Chinese Journal of Ecology 173, 2035-2039.
- Xiao, X.Y. , Li, Q.P., 2013. Agricultural production: accumulation of science and technology and the spatial spillover—A research based on the spatial panel data between 1986-2010. Economic Issues in China 276, 43-50.
- Xu, B.W. , Shen, Z.Y., Lin, G.H., 2019. Evolution of green total factor productivity and regional disparity in China’s husbandry. Chinese Journal of Eco-Agriculture 27, 613-622.
- Xu, M. , Jiang, Y., 2015. Can the China’s industrial structure upgrading narrow the gap between urban snd rural consumption. The Journal of Quantitative & Technical Economics 32, 3-21.
- Yang, Z.Y. , Peng, L.W., Yan, Z.F., 2023. Dynamic evolution and convergence analysis of green development level of freshwater aquaculture in China—From the perspective of green total factor productivity. Journal of Agrotechnical Economics (12), 1-21.
- Yu, F.W. , 2018. An analysis of the reasons, core and counter measures of agricultural green development in the New Era. Chinese Rural Economy 401, 19-34.
- Yuan, P. , Zhu, L.Z., 2015. Agricultural pollution prevention and control in China: deficiencies of environmental regulation and the stake holder's adverse selection. Issues in Agricultural Economy 431, 73-80+112.
- Zhan, J.T. , Xu, Y.J., 2019. Environmental regulation, agricultural green TFP and grain security. China Population, Resources and Environment 29, 167-176.
Figure 1.
Cumulative indices of cotton GTFP and its decomposition (from 2000 to 2021).
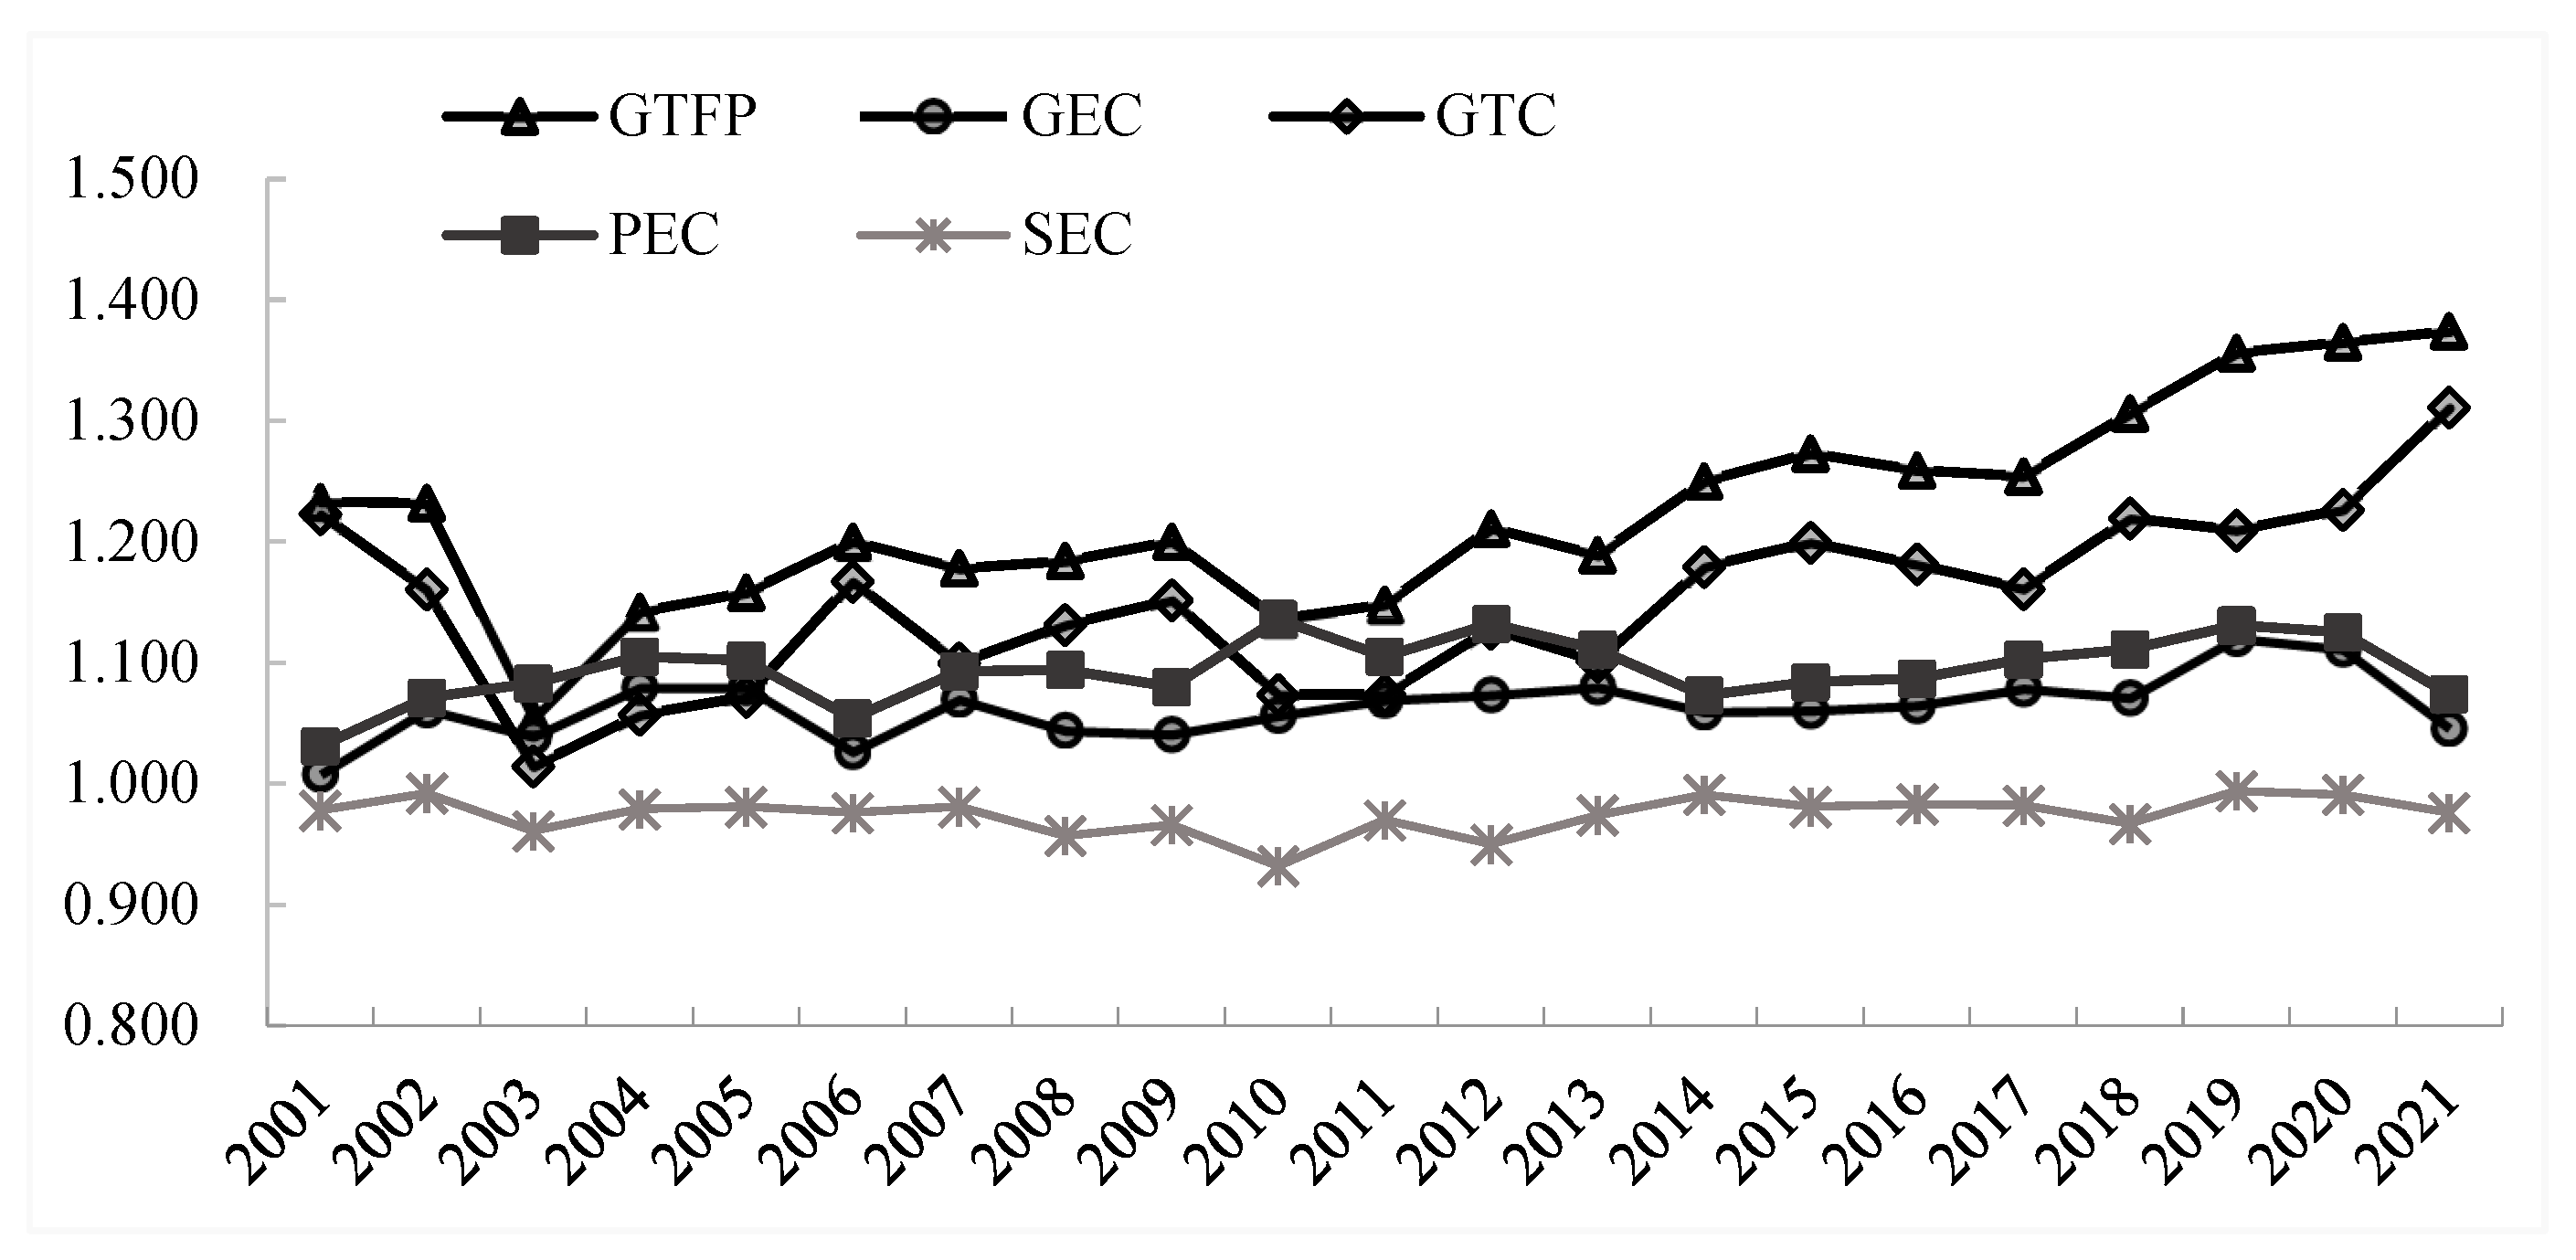
Table 1.
Main carbon sources and carbon emission coefficients in arable land utilization.
| Carbon source | Carbon emission coefficient | Data sources |
|---|---|---|
| Fertilizer | 0.8956kg/kg(C) | Oak Ridge National Laboratory, USA |
| Pesticide | 4.9341kg/kg(C) | Oak Ridge National Laboratory, USA |
| Plastic Mulch | 5.18kg/kg(C) | Institute of Agricultural Resources and Ecological Environment, Nanjing Agricultural University |
| Diesel | 0.5927kg/kg(C) | IPCC |
| Irrigation | 266.48kg/hm2(C) | West and Marland, 2011 |
| Seeding | 312.6kg/km2(C) | College of Biological Sciences and Technology, China Agricultural University (Wu et al., 2007) |
Table 2.
Descriptive statistic of the variables.
| Variable | Mean | Std | Min | Max |
| GTFP | 1.254 | 0.288 | 0.762 | 2.078 |
| ER | 3.623 | 0.771 | 2.011 | 9.368 |
| RD | 0.462 | 0.647 | 0.079 | 3.959 |
| Indus | 2.305 | 0.083 | 2.116 | 2.481 |
| Urbni | 47.022 | 10.704 | 24.430 | 73.940 |
| Incom | 8010.751 | 5279.509 | 1529.100 | 26790.800 |
| Disas | 21.653 | 13.747 | 0.993 | 69.520 |
| Irri | 42.828 | 14.635 | 26.620 | 92.810 |
| Elec | 268.662 | 387.565 | 25.500 | 2010.960 |
| Finac | 9.296 | 4.100 | 2.120 | 20.380 |
| Edu | 8.554 | 0.640 | 6.690 | 9.910 |
| Scale | 1.009 | 2.058 | 0.001 | 12.310 |
| Trans | 95.293 | 48.371 | 9.820 | 260.950 |
Table 3.
GTFP of cotton and its decomposition (from 2000 to 2021).
| Periods | GTFP | GEC | GTC | PEC | SEC | Cumulative GTFP |
| 2000~2001 | 1.233 | 1.008 | 1.223 | 1.031 | 0.978 | 1.233 |
| 2001~2002 | 0.999 | 1.053 | 0.949 | 1.039 | 1.014 | 1.232 |
| 2002~2003 | 0.856 | 0.979 | 0.874 | 1.011 | 0.969 | 1.054 |
| 2003~2004 | 1.083 | 1.039 | 1.042 | 1.020 | 1.019 | 1.142 |
| 2004~2005 | 1.014 | 1.000 | 1.014 | 0.998 | 1.002 | 1.158 |
| 2005~2006 | 1.036 | 0.951 | 1.089 | 0.956 | 0.995 | 1.200 |
| 2006~2007 | 0.982 | 1.042 | 0.942 | 1.037 | 1.005 | 1.178 |
| 2007~2008 | 1.005 | 0.976 | 1.029 | 1.001 | 0.975 | 1.184 |
| 2008~2009 | 1.014 | 0.997 | 1.018 | 0.987 | 1.010 | 1.200 |
| 2009~2010 | 0.946 | 1.015 | 0.932 | 1.052 | 0.965 | 1.136 |
| 2010~2011 | 1.011 | 1.012 | 1.000 | 0.973 | 1.040 | 1.148 |
| 2011~2012 | 1.055 | 1.004 | 1.051 | 1.024 | 0.980 | 1.211 |
| 2012~2013 | 0.982 | 1.006 | 0.976 | 0.982 | 1.025 | 1.189 |
| 2013~2014 | 1.051 | 0.981 | 1.071 | 0.965 | 1.017 | 1.250 |
| 2014~2015 | 1.018 | 1.001 | 1.017 | 1.011 | 0.990 | 1.273 |
| 2015~2016 | 0.989 | 1.004 | 0.985 | 1.002 | 1.002 | 1.259 |
| 2016~2017 | 0.996 | 1.013 | 0.983 | 1.015 | 0.999 | 1.254 |
| 2017~2018 | 1.042 | 0.993 | 1.050 | 1.007 | 0.985 | 1.306 |
| 2018~2019 | 1.038 | 1.046 | 0.992 | 1.018 | 1.028 | 1.356 |
| 2019~2020 | 1.007 | 0.992 | 1.014 | 0.995 | 0.997 | 1.365 |
| 2020~2021 | 1.006 | 0.941 | 1.069 | 0.955 | 0.985 | 1.374 |
| Mean | 1.015 | 1.002 | 1.013 | 1.003 | 0.999 | - |
Note: PEC and SEC denote pure technical efficiency and scale efficiency, respectively.
Table 4.
The estimated values of coefficients in base regression.
| Variables | FE | FGLS | ||
| Coefficient | Std | Coefficient | Std | |
| lnER | 0.741** | 0.278 | 0.574*** | 0.065 |
| ln2ER | -0.166** | 0.069 | -0.148*** | 0.017 |
| lnER×lnRD | 0.064 | 0.044 | 0.044*** | 0.008 |
| lnRD | -0.062 | 0.056 | -0.014 | 0.013 |
| Indus | 1.597** | 0.593 | 0.630*** | 0.094 |
| Urbni | -0.244* | 0.111 | -0.144** | 0.060 |
| Incom | 0.079 | 0.063 | -0.100*** | 0.025 |
| Disas | -0.016 | 0.014 | -0.003 | 0.002 |
| Irri | 0.215* | 0.107 | 0.054*** | 0.020 |
| Elec | -0.065 | 0.040 | 0.003 | 0.006 |
| Finac | 0.014 | 0.028 | 0.084*** | 0.005 |
| Edu | -0.014 | 0.446 | 1.563*** | 0.084 |
| Scale | -0.041 | 0.014 | -0.040*** | 0.004 |
| Trans | -0.126** | 0.025 | -0.145*** | 0.002 |
| Constant | -1.434*** | 0.278 | -2.379*** | 0.191 |
| Wald Test | - | 5655.15 | ||
Note: *, **, and ***, significant at the 0.1,0.05, and 0.01 levels, respectively.
Table 5.
Results of robustness test.
| Variable | (1) | (2) | (3) |
| FE | FE | FE | |
| lnER | -1.580** (-3.04) |
0.714*** (2.91) |
0.662*** (3.04) |
| ln2ER | 0.264*** (3.18) |
-0.167** (-2.50) |
-0.143* (-1.88) |
| lnER×lnRD | 0.070 (1.60) |
0.045* (1.81) |
0.038 (1.15) |
| Z | Control | Control | Control |
| Constant | 1.900 (1.67) |
-1.544*** (-2.91) |
-1.047** (-2.87) |
| N | 252 | 228 | 239 |
| R2 | 0.4419 | 0.4273 | 0.4408 |
Disclaimer/Publisher’s Note: The statements, opinions and data contained in all publications are solely those of the individual author(s) and contributor(s) and not of MDPI and/or the editor(s). MDPI and/or the editor(s) disclaim responsibility for any injury to people or property resulting from any ideas, methods, instructions or products referred to in the content. |
© 2024 by the authors. Licensee MDPI, Basel, Switzerland. This article is an open access article distributed under the terms and conditions of the Creative Commons Attribution (CC BY) license (http://creativecommons.org/licenses/by/4.0/).
Copyright: This open access article is published under a Creative Commons CC BY 4.0 license, which permit the free download, distribution, and reuse, provided that the author and preprint are cited in any reuse.


