
Submitted:
22 December 2024
Posted:
23 December 2024
You are already at the latest version
Preprints on COVID-19 and SARS-CoV-2
Abstract
In England, from Apr 21 to May 23, all-cause mortality among COVID-19 unvaccinated ten years and older was higher than among vaccinated. But as the pattern was similar concerning mortality not involving COVID-19, the discrepancy is attributed mainly to unvaccinated having inferior health at the outset. There was nonetheless significant protection for vaccinated between July 21 and Jan 22. Absent of control variables as a means to compare non-randomized groups, I reached that conclusion by differentiating all-cause mortality from mortality not involving COVID-19. However, while mortality not involving COVID-19 decreased among unvaccinated compared to the first observation month, it was high among vaccinated, i.e., a relative increase in mortality among vaccinated. An interpretation is that vaccination, despite temporary protection, increased mortality. Strengthening the interpretation was relatively high mortality among vaccinated not involving COVID-19 counterintuitively following periods of excess mortality. Further strengthening the interpretation was relatively high mortality not involving COVID-19 among vaccinated corresponding with the excess mortality during the same period.
Keywords:
COVID-19 vaccination
; all-cause mortality
; mortality involving COVID-19
; mortality not involving COVID-19
; excess mortality
Introduction
According to the UK Office for National Statistics [1], rates for COVID-19 unvaccinated adults in England “were higher for Black Caribbean, Black African and White Other ethnic groups. Rates were also higher for those living in deprived areas, who have never worked or are long-term unemployed, who are limited a lot by a disability, … or who are male.” The statement indicates that unvaccinated have inferior health at the outset than vaccinated, inducing biased comparisons as the groups are not randomly assigned. Therefore, matching, balancing [2], or controlling for potential confounders, e.g., ethnicity, employment-, disability-, socioeconomic status, and gender may debias the results [3]. However, variables accounting for potentially confounding effects are often unavailable or unknown, and including those available but unknowingly improper can increase bias [4]. In line with the reasoning, York ([4], p. 675) showed that “unless all potential confounding factors are included in an analysis (which is unlikely to be achievable with most real-world data-sets), adding control variables to a model in many circumstances can make estimated effects … less accurate.”
Due to the addressed issues, comparing non-randomized groups, such as COVID-19 vaccinated and unvaccinated, even in the presence of seemingly relevant control variables, is challenging, but in this study, using English data [5], I show an achievable approach. Initially, I (i) estimated all-cause mortality among COVID-19 vaccinated and unvaccinated ten years and older, covering a 26-month period from Apr 21 to Apr 23. Then, I (ii) estimated mortality not involving COVID-19, and finally, using xlincom [6], an extension of Stata’s [7] lincom algorithm, I differentiated the results of (i) and (ii). As all-cause mortality estimates include cases involving COVID-19, I show that differentiating those from estimates not involving COVID-19 cases can identify potentially genuine effects of vaccination between populations with different health statuses at the outset.
Results
Below, I first present the empirical results of age-standardized mortality probabilities among vaccinated and unvaccinated, shown in Figure 1. Aided by odds ratios (ORs) calculations shown in Figure 2, I then address the results’ substantial interpretation.
Initial Mortality Probability Analyses
Graph A, Figure 1, shows that the all-cause mortality probability, particularly at the beginning of the period, was higher among unvaccinated than vaccinated. The mortality decreased among the unvaccinated, but among the vaccinated, it was relatively stable or had a slight increase. Consequently, the mortality among unvaccinated and vaccinated almost was tangent at the end of the period.
Graph B, Figure 1, shows that the mortality probability not involving COVID-19 was similar to the all-cause mortality probability (Graph A, Figure 1), except for a lower rate among unvaccinated between the last half of 21 and the beginning of 22. Graphs C1 and C2, Figure 1, identical except for different scaling, show that the mortality probability involving COVID-19 was higher among unvaccinated than vaccinated, particularly between the last part of 21 and the beginning of 22.
An interpretation of Graph A, Figure 1, can be that the vaccinated had a temporal but declining mortality protection, which aligns with previous research [12]. But as the pattern was similar concerning mortality not involving COVID-19 (Graph B, Figure 1), the difference can alternatively be attributed to unvaccinated having inferior health at the outset [1]. The reason for the latter assumption is that there is no logical explanation as to how vaccination can prevent mortality that does not involve COVID-19 [13].
Odds Ratio Analyses
To gain more knowledge about the above issues, Graph A, Figure 2, shows ORs of all-cause mortality and mortality not involving COVID-19 among unvaccinated compared to vaccinated as a reference group.1 At the beginning of the period, the ORs of mortality among unvaccinated were about 2 and 2,5 compared to vaccinated, and significant (95% CIs). A similar pattern concerning all-cause mortality and mortality not involving COVID-19 indicates that vaccination did not have a preventive effect (as it logically cannot have a preventive effect against mortality not involving COVID-19). However, between the last half of 21 and the beginning of 22, the ORs were higher for all-cause mortality than for mortality not involving COVID-19, which indicates a temporal preventive vaccine effect.
Graph B, Figure 2, adds further information showing that ORs of all-cause mortality compared to mortality not involving COVID-19 between July 22 and Jan 23 were significant (95% CIs), with most values above 1.2. The results were reached by using Stata’s [7] xlincom algorithm [6] first to differentiate the log odds (the logarithm of the ORs) of estimates reported in Graph A, Figure 2, and next generate the new ORs from the differentiated log odds.2 Accordingly, a conclusion so far is that vaccinated were significantly (CIs 95%) protected between July 21 and Jan 22.
One may attribute the seemingly non-significant vaccine protection from Feb 22 (Graph B, Figure 2) to relatively low mortality involving COVID-19 during that period (Graphs C1 and C2, Figure 1). The reason for the argument is that the effects in Graph B, Figure 2, would be absent if the mortality involving COVID-19 were to approach zero (which explains the non-significant effect between Apr and June 21). However, Graph C, Figure 2, shows that the ORs of mortality among unvaccinated (compared to vaccinated as a reference group) involving COVID-19 were down from about 10 at the beginning to about 2 at the end. It implies that not only was the mortality among unvaccinated not involving COVID-19 relatively low at the end (Grach A, Figure 2), but also the ORs of mortality involving COVID-19 (Graph C, Figure 2). If the latter were high, one could argue that low mortality involving COVID-19 is a valid explanation for the non-significant effect from Feb 22 (Graph B, Figure 2) but less so when the ORs of mortality among unvaccinated were also relatively low (Graph C, Figure 2).3
How Odds Ratios and Probability Analyses Indicate Declining Health among Vaccinated
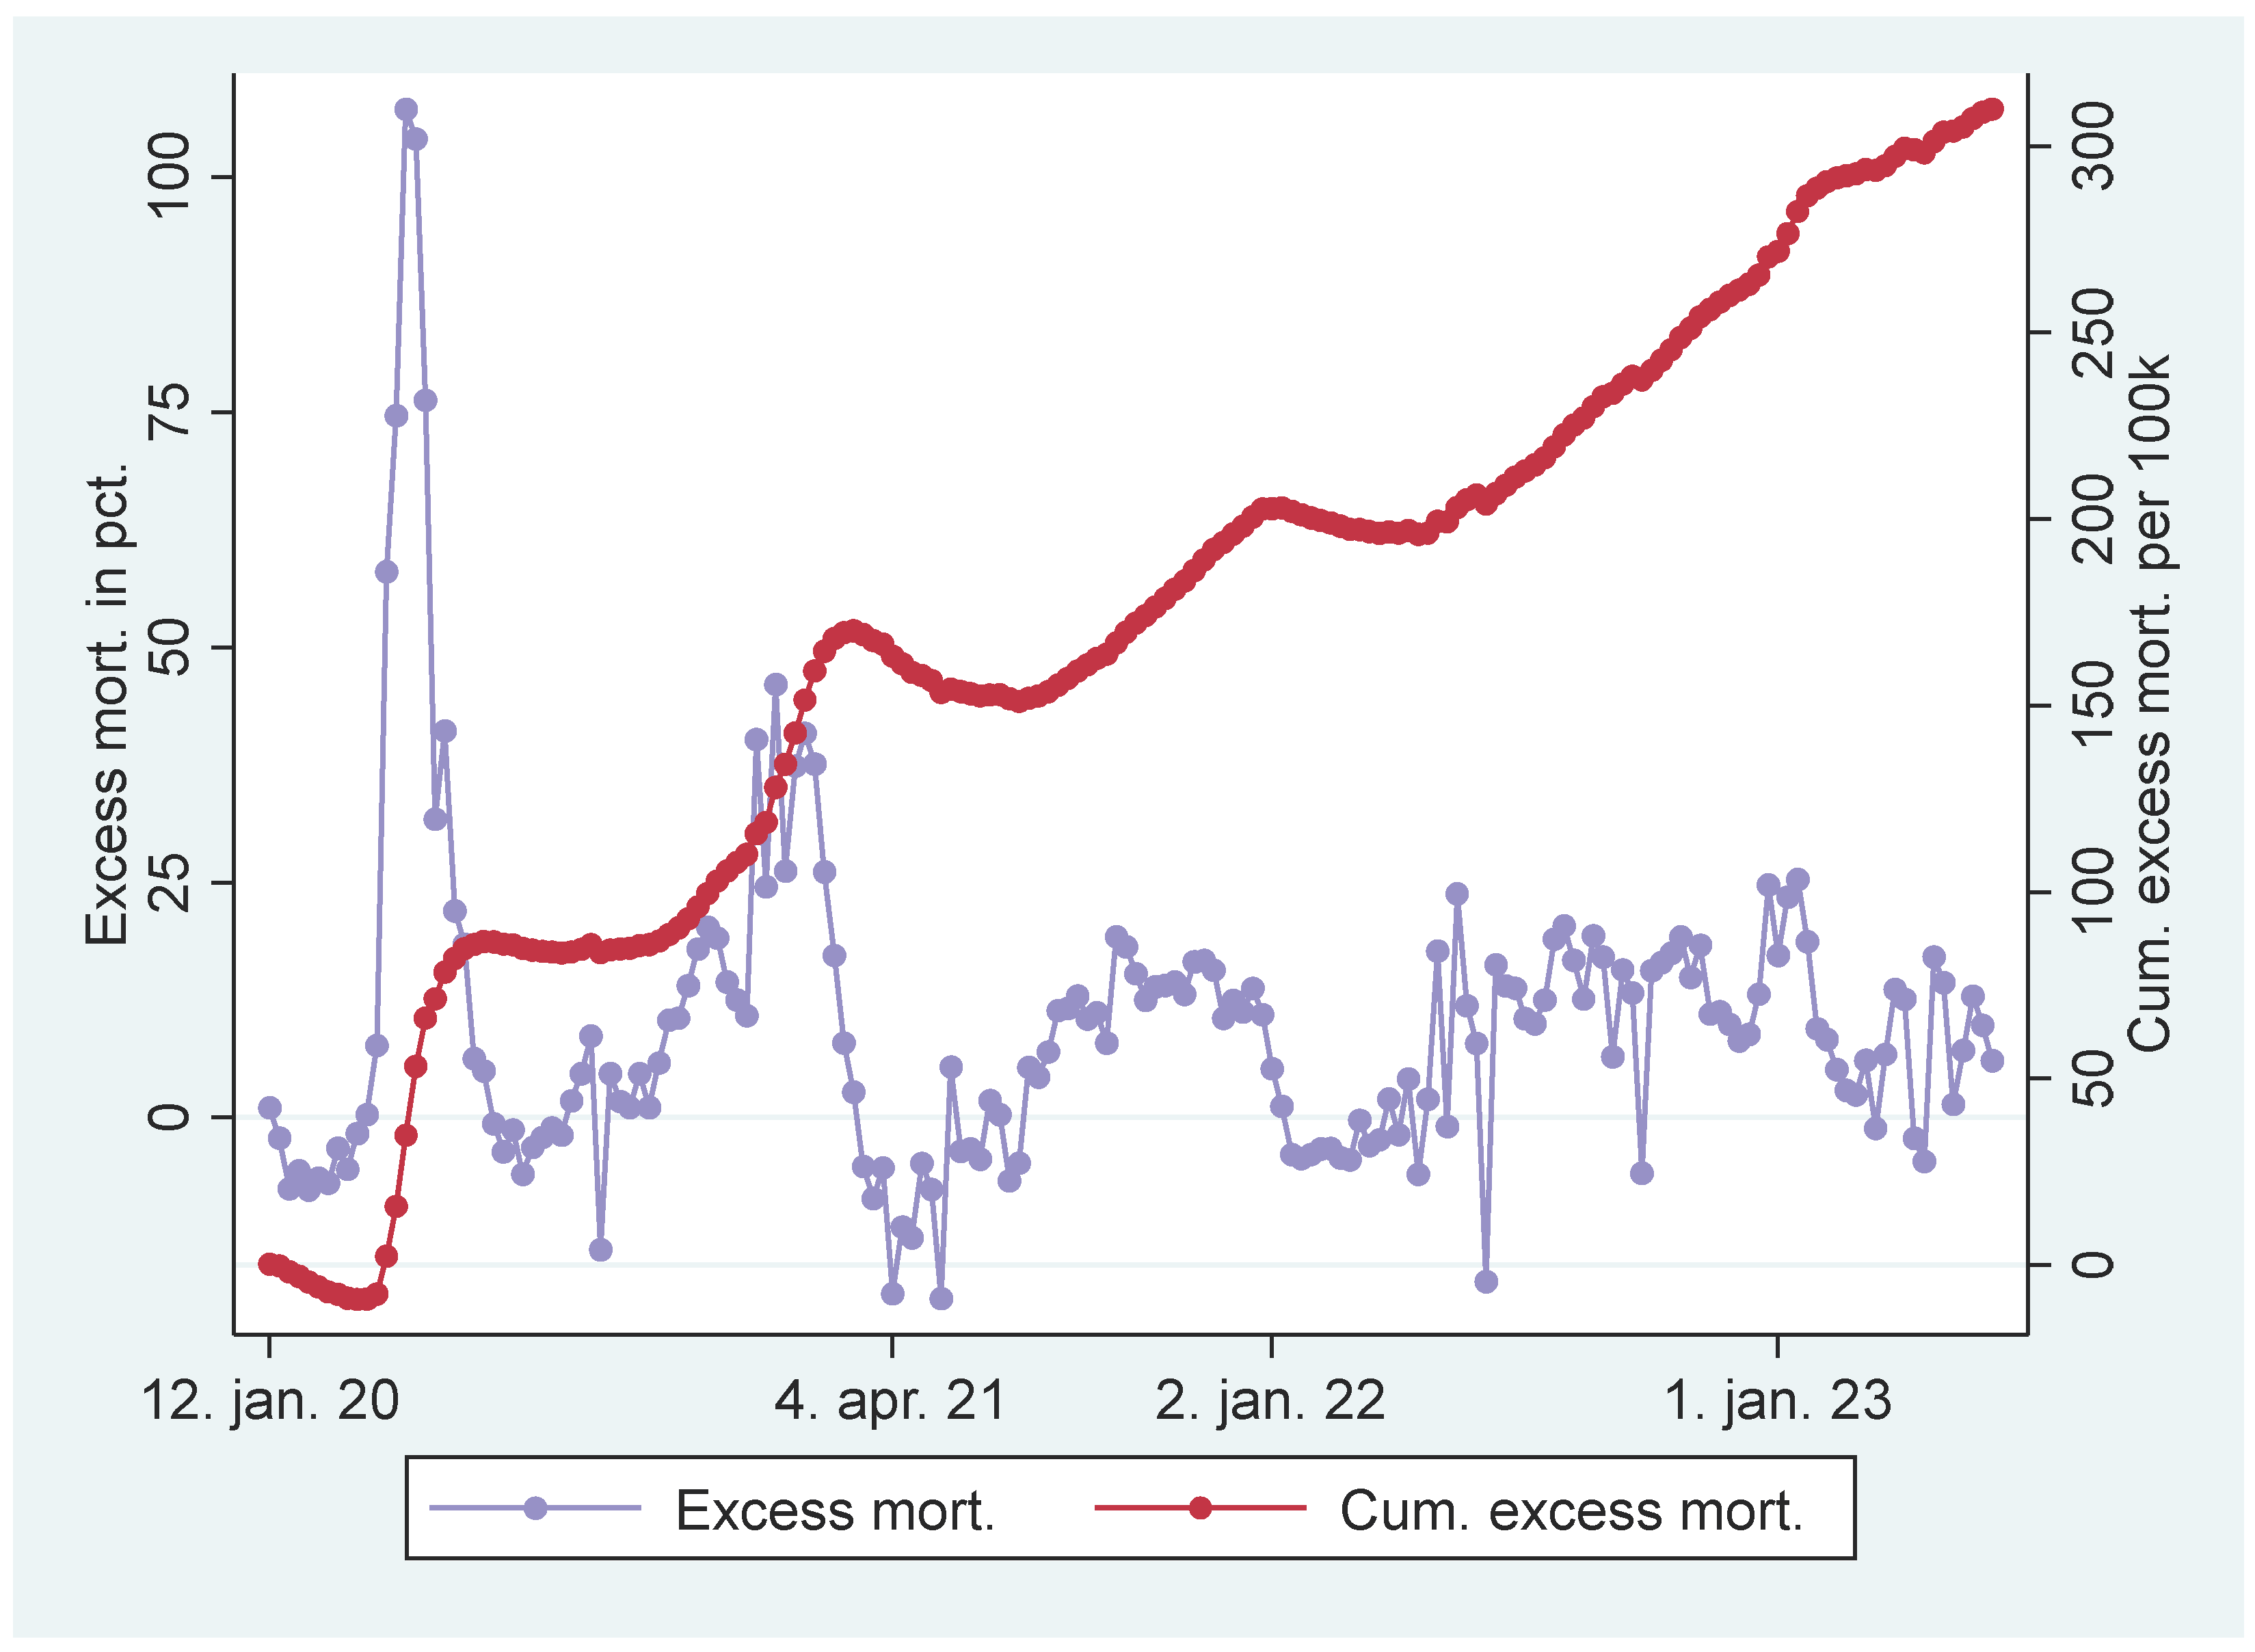
Graph D, Figure 2, shows that while mortality not involving COVID-19 decreased among unvaccinated compared to the first observation month, it was high among vaccinated. The results reflect mortality probabilities in Graph B, Figure 1, which were almost tangent at the end of the period. Also, they reflect the declining ORs of unvaccinated reported in Graph A, Figure 2, taking a non-significant value of a little over 1 at the end (95% CI). Hence, the data show a relatively high and relative increase in mortality not involving COVID-19 among vaccinated. An interpretation is that vaccination, despite temporary protection, increased mortality [13]. Strengthening the interpretation was relatively high mortality among vaccinated not involving COVID-19 counterintuitively following periods of excess mortality (Figure 3).4 Further strengthening the interpretation was the relatively high mortality rate not involving COVID-19 among the vaccinated corresponding with the excess mortality rate during the same period (ibid.).5
Discussion
This study, describing and using an approach to compare non-randomized groups absent of control variables, found that COVID-19 vaccination temporally protected against mortality, which aligns with other research [8,9,10,11,12]. A further interpretation of the data, nonetheless, indicated that COVID-19 vaccination, despite temporary protection, increased mortality [13]. It also aligns with other research suggesting that COVID-19 vaccination can have adverse effects [14,15,16] and increase mortality [17].
During the study period, a share of people in the unvaccinated group were transferred to the vaccinated. Assuming they had inferior health status at the outset, it may explain the relative increase in mortality among the vaccinated. However, those who remained unvaccinated, on the contrary, had inferior health status at the outset [1], making the above reasoning implausible. Ceteris paribus, one may even oppositely conclude that it would decrease relative mortality among vaccinated.6 Since most elderly candidates had been offered vaccine by Apr 21 [1,18], I nonetheless assume the estimates were not substantially skewed over the study period, as relatively few people die in younger age cohorts.
The study’s validity hinges on non-systematic skewness in classifying false positives concerning mortality involving COVID-19 and false negatives concerning mortality not involving COVID-19. I cannot see any substantial reason for that, but it nonetheless may induce some cautiousness when interpreting the data.
This study included those ten years and older. I, therefore, encourage future research to analyze different age cohorts separately to assess how findings may converge or eventually diverge. As this study merely distinguished between those vaccinated and those who were not, I also encourage future research to distinguish between those who received one or more doses and different vaccine types, although it may be methodologically challenging.
Methods
Notes
- Vertical axes in Figure 2 are log-transformed using the natural logaritm.
- The ORs in Graph C, Figure 2, were significant (95% CIs) during the whole period, which can be due to (i) vaccine protection and (ii) unvaccinated having inferior health at the outset. But as the ORs were only about fifth since Feb 22 compared to the first months, explanation (ii) is more likely during that period.
- Assuming that the excess mortality among the unvaccinated segment before Apr 21 was a percent, one may assume that it was a*b percent among the vaccinated segment, where 0<b<1. One may assume b<1 because the vaccinated segment had relatively good health at the outset [1], and one may assume 0<b because there were, nonetheless, people vulnerable to COVID-19 among them. I.e., a*b was lower than a but still higher than zero. According to the reasoning, one should expect a decline in mortality among vaccinated during the study period due to previous excess mortality, but not necessarily as marked as observed among unvaccinated. Alternatively, one may argue the opposite as among the vaccinated segment, “some very comorbid patients [in care homoes] got vaccine side effects that probably accelerated an already progressing death process” ([23], p. 3 - my translation from Norwegian).
- People in England under 70 years old but clinically extremely vulnerable were prioritized vaccination with those aged between 70-74 [18]. Hence, they were prioritized early.
- To exemplify, in Apr 2021, the age-standardized all-cause mortality rate among “ever vaccinated”, defined as vaccinated in this study, was 812.7 per 100,000 person-years, which were 2,124,523 [5]. The expression (812.7/100,000)*2,124,523 gives 17,266 estimated deaths in an estimated population of 25,494,276, which was reached by multiplying 2,124,523 by 12. I.e., the age-standardized all-cause mortality probability among vaccinated in Ap 21 was 17,266 divided by 25,494,276, taking the value of .0068 percent. Similar estimations of all-cause mortality, mortality involving and not involving COVID-19, were carried out each month for vaccinated and unvaccinated.
Funding
This study did not receive any funding.
Conflicts of Interest
The author reports no conflict of interest.
References
- UK Office for National Statistics. Coronavirus (COVID-19) latest insights: Vaccines 2023. Available online: https://www.ons.gov.uk/peoplepopulationandcommunity/healthandsocialcare/conditionsanddiseases/articles/coronaviruscovid19latestinsights/vaccines.
- King, G.; Nielsen, R. Why Propensity Scores Should Not Be Used for Matching. Political Analysis 2019, 27, 435–454. [Google Scholar] [CrossRef]
- Wysocki, A.C.; Lawson, K.M.; Rhemtulla, M. Statistical Control Requires Causal Justification. Advances in Methods and Practices in Psychological Science 2022, 5, 25152459221095823. [Google Scholar] [CrossRef]
- York, R. Control variables and causal inference: a question of balance. International Journal of Social Research Methodology 2018, 21, 675–684. [Google Scholar] [CrossRef]
- UK Office for National Statistics. Deaths by vaccination status, England 2023. Available online: https://www.ons.gov.uk/peoplepopulationandcommunity/birthsdeathsandmarriages/deaths/datasets/deathsbyvaccinationstatusengland.
- Wakker, W. XLINCOM: Stata module to estimate multiple linear combinations of parameters. 2023.
- StataCorp. Version 17. College Station, TX StataCorp LP; 2021.
- Lopez-Doriga Ruiz, P.; Gunnes, N.; Michael Gran, J.; Karlstad, Ø.; Selmer, R.; Dahl, J.; et al. Short-term safety of COVID-19 mRNA vaccines with respect to all-cause mortality in the older population in Norway. Vaccine 2023, 41, 323–332. [Google Scholar] [CrossRef] [PubMed]
- Haas, E.J.; Angulo, F.J.; McLaughlin, J.M.; Anis, E.; Singer, S.R.; Khan, F.; et al. Impact and effectiveness of mRNA BNT162b2 vaccine against SARS-CoV-2 infections and COVID-19 cases, hospitalisations, and deaths following a nationwide vaccination campaign in Israel: an observational study using national surveillance data. Lancet 2021, 397, 1819–1829. [Google Scholar] [CrossRef]
- Bernal, J.L.; Andrews, N.; Gower, C.; Robertson, C.; Stowe, J.; Tessier, E.; et al. Effectiveness of the Pfizer-BioNTech and Oxford-AstraZeneca vaccines on covid-19 related symptoms, hospital admissions, and mortality in older adults in England: test negative case-control study. Bmj-British Medical Journal 2021, 373. [Google Scholar]
- Watson, O.J.; Barnsley, G.; Toor, J.; Hogan, A.B.; Winskill, P.; Ghani, A.C. Global impact of the first year of COVID-19 vaccination: a mathematical modelling study. The Lancet Infectious Diseases 2022. [Google Scholar] [CrossRef] [PubMed]
- Nordstrom, P.; Ballin, M.; Nordstrom, A. Risk of infection, hospitalisation, and death up to 9 months after a second dose of COVID-19 vaccine: a retrospective, total population cohort study in Sweden. Lancet 2022, 399, 814–823. [Google Scholar] [CrossRef]
- Alessandria, M.; Malatesta, G.; Di Palmo, G.; Cosentino, M.; Donzelli, A. All-cause mortality according to COVID-19 vaccination status: An analysis of the UK office for National statistics public data. F1000Research 2024, 13, 886. [Google Scholar] [CrossRef]
- Fraiman, J.; Erviti, J.; Jones, M.; Greenland, S.; Whelan, P.; Kaplan, R.M.; Doshi, P. Serious adverse events of special interest following mRNA COVID-19 vaccination in randomized trials in adults. Vaccine 2022, 40, 5798–5805. [Google Scholar] [CrossRef]
- Mostert, S.; Hoogland, M.; Huibers, M.; Kaspers, G. Excess mortality across countries in the Western World since the COVID-19 pandemic: ’Our World in Data’ estimates of 20 to December 2022. BMJ Public Health 2024, 2, e000282. [Google Scholar] [CrossRef]
- Faksova, K.; Walsh, D.; Jiang, Y.; Griffin, J.; Phillips, A.; Gentile, A.; et al. COVID-19 vaccines and adverse events of special interest: A multinational Global Vaccine Data Network (GVDN) cohort study of 99 million vaccinated individuals. Vaccine 2024, 42, 2200–2211. [Google Scholar] [CrossRef]
- Aarstad, J. Deaths among young people in England increased significantly in 10 of 11 weeks after COVID-19 vaccination and doubled in three. Excli j. 2024, 23, 908–911. [Google Scholar]
- UK Office for National Statistics. UK COVID-19 vaccines delivery plan 2021. Available online: https://www.gov.uk/government/publications/uk-covid-19-vaccines-delivery-plan/uk-covid-19-vaccines-delivery-plan.
- UK Office for National Statistics. Weekly COVID-19 age-standardised mortality rates by vaccination status, England: methodology 2021. Available online: https://www.ons.gov.uk/peoplepopulationandcommunity/birthsdeathsandmarriages/deaths/methodologies/weeklycovid19agestandardisedmortalityratesbyvaccinationstatusenglandmethodology.
- UK Office for National Statistics. Impact of registration delays on mortality statistics in England and Wales: 2022 2024. Available online: https://www.ons.gov.uk/peoplepopulationandcommunity/birthsdeathsandmarriages/deaths/articles/impactofregistrationdelaysonmortalitystatisticsinenglandandwales/latest.
- Williams, R. Using the margins command to estimate and interpret adjusted predictions and marginal effects. Stata Journal 2012, 12, 308–331. [Google Scholar] [CrossRef]
- Knol, M.J.; Pestman, W.R.; Grobbee, D.E. The (mis)use of overlap of confidence intervals to assess effect modification. Eur J Epidemiol. 2011, 26, 253–254. [Google Scholar] [CrossRef]
- Wyller, T.B.; Kittang, B.R.; Ranhoff, A.H.; Harg, P.; Myrstad, M. Dødsfall i sykehjem etter covid-19-vaksine. Tidsskrift for Den norske legeforening 2021, 141, 1–8. [Google Scholar] [CrossRef] [PubMed]
- Our World in Data. Coronavirus (COVID-19) Vaccinations 2024. Available online: https://ourworldindata.org/covid-vaccinations.
- UK Office for National Statistics. Excess mortality within England: 2023 data - statistical commentary 2024 [.
Figure 1.
Monthly mortality probabilities in percent with 95% CIs.
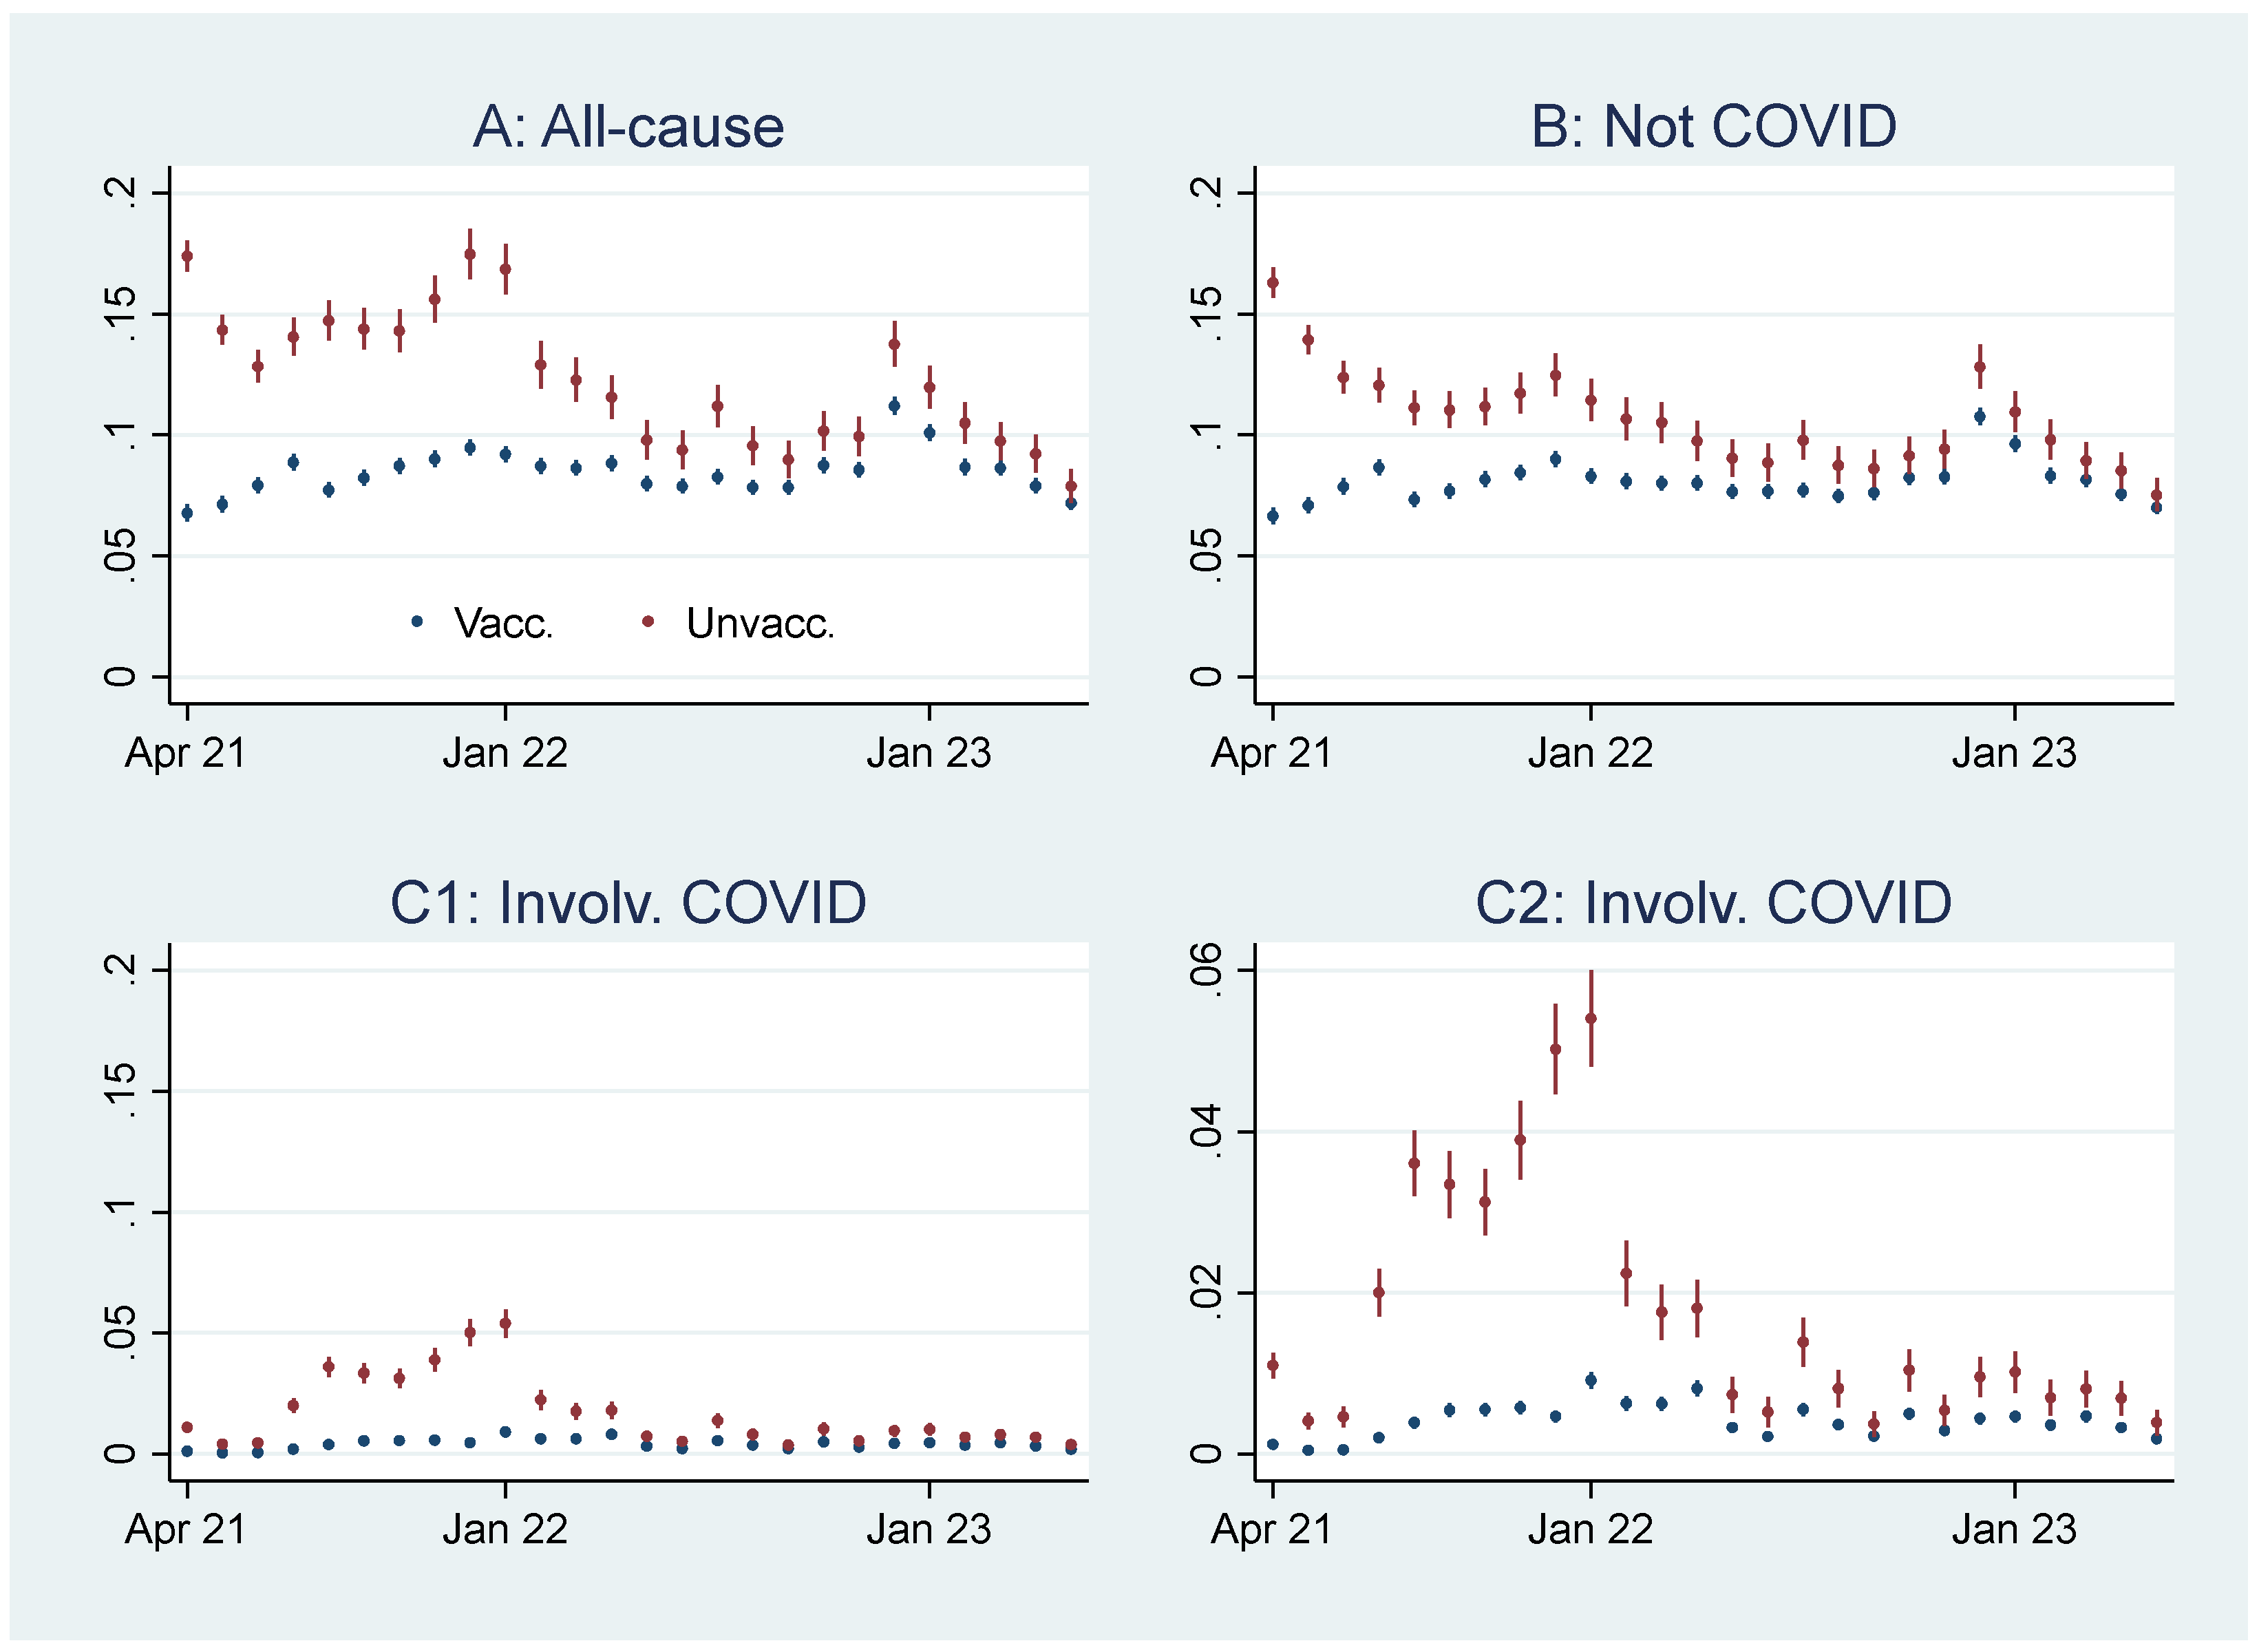
Figure 2.
Monthly ORs of mortality with 95% CIs.
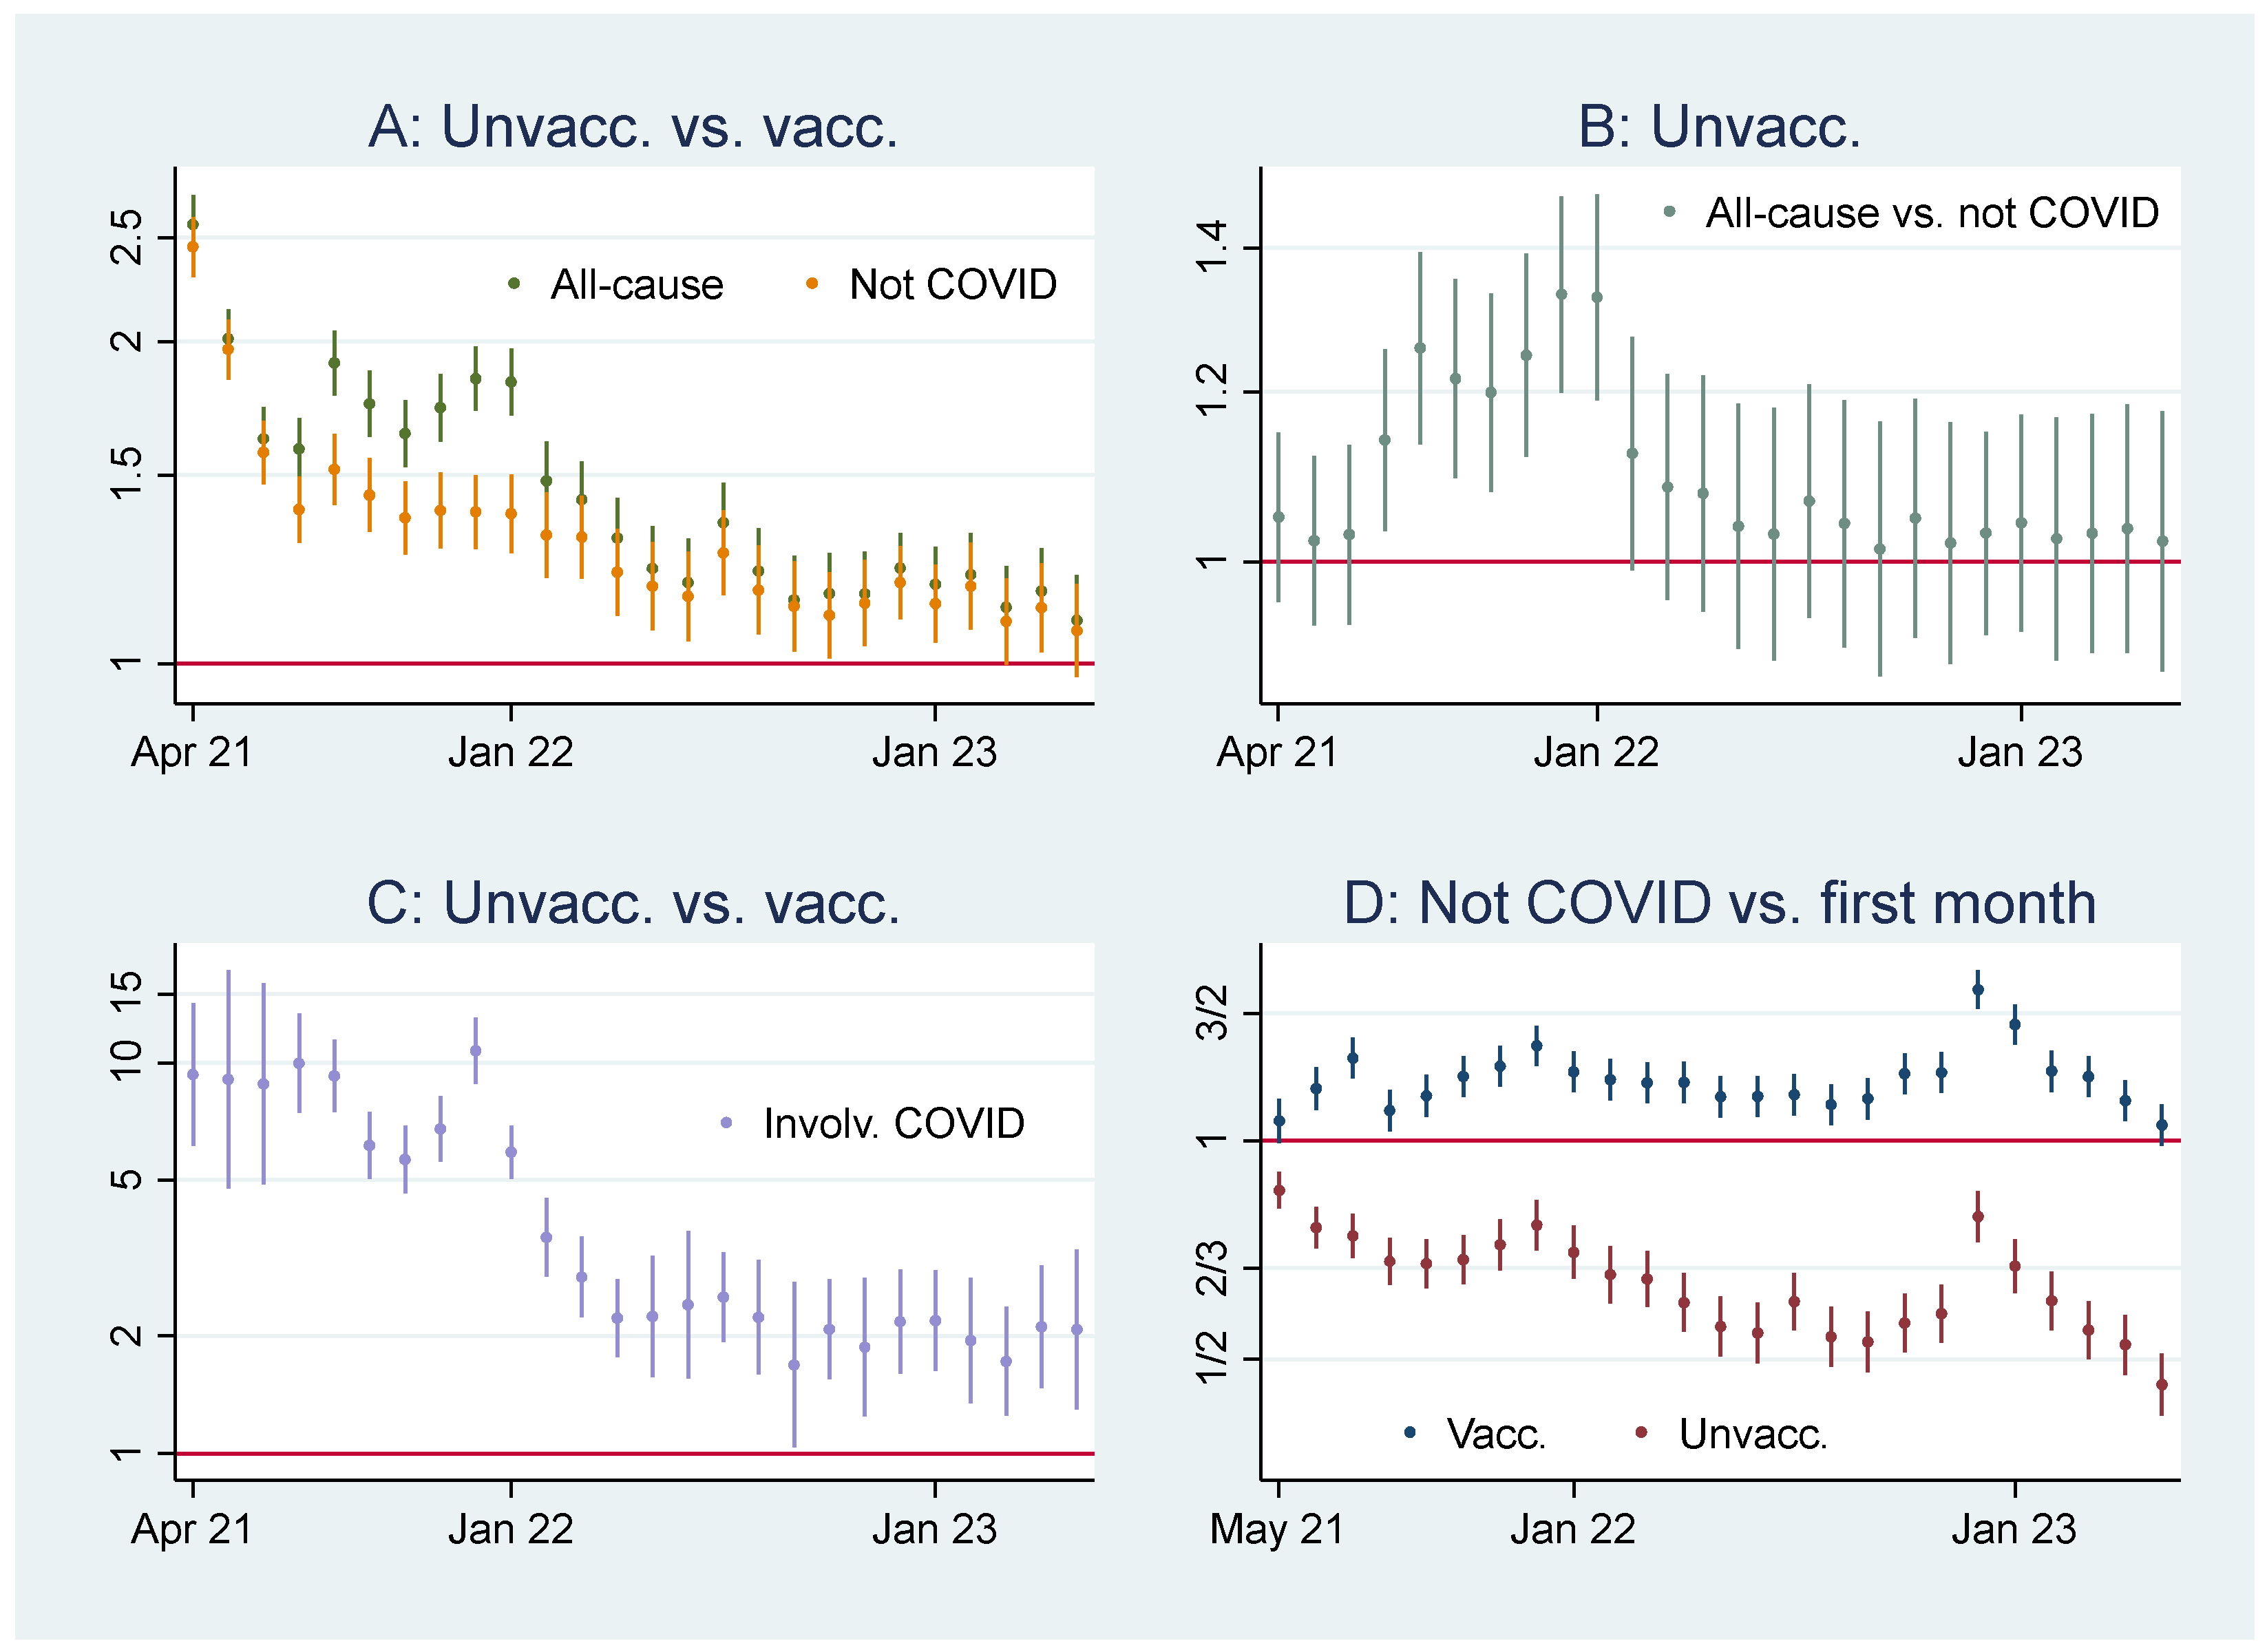
Figure 3.
Weekly UK excess mortality in percent and cumulative excess mortality.
Disclaimer/Publisher’s Note: The statements, opinions and data contained in all publications are solely those of the individual author(s) and contributor(s) and not of MDPI and/or the editor(s). MDPI and/or the editor(s) disclaim responsibility for any injury to people or property resulting from any ideas, methods, instructions or products referred to in the content. |
© 2024 by the authors. Licensee MDPI, Basel, Switzerland. This article is an open access article distributed under the terms and conditions of the Creative Commons Attribution (CC BY) license (http://creativecommons.org/licenses/by/4.0/).
Copyright: This open access article is published under a Creative Commons CC BY 4.0 license, which permit the free download, distribution, and reuse, provided that the author and preprint are cited in any reuse.


