
Submitted:
25 December 2024
Posted:
26 December 2024
You are already at the latest version
Abstract
The coupling effects of electrical pulse, temperature, strain rate, and strain on the flow behavior and plasticity of 7075-T6 aluminum alloy were investigated and character-ized. The isothermal tensile test and electrically-assisted isothermal tensile test were performed at the same temperature, and the typical models were further embedded in ABAQUS for numerical simulation to illustrate the electroplastic effect. The results showed that electrical pulses reduced deformation resistance but greatly increased elongation. Compared with the traditional Johnson-Cook model, the proposed modi-fied Electrothermal coupling constitutive equations has a certain improvement in cal-ibration accuracy for highly nonlinear and thermoelectric coupling dynamic behavior. Moreover, Combined with the electrically assisted three-point bending experiment, it was found that the rebound angle decreases with the increase of current density. This is very close to the experimental result, further verifying the effectiveness of the ther-moelectric coupling constitutive equation.
Keywords:
7075-T6 Aluminum alloy
; Material characterization
; Electroplastic effects
; Johnson-Cook constitutive
; Uniaxial tensile
1. Introduction
The mechanical properties [1,2,3] of 7075-T6 aluminum alloy were obtained through electrically assisted uniaxial tensile experimental analysis and numerical simulation, including thermal and non-thermal effects of the material [4,5]. To further utilize the mathematical model method to represent the relationship between flow stress and strain of materials under plasticity effects, a traditional constitutive equation was used to link current density with thermal activation behavior [6,7]. Additionally, the thermoelectric-coupled constitutive equation of the material needs to be established. The equation can be effectively imported into the finite element software for simulation analysis to improve the simulation accuracy.
Since the 1960s, the theory of electroplastic deformation [6,8,9]has been studied, but there are few reports on its industrial applications. Electrically-assisted production creates complex shapes for forming aluminum alloy components, especially in lightweight automotive design. Applying an electric current reduces the material’s yield strength when machining aluminum and copper alloys, facilitating processes like stamping and tensile. Roh et al. [10] modified the power-law Hollomon hardening model by fitting electroplastic experimental data. They developed a comprehensive phenomenological model that includes Joule heating and electroplastic effects to quantify their contribution to mechanical behavior. However, the model did not capture the stress drop [11,12]. Wang et al. [13] separated the Joule heating effect from the microscopic thermal effect caused by electrical pulses to construct a composite model. DINH K-A [14] found that the current increased elongation in electrically-assisted two-stage forming experiments on Al-Mg and Al-Si-Mg alloys and the quantitative effect of the current on the synthesized microstructures [15] depended on the type of aluminum alloy. Adam Jordan [16] demonstrated through electrically assisted bending tests that applying electric current to Al6111 aluminum alloy reduced its deformation resistance [8,17] and inhibited springback [9,18]. The DIC measurement system found a more homogeneous strain distribution over the thickness, particularly for the coarse grain structure, related to the electrophysical effect.
The conventional Johnson-Cook constitutive equation was appropriately modified based on the stress-strain curves obtained from unidirectional tensile experiments on 7075-T6 aluminum alloy. By combining high-temperature and thermoplastic parameters, a new thermoelectrically coupled constitutive equation, EA-Johnson-Cook, suitable for this material, was developed. After obtaining the relevant parameters, the new equation’s ability to predict rheological stresses is analyzed. Finally, based on von Mises’ theory of plasticity, the modified constitutive equation is implemented in ABAQUS software through the UMAT subroutine to evaluate the effectiveness of the constitutive equation algorithm. This paper discusses the effects of strain rate and current density on the mechanical properties of 7075 aluminum alloy. It quantifies the impact of each parameter through constitutive equations, providing a reference for the application of electrically assisted machining.
2. Experimental Equipment and Materials
2.1. Experimental Materials
The thickness of the test material was 1 mm, a 7075-T6 aluminum alloy sheet supplied by Chalco Ruimin Company. Its chemical composition is shown in Table 1, and its mechanical properties are represented in Table 2. The sheet was processed into the required shape for the tensile test by punching, and the dimensions of the specimen were illustrated in Figure 1, considering the gauge and high-temperature tensile test design. The units in the figure were in millimeters.
2.2. Experimental Equipment
(1) Pulse power supply and thermal imager
As shown in Figure 2a, the SMD-100 dual-pulse electroplating power supply was utilized, capable of operating in unidirectional or bidirectional modes. The waveform was rectangular, with a current range of 0 to 200A and a duty cycle range of 1 to 99%. By adjusting the current magnitude and duty cycle, this power supply could generate the required pulse current for the experiment. Due to the relatively high current intensity used in the experiment, it was essential to wear insulating gloves to prevent safety hazards. Additionally, as shown in Figure 2b, a FLIR E5 WiFi model thermal imager was employed, and it features a spectral range of 7.5 to 13 μm and a measurable temperature range of -20 to 900 °C. When current passes through the material, it introduces heat into the material. Simultaneously, heat exchanged with the surrounding air and heat radiation contributed to heat loss.
(2) Electrically-assisted tensile platform
A current-assisted uniaxial tensile testing machine for sheet metal was designed to integrate current parameters, temperature detection, and temperature control. A pinning device was included for insulation to prevent current damage to the machine. Figure 3a illustrates the quasi-static uniaxial tensile test apparatus supported by pulsed current. The conductor wrapped around the energized interface of the specimen, which was coated with PTFE adhesive and sprayed with black boron nitride paint. The fixture structure is shown in Figure 3b.
As shown in Figure 3, the pin material was silicon nitride. It was known for its excellent flexural and shear strength, capable of withstanding thermal shocks. Bakelite served as insulation, while the upper and lower fixtures were made from high-temperature 304 stainless steel. The tensile testing of 7075-T6 aluminum alloy commenced, with the pulsed power supply requiring heating or cooling at the beginning and end of each test to ensure the current was effective.
2.3. Experimental Principle
An electrically-assisted uniaxial tensile test involves introducing a pulse current into the traditional tensile process. Experimental platforms include a fixture insulation design in which a plastic or wood insulator is inserted between the original universal tensile testing machine fixture. This design prevents electrical conductivity, thereby ensuring normal equipment operation. The test principle is illustrated in Figure 4.
The current-assisted tensile testing device mainly comprised four components: the tensile testing platform, pulse power supply, control system, and data acquisition platform. The tensile testing platform included a tensile fixture, specimen, and bench. The power supply consisted of the pulse power supply unit, insulated fixture, and electrode connector, ensuring a closed loop during testing to adjust current and voltage parameters. The control system was primarily composed of a tensile testing machine controller that regulates the speed. The data acquisition platform comprises a computer, force sensor, electronic extensometer, and USB interface. The data acquisition platform mainly consisted of a laptop, a force sensor, an electronic extensometer, and a USB interface. Utilizing the M223C testing measurement and control system, the tensile force and displacement were measured in real-time during the tensile test. The software generated the force-displacement and stress-strain curves, enabling automated data acquisition.
2.4. Experimental Arrangement
During sheet metal forming simulations inaccurate material stress-strain parameters can lead to low accuracy. In current-assisted metal tensile testing, stress and strain varied inconsistently, requiring precise measurement. Four variables: current density, pulse frequency, shear rate, and accurate strain-strain curves—were established through electrically assisted tensile tests. This process helped create a new material constitutive equation, improving the accuracy of simulations and examining the impact of pulse current on the mechanical properties of aluminum alloy sheets. During tensile testing this section focused on studying the effects of varying current densities and strain rates on the mechanical properties of 7075-T6 aluminum alloy. Test parameters are shown in Table 3, and the temperature in the table represents the reference temperature measured at the current temperature.
2.5. Experimental Results
When the pulse frequency is 200 Hz, the stress is obtained at three different strain rates and four different current densities (8 A/mm2, 14 A/mm2, 20 A/mm2, and 26 A/mm2) during the tensile process. The strain curve is shown in Figure 5. Analysis of the high-temperature tensile stress-strain curve revealed a decrease in flow stress as the temperature rises to 150 °C. Plasticity remained stable due to the accelerated heat-activated slip mechanism at high temperatures, which quickly eliminates dislocations and reduces tensile strength. There are no obvious signs of temperature softening at 210 °C. The most notable stress reduction occurred between 270 °C and 330 °C, with a sharp decrease in tensile strength at 330 °C. At the same time, the increase in elasticity is related to the thermally activated slip mechanism in the crystals, because the generated thermal energy promotes the rapid movement of dislocations and reduces the concentration of stress in the lattice, thus increasing the plasticity of the material.
The significant decrease in tensile strength and the increase in ductility at 330°C are attributed to the thermally activated slip mechanism within the crystals. The primary driving mechanism is thermal energy, which promotes the rapid movement of dislocations and reduces stress concentration within the lattice. This process lowered the yield strength to approximately 150 MPa, enhancing the plasticity. The electrically assisted tensile curve shows that stress decreases and increases material toughness at the same temperature. In addition to the Joule heating effect, the electroplastic impact is also evident, enhancing the plasticity of the material.
In contrast, the Joule heating effect is more significant. When the temperature reaches a certain threshold, the material softens, and the phenomenon of sequestration and entanglement [19,20] is substantial. Introducing electric current to the drift electrons can reduce resistance, enhance mobility, and facilitate slip, potentially lowering the strength of the metal sheet.
As shown in Figure 6, the ultimate tensile stress (UTS) under both high-temperature tensile (TAT) and electrically assisted tensile (EAT) conditions exhibits a stepwise decreasing trend. The ultimate tensile strengths under the influence of electric current decrease to 301.84 MPa, 231.85 MPa, 189.42 MPa, and 144.03 MPa, respectively. Additionally, there is a gradual increase in the post-break elongation of the specimens at high temperatures (), highlighting the differences observed under the influence of current. Under different current densities of 39.94%, 44.49%, 49.12%, and 37.33%, the ultimate tensile stress decreased by 76.4 MPa as the current density increased from 20 to 26 A/mm2. Additionally, the post-break elongation decreased by 10.79%. This is due to the decrease in the fracture area of the steel plate, the increase in the relative current density and the concentration of heat at the midpoint of the specimen, resulting in uneven heat distribution.
2.6. Electroplastic Effect Coefficient Solution
(1) Electroplastic effect decoupling
The difference in flow stress between room temperature and electrically assisted heating is , where represents the room temperature tensile rheological stress and represents the rheological stress obtained through electrically assisted heating. The relationship is expressed in Equation (1):
The difference in flow stress between furnace heating and electrically assisted heating at the same temperature is , where represents the ultimate tensile strength obtained through furnace heating. The relationship related to the thermoplastic effect is shown in Equation (2):
As presented in Table 4, based on the high-temperature tensile experimental data under electrically assisted heating and at the same temperature, the fracture strain value of the material increases in the high-temperature state. Therefore, the difference in stress can not be achieved solely through the corresponding strain. Instead, the difference can be observed through variations in peak stress values under different conditions, reflecting changes in plasticity. The maximum stress, or ultimate tensile strength, determines the proportion of purely electrically induced plastic deformation, denoted as in Equation. (3):
(2) Electroplastic effect coefficient solution and law
The ratio of the work done by the current during plastic deformation to the total power consumed by the pulsed power supply characterized the electrophysical effect coefficient [21,22]. This portion of the electrical power provided sufficient energy for dislocations, enabling them to overcome lattice obstacles and continue their movement. Assuming that the total power consumed during the plastic deformation stage of 7075 aluminum alloy remained constant when the sheet temperature was constant, regardless of the current intensity. The total energy consumed during electrically-assisted uniaxial tensile was:
in Equation (4) is the total power during tensile, in Equation (6) is the mechanical power of the tensile testing machine, and in Equation (7) is the electrical power consumed during tensile, where the experimental procedure is all 10 V voltage:
where A is the instantaneous cross-sectional area of the material, is the power conversion efficiency, is the strain rate, and is the length of the scalar segment from the above equation:
Referring to Equation (8), assuming a power conversion efficiency of 100% (=1) and a scalar segment length of 20 mm, the coefficient of the electrophysical effect could be derived from Equation (9):
Equation (9) revealed that the variable is correlated with the current density , specimen size, and strain rate . For instance, considering a strain rate of 1s-1, Figure 7 illustrates the trend of the coefficient with the flow stress difference for various current densities. Generally, the electroplastic effect coefficient is not a fixed value [23,24]; it is influenced by factors such as specimen size, current density , and strain rate .
As shown in Figure 7, the coefficient of the electroplastic effect increases with the current density . The maximum values are summarized in Table 5. Show differences in the contribution of current density to plasticity change and indicate the threshold for enhanced plasticity at a given current density. Therefore, pure electrophilic plasticity can be harnessed to lower the forming temperature and offset the decrease in plasticity resulting from temperature reduction.
3. 7075-T6 Electrothermal Coupling Constitutive Equations
3.1. Johnson-Cook Constitutive Equation
Johnson-Cook develops an image-only constitutive model that considers the strain hardening, strain rate, and thermal softening [25,26] described above. It creates expressions for , , and that are independent. The Equation (10) is as follows:
where is the rheological stress; is the equivalent plastic strain, is the dimensionless strain rate, is the strain rate sensitivity factor; is the temperature effect coefficient, , where is the reference temperature, is the melting point temperature, and is the temperature effect coefficient.
3.2. Electrothermal Conversion
Magargee’s experiments [9] observed that when the metal temperature was cooled to room temperature, there was minimal change in the flow stress of electrically assisted metal deformation, and it suggested that most electric heat was transferred as thermal energy. Therefore, in the investigation of electrically assisted forming, it was crucial first to analyze the conversion of electrical energy into thermomechanical energy and examine the direct conversion of electrical and thermal energy.
(1) Conversion of electrical energy and thermal energy
In electrically assisted forming, the heating of the metal material is closely related to the energizing time and current density. Assuming that the whole heat transfer process is adiabatic [27], then the Joule heating () of the heat conduction entering the material is stored in the system in proportion to the heat capacity of the material (). The applied Joule thermal energy is the same as the thermal energy stored by the capacitor, and the energy conversion Equation (11) is as follows:
where is Joule thermal energy;
is Thermal energy stored in the material system.
According to the Joule heat [16,28] equation , where , from the equation defining resistance, ( is the current density, is the resistivity of the material, is the time of energization). According to the thermal energy formula (m is the mass of the material, is the specific heat capacity, and is the temperature difference), where ( is the mass density, is the cross-sectional area of the center of the specimen at the time of current flow, and is the length of the material), as shown in Table 6:
Substituting the above equation into the energy conversion Equation (11), the Equation (12) is as follows:
The deformation is derived:
During the experiment, the temperature at the center of the sheet can be measured using a thermal imager after increasing the current. Figure 8 shows the relationship between the energizing time and temperature under various currents. As the current density increases, the temperature rises. 0-8 s temperature rises faster, and 8-40 s temperature rises slower until the sheet breaks.
(2) Thermoelectric conversion functions
According to the data on the tensile strength of 7075-T6 aluminum alloy at high temperatures, the material parameter “thermoelectric conversion parameter” is defined. as the ratio of high-temperature tensile strength to tensile strength at room temperature, and Equation (14) can be converted into:
where K is the time-dependent softening time function.
Establish the relationship between the thermal softening parameters generated by current joule heating and the effective current density, which ends when the temperature rises to the material’s melting point. The thermoelectric conversion parameters increased with the increase of current density. The growth rate is slower at the beginning, and the temperature of the aluminum alloy increases faster after the current density reaches 8; When the current density further increases to 15~25 , the temperature rises to the melting point. It is shown that the thermal softening parameter value increases with a longer energizing time at the same current density, leading to a more pronounced thermal softening effect induced by Joule heating.
For aluminum alloys with low melting points (<1000 °C), thermoplastic deformation is usually characterized by a wide range of stresses and temperatures. Sheikh-Ahmad utilizes this approach to showcase the efficacy of electrically assisted tensile tests for high-temperature uniaxial tests at varying strain rates [6]. He employs an s-shaped exponential form to express the empirical correlation between the thermal softening parameters and temperature. This correlation is known as the thermoelectric softening function, as shown in Equation (15):
Substitution of the electrothermal conversion parameters concerning the current density leads to Equation (16):
The sum of the equation is the parameters of . The least squares fitting method and experimental data can determine the conversion function.
The fitting curves for the 7075-T6 aluminum alloy at different times are shown in Figure 9. At lower current densities, the current does not significantly affect the material’s behavior. However, small changes in current density can dramatically alter the material’s properties at higher densities, reaching a critical value known as the “current density threshold”. For 7075-T6 aluminum alloy, the change in tensile strength is observed to be very small at the effective current density below 5, but the tensile strength will be significantly reduced between 5~25 .
(3) Current density threshold
By computing the rate of thermal softening change concerning the effective current density and formulating the function, a useful approach was presented to quantify the position and limit of the current density threshold. This method helped determine the relative impact of the effective current density on the thermal softening rate, known as the ’current density sensitivity.’ It clarified how thermal softening varies with respect to the current density. The current density needed for optimal thermal softening of the material could be determined through analysis. When an electric current induced thermal softening in a low melting point metal, the required current density for maximum effectiveness could be estimated within the appropriate “current density sensitivity range.” Consequently, the thermal softening Equation (17) can be established.
Figure 10 illustrates the current density helps identify the required current density for effective thermal softening. As the energizing time increases within a specific range, the peak value and the adequate current density sensitivity increase. Evaluating the current density sensitivity of a particular material allows us to optimize and select the most appropriate current density for inducing softening. This process also enables us to assess the effect of electrically assisted deformation on a given workpiece material. When the power-on time is 40 seconds, the sensitive narrow-band range aligns with the density gradient used in the test.
3.3. Electrothermal Coupling Constitutive Equations
Utilizing the Johnson-Cook model and electrothermal coupling analysis, the electrically assisted plastic deformation of 7075-T6 aluminum alloy was characterized, which led to the establishment of the electrothermal coupling constitutive model, EA-Johnson Cook. Initially, the model’s strength and strain hardening coefficients were derived from room temperature tensile tests. Subsequently, the thermal softening term governing the stress behavior at elevated temperatures was determined. Finally, the electrothermal coupling constitutive model for aluminum alloy materials was analyzed and validated through integration with finite element software [29].
(1) EA-Johnson Cook constitutive equations
Based on the Johnson-Cook model at high temperatures, an electrical and thermal energy conversion term, the electrothermal conversion function , is added to characterize the electrically assisted tensile behaviour. The electrothermal coupling constitutive equation EA-Johnson-Cook of the material can be expressed as:
where is the strain-hardening function;
is the strain rate function;
is the Electrothermal conversion function.
(2) Determination of strain-hardening function
When , and when the stress changes with strain, the strain-hardening function of the material is:
, , and represent the initial yield stress, the material strain hardening modulus, and the hardening index at the reference strain rate and temperature. The above equation shows that it has a linear relationship. When the temperature is 25°C, and the strain rate is 0.001, the material’s unidirectional tensile true plastic stress-strain curve is shown in Figure 11. At that time, , A=547.512MPa.
To calculate the value of n, the least squares fitting method is used, and the natural logarithm is taken on both sides of the equal sign. Then, the equation (20) can be rewritten as:
The relationship between the and is linear, the slope of the straight line in the graph is the hardening index, and n is calculated at 0.751.
To calculate the value of B, Equation (21) can be rewritten as:
As shown in Figure 12, the relationship curve is plotted. The relationship between the and is approximately linear, then B is the slope of the curve, and B=671.202 is obtained by linear fitting.
is the strain rate function, where , is the strain rate, is the reference strain rate, Equation (22) is as follows, and the real stress-strain data (strains of 0.1 to 0.3 at intervals of 0.05) at four different strain rates at a reference temperature of 25 °C are selected as shown in , substituting the true stress-strain data into Equation.
The relationship curve of - is shown in Figure 13, and the value of parameter c is calculated as 0.116 by linear fitting.
(4) Solution of thermal softening parameter m
Compared to room temperature tensile, the flow stress of 7075-T6 aluminum alloy under electric current is much lower, attributed to the thermal softening effect. can also be interpreted as the ratio of the strength of high-temperature tensile or electrically assisted tensile to room-temperature tensile as shown in Equation (23):
Recalling the JC model, we can directly fit the straight line in Figure 16 to obtain equation (24) to obtain the slope values and the model parameters m.
where is the electrically assisted tensile strength and is the room-temperature tensile strength.
As seen from Table 7, the parameter m increases with increasing strain rate, as higher strain rates lead to more significant plastic deformation. is maximum at 0.1, indicating the best model fit at this rate.
(5) The electrothermal conversion function
Compared to room-temperature tensile, the flow stress of the 7075-T6 aluminum alloy under electric current is significantly lower, attributed to the thermal softening effect. represents the thermal energy function. It is defined as the ratio of the strength of high-temperature tensile or electrically assisted tensile to that of room-temperature tensile, as shown in Equation (25):
Let the left side be M to simplify Equation (25), and leads to Equation (26):
-
Taking the rate as 1 as an example, the EA-Johnson Cook model connecting the current density parameters is an Equation (27):
4. Numerical Simulation of Uniaxial Tensile
4.1. Analysis of Current and Temperature Field During the Pulsed Current Loading Process
Then, we simulate the current-assisted tensile process, setting power on time of 40 seconds, and four groups current densities (8 A/mm², 14 A/mm², 20 A/mm², and 26 A/mm²) for comparison. This analysis aims to examine the distribution patterns of the temperature field, current field, and strain field during the energized tensile process. The simulation results are shown in Figure 14, which illustrates the current distribution and uniform distribution of current density across the marked distance section of the specimen.
Figure 15 illustrates the temperature change along the length with different current densities. The temperature increases with current density. Notably, the temperature distribution gradually converges to the middle section, forming a curve similar to a quadratic function with a smooth transition at the peak temperature. Moreover, with higher current densities, the temperature elevation area expands. At a current density of 26 A/mm², the temperature rise area extends about 1 mm further on both sides compared to 8 A/mm².
4.2. Stress and Strain Field Analysis during the Pulsed Current Loading Process
It involves coupling electric, thermal, and force fields, requiring observing the stress-strain field distribution. A path is established in the direction of the length with current densities of 8 A/mm2, 14 A/mm2, 20 A/mm2, and 26 A/mm2, respectively. Figure 16a,b show the stress and strain change curves along the length of the plate. The rapid increase in current density due to rising temperature gradually reduces stress and strain. The stress-strain and temperature fields exhibit nearly trapezoidal distributions, with higher values at the middle and lower at the sides. This pattern results from the current-assisted tensile process affecting the elastic modulus and Poisson’s ratio due to temperature changes, which leads to a similarity between the stress-strain and temperature distributions.
4.3. Comparison of Numerical and Analytical Solutions
Through implicit analysis to customize the material principal structure [30,31], the primary task of UMAT is based on finite element calculations.
The modified Johnson-Cook model combined with ABAQUS software predicted the flow stress behavior of electrically assisted tensile specimens at different rates. After conducting uniaxial tensile tests at different rates, Figure 17 compares experimental and predicted values. The results show that the model’s predictions are highly consistent with the experimentally observed flow stress trends, which indicates that the error of EA Johnson-Cook model is tiny. Three standard statistical parameters have been introduced [32] to quantify the accuracy and reliability of the response model. That is, correlation coefficient (R), mean absolute error (AARE), and root mean square error (RMSE), with their expressions given in Equations (28), (29), and (30).
Figure 18 shows the overall standard statistical results and the correlation between the experimental values and the predicted values of the intrinsic model. Data points near the straight line indicates less deviation between the predicted and experimental values, including the statistical parameters R, AARE, RMSE. The correlation coefficient of the model is 0.99608, indicating that the correlation between the experimental data and the data predicted by the model is in good agreement. In addition, the AARE and RMSE of the model are 2.2633% and 5.678633 MPa, respectively. These results are attributed to the EA Johnson-Cook model using fractional versus exponential thermal softening terms to describe thermally activated plastic deformation.
4.4. Electrically-Assisted Three-Point Bending Platform Construction
Experimental verification of formability of 7075 aluminum alloy under electrified conditions with a three-point bending test. Figure 19 shows the three-point bending experimental setup. Insulation is applied to the punch and die to ensure measurement accuracy. The downward pressure speed of the punch is set at 10 mm/min for consistency
4.5. Effect of Different Current Densities on Temperature
As shown in Figure 20, the stress-strain curve at various current densities decreases bending stress as current density increases, demonstrating the current’s capacity to enhance material plasticity. The figure shows a significant decrease in the stress yield section, with flexural strength at the yield point dropping by 21-24% at its maximum.
Figure 21 shows the spring back angle of the 7075 aluminum alloy sheet after forming with various electrical pulse parameters. With a specific duty cycle, the rebound angle notably decreased as the pulse current density rose, which suggested that applying pulse current could effectively enhance the resilience of the plates post-forming. Adjusting the pulse current density appropriately minimizes plate bending spring back, improving the forming effect. The rebound angle was smaller at a 20% duty cycle, resulting in better suppression. Notably, at D=20% and a current density of 20 A/mm2, the rebound angle measures 4°, nearly eliminating the rebound effect.
4.6. Effect of Different Current Densities on Temperature
In Figure 22, the specimen temperature measurement locations is segmented into three positions. When the response values peak, the temperature rises fastest and highest at reference point 1, corresponding to the bending rounded corner. This region is more prone to softening than the surrounding areas, facilitating bending deformation. The temperature increase accelerates residual stress release, promotes stress relaxation, and reduces bending resilience. Reference point 2 lies midway between reference point 1 and reference point 3 along the span. Consequently, the temperature at reference point 2 is higher than at reference point 3 due to increased friction with the rounded corners of the die. The overall temperature is notably lower compared to that in the tensile test. This discrepancy can be attributed to the superior thermal efficiency of the 7075 aluminum alloy, which features a significantly larger contact area between the plate and the surrounding air.
Figure 23 illustrates the temperature variations over time under different current densities. The temperature rise rate varied with current densities, with higher current densities causing faster temperature increases in the specimen. Elevated current densities allow the plate to absorb more energy, rapidly increasing thermal activation energy. This trend aligned with findings from the tensile test. By adjusting the current density, operators can determine optimal heating and moulding temperatures, improving efficiency and reducing costs.
4.7. Bending Stress Field Analysis
Figure 24 illustrates the distribution of bending stress. Following yielding, there was a significant decrease in bending stress. The ultimate bending strength can be analyzed by adjusting the analysis step to coincide with the moment of maximum stress. As shown in the cloud diagram, the stress distribution gradually becomes more concentrated. The stress distribution region exhibits a stepwise uniform pattern, highlighting the bending rounded corners as areas of maximum force. The bending stress greatly exceeds the tensile stress and decreases as the current density of the energized surface increases.
5. Conclusions
(1) Based on the electrically assisted tensile test platform, the variation law of yield strength of 7075-T6 aluminum alloy was obtained. The yield strength decreases with the increase of current density.
(2) Through decoupling of thermal and non thermal effects, it was found that compared with traditional electric furnace heating, electric assisted heating reduces yield strength and increases elongation; The higher the current density, the greater the electroplastic effect coefficient, and pure electroplasticity can be used to reduce the forming temperature.
(3) A thermal Electrothermal coupling constitutive equations was constructed, and through subroutine and error analysis, it was found that the correlation between strain rate 1s-1 was as high as 0.99, with a minimum average relative error of 2.26% and a root mean square error of 5.68 MPa.
(4) The verification of the electric assisted three-point bending example shows that as the current density increases, the rebound angle decreases, the rebound suppression effect is better, the bending stress decreases with the increase of current density, and the yield cross-section of stress significantly decreases.
Author Contributions
Conceptualization, S.S.D.; methodology, J.S.X.; software, Z.L. and H.J.S. and K.Z. and Z.J.L; validation, Z.L. and H.J.S. and H.J.S. and K.Z. and Z.J.L.; formal analysis, C.Y.Z.; investigation, S.S.D.; resources, S.S.D.; data curation, J.S.X.; writing—original draft preparation, Z.L.; writing—review and editing, S.S.D. and J.S.X; visualization, Z.L. and H.J.S. and H.J.S. and K.Z. and Z.J.L.; supervision, J.S.X.; project administration, S.S.D.; funding acquisition, S.S.D. All authors have read and agreed to the published version of the manuscript.
Funding
This research received no funding.
Data Availability Statement
Not applicable.
Conflicts of Interest
The authors declare no conflicts of interest.
References
- Dalong L, Yanting L, Enlin Y, et al. Theoretical and experimental study of the drawing force under a current pulse[J]. The International Journal of Advanced Manufacturing Technology, 2018, 97(1):1047-1051. [CrossRef]
- Li C, Xu Z, Peng L, et al. An electric-pulse-assisted stamping process towards springback suppression and precision fabrication of micro channels[J]. International Journal of Mechanical Sciences, 2022, 218. [CrossRef]
- Stolyarov V, Misochenko A A Pulsed Current Application to the Deformation Processing of Materials[J]. Materials (Basel), 2023, 16(18). [CrossRef]
- Liu J, Jia D, Fu Y, et al. Electroplasticity effects: from mechanism to application[J]. The International Journal of Advanced Manufacturing Technology, 2023. [CrossRef]
- Lv Z, Zhou Y, Zhan L, et al. Electrically assisted deep drawing on high-strength steel sheet[J]. The International Journal of Advanced Manufacturing Technology, 2020, 112(3-4):763-7. [CrossRef]
- Mai J, Peng L, Lin Z, et al. Experimental study of electrical resistivity and flow stress of stainless steel 316L in electroplastic deformation[J]. Materials Science and Engineering: A, 2011, 528(10-11):3539-3544. [CrossRef]
- Tskhondiya G A, Beklemishev N N Simulating the effect of a high density electric current pulse on the stress field during plastic deformation[J]. International Journal of Material Forming, 2011, 5(2):157-162. [CrossRef]
- Fan R, Magargee J, Hu P, et al. Influence of grain size and grain boundaries on the thermal and mechanical behavior of 70/30 brass under electrically-assisted deformation[J]. Materials Science and Engineering: A, 2013, 574218-225. [CrossRef]
- Magargee J, Morestin F, Cao J Characterization of Flow Stress for Commercially Pure Titanium Subjected to Electrically Assisted Deformation[J]. Journal of Engineering Materials and Technology, 2013, 135(4). [CrossRef]
- Roh J-H, Seo J-J, Hong S-T, et al. The mechanical behavior of 5052-H32 aluminum alloys under a pulsed electric current[J]. International Journal of Plasticity, 2014, 5884-99. [CrossRef]
- Hu L, Jiang S, Zhou T, et al. Multiscale Modeling of Polycrystalline NiTi Shape Memory Alloy under Various Plastic Deformation Conditions by Coupling Microstructure Evolution and Macroscopic Mechanical Response[J]. Materials (Basel), 2017, 10(10). [CrossRef]
- Ao D, Chu X, Yang Y, et al. Effect of electropulsing on springback during V-bending of Ti-6Al-4V titanium alloy sheet[J]. The International Journal of Advanced Manufacturing Technology, 2018, 96(9-12):3197-3207. [CrossRef]
- Wang X, Xu C, Li Y, et al. Respective roles of the thermal and electromigration effect in AZ31 Mg alloy during low-frequency electropulsing tension[J]. Journal of Alloys and Compounds, 2020, 846. [CrossRef]
- Dinh K-A, Hong S-T, Choi S-J, et al. The Effect of Pre-strain and Subsequent Electrically Assisted Annealing on the Mechanical Behaviors of Two Different Aluminum Alloys[J]. International Journal of Precision Engineering and Manufacturing, 2020, 21(12):2345-2358. [CrossRef]
- Fu J, Ma D, Fan L, et al. Tribological Properties of Solid Lubricant WS(2) in Dimples on the Cylinder of Diesel Engine at High Temperature[J]. Materials (Basel), 2022, 15(22). [CrossRef]
- Jordan A, Kinsey B L Investigation of thermal and mechanical effects during electrically-assisted microbending[J]. Journal of Materials Processing Technology, 2015, 2211-12. [CrossRef]
- Wagner K C, Byrd G D Evaluating the effectiveness of clinical medical librarian programs: a systematic review of the literature. J Med Libr Assoc 92(1) January 2004[J]. J Med Libr Assoc, 2012, 100(4 Suppl): J.
- Shi C, Mao W, Chen X G Evolution of activation energy during hot deformation of AA7150 aluminum alloy[J]. Materials Science and Engineering: A, 2013, 57183-91. [CrossRef]
- Islam Z, Wang B, Haque A Current density effects on the microstructure of zirconium thin films[J]. Scripta Materialia, 2018, 14418-21. [CrossRef]
- Li X, Yang W, Xu D, et al. A new ductile fracture criterion considering both shear and tension mechanisms on void coalescence[J]. International Journal of Damage Mechanics, 2020, 30(3):374-398. [CrossRef]
- Xu S, Xiao X, Zhang H, et al. Electroplastic Effects on the Mechanical Responses and Deformation Mechanisms of AZ31 Mg Foils[J]. Materials (Basel), 2022, 15(4). [CrossRef]
- Song P, Li X, Ding W, et al. Electroplastic Tensile Behavior of 5A90 Al–Li Alloys[J]. Acta Metallurgica Sinica (English Letters), 2014, 27(4):642-648. [CrossRef]
- Indhiarto I, Shimizu T, Yang M Effect of Peak Current Density on Tensile Properties of AZ31B Magnesium Alloy[J]. Materials (Basel), 2021, 14(6). [CrossRef]
- Dobras D, Bruschi S, Simonetto E, et al. The Effect of Direct Electric Current on the Plastic Behavior of AA7075-T6 Aluminum Alloy in Different States of Hardening[J]. Materials (Basel), 2020, 14(1). [CrossRef]
- Shang H, Wang S, Zhou L, et al. Neural network-based ductile fracture model for 5182-O aluminum alloy considering electroplastic effect in electrically-assisted processing[J]. Engineering Fracture Mechanics, 2023, 290. [CrossRef]
- Zhou Y, Zhu R, Zuo X, et al. Tribo-electrical behaviors of CNTs-MoS2/Cu composites under sliding electrical contact with brass[J]. 2023, 180108207. [CrossRef]
- Zhao Y C, Wan M, Meng B, et al. Pulsed current assisted forming of ultrathin superalloy sheet: Experimentation and modeling [J]. Materials Science and Engineering: A, 2019, 767. [CrossRef]
- Ruszkiewicz B J, Grimm T, Ragai I, et al. A Review of Electrically-Assisted Manufacturing With Emphasis on Modeling and Understanding of the Electroplastic Effect[J]. Journal of Manufacturing Science and Engineering, 2017, 139(11). [CrossRef]
- Zhou M, Lin Y C, Deng J, et al. Hot tensile deformation behaviors and constitutive model of an Al–Zn–Mg–Cu alloy[J]. Materials & Design, 2014, 59141-150. [CrossRef]
- Sheng Y, Hua Y, Wang X, et al. Application of High-Density Electropulsing to Improve the Performance of Metallic Materials: Mechanisms, Microstructure and Properties[J]. Materials (Basel), 2018, 11(2). [CrossRef]
- Li X N, Xu Z, Guo P, et al. Electroplasticity mechanism study based on dislocation behavior of Al6061 in tensile process[J]. Journal of Alloys and Compounds, 2022, 910. [CrossRef]
- Lu J, Song Y, Zhou P, et al. Rheological behavior and dynamic softening mechanism of AA7075-T6 sheet under isothermal tensile deformation[J]. Journal of Materials Research and Technology, 2020, 9(5):9784-9797. [CrossRef]
Figure 1.
(a) Dimensions of electrically assisted tensile specimens; (b) Voltage distribution of 7075-T6 aluminum alloy sample.
Figure 1.
(a) Dimensions of electrically assisted tensile specimens; (b) Voltage distribution of 7075-T6 aluminum alloy sample.
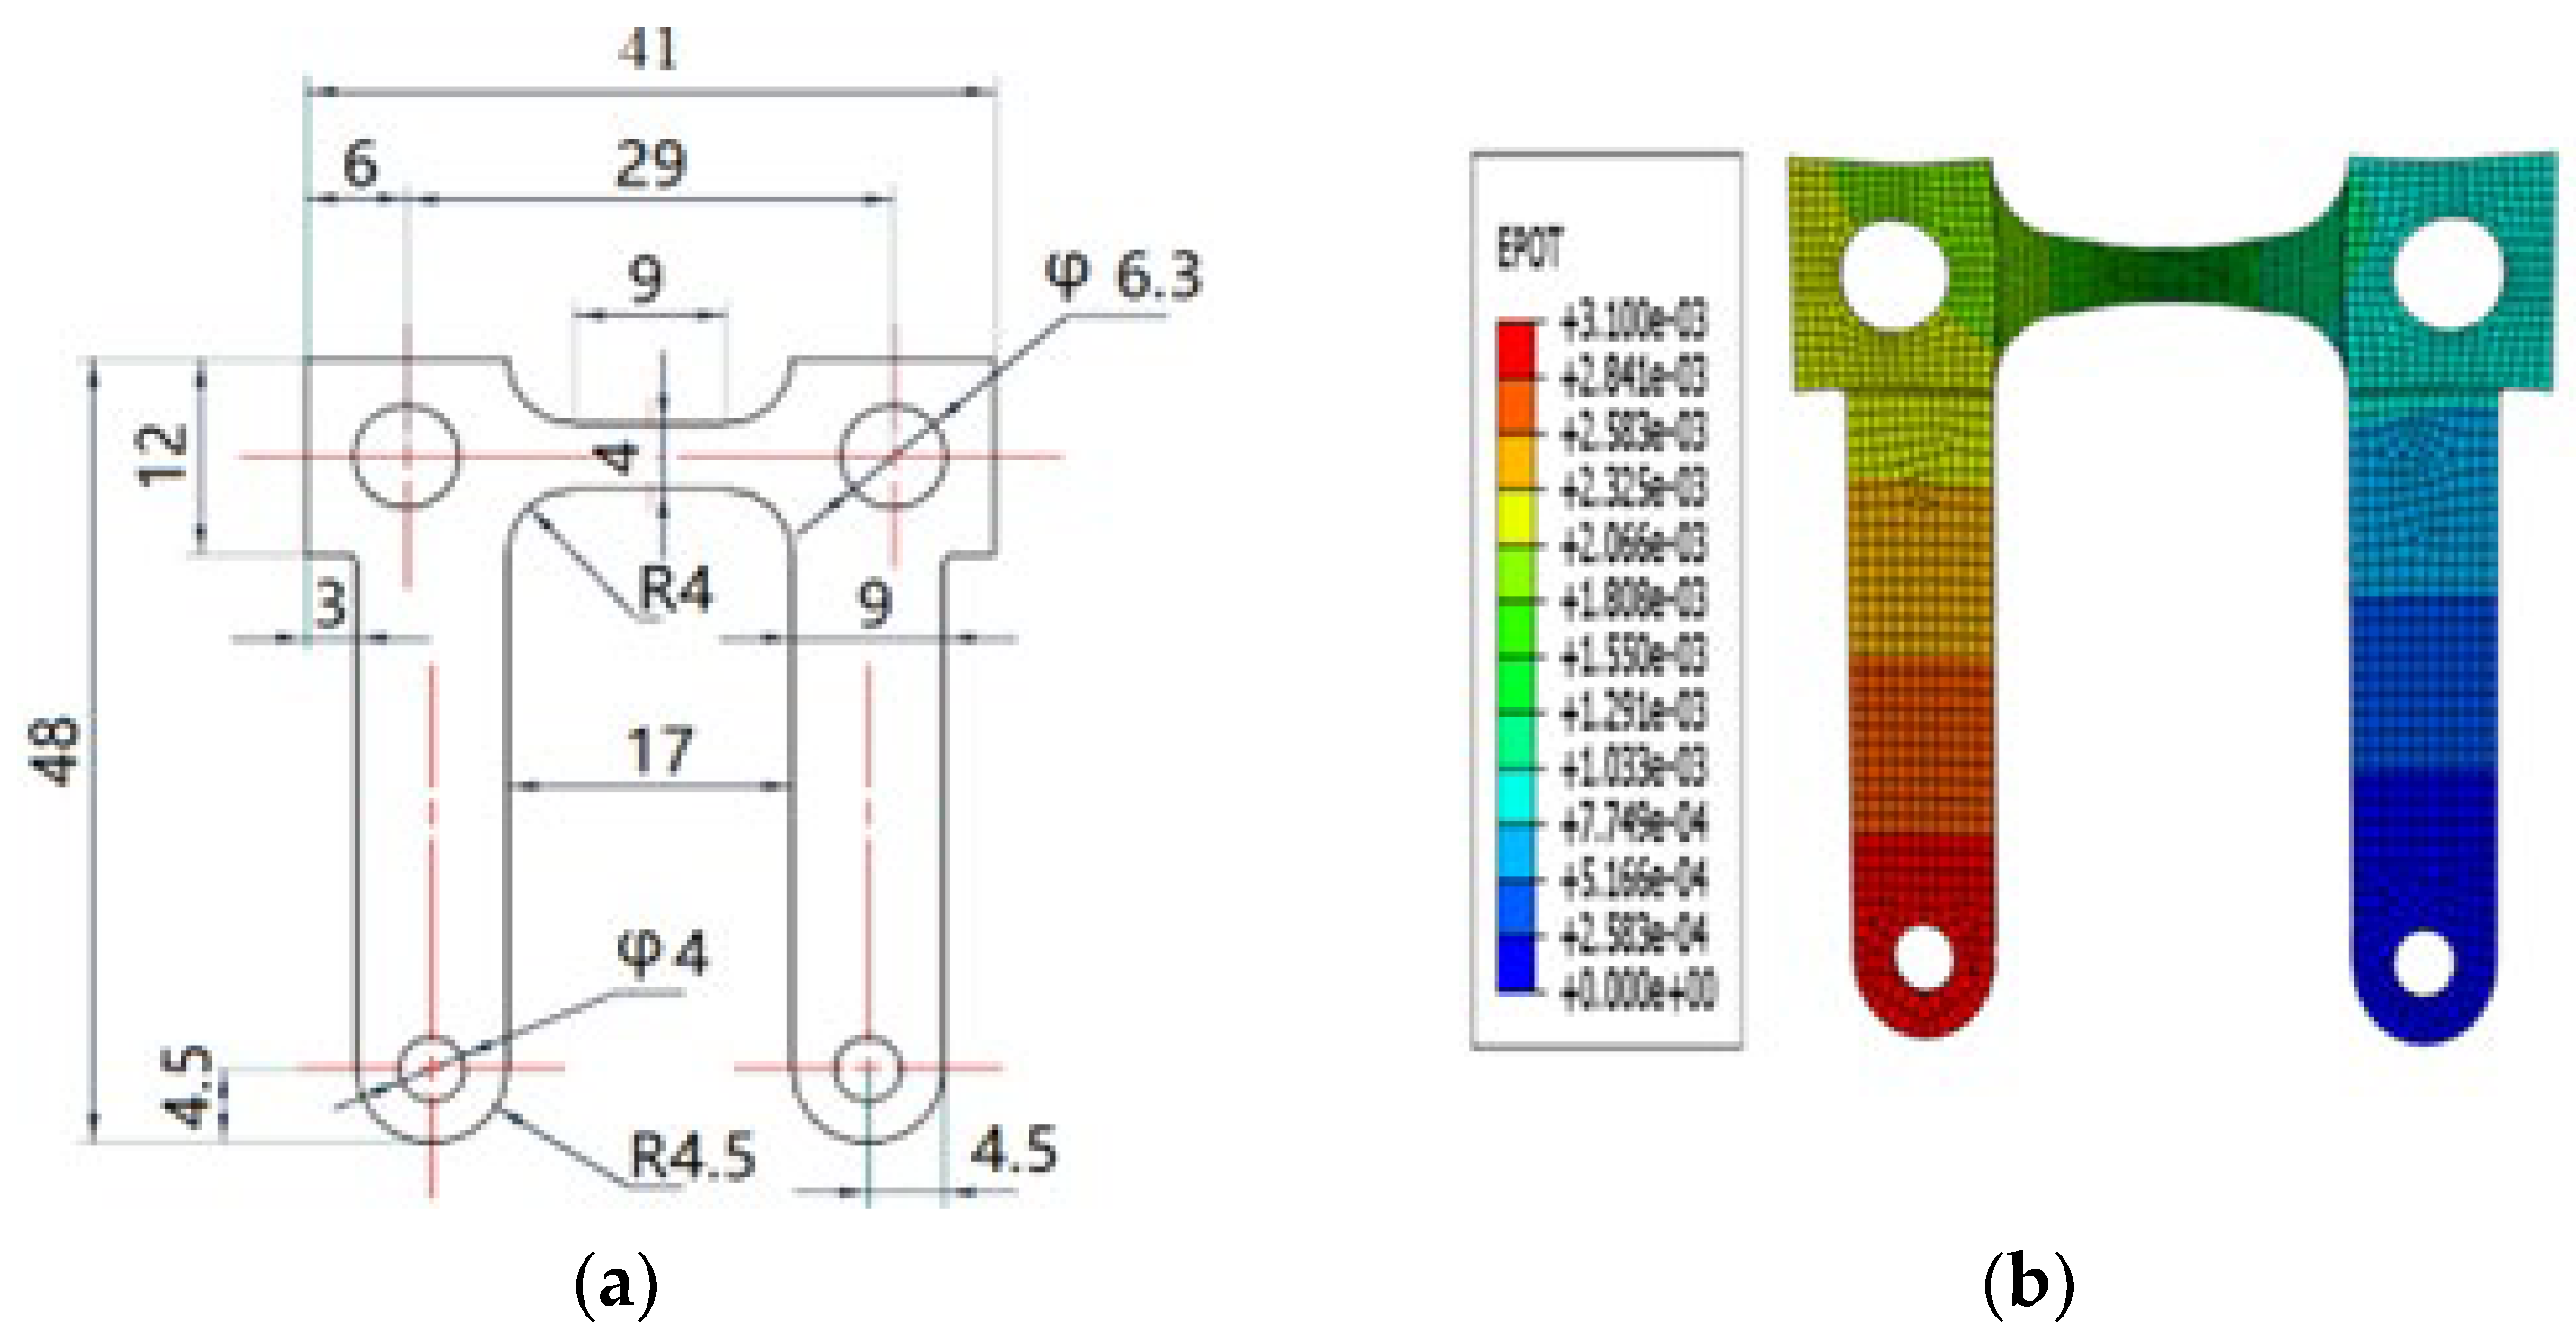
Figure 2.
Experimental equipment diagram (a) Pulse power supply and waveform schematic (b) Thermal imaging camera and heat transfer schematic.
Figure 2.
Experimental equipment diagram (a) Pulse power supply and waveform schematic (b) Thermal imaging camera and heat transfer schematic.
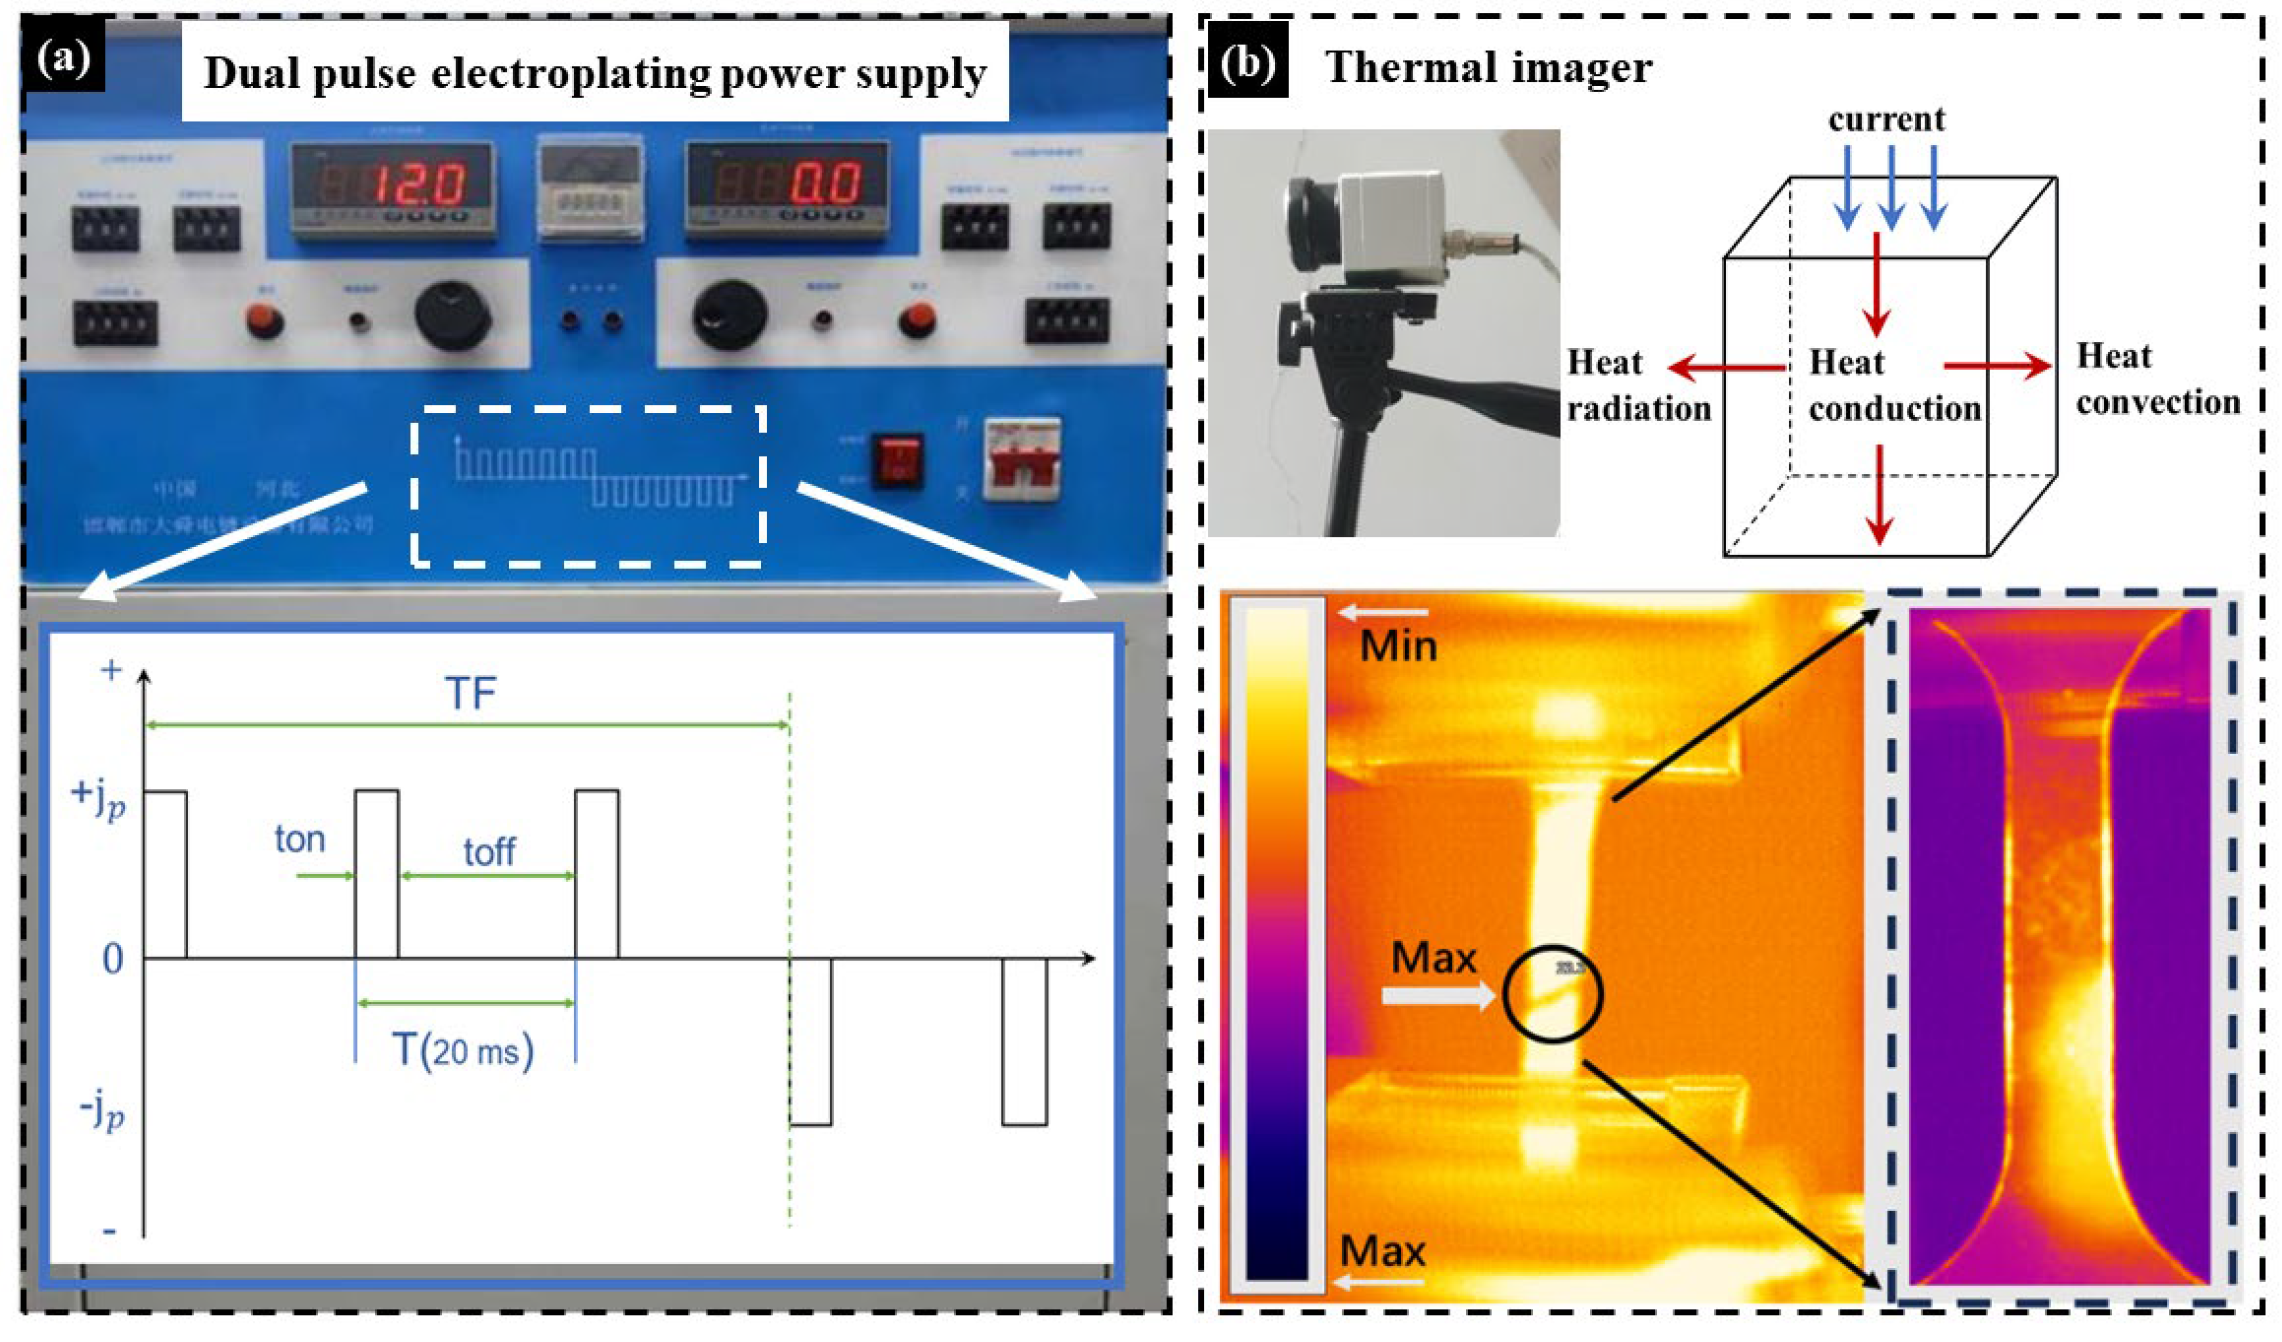
Figure 3.
Electrically-assisted tensile platform (a) Electrically-assisted tensile test platform; (b) Fixture design.
Figure 3.
Electrically-assisted tensile platform (a) Electrically-assisted tensile test platform; (b) Fixture design.
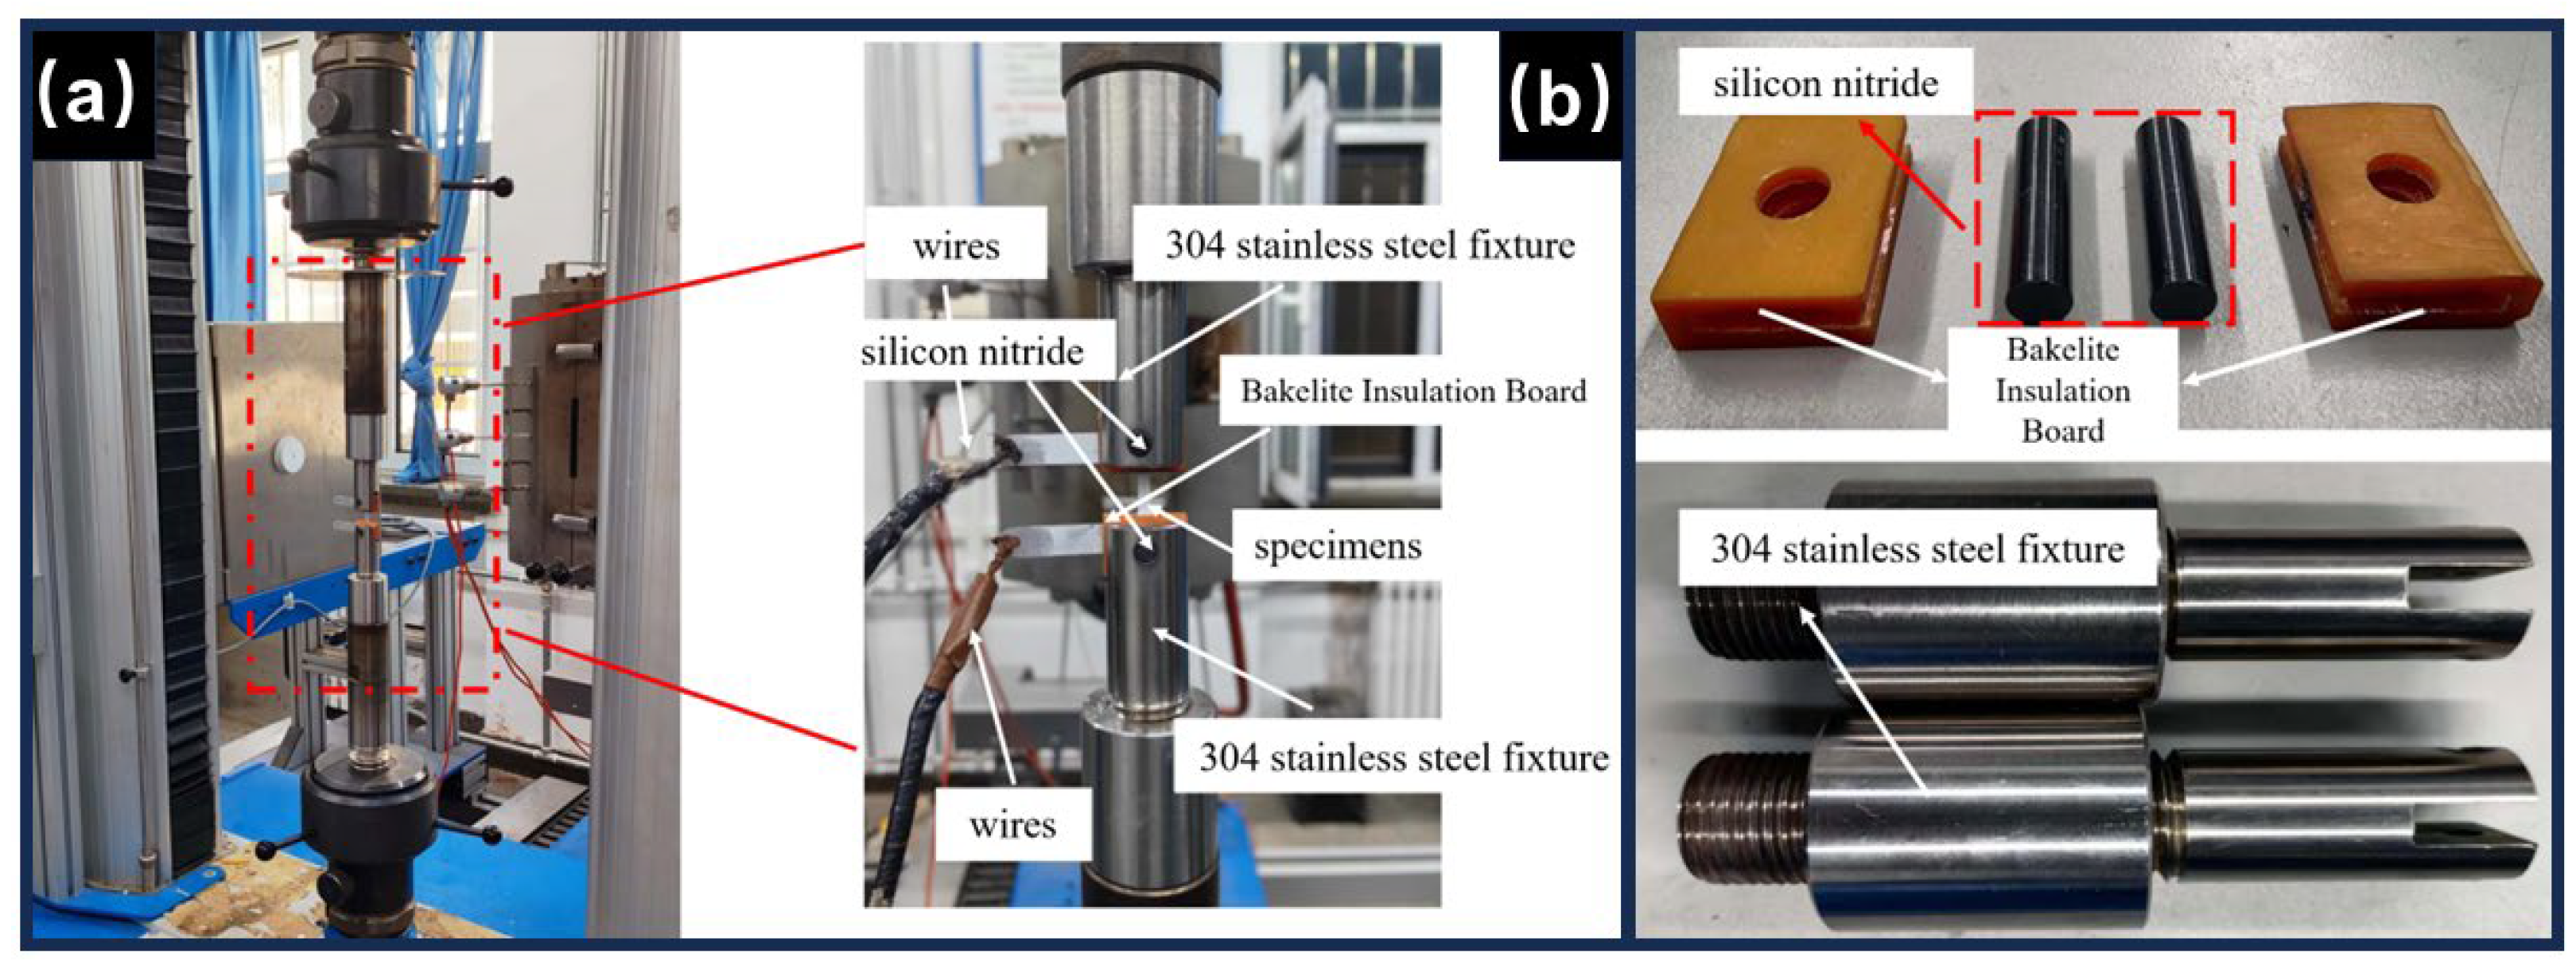
Figure 4.
Experimental process schematic.
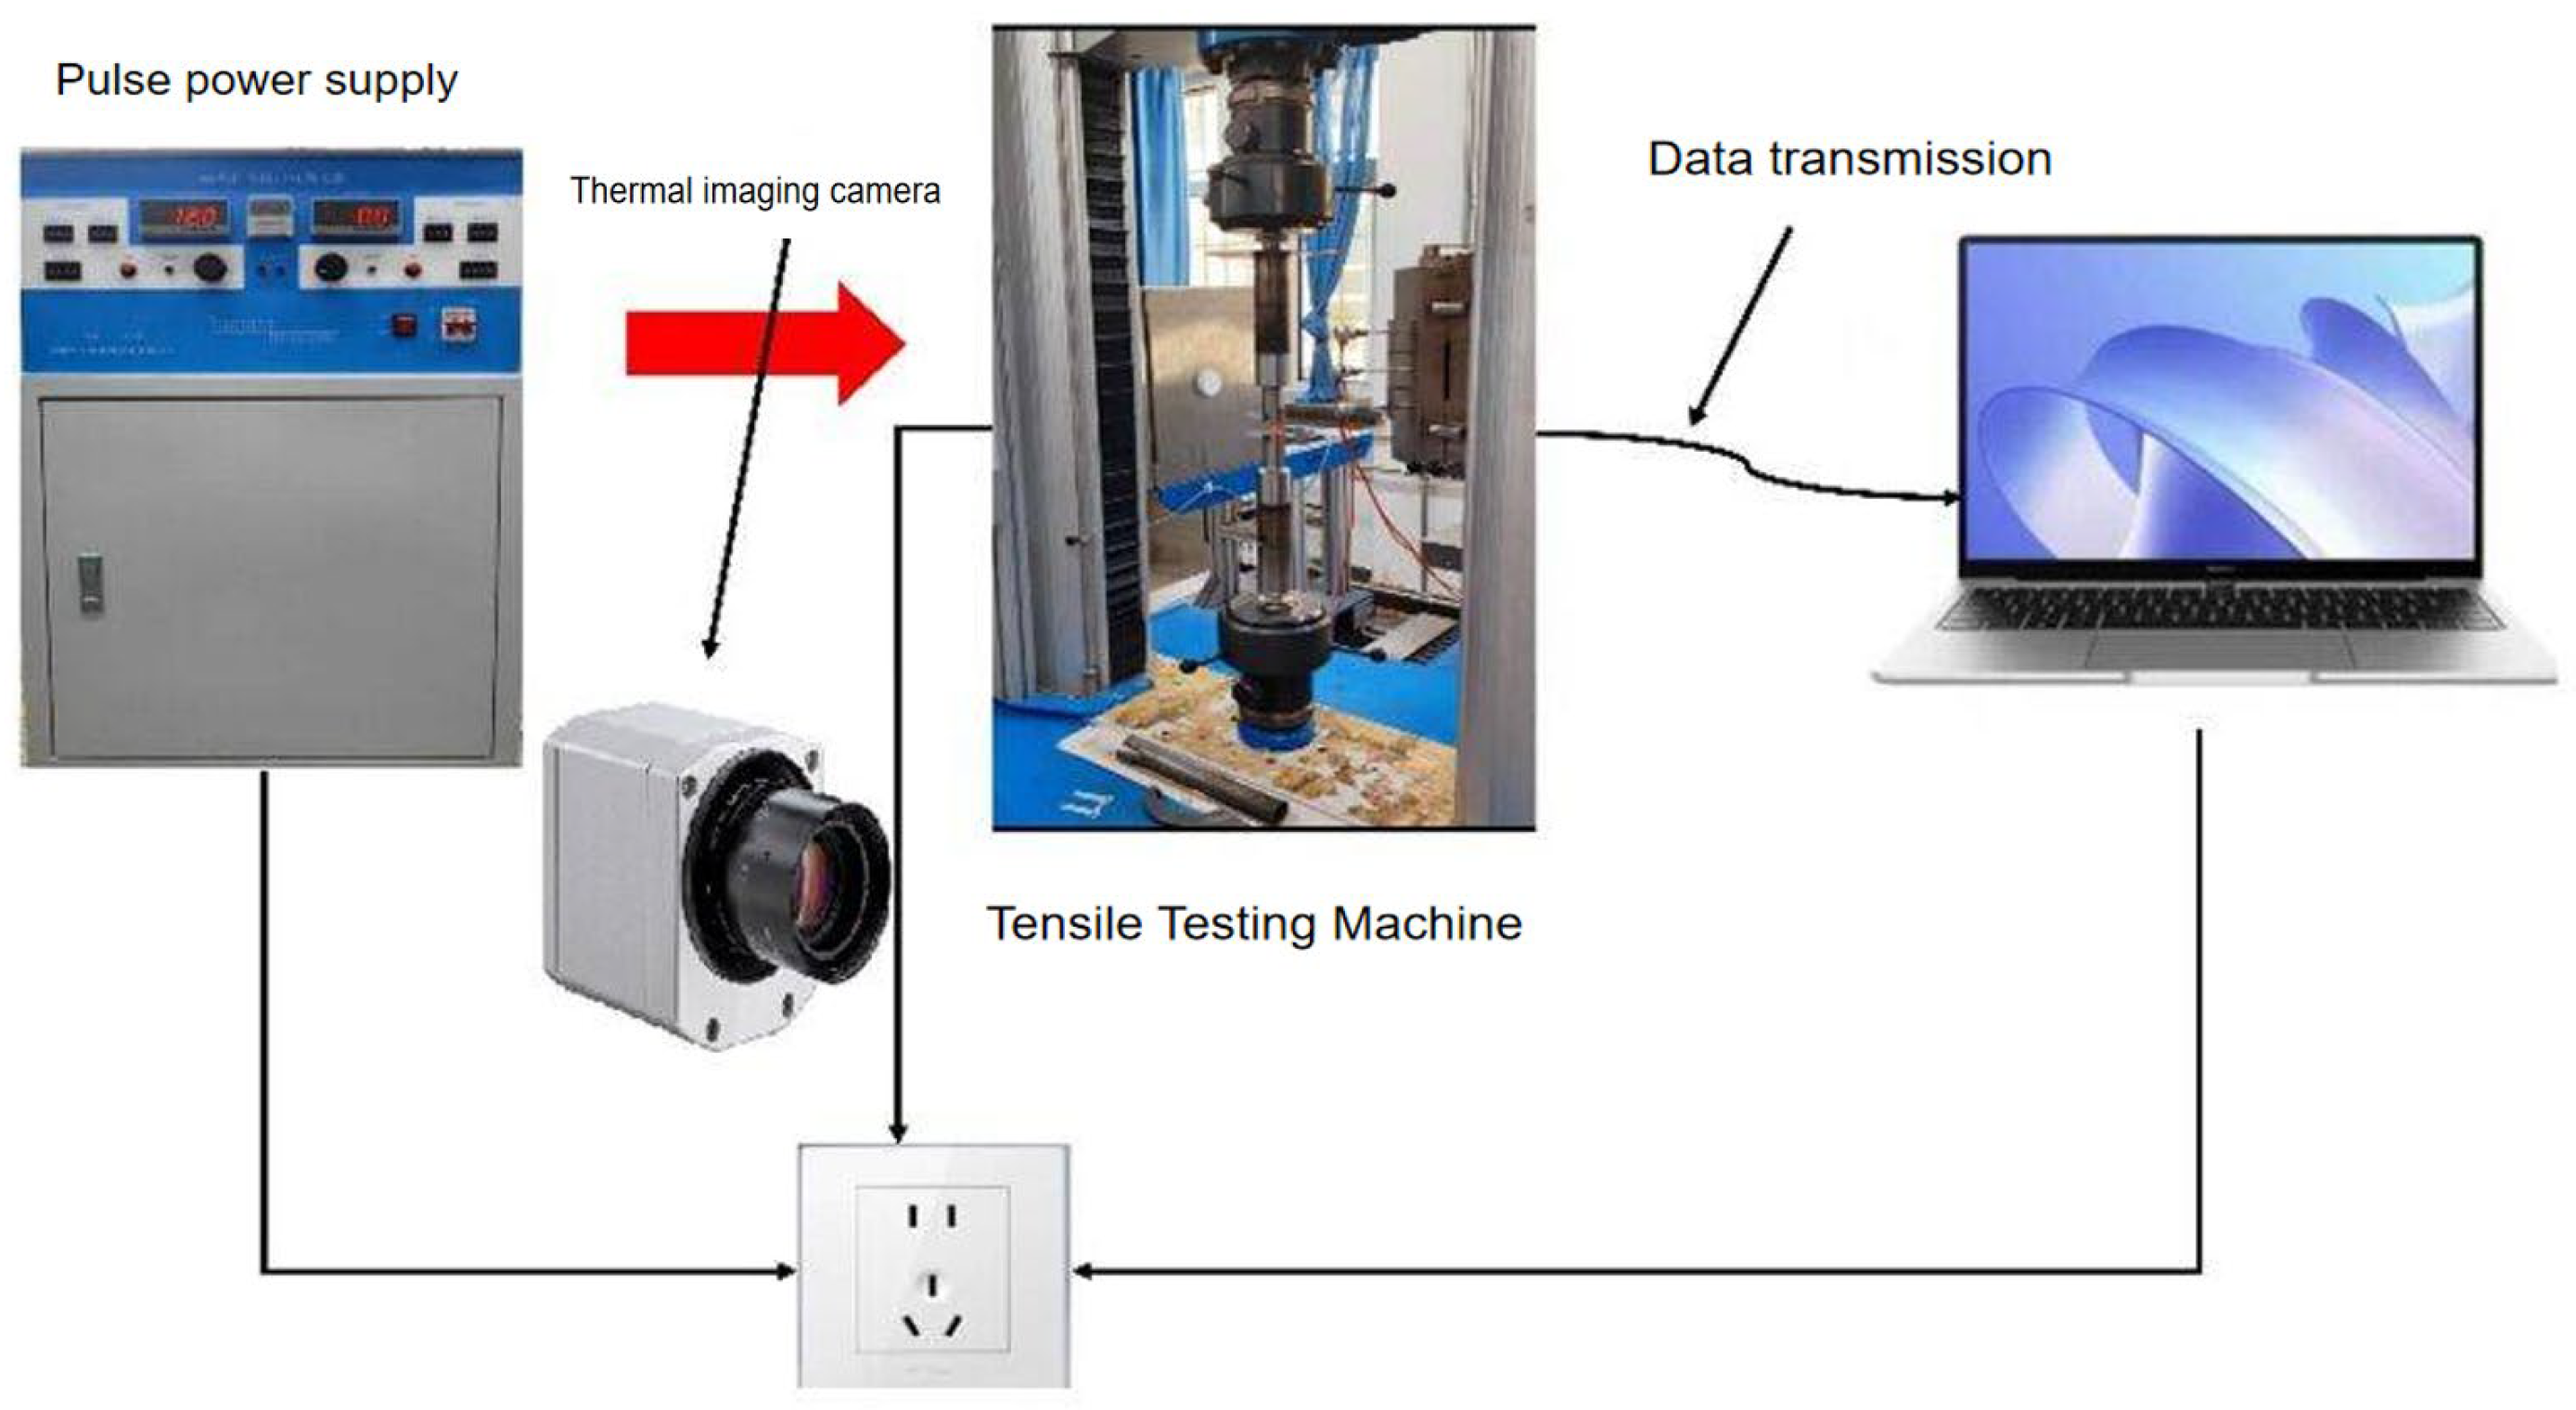
Figure 5.
True Stress-Strain Curves of Isothermal Temperature Tensile and Electrically Assisted Tensile.
Figure 5.
True Stress-Strain Curves of Isothermal Temperature Tensile and Electrically Assisted Tensile.
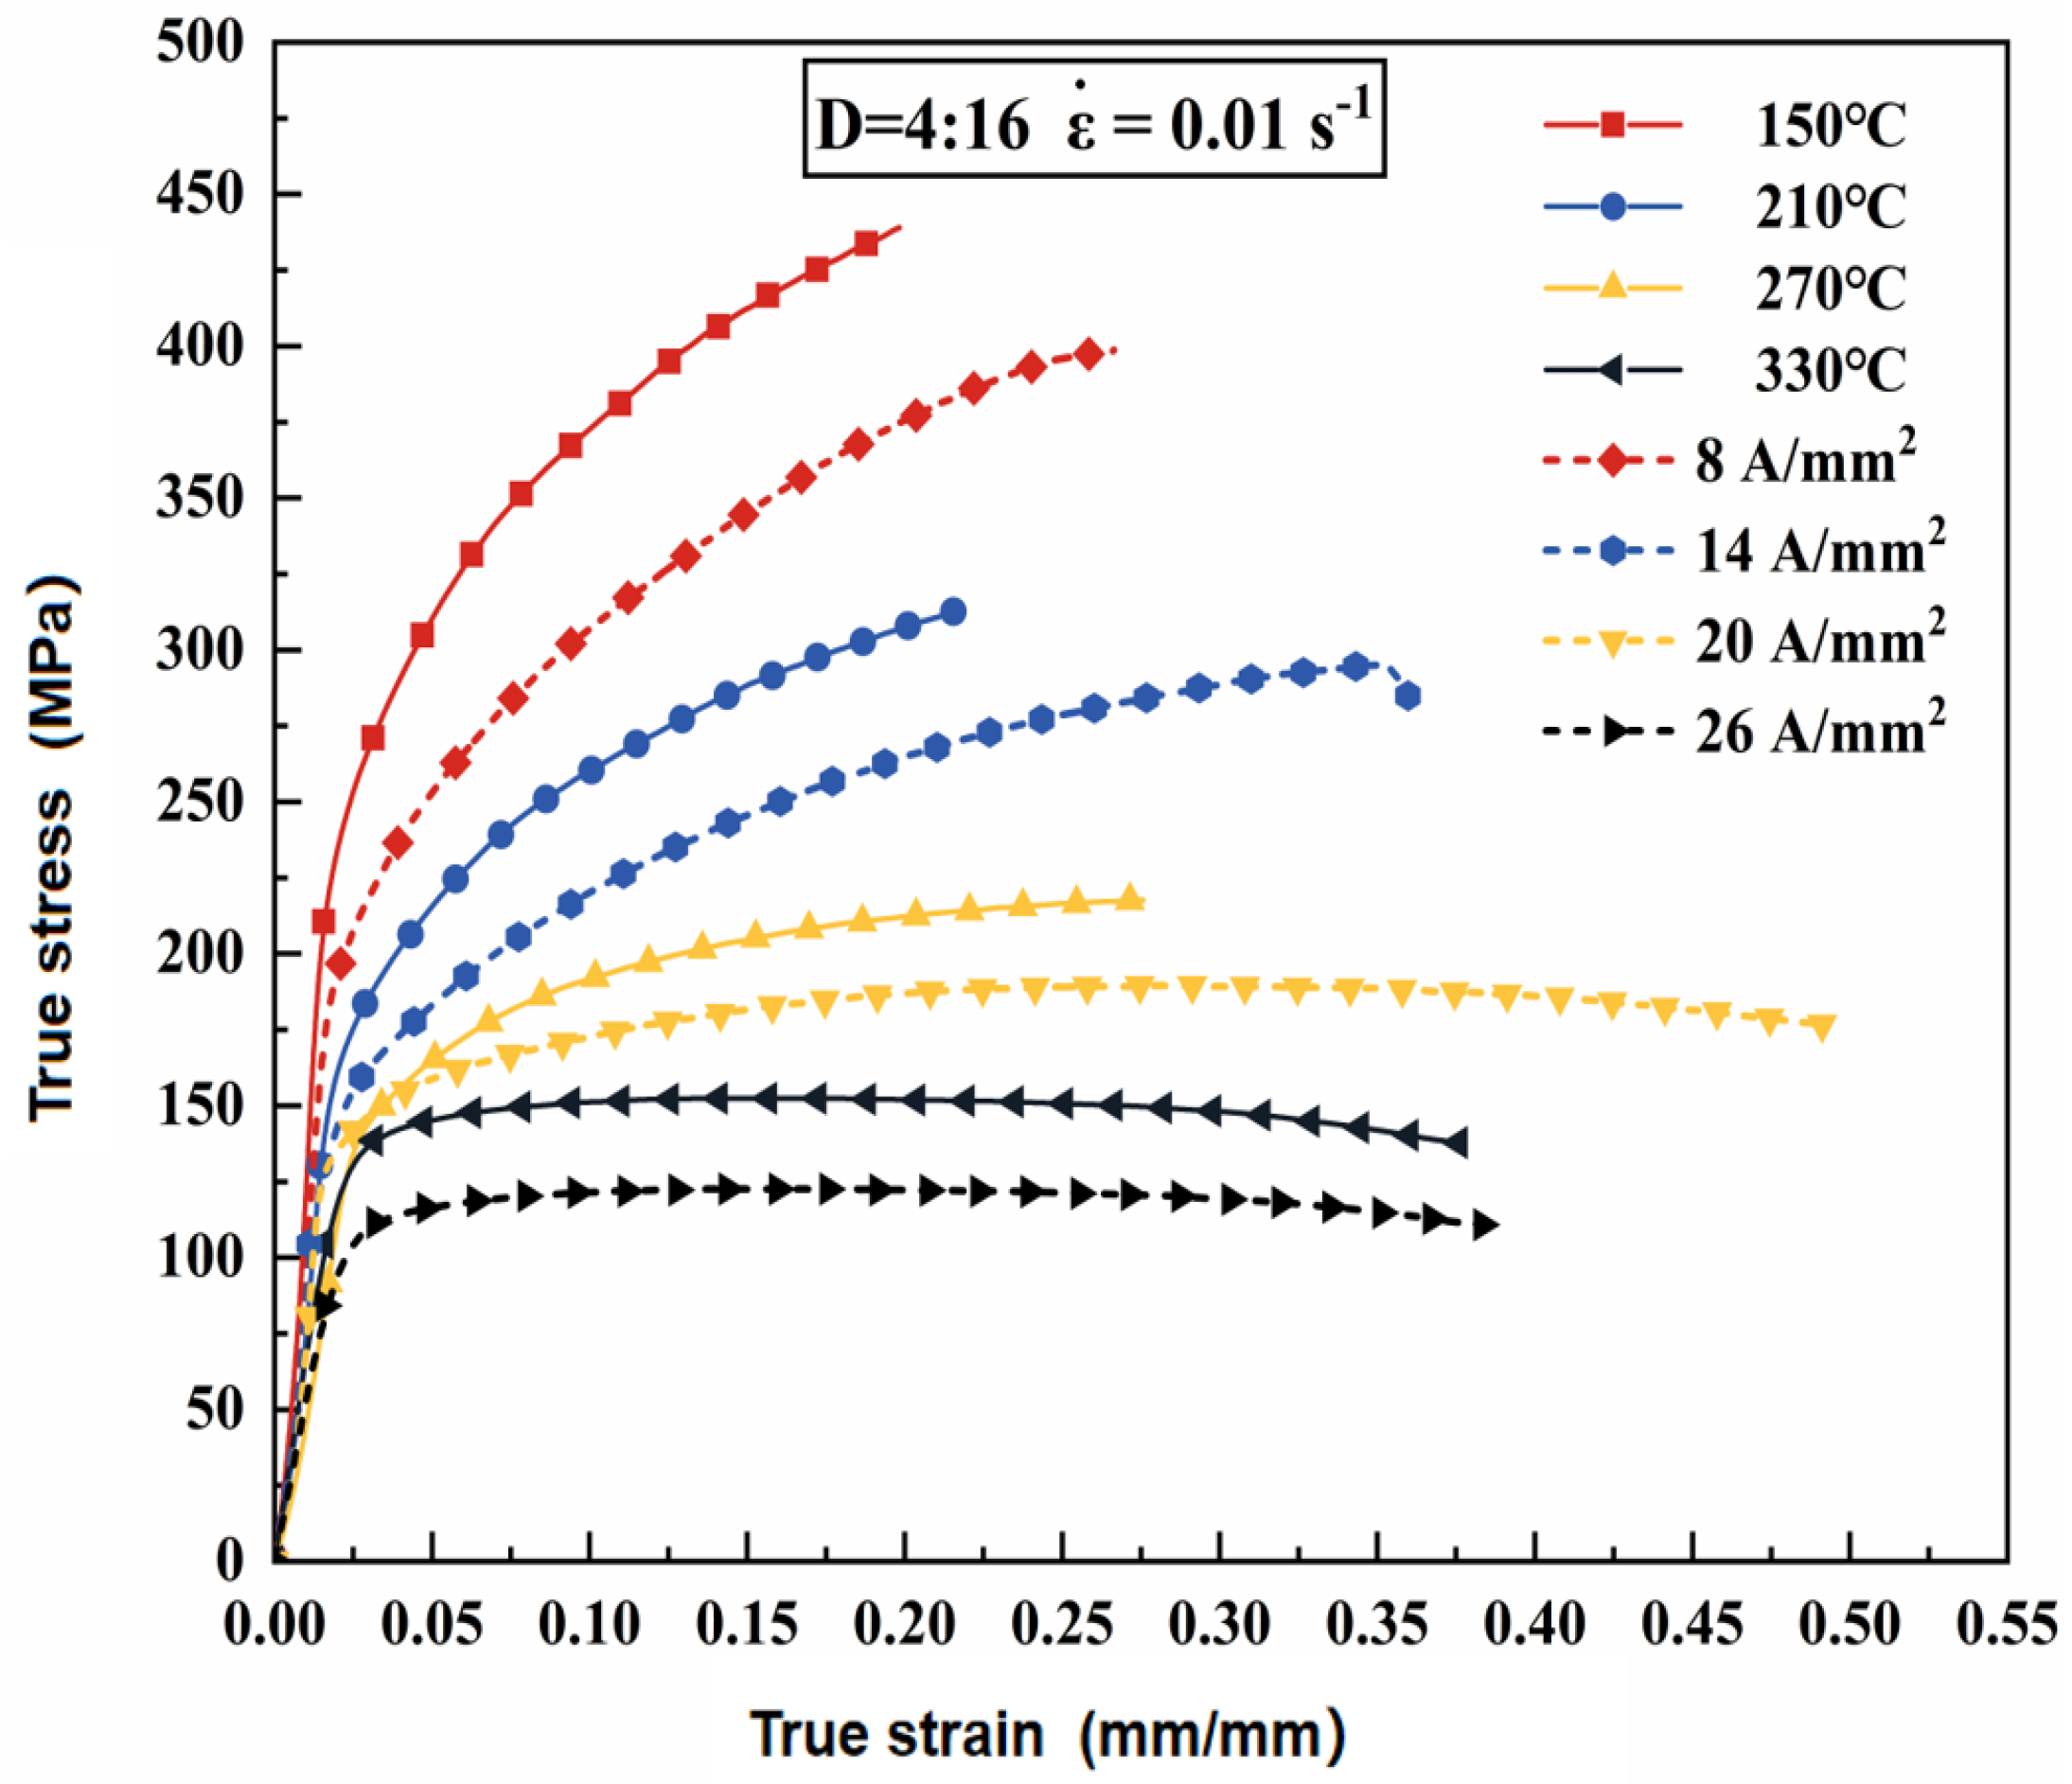
Figure 6.
Comparison of ultimate tensile lightness and elongation at break data under high temperature tensile (TAT) and electrically assisted tensile (EAT) conditions.
Figure 6.
Comparison of ultimate tensile lightness and elongation at break data under high temperature tensile (TAT) and electrically assisted tensile (EAT) conditions.
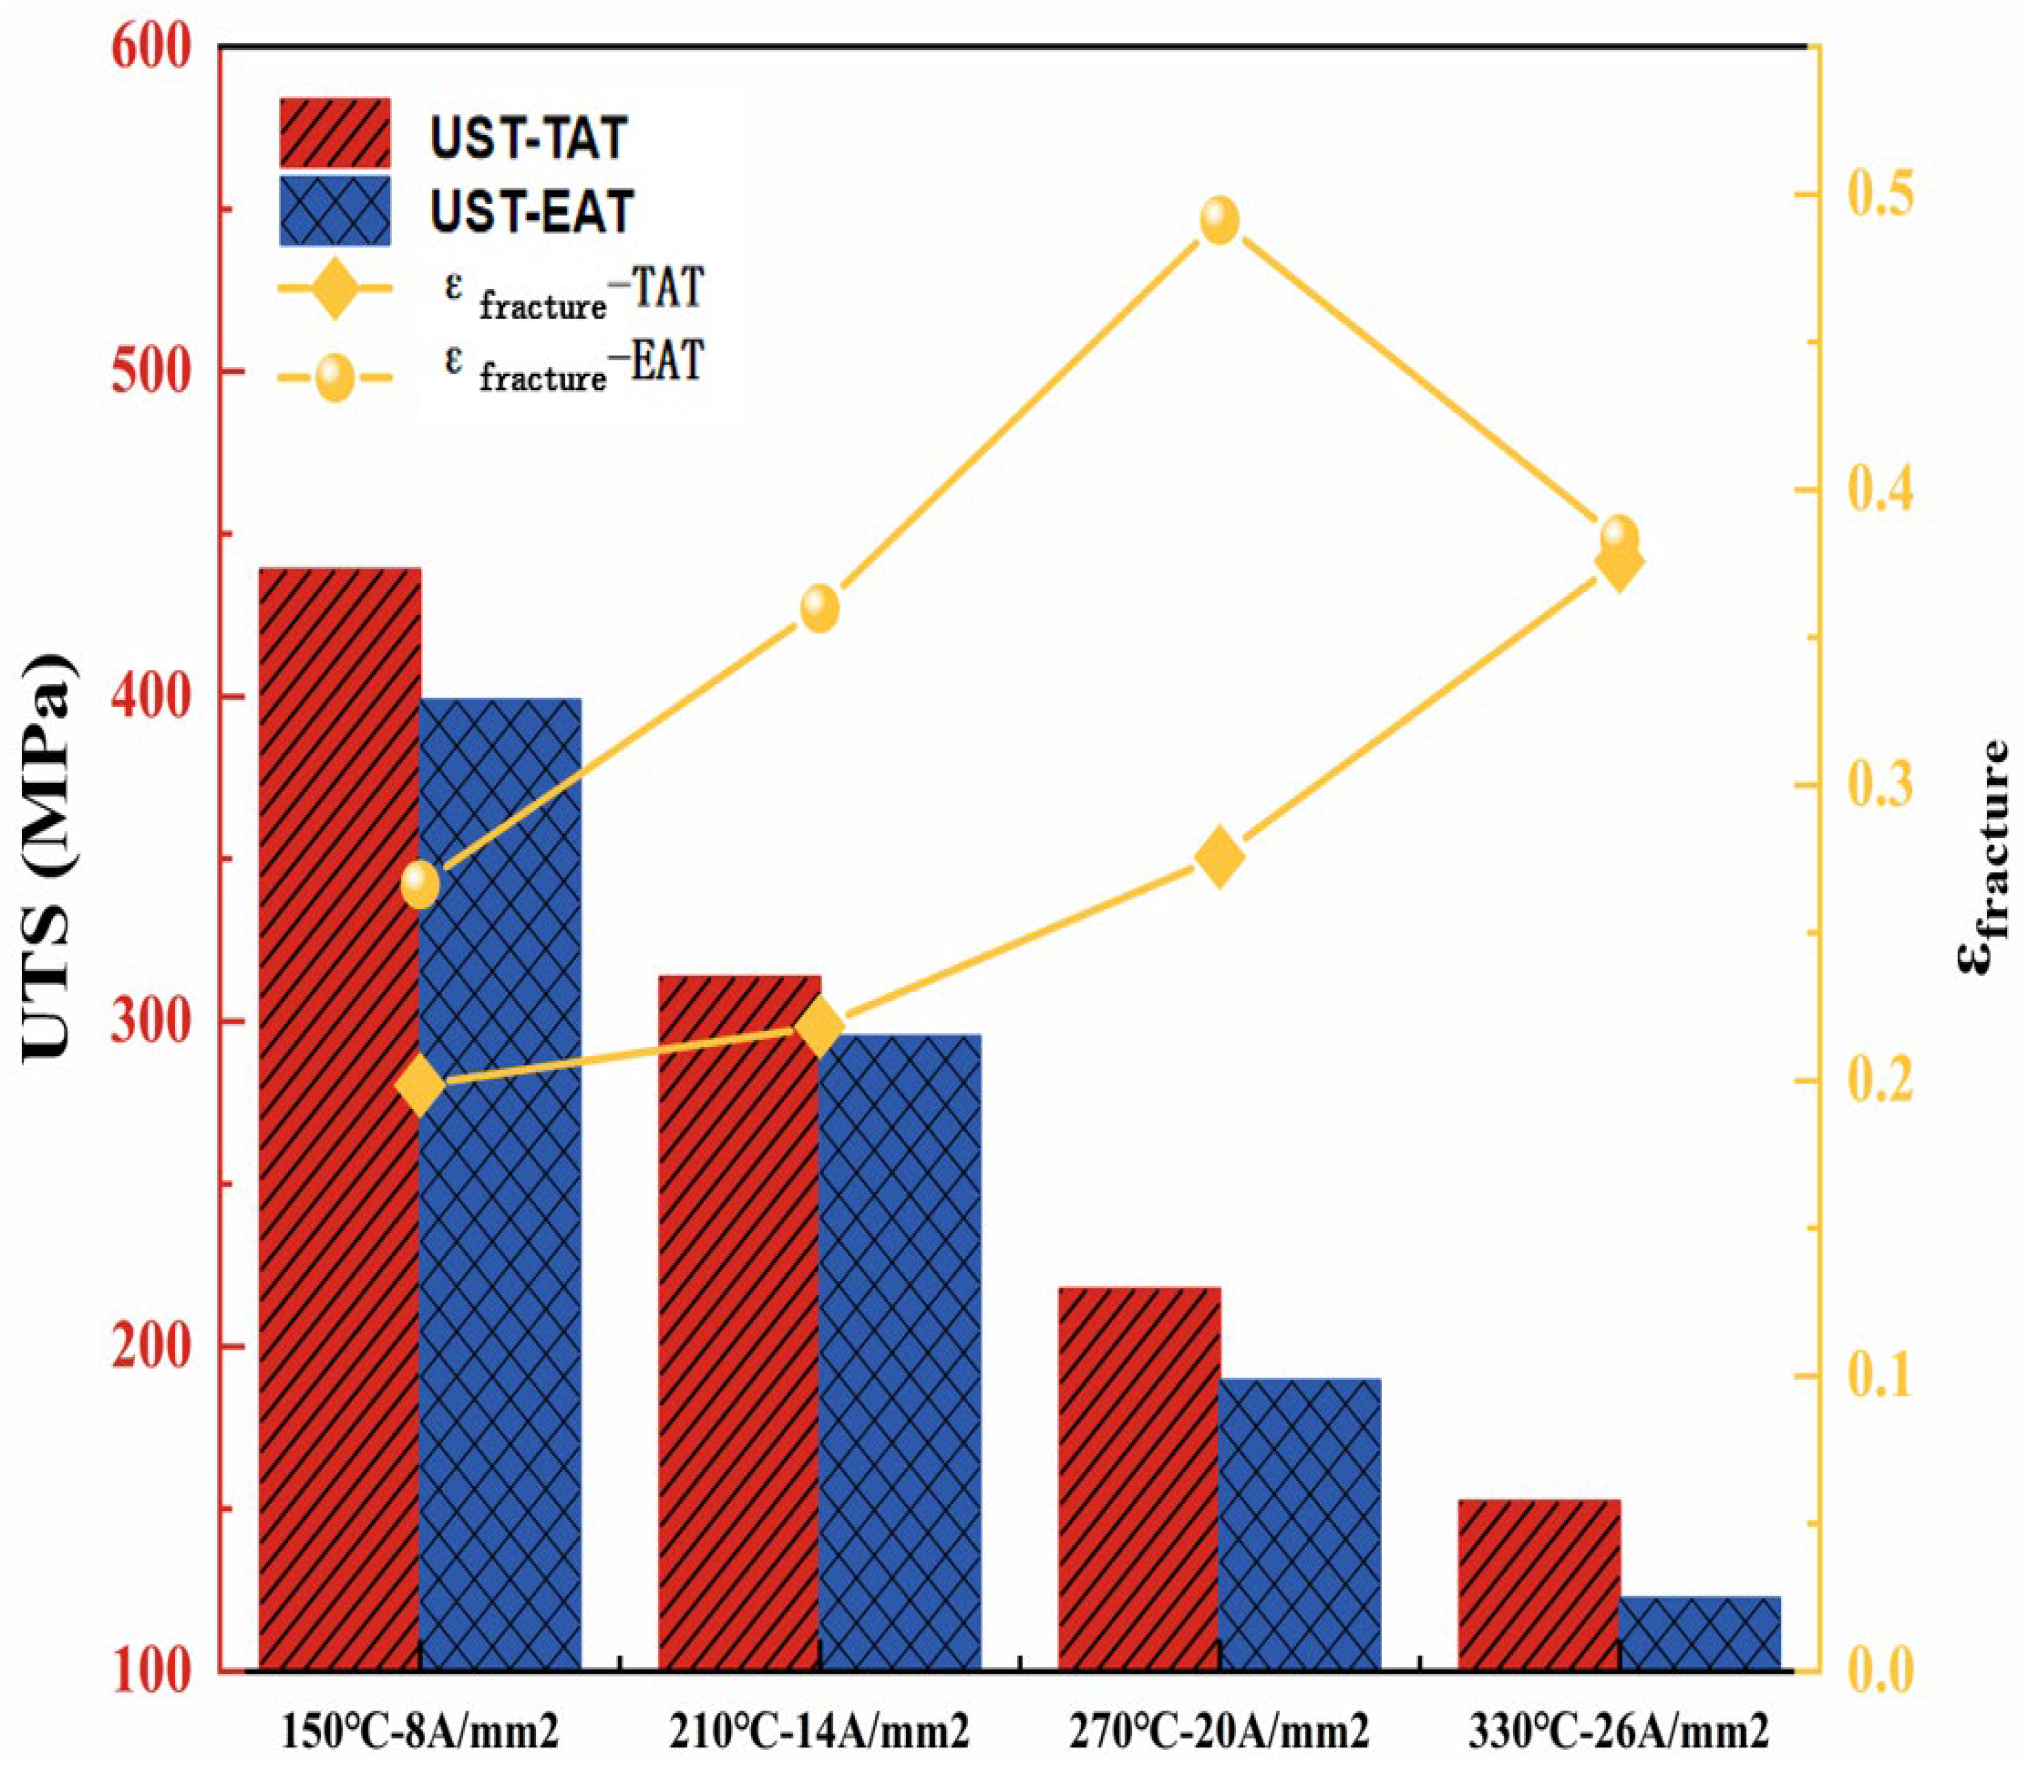
Figure 7.
Electroplating effect coefficients at different current densities.
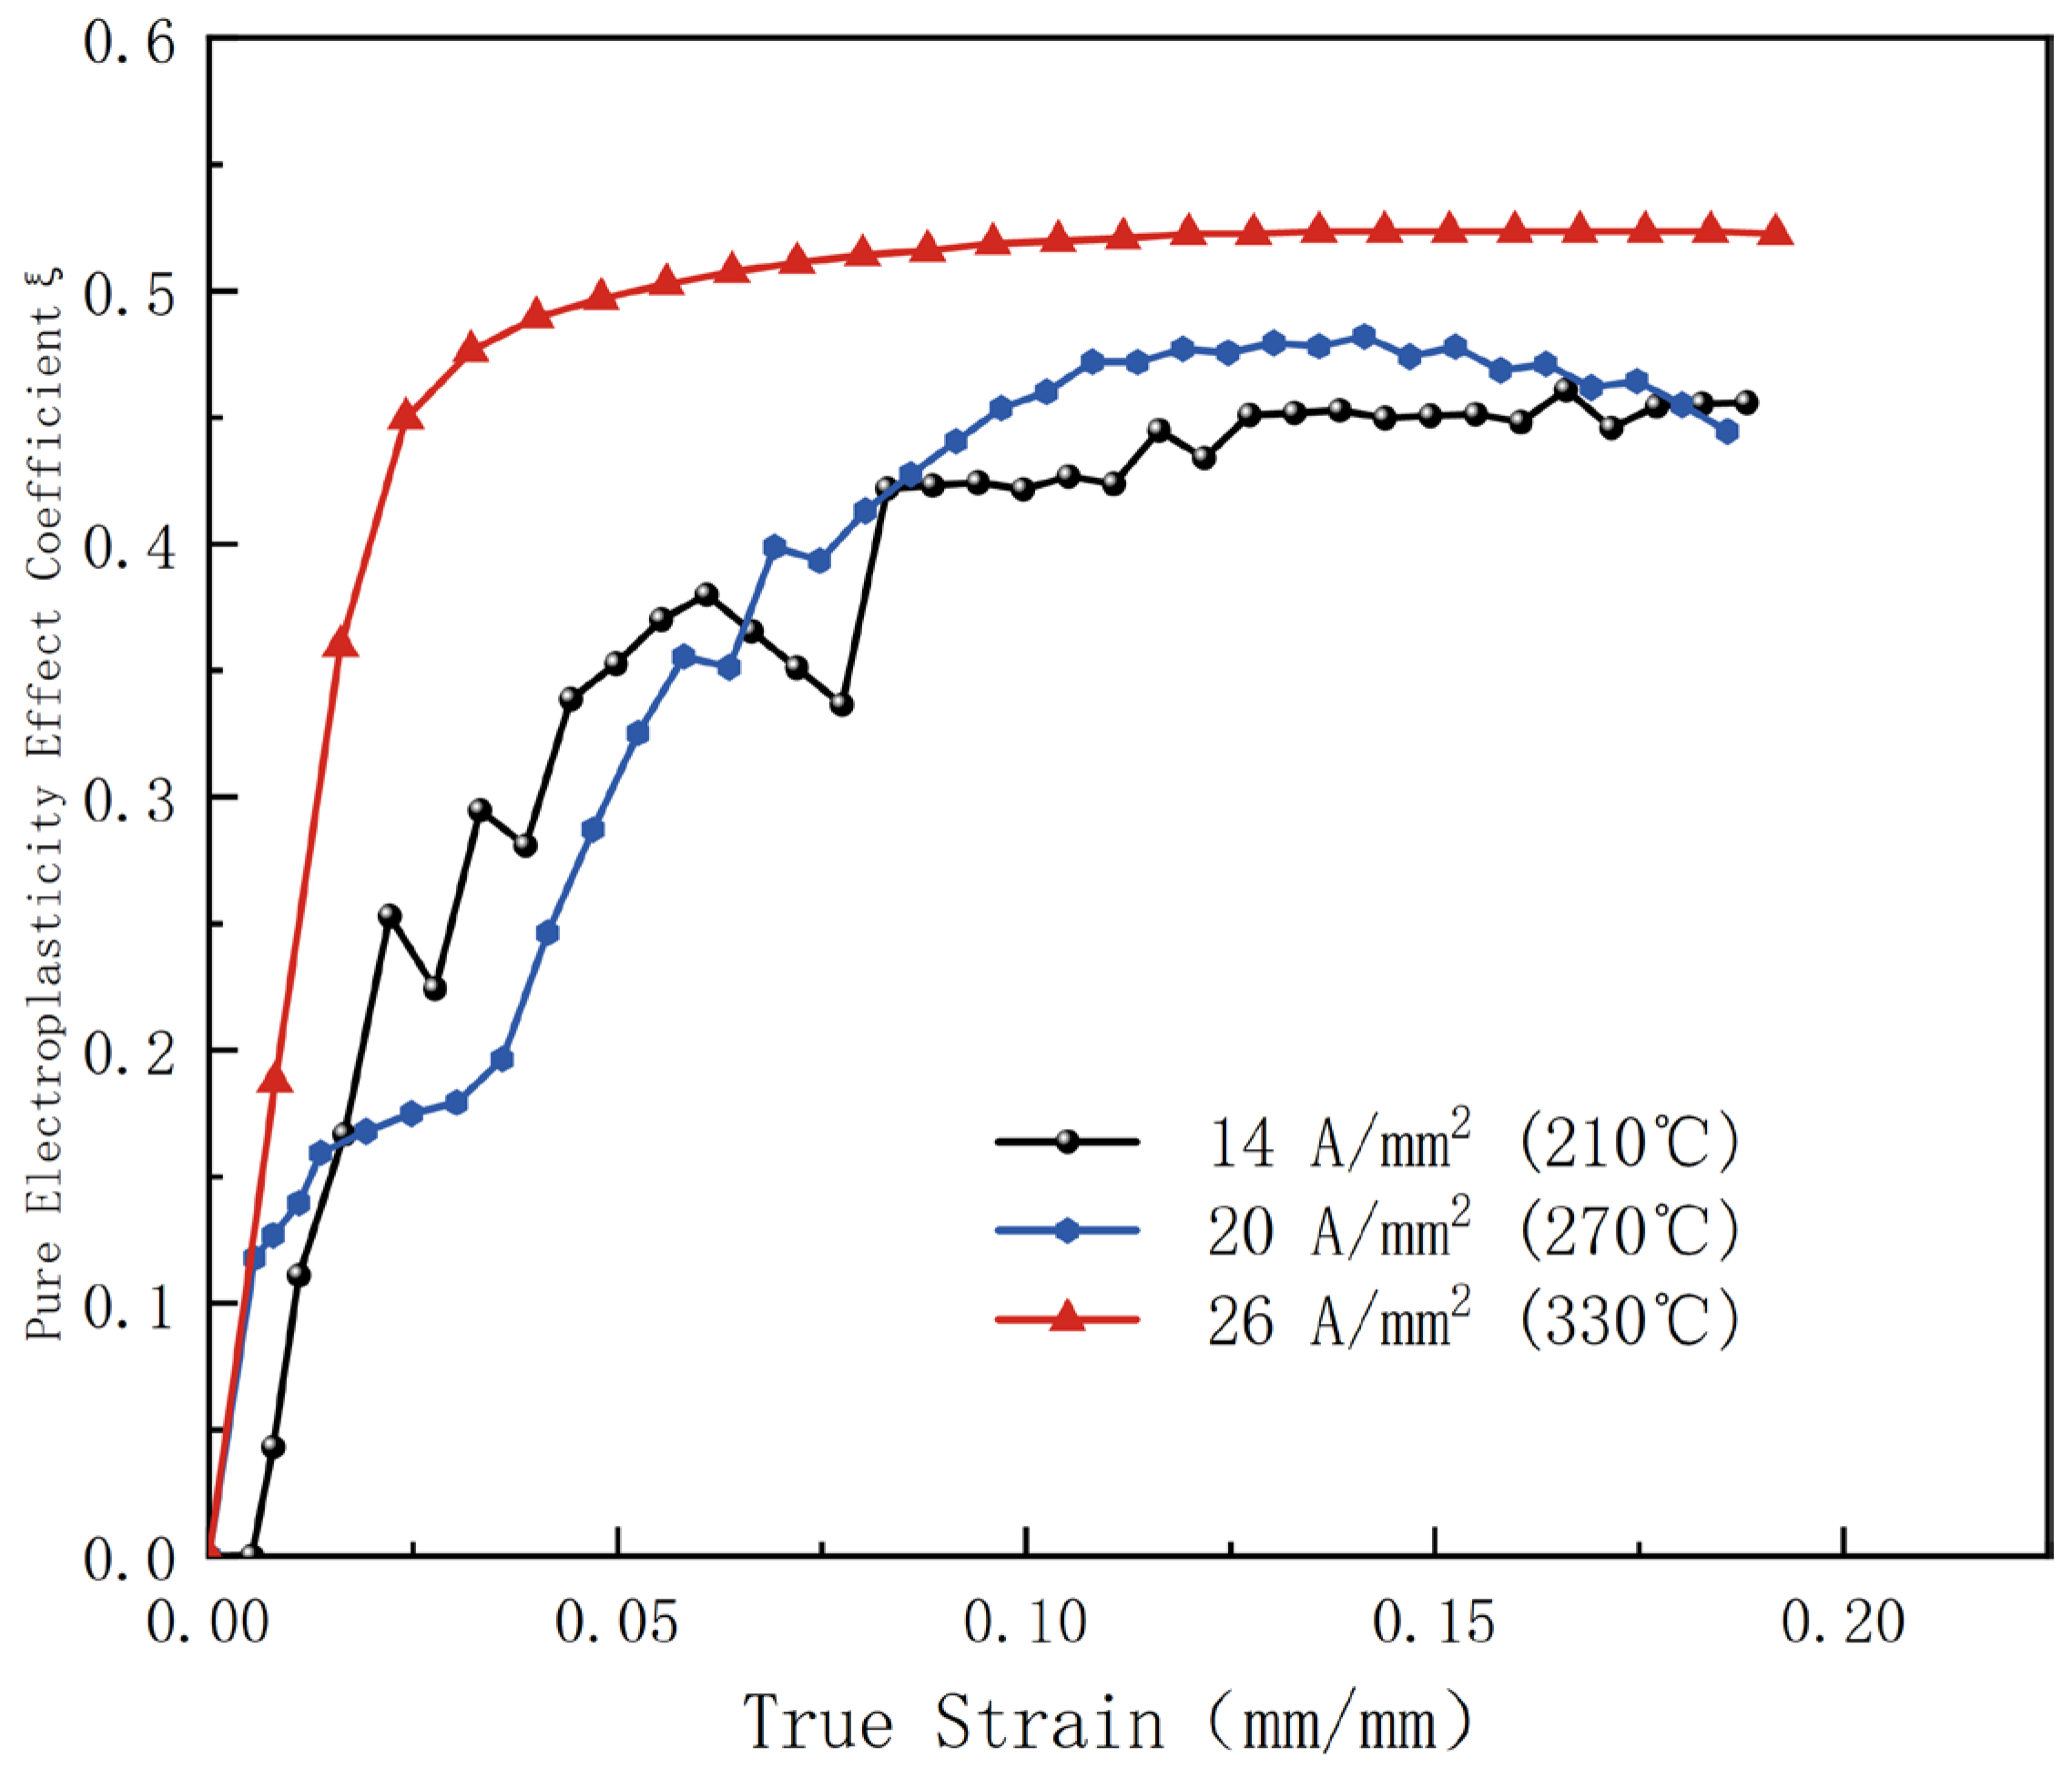
Figure 8.
Temperature rise curves at different current densities.
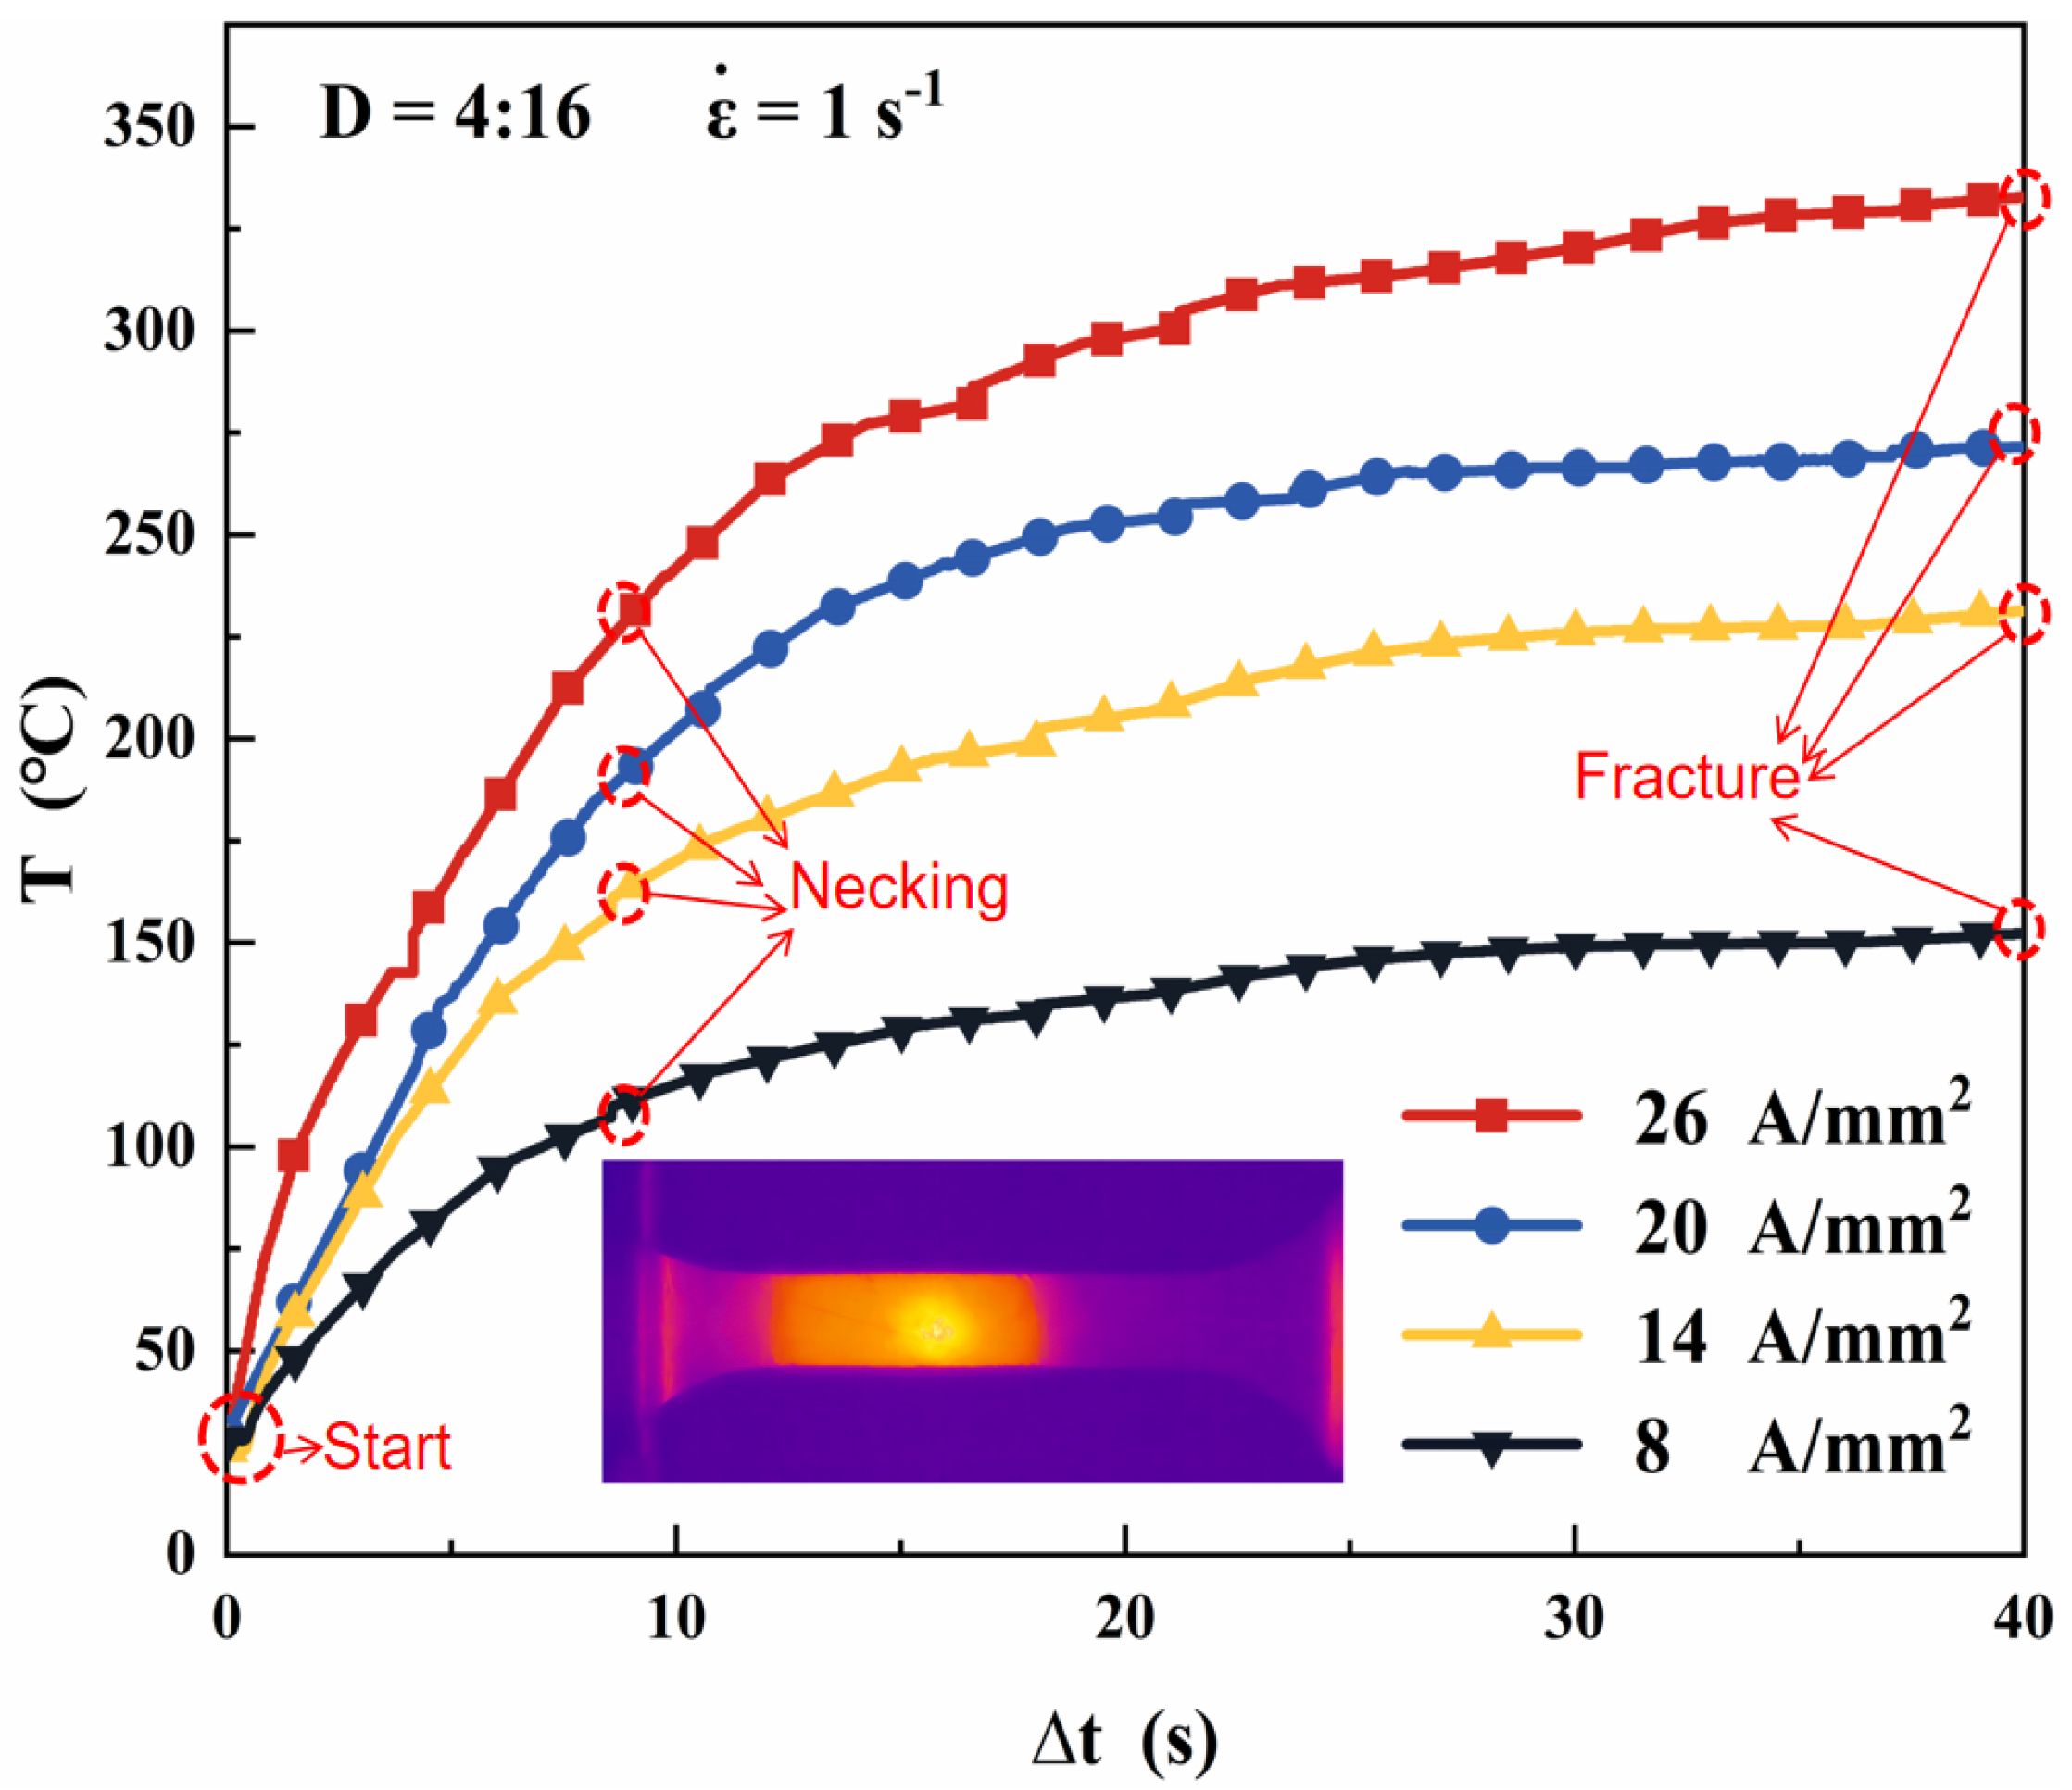
Figure 9.
Relationship curves under different power-on timesJe−(T).
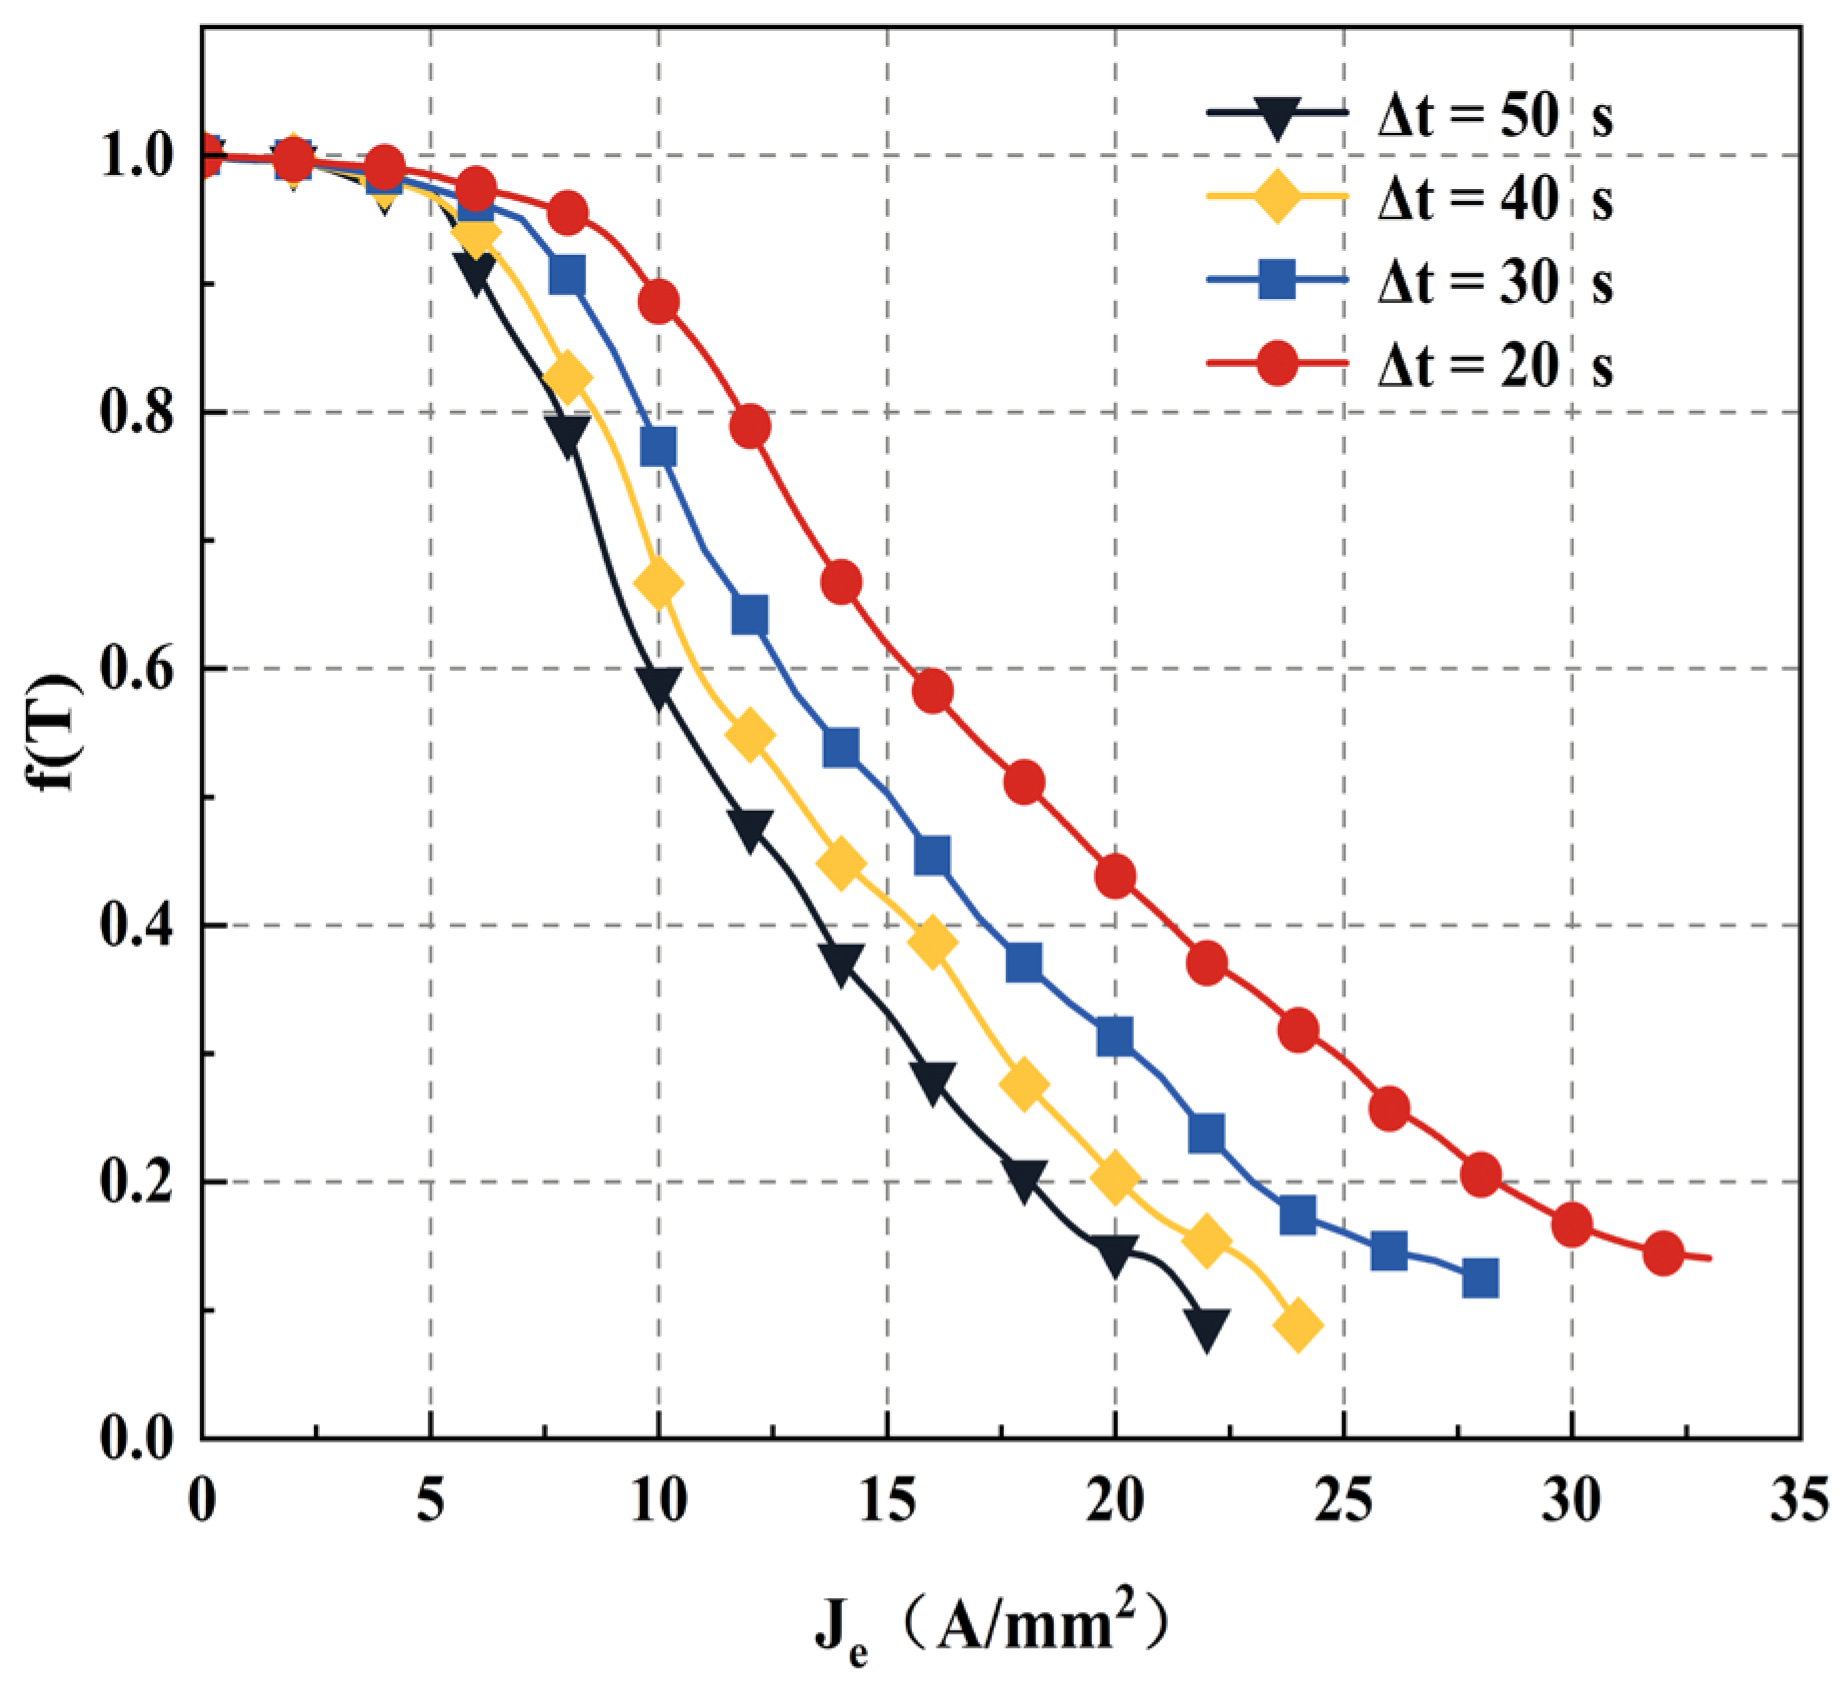
Figure 10.
Different power-on-times relationship curves of
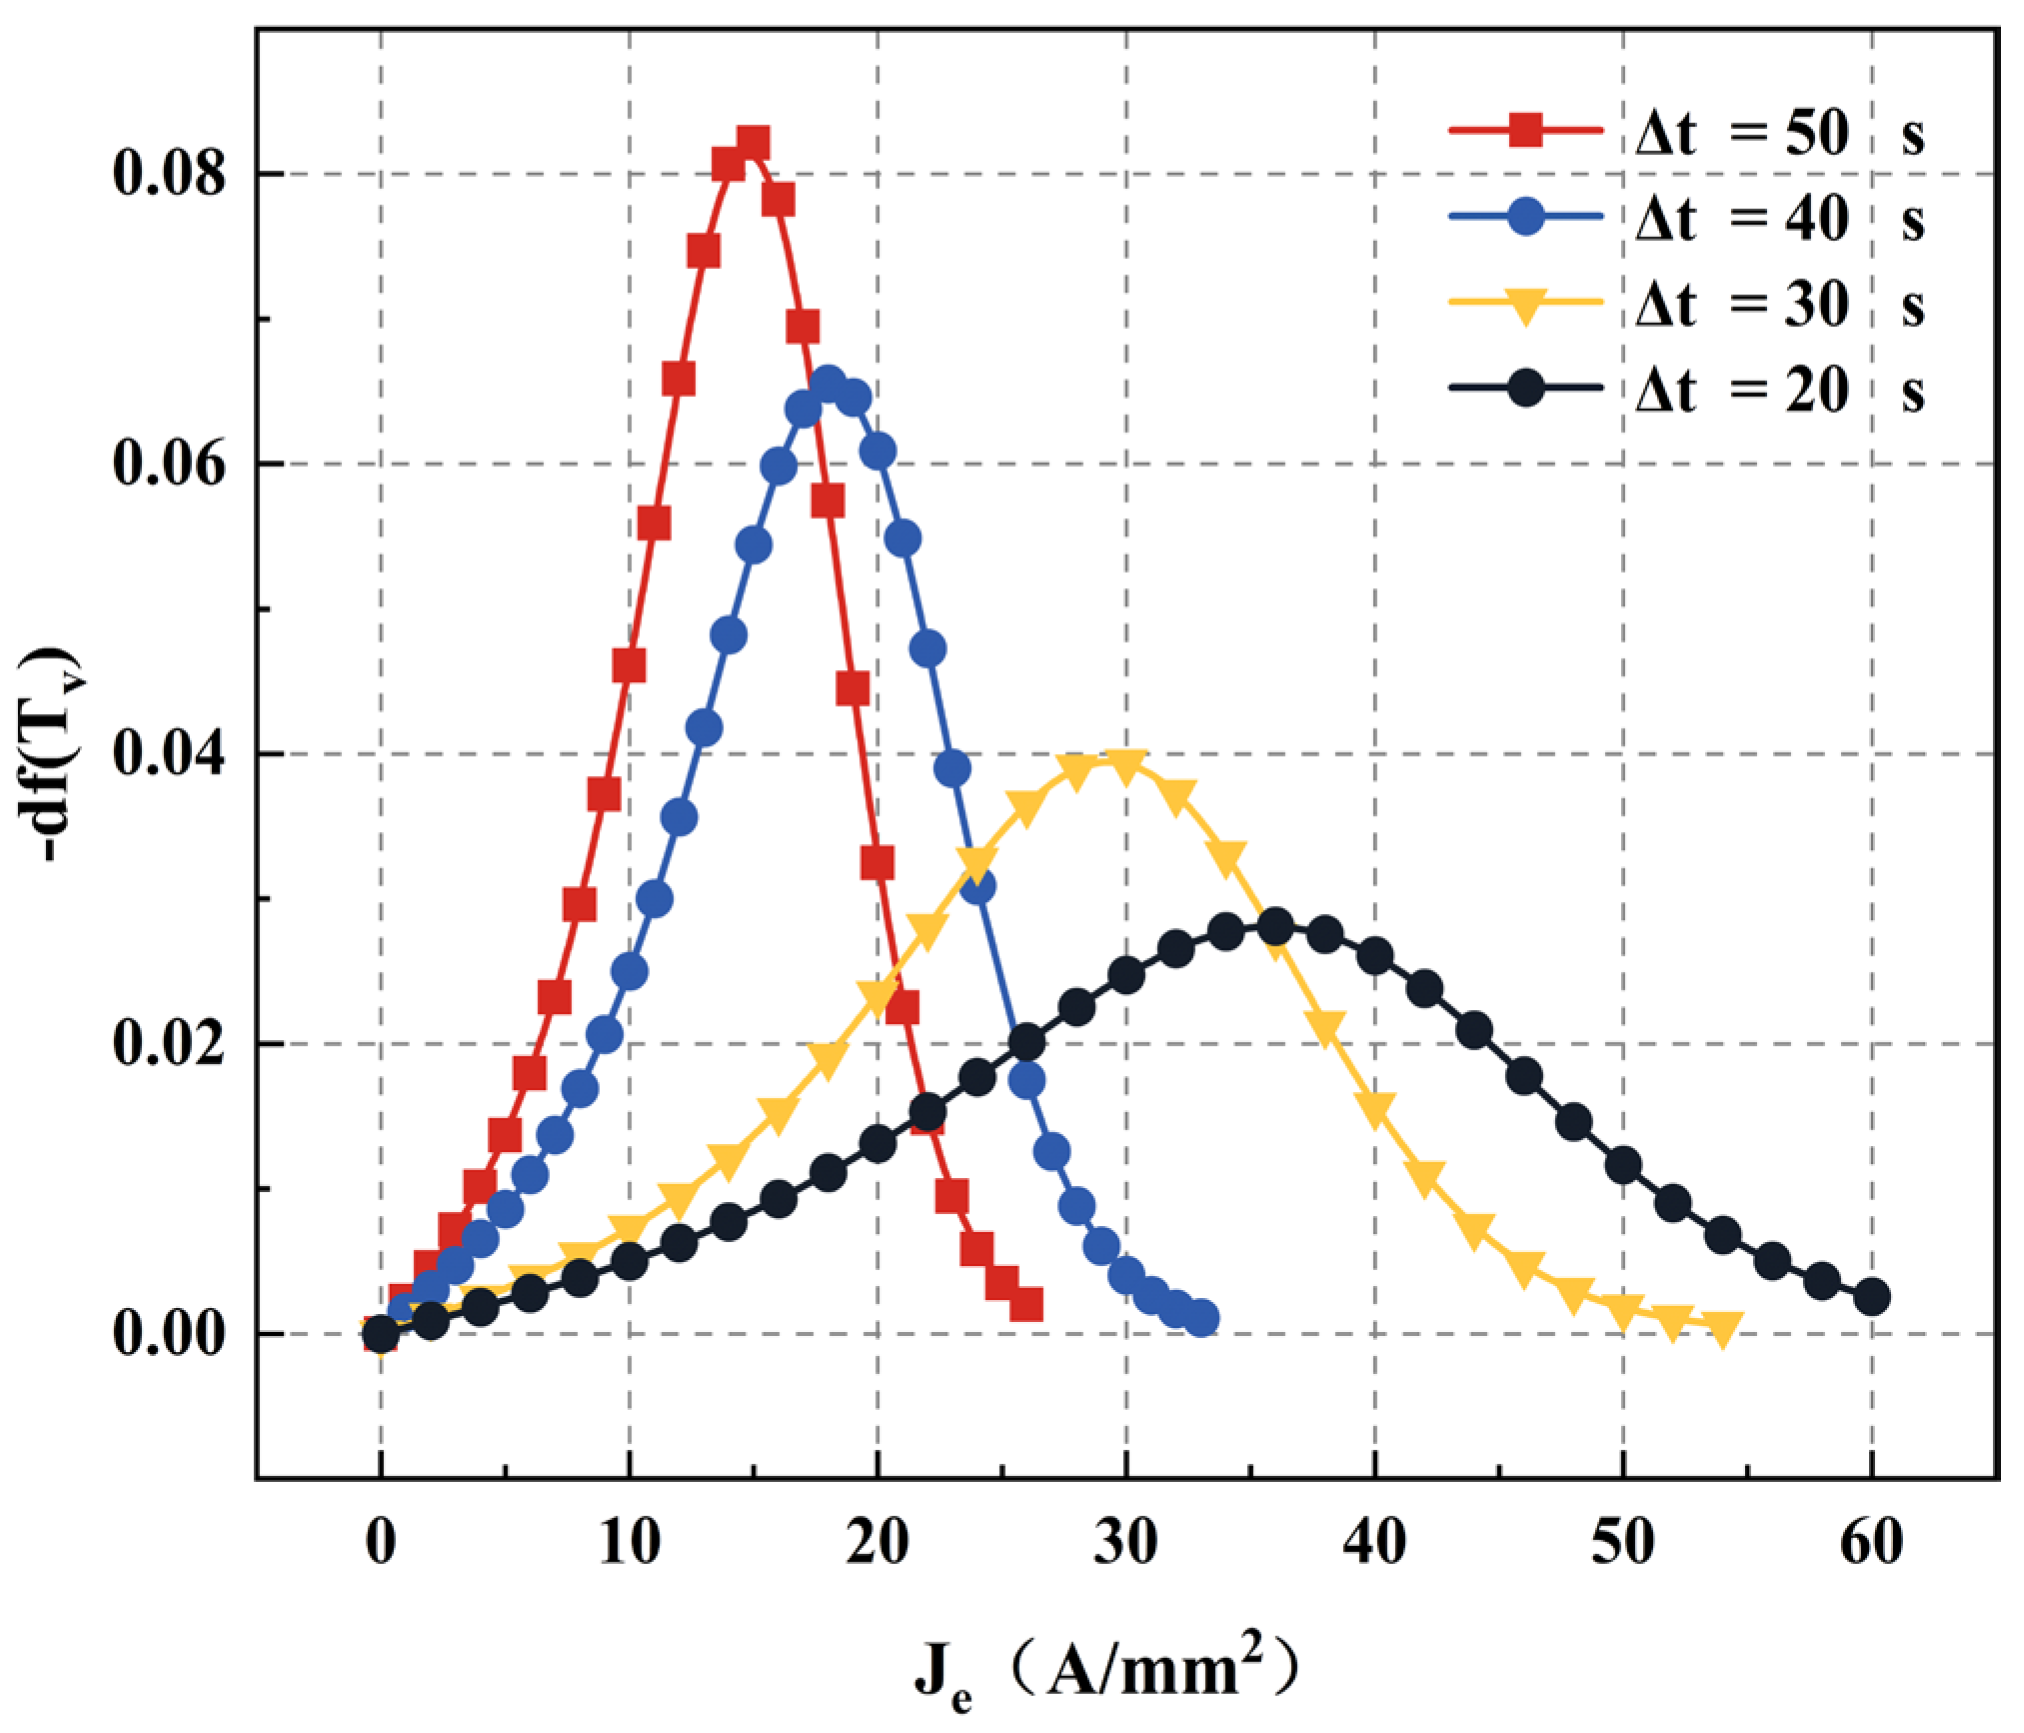
Figure 11.
Room temperature stress-strain curve and fitting with 0.001
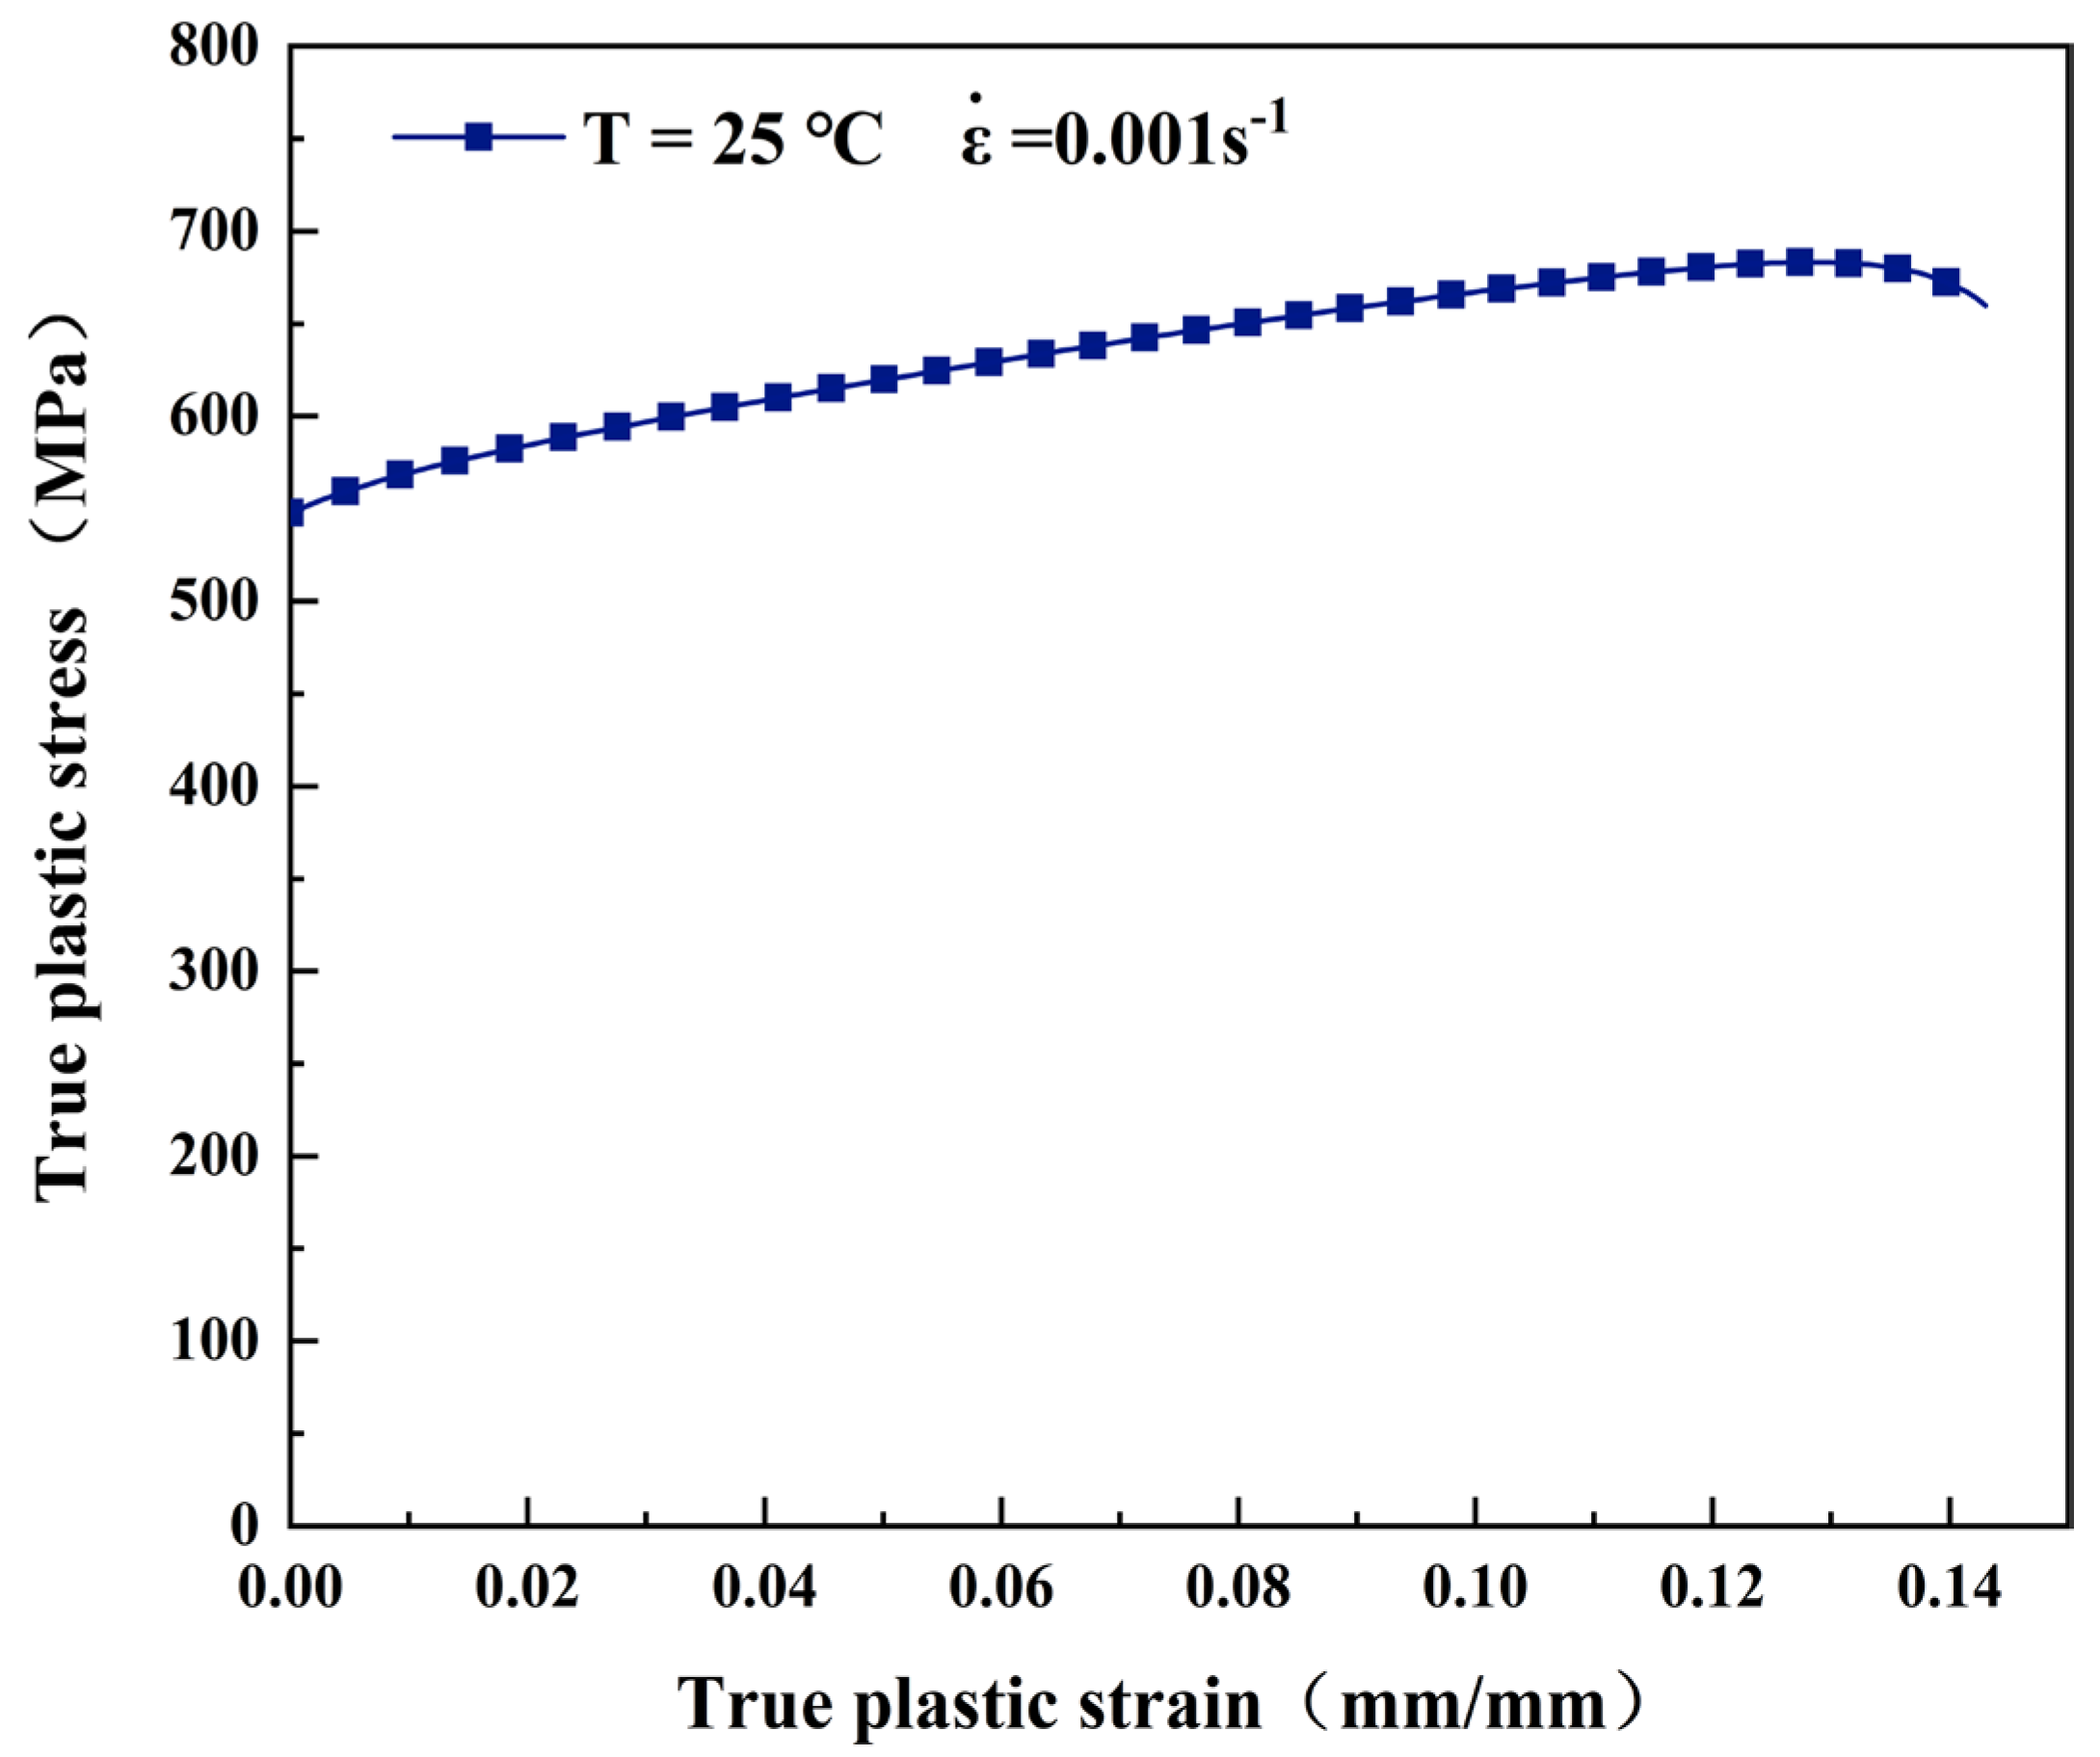
Figure 12.
Relationship between and (3) Determination of strain rate parameters
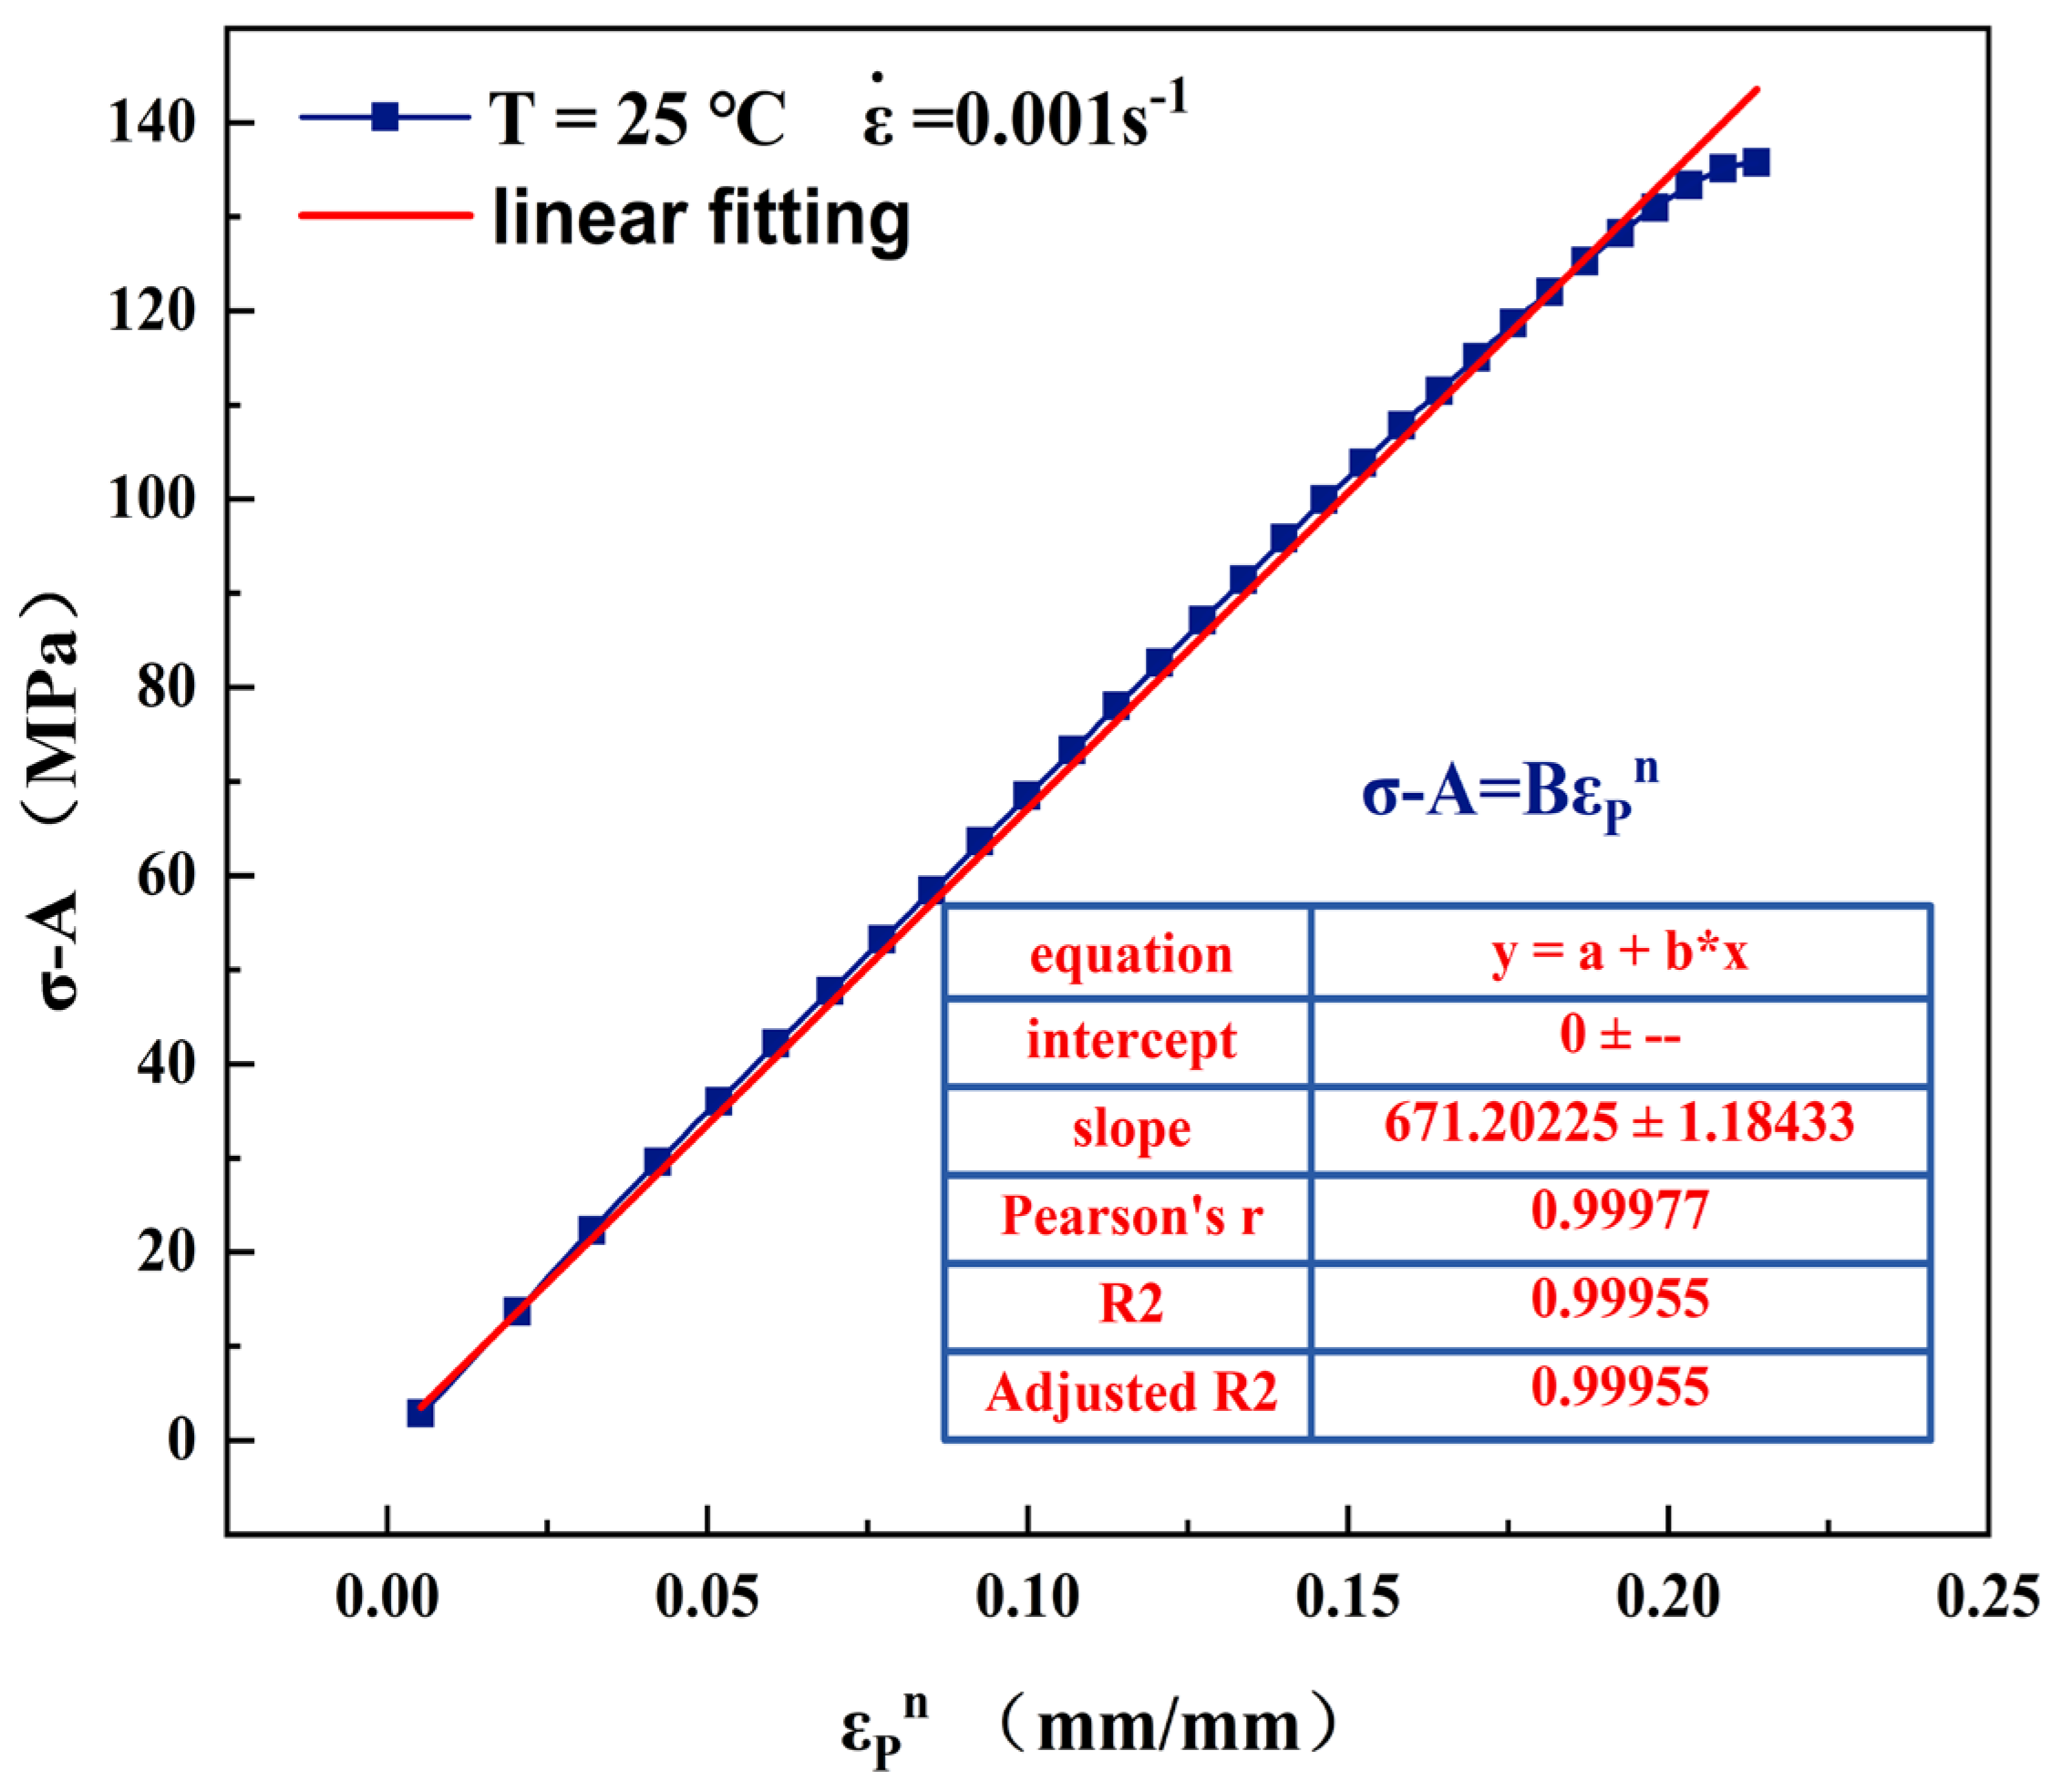
Figure 13.
Fitting curve.
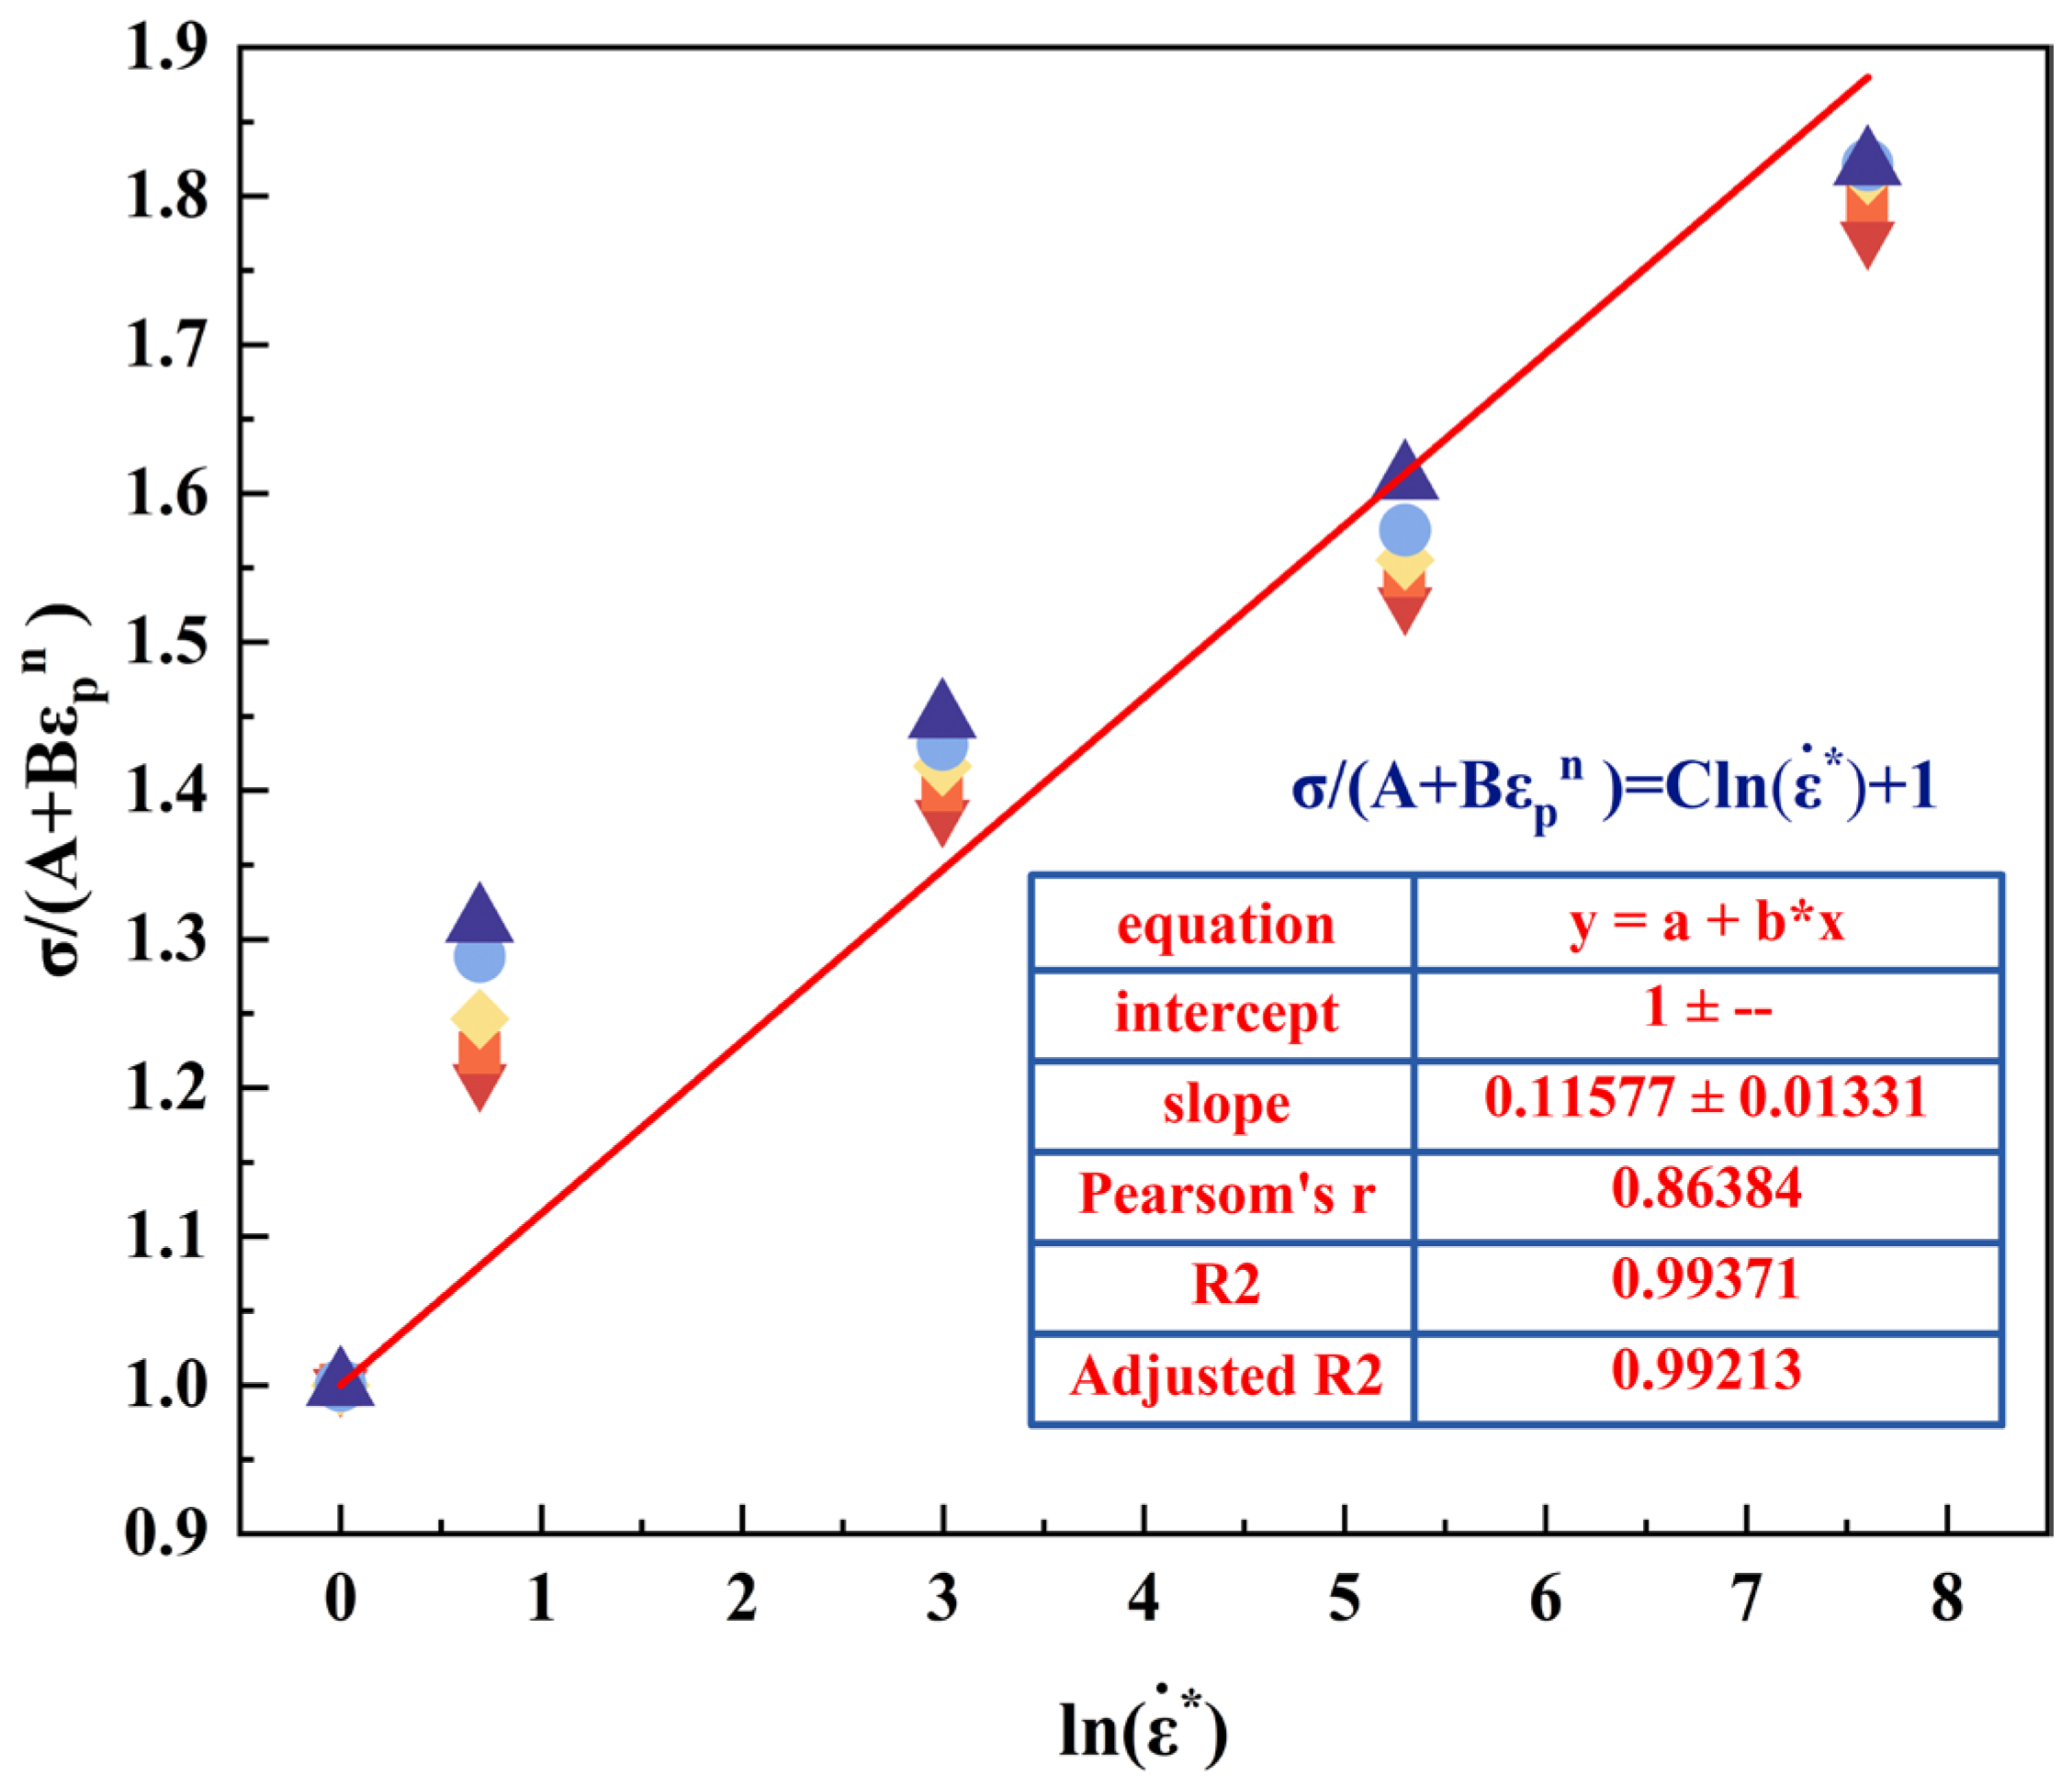
Figure 14.
Current density distribution of tensile specimens under pulsed currents (a) 8 A/mm2 (b) 14 A/mm2 (c) 20 A/mm2 (d) 26 A/mm2.
Figure 14.
Current density distribution of tensile specimens under pulsed currents (a) 8 A/mm2 (b) 14 A/mm2 (c) 20 A/mm2 (d) 26 A/mm2.
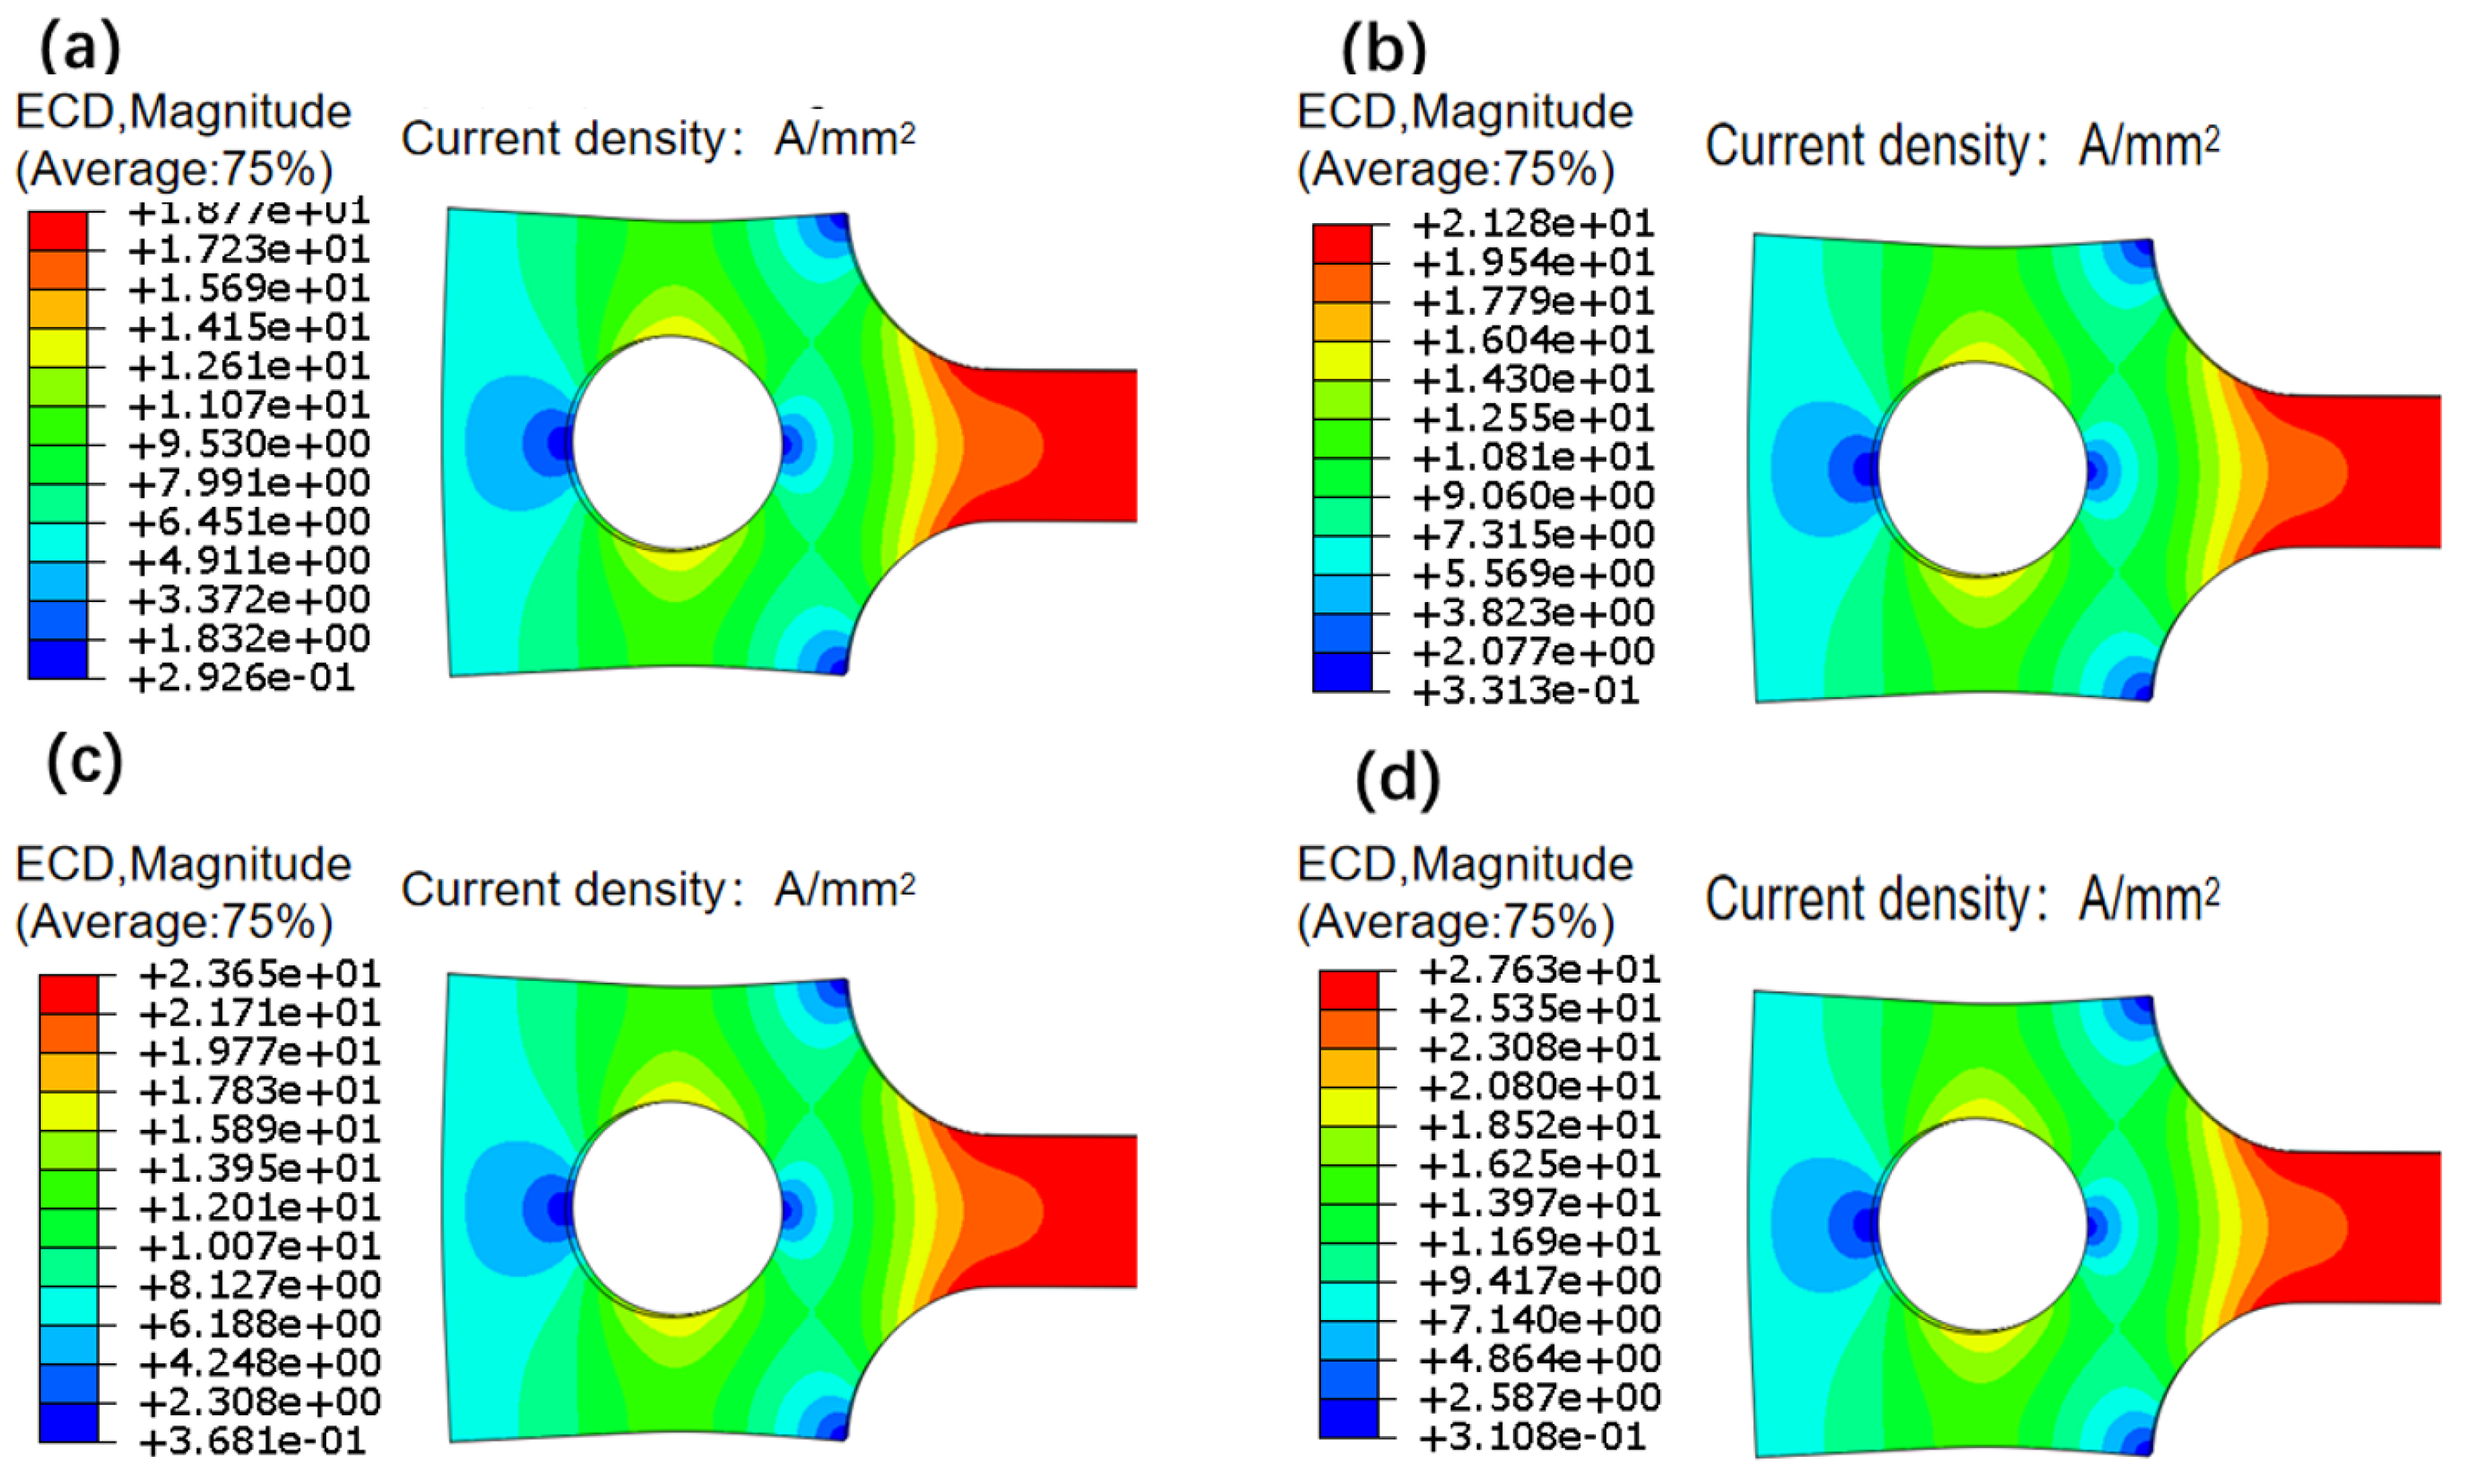
Figure 15.
Temperature distribution in the centre axis of specimens with different current densities.
Figure 15.
Temperature distribution in the centre axis of specimens with different current densities.
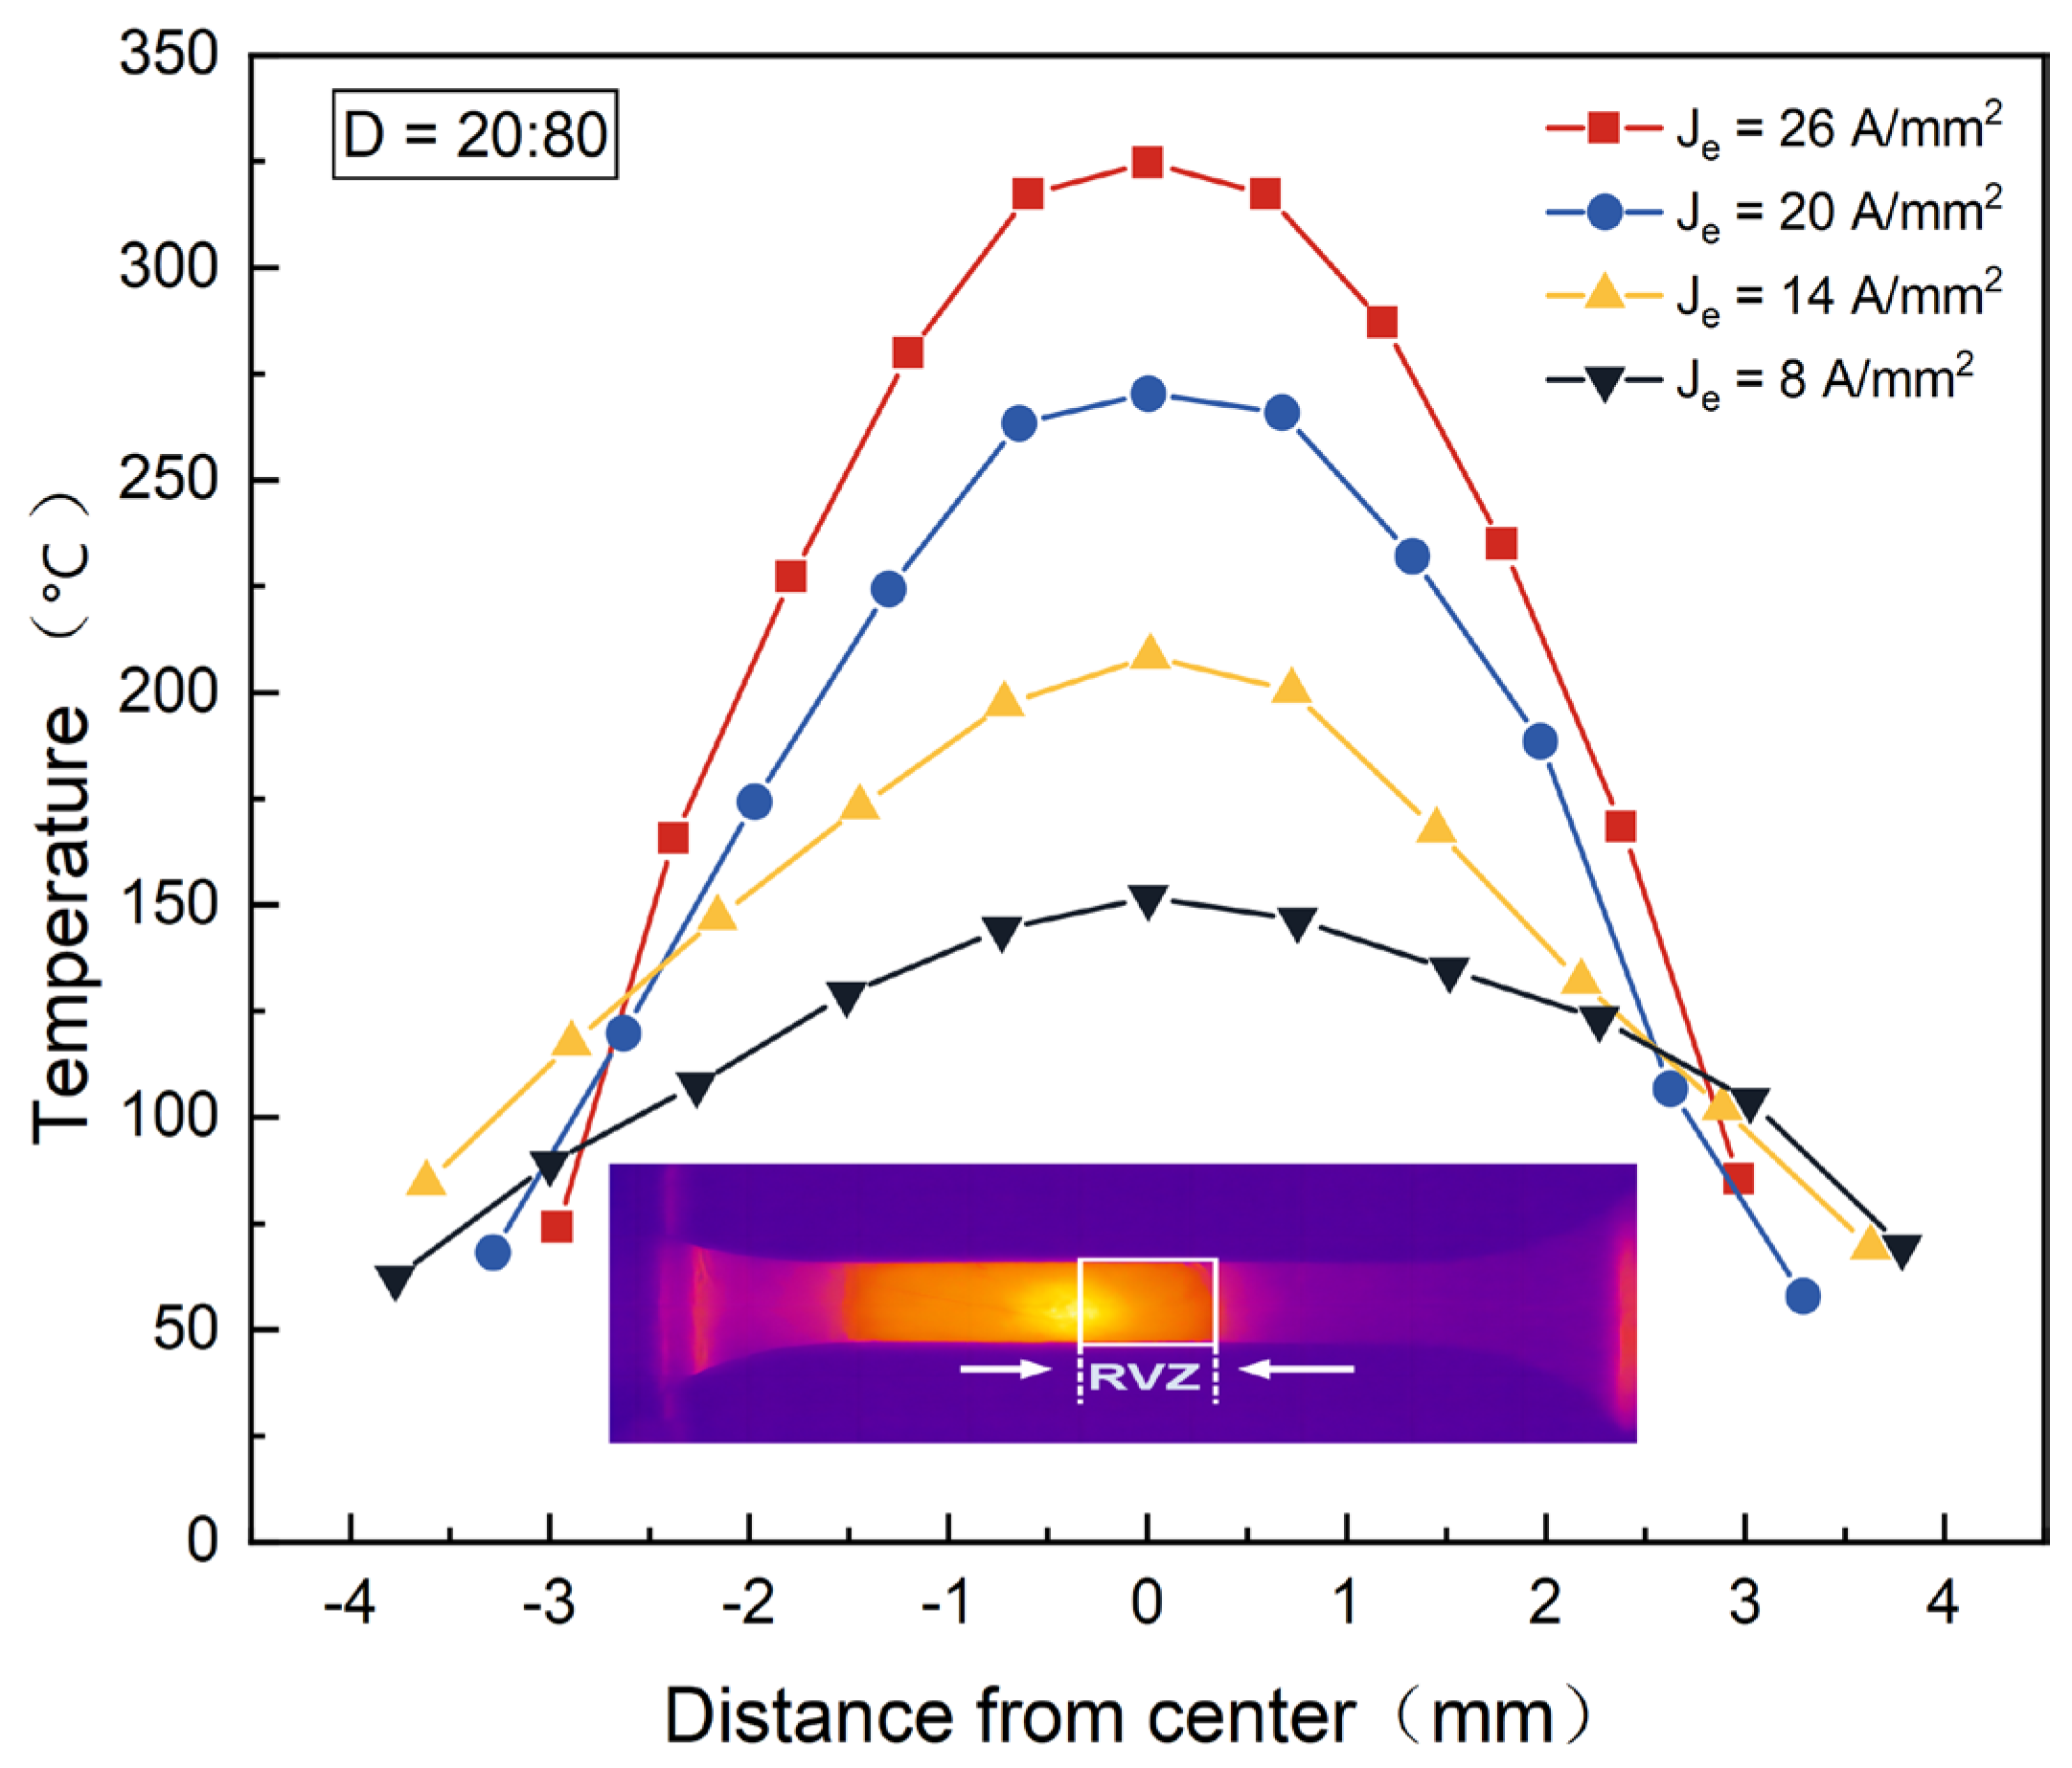
Figure 16.
Distribution of stress-strain field at different current densities in the center of the sample (a) Stress field distribution (b) Strain field distribution.
Figure 16.
Distribution of stress-strain field at different current densities in the center of the sample (a) Stress field distribution (b) Strain field distribution.
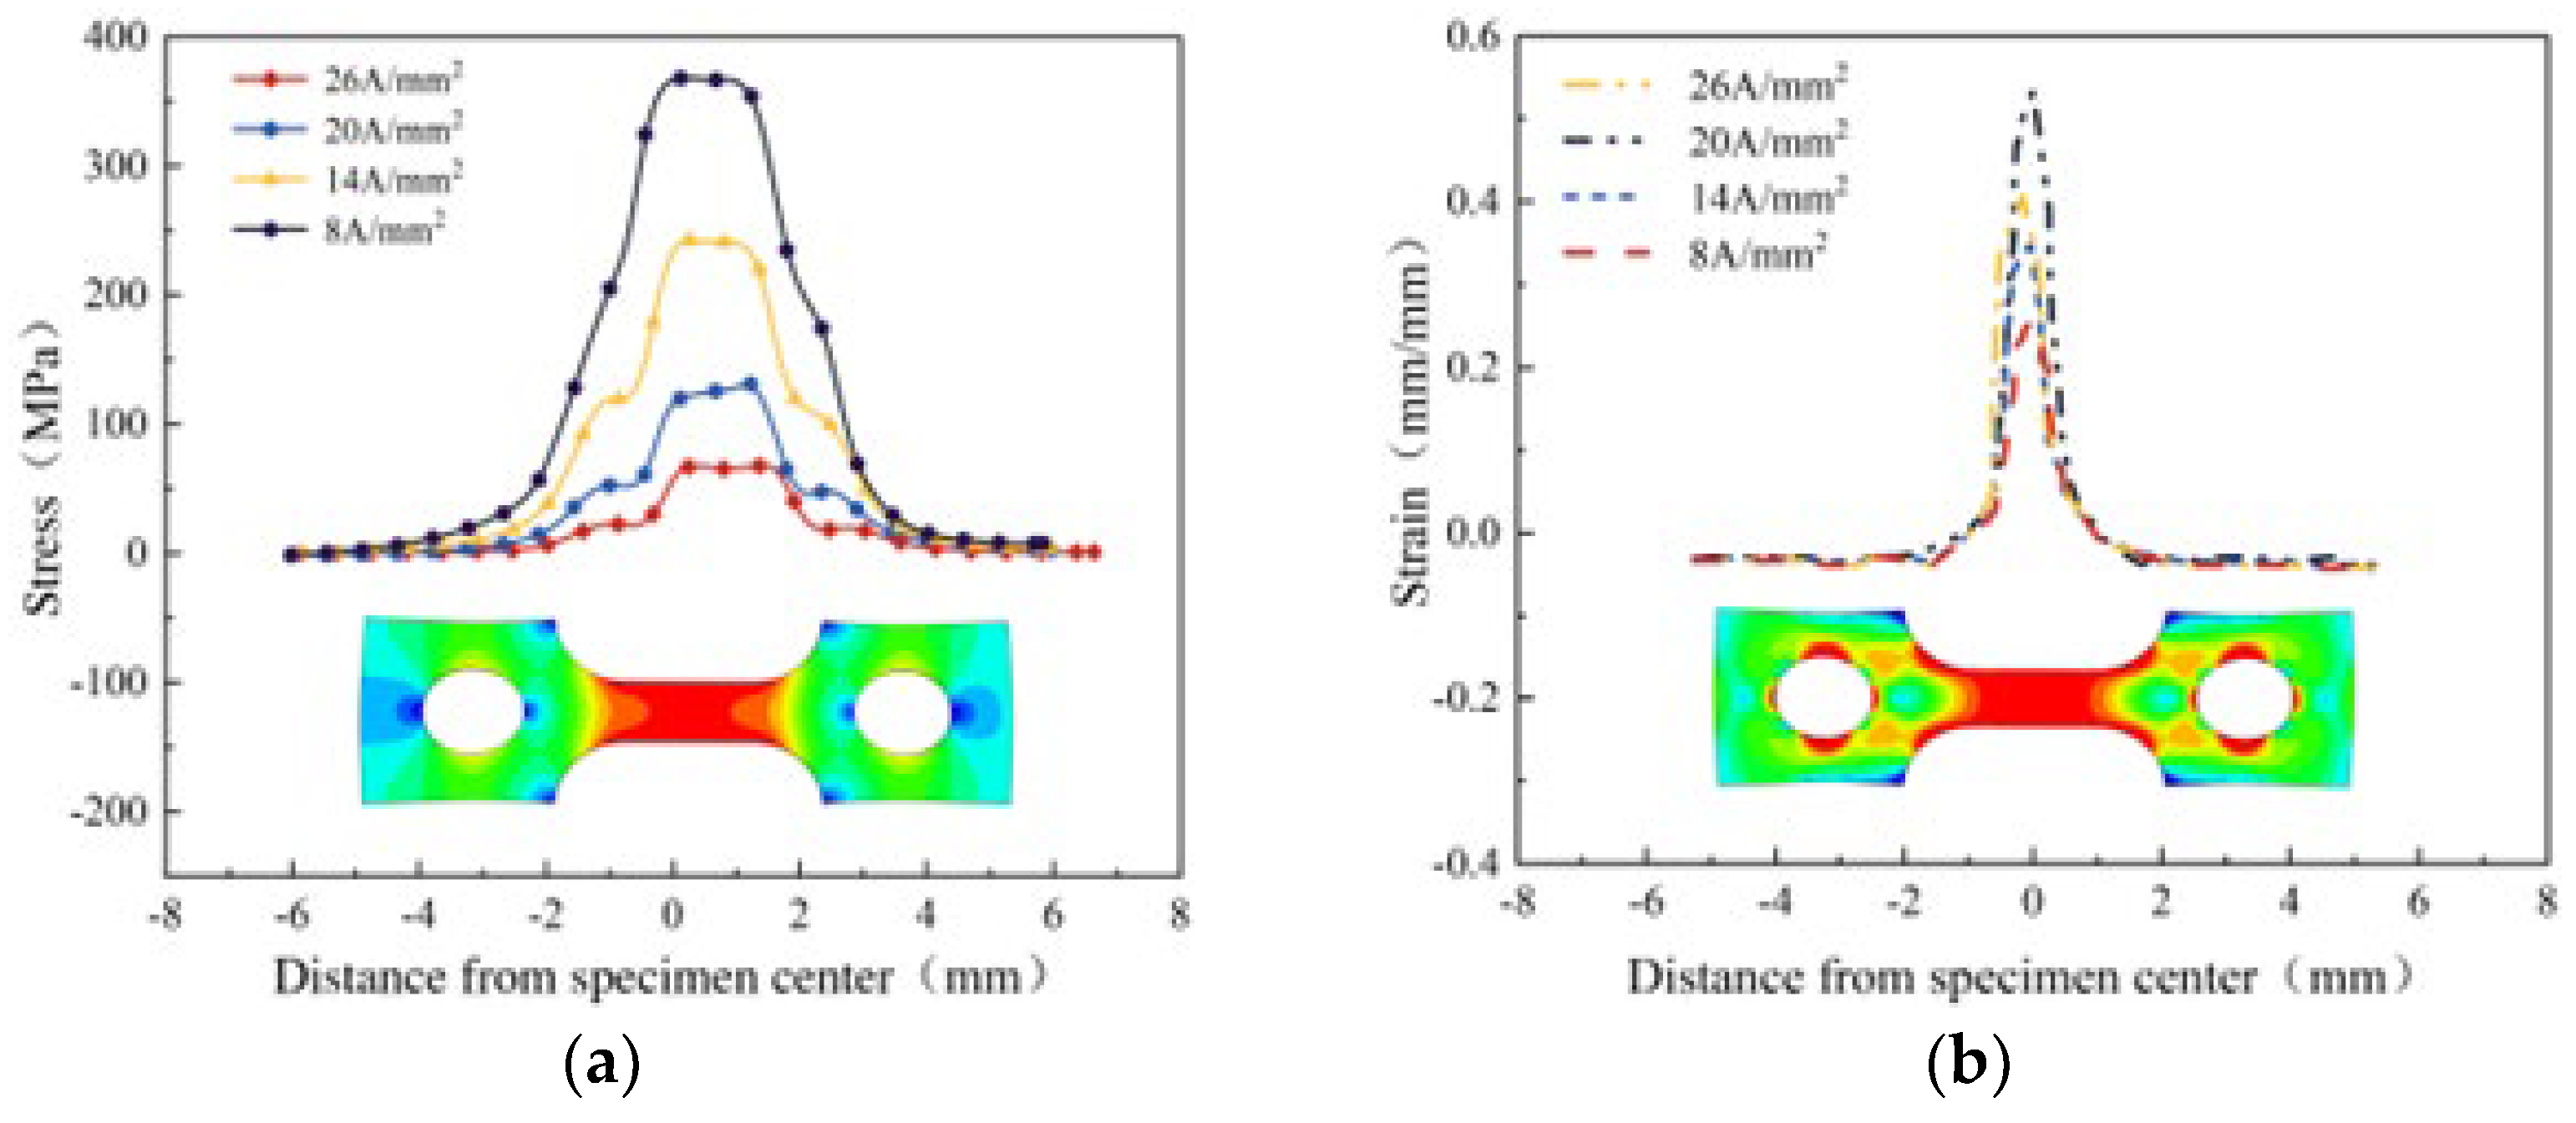
Figure 17.
Validation curve fitting at different rates (a) (b) 1 (c) 0.1 (d) 0.01.
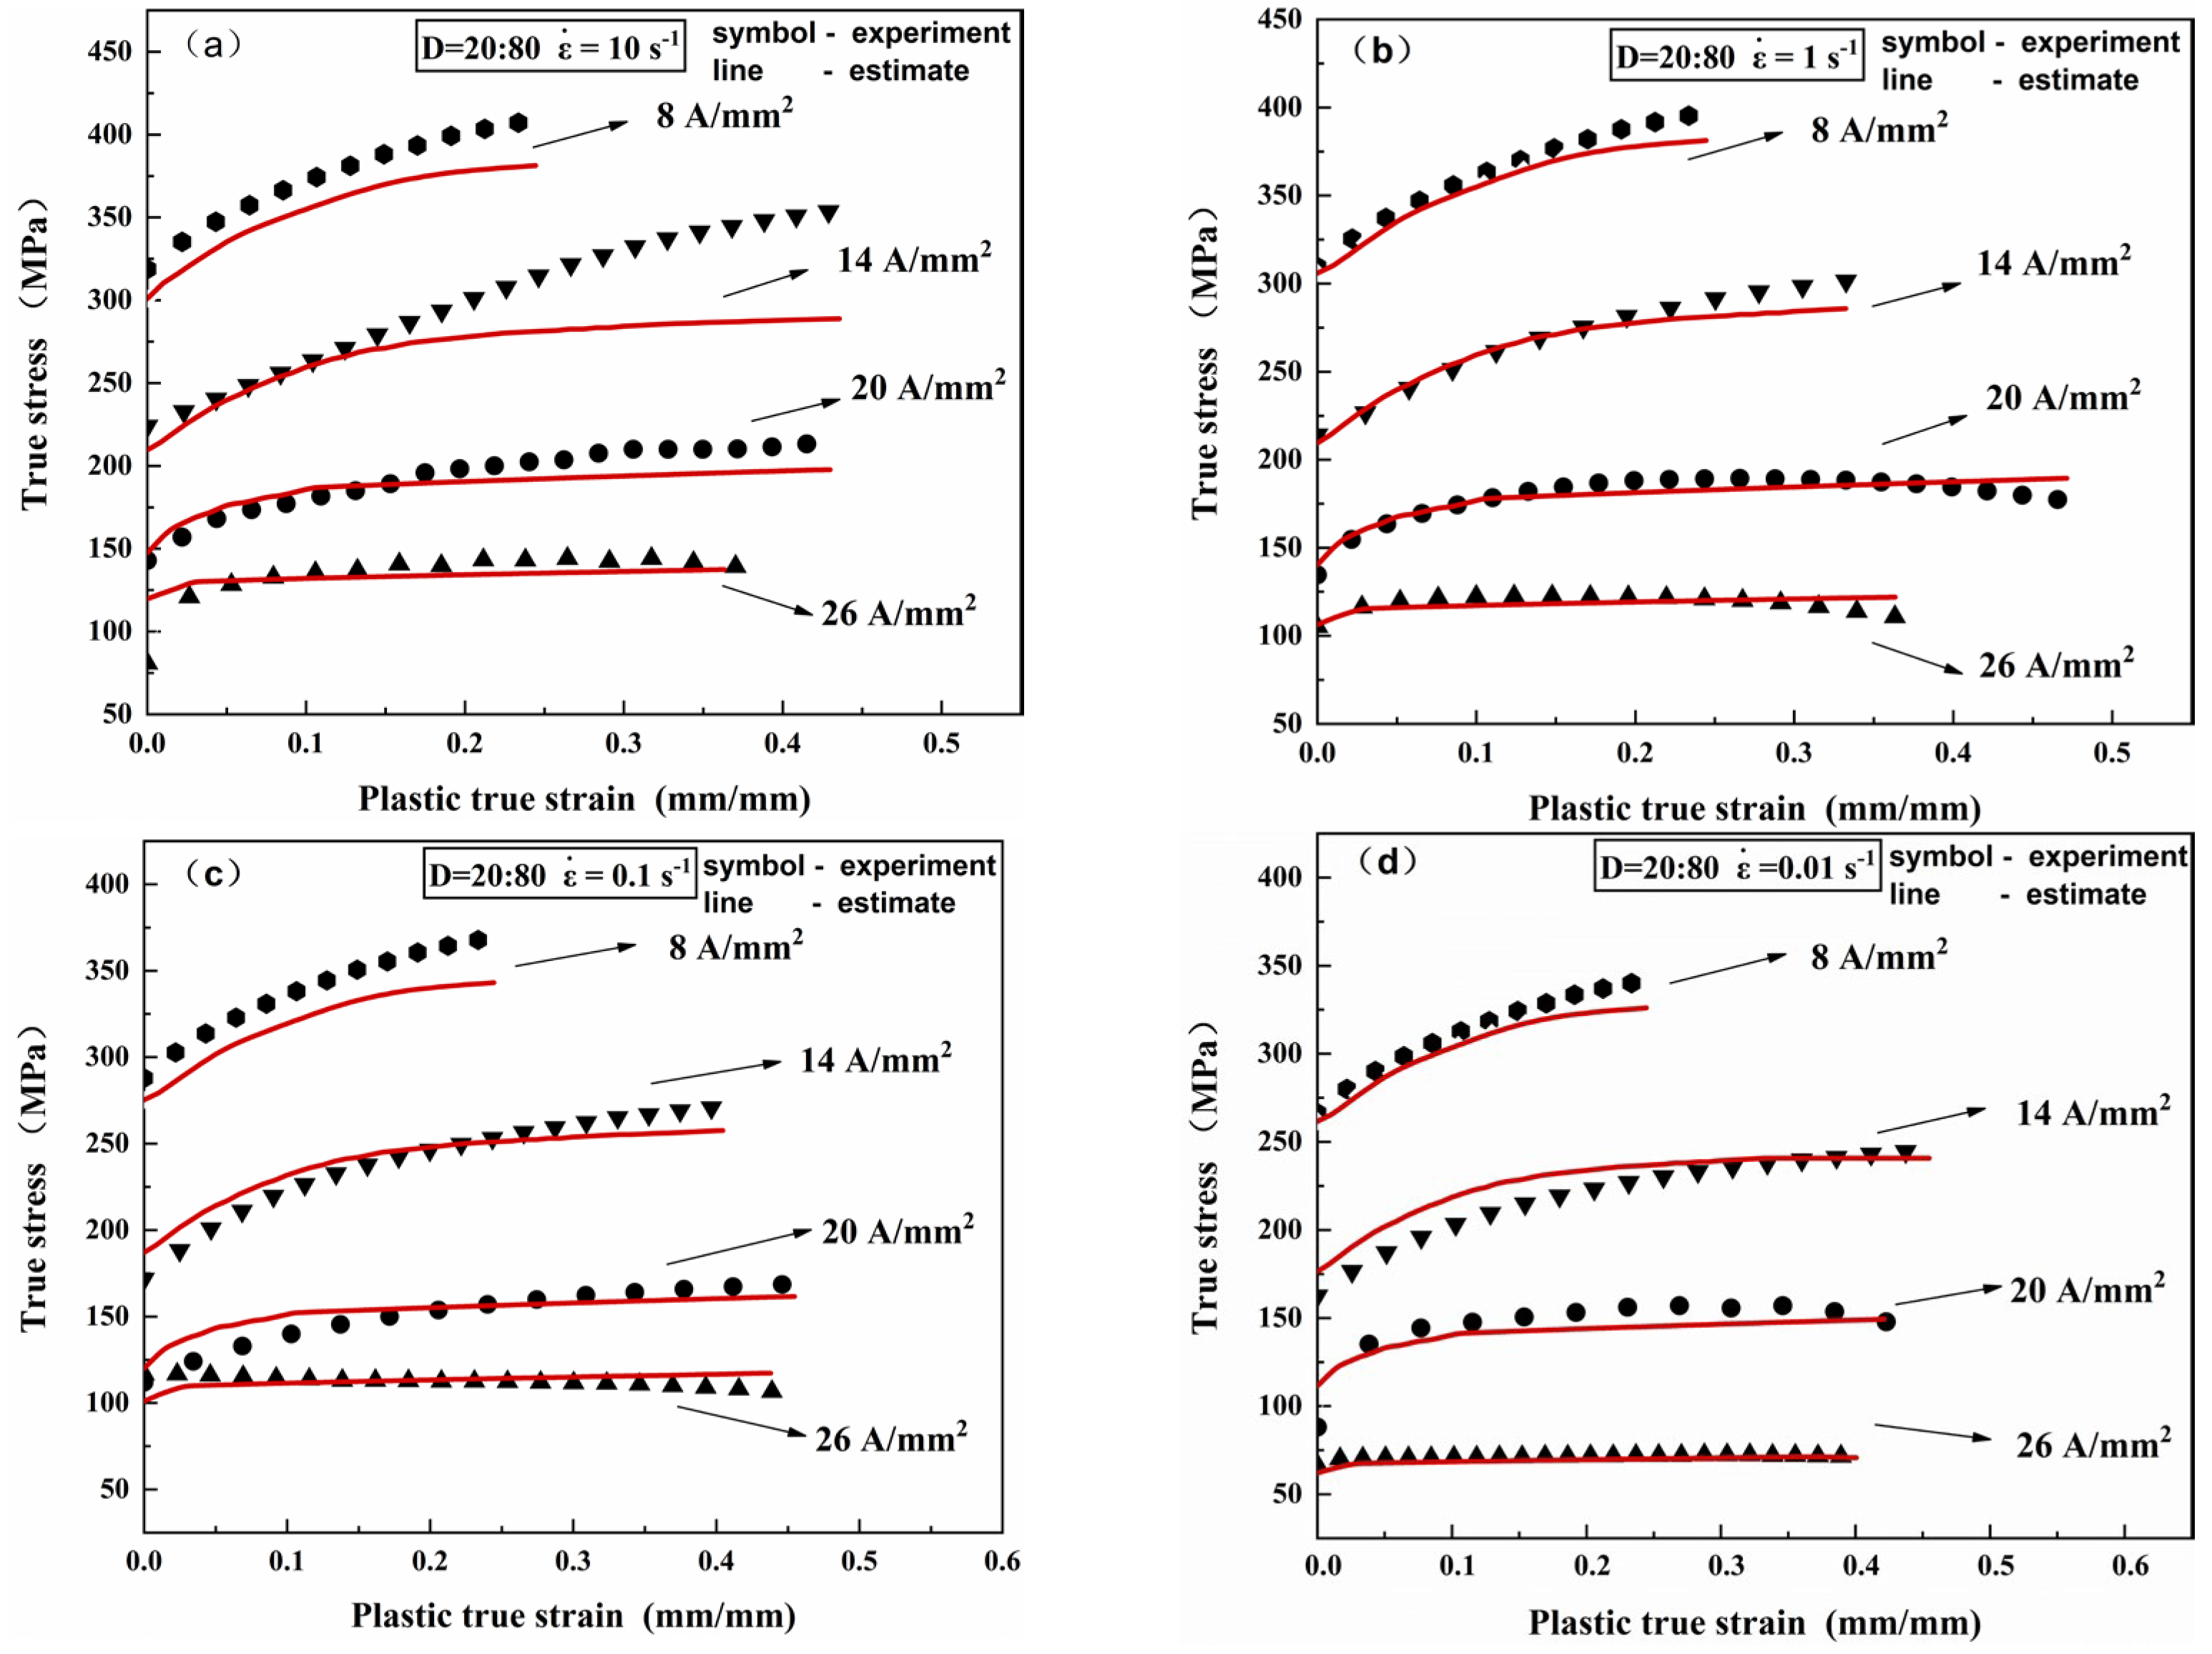
Figure 18.
Overall standardized statistical results and correlation between experimental stresses and predicted stresses at different strain rates (a) 10 (b) (c) (d) .
Figure 18.
Overall standardized statistical results and correlation between experimental stresses and predicted stresses at different strain rates (a) 10 (b) (c) (d) .
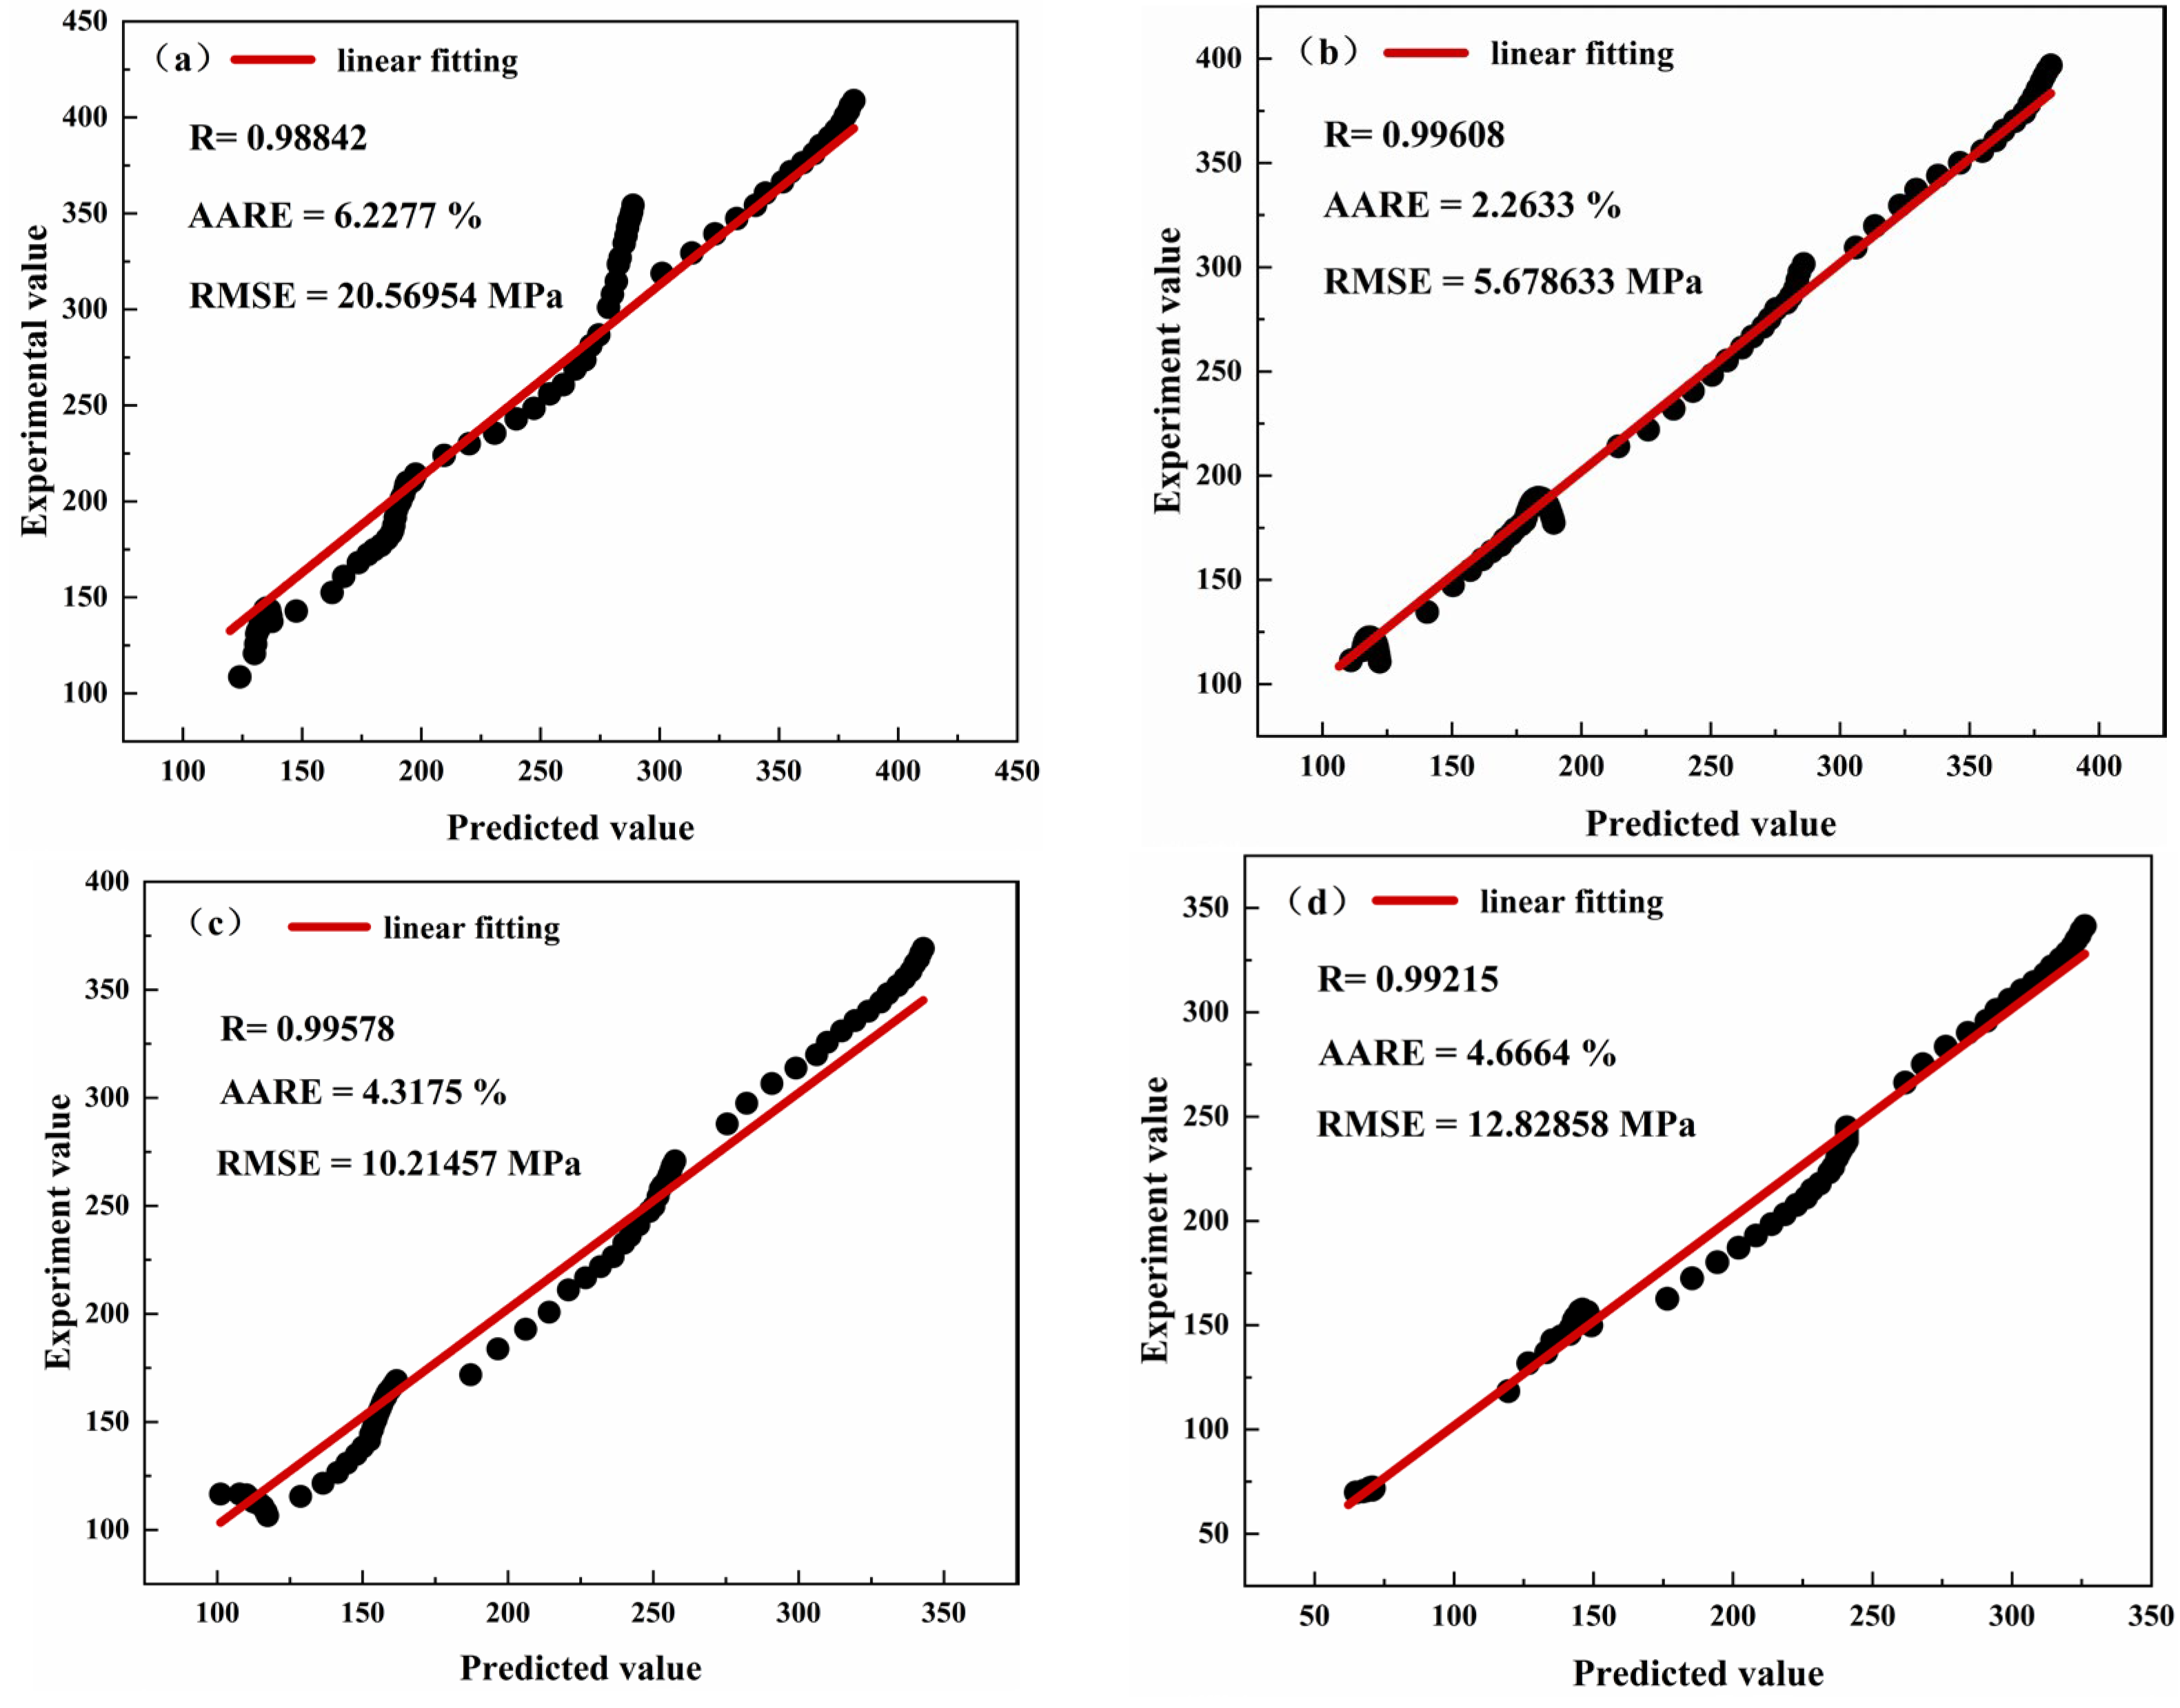
Figure 19.
Three-point bending test platform Stress-strain curves with different current densities.
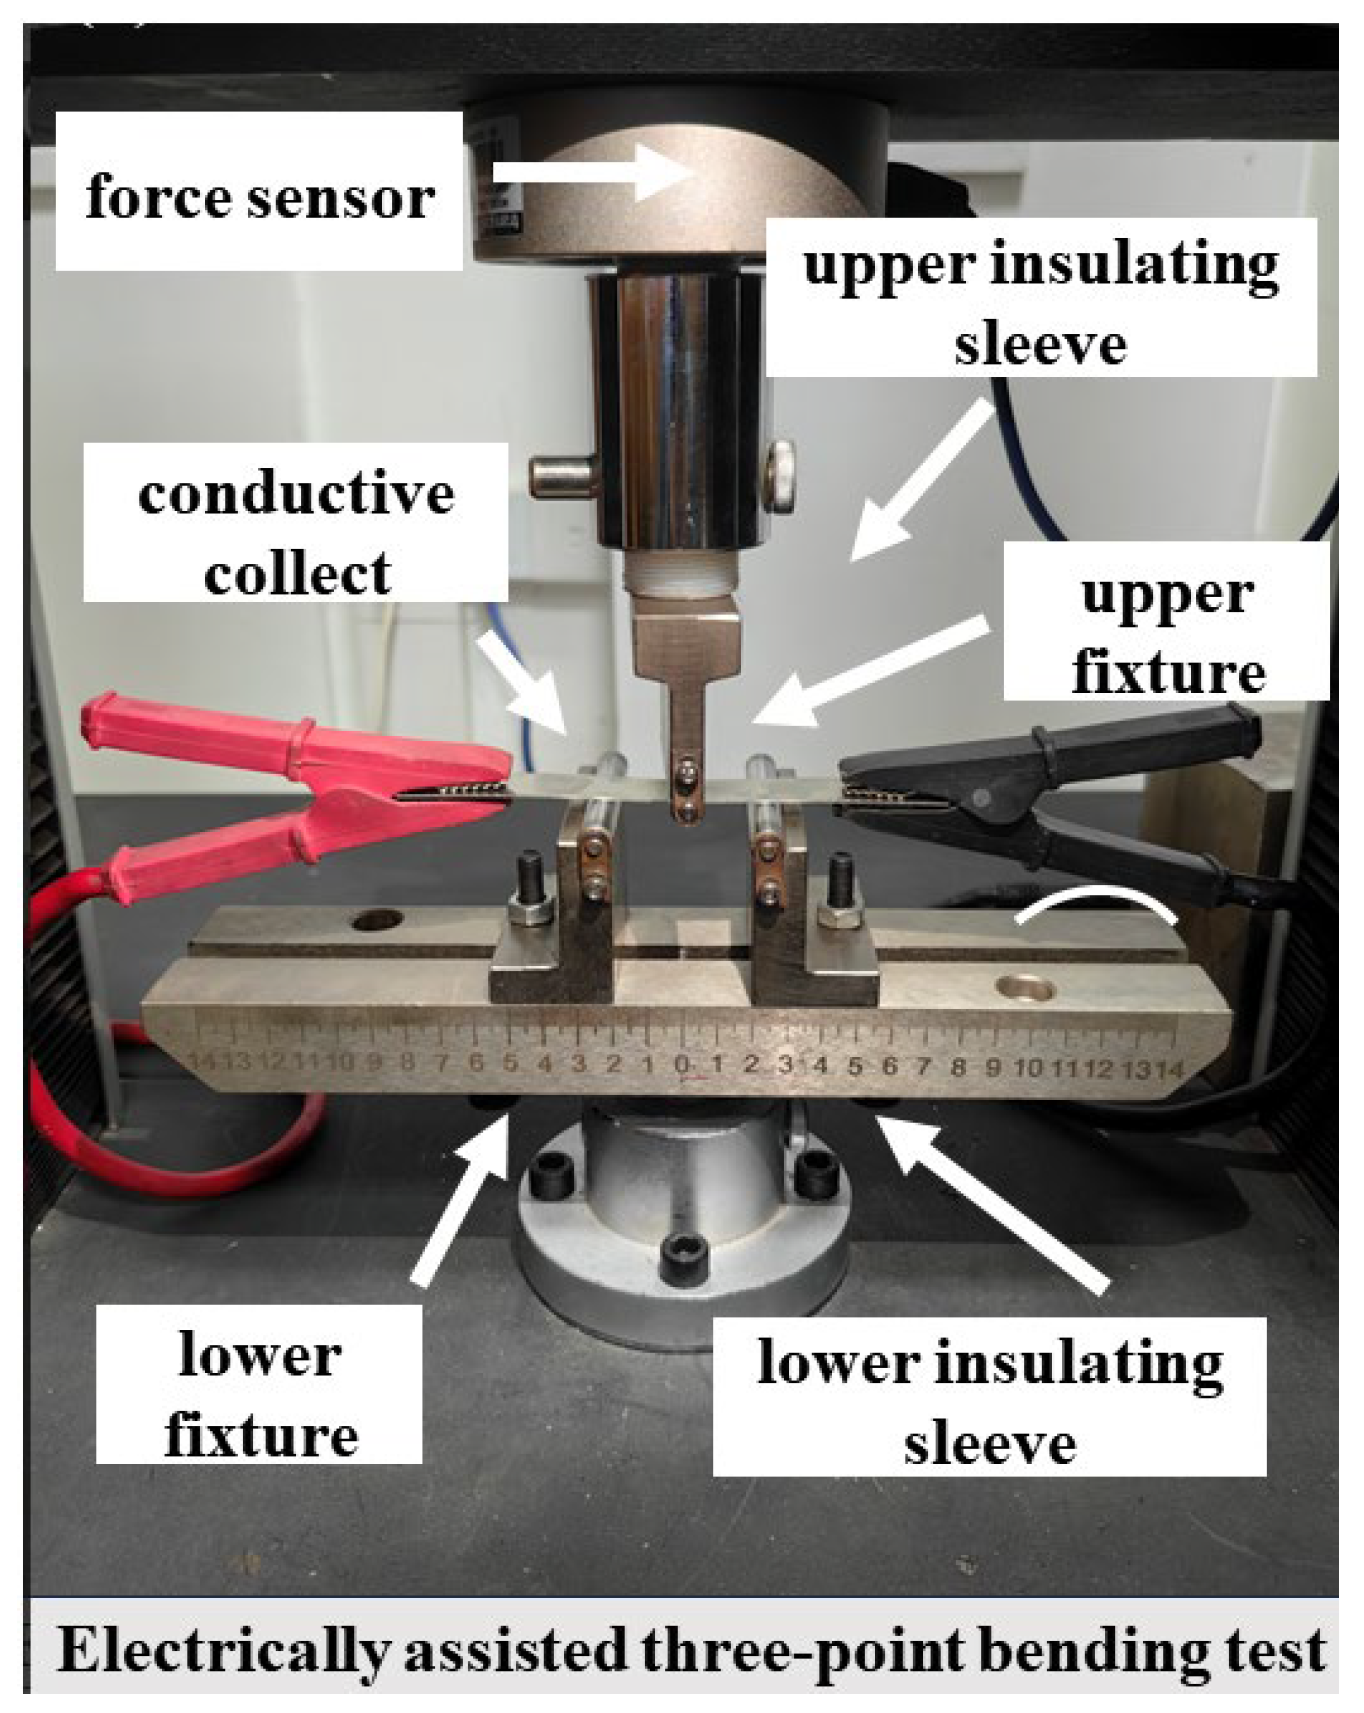
Figure 20.
Stress-strain at different current densities.
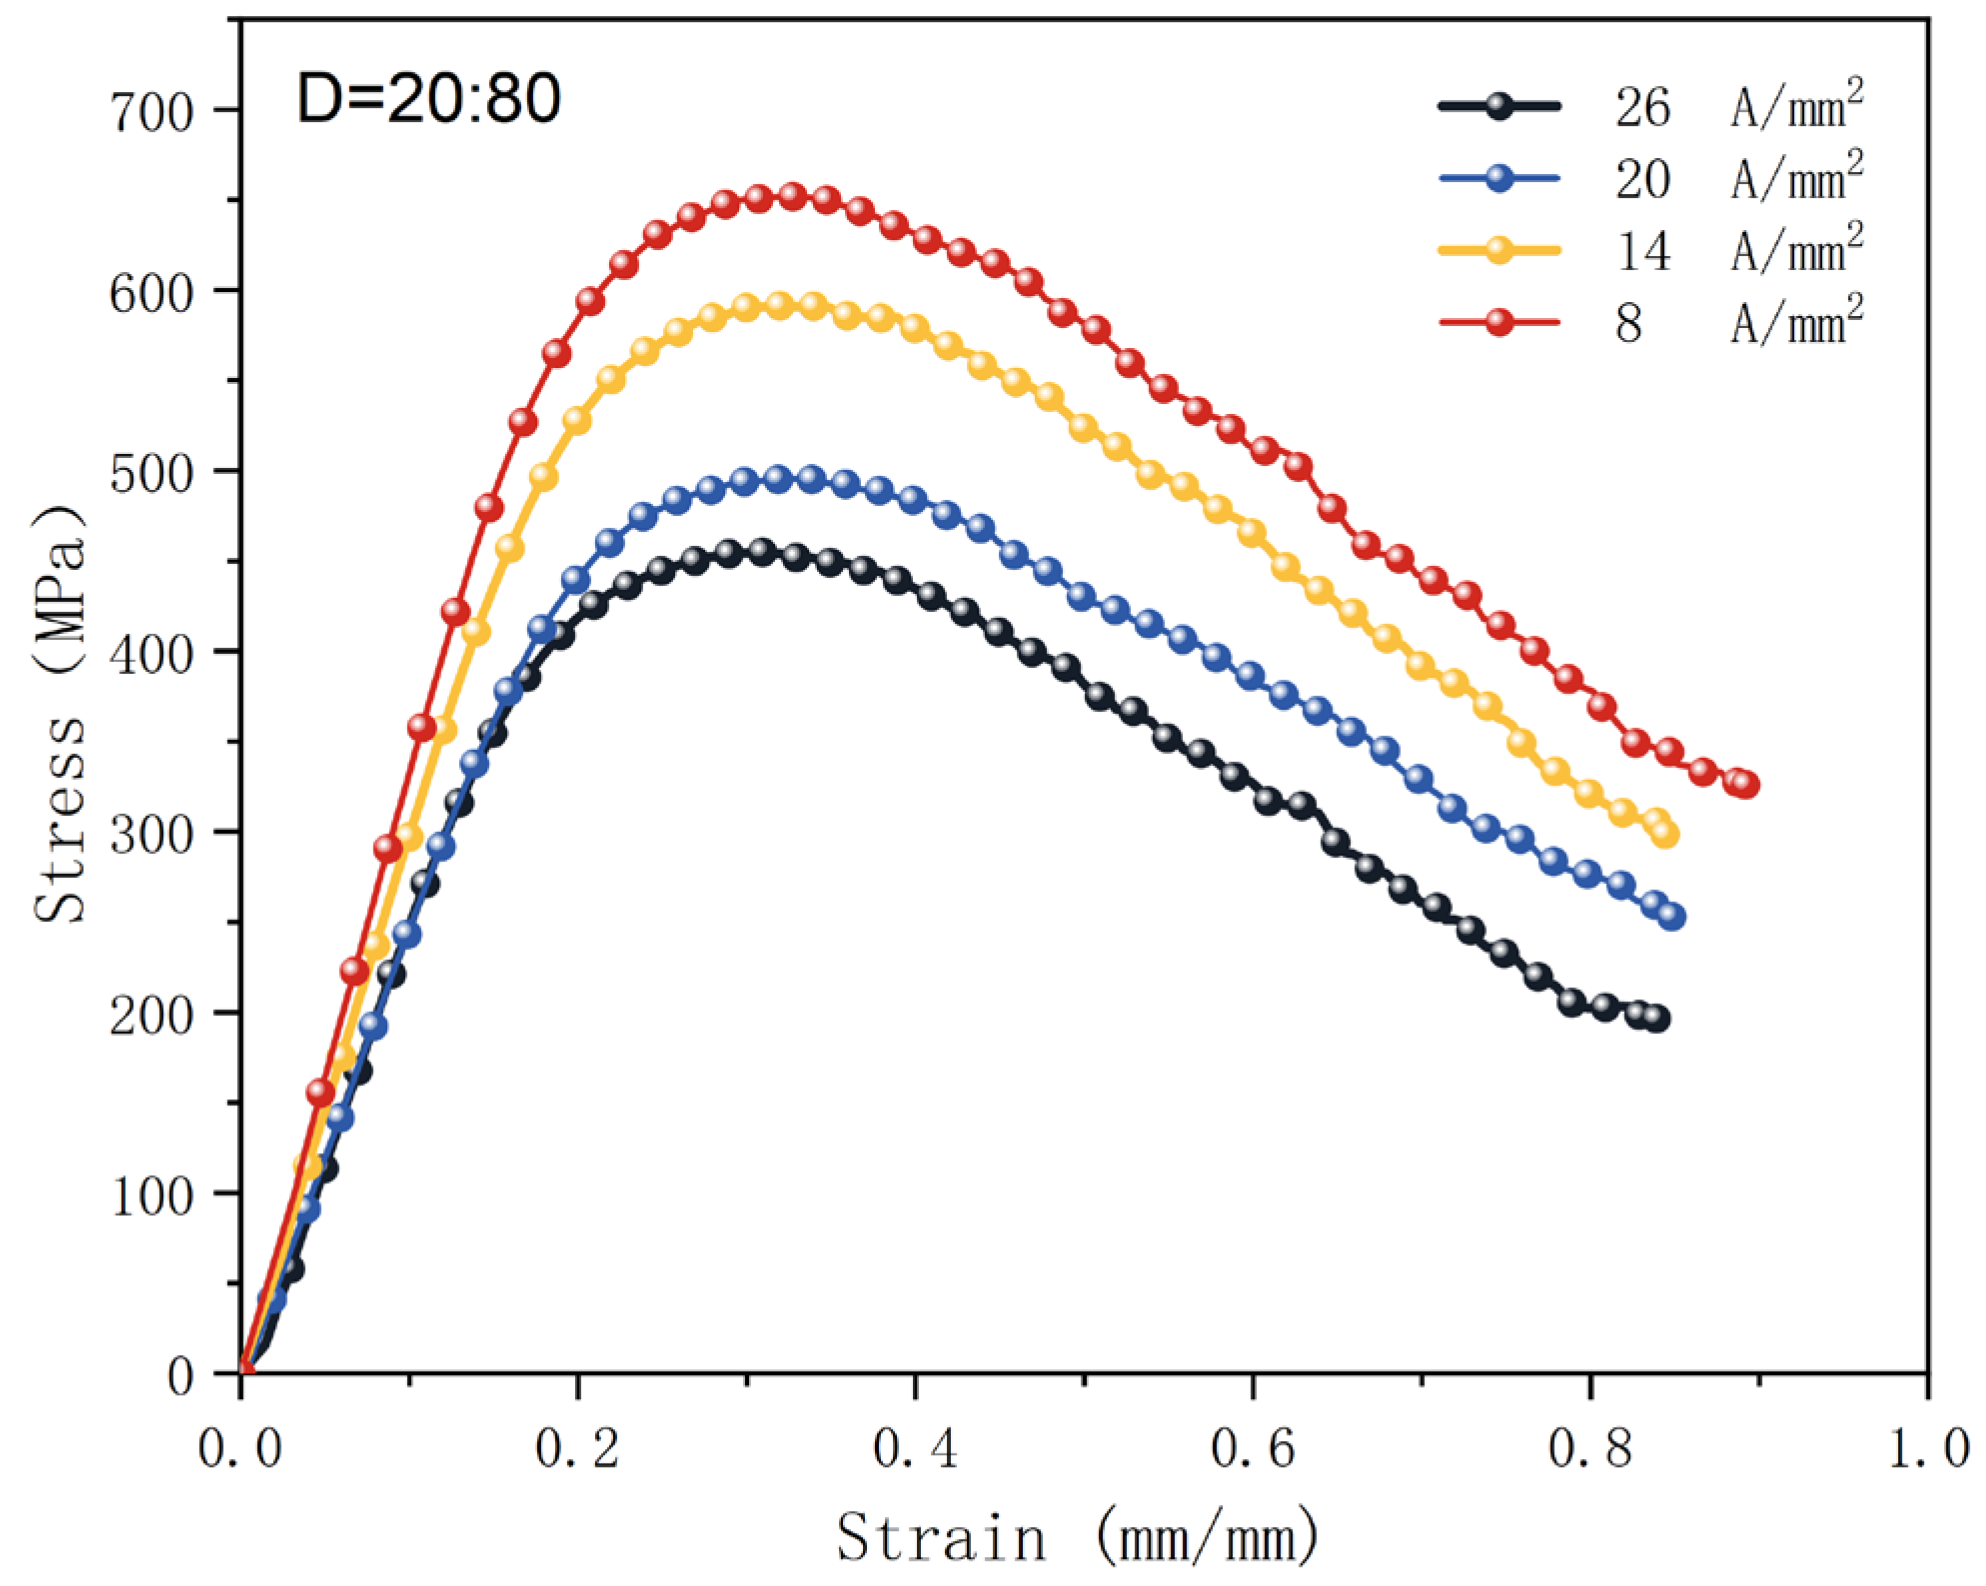
Figure 21.
Rebound for different current parameters.
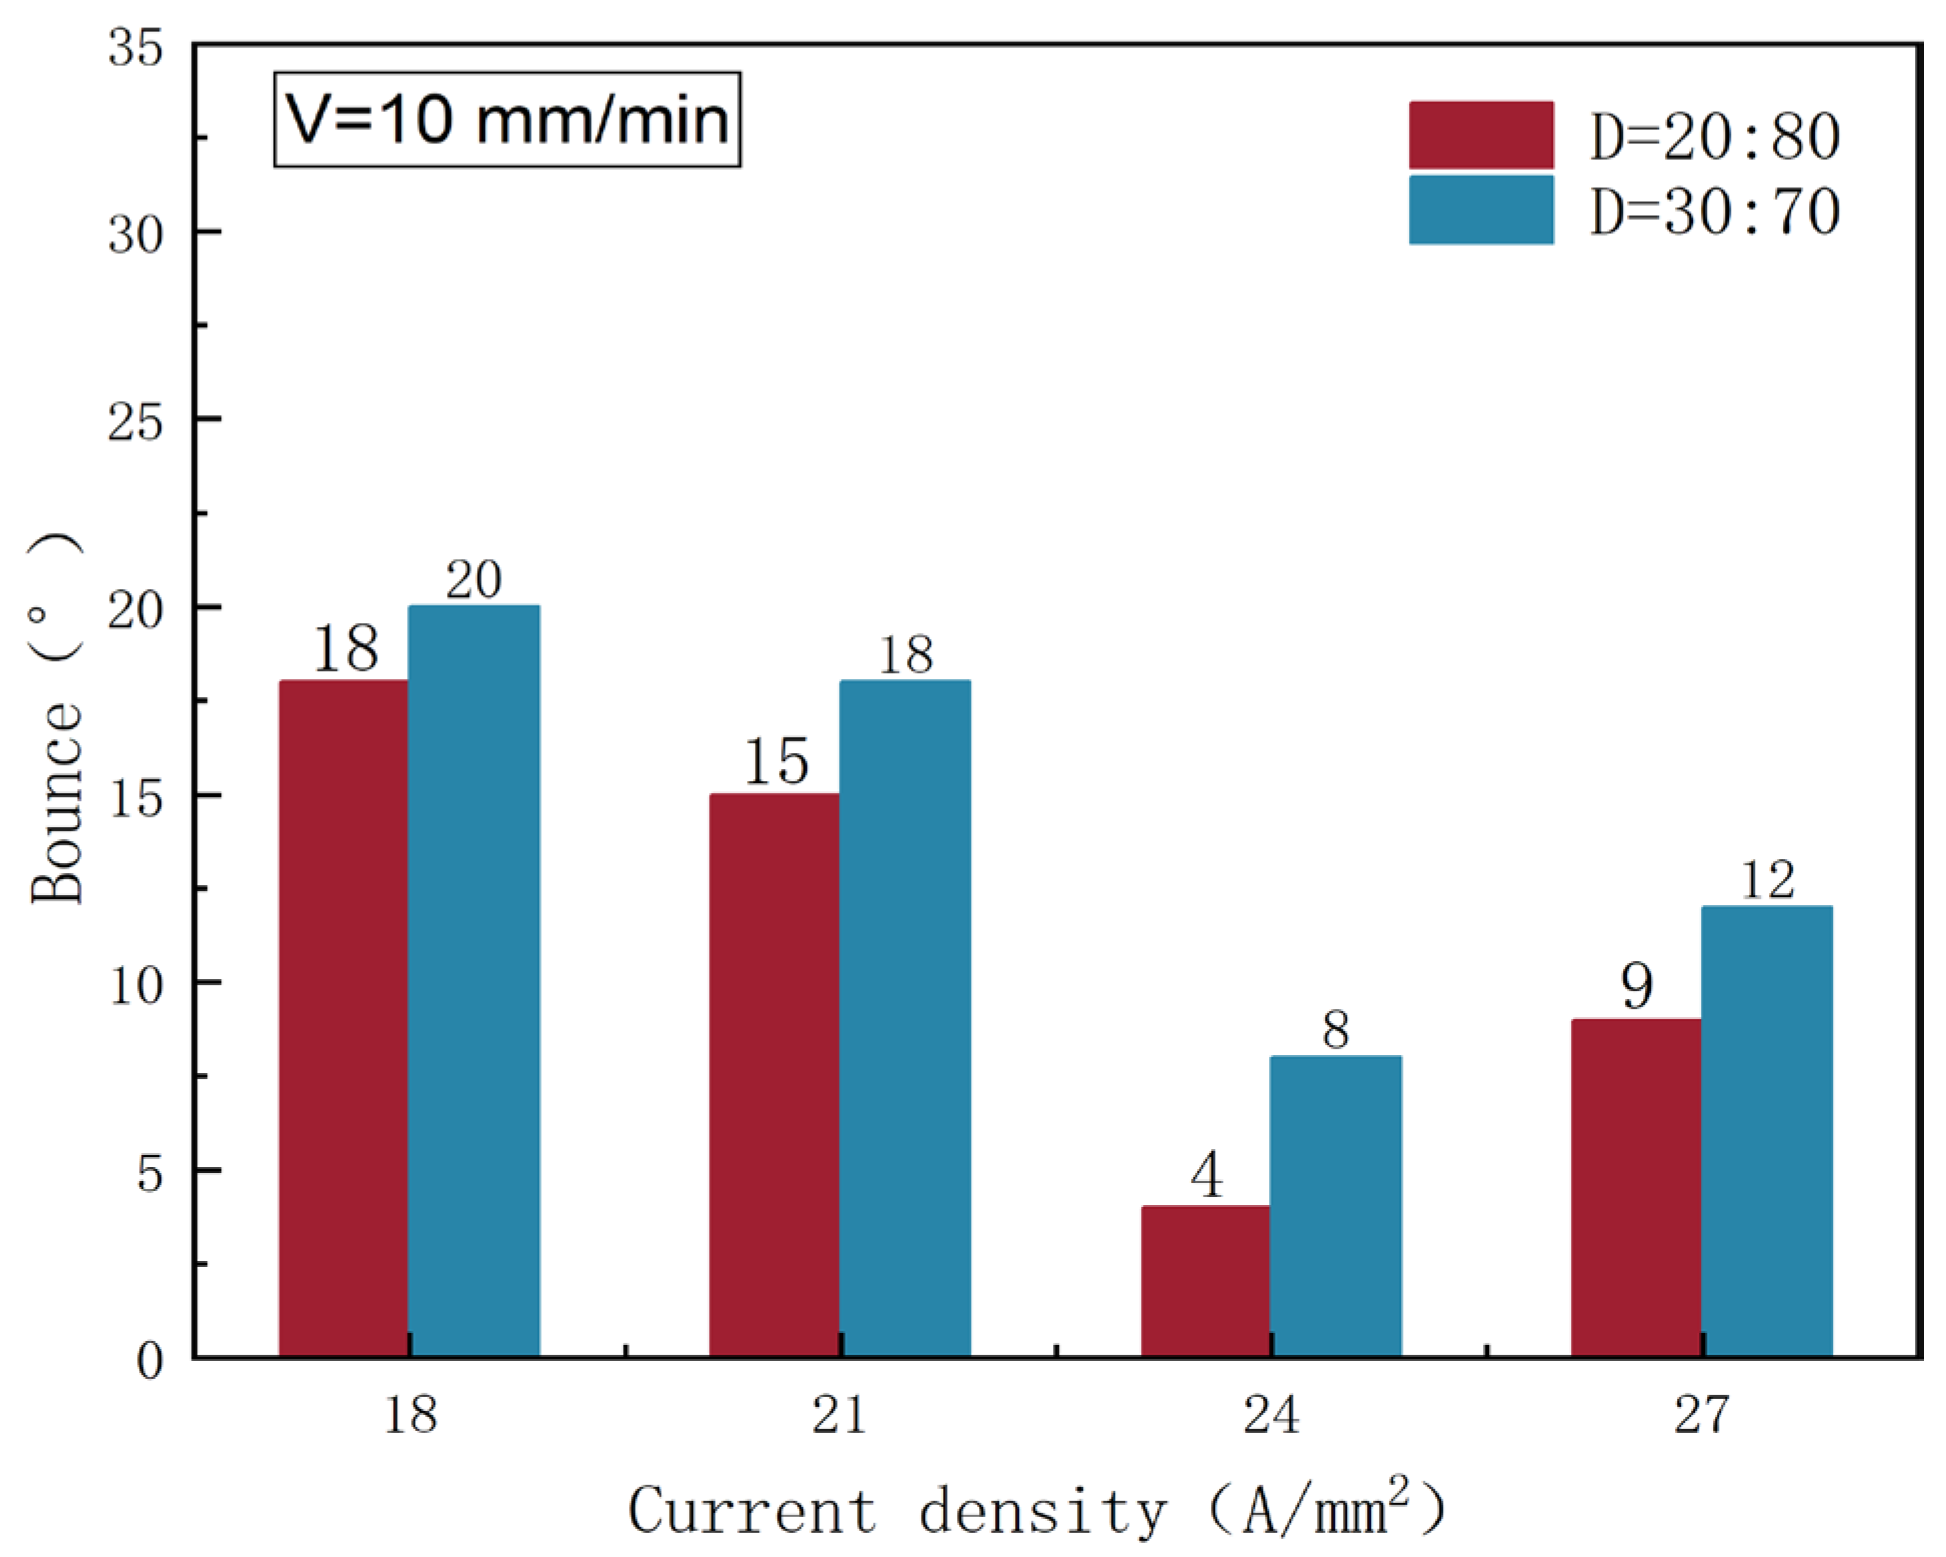
Figure 22.
Temperature variation with time at three positions.
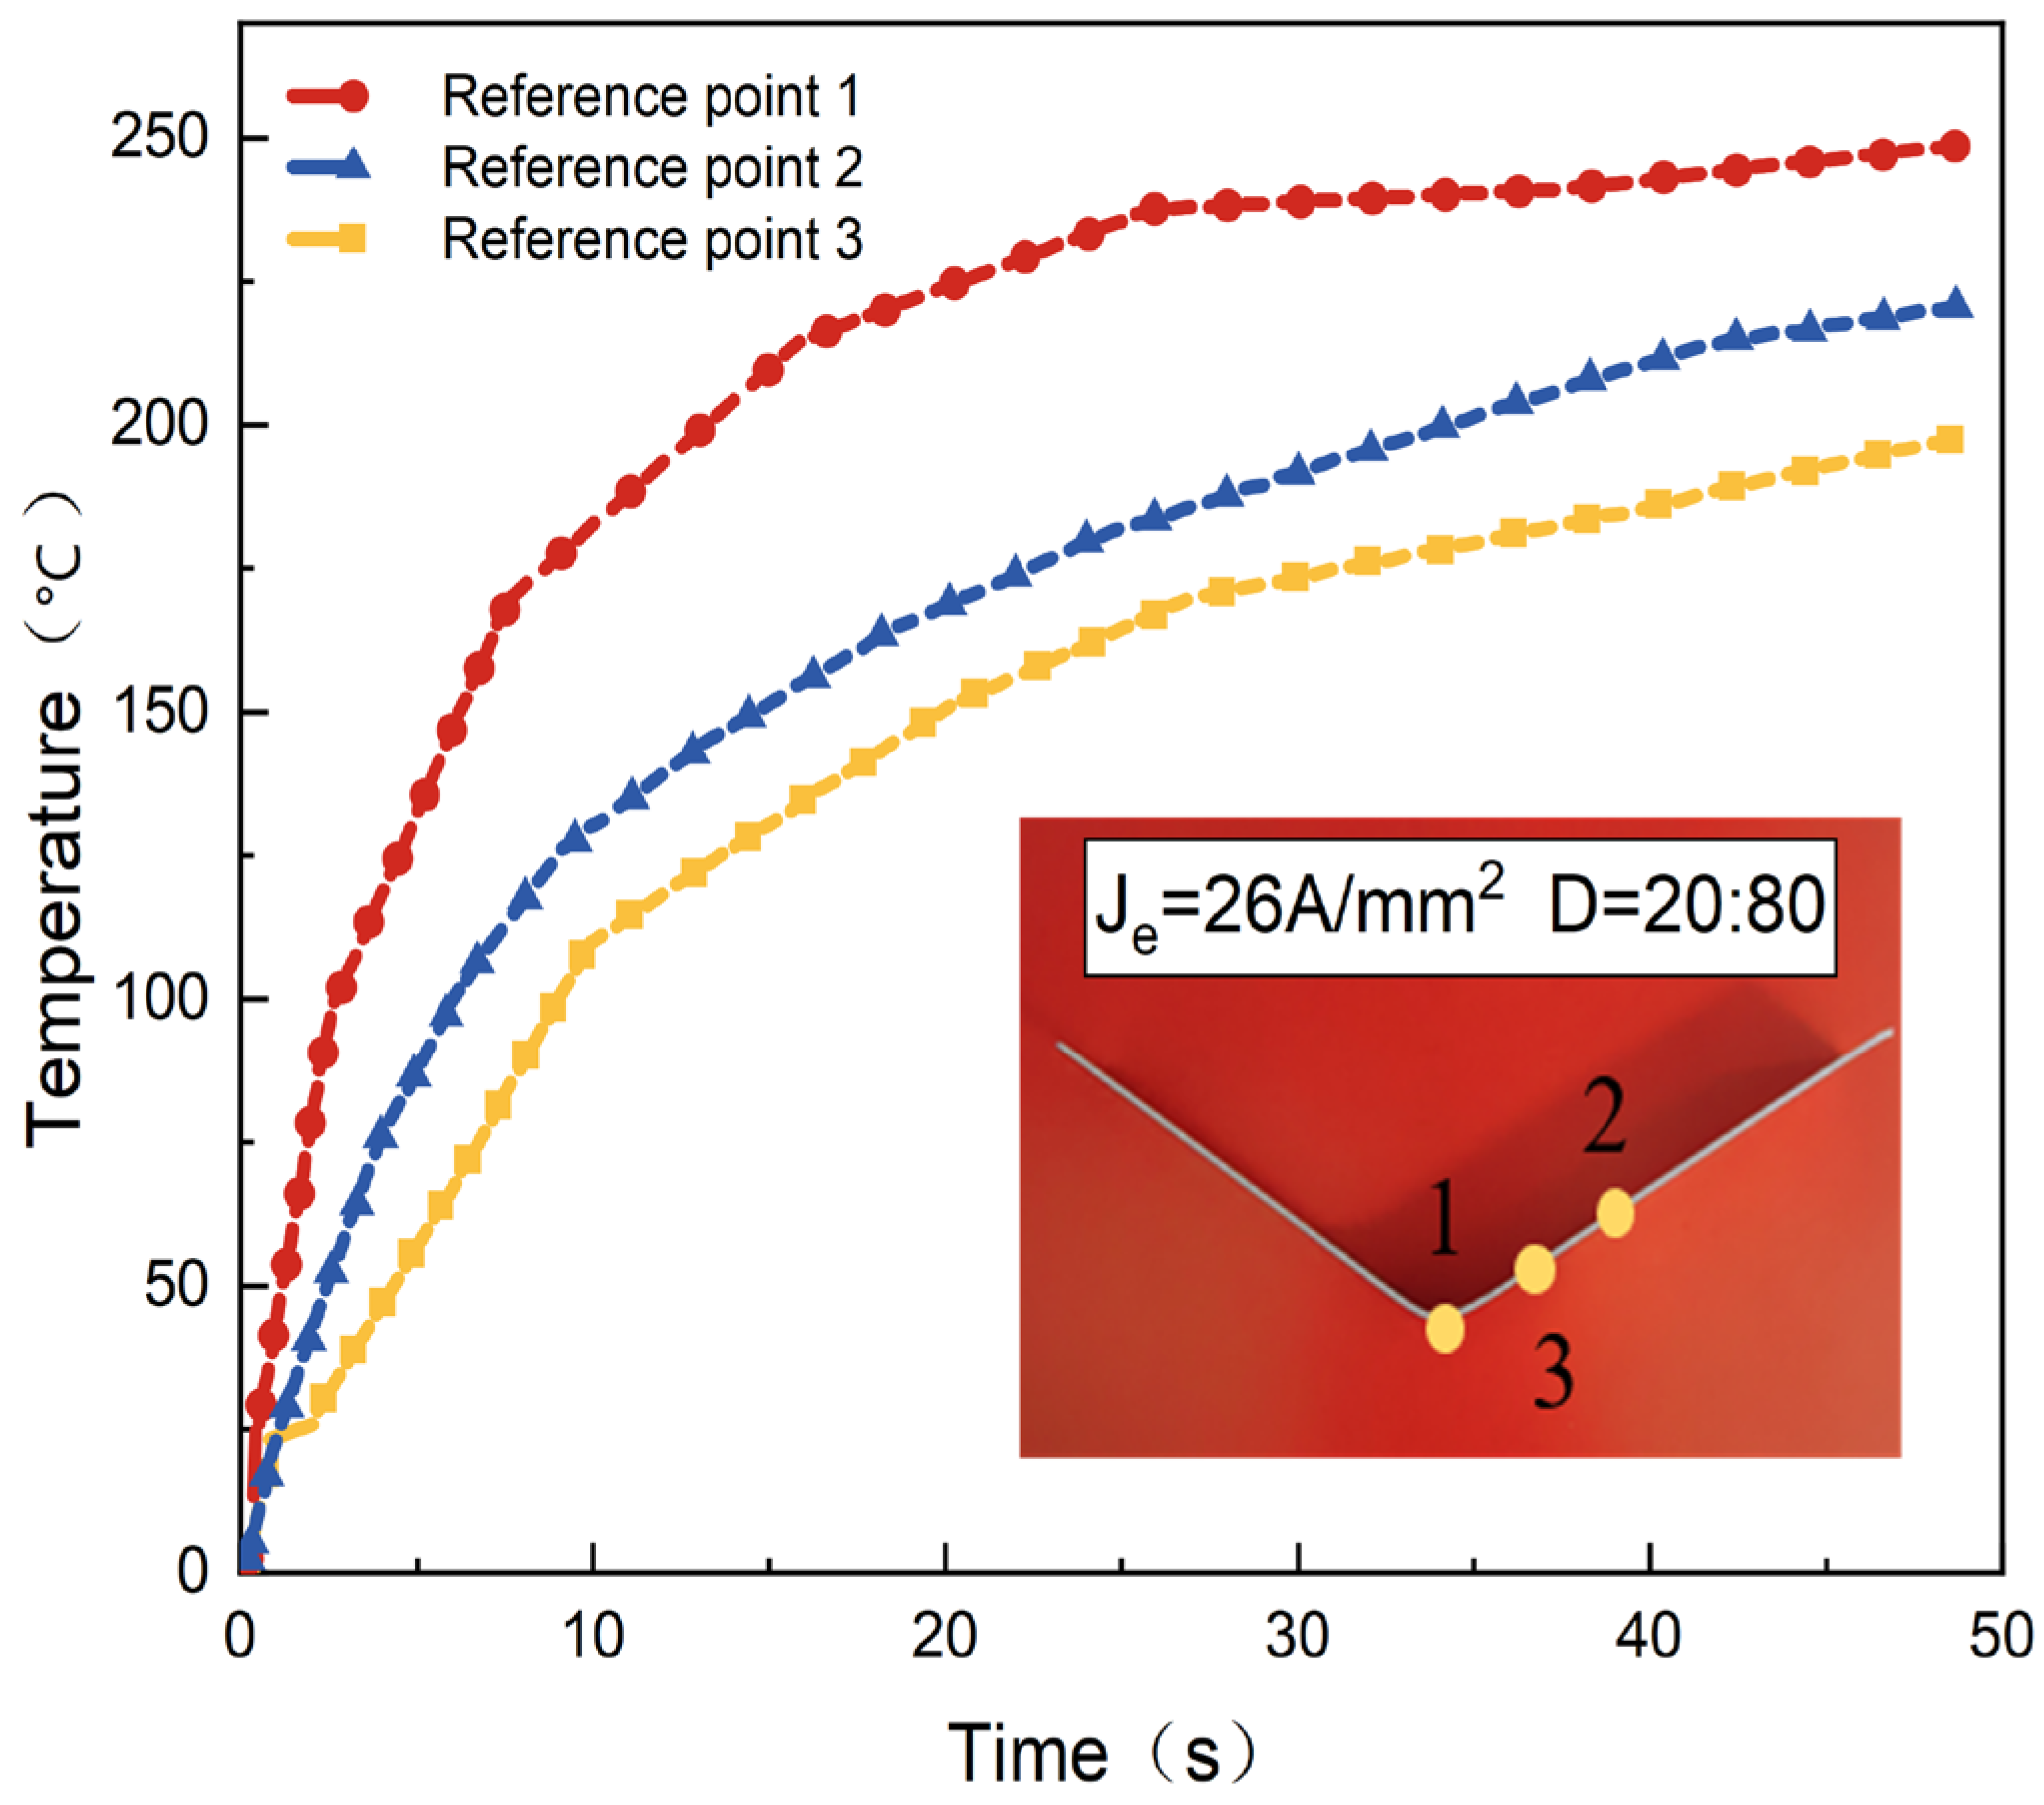
Figure 23.
Temperature variation at different times in the length direction.
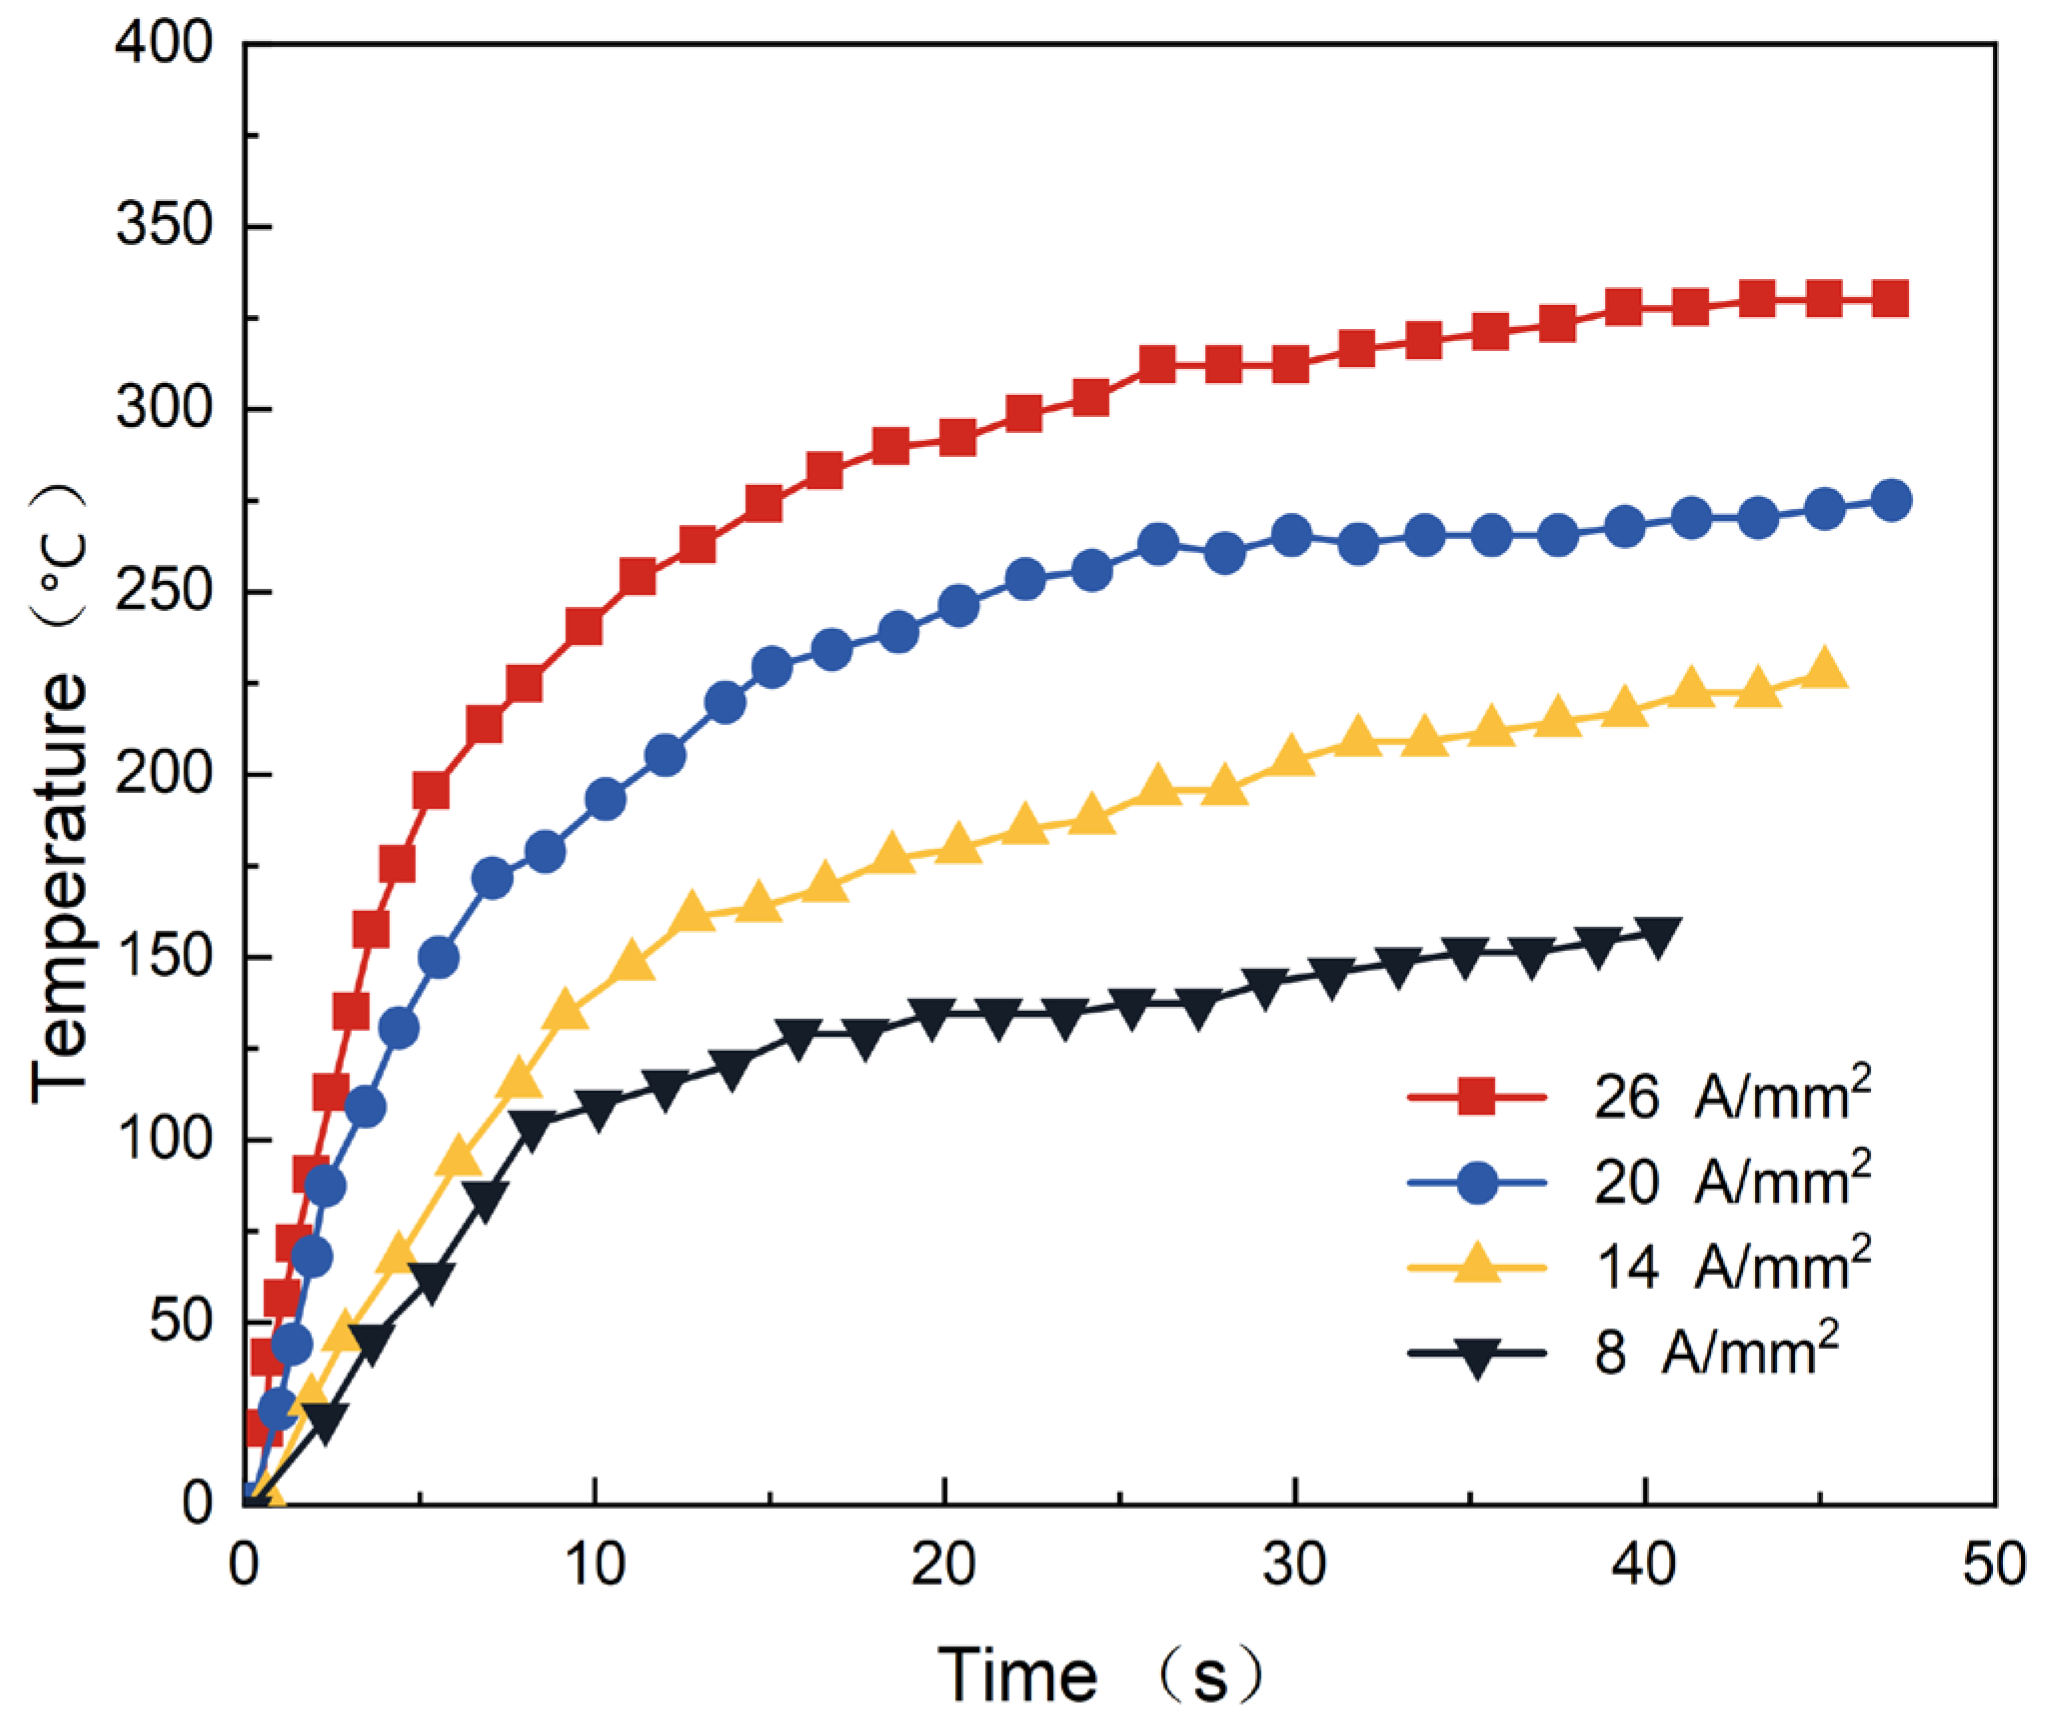
Figure 24.
Stress field clouds at different current densities.
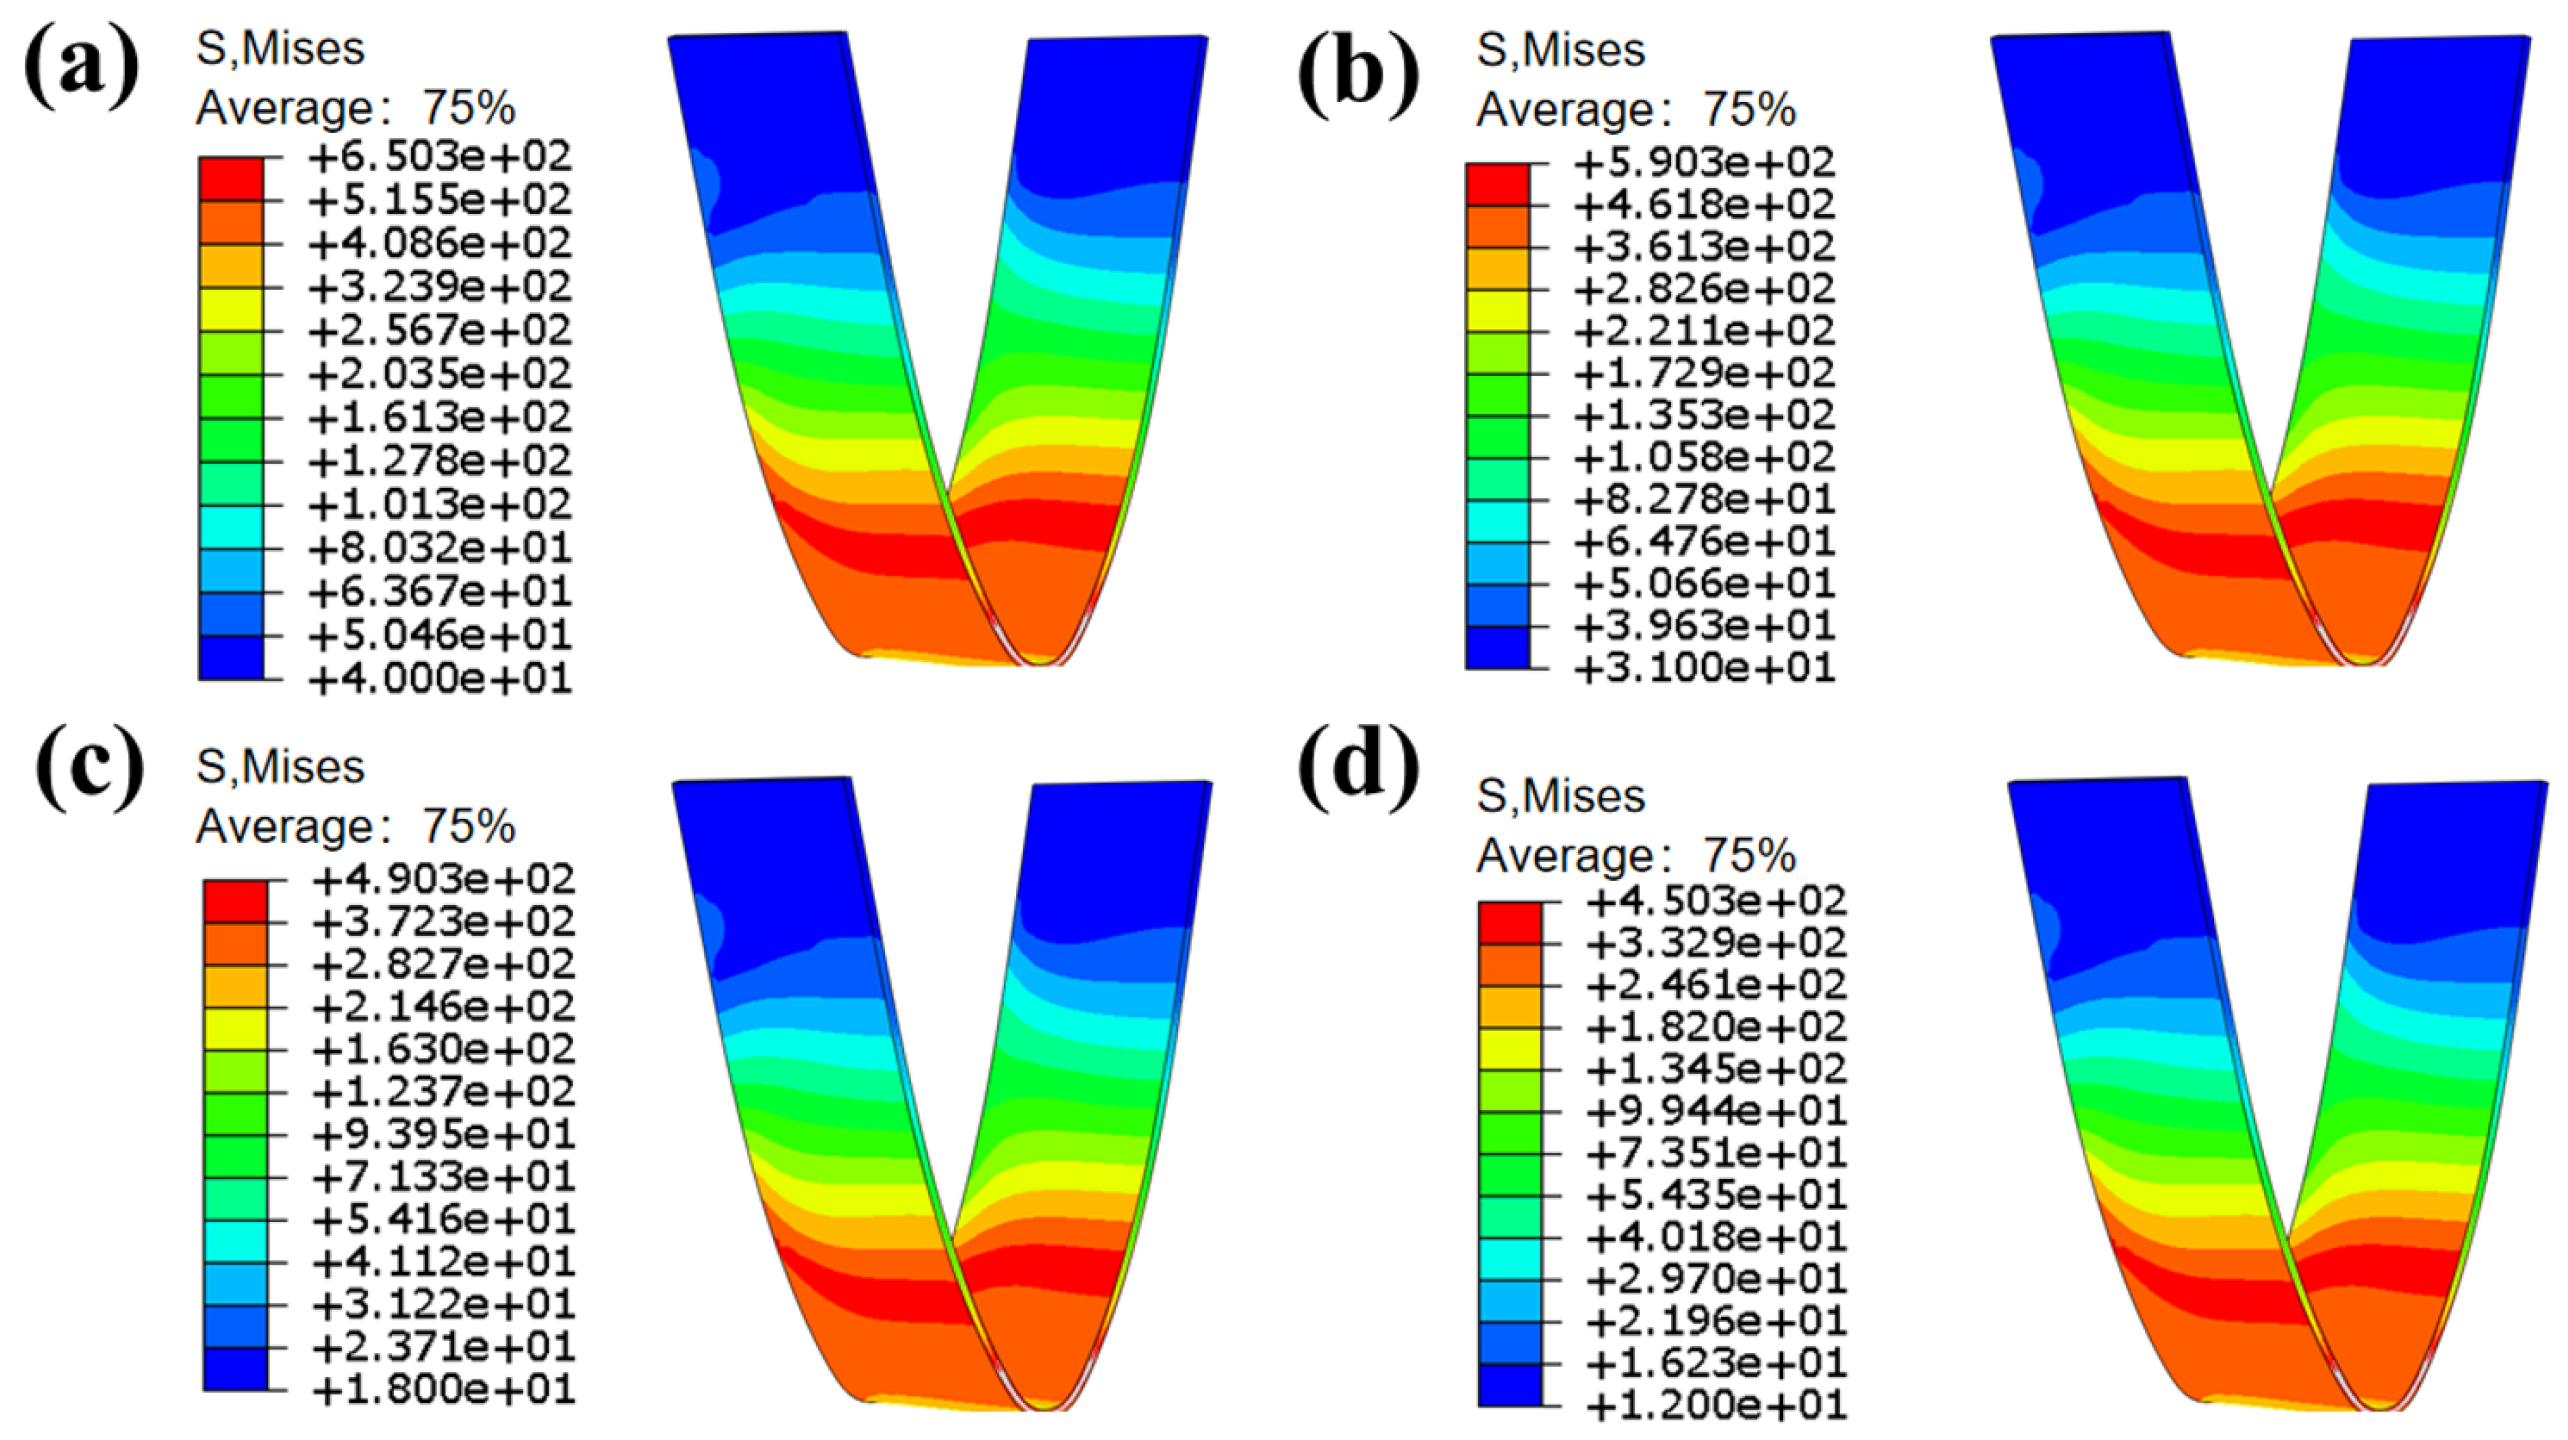

Table 1.
Chemical composition of 7075-T6 aluminum alloy (mass fraction, %).
| Element | Cu | Mg | Fe | Ti | Zn | Si | Cr | Al |
| Quality score | 1.63 | 3.161 | 0.1309 | 0.2113 | 6.10 | 0.03 | 0.22 | Balanced |
Table 2.
The main mechanical properties of 7075-T6 aluminum alloy.
| Tensile Strength (MPa) | Yield Strength (MPa) | Elongation (%) | Elastic Modulus (GPa) |
| 547.5 | 490.7 | 13.4 | 70 |
Table 3.
Experimental schedule.
|
Current Density () |
Pulse Frequency (HZ) |
Title Strain Rate (s-1) |
Temperature (℃) |
| 8 | 200 | 0.01 | 150 |
| 14 | 200 | 0.1 | 210 |
| 20 | 200 | 1 | 270 |
| 26 | 200 | 10 | 330 |
Table 4.
Decoupling of effects at different temperatures under
| Percentage of electrophysical effects ) |
) | ) | ) |
|---|---|---|---|
| Thermoplastic (%) | 50.029 | 66.986 | 75.726 |
| Electrically plasticized | 52.859 | 69.817 | 80.481 |
| Purely electro plastic | 5.353 | 4.056 | 5.908 |
Table 5.
Maximum values of purely electroplastic effect coefficient A at different current densities.
Table 5.
Maximum values of purely electroplastic effect coefficient A at different current densities.
| Current Density | Purely Electroplastic Effect Coefficient |
| 14 | 0.461 |
| 20 | 0.482 |
| 26 | 0.523 |
Table 6.
Material parameters of a 7075-T6 aluminum alloy at room temperature.
| 12.81e-09 | 9.454e+05 | 5.19e-05 | 477 |
Table 7.
Analysis of the m-value of the coefficient and the fitting result.
| Strain rate | m | R | R2 |
R2 After adjustment |
| 10s-1 | 0.203 | 0.98999 | 0.98009 | 0.97904 |
| 1s-1 | 0.212 | 0.99327 | 0.98402 | 0.98318 |
| 0.1s-1 | 0.239 | 0.99327 | 0.98658 | 0.98588 |
| 0.01s-1 | 0.281 | 0.98541 | 0.97104 | 0.96952 |
Table 8.
fitting parameter error assessment.
| Strain rate | R | R2 |
R2 After adjustment |
|---|---|---|---|
| 10s-1 | 0.98999 | 0.98009 | 0.97904 |
| 1s-1 | 0.99327 | 0.98402 | 0.98318 |
| 0.1s-1 | 0.99327 | 0.98658 | 0.98588 |
| 0.01s-1 | 0.98541 | 0.97104 | 0.96952 |
Disclaimer/Publisher’s Note: The statements, opinions and data contained in all publications are solely those of the individual author(s) and contributor(s) and not of MDPI and/or the editor(s). MDPI and/or the editor(s) disclaim responsibility for any injury to people or property resulting from any ideas, methods, instructions or products referred to in the content. |
© 2024 by the authors. Licensee MDPI, Basel, Switzerland. This article is an open access article distributed under the terms and conditions of the Creative Commons Attribution (CC BY) license (http://creativecommons.org/licenses/by/4.0/).
Copyright: This open access article is published under a Creative Commons CC BY 4.0 license, which permit the free download, distribution, and reuse, provided that the author and preprint are cited in any reuse.


