1. Introduction
Protected areas are considered the core basic for biodiversity conservation and are classified as the primary status in maintaining regional ecological security [
1,
2]. Na-ture reserve as a key member of the natural protected areas system, and the most ef-fective measures for biodiversity conservation in China [
3]. Mountain regions are un-usually biodiverse, and playing an array of roles for ecological preservation and af-fecting neighboring lowlands through biotic interchange [
4]. Mountains cover 78% of extremely important areas and 83% of important areas for biodiversity conservation in China [
5]. Hence, assessing the ecological integrity of a nature reserve in mountain re-gions can help to improve the regional ecological spatial quality, clarify the zonal management strategy, and maximize the benefits of regional ecological security.
Ecological integrity refers to the state of ecosystems, which is a major concern for humanity [
6,
7]. As the insights of ecosystem components, the integrity means that an ecosystem possesses all the indigenous biodiversity and ecological processes that should be contained in the natural habitat of a region, and maintains its structure and function without damage [
8,
9]. Maintaining the ecosystem integrity and authenticity of nature reserves plays an important role in protecting regional biodiversity and sta-bilizing ecosystem functions [
10,
11]. In the meantime, the state of ecological integrity of nature reserves is the background and the best state of ecological integrity of the re-gion, so it is very urgent and important to assess the ecological integrity of nature re-serves.
Currently, the ecological integrity evaluation including various indicators from ecosystem structure, function and process, such as biodiversity, habitat fragmentation, ecosystem services, etc. [
12]. And then, transform these indicators into ecosystem in-tegrity indices using statistical methods to reveal the ecosystem integrity status [
7,
13]. In a mountain zonal nature reserve, where constant mainstay as forest ecosystems, the ecological integrity could be judged through the landscape pattern index as an indica-tor has been a major trend in recent years [
11,
12,
14]. Landscape ecology provides an effective method for analyzing the integrity and originality of nature reserves at the landscape level by quantitatively analyzing the spatial distribution characteristics of landscape components and revealing the links between spatial patterns and ecological processes [
6,
12,
15]. Landscape ecological integrity is the ability of a landscape to maintain its self-organization, stability, and structural and functional diversity [
16,
17]. Parrish et al.(2003) defined the landscape ecological integrity as the ability of an eco-system to support and maintain a biotic community with species composition compa-rable to that of natural habitats in the region, diversity, and functional organization [
18]. A higher-level landscape ecological integrity is an ecosystem with natural evolu-tionary and ecological processes that are minimally or unaffected by human activities [
19]. The landscape pattern framework has significant spatial and temporal character-istics, which is conducive to the dynamic evaluation and monitoring of ecosystem in-tegrity, the construction and optimization of ecological networks and ecological pro-tection space [
7].
Xiangjiangyuan Provincial Nature Reserve (XPNR) is a protect area approved by the Jiangxi Provincial Government in 2017, which is locating at the intersection of Wuyi Mountain Range and Nanling Range [
20]. The protected objects of this nature reserve contain evergreen broad-leaved forests and wildlife, such as Neofelis nebulosa, Syrmaticus ellioti etc. Hence, the nature reserve is an important node between Wuyi Mountain Range and Nanling Range protect areas network. Therefore, applying the principles of landscape ecology and based on the 7th national forest inventory datasets, we explore the landscape composition of each functional zone, analyze the ecological integrity of the nature reserve. As the aim to address the following questions: (1) how about the landscape composition and diversity in each functional zone; (2) what is the landscape patchiness of important forest types in each functional zone; and (3) how about the ecological integrity of the nature reserve?
2. Materials and Methods
2.1. Study Area
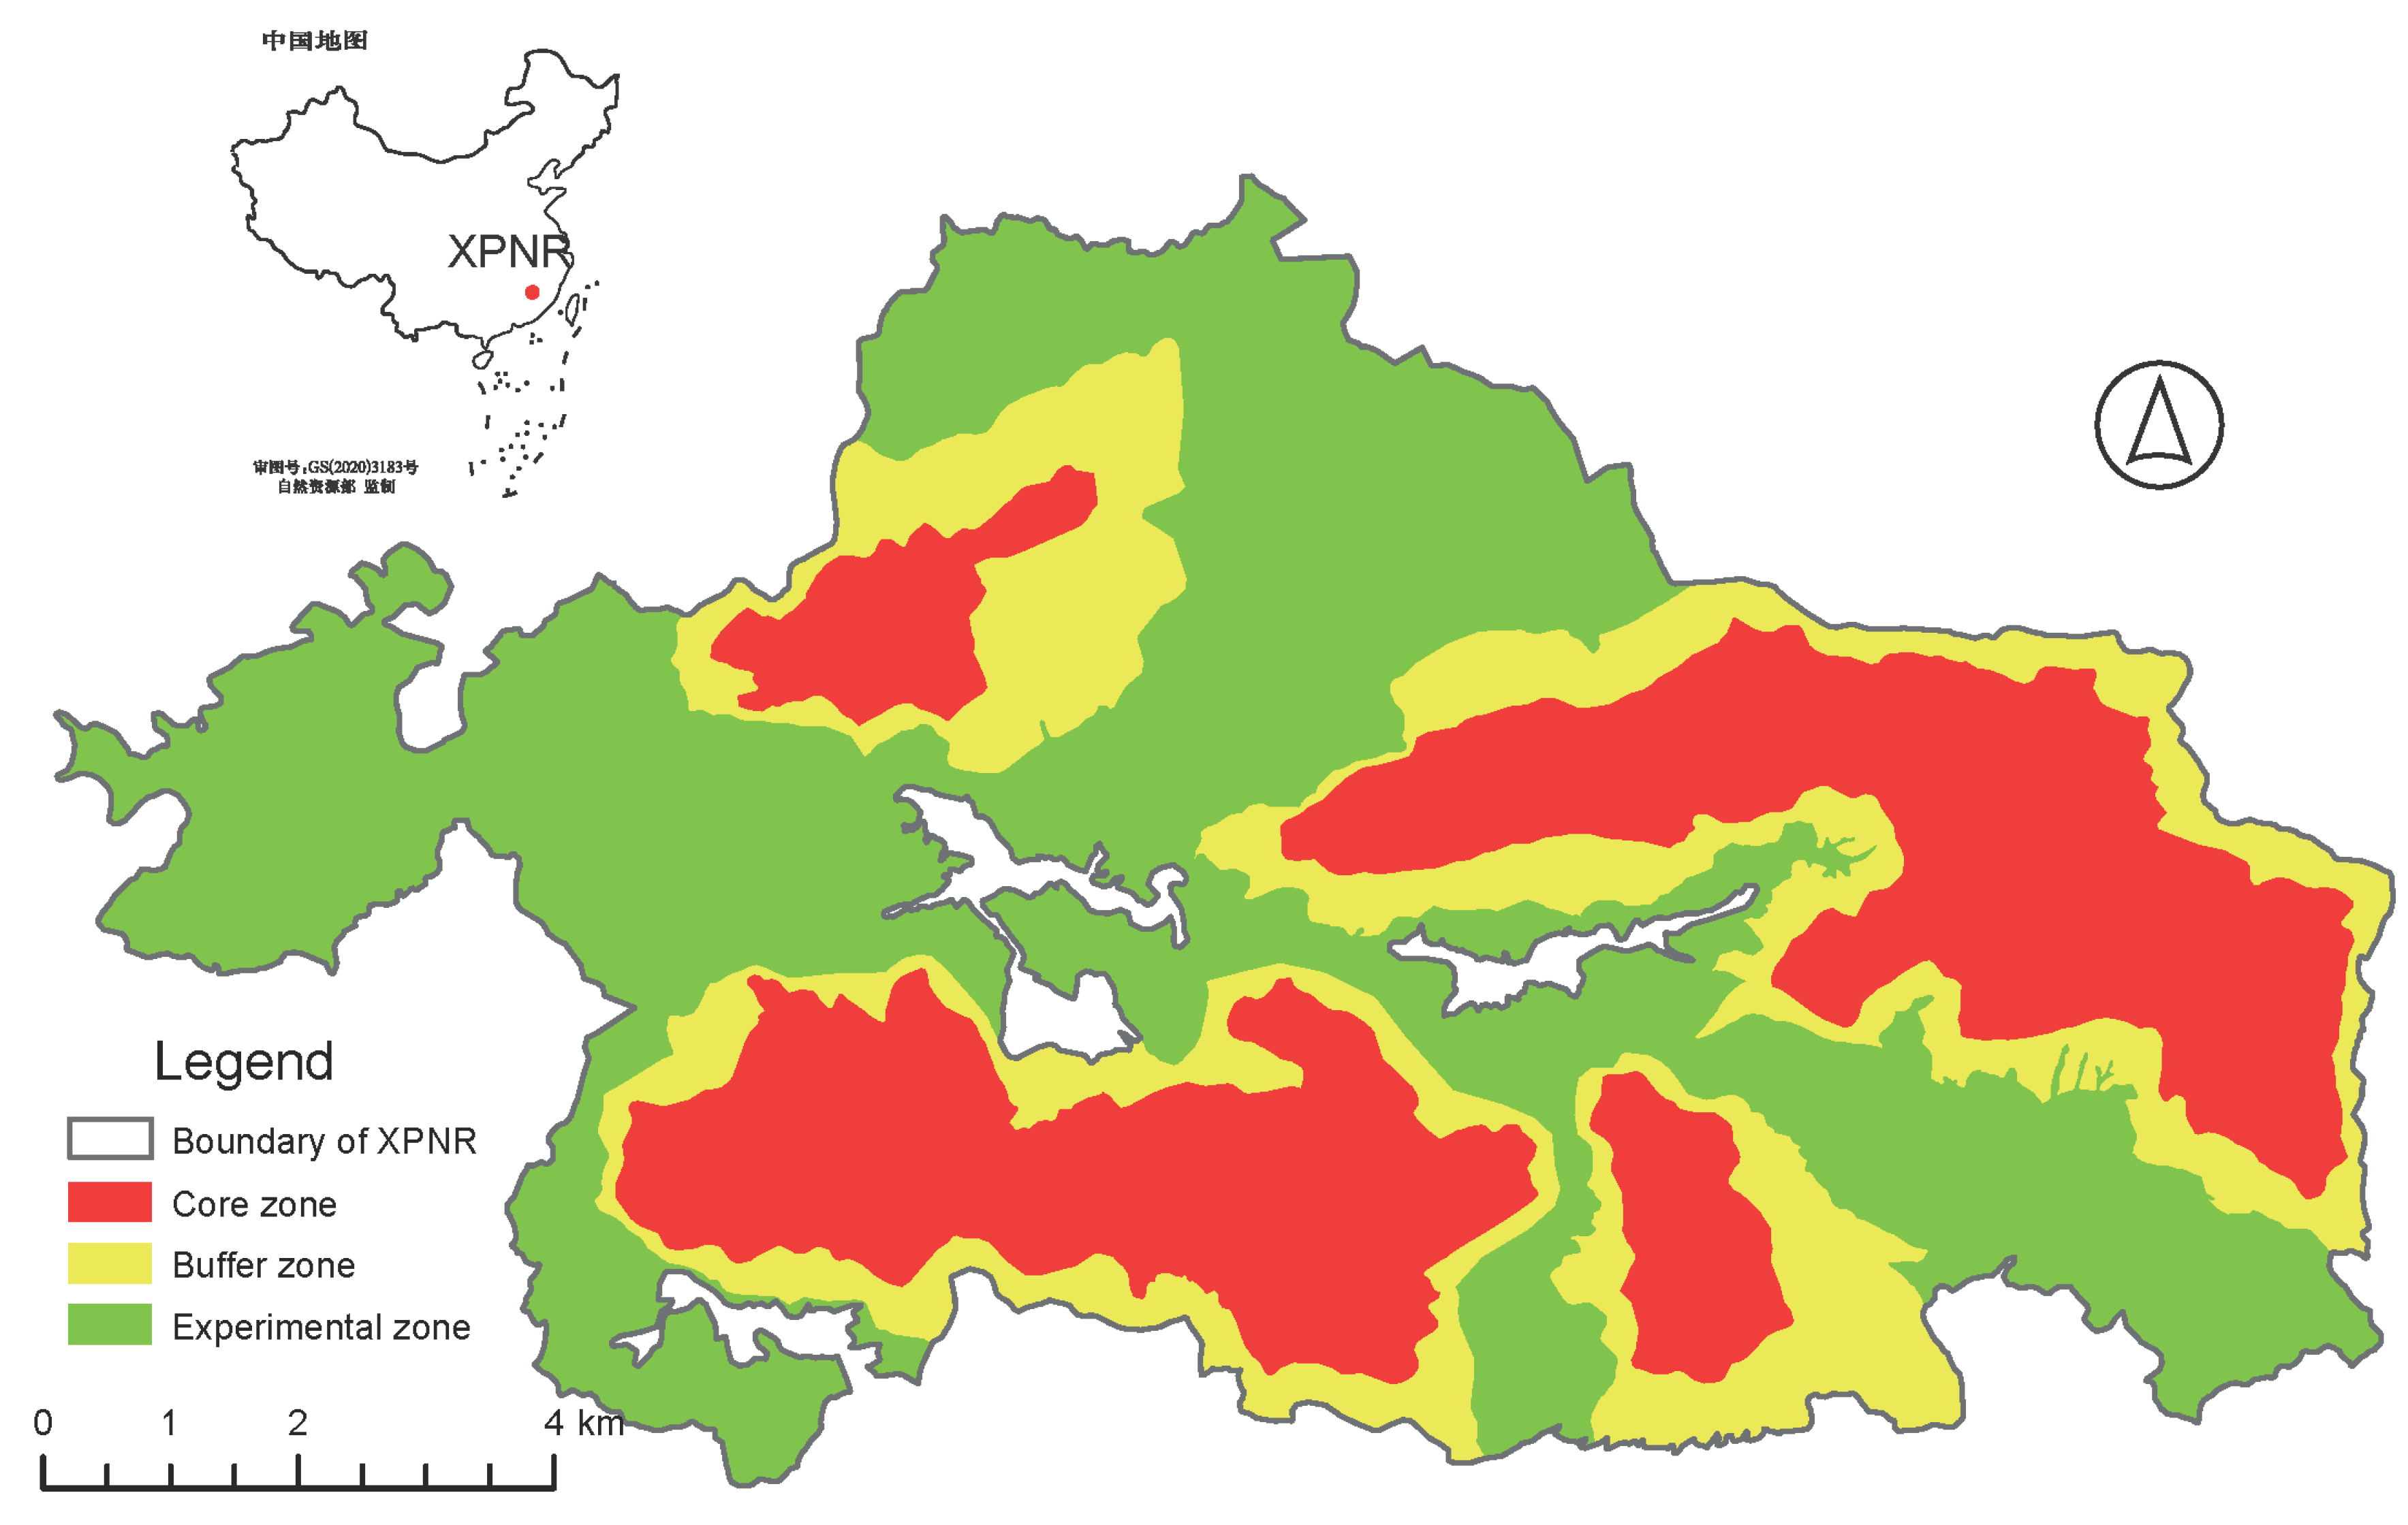
Xiangjiangyuan Provincial Nature Reserve is located in Huichang County, Ganzhou City, Jiangxi Province (115°48′22"-116°02′00"E, and the latitude of 25°29′00"-25°36′03"N) (
Figure 1). It is 23 km long from east to west and 13 km wide from north to south, with a total area of 10,341.39hm
2. The protected area has a humid climate in the central subtropical monsoon, with a mild climate, sufficient heat, long sunshine hours, abundant light energy, high precipitation, no droughts or floods, and a large difference in the four distinct seasons. The lowest temperature in the reserve is in January, with an average temperature of 8.8℃, the highest temperature is in July, with an average temperature of 28.7℃, and the perennial temperature fluctuates around 19.4℃. There are 215 families, 831 genera and 2,276 species of vascular plants in the nature reserve. Zoological geography belongs to the East Hilly Plain subregion of the Sino-Japanese realms [
21,
22], with 383 species of vertebrates in 35 orders and 104 families. The forest ecosystem in the reserve is relatively intact, with more than 90% forest coverage, and the development of broad-leaved evergreen forests with the characteristics of the southern part of the middle subtropics.
2.2. Data Collection
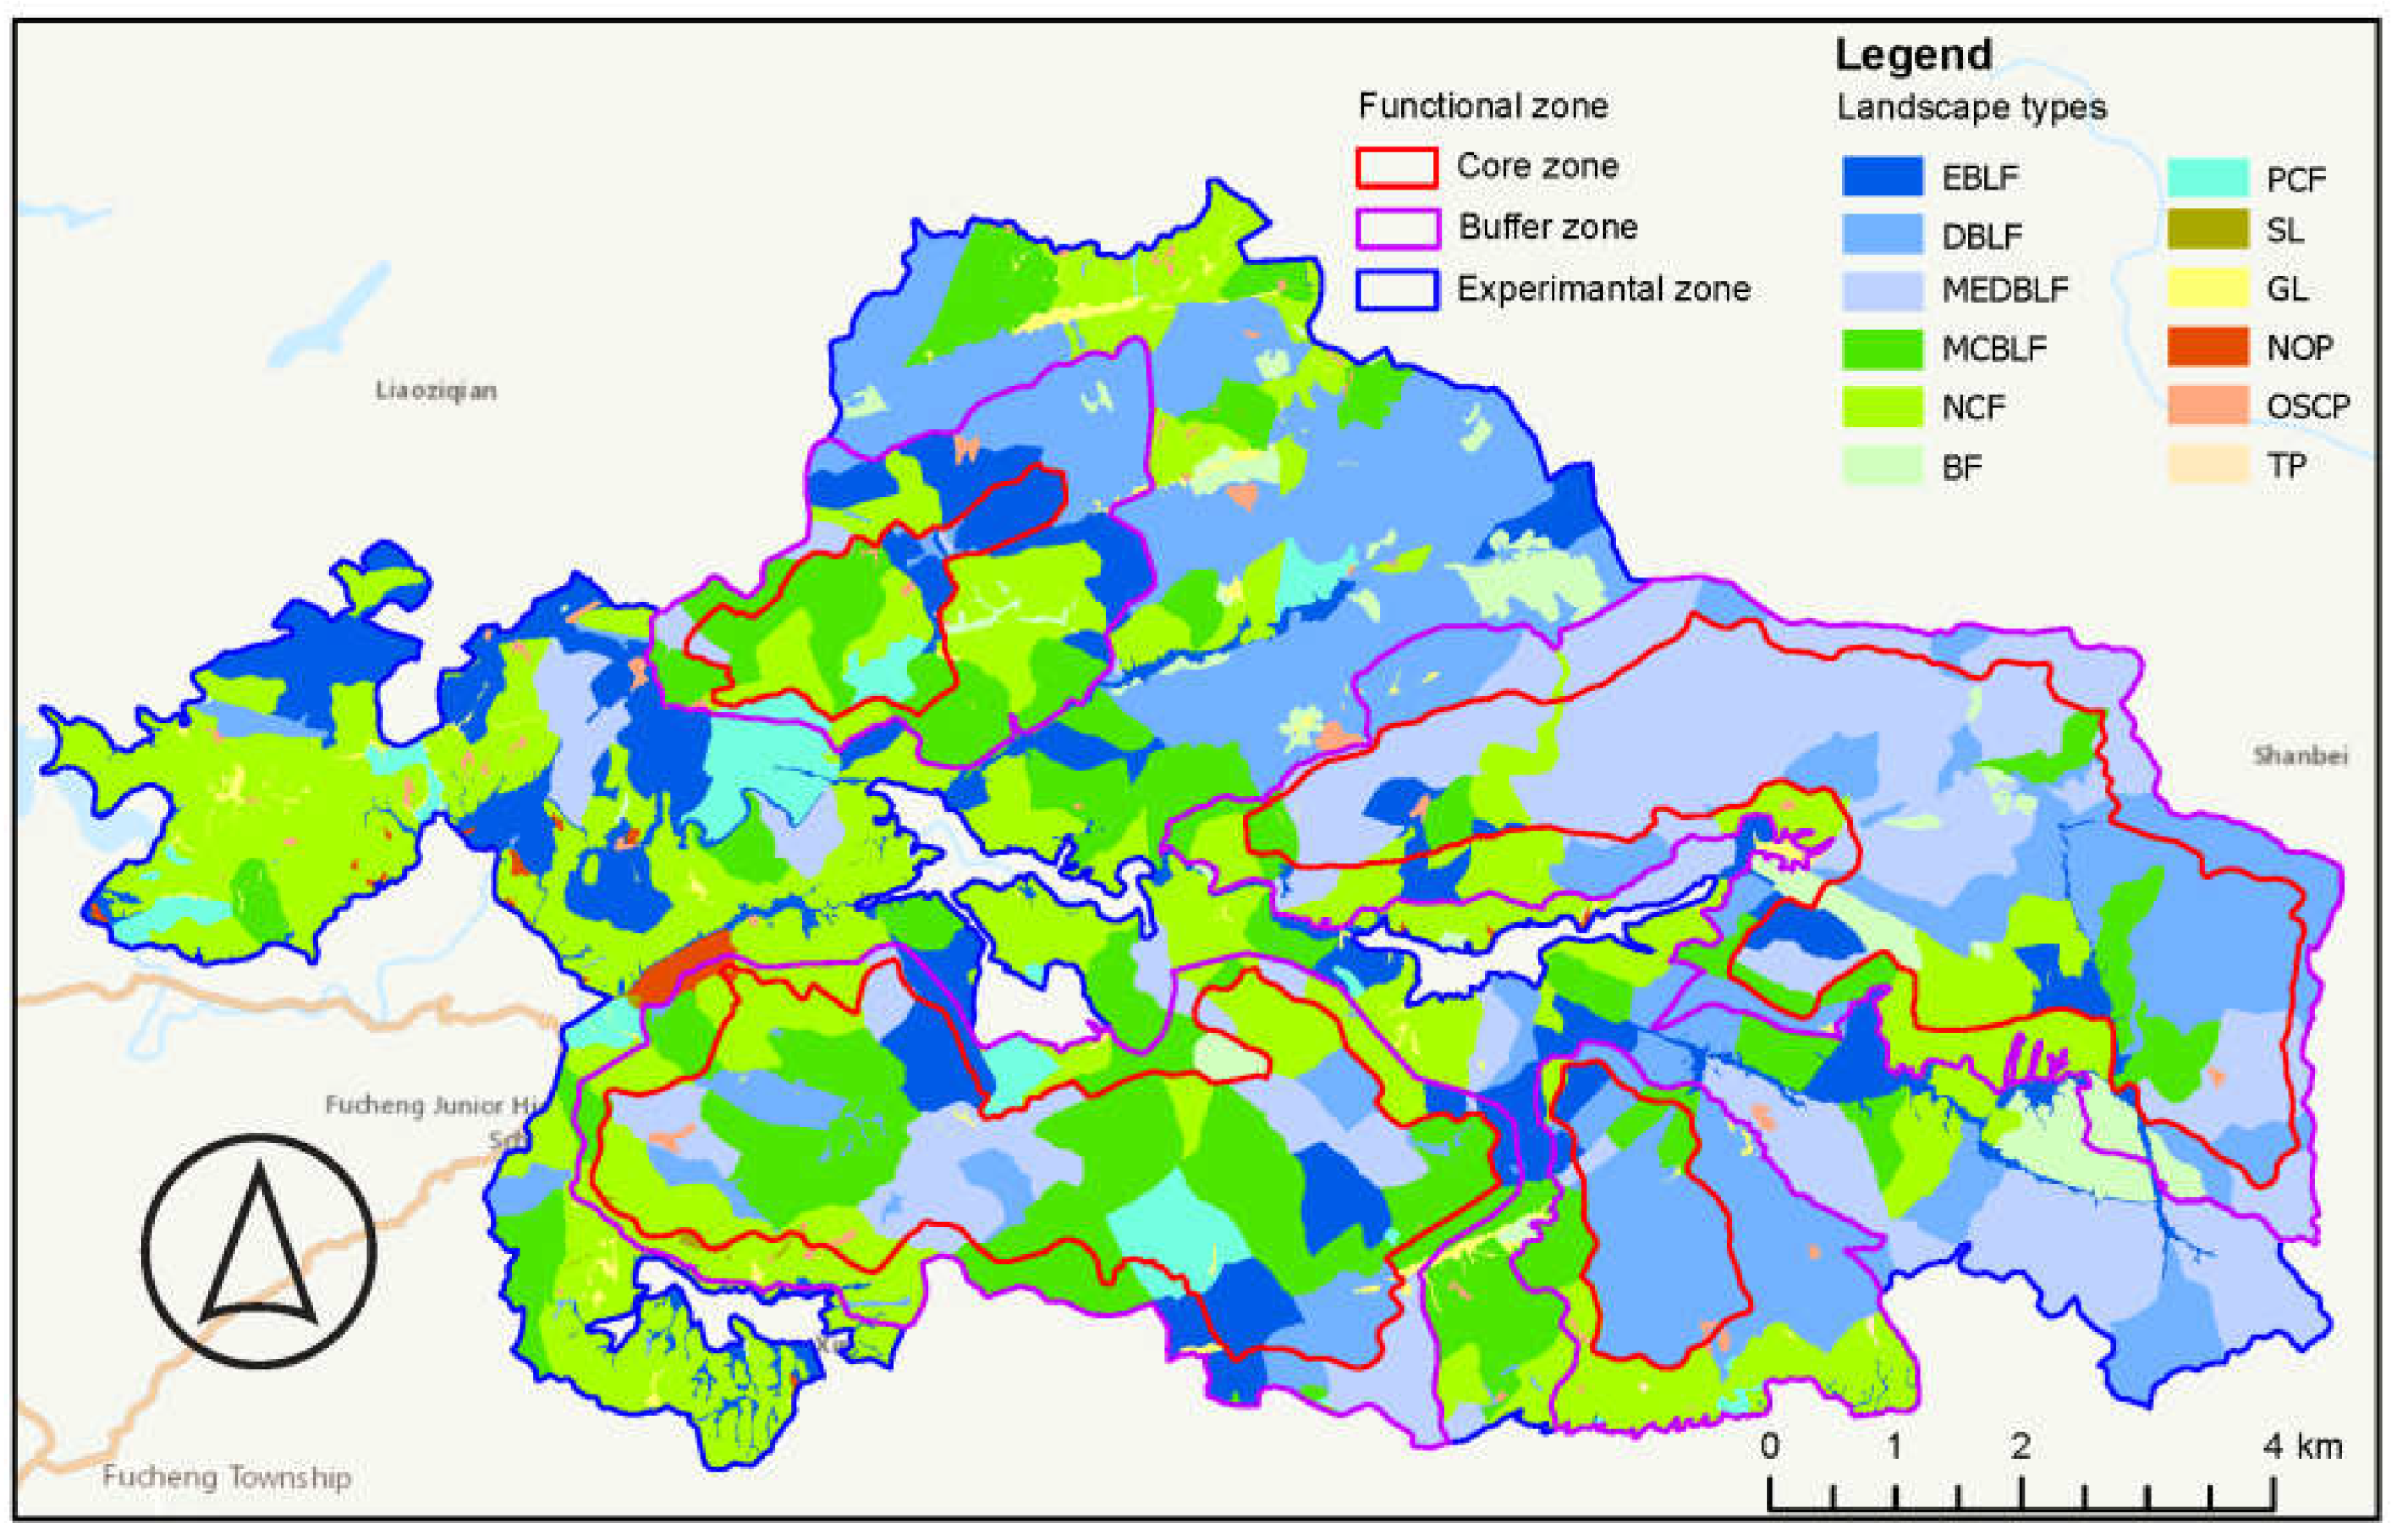
The functional zone shapefile of XPNR was provided by Huichang County Xiangjiangyuan Provincial Natural Reserve Administration Committee, and the vector data was approved by the Jiangxi Provincial Government in 2017. The second level forest resource datasets of 7th national forest survey in 2017-2019 was collected to assess the landscape ecological integrity. The landscape type of patch was identified through dominant plants included in the database. A total of 12 landscapes types were distinguished (
Figure 2), such as evergreen broad-leaved forest (EBLF), mixed evergreen deciduous broad-leaved forest (MEDBLF), deciduous broad-leaved forest (DBLF), natural coniferous forest (NCF), mixed coniferous broad-leaved forest (MCBLF), bamboo forest (BF), planted coniferous forest (PCF), shrublands (SL), grasslands (GL), navel orange plantations (NOP), oil-seed camellia plantations (OSCP), and tea plantations (TP). Landscape patches were grouped according to Põldveer et al. (2023) grouping methodology into following naturalness classes [
23]: 1) managed patches, 2) recovering patches, and 3) natural (including old-growth) patches; altogether 492 patches were under study.
2.3. Landscape Ecological Integrity Calculation and Evaluation
Several landscape pattern indices were used to evaluate the ecological integrity of the nature reserve and the three functional zones. The patch density (PD) and mean patch size (MPS) were used to measure the landscape fragmentation of the nature reserve according to the following formula (1) and (2). In landscape ecology level, the PD indicates the stability of the landscape pattern, but the MPS indicates the heterogeneity of the landscape [
24].
where N is the number of patches, A is the total area of landscape types.
The largest patch index (LPI) refers to a simple measure of dominance as follows [
25]:
where aij is the area of patch j in landscape type i.
The mean shape index (MSI) and area-weighted mean patch fractal dimension (AWMFD) describes shape complexity of landscape. These two metrics reflect the extent to which human activities affect natural landscapes [
26].
where m is the number of landscape patch types, n is the number of all patches in the landscape, pij is the perimeter of patch j in landscape type i.
The contagion index (CONTAG) is an aggregation metric, describes the connectivity of landscape types and granularity of the landscape texture by measuring the extent to which landscape types are clumped together [
27].
Where m is the number of landscape patch types, n is the number of all patches in the landscape, pij is the perimeter of patch j in landscape type i.
Landscape metrics analysis were used raster data as its data source. Hence, the obtained landscape vector data were converted to raster data and then calculated with Fragstats software [
28,
29].
3. Results
3.1. Landscape Composition Analysis
As shown in
Table 1, the landscape types were dominated by five major types: EBLF, MEDBLF, DBLF, MCBLF, NCF. The areas of NCF and DBLF were 2535.25ha, 2281.28ha, about 24.52% and 22.06% of the XPNR, respectively. These two kinds of landscape were mainly distributed in the experimental zone. The area of MEDBLF was 1860.89ha, and the MCBLF was 1622.89ha, these two landscapes were about 17.99% and 15.69% of the total area, respectively. These two kinds of landscape were mainly distributed in the core zone. In addition, although the DBLF has the largest area in the experimental zone, it also has a larger area in the core zone. Hence, the core zone was dominated by MEDBLF, MCBLF and DBLF, all of those landscape were recovered after anthropogenic activities for long times. Similar to the DBLF, the EBLF was mainly distributed in experimental zone, but has a larger area in the core zone. The remaining landscape types were mainly distributed in the experimental zone.
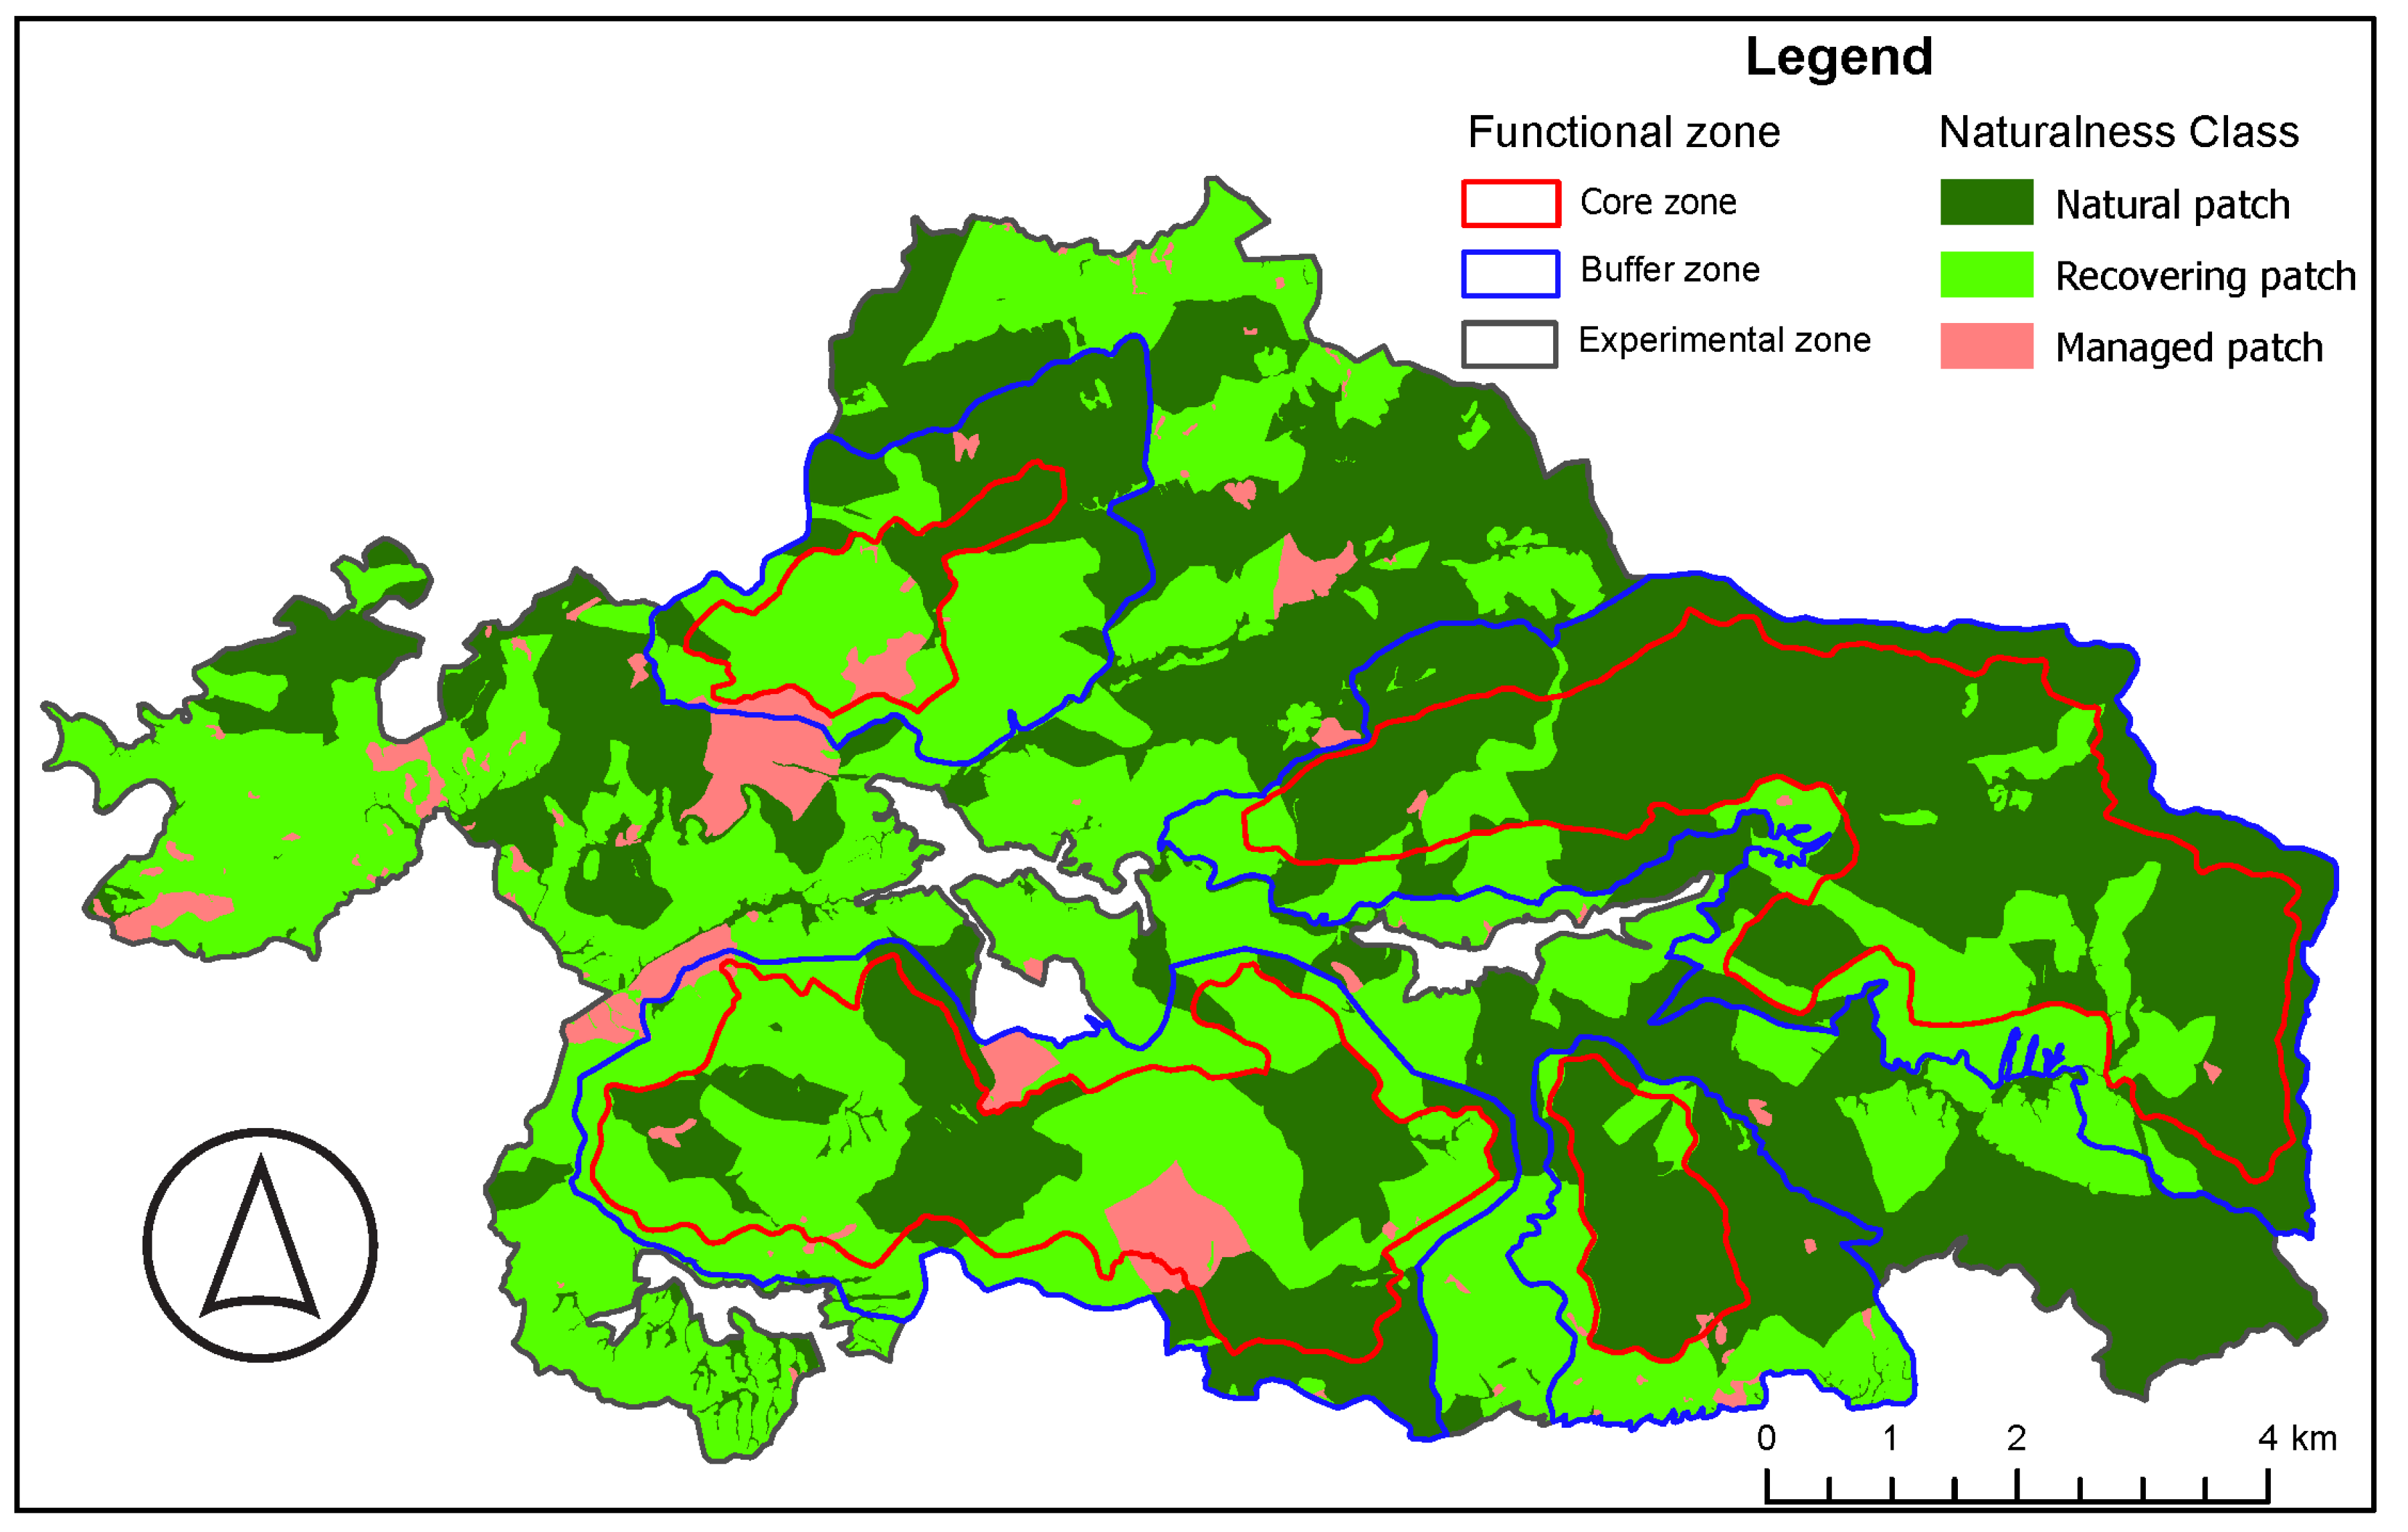
3.2. Naturalness Assessment
Results of the naturalness assessment of the three functional zone in XPNR were given in
Table 2. According to the findings, regardless the entire XPNR, or the different functional zones, natural patches were the largest naturalness class in the area. The area of natural patches was occupied 52.10% of XPNR, and accounted for 46.19%, 50.28% and 62.43% of the experimental zone, buffer zone and core zone, respectively. The area of recovering patches was 4567.68 ha, accounting for 44.17% of XPNR. The managed patches area was 385.98 ha, and accounting for 3.73% of XPNR, which mainly distributed in experimental zone. Hence, the non-managed patches (include natural patches and recovering patches) area accounted for 96.27% of XPNR, has high ecological integrity and originality, and good ecological quality.
Figure 3.
Result of naturalness class in the XPNR.
Figure 3.
Result of naturalness class in the XPNR.
3.3. Landscape Pattern Indices Analysis
The landscape pattern indices of the nature reserve and three functional zone were shown in
Table 3. According to the result, the experimental zone had a largest PD value, and MPS value. In contrast, the core zone had smallest value of PD and MPS. Hence, from experimental zone to core zone, a decrease in patch density and increase in mean patch size of landscape patch, indicated that landscape fragmentation along the functional zone had been reduced. Both the experimental zone and the core area had relatively high LPI index, while the buffer zone and the entire nature reserve had relatively low LPI, indicated that both the experimental area and the core area had strong landscape dominance, but not for buffer zone. The dominant landscape of the experimental zone was DBLF, while the core zone was MEDBLF. A low variation of MSI among the three functional zone, indicated that a low landscape shape heterogeneity in XPNR. A special high value of AWMPFD and CONTAG value in experimental zone, indicated the anthropogenic impacts relative to other functional zones.
From the entire nature reserve, the PD and LPI value was small, but the MPS value was large, indicated that the degree of landscape fragmentation was low and the distribution of the different patch types was relatively uniform. Moreover, the MSI value was high, but the AWMPFD value was relatively low, which indicated that the complexity degree of the patches was high and the anthropogenic activities in XPNR was small. In addition, the CONTAG value was the highest, indicated the strong connection between different landscape types.
3.4. Landscape Pattern Index of Important Landscape Types in Each Functional Area
The results of the landscape pattern index analysis for the important landscape types in different functional zones of XPNR: EBLF, MEDBLF, DBLF, MCBLF, NCF were shown in
Table 4. According to the result, the entire nature reserve includes the experiment zone and buffer zone, the PD value for EBLF were large but other important landscape types were small, but the opposite for the MPS. In the same times, the MPS value of MEDBLF and the MSI of NCF were largest in all functional zone and the entire nature reserve. But there were relatively equally large LPI value for all important landscape types in all functional zone and the entire nature reserve. Finally, the two kinds of landscape fractal indices MPS and AWMPFD were relatively high, indicated that a high complexity of patch shapes and less intervention by anthropogenic activities for the nature reserve.
4. Discussion
4.1. The Ecological Integrity of XPNR
The construction and evaluation of nature reserves is the basis for realizing the scientific protection and rational utilization of regional natural resources and biodiversity [
30,
31]. Evaluation the ecological integrity of a nature reserve is an important field of ecological quality and conservation effectiveness of protected areas [
19]. In this research, we used a set of landscape ecological integrity method to quantitative assessment the integrity and authenticity of XPNR ecosystems. The result show that the natural ecosystem of XPNR generally maintains good integrity and authenticity. Compared to the different functional zone of the nature reserve as the degree of fragmentation and anthropogenic activities, and ranked from largest to smallest: experimental zone > buffer zone > core zone. This rank shown that the functional regionalization was consistent with the protection and utilization objectives of the nature reserve.
In general, the core zone is an ecosystem in a nature reserve that has been preserved in its natural state, or an area where there is hope for the gradual restoration into a natural ecosystem, with a strictly managed [
1,
18]. In XPNR, the core zone was located in the eastern of the XPNR, accounting for about 30.5% area of the whole nature reserve. The dominant landscapes of the core zone were MEDBLF, DBLF, and MCBLF. All of those dominant landscape types were in the process of succession, and their succession climax is EBLF. But this zone with a smallest of PD and largest of MPS through the nature reserve, it was the smallest degree of fragmentation and the most complete zone. With conservation management enforced, this zone will be evolved into the highest naturalness and ecosystem services zone [
23,
32].
In contrast, the buffer zone was more densely populated than the core zone, and has a highway passing through it. The MSI value of the buffer zone is lower than that of the core zone, and the originality and integrity were worse than the core zone. The MSI value was relatively high in the nature reserve, which is due to the fact that the site has adopted some effective protection measures [
33]. Similarly, the forest landscape was also very neatly organized into a piece, so the ecological quality of the buffer zone has also been maintained at a relatively good level [
12]. The ecological quality of the buffer zone was also maintained at a relatively good level [
2,
33], which could be satisfied to the requirements for the survival of rare and endangered plants and animals in the area, such as
Machilus thunbergii ,
Bretschneidera sinensis,
Neofelis nebulosa,
Manis pentadactyla, etc.
The experimental zone accounted for 46.3% of the area of the XPNR, which distributed a large number of DBLF and NCF. Its PD was the smallest compared to the other functional areas with the largest MPS value and the small average patch area, which indicated that the experimental zone was the most serious patch fragmentation in the whole nature reserve [
18]. Among all landscape type in the experimental zone, the LPI values of both DBLF and MEDBLF were high, indicated that these two landscape types dominant vegetation types. Their MSI values were the smallest compared to other functional zones, indicated that the degree of perceived disturbance was high and the original integrity of the experimental area was not as good as that of other areas [
25]. Because NCF and broadleaf forests have relatively strong environmental adaptability and expansion ability among various landscape types, their constantly expand to the areas where other vegetation types were located, making the boundary divided by other elements of the patch become irregular in shape, and the patches are complex and diversified, the experimental area is not as good as other areas. The highest AWMPFD value was found in the experimental area [
26]. It is also because of this strong adaptive ability of extension and little interference by human factors that it is easy to promote the interaction between vegetation and external environment, which makes the connectivity between different landscape patches in the experimental area good and the CONTAG value high.
4.2. Implication for the Protected Area Management
The protection goals of XPNR include whole-ecosystem protection, natural resources conservation, ecosystem balance maintaining, etc. As the evaluation of ecological integrity of XPNR based on landscape ecological principle, the ecosystem integrity of the nature reserve was good, which was not far from the protection target requirements of the nature reserve. The naturalness class of the XPNR shown in recovering level, with less anthropogenic interference, and the natural forest vegetation was in the middle or late stage of succession. Although a few of human-modified ecosystem and a weak of human activities was existed in experimental zone, the ecological integrity was good because of the low degree of landscape fragmentation and excellent landscape connectivity. Compared with experimental zone, the buffer zone and core zone were the zones with relatively high conservation strength, so that the ecological integrity were relatively high.
As the naturalness of the XPNR was in recovering, the ecological quality of the nature reserve was in the middle or late stage of succession. In order to ensure the further positive development of the ecological quality of the nature reserve, the reserve needs to take the following measures to effectively maintain and improve the integrity of the ecosystem. The first, overall protection by geographical unit. Secondly, optimization of the distribution of key habitats based on their functional zoning. Thirdly, improvement of habitat connectivity, with an emphasis on mobile-connected species. And finally, assessment of the persistence of ecosystem integrity and original authenticity.
5. Conclusions
We developed an effective framework of landscape ecological integrity assessment, and used to evaluation for a mountain nature reserve in mid-subtropical region. As the evaluation result, the XPNR maintained good integrity in general, and the naturalness class of the nature reserve was in recovering level. The degree of landscape fragmentation in each functional area was as follows: core area<buffer area<experimental area, and the degree of human interference was as follows: core area<buffer area<experimental area. Based on the current status of ecological integrity of the nature reserve, we suggested that some more effectively management measures would be performed for the goal of improving ecosystem integrity. Our findings highlight that improving landscape ecological quality of the mountain nature reserve is a long-term and difficult task.
Author Contributions
Conceptualization, M.Y. and Y.L.; methodology Y.L.; software, M.Y.; investigation, M.Y.; resources, Y.L.; data curation, M.Y.; writing—original draft preparation, M.Y. and Y.L.; writing—review and editing, M.Y. and Y.L.; visualization, M.Y.; supervision, Y.L.; project administration, Y.L.; funding acquisition, Y.L. and M.Y. All authors have read and agreed to the published version of the manuscript.
Funding
This research was funded by the National Natural Science Foundation of China (32360285) and the Youth Science Fund Project in Jiangxi Province (2018BA214004).
Data Availability Statement
The data presented in this study are available in the article.
Acknowledgments
In this section, you can acknowledge any support given which is not covered by the author contribution or funding sections. This may include administrative and technical support, or donations in kind (e.g., materials used for experiments).
Conflicts of Interest
The authors declare no conflict of interest.
References
- Watson, J.; Dudley, N.; Segan, D.; Hockings, M. The performance and potential of protected areas. Nature 2014, 515, 67–73. [Google Scholar] [CrossRef]
- Zeng, Y.; Koh, L.P.; Wilcove, D.S. Gains in biodiversity conservation and ecosystem services from the expansion of the planet’s protected areas. Sci. Adv. 2022, 8, eabl9885. [Google Scholar] [CrossRef] [PubMed]
- Zhang, L.; Luo, Z.; Mallon, D.; Li, C.; Jiang, Z. Biodiversity conservation status in China's growing protected areas. Biol. Conserv. 2017, 210, 89–100. [Google Scholar] [CrossRef]
- Rahbek, C.; Borregaard, M.K.; Antonelli, A.; Colwell, R.K.; Holt, B.G.; Nogues-Bravo, D.; Rasmussen, C.M.Ø.; Richardson, K.; Rosing, M.T.; Whittaker, R.J.; Fjeldså, J. Building mountain biodiversity: geological and evolutionary processes. Science 2019, 365, 1114–1119. [Google Scholar] [CrossRef]
- He, M.; Cliquet, A. Challenges for protected areas management in China. Sustainability 2020, 12, 5879. [Google Scholar] [CrossRef]
- Theobald, D.M. A general model to quantify ecological integrity for landscape assessments and US application. Landscape Ecol. 2013, 28, 1859–1874. [Google Scholar] [CrossRef]
- González, C. Evolution of the concept of ecological integrity and its study through networks. Ecol. Model. 2023, 476, 110224. [Google Scholar] [CrossRef]
- Karr, J.R.; Larson, E.R.; Chu, E.W. Ecological integrity is both real and valuable. Conserv. Sci. Pract. 2022, 4, e583. [Google Scholar] [CrossRef]
- Ohsawa, T. How are ecosystem services related to biodiversity and ecological integrity in each site under climate change? Ecol. Res. 2022, 37, 461–465. [Google Scholar] [CrossRef]
- Han, J.; Wang, D.; Zhang, S. Momoge Internationally Important Wetland: Ecosystem Integrity Remote Assessment and Spatial Pattern Optimization Study. Land 2022, 11, 1344. [Google Scholar] [CrossRef]
- Rosenfield, M.F.; Jakovac, C.C.; Vieira, D.L.M.; Poorter, L.; Brancalion, P.H.S.; Vieira, I.C.G.; de Almeida, D.R.A.; Massoca, P.; Schietti, J.; Albernaz, A.L.M.; Ferreira, M.J.; Mesquita, R.C.G. Ecological integrity of tropical secondary forests: concepts and indicators. Biol. Rev. 2023, 98, 662–676. [Google Scholar] [CrossRef]
- Jia, H.; Luo, P.; Yang, H.; Luo, C.; Li, H.; Wu, S.; Cheng, Y.; Huang, Y.; Xie, W. Exploring the relationship between forest scenic beauty with color index and ecological integrity: case study of Jiuzhaigou and Giant Panda National Park in Sichuan, China. Forests 2022, 13, 1883. [Google Scholar] [CrossRef]
- Brown, E.; Williams, B. Ecological integrity assessment as a metric of biodiversity: are we measuring what we say we are? Biodivers. Conserv. 2016, 25, 1011–1035. [Google Scholar] [CrossRef]
- Lõhmus, A.; Pass, E.; Margus, P. Distribution of grouse and their predators in peatland forest landscapes: A case for ecological integrity. Forest Ecol. Manag. 2023, 546, 121332. [Google Scholar] [CrossRef]
- Manolaki, P.; Chourabi, S.; Vogiatzakis, I.N. A rapid qualitative methodology for ecological integrity assessment across a Mediterranean island's landscapes. Ecol. Complex. 2021, 46, 100921. [Google Scholar] [CrossRef]
- Wurtzebach, Z.; Schultz, C. Measuring ecological integrity: history, practical applications, and research opportunities. BioScience 2016, 66, 446–457. [Google Scholar] [CrossRef]
- Shi, Y.; Wang, N.; Li, T.; Wang, H.; Kang, H.; Shi, X. Evaluation of Landscape Ecological Integrity in the Yulin Region, China. Sustainability 2018, 10, 4300. [Google Scholar] [CrossRef]
- Parrish, J.D.; Braun, D.P.; Unnasch, R.S. Are we conserving what we say we are? measuring ecological integrity within protected areas. BioScience 2003, 53, 851–860. [Google Scholar]
- Walston, L.J.; Hartmann, H.M. Development of a landscape integrity model framework to support regional conservation planning. Plos One 2018, 13, e0195115. [Google Scholar] [CrossRef] [PubMed]
- Wang, N.; Cheng, W.; Wang, B.; Liu, Q.; Zhou, C. Geomorphological regionalization theory system and division methodology of China. J. Geogr. Sci. 2020, 30, 212–232. [Google Scholar] [CrossRef]
- Holt, B.G.; Lessard, J.P.; Borregaard, M.K.; Fritz, S.A.; Araújo, M.B.; Dimitrov, D.; Fabre, P.-H.; Graham, C.H.G.; Graves, G.R.; Jønsson, K.A.; Nogués-bravo, D.; Wang, Z.; Whittaker, R.J.; Fjeldså, J.; Rahbek, C. An update of wallace’s zoogeographic regions of the world. Science, 2013, 339, 74–78. [Google Scholar] [CrossRef]
- Gao, E.; He, J.; Wang, Z.; Xu, Y.; Tang, X.; Jiang, H. China’s zoogeographical regionalization based on terrestrial vertebrates. Biodiv. Sci. 2017, 25, 1321–1330. [Google Scholar] [CrossRef]
- Põldveer, E.; Korjus, H.; Kiviste, A.; Kangur, A.; Paluots, T.; Laarmann, D. Assessment of spatial stand structure of hemiboreal conifer dominated forests according to different levels of naturalness. Ecol. Indic. 2020, 110, 105944. [Google Scholar] [CrossRef]
- Bender, D.J.; Contreras, T.A.; Fahrig, L. Habitat loss and population decline: a meta-analysis of the patch size effect. Ecology, 1998, 79, 517–533. [Google Scholar] [CrossRef]
- Park, Y.; Guldmann, J.-M. Measuring continuous landscape patterns with gray-level co-occurrence matrix (GLCM) indices: An alternative to patch metrics? Ecol. Indic. 2020, 109, 105802. [Google Scholar] [CrossRef]
- Flowers, B.; Huang, K.-T.; Aldana, G.O. Analysis of the habitat fragmentation of ecosystems in belize using landscape metrics. Sustainability 2020, 12, 3024. [Google Scholar] [CrossRef]
- Riitters, K.; Costanza, J.K.; Coulston, J.W.; Vogt, P.; Schleeweis, K. Interpreting image texture metrics applied to landscape gradient data. Landscape Ecol. 2023, 38, 2179–2188. [Google Scholar] [CrossRef]
- Yang, Z. Landscape pattern analysis of Hainan natural meadow in China based on Fragstats and thematic mapper. J. Landsc. Res. 2012, 4, 13–14. [Google Scholar]
- McGarigal, K.; Cushman, S.A.; Ene E. FRAGSTATS v4: spatial pattern analysis program for categorical and continuous maps. Computer software program produced by the authors at the University of Massachusetts, Amherst, 2012.
- Gao, J.; Wang, Y.; Zou, C.; Xu, D.; Lin, N.; Wang, L.; Zhang, K. China’s ecological conservation redline: A solution for future nature conservation. Ambio 2020, 49, 1519–1529. [Google Scholar] [CrossRef]
- Jing, Y.; Zhang, F.; He, Y.; Kung, H.; Johnson, V.C.; Arikena, M. Assessment of spatial and temporal variation of ecological environment quality in Ebinur Lake Wetland National Nature Reserve, Xinjiang, China. Ecol. Indic. 2020, 110, 105874. [Google Scholar] [CrossRef]
- Xu, B.; Zhang, Y.; Lin, W. A connectivity modeling and evaluating methodological framework in biodiversity hotspots based on naturalness and linking wilderness. Conserv. Sci. Pract. 2022, 4, e12750. [Google Scholar] [CrossRef]
- Liu, F.; Feng, C.; Zhou, Y.; Zhang, L.; Du, J.; Huang, W.; Luo, J.; Wang, W. Effectiveness of functional zones in National Nature Reserves for the protection of forest ecosystems in China. J. Environ. Manag. 2022, 308, 114593. [Google Scholar] [CrossRef] [PubMed]
|
Disclaimer/Publisher’s Note: The statements, opinions and data contained in all publications are solely those of the individual author(s) and contributor(s) and not of MDPI and/or the editor(s). MDPI and/or the editor(s) disclaim responsibility for any injury to people or property resulting from any ideas, methods, instructions or products referred to in the content. |
© 2024 by the authors. Licensee MDPI, Basel, Switzerland. This article is an open access article distributed under the terms and conditions of the Creative Commons Attribution (CC BY) license (http://creativecommons.org/licenses/by/4.0/).