Preprint
Article

Pharmacokinetics of Levofloxacin Entrapped in Non-Ionic Surfactant Vesicles (Niosomes) in Sprague Dawley Rats

Submitted:

26 December 2024

Posted:

30 December 2024

You are already at the latest version

A peer-reviewed article of this preprint also exists.

Abstract

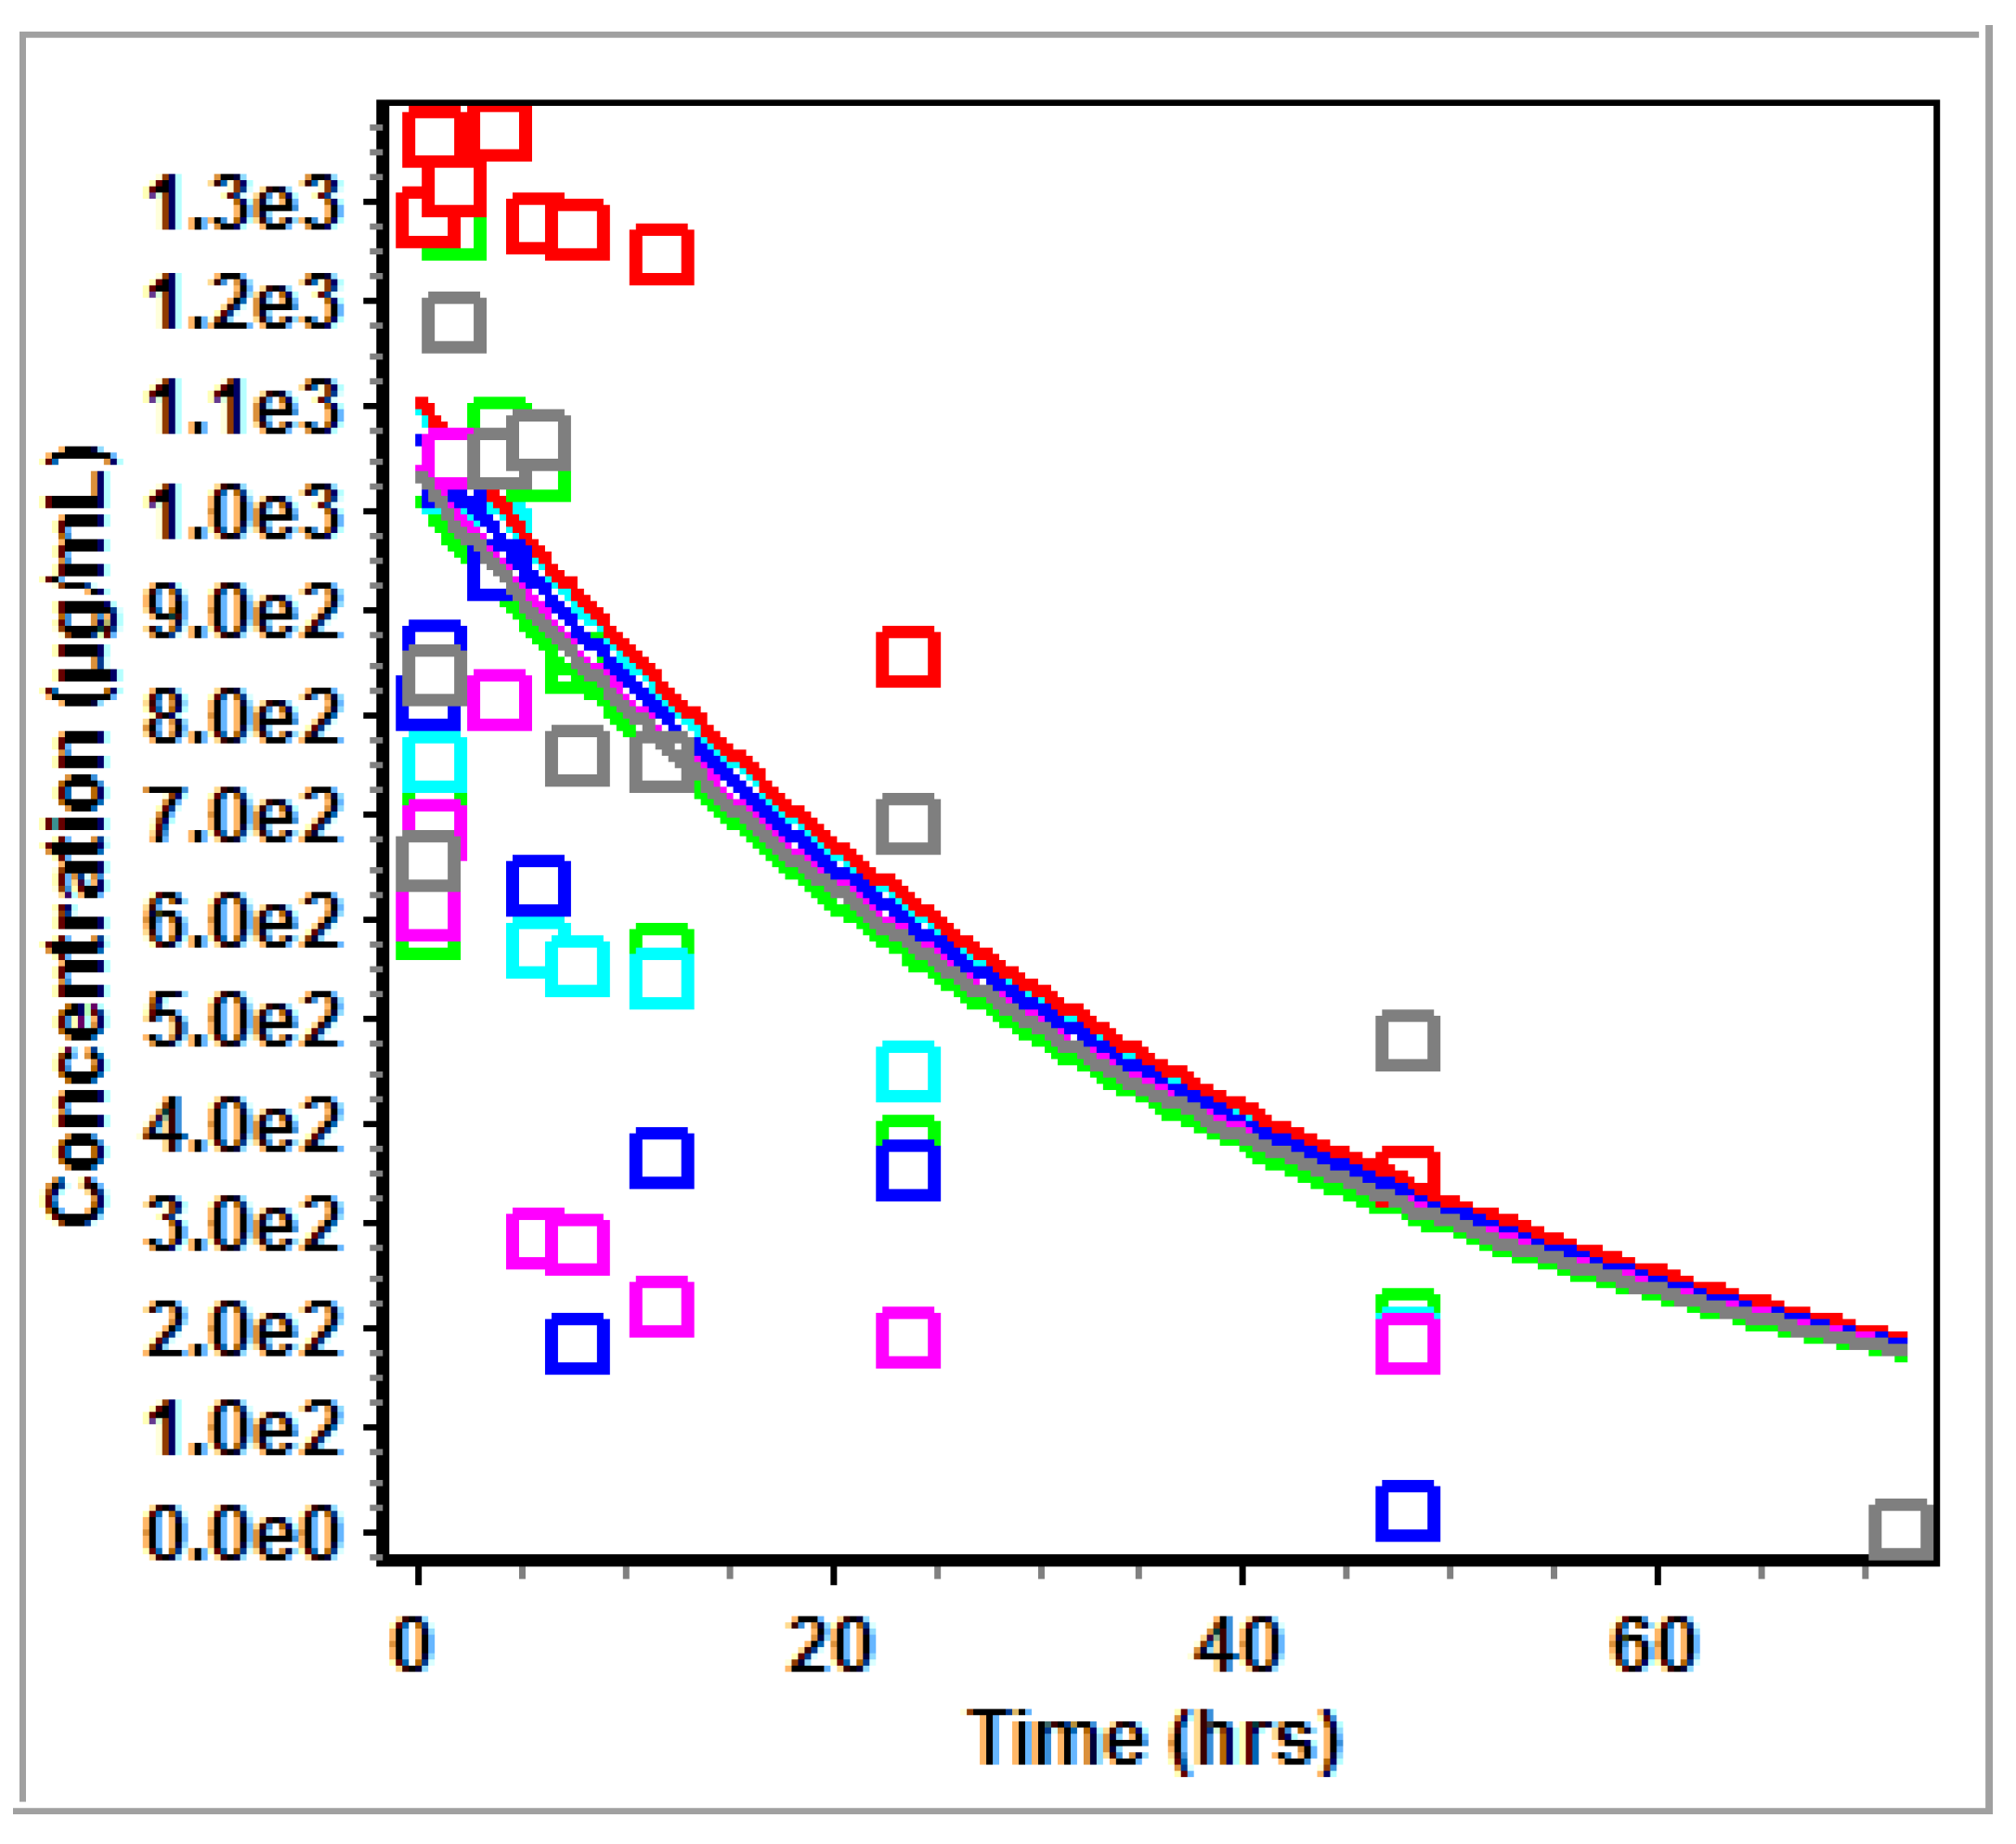
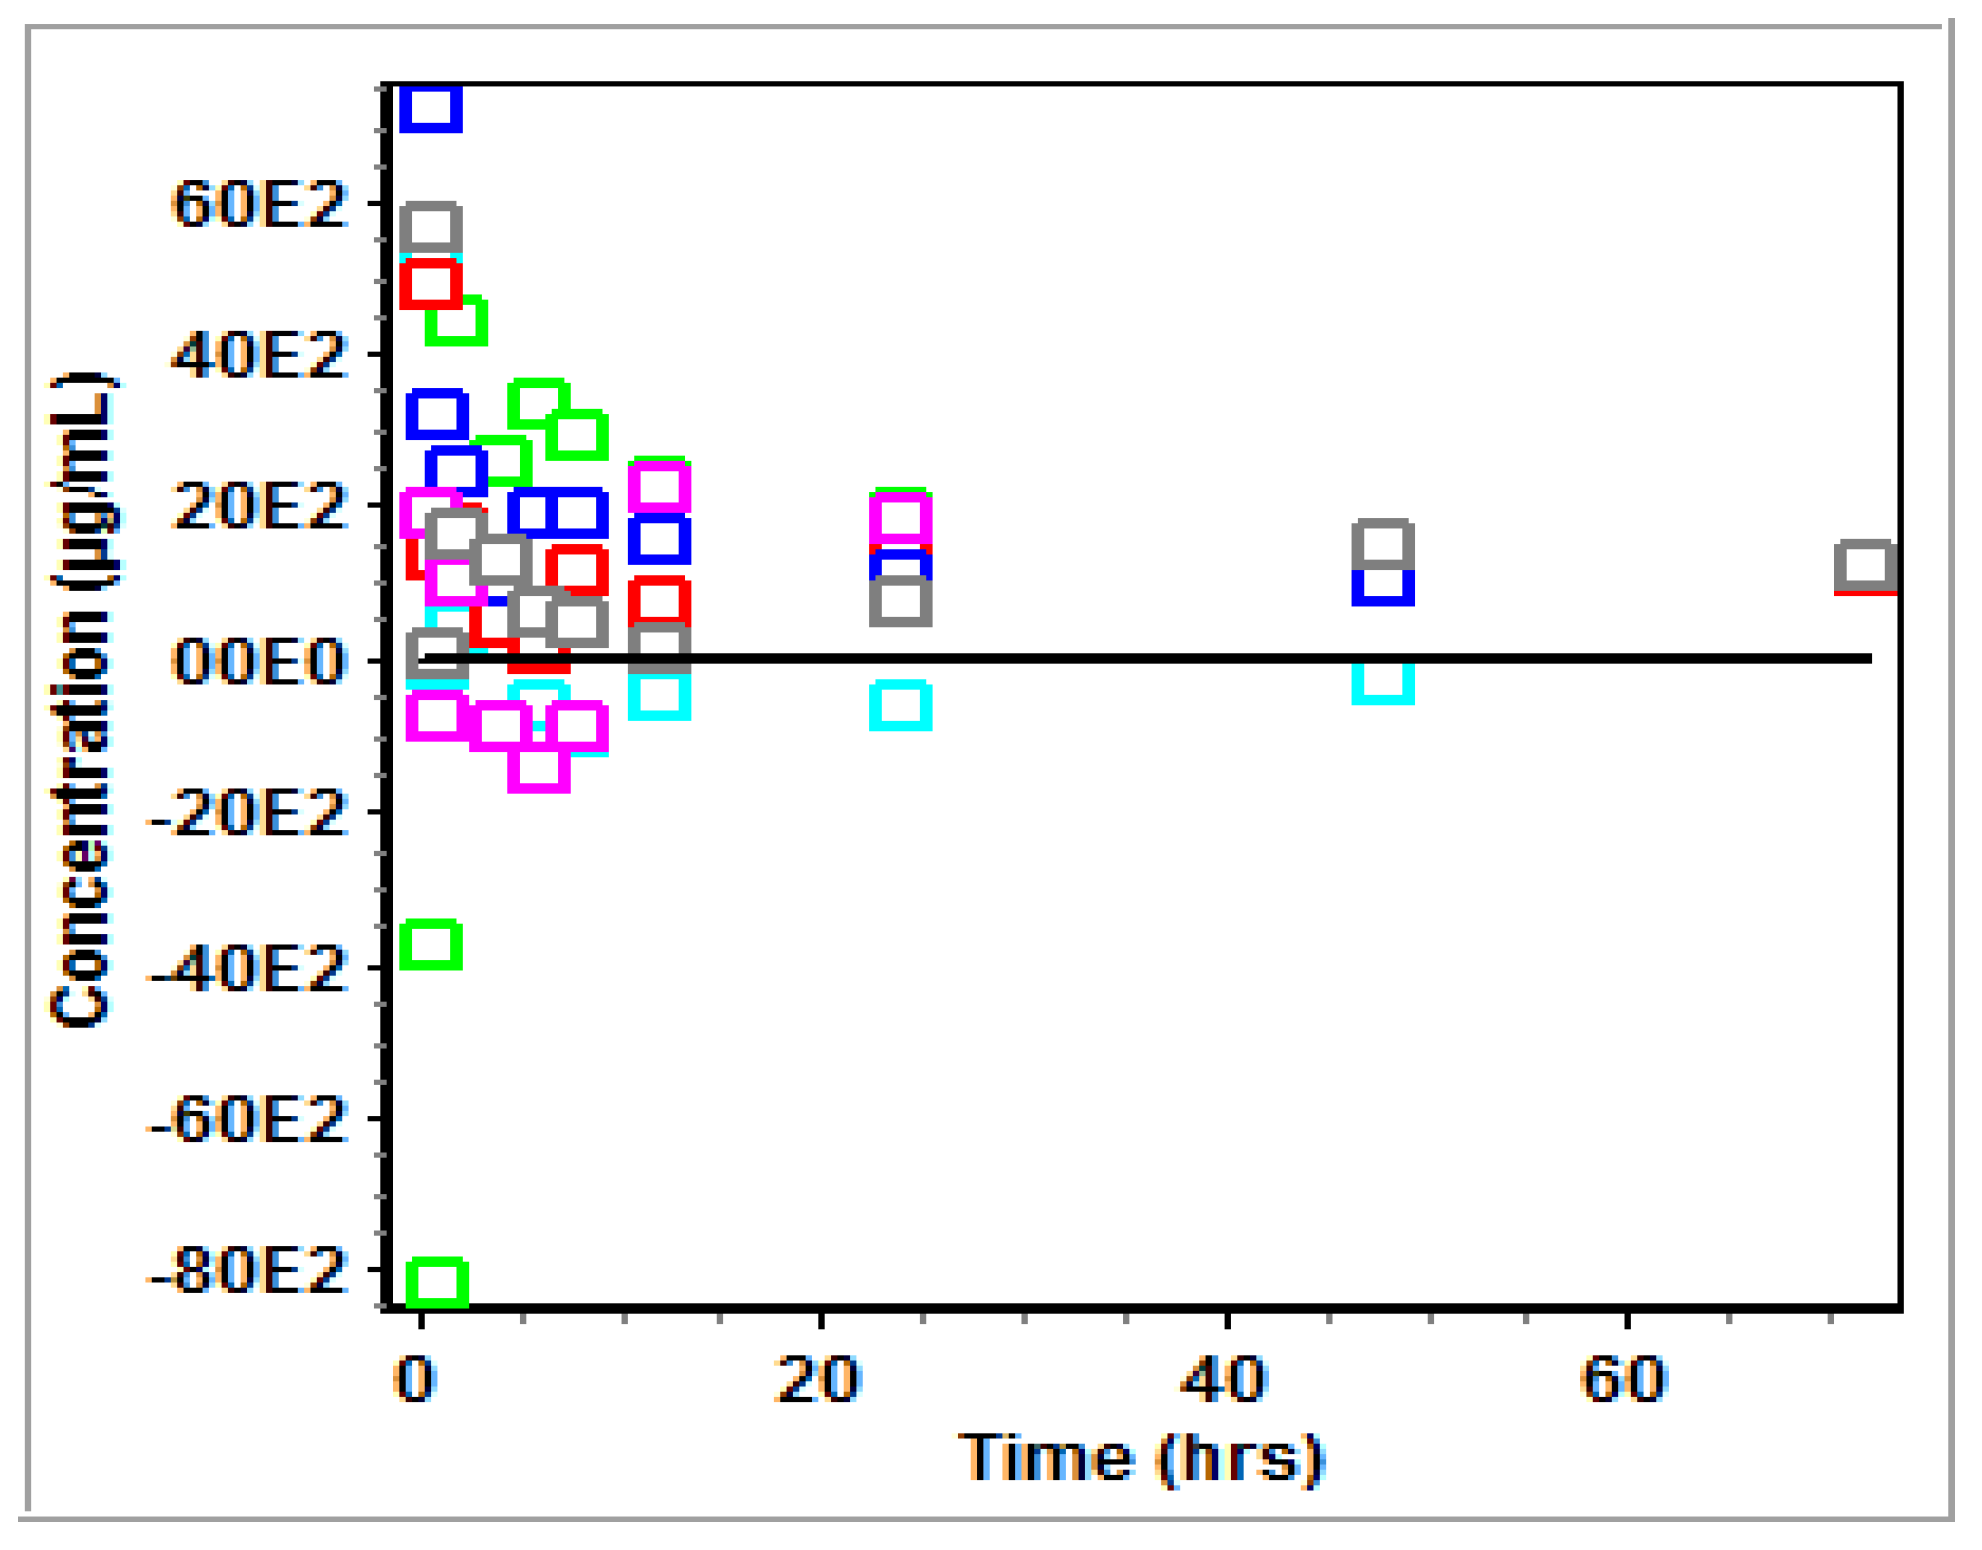
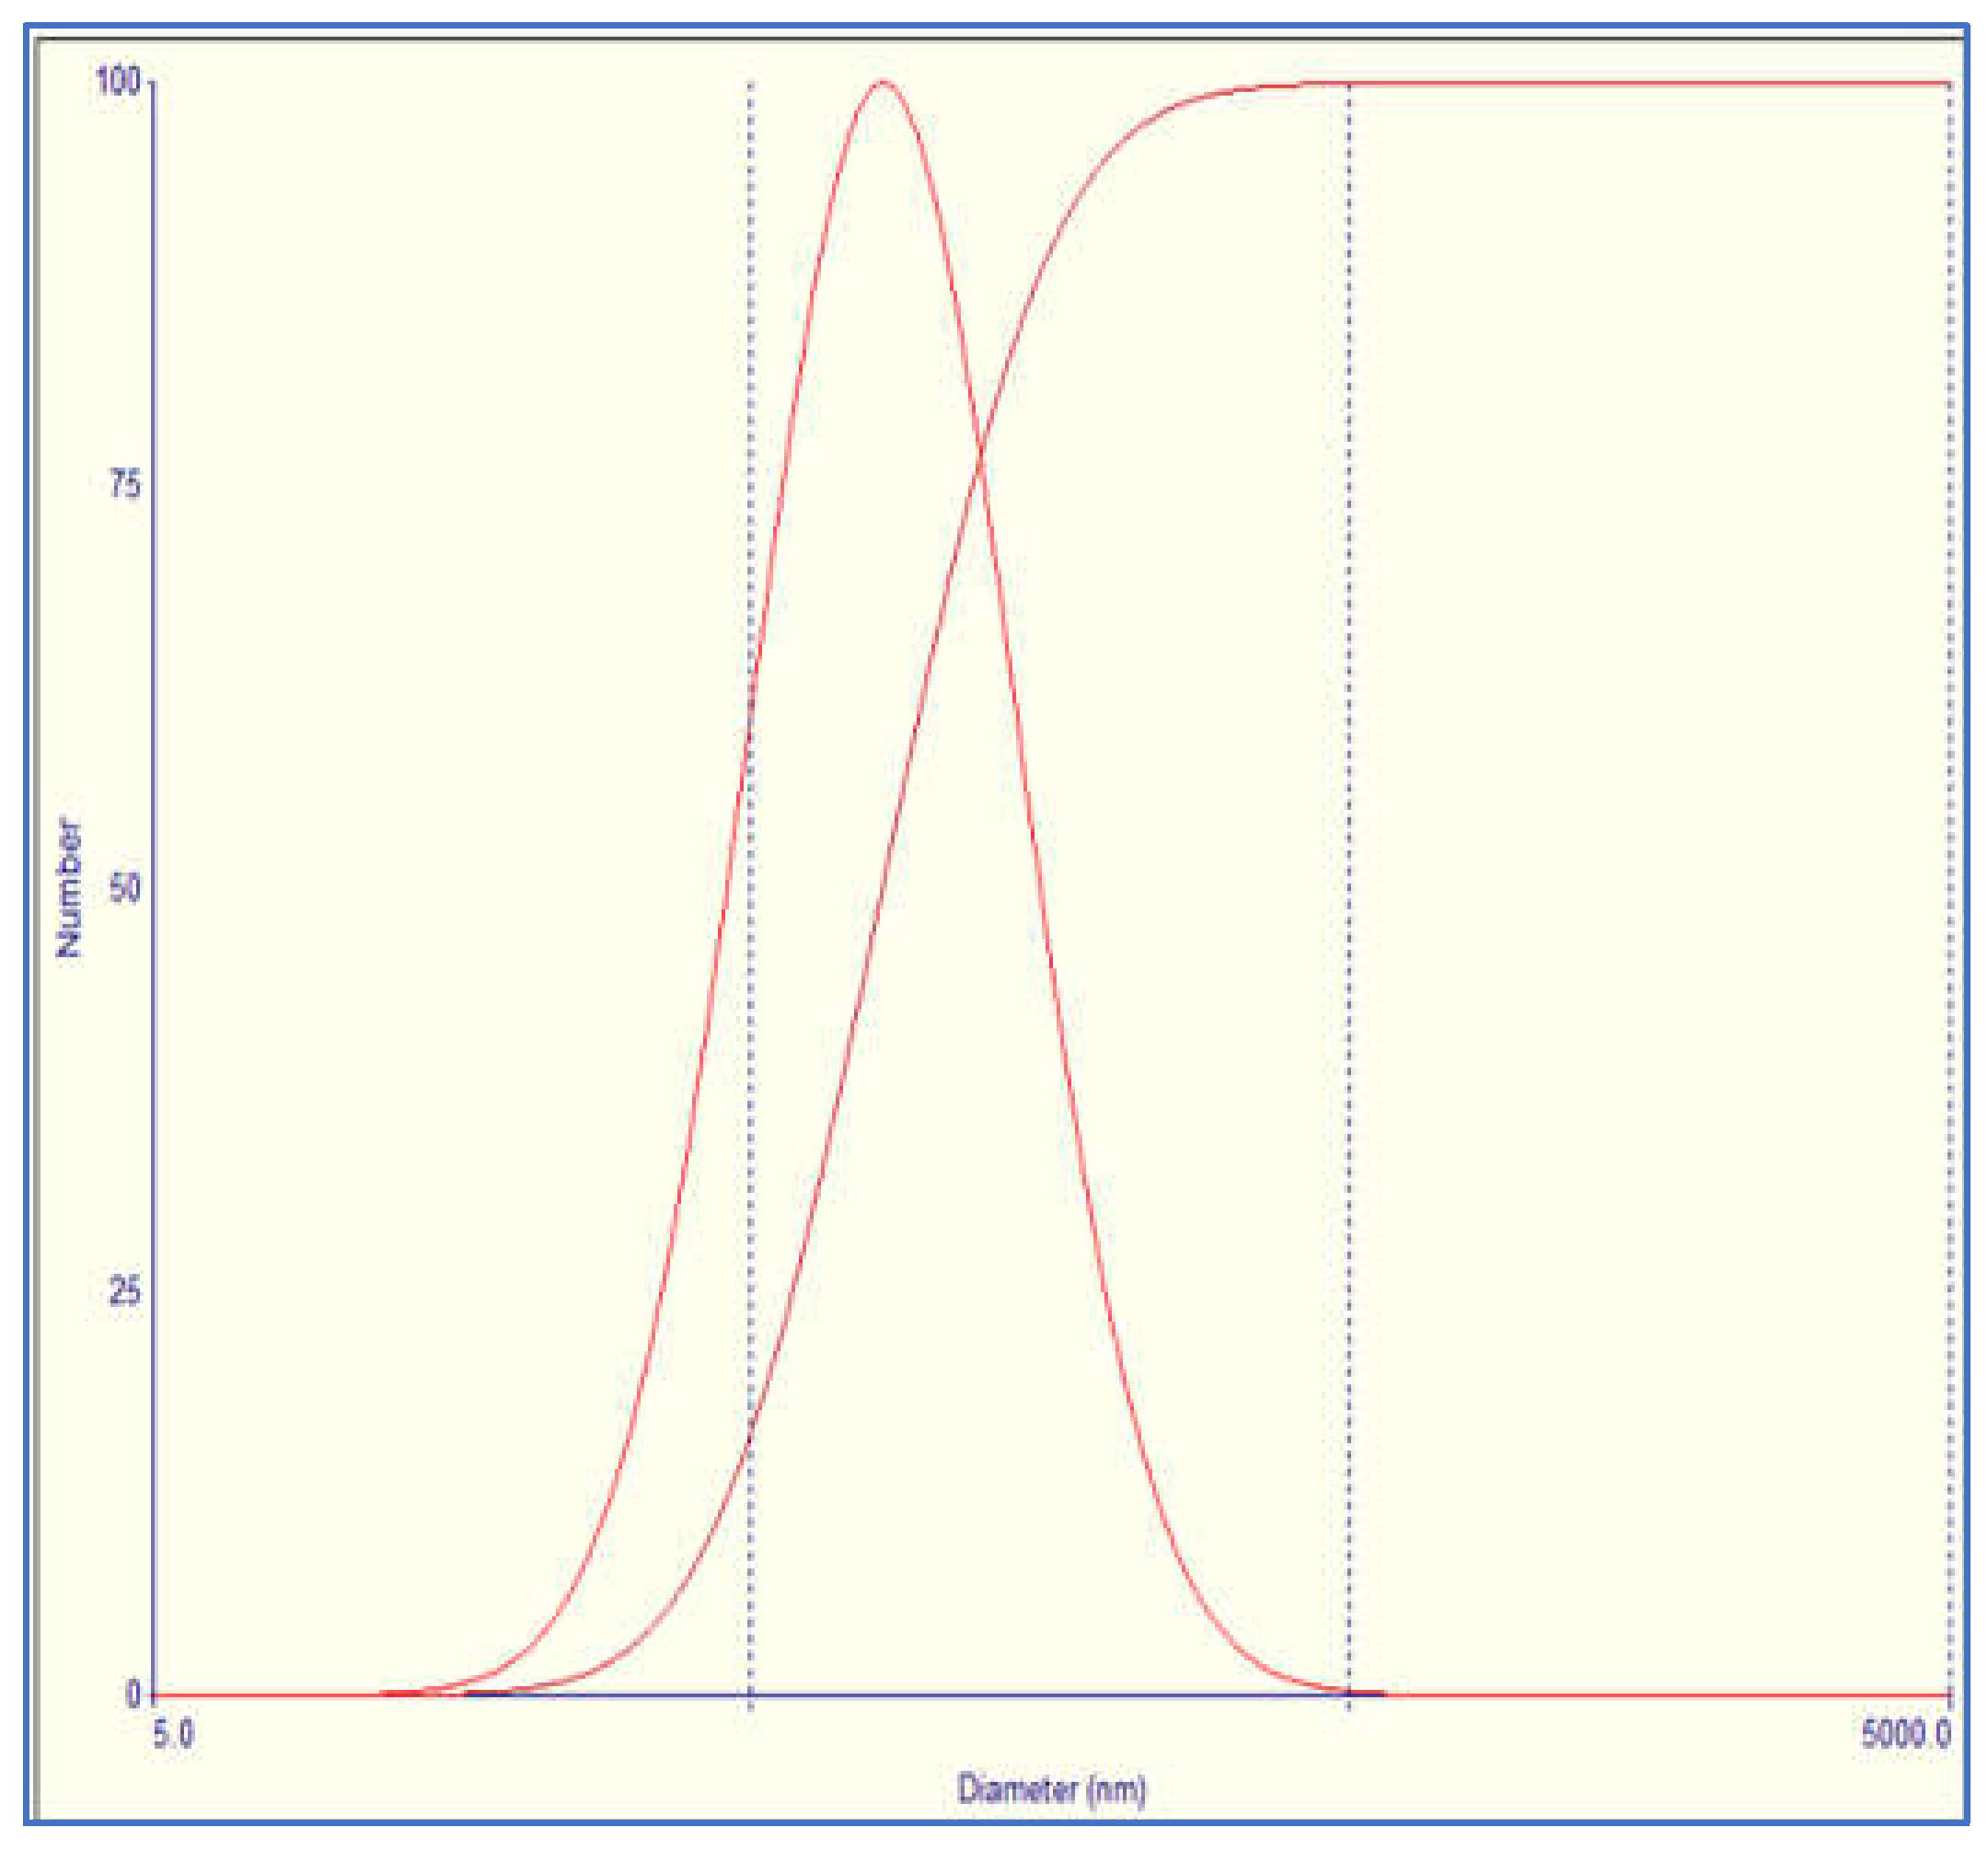
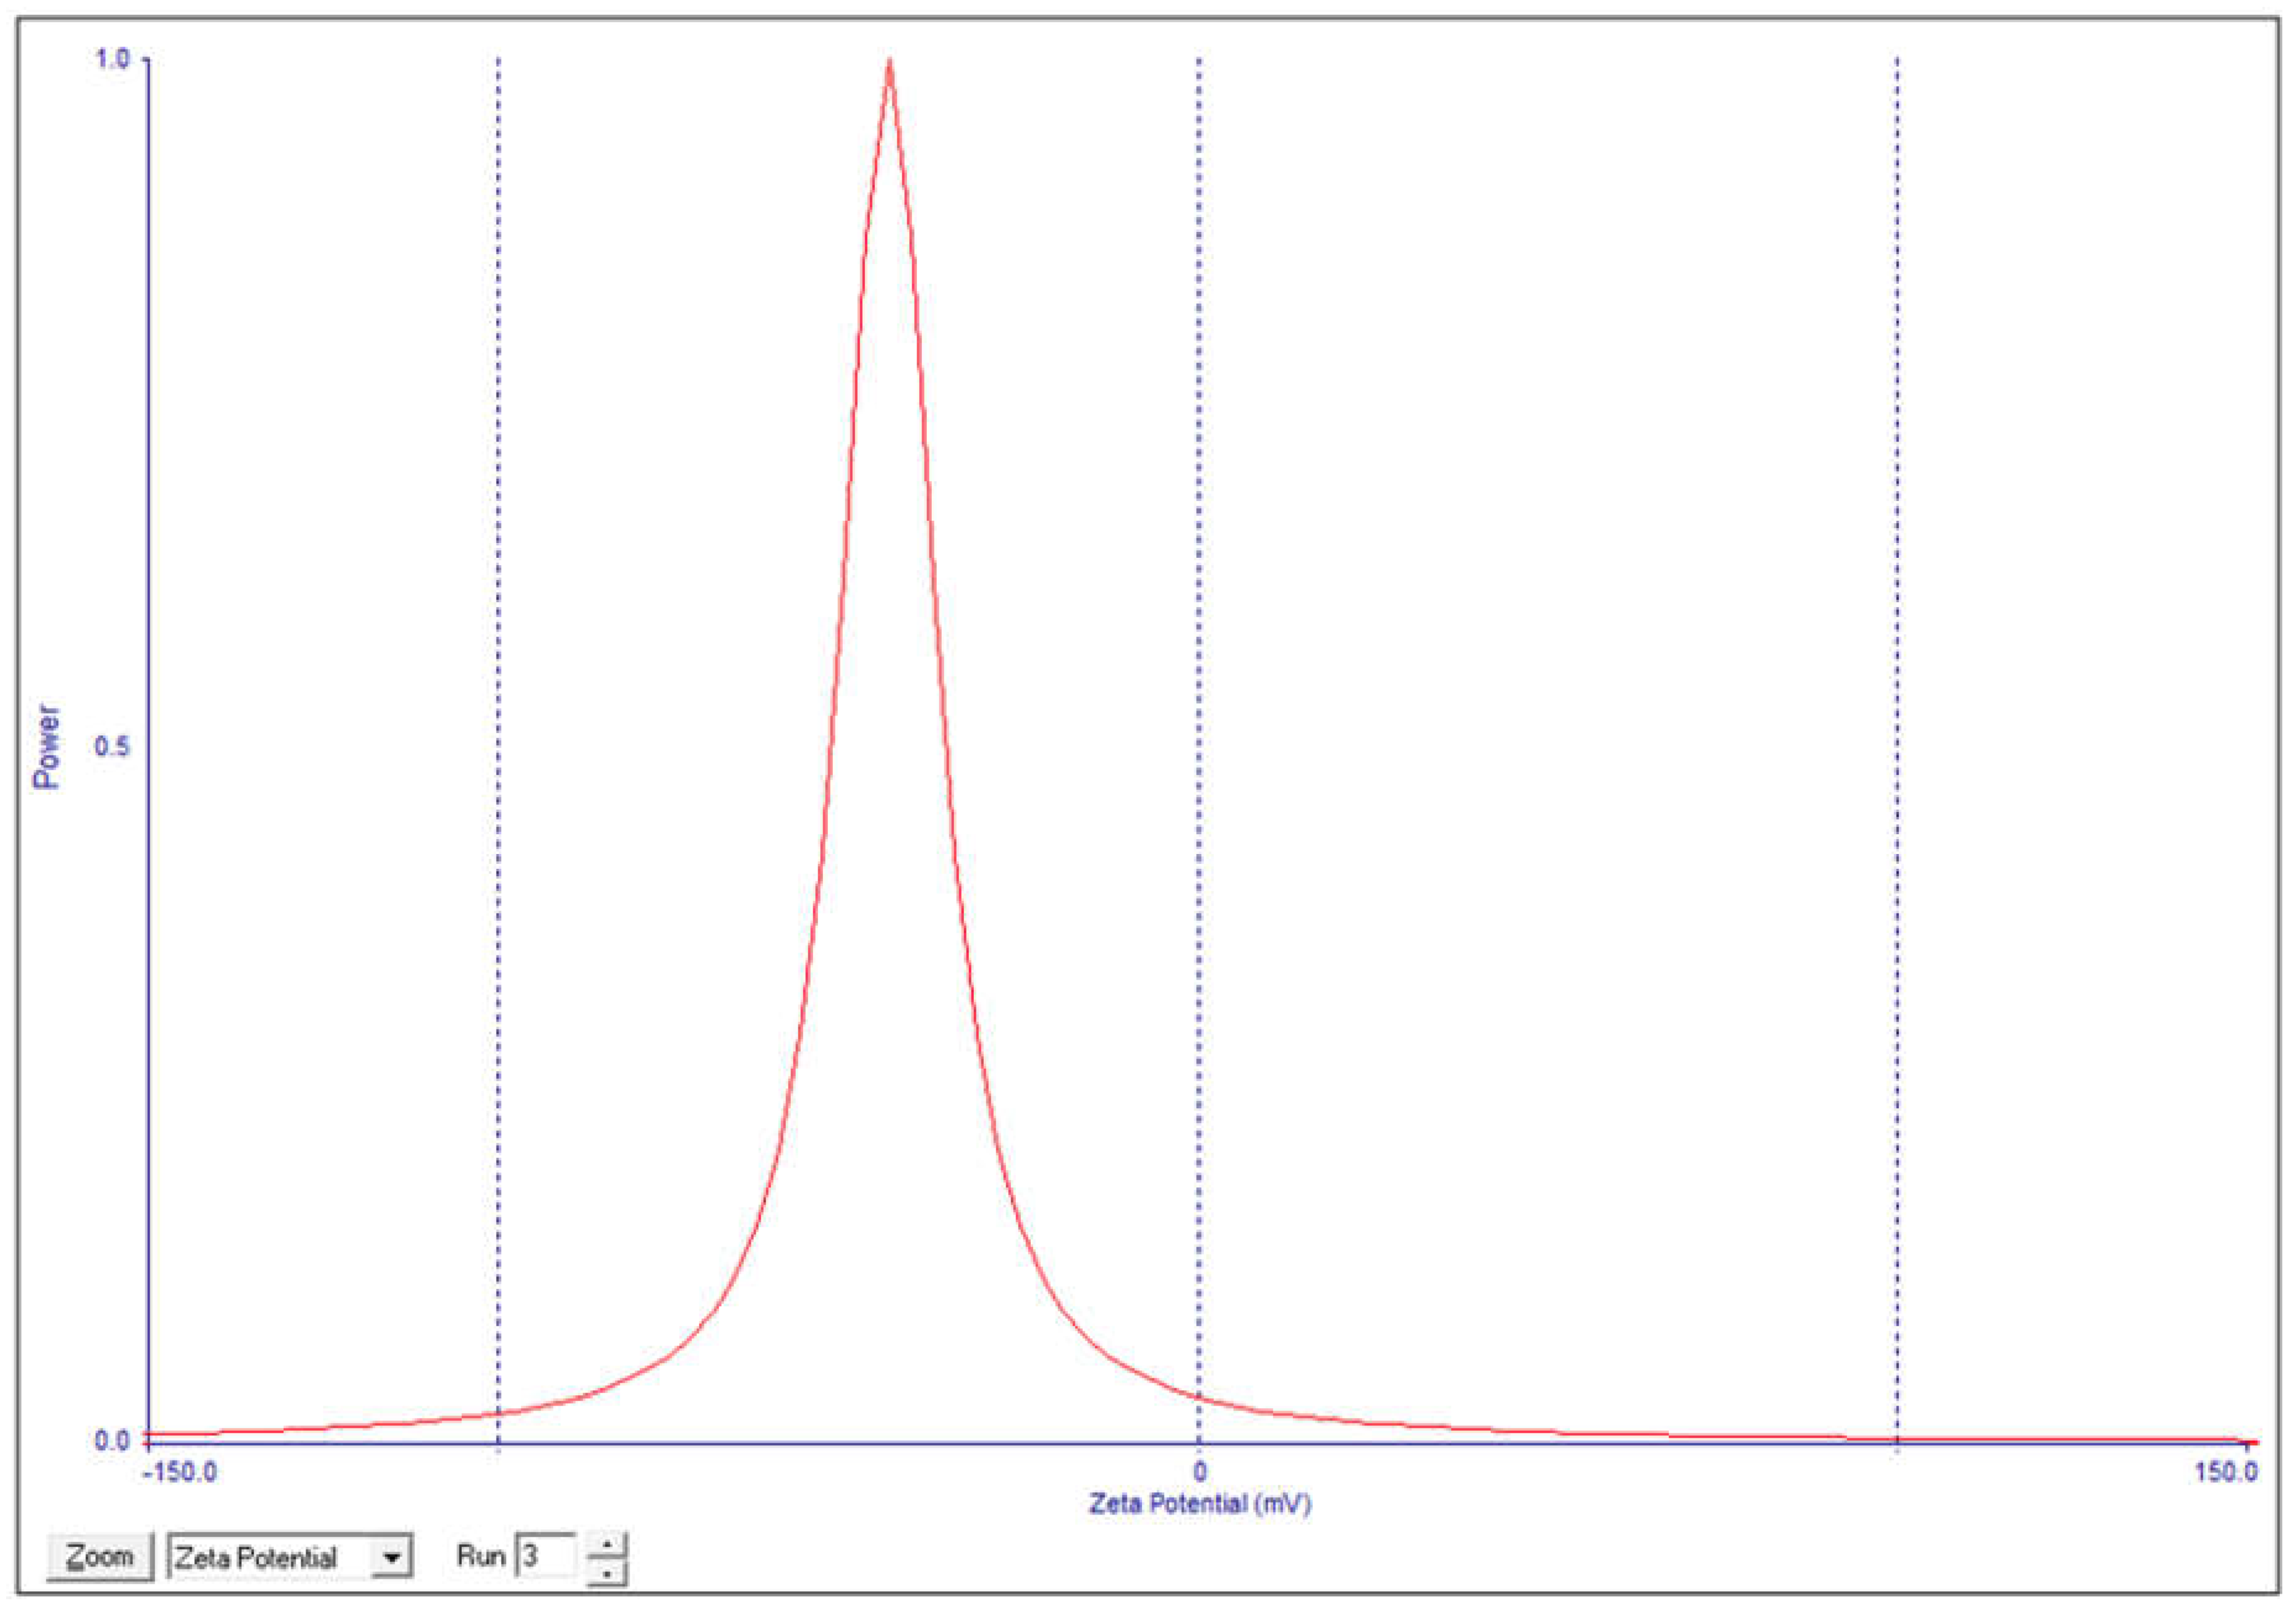
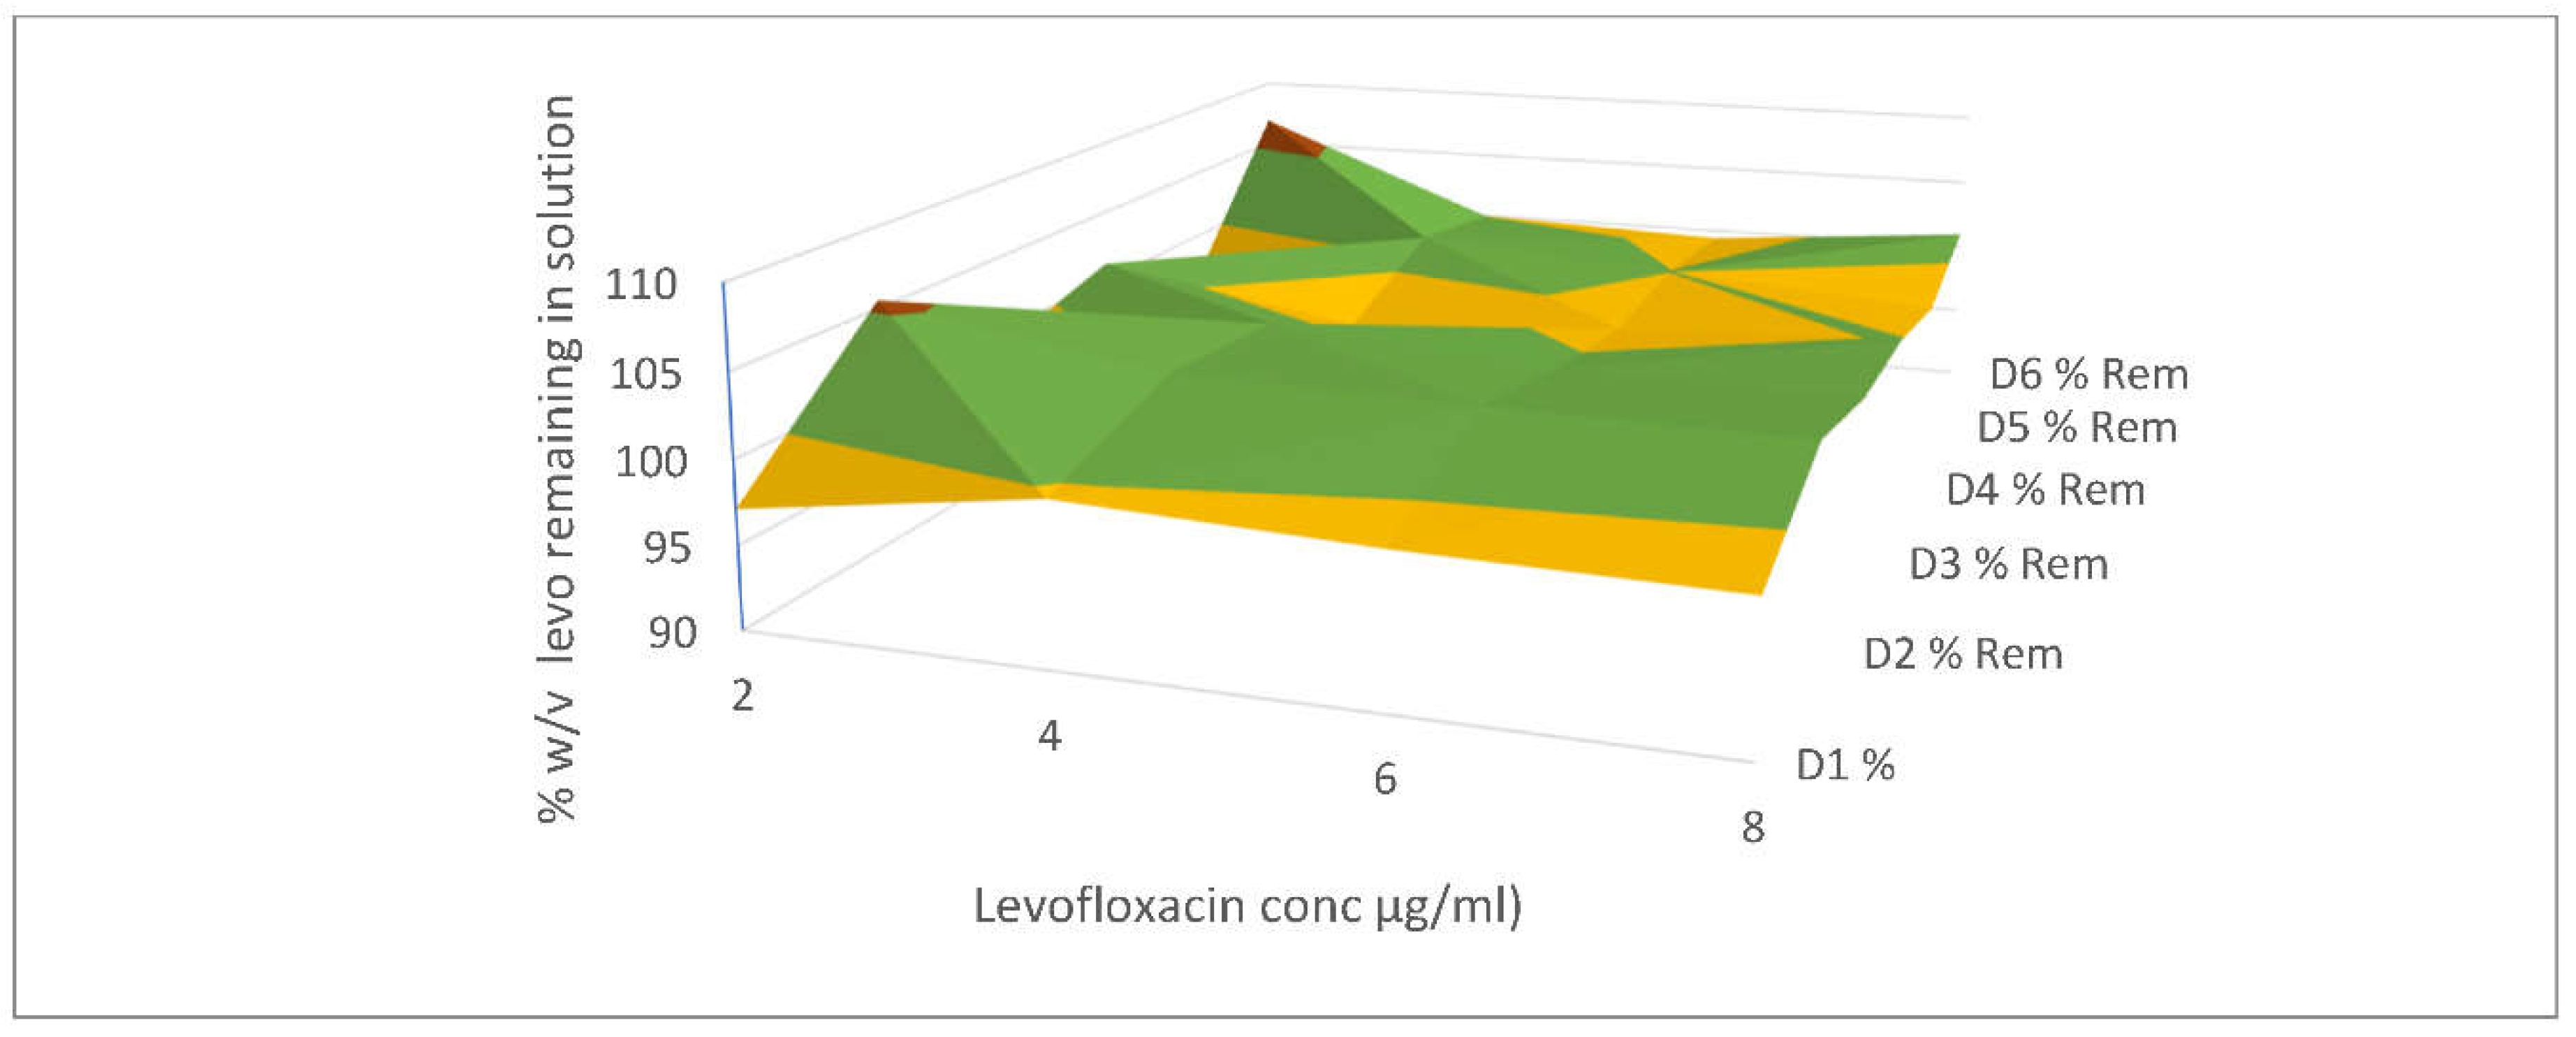
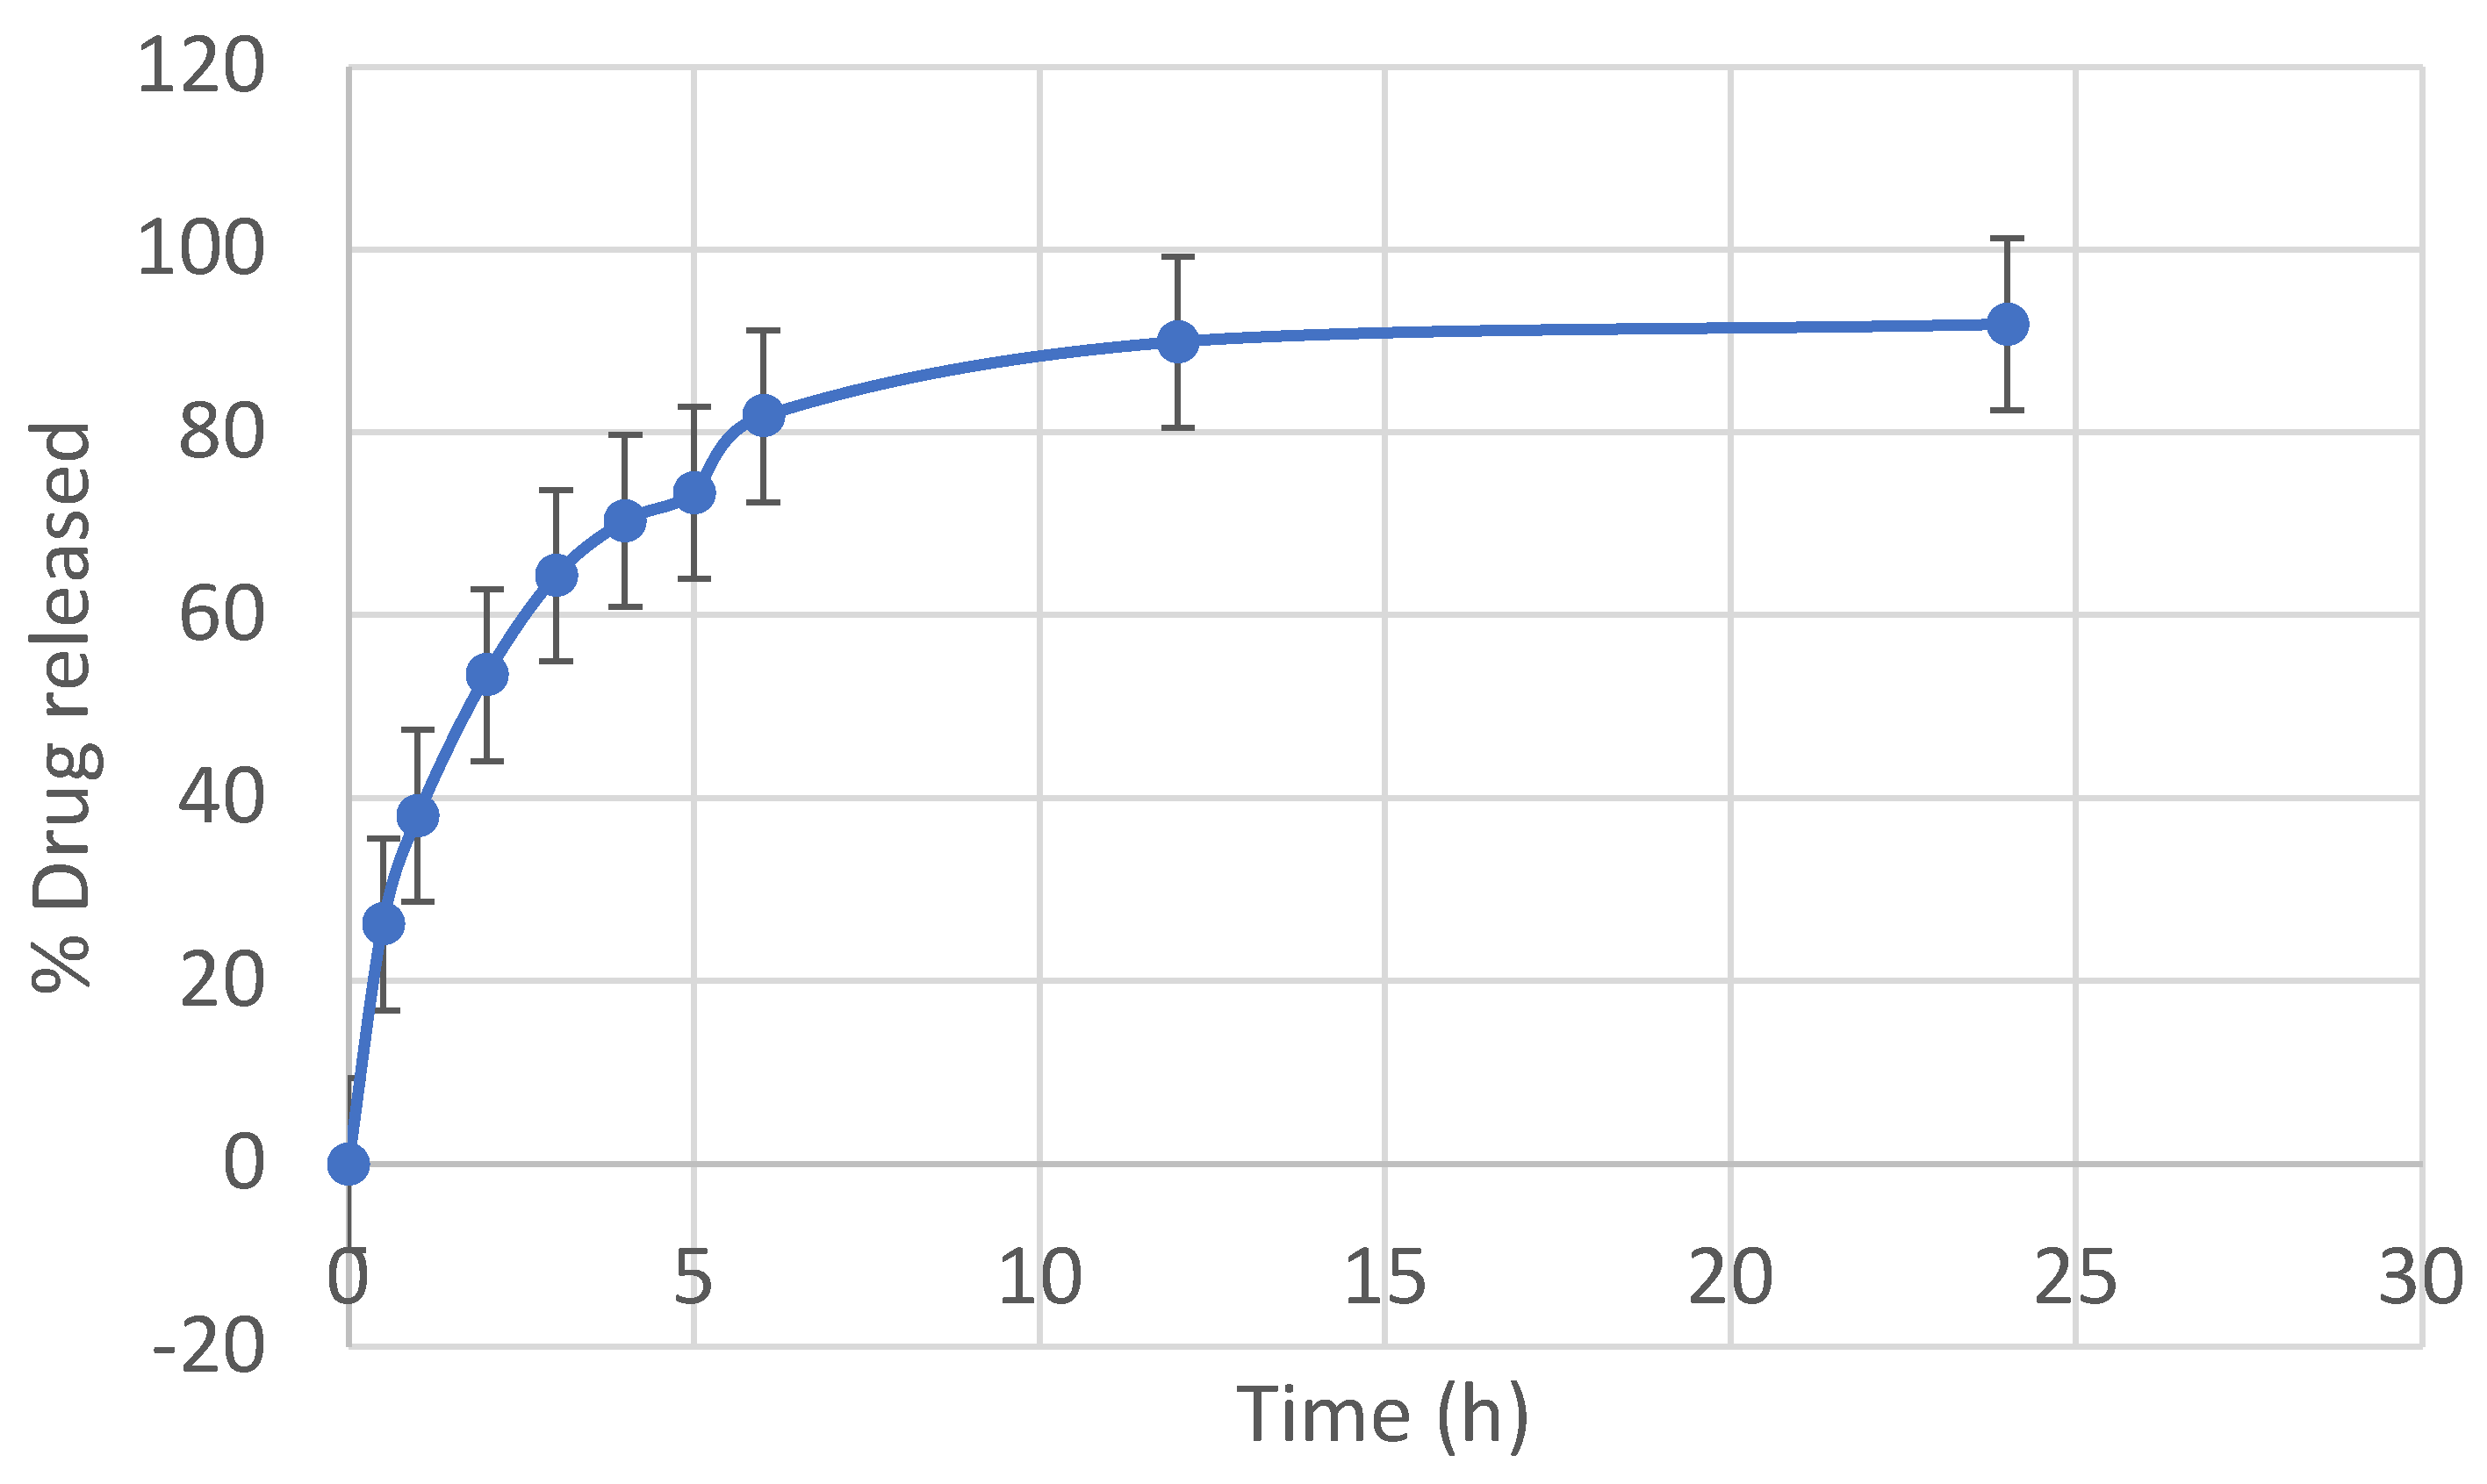
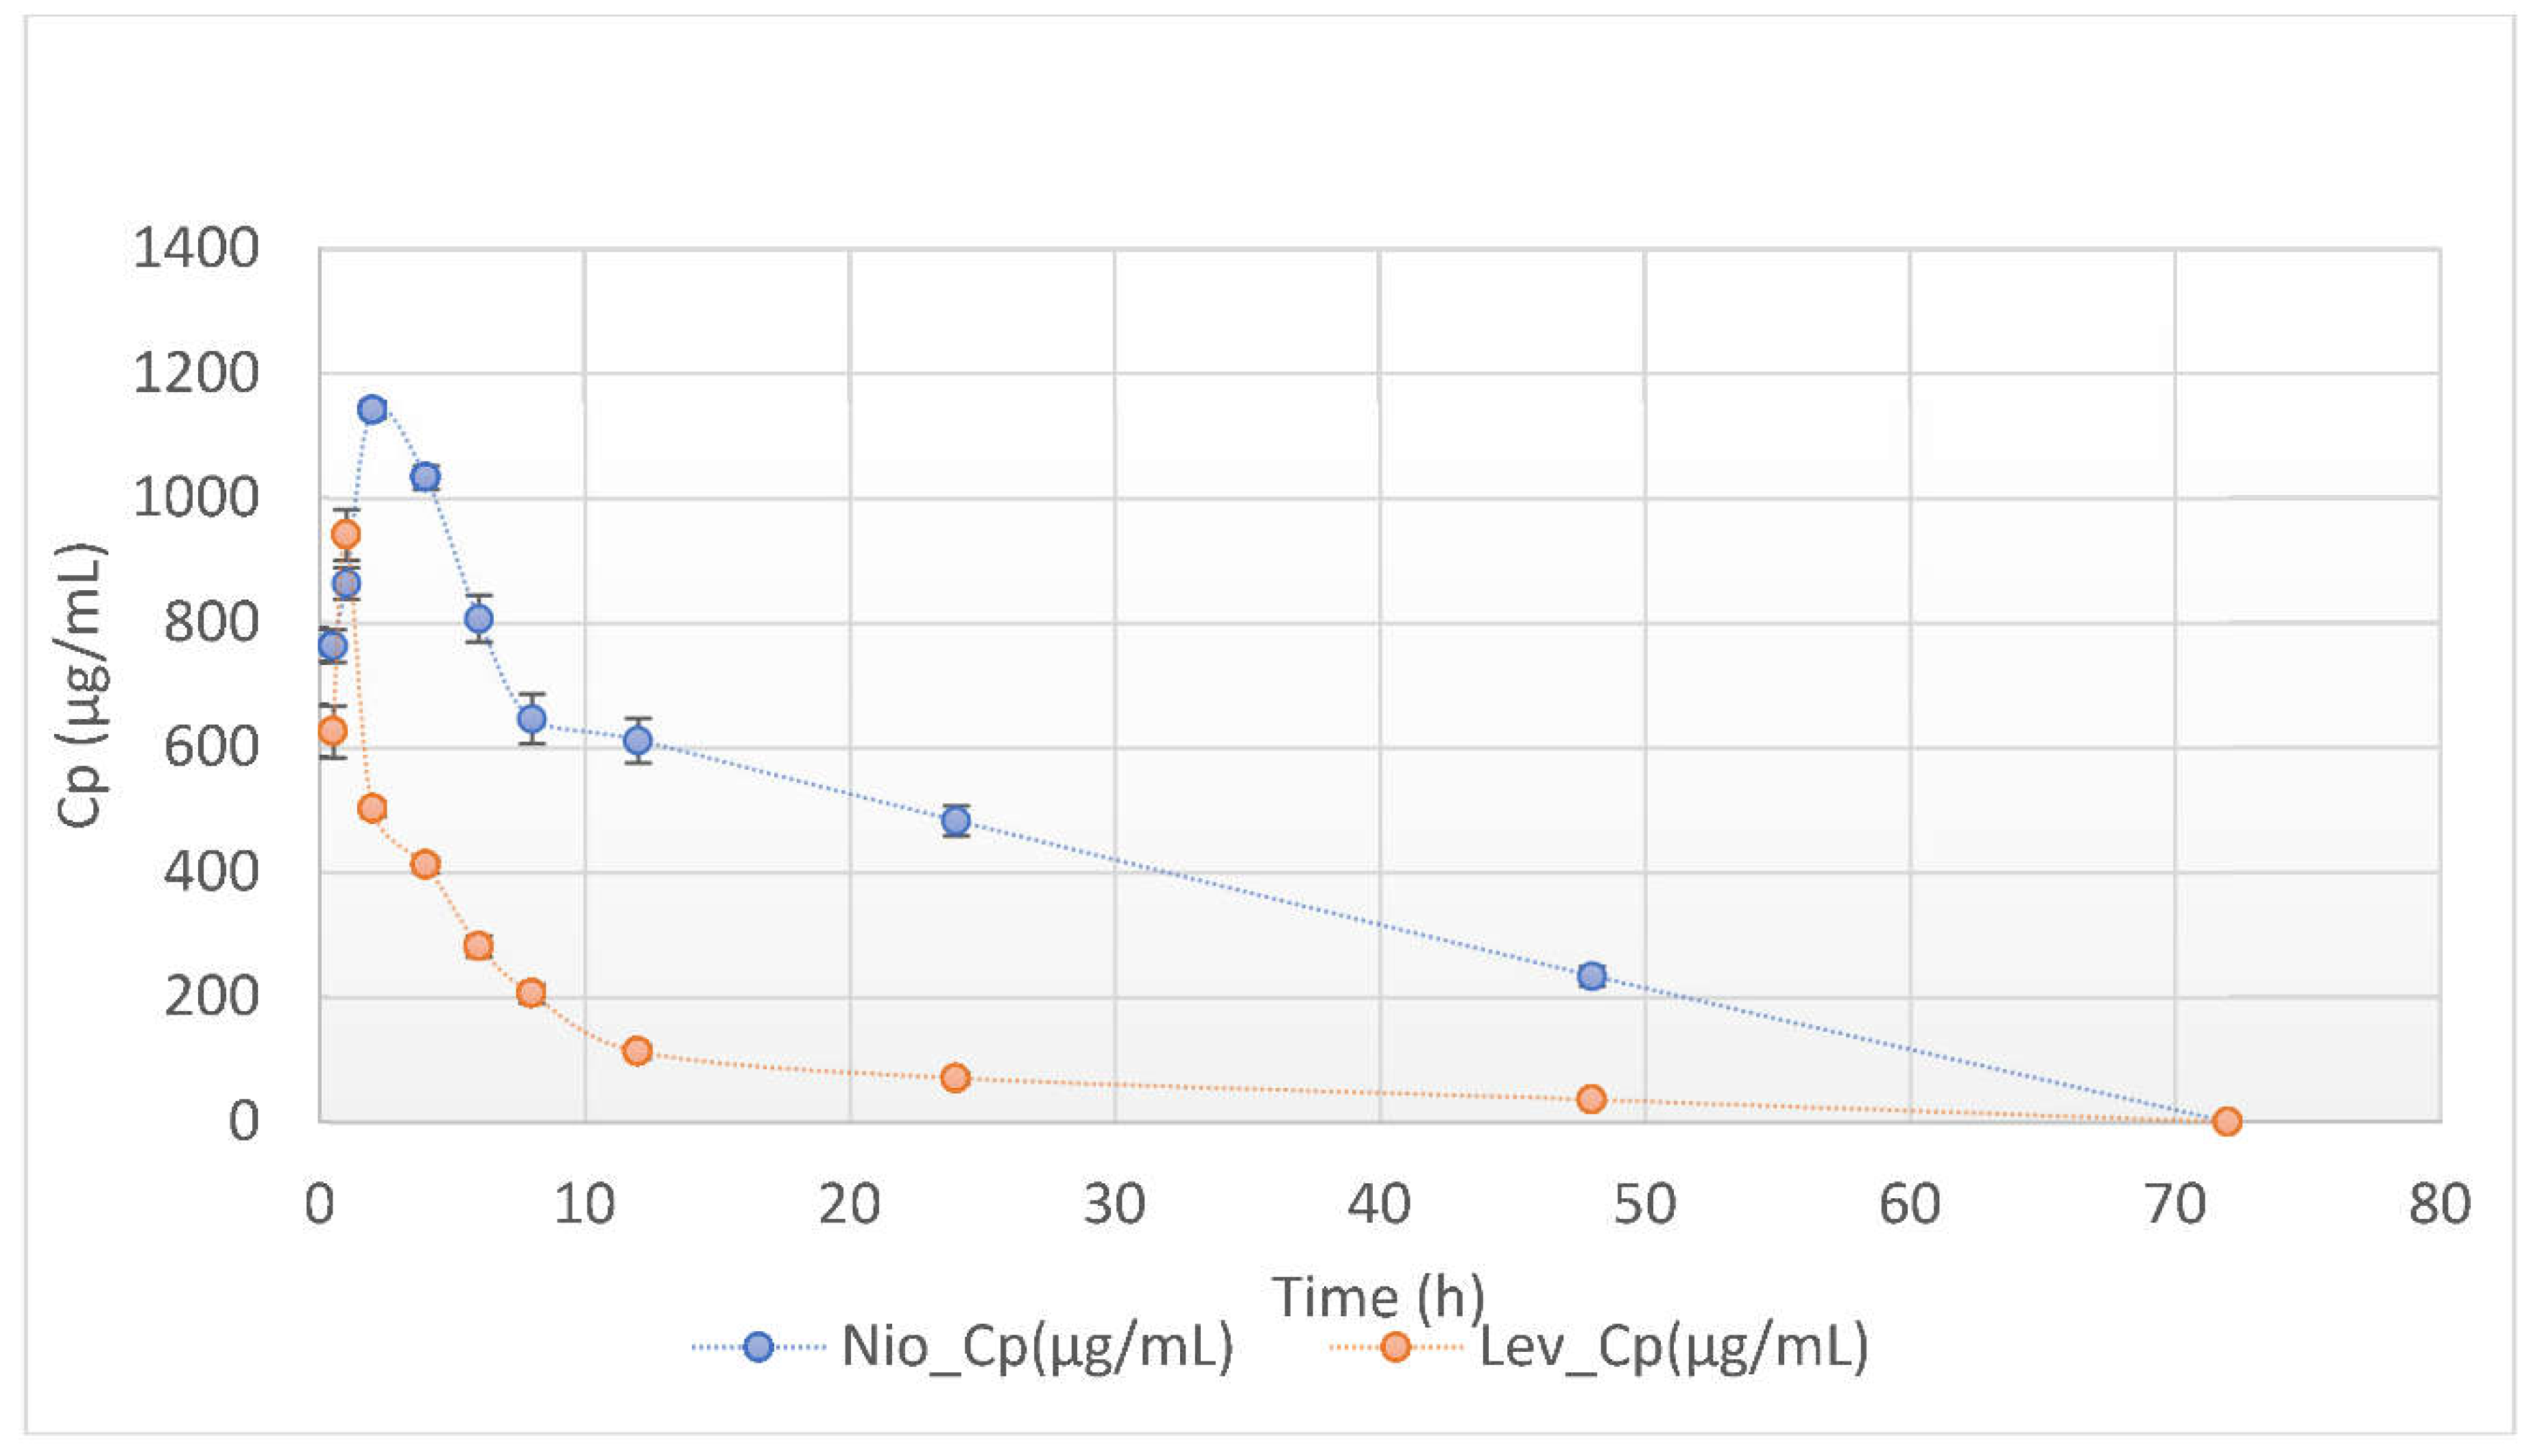
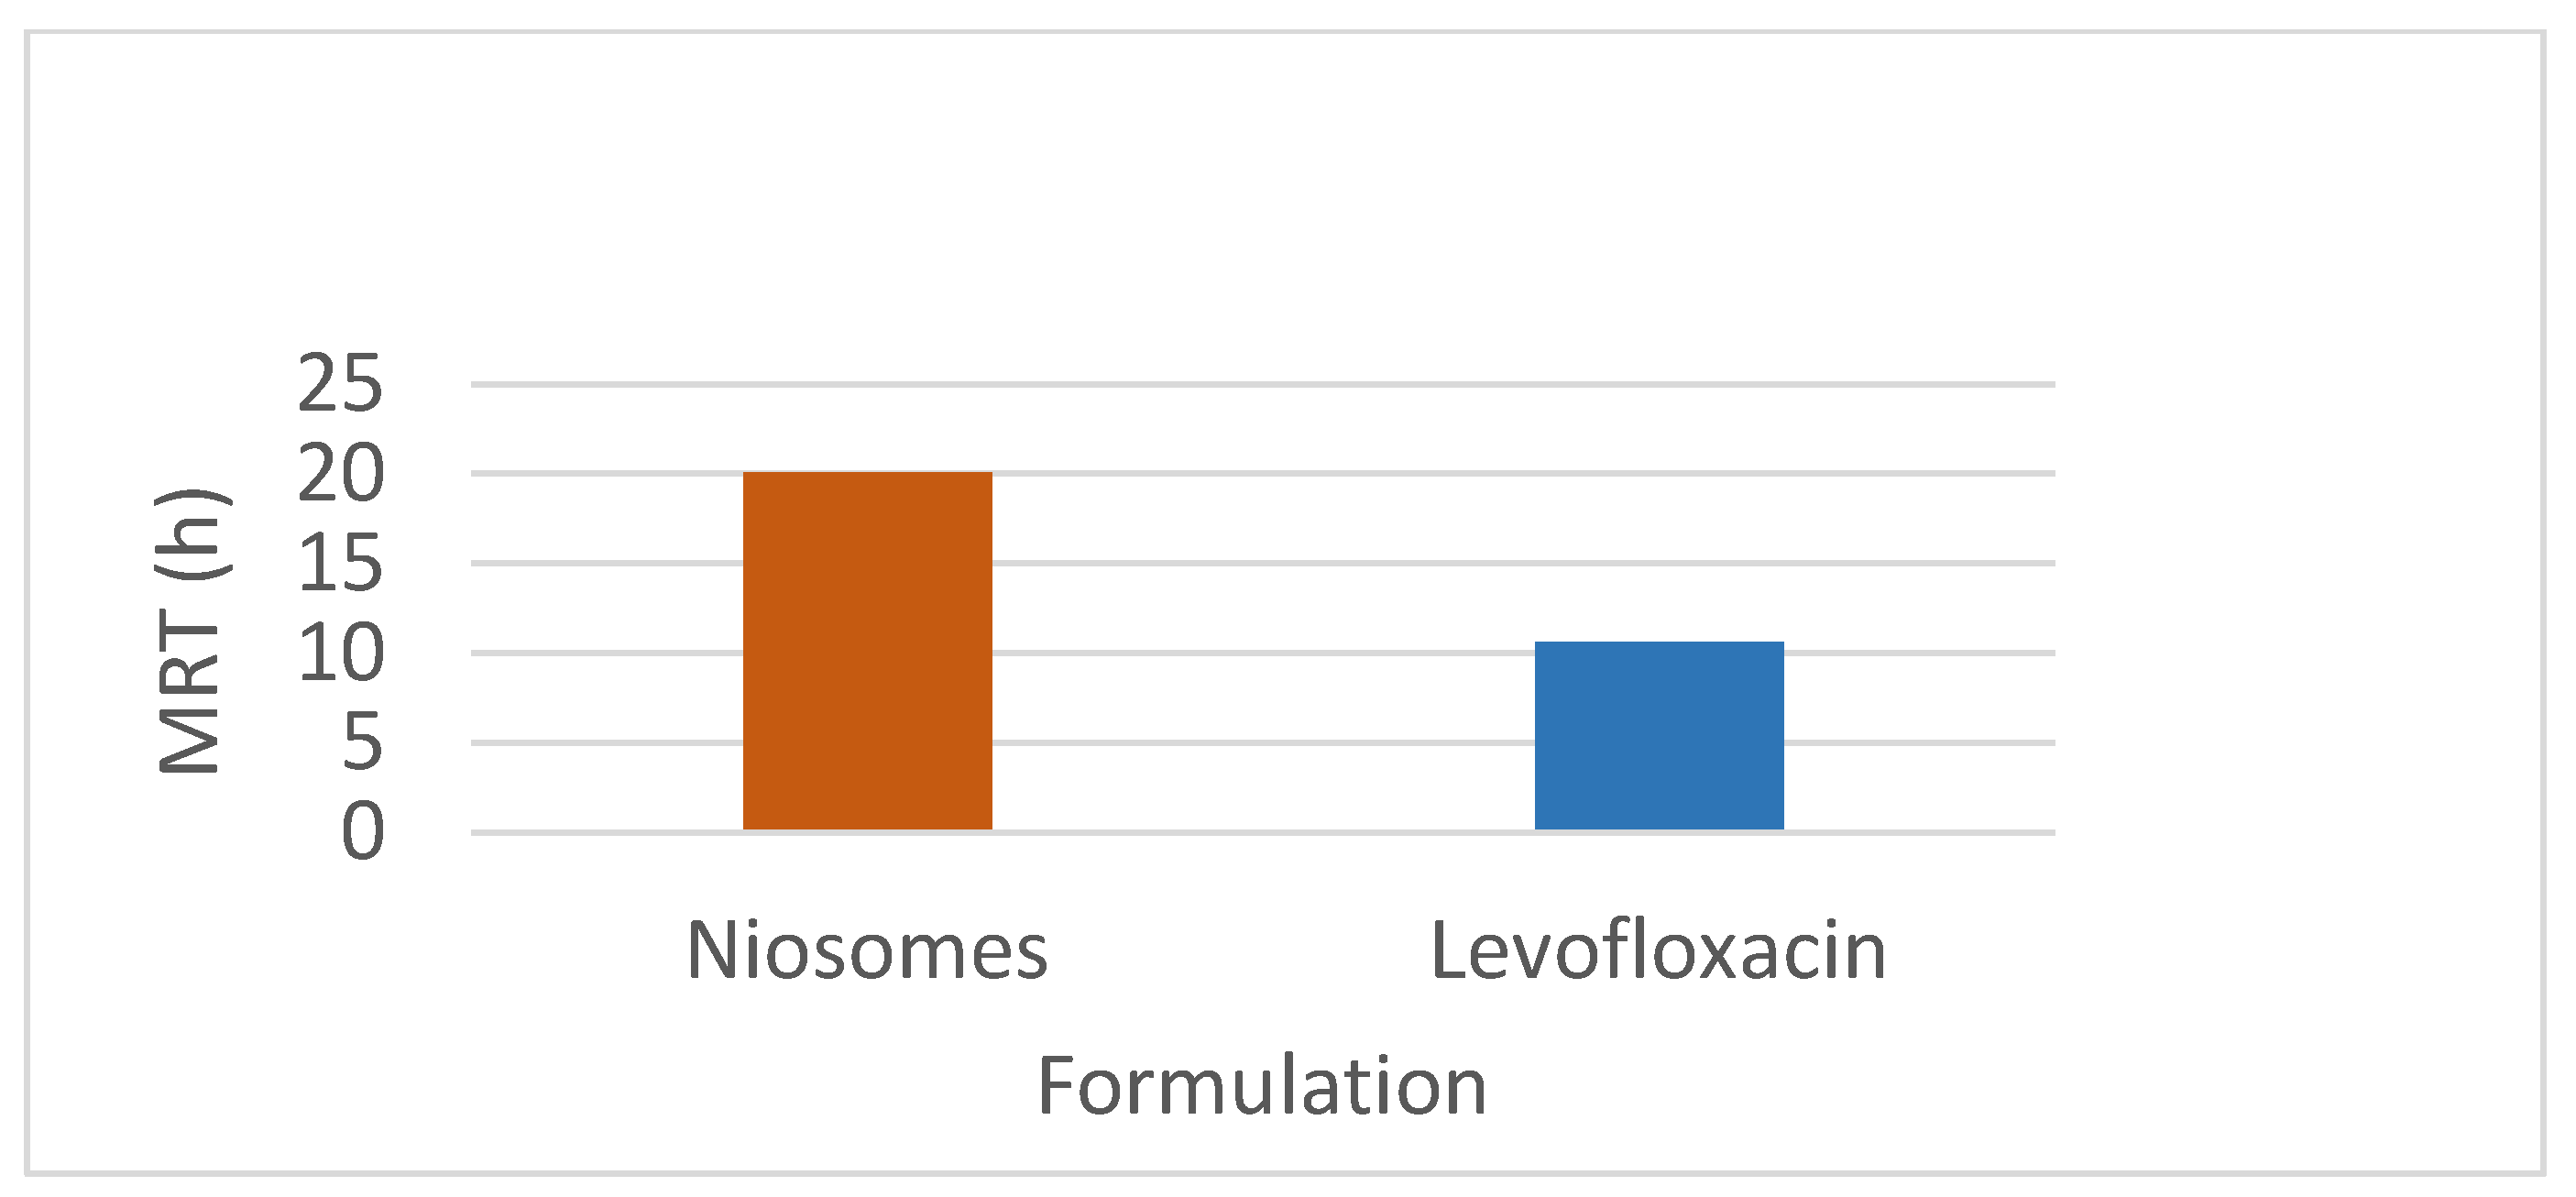
This study investigated the pharmacokinetics of levofloxacin niosomes following a single dose administered intraperitoneally to Sprague Dawley rats, using conventional unentrapped drug as reference. Guided by results of previous studies, an experimental design software (DoE Fusion One) was used to design screening experiments that provided factor combinations and processing variable settings that resulted in an optimized formulation. Optimized niosomes of levofloxacin were prepared, characterized and evaluated in vitro for drug release rate. The well-characterized formulation was used for in vivo study in Sprague Dawley rats in a non-cross over parallel study. One of two groups of rats (n = 6 each) was injected intraperitoneally with conventional levofloxacin and the other with levofloxacin niosomes at 7.5mg/kg/dose. Blood samples were collected at ½, 1, 2, 4, 8, 12, 18, 24, 48 and 72 hours via tail snip. Drug concentrations were determined using a validated high-performance liquid chromatographic (HPLC) method. The plasma concentration versus time data from rats were fed into the Gastroplus software (Simulations Plus, CA) and used to model the pharmacokinetic profiles of the i.p. levofloxacin and its niosomes. The optimized drug-loaded niosomes used for in vivo rat study had a mean size of 368.8 (± 11.0 SE), encapsulation efficiency (EE) of 34.21 %, Zeta potential of -42.10 (± 2.07 SE) and mean polydispersity index (PDI) of 0.316 (± 0.014 SE). Following i.p. injection, levofloxacin release was controlled with less than 80 % released in 6 h and about 90% released in 12 h. Modeling of levofloxacin bio-disposition following i.p. injection in rats with Akaike information criterion (AIC) and Schwarz criterion (SC) indicated that the niosomes formulations are best fitted to one-compartment model while the conventional drug formulation followed two-compartment model. The niosomal formulation appeared to alter the biodistribution of levofloxacin, and concentrated the drug in the vascular compartment with slow, sustained distribution outside of the vascular compartment. Overall, the niosomes formulation showed significant increase in levofloxacin mean residence time (MRT), prolonged its elimination half-life (t1/2) and decrease its volume of distribution (Vd). Encapsulation of levofloxacin in niosomes altered its pharmacokinetic profile. It appears that, by vesicular encapsulation, niosomes altered levofloxacin biodistribution possibly by preventing its binding to plasma protein while correspondingly increasing its residence time in systemic circulation. Thus, by protecting intraperitoneally injected levofloxacin en route into the plasma, niosomes significantly enhance its delivery to, and concentration in, the intravascular compartment with enanced potential for treating intravascular conditions like bacteremia.

Keywords: 
;  ;  ;  

1. Introduction

Fluoroquinolones demonstrate superior ability to penetrate tissues than other antibiotics [1,2]. They accumulate in macrophages and neutrophils [3] and are bactericidal at a low pH environment [4]. These qualities make the fluoroquinolones the drugs of choice for treating clinical diseases caused by intracellular pathogens. Availability of fluoroquinolones, particularly levofloxacin, in oral dosage forms, although makes them suitable for use in both clinical and ambulatory settings, has however enhanced their selection pressure, made them targets for misuse and predisposed them to resistance development with consequent loss of activity against various organisms [5]. Case-controlled studies of resistance against susceptible isolates indicated levofloxacin exposure as a strong risk factor for the development of fluoroquinolone resistant isolates of Enterobacteriaceae [3]. Exposure to fluoroquinolones generlly appears to be positively associated with fluoroquinolone resistance and negatively associated with microbial susceptibility to fluoroquinolones.
One of the main mechanisms by which bacteria develop resistance to antimicrobial agents is through the evolution of cellular structures that prevent drug permeation [5,6,7]. Although levofloxacin, a Biopharmaceutics Class 1 drug, is highly soluble and highly permeable [8], bacteria are becoming increasingly resistant to the drug by efflux pump amplification and porin pathway blockade. It is believed that drug loading in colloidal carriers (like noisomes) may enhance drug penetration into, and retention in, bacterial cells. The microscopic lamellar structures formed from admixture of non-ionic surfactant and cholesterol followed by rehydration in an aqueous media (niosomes) have the ability to accommodate drugs of various molecular nature with a wide range of solubilities. In addition, niosomes are osmotically active and stable with the potential for increasing the stability of entrapped drug. Furthermore, the surfactants used for the construction are biodegradable, biocompatible, and non-immunogenic, and the formulation requires no special handling or storage conditions [6,9]. Niosomes is growing in therapeutic applications for delivery of a wide range of drugs for various conditions. In a study by Akbarzadeha et al (2020) [10], doxycycline-loaded niosomes exhibited improved antibacterial activity via prolongation of the mean residence time, increase in drug half-life and expansion of the systemic exposure via increased area under the plasma concentration versus time curve (AUC).
Studies have shown that the distribution and localization of colloidal carriers in tissues, cellular and sub-cellular areas, parallel the distribution into the common bacteria cells that are responsible for intracellular infections [11]. Topoisomerases, the target enzymes for fluoroquinolones, are in the bacteria cytoplasm and changes in permeability of the outer membrane of gram-negative bacteria cell has been linked with resistance development. It has been hypothesized that encapsulation of drugs in niosomes could provide stealth effect, enhance internalization by bacteria cells and improve intracellular delivery to the cytoplasm [12]. Generally, cationic niosomes are internalized faster and to a greater extent than negatively charge and neutral particles due to stronger electrostatic attraction to the negatively charged cell membrane [13].
Levofloxacin is the optical S-(-) isomer of the ofloxacin. It has a broad spectrum of activity against gram positive, gram negative and atypical organisms such as Mycoplasma, Legionella, Mycobacterium and Chlamydia [14]. Levofloxacin is a major component of the antibacterial cocktails to H. pylori. Its loss to resistance portends major setback to the fight against peptic and duodenal ulcer, and their potential progression to gastroduodenal carcinoma [15,16,17]
Various approaches have been used to repurpose drugs for optimization of bioavailability, bioequivalence, and systemic exposure. Solubility of molecules with inherent poor solubility have been achieved by use of cosolvents, inclusion in cyclodextrins, of solid dispersion in hydrophilic polymers [18,19]. Formulation approaches have also been used including formulation as microemulsions, self-microemulsifying drug delivery system (SMEDDS), of nanosuspensions [18,20]. One of the most commonly employed processing methods for solubility and bioavailability improvement is supercritical carbon dioxide [21,22]. Supercritical fluids (SCFs) technology has the advantage of being solvent-free and purity of resulting products and could obviate the use of organic solvent characteristic of many of the current methods for nanovesicles and nanoparticles production [21,23,24]. Levofloxacin is a BCS class 1 drug which is highly soluble and highly permeable [8,25] . It is currently being repurposed via molecular modification as an anticancer agent [26]. Approaches to levofloxacin formulation for enhanced intracellular delivery involve use of lipid nanoparticles [27]; silica-based mesoporous materials [28] and nanocariers [29,30]. In a previous study, we investigated formulations of select fluoroquinolones (norfloxacin, ciprofloxacin, gatifloxacin and levofloxacin) in non-ionic vesicles (niosomes) [9,31]. Drug loading of levofloxacin in niosomes was 40.52 (±1.23) % with temperature dependent stability and slowest drug leaching at 4°C. Drug release from niosomes was by first-order, concentration-dependent mechanism and in vitro testing against ciprofloxacin-resistant bacterial strains showed at least a two-fold increase in potency [31]. It appears that there is dearth of literature information on the mechanisms of biodistribution of levofloxacin niosomes in vivo. This study was therefore designed to investigate the in vivo pharmacokinetics (PK) of an optimized niosomal formulation of levofloxacin in rats following intra-peritoneal administration. The aim was to determine the pharmacokinetic parameters and any impact of niosomes on in vivo distribution of levofloxacin in rats.

2. Materials and Methods

2.1. Ethical Approval and Declaration

The study protocol was approved by the Department of Graduate Studies, University of the West Indies, St. Augustine, Trinidad and Tobago. The application for animal research was approved by the Animal Ethics Committee, Faculty of Medical Sciences, University of the West Indies. The research was conducted using Sprague Dawley rats. Protocols for animal handling followed the Principles of Laboratory Animal Care (LAC) and the Institutional Animal Care Committee (IACC) and in accordance with the National Institutes of Health’s “Guide for the Care and Use of Laboratory Animals” (NIH publication no. 8623).

2.2. Experimental Design for Niosomes Formulation

The input variables were entered into the Fusion One Design of Experiment (DoE) module as follows - Design wizard mode: User interactive; Design type: Two level (Full factorial); Number of internal blocks: 1; Blocking strategy: No blocking; Center point level settings: CHOL, 10; SAA, 10; DCP, 3.75 and variable level settings: CHOL (mM), 5.0 < CHOL < 15.0; SAA (mM), 5 <SAA<15; DCP (mM%), 2.5 <DCP<15. The layout of treatment parameters is shown in Table 1.

2.3. Niosomes Preparation and Characterization

Niosomes were prepared following the previously reported and optimized formulation comprising cholesterol, sorbitan monosterate (Span 60) and dicetylphosphate in the molar ratio of 9.5:9.5:1 respectively, using the thin film hydration method [31,32]. Niosomes containing levofloxacin was prepared using surfactant (Span 60), cholesterol and dicetylphosphate in varying molar ratios determined by Design of Experiment (DoE Fusion One software). The layout of factor combinations is shown in Table 1. The thin film hydration and post-preparation handling procedures, previously reported in our lab [9,31], were used. Hydrated pro-niosomes were ultra-sonicated for 6 minutes using 20 % amplification setting at 25 °C. The resulting colloidal dispersion was washed twice with phosphate buffered saline and lyophilized. The lyophilized powder was stored in air-tight light-protective vial until used for further experimentation.

2.3.1. Characterization of Niosomes

2.3.1.1. Scanning Electron Microscope (SEM) of Niosomes
SEM analysis was performed at the George Washington University (GW) Nanofabrication and Imaging Center. To determine the size of the particles, all lyophilized compounds were mounted on aluminum stubs using carbon tape for SEM analysis. Imaging was performed using an in-lens FEI Teneo FEG SEM (ThermoFisher). High-resolution images were acquired under high-vacuum conditions, with a voltage of 2 kV, a beam landing current of 25 pA, and a working distance of 3.9 mm. The horizontal field width was set to 11.8 µm, and the pixel size was 1.93 nm. A dwell time of 1 µs was used, along with a resolution of 6,000 x 6,000 pixels for each SEM image. No coating was applied during these analyses.
2.3.1.2. Transmission Electron Microscopy
Five mL of nanoparticle suspension were applied for 5 minutes onto formvar/carbon-coated 200 mesh copper grids (Electron Microscopy Sciences) that were glow discharged (20 mA for 60 seconds) right before use. EVs were negatively stained with 1% uranyl acetate (Electron Microscopy Sciences) for 2 minutes and air-dried before imaging. A FEI Talos F200X transmission electron microscope operated at 200 kV was used. Images were acquired with a Thermo Scientific Ceta 16M CMOS camera.
2.3.1.3. Vesicle Size, Polydispersity Index (PDI) and Zeta Potential
The hydrodynamic size, size distribution and polydispersity index (PDI) of the niosomes were determined using 90Plus particle Size Analyzer (Brookhaven Instruments, NY). About 100 µL of freshly prepared niosomes was diluted to 2 mL in deionized water, loaded into culverts and analyzed following manufacturer’s protocols. The surface charge (Zeta potential) was also determined using the 90Plus particle Size Analyzer.

2.3.2. Assay of Niosomes Drug Content

Amounts of drug in starting, intermediate and finished niosomes were analyzed using validated methods on Agilent 1260 Infinity HPLC machine.
2.3.2.1. HPLC Method Development
The HPLC system comprised the Agilent 1260 Infinity II LC Gradient DAD System, incorporating a gradient pump with degasser (max. pressure 600 bar), autosampler, column oven and equipped with OpenLab CDS Workstation PC Bundle. The column was Poroshell 120 EC-C18 4.6x100mm, 2.7μm. Mobile phase comprised of acetonitrile: water, each with 0.75% trifluoro acetic acid (TFA) operated in gradient mode. Injection volume was 20 μL, and column temperature was at 35 °C. The system was validated for specificity, repeatability, accuracy, and precision following USP specifications.
2.3.2.2. Assay of Niosomes Drug Content
The drug contents of formulated niosomes (encapsulation efficiency, EE) was calculated according to the formula:
EE = (W Encapsulated/W total) × 100%
2.3.2.3. In Vitro Dissolution of Drug from Noisomes
The dialysis tube method previously reported [31] was used with modification to determine drug dissolution from lyophilized niosomes powder. An amount of niosomes equivalent to 5 mg of the drug was placed in a dialysis tube. The tube was suspended in an external reservoir containing 50 ml of phosphate buffer saline (pH 7.4) maintained at 37±1ºC and subjected to continuous oscillatory stirring motion at 50 rpm. Aliquots of 2ml were withdrawn at specified time interval and replaced with fresh medium equilibrated to 37ºC. The amount of drug in each aliquot was determined by validated HPLC method.

2.4. Design of Bioavailability Study

A non-cross over, one-phase parallel experimental design was used. Sprague Dawley rats 6-8 weeks old, weighing between 200-250g were obtained from the School of Veterinary Medicine, University of the West Indies. The animals were randomly assigned to 2 groups (n = 6) and were allowed to acclimatize to the local conditions for seven days before any experimental work was done. Group 1 animals were given the conventional (pure) drug, whilst group 2 animals were given an equivalent dose of drug entrapped in niosomes. Levofloxacin (>98% pure HPLC, Sigma Aldrich, Canada) solution in phosphate buffer saline (PBS) was administered intraperitoneally (i.p.) in the left lower quadrant at a dose of 7.5mg/kg as previously reported [9] using a 23gauge needle. The tail was cleaned with chlorhexidine gluconate followed by an alcohol prep pack and allowed to dry whilst the animal was restrained. The tail was snipped approximately 1-2mm above the tip with a pair of sterile scissors and was massaged gently from top to bottom whilst blood was collected in sterile Eppendorf tubes. Blood was collected at time points 0, ½, 1, 2, 4, 6, 8, 12, 24, 48 and 72 hours after the drug was administered. Total volume of blood collected during a 24-hour period was limited to ≤7.5% of the total circulating volume (estimated average of 64 ml/kg), in accordance with the NIH Animal Research Advisory Committee (ARAC) Guidelines (National Institutes of Health (US) [33].

2.5. Samples Preparation for HPLC Analysis

Eppendorf tubes containing blood samples were allowed to stand for 30 minutes. Blood samples were then centrifuged at 5000 rpm for 10 minutes. The serum was then carefully siphoned using a micropipette. A micropipette was used to transfer 40µL of serum to a clean, dry Eppendorf tube (1.5mL) followed by 120µL of methanol to precipitate protein content. The resulting mixture was vortexed for one minute and then centrifuged for 10 minutes at 10,000rpm. The supernatant was collected and stored in clean dry Eppendorf tubes at -800C until used for analysis.
To obtain blank serum from rat blood for HPLC analysis, rats were euthanized using 150mg/kg i.p. pentobarbital injection [35]. The rodent was placed lying on its back and checked for pedal reflex to ensure the animal could not feel pain. Blood was drawn by cardiac puncture. With the bevel facing upwards, the needle was inserted to the left of the animals xyphoid process (base of the sternum), directing the needle towards the chin at a 30-450 angle. After the needle tip penetrated the skin, the syringe plunger was gently pulled back to create a slight negative pressure. The needle was advanced until blood was withdrawn. If unable to withdraw blood, the needle was slowly withdrawn while maintaining the negative pressure on the syringe until the needle is nearly but not completely withdrawn. The needle was then redirected in a slightly different direction. Blood was placed in a sterile tube and allowed to stand for 30 minutes. Blood samples were then centrifuged at 5000rpm for 10 minutes. The supernatant was removed and placed in sterile glass tubes. Methanol was added to serum in a ratio of 3:1 for protein precipitation. The resulting mixture was vortexed for one minute and centrifuged for 10 minutes at 10,000rpm. The supernatant was collected and stored in clean dry Eppendorf tubes at -800C until used for analysis. To prepare sample for analysis, 20µL of serum were placed in a clean dry Eppendorf tube using a micropipette. Forty microliters (40µL) of methanol were added. The contents were vortexed for one minute and then centrifuged at 10,000rpm for 10 minutes. The supernatant was removed and loaded in HPLC auto sampler tray from which 20 µL was injected during the analysis. HPLC analytical parameters were as described under section 2.3.1.4. above.

2.6. Treatment and PK Analysis of Plasma Data

HPLC data was entered into Gastroplus PKTM modeling and simulation software. The data obtained from the pharmacokinetic analysis of serum samples represented the drug concentrations in plasma (Cp) at various time points. This Cp vs time data was entered in the GastroPlus™ menu and the non-compartment analysis (NCA) was done.
The individual weight of each animal was then entered into the software and pharmacokinetic modelling was determined for one, two and three compartmental models. The software used the Hooke and Jeeves Pattern search [34,36] with the error weighting set at 1/Yhatʌ2. The software was able to generate solutions for non-compartment analysis (NCA) and one, two and three compartment models. This data analysis incorporated model fitness algorithms of the Akaike Information Criterion (AIC) [36,38] and Schwarz Criterion (SC) [39] according to the equations:
AIC = (#Pts)*Log(Obj)+2(#Parameters)
SC = (#Pts)*Log(Obj)+(#Parameters)*(Log(#Pts))
The best model was reported by each algorithm together with estimates of errors (residuals)

3. Results

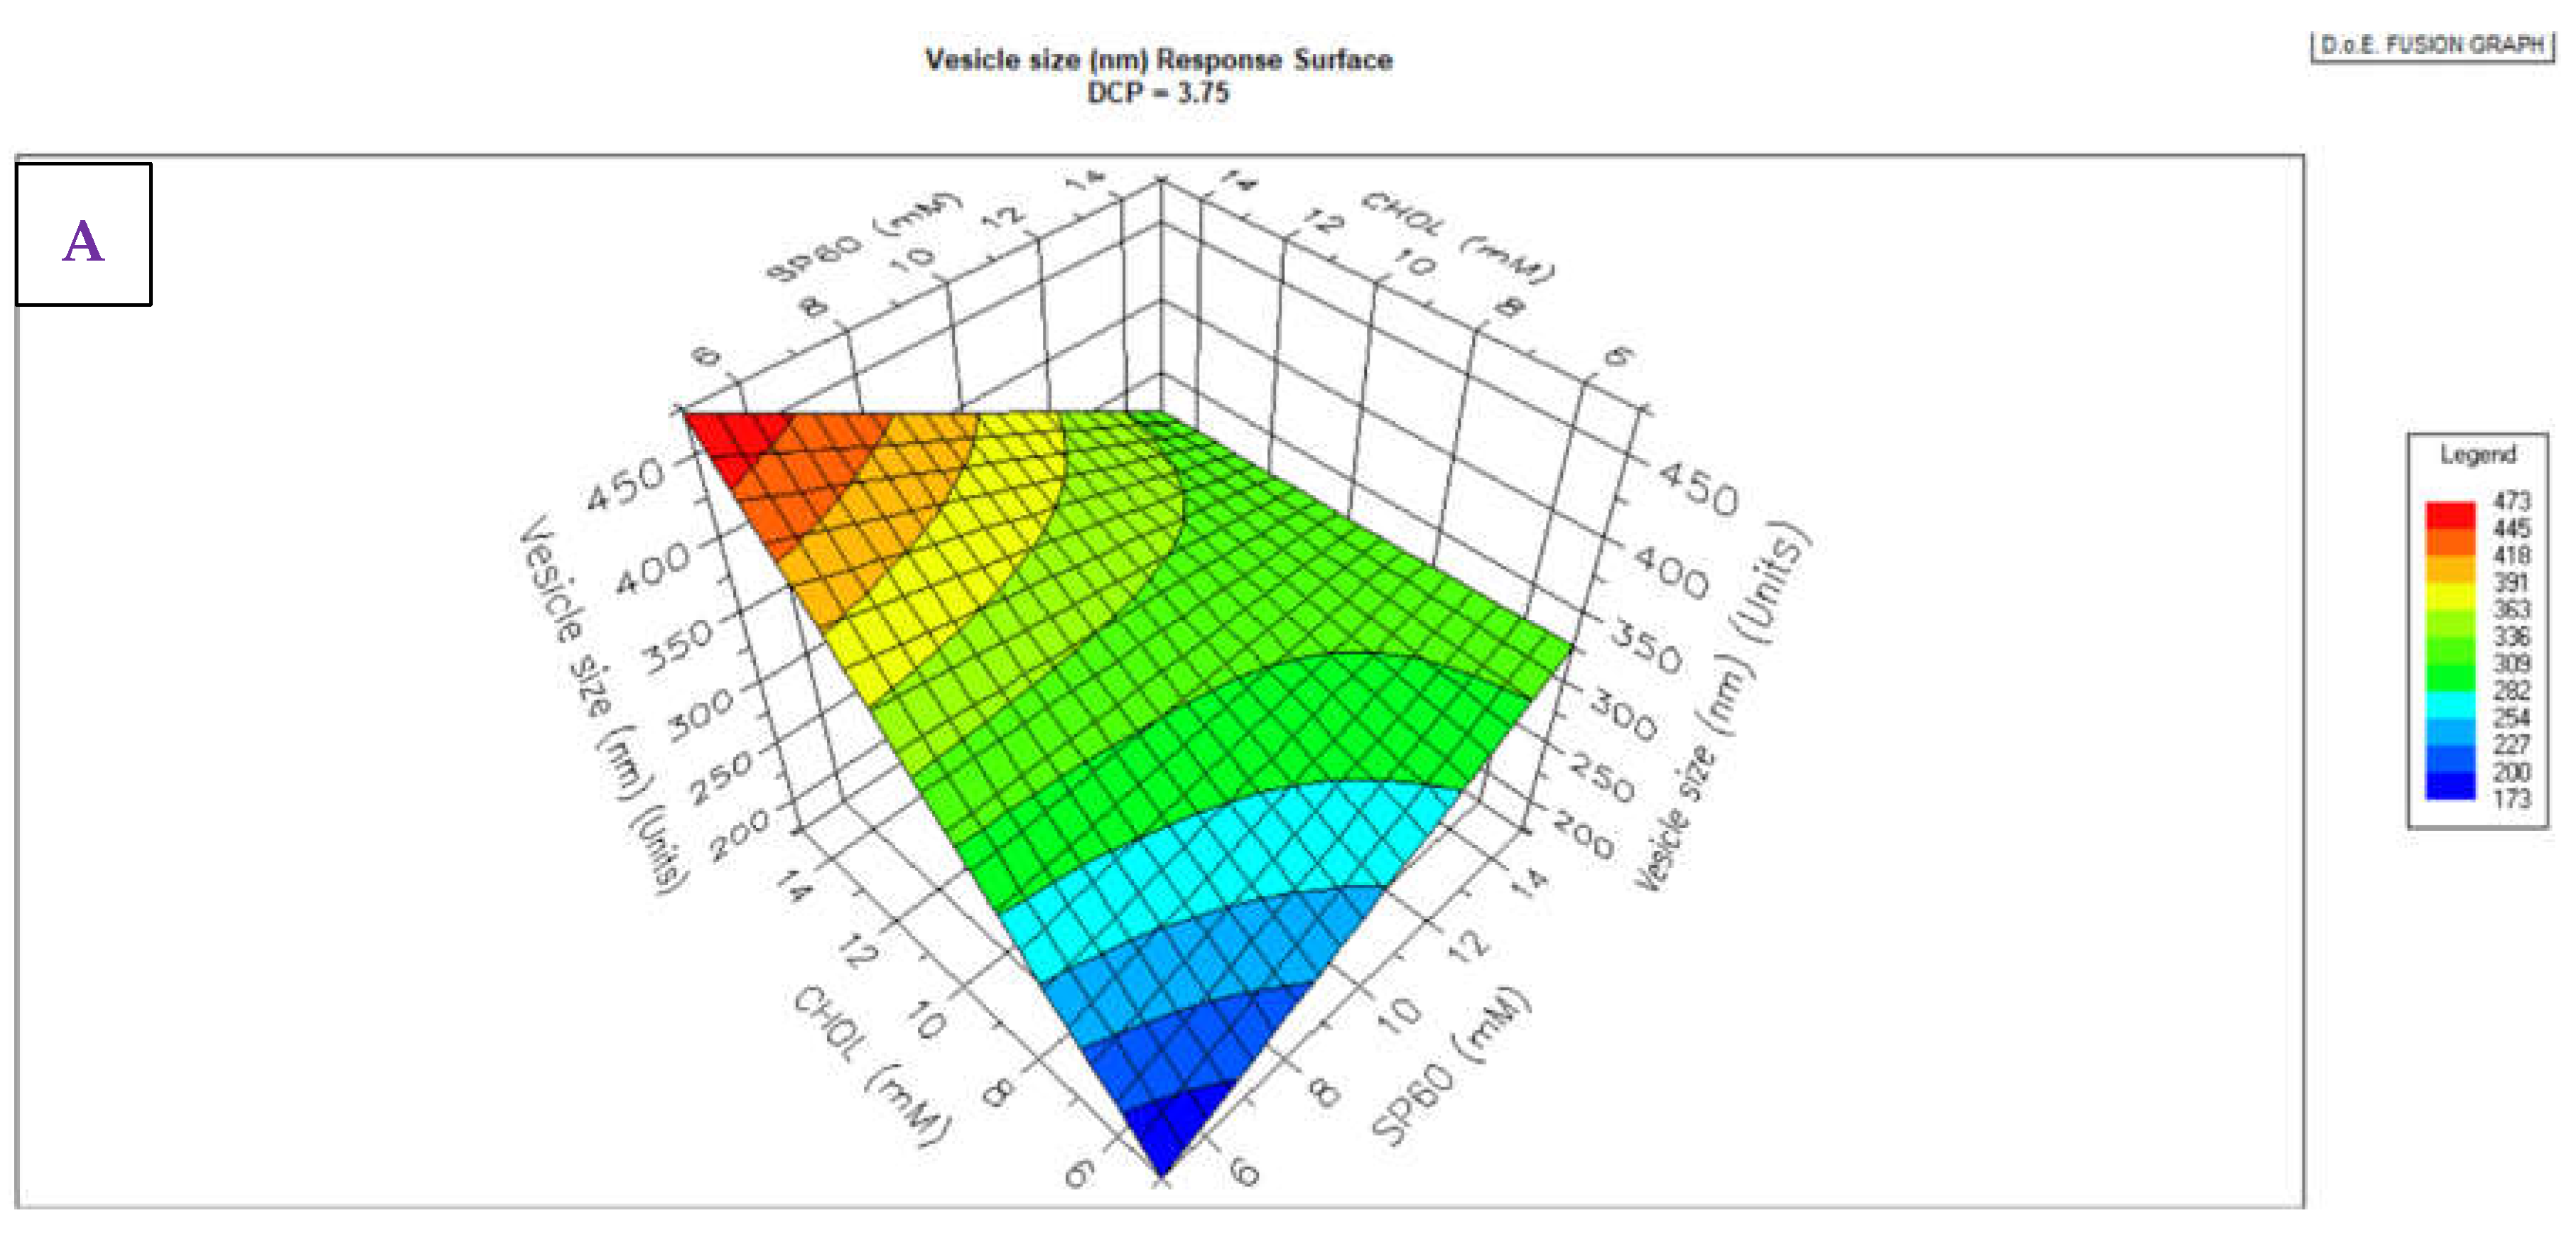
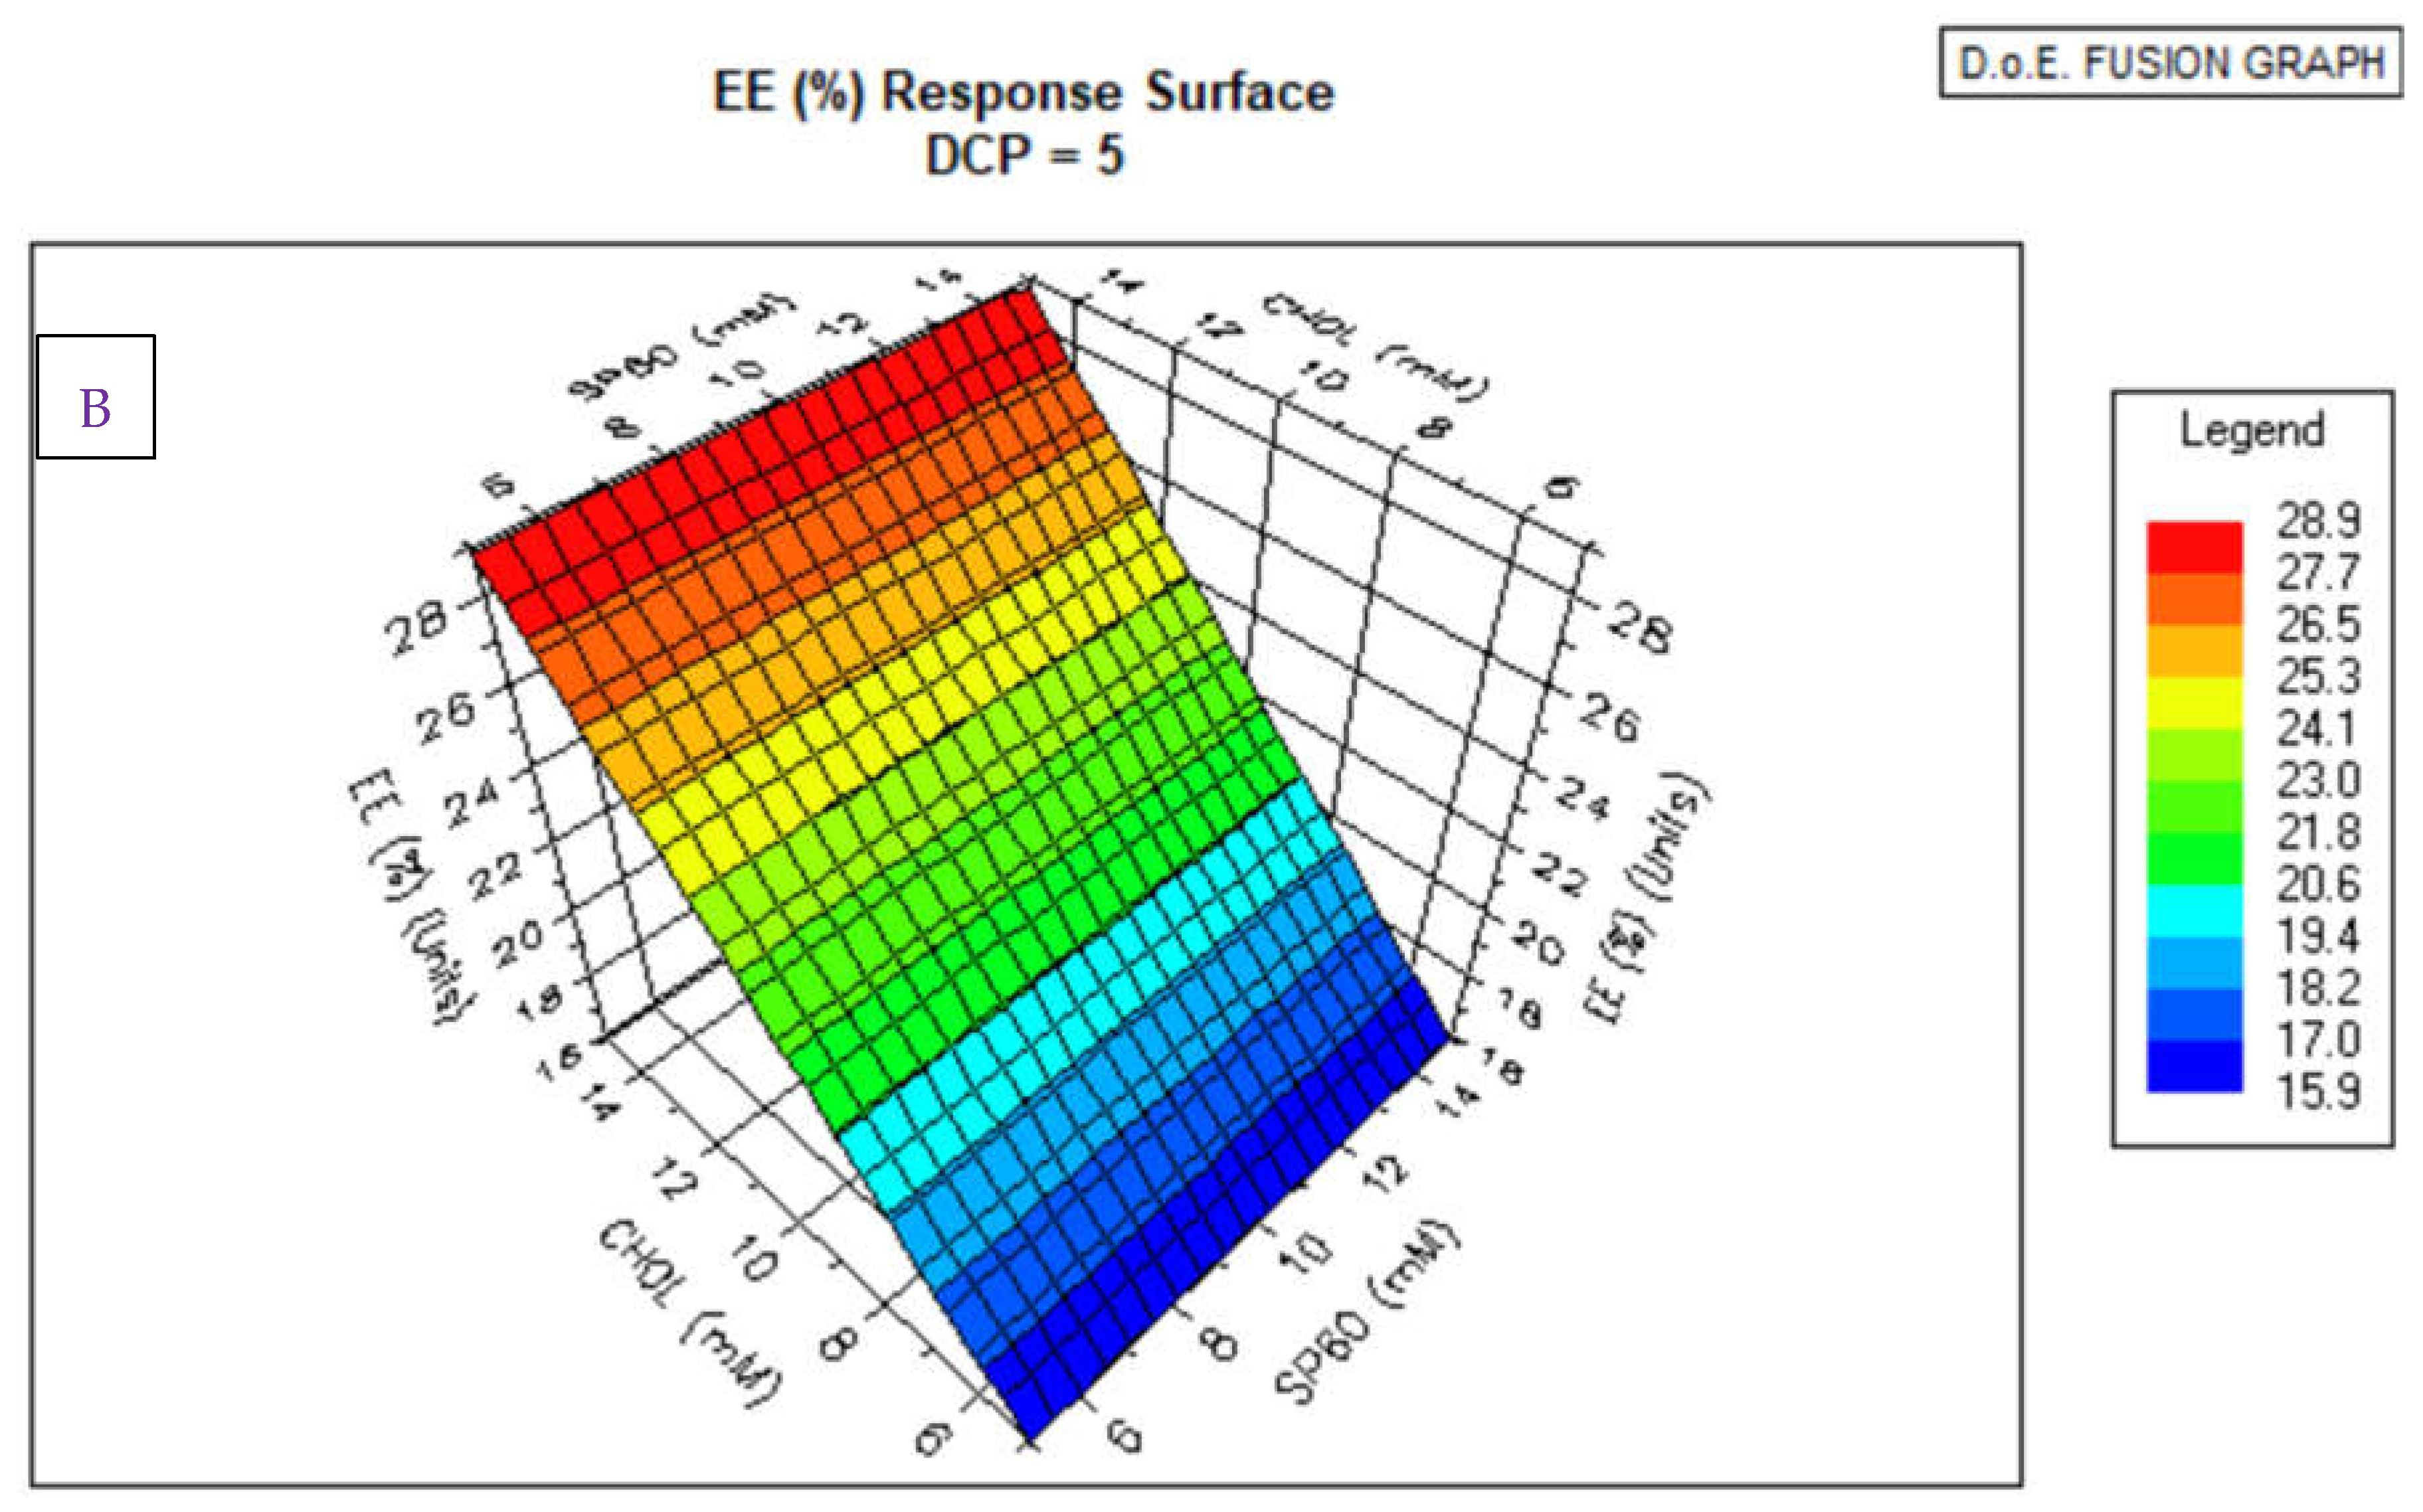
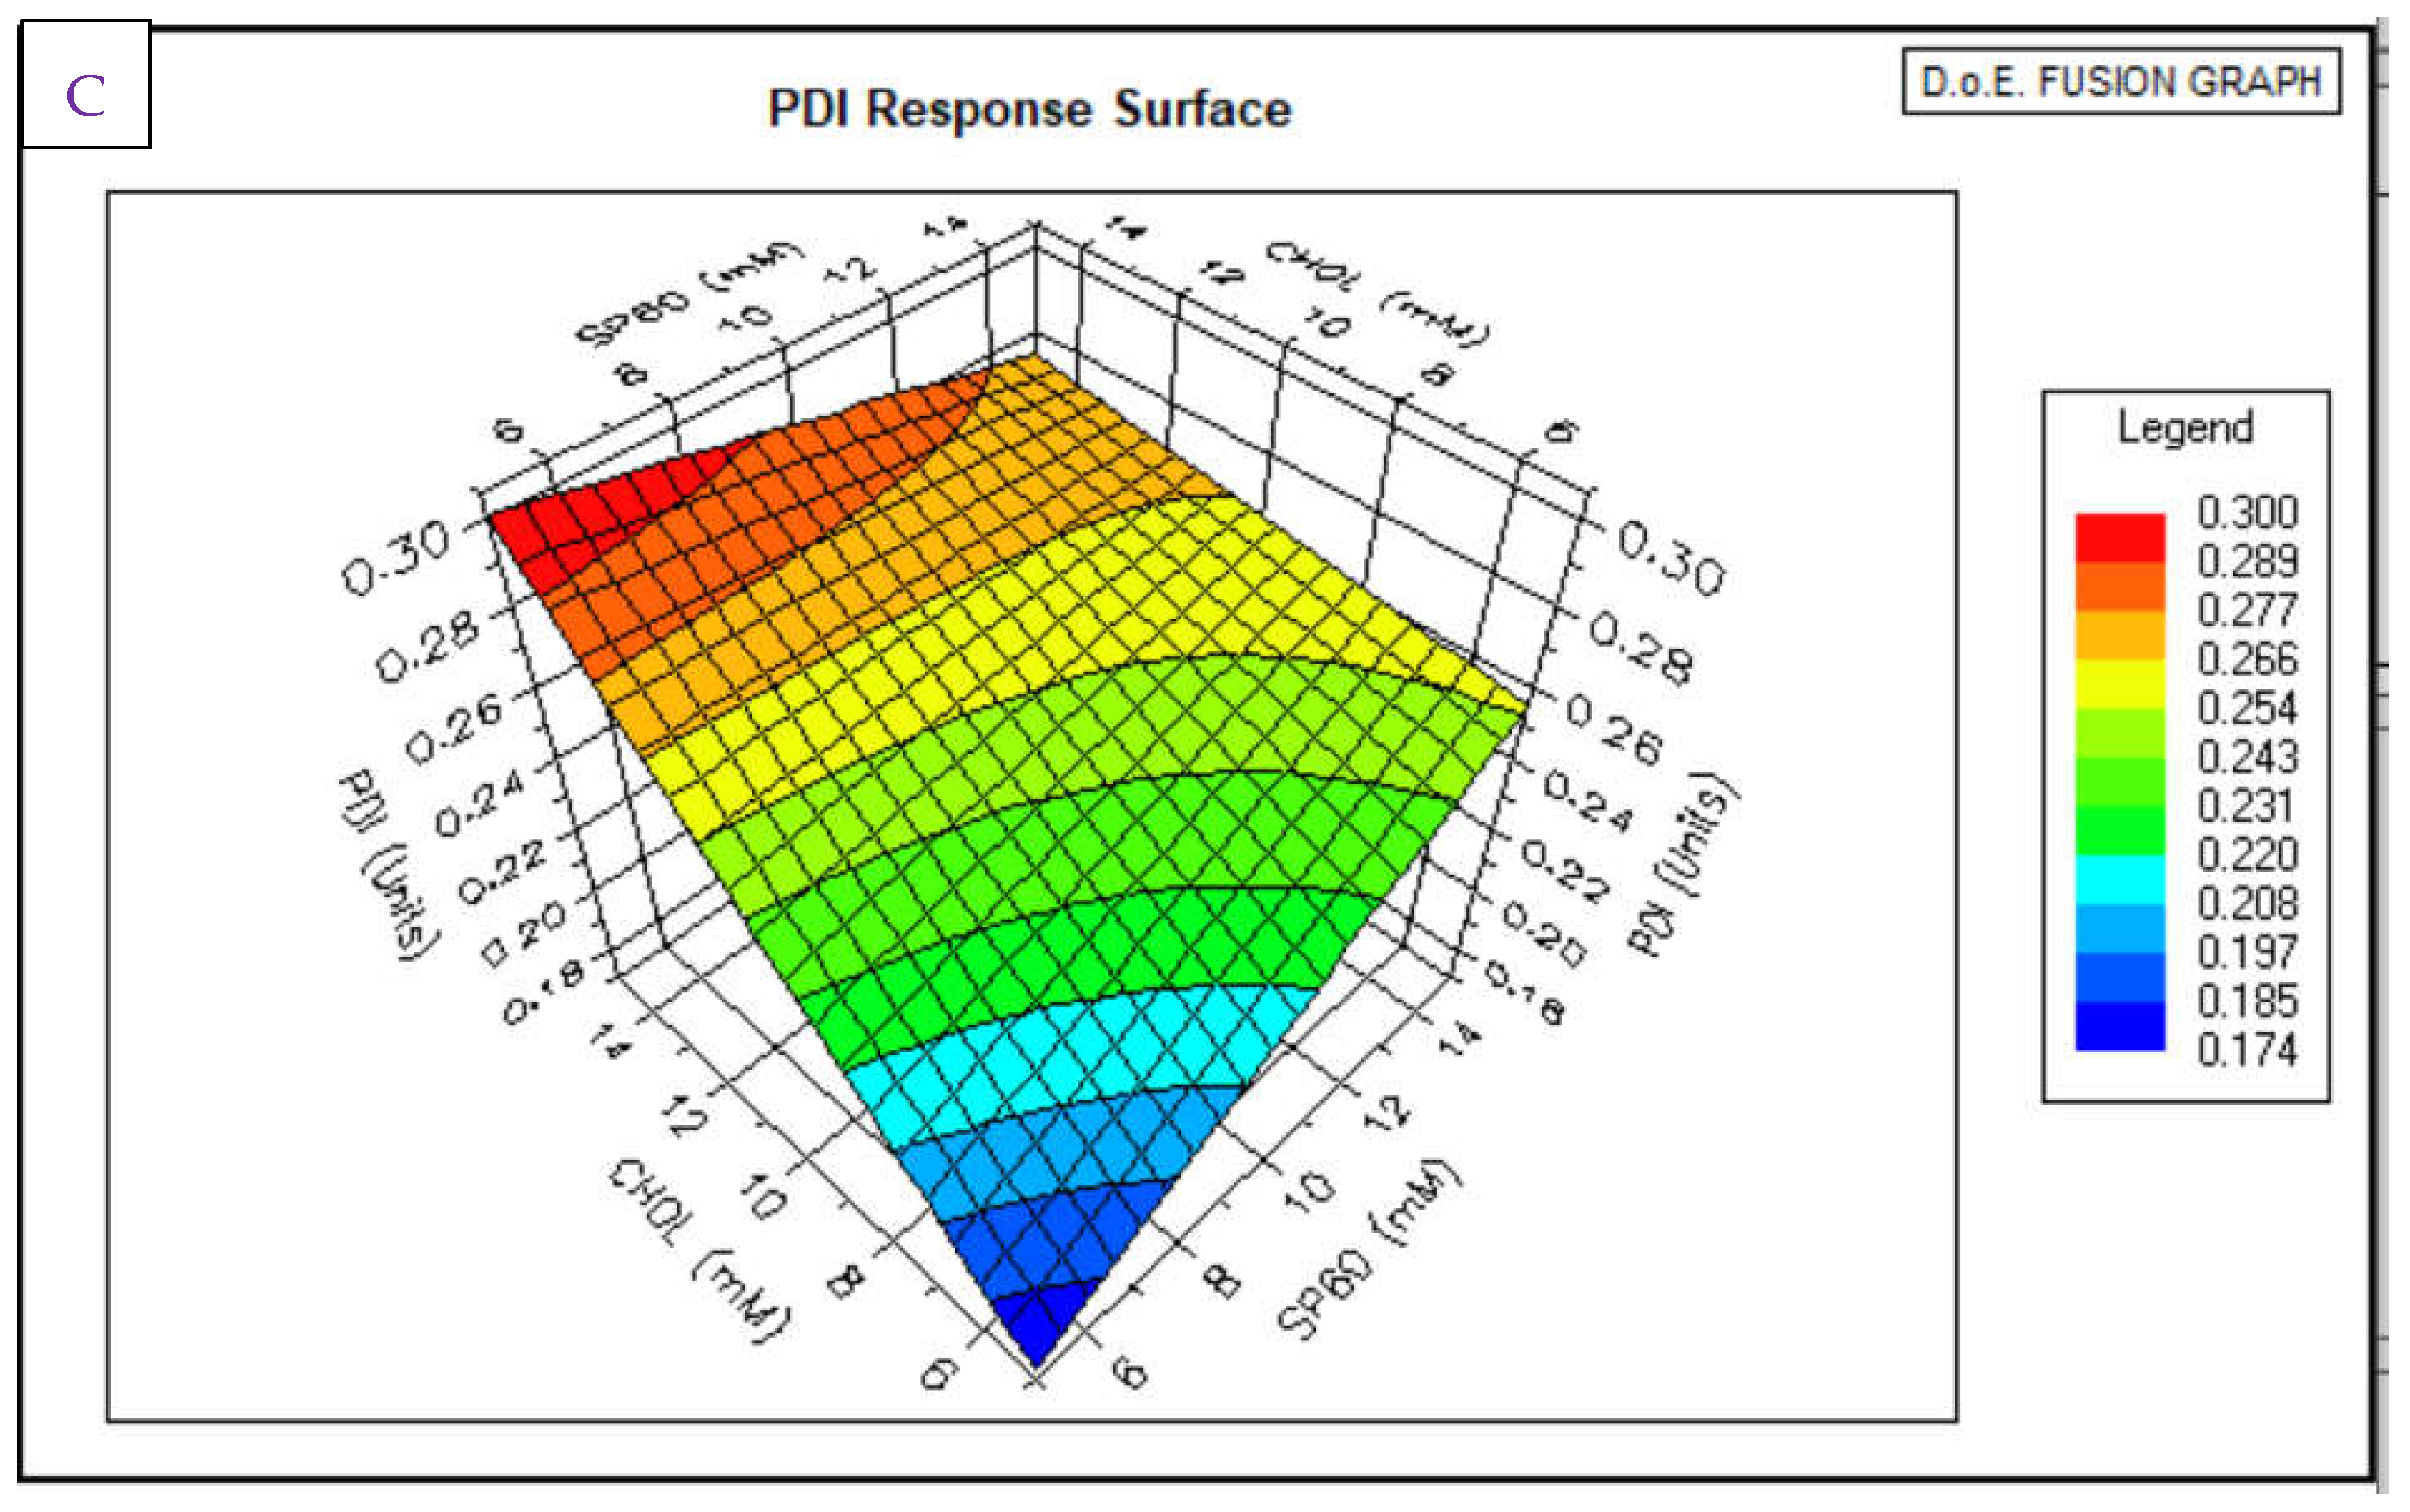
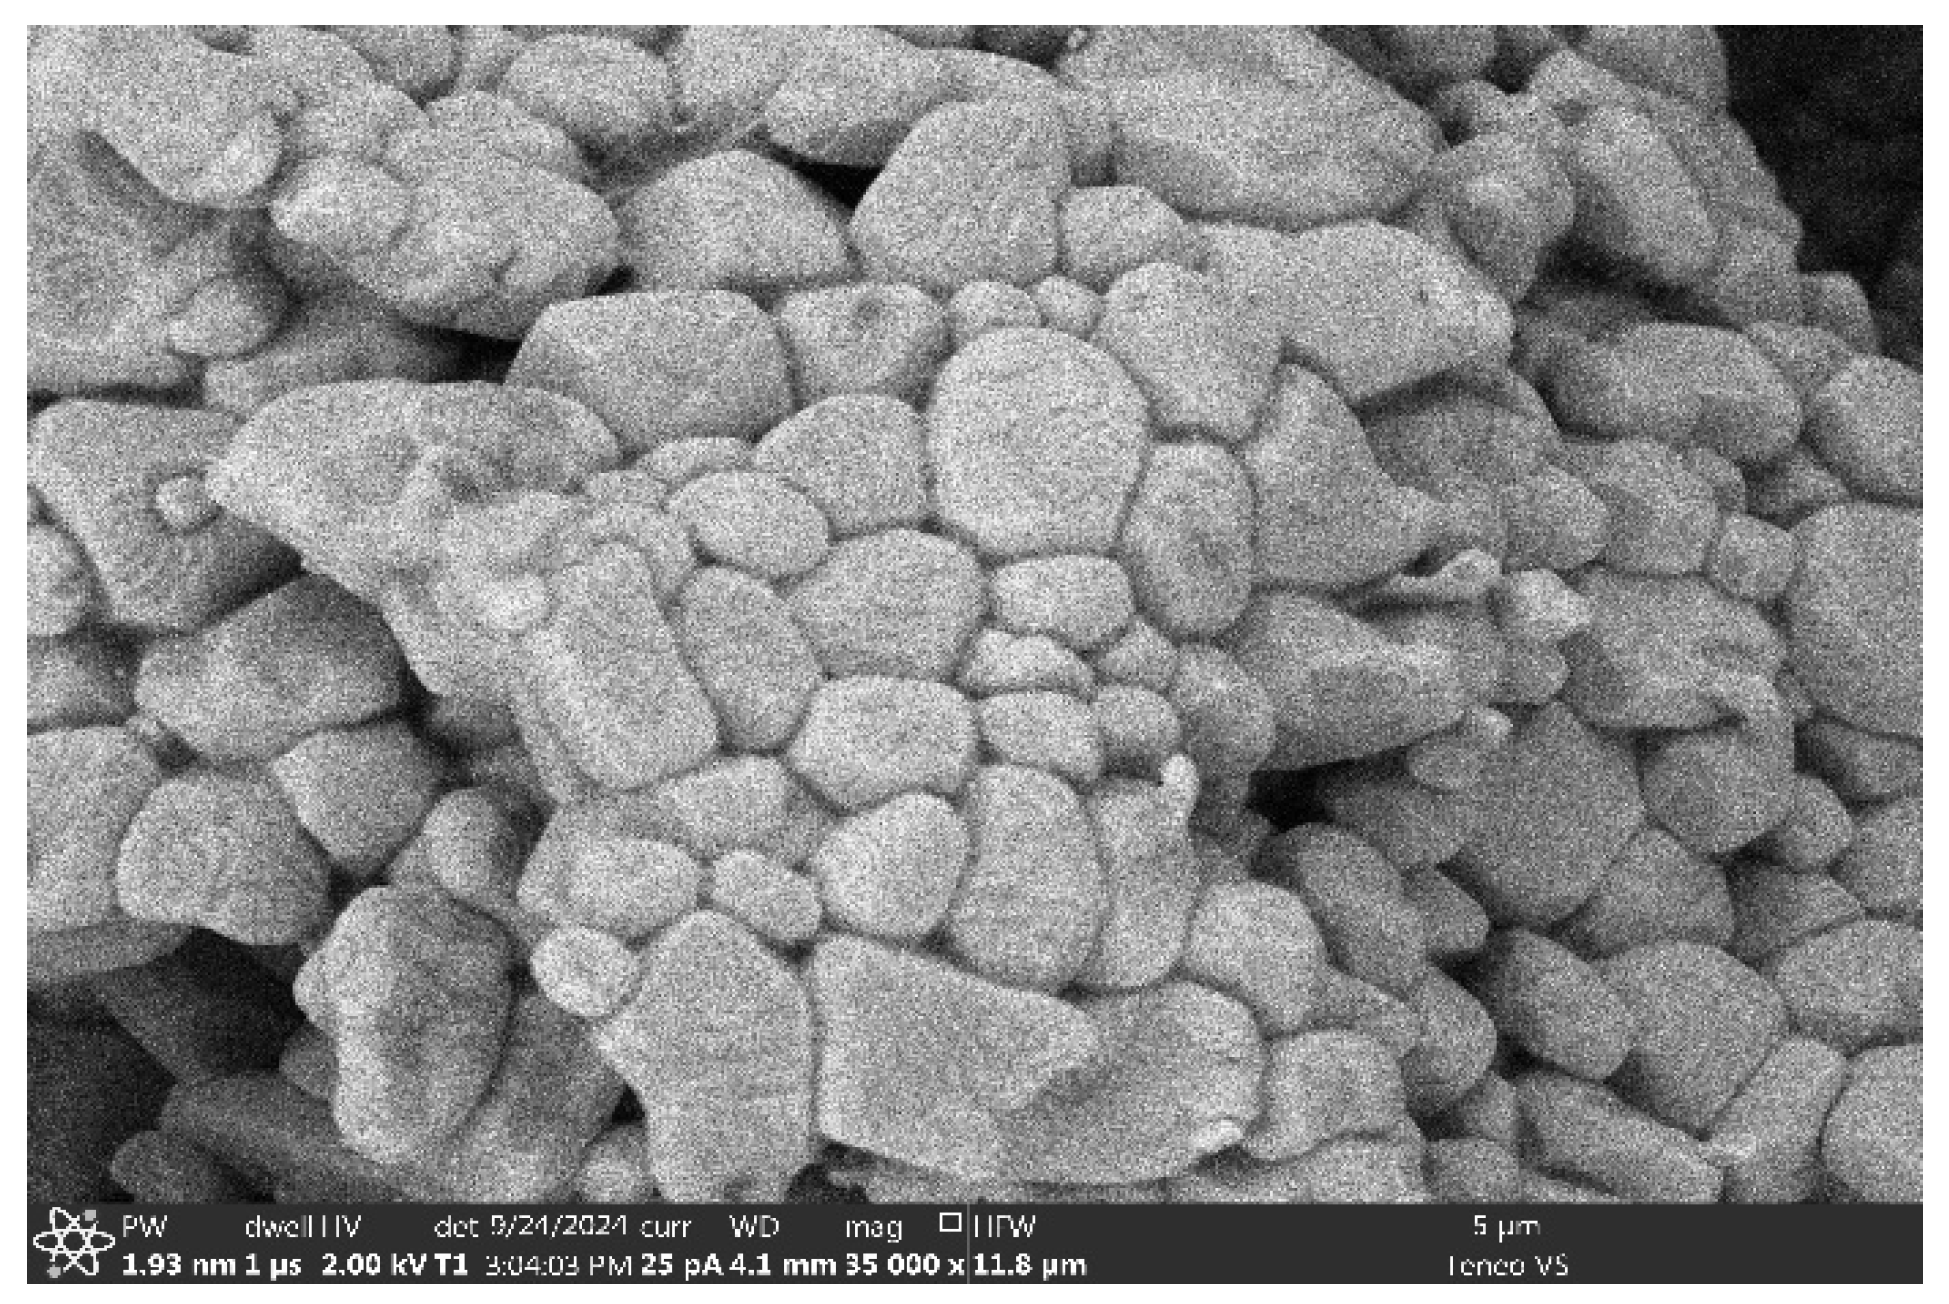
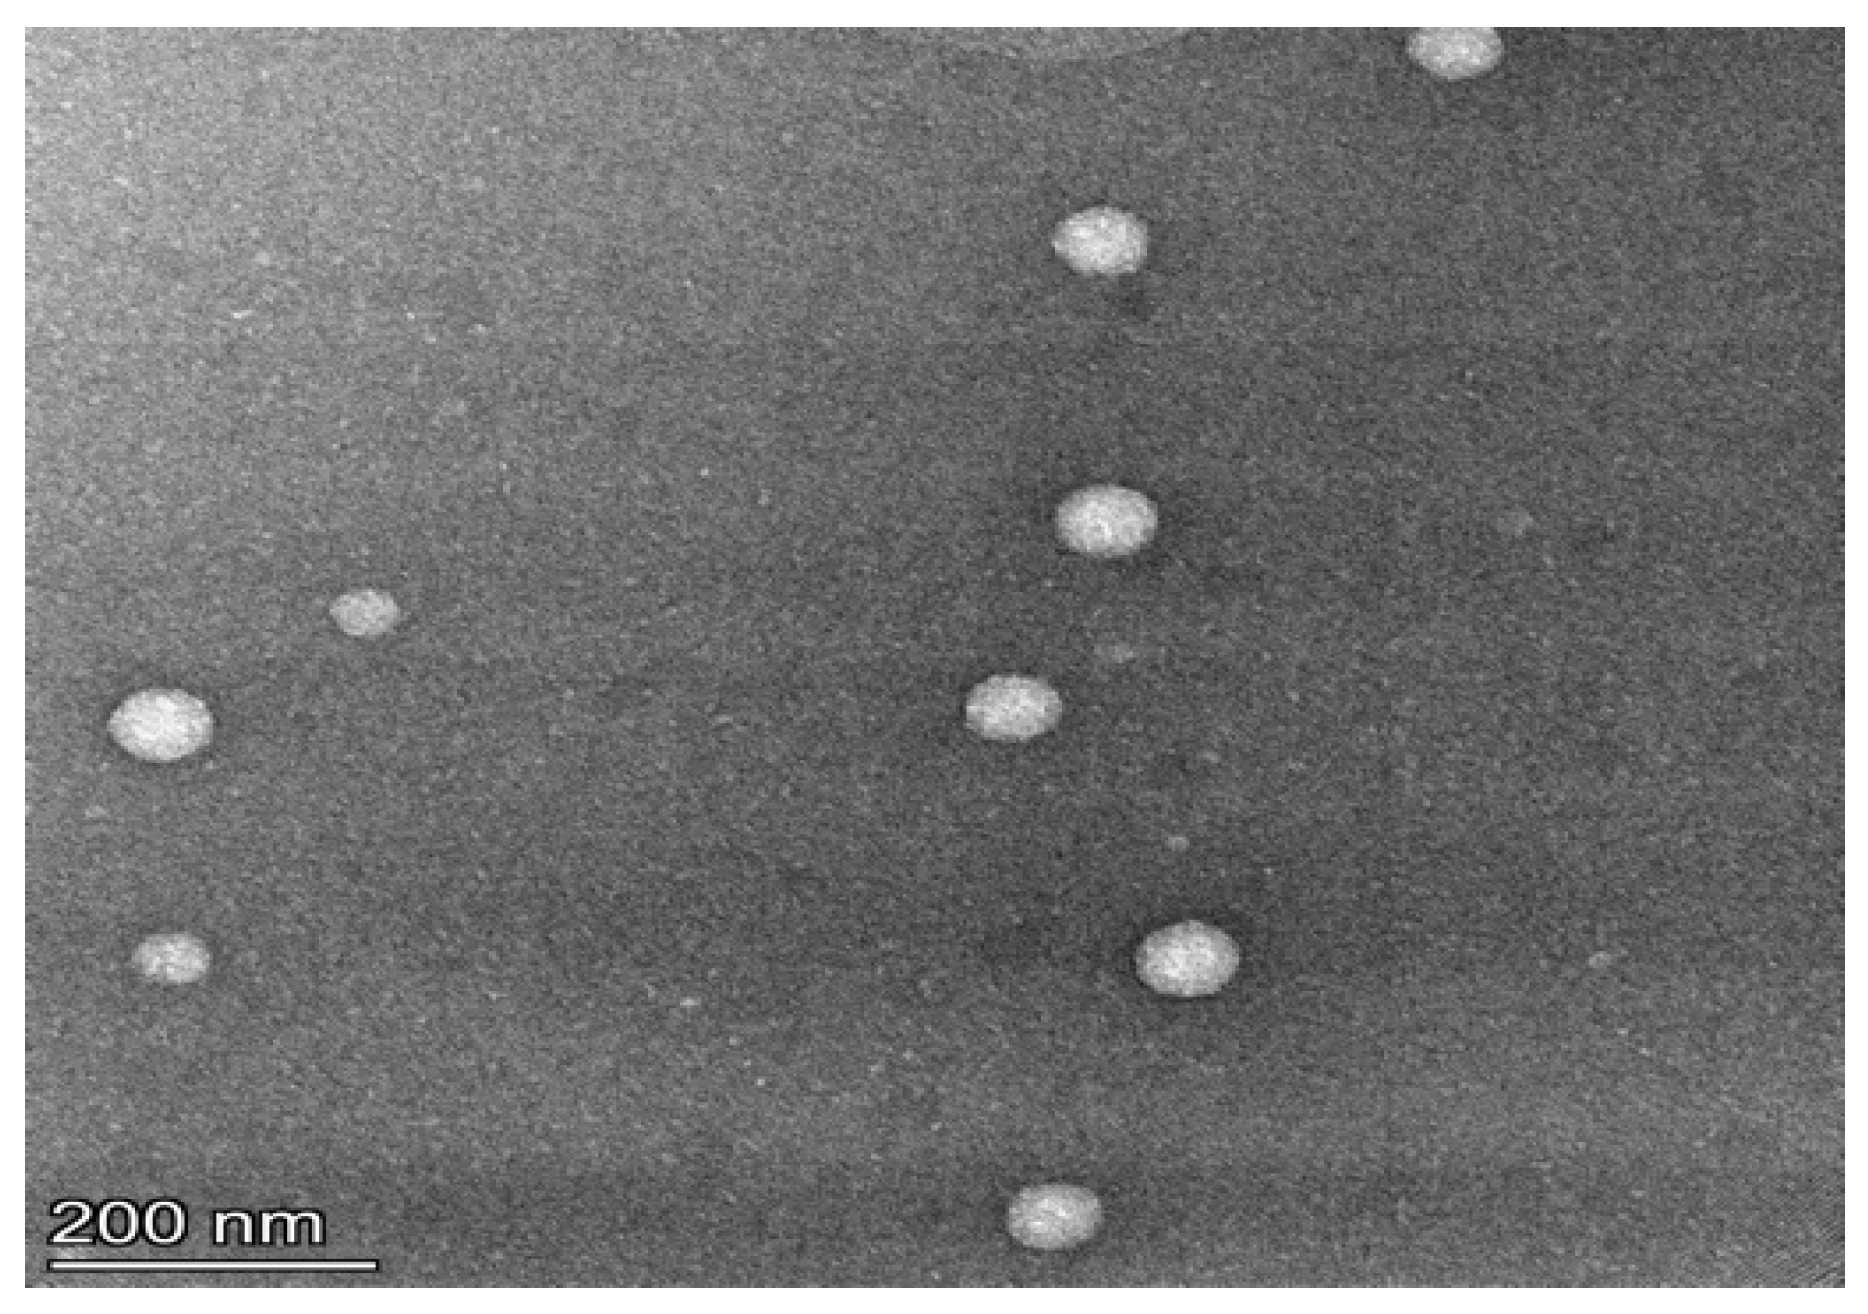
3.1. Niosomes Physicochemical Properties

3.1.1. Morphology, PDI and Zeta Potential

The SEM images of levofloxacin niosomes are shown in Figure 1(A & B). The vesicles were near spherical with an average polydispersity index (PDI) of 0.316 ± 0.014. Typical plots of size distribution and Zeta potential of niosomes are shown in Figure 2 A and B. The mean effective diameter of optimized drug-loaded niosomes was 368.8 ± 11.0 (SE) and mean Zeta potential was -42.10 (± 2.07 SE). The impact of input variables on niosomes characteristics are predicted by the equations 3 to 5:
Vesicle size (nm) = + 322.595 + 73.703(X1) - 76.230(X1 * X2) + 97.330(X2 * X3)
EE (%) = + 27.4283268221 + 4.3184604744 (X2 * X3)
Zeta = - 20.7239 + 19.1803(X2) + 34.7614(X3) + 32.9203(X1 * X2)
The interrelationsip of niosomes formers on vesicle size, encapsulation efficiency and zeta potential are sown in the responsse surface graphs in Figure 3A, B and C respectively.
Figure 3(A). Response surface for the interaction between input variables and their impact on (A) niosomes drug encapsulation.
Preprints 144176 g005
Figure 3(B). Response surface for the interaction between input variables and their impact on vesicle (niosomes) size.
Preprints 144176 g006
Figure 3(C). Response surface for the interaction between input variables and their impact on polydispersity index (PDI).
Preprints 144176 g007
The response surface graphs of niosomes properties and input variables are shown in Figure 3, B & C.

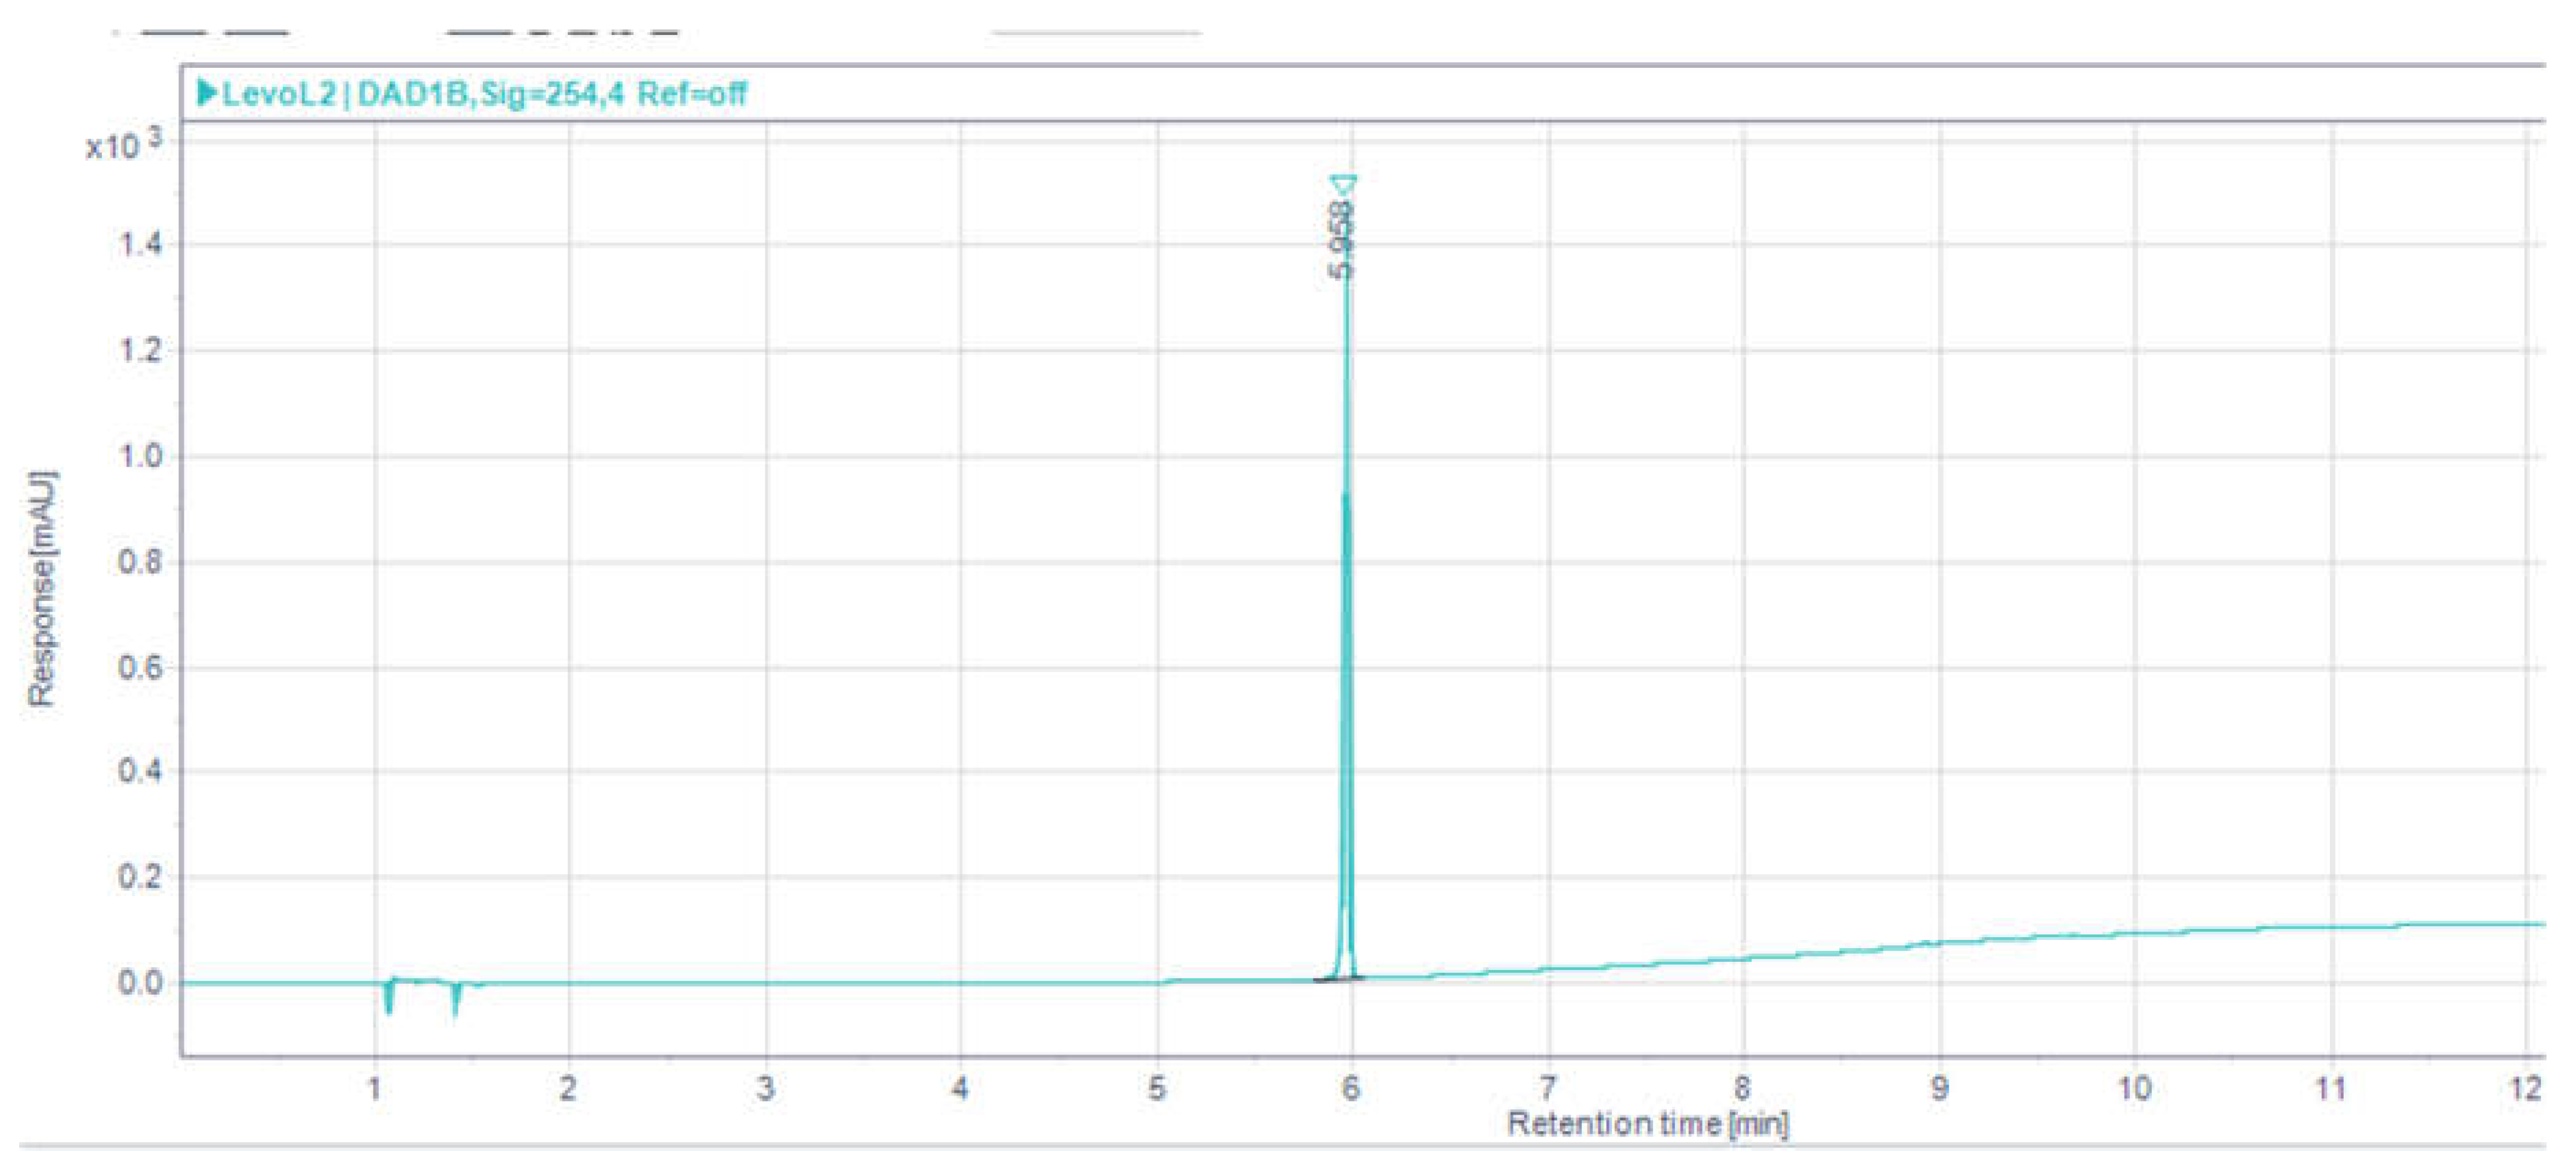
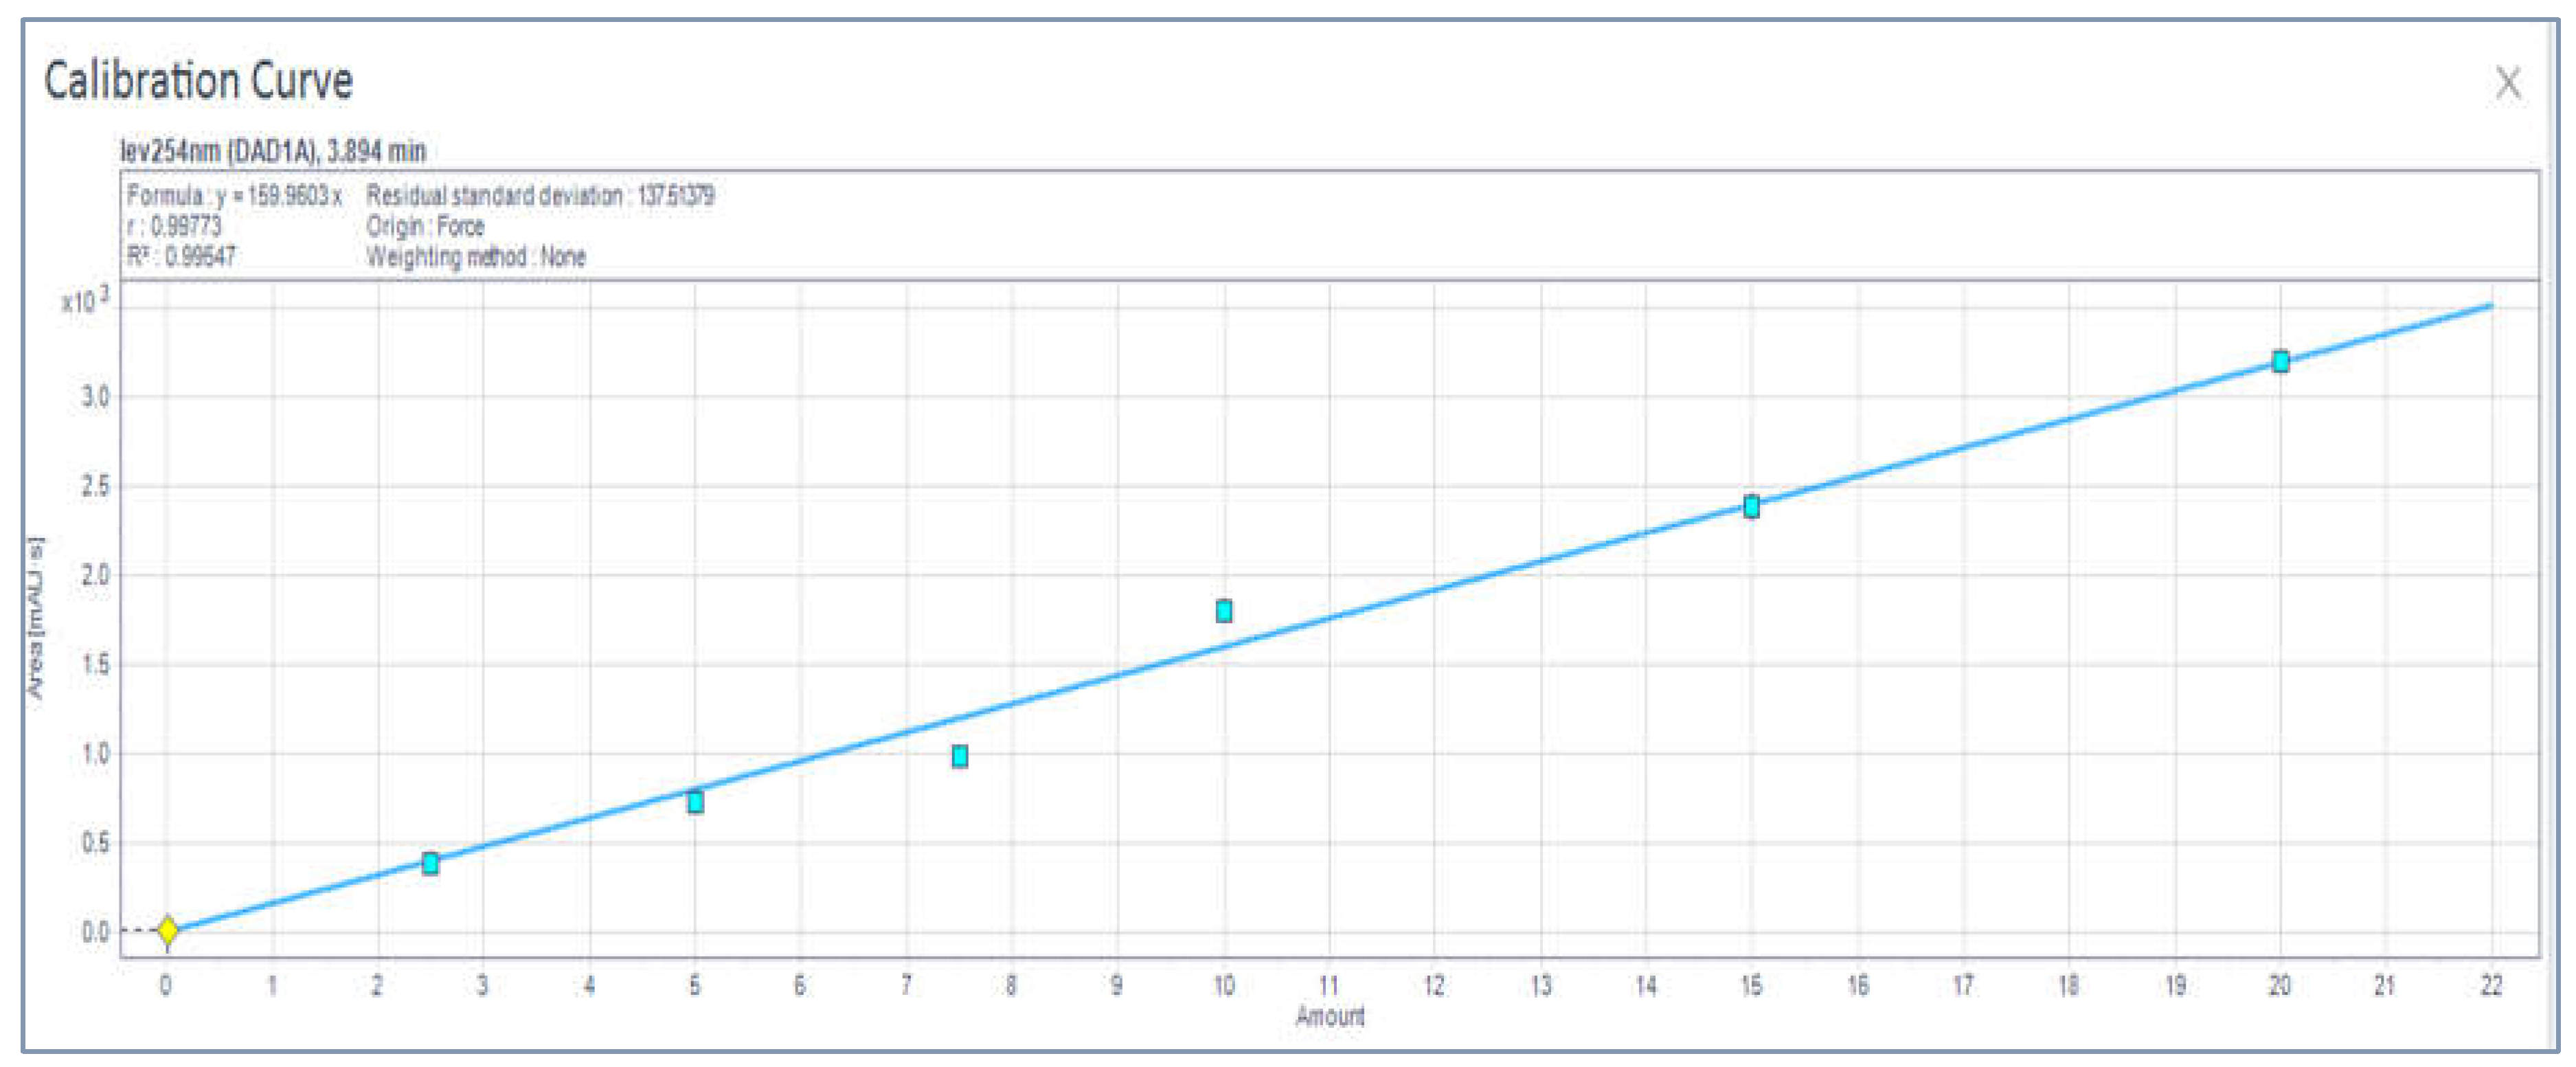
3.1. HPLC Analytical Method Parameters

The calibration samples of levofloxacin at different concentrations were prepared and analyzed on HPLC using parameters described in section 3.3.2.1. The chromatogram obtained using a mobile phase of water: acetonitrile (+0.75% trifluoro acetic acid, TFA) in gradient mode sowed levofloxacin elution at an average retention time of 5.8 min (±0.047) minutes (Figure 4A). The peak area obtained for each sample was plotted against the respective concentration (Figure 4B). The equation of the line (Eq. 1) obtained from the calibration curve was:
Peak Area = 294.06* Conc - 54.583
The correlation between peak area versus concentration plot was near perfect linearity with R² = 0.9987. The parameters of Eqn. 6 were used to convert areas of chromatograms obtained for the analytes to to drug concentrations and independently confirmed with intermittent analysis of known concentrations of reference samples interspersed between each set of analytes’ run on HPLC. The HPLC analytical parameters are shown in Table 4. The intraday and interday data stability are shown in Figure 5 while the accuracy and precision of the analytical method is shown in Table 5. The intraday and interday validation runs on HPLC showed variations less <6.12 % and the reproducibility with relative error less than 2.5% (Table 5). The upper and lower limits were within 95% and 110 %.

3.3. Drug Dissolution from Niosomes

The dissolution profile of levofloxacin from optimized niosomes formulation is shown in Figure 6. Less than 80 % was released in 6 h while about 90 was released in 12 h. Niosomes encapsulation effectively protected the drug from rapid release typical of the pure drug from conventional dosage forms. Niosomes formulation could extend the short half-life of pure levofloxacin.

3.2. Non-Compartmental Analysis (NCA) in GastroPlus™

Results of data treatment in PK module of the Gastroplus modeling and simulation software, indicated the weighted sum of squared errors = 7.7402E-1; and a weighting of 1/Yhat^2. Figures 7A, B and C display the results of levofloxacin concentration versus time (Cp vs t), log-transformed Cp vs t, and the plots of residuals respectively for levofloxacin formulation in niosomes. Similarly, Figures 8A, B and C display the respective results of pure drug levofloxacin following intra-peritoneal administration in rats. Plots in Figures 7A, B and C show discernible bi-exponential profiles of the respective Cp versus t and log Cp vs t plots, which are reflective of 2-compartment open model. The comparative bioavailability profiles of levofloxacin and its niosomes are shown in Figure 9.
The algorithmic search in Gastroplus for the most fitting PK model (using Hooke and Jeeves patterns search [34] and objective weighting of 1/Yhat^2) indicated that both Akaike information criteria (AIC) [37,37] and Schwartz criteria (SC) [38,39] support the two-compartment as the preferred model for PK of drug in niosomes and one-compartment as the preferred model for the PK of pure levofloxacin.

4. Discussion

Niosome Formulation and Characterization

Span 60 (SP60) was selected as niosomes-forming non-ionic, lipid soluble surfactant, cholesterol (CHOL) was used as membrane stabilizer and dicetyl phosphate (DCP) was used as charge inducer for the prepared niosomes based on our previous studies [9,31]) Using a 23 factorial experiment with four center points (total formulation = 12), levels of SP60, CHOL and DCP for the control niosomes were screened. Analysis of data from screening experiment with the Design of Experiment (DoE) model algorithm suggested Formulation 11, with SP60:CHOL:DCP (15:15:5), as the formulation with optimum balance of niosomes properties. From the DoE analytical parameters of Formulation 11, observed Encapsulation Efficiency (EE) was 34.21 % while predicted Encapsulation Efficiency was 34.04 %. The ordinary residual was 0.0263. Mean niosomes size was 368.8 ± 11.0 (SE), PDI was 0.316 ± 0.014 (SE), and Zeta potential was -42.10 ± 2.07 (SE). Formulation 11 (Table 1) was used for the BA studies in rats.
The size, PDI and zeta potential of niosomes are determined by the formulation ingredients and the media in the niosomes are suspended [40]. Zeta potential and particle size affect the thermodynamic properties of the niosomes. Because the smaller size niosomes have a larger surface-to-volume ratio, they tend to be more thermodynamically stable. The particle size distribution and polydispersity index (PDI) of niosomes can affect the processability, bulk properties, product appearance and biological performance of the end product [40]. Thus, reliable and reproducible analytical procedures for niosomes mean vesicle diameter, surface charge and heterogeneity are important fundamental quality control products parameters. The small niosmes sizes and the high value of Zeta potential imply good stability of the colloidal dispersion while the reasonably high %EE indicate ability to deliver therapeutic concentration of niosomess intravasculalerly via i.p. injections.

4.2. PK Modeling and Analysis

From the data generated for the NCA in Table 6, the AUC, AUMC, MRT, Cl and Vss are all above the 125% range for bioequivalence. Bioequivalence of a given product is conferred if the mean bioavailability of the product under consideration is within 80-125% of the reference formulation. From the perspective of pharmacokinetic modeling, the FDA 2003 guidance indicated that other parameters such as AUC (0-∞), AUC(0-tlast) and Cmax also be considered [41]. The values of AUC, AUMC and MRT were all significantly higher for the niosomal formulation than for the unentrapped drug (Table 6 and Table 7). The decreased volume of distribution, decreased clearance, and enhanced MRT and AUC are positive outcomes of niosomal encapsulation, which is indicative of the potential of niosomes to increase the drug’s therapeutic efficacy whilst concurrently minimizing its adverse effects. While the one-compartment behavior of levofloxacin niosomes and the corresponding increase of MRT and reduced CL and Vss cannot be easily explained, it appears that the niosomal formulation prevented rapid drug release and released it in a sustained manner. Therefore, the relative bioavailability and the MRT of the niosomes-encapsulated drug were increased above those of unencapsulated drug molecules.
Fluoroquinolones generally have superior ability to penetrate tissues [42] than other antibiotics and can penetrate organelles like macrophages and neutrophils to accentuate bactericidal activity [1,2,3] . Analysis of the data generated for one compartment model of levofloxacin shows several parameters’ differences between the niosome encapsulated formulations and the conventional pure drug. All parameters tested were out of the bioequivalence range indicating significant differences in their pharmacokinetic parameters. Differences in all parameters tested were significant at 95% confidence interval except for MRT, Vd and t1/2. Even though the MRT, Vd and t1/2 showed no significant difference, the MRT for the niosome formulation (40.62h) was 1.64 times higher than that of the unentrapped conventional formulation (24.66h). The same was observed for the t1/2 of the niosome entrapped drug (28.66h) which shows a half-life of 1.64 X that of the unentrapped drug (17.09h). Thus, niosome entrapped drug showed higher effect on all other parameters than the unentrapped drug. The only possible reason for this difference was the drug delivery system employed. Encapsulation in niosomes seems to restrict drug distribution, enhance plasma levels and allow for sustained release of drug molecules from the construct. In the two-compartment model (Table 8), only the values of Vc and Cmax were bioequivalent, with all other parameters falling outside of the stipulated 80-125% range. The data, however, were not significantly different as can be seen from the “t” values as well as the p values generated for this data (Table 8). Progression to the Three Compartmental analysis (Table 9) resulted in PK parameters losing reliability as the coefficient of variation increased dramatically.
The Hooke and Jeeves pattern search [34] also showed a difference in the release and pharmacokinetic characteristics of the two formulations. The patterns shown in Figures 5A & B indicate that niosome formulation shows a linear pattern of drug release. The initial post-absorption rate of drug release from the niosomal formulation was much slower and sustained than those from the conventional free drug Figure 6A & B. The logarithmic display for niosome (Figure 5B) and conventional drug (Figure 6B) show a clear difference in release pattern as the niosomes profile is linear compared to the nonlinear profile of the conventional drug. The plot of residuals for the niosomes-treated animals (Figure 5C) showed an even distribution around the horizontal axis that supports a linear profile of drug release. This even distribution was not seen in the plot for the conventional formulation (Figure 6C). The average Cp Vs time profiles for rats administered levofloxacin niosomes and those with pure levofloxacin are shown in Figure 7. Similar findings have been reported by other studies in literature. Ruckmani et al (2010) [43] and Ammar et al (2017)[44] showed that niosomes entrapment of the drugs enhanced the AUC, MRT and t1/2. Feitosa et al (2022) [45] developed a niosomal formulation of doxycycline using Span 60/Tween 60 and cholesterol via modified thin hydration method. The average size of the final formulation was 281.9 nm and encapsulation efficiency (EE) was 72.1%. A significantly lower minimum inhibitory concentration (MIC) against different Gram-positive and Gram-negative bacteria were reported, indicating higher antibacterial activity of doxycycline niosomes than that of the free drug [10,45] (Akbarzadeh et al., 2020; Feitosa et al, 2022).
Figure 7(A). Cp vs t for levofloxacin niosomes.
Preprints 144176 g012
Figure 7(B). log Cp vs t for levofloxacin niosomes.
Preprints 144176 g013
Figure 7(C). Plot of residuals for levofloxacin niosomes.
Preprints 144176 g014
PK parameters from data analysis in GastroPlusTM are reported with values for both SIC and AIC as model suitability indices (Table 10). To determine the model that best fit the drug exposure in the rats, model search was extended from non-compartmental (purely mechanistic) to physiologic models depicting the body compartments into 1, 2 or 3, depending on rate of perfusion and rapidity of equilibration between plasma (central compartment) and various organs (rapidly equilibrating organs and tissues) (Nestorov et al, 1998; Jeong et al, 2022) [46,47]. While noting that PK models cannot indicate the absolute physiologic or anatomic location of drug molecules as they traverse the body of an animal (Burnham et al, 2002) [48], a close approximation of one model relative to another may provide the most accurate representation of drug exposure systemically. Since presently, many drugs needed to be administered at sufficient doses to obtain require dose at the desire site of action, which, often times, may be outside of the plasma compartment, PK parameters selected based on the most predictive model could be advantageous in the choice of delivery design that would provide the most efficient drug dosing. For instance, as was previously reported [31] (Jankie, et al, 2012), a 50 % reduction in MIC/MBC of some fluoroquinolones niosomes (including levofloxacin, gatifloxacin and ciprofloxacin) on P. aeruginosa, E. coli and S. aureus could enable dose reduction if the PK parameters indicate that drug perfusion is concurrently enhanced by niosomes encapsulation of the drug molecules. Therefore, the slower rate of distribution of niosomes-encapsulated levofloxacin from plasma to the extravascular compartment (niosomes kz = 0.025; pure drug kz = 0.041) and the significantly higher mean residence time (MRT, Figure 8) suggest a high potential for the translation of the observed reduction in MIC/MBC in vitro to in vivo microenvironment.
Figure 8(A). Cp vs t for pure unenca sulated levofloxacin.
Preprints 144176 g015
Figure 8(B). log Cp vs t for pure unencapsulated levofloxacin.
Preprints 144176 g016
Figure 8(C). Plot of residuals for pure, unencapsulated levofloxacin.
Preprints 144176 g017
Encapsulation in sub-microscopic particles generally has been associated with improved bioavailability. Until recently, liposomes have been used extensively to improve the pharmacokinetic profile of drugs for administration via different routes (Xie et al, 2016; Bayindir et al, 2015) [49,50]. The results of those studies indicate the ability of the drug carrier to preserve the drug en route distribution channels to thhe plasma, protect it from the external environment and preferentially deliver it to the site where its action is needed. These outcomes have inspired the FDA approval of some liposomal formulations for clinical use. However, the short in vivo fate of liposomes is a limiting factor and studies have focused on improving its circulation time [49]. Unlike liposomes, niosomes are cheaper to produce and do not require special storage and handling conditions. Hence, recent attention has been focused on niosomal drug delivery as in this study. Taken together with our previous report [31], this PK model analysis indicates that niosomes encapsulation of levofloxacin, by concentrating the drug in the intravascular compartment, preventing its binding to plasma protein, and preventing bacteria sensing of drug molecules that are enveloped in lipid vesicles (niosomes), has the potential to obviate the resistance development, which is currently limiting the efficacy of the drug.

5. Conclusions

Formulation containing Span 60, Cholesterol and dihexadecyl phosphate at 15:15:5 molar ratio produced encapsulation Efficiency (EE) of 34.21, mean niosomes size of 354 ± 11.0 (SE), PDI of 0.316 ± 0.014 (SE), and Zeta potential of -42.10 ± 2.07 (SE). This levofloxacin-loaded formulation was used for the BA studies in rats. All PK parameters tested were out of the bioequivalence range indicating significant differences in pharmacokinetic parameters of nioencapsulated via non-encapsulated levofloxacin. Differences in all parameters tested were significant at 95% confidence interval except for Vd and t1/2. The MRT for the niosome formulation (40.62h) was 1.64 times higher than that of the unentrapped conventional formulation (24.66h). The same was observed for the t1/2 of the niosome entrapped drug (28.66h) which shows a half-life of 1.64 X that of the unentrapped drug (17.09h). Thus, niosome entrapped drug showed higher valuess for all PK parameters than the unentrapped drug. The only possible reason for this difference was the drug delivery system employed. Encapsulation in niosomes seems to restrict drug distribution, increased intravascular drug concentration and enabled sustained release of drug molecules from the construct. Thus, encapsulation of levofloxacin in niosomes altered its pharmacokinetic profile. Niosomes appear to protect levofloxacin en route into plasma, altering its binding to plasma protein and increasing its residence time in systemic circulation, suggesting a significant potential for the delivery of the drug to intravascular bacteria. Taken together with our previous report [31], this PK model analysis indicates that niosomes encapsulation of levofloxacin, by concentrating the drug in the intravascular compartment, preventing its binding to plasma protein, and preventing bacteria sensing of drug molecules that are enveloped in lipid vesicles (niosomes), has the potential to obviate the resistance development, which is currently limiting the efficacy of the drug. Furthers studies are needed to confirm intracellular delivery and the delivery mechanisms of niosomes-encapsulated levofloxacin into multi-drug resistant bacterial cells.

Author Contributions

Conceptualization, ASA, SJ and LPP; methodology, ASA, JJ & SJ.; software, ASA& SKA; validation, ASA, SJ, SKA, KA., and JJ; formal analysis, ASA, KA, SJ.; investigation, SJ, JJ, and ASA.; resources, ASA, SJ, JJ.; data curation, ASA, SJ, KA.; writing—original draft preparation, SJ and ASA.; writing—review and editing, ASA, LPP, SKA.; visualization, ASA; supervision, ASA and LPP.; project administration, ASA and SJ; funding acquisition, ASA. All authors have read and agreed to the published version of the manuscript.

Funding

This research was funded by the Georgetown Howard Universities Center for Clinical and Translational Science (GHUCCTS)-Pilot Translational and Clinical Studies, Grant #: GRT000558.

Institutional Review Board Statement

The animal study protocol was approved by the Animal Ethics Committee, Faculty of Medical Sciences, University of the West Indies and the Institutional Review Board of Howard University (IBC-2023-0015 of 10/18/2023).

Informed Consent Statement

“Not applicable.”

Data Availability Statement

The data presented in this study are available on request from the corresponding author due to related studies that are ongoing and pending patent applications.

Acknowledgments

The authors acknowledge the gift of Gastroplus PK Modeling and Simulations software by the Simulations Plus, Inc. (NASDAQ: SLP) 42505 10th Street West | Lancaster, CA 93534 | United States.

Conflicts of Interest

The authors declare no conflicts of interest. The funders had no role in the design of the study; in the collection, analyses, or interpretation of data; in the writing of the manuscript; or in the decision to publish the results.

Abbreviations

The following abbreviations are used in this manuscript:
HPLC High Pressure Liquid Chromatography
EE Encapsulation Efficiency
AIC Akaike information criteria (AIC)
BIC Bayesian information criterion
SC Schwartz criteria (SC)
MRT Mean Residence time
Vd Volume of distribution
t1/2 Elimination half-life
AUC Area under the Plasma Concentration Versus Time Plot
AUMC Area Under the First Moment Curve
SMEDDS Self-microemulsifying Drug Delivery System
SCF Super Critical Fluid
BCS Biopharmaceutics Classification System
CHOL Cholesterol
DCP Dicetyl phosphate
SAA Surface Active Agent
SEM Scanning Electron Microscope
TEM Transmission Electron Microscope
PDI Polydispersity Index
Cl Clearance
Vss Volume of distribution at steady state
Cmax Maximum plasma concentration
Vc Volume of (distribution) central compartment

References

  1. Nix DE, Goodwin SD, Peloquin CA, Rotella DL, Schentag JJ. Antibiotic tissue penetration and its relevance: models of tissue penetration and their meaning. Antimicrob Agents Chemother. 1991; 35:1947–52. [CrossRef]
  2. Dalhoff A. A review of quinolone pharmacokinetics. In: Fernandes PB,editor. Tele-symposium on quinolones: Barcelona, Spain: JR Prous Science Publishers; 1989. 277-312.
  3. Easmon CS, Crane JP. Uptake of ciprofloxacin by human neutrophils. J Antimicrob Chemother. 1985;16(1):67–73. [CrossRef]
  4. Rastogi N, Blom-Potar MC. Intracellular bactericidal activity of ciprofloxacin and ofloxacin against Mycobacterium tuberculosis H37Rv multiplying in the J-774 macrophage cell line. Zentralbl Bakteriol. 1990;273(2):195–9. [CrossRef]
  5. Nikaido H, Vaara M. Molecular basis of bacterial outer membrane permeability. Microbiol Rev. 1985;49(1):1–32. [CrossRef]
  6. Hancock REW, Raffle VJ, Nicas TI. Involvement of the outer membrane in gentamicin and streptomycin uptake and killing in Pseudomonas aeruginosa. Antimicrob Agents Chemother. 1981;19(5):777–85. [CrossRef]
  7. Bedard J, Wong S, Bryan LE. Accumulation of enoxacin by Escherichia coli and Bacillus subtilis. Antimicrob Agents Chemother. 1987;31(9):1348–54. [CrossRef]
  8. Koeppe MO, Cristofoletti R, Fernandes EF, Storpirtis S, Junginger HE, Kopp S, Midha KK, Shah VP, Stavchansky S, Dressman JB, Barends DM. Biowaiver monographs for immediate release solid oral dosage forms: Levofloxacin. Journal of Pharmaceutical Sciences. 2011 May 1;100(5):1628-36. [CrossRef]
  9. Jankie S, Johnson J, Pinto Pereira LM, Adebayo AS, Pillai GK. Acute and Subacute Toxicity of Sorbitan Monostearate (Span 60) Non-ionic Surfactant Vesicles (Niosomes) in Sprague Dawley Rats. British Journal of Pharmaceutical Research. 2016; 14. 1-9. [CrossRef]
  10. Akbarzadeh, I., Yaraki, M. T., Bourbour, M., Noorbazargan, H., Lajevardi, A., Shilsar, S. M. S., ... & Mousavian, S. M. (2020). Optimized doxycycline-loaded niosomal formulation for treatment of infection-associated prostate cancer: An in-vitro investigation. Journal of Drug Delivery Science and Technology, 57, 101715. [CrossRef]
  11. Paganoni R, Herzog C, Braunsteiner A, Hohl P. Fleroxacin: in-vitro activity worldwide against 20,807 clinical isolates and comparison to ciprofloxacin and norfloxacin. J Antimicrob Chemother. 1988;22 Suppl D:3–17. [CrossRef]
  12. Subramaniam, S., Joyce, P., Thomas, N., & Prestidge, C. A. (2021). Bioinspired drug delivery strategies for repurposing conventional antibiotics against intracellular infections. Advanced Drug Delivery Reviews, 177, 113948. [CrossRef]
  13. Fröhlich E. The role of surface charge in cellular uptake and cytotoxicity of medical nanoparticles. International journal of nanomedicine. 2012 Nov 2:5577-91. [CrossRef]
  14. Fish DN, Chow AT. The clinical pharmacokinetics of levofloxacin. Clin Pharmacokinet. 1997 Feb;32(2):101-19. [CrossRef]
  15. Bilardi C, Dulbecco P, Zentilin P, Reglioni S, Iiritano E, Parodi A, Accornero L, Savarino E, Mansi C, Mamone M, Vigneri S. A 10-day levofloxacin-based therapy in patients with resistant Helicobacter pylori infection: a controlled trial. Clinical Gastroenterology and Hepatology. 2004 Nov 1;2(11):997-1002.
  16. Hu Y, Zhang M, Lu B, Dai J. Helicobacter pylori and antibiotic resistance, a continuing and intractable problem. Helicobacter. 2016 Oct;21(5):349-63.
  17. Maeda, Y., Takahashi, Y., Naika, Y., Maeda, T., Otsuka, Y., Saeki, Y., Otani, S., Kohama, K., Hieda, Y., Goromaru, T., Eto, S., & Murakami, T. (2023). Ester Prodrugs of Levofloxacin to Prevent Chelate Formation in Presence of Aluminium Ion. Pharmaceutical Sciences, 29(1), 65-74. [CrossRef]
  18. Adeyeye MC, Adebayo A. Hard Shell Capsules in Clinical Trials. In Pharmaceutical Dosage Forms 2017 Oct 30 (pp. 31-74). CRC Press.
  19. Stasiłowicz A, Tykarska E, Rosiak N, Sałat K, Furgała-Wojas A, Plech T, Lewandowska K, Pikosz K, Pawłowicz K, Cielecka-Piontek J. The Inclusion of tolfenamic acid into cyclodextrins stimulated by microenvironmental pH modification as a way to increase the anti-migraine effect. Journal of Pain Research. 2021 Apr 14:981-92. [CrossRef]
  20. Mu H, Holm R. Solid lipid nanocarriers in drug delivery: characterization and design. Expert opinion on drug delivery. 2018 Aug 3;15(8):771-85. [CrossRef]
  21. Bagheri H, Notej B, Shahsavari S, Hashemipour H. Supercritical carbon dioxide utilization in drug delivery: Experimental study and modeling of paracetamol solubility. European Journal of Pharmaceutical Sciences. 2022 Oct 1;177:106273. [CrossRef]
  22. Sheikhi-Kouhsar M, Bagheri H, Alsaikhan F, Aldhalmi AK, Ahmed HH. Solubility of digitoxin in supercritical CO2: Experimental study and modeling. European Journal of Pharmaceutical Sciences. 2024 Apr 1;195:106731. [CrossRef]
  23. Hosseini S, Mehrtash M, Khamesee MB. Design, fabrication and control of a magnetic capsule-robot for the human esophagus. Microsystem technologies. 2011 Jun;17:1145-52. [CrossRef]
  24. Kazemi M, Emami J, Hasanzadeh F, Minaiyan M, Mirian M, Lavasanifar A. Pegylated multifunctional pH-responsive targeted polymeric micelles for ovarian cancer therapy: synthesis, characterization and pharmacokinetic study. International Journal of Polymeric Materials and Polymeric Biomaterials. 2021 Sep 22;70(14):1012-26.
  25. Blokhina SV, Sharapova AV, Ol'khovich MV, Volkova ТV, Perlovich GL. Solubility, lipophilicity and membrane permeability of some fluoroquinolone antimicrobials. European Journal of Pharmaceutical Sciences. 2016 Oct 10;93:29-37. [CrossRef]
  26. Behroozi R, Dehghanian E. Drug repurposing study of levofloxacin: Structural properties, lipophilicity along with experimental and computational DNA binding. Journal of Molecular Liquids. 2024 Jun 6:125218. [CrossRef]
  27. Islan GA, Tornello PC, Abraham GA, Duran N, Castro GR. Smart lipid nanoparticles containing levofloxacin and DNase for lung delivery. Design and characterization. Colloids and Surfaces B: Biointerfaces. 2016 Jul 1;143:168-76. [CrossRef]
  28. Cicuendez M, Izquierdo-Barba I, Portolés MT, Vallet-Regí M. Biocompatibility and levofloxacin delivery of mesoporous materials. European Journal of Pharmaceutics and Biopharmaceutics. 2013 May 1;84(1):115-24. [CrossRef]
  29. Konreddy AK, Rani GU, Lee K, Choi Y. Recent drug-repurposing-driven advances in the discovery of novel antibiotics. Current medicinal chemistry. 2019 Aug 1;26(28):5363-88. [CrossRef]
  30. Derbali RM, Aoun V, Moussa G, Frei G, Tehrani SF, Del’Orto JC, Hildgen P, Roullin VG, Chain JL. Tailored nanocarriers for the pulmonary delivery of levofloxacin against Pseudomonas aeruginosa: a comparative study. Molecular pharmaceutics. 2019 Mar 22;16(5):1906-16. [CrossRef]
  31. Jankie S, Adebayo AS, Pillai G. In vitro activities of fluoroquinolones entrapped in non-ionic surfactant vesicles against ciprofloxacin-resistant bacteria strains. J Pharm Technol Drug Res.2012; 1:1–1.
  32. Uchegbu IF, Florence AT. Non-ionic surfactant vesicles (niosomes): physical and pharmaceutical chemistry. Advances in colloid and interface science. 1995 Jun 27;58(1):1-55. [CrossRef]
  33. National Institutes of Health (US). Animal Research Committee, & NIH Office of Animal Care. (1999). Using Animals in Intramural Research: Guidelines for Investigators and Guidelines for Animal Users. NIH Animal Research Advisory Committee.
  34. Hooke, R., & Jeeves, T. A. (1961). “Direct Search'' Solution of Numerical and Statistical Problems. Journal of the ACM (JACM), 8(2), 212-229. [CrossRef]
  35. Wadham JJB, Townsend P, Morton DB. Intraperitoneal injection of sodium pentobarbital as a method for euthanasia for rodents. Australian and New Zealand Council for the care of animals in research and teaching. 1997; 10 (4): 8.
  36. Siefert, C. M. (2000). Model-assisted pattern search (Doctoral dissertation, College of William and Mary).
  37. Akaike, H. (1974). A new look at the statistical model identification. IEEE transactions on automatic control, 19(6), 716-723. [CrossRef]
  38. Sugiura, N. (1978). Further analysis of the data by akaike's information criterion and the finite corrections: Further analysis of the data by akaike's. Communications in Statistics-theory and Methods, 7(1), 13-26.
  39. Schwarz, G. (1978). Estimating the dimension of a model. The annals of statistics, 461-464. [CrossRef]
  40. Danaei M, Dehghankhold M, Ataei S, Hasanzadeh Davarani F, Javanmard R, Dokhani A, Khorasani S, Mozafari MR. Impact of Particle Size and Polydispersity Index on the Clinical Applications of Lipidic Nanocarrier Systems. Pharmaceutics. 2018 May 18;10(2):57. [CrossRef]
  41. Zhang, Q., Deng, C., Fu, Y., Sun, X., Gong, T., & Zhang, Z. (2016). Repeated administration of hyaluronic acid coated liposomes with improved pharmacokinetics and reduced immune response. Molecular pharmaceutics, 13(6), 1800-1808. [CrossRef]
  42. Hurtado FK, Weber B, Derendorf H, Hochhaus G, Dalla Costa T. Population pharmacokinetic modeling of the unbound levofloxacin concentrations in rat plasma and prostate tissue measured by microdialysis. Antimicrobial agents and chemotherapy. 2014 Feb;58(2):678-86. [CrossRef]
  43. Ruckmani K, Sankar V, Sivakumar M. Tissue distribution, pharmacokinetics and stability studies of zidovudine delivered by niosomes and proniosomes. Journal of biomedical nanotechnology. 2010 Feb 1;6(1):43-51. [CrossRef]
  44. Ammar HO, Haider M, Ibrahim M, El Hoffy NM. In vitro and in vivo investigation for optimization of niosomal ability for sustainment and bioavailability enhancement of diltiazem after nasal administration. Drug delivery. 2017 Jan 1;24(1):414-21. [CrossRef]
  45. Feitosa RC, Ishikawa ES, da Silva MF, da Silva-Junior AA, Oliveira-Nascimento L. Five decades of doxycycline: Does nanotechnology improve its properties? International journal of pharmaceutics. 2022 Apr 25; 618:121655.
  46. Nestorov IA, Aarons LJ, Arundel PA, Rowland M. Lumping of whole-body physiologically based pharmacokinetic models. Journal of pharmacokinetics and biopharmaceutics. 1998 Feb;26:21-46. [CrossRef]
  47. Jeong YS, Kim MS, Chung SJ. Determination of the number of tissue groups of kinetically distinct transit time in whole-body physiologically based pharmacokinetic (PBPK) models I: theoretical consideration of bottom-up approach of lumping tissues in whole-body PBPK. The AAPS journal. 2022 Aug 24;24(5):90. [CrossRef]
  48. Burnham KP, Anderson DR, editors. Model selection and multimodel inference: a practical information-theoretic approach. New York, NY: Springer New York; 2002 Jul.
  49. Xie Q, Deng W, Yuan X, Wang H, Ma Z, Wu B, et al. Selenium-functionalized liposomes for systemic delivery of doxorubicin with enhanced pharmacokinetics and anticancer effect. Eur J Pharm Biopharm.2018; 122, 87-95. [CrossRef]
  50. Bayindir ZS, BEŞİKCİ A, Yüksel N. Paclitaxel-loaded niosomes for intravenous administration: pharmacokinetics and tissue distribution in rats. Turkish journal of medical sciences. 2015;45(6):1403-12.
Figure 1(A). Scanning electron microscope of levofloxacin niosomes.
Preprints 144176 g001
Figure 1(B). Transmission electron microscopy of levofloxacin niosomes.
Preprints 144176 g002
Figure 2(A). Typical niosomes size distribution (Effective diameter: 354 ± 11.0 (SE); PDI: 0.316 ± 0.014 (SE).
Preprints 144176 g003
Figure 2(B). typical Zeta potential of levofloxacin niosomes (Zeta potential: -42.10 ± 2.07 (SE)).
Preprints 144176 g004
Figure 4(A). Typical chromatogram of levofloxacin on reverse phase HPLC column (ACN:H2O, +0.75%TFA gradient mode).
Preprints 144176 g008
Figure 4(B). Reverse phase HPLC calibration curve for levofloxacin in method (ACN:H2O; 60:40).
Preprints 144176 g009
Figure 5. Intra-day and inter-day stability of levofloxacin concentrations during HPLC analysis.
Preprints 144176 g010
Figure 6. Dissolution profiles of levofloxacin-loaded niosome.
Preprints 144176 g011
Figure 9. Average Cp Vs times for rats administered levofloxacin niosomes and those with pure levofloxacin.
Preprints 144176 g018
Figure 10. Mean residence time (MRT) of niosomes vs pure drug levofloxacin.
Preprints 144176 g019
Disclaimer/Publisher’s Note: The statements, opinions and data contained in all publications are solely those of the individual author(s) and contributor(s) and not of MDPI and/or the editor(s). MDPI and/or the editor(s) disclaim responsibility for any injury to people or property resulting from any ideas, methods, instructions or products referred to in the content.
Copyright: This open access article is published under a Creative Commons CC BY 4.0 license, which permit the free download, distribution, and reuse, provided that the author and preprint are cited in any reuse.

Downloads

61

Views

37

Comments

0

Subscription

Notify me about updates to this article or when a peer-reviewed version is published.

Email

Prerpints.org logo

Preprints.org is a free preprint server supported by MDPI in Basel, Switzerland.

Subscribe

© 2025 MDPI (Basel, Switzerland) unless otherwise stated