1. Introduction
This study explores the effect of the cash conversion cycle (CCC) on firm profitability, the nonlinearity of the CCC effect, and how this effect varies with a country's overall economic conditions. Broadly defined, the CCC is the time it takes for a firm to convert cash outflows (from purchases) into cash inflows (from sales). Working capital management, a significant component of CCC, is a complex process due to the intricate relationship between current assets and current liabilities. Creating an optimal structure of these components and managing their interrelationship remains a crucial responsibility for financial managers. The complexity is heightened by the opportunity cost of holding current assets instead of investing in non-current assets. This trade-off between working capital (mainly cash) and other assets varies temporally and cross-sectionally, influenced by market conditions and firm-specific factors.
The relationship between CCC and firm performance has been widely studied, yet the findings remain mixed and unsettled. Numerous studies (e.g., Nobanee et al., 2011; Wang, 2019; Yazdanfar & Öhman, 2014; Zeidan & Shapir, 2017; Deari & Palomba, 2024) have found a negative relationship between CCC and firm performance, arguing that shorter CCCs improve working capital management and, consequently, profitability. On the other hand, some studies (e.g., Panigrahi, 2013; Zakari & Saidu, 2016) have found a positive relationship, suggesting that a longer CCC serves as a buffer during financial hardships and provides insurance against delayed receivables. Additionally, Chen et al. (2022) demonstrated significant evidence of CCC's impact on profitability, further highlighting the variability in findings.
Several scholars have also investigated the non-linear relationship between CCC and profitability. For example, Fernandes et al. (2021) identified an inverted U-shaped relationship, arguing that an optimal CCC level exists where profitability is maximized. According to their findings, firms with excessively short CCCs may miss opportunities for higher performance, while firms with excessively long CCCs experience diminished profitability. Supporting studies (e.g., Deari & Palomba, 2024; Rey-Ares et al., 2021; Zeidan & Shapir, 2017) emphasize the importance of CCC as a dynamic metric reflecting the relationship between the debtors' collection period, creditors' deferral period, and inventory conversion period. As a versatile tool for analyzing working capital management (Anser & Malik, 2013), CCC enables firms to adopt aggressive, neutral, or conservative strategies based on their business needs, targets, and operating environments. Additionally, working capital policies influence broader financial decisions, including how firms are financed.
The role of CCC in economic uncertainty, such as during economic crises (measured by negative real GDP growth), has been explored less. A few exceptions include studies by Chen et al. (2018) and Carnes et al. (2023), highlighting how cash reserves can serve as critical buffers during economic crises, mitigating adverse effects on firm performance. These studies suggest that the relationship between CCC and profitability may shift during economic downturns depending on the firm's ability to effectively manage liquidity and working capital.
This study focuses on firms operating in Germany, Spain, France, Great Britain, and Italy from 2006 to 2015, encompassing the 2008 financial crisis and its aftermath. Including these countries provides a diverse economic context to examine the role of CCC under varying economic conditions.
Two gaps in the literature emerge from the empirical investigations on CCC and firm profitability. First, the direction of the relationship between CCC and firm performance remains unsettled, compounded by evidence suggesting a potential non-linear relationship. Second, limited research examines the sensitivity of CCC's effect on firm performance during periods of economic uncertainty. Despite extensive research, these gaps remain unexplored in detail.
This paper addresses these issues by investigating two research questions: (1) whether the relationship between CCC and profitability is non-linear and (2) whether the CCC-profitability relationship is sensitive to a country's economic conditions, particularly during crises. By addressing these questions, this study seeks to contribute to the existing literature by exploring the non-linear effect of CCC on profitability and the sensitivity of this relationship to economic uncertainty.
The rest of the paper is organized as follows:
Section 2 presents a literature review of previous studies and hypothesis development;
Section 3 outlines the methodology and data inspections;
Section 4 presents empirical findings and discussions; and
Section 5 offers conclusions and policy implications.
2. Literature Review and Hypothesis Development
In this section, we will review the related studies regarding the relationship between CCC and firm profitability, the nonlinearity of this effect, and the impact of economic crises on this relationship. We will then use these related studies to develop the hypothesis. We will discuss and state the hypothesis development next. We will discuss the literature on the effect of CCC on a firm's performance along four strands. First, we will examine studies focusing on the CCC-performance relationship of listed firms. Second, we will explore studies that shed light on this relationship for industry-specific reasons. Third, we will review the literature on the nonlinearity of the CCC's effect on firms' profitability. Finally, we will review the literature on the impact of economic and financial crises on enhancing CCC's effect on firm performance.
2.1. CCC and Firm’s Performance: Review of Studies on Listed Firms
We first look at the evidence from listed companies in developed countries. The relationship between CCC and profitability has been extensively studied in listed firms from developed markets. In the U.S. market, Wang (2019) analyzed data from 1976 to 2015 and found that firms with low CCCs generate higher returns than those with high CCCs, primarily due to the influence of inventory and receivables outstanding. Conversely, Chen, Zheng, and Chai (2022) found no evidence of the CCC effect in the Chinese market over the sample period 2002–2019, noting that while receivables outstanding significantly predict returns, inventory outstanding does not.
The CCC is also a crucial indicator of operating efficiency in fundamental analysis. Chen, Choy, and Tan (2022) investigated the return predictability of CCC and its components across global stock markets in 22 developed and 25 emerging countries. They found a negative and robust CCC return spread in their international sample. However, it was more moderate than Wang's (2019) findings in the U.S. Additionally, they found that each component of the CCC can significantly predict future stock returns, as evidenced by time-series abnormal returns or cross-sectional regressions.
Zeidan and Shapir (2017) support the idea that reducing the CCC can significantly enhance shareholder value. Their analysis of the Brazilian company MRV shows how operational changes reduced the CCC from 508 days in 2012 to 351 days in 2015, significantly lowering working capital requirements without negatively impacting operating margins or sales. This reduction increased profits and free cash flow to equity and led to higher stock prices, reinforcing the value-enhancing potential of effective CCC management. Similarly, Vahid et al. (2012) discovered a negative association between operating profitability and measures of working capital management, such as the average collection period, inventory turnover (in days), average payment period, CCC, and net trade cycle. These relationships are significant, except for CCC. These results align with U.S.-based findings, suggesting that CCC reduction strategies in developed economies generally enhance financial performance.
Next, we looked at the evidence on the effect of CCC on a firm's performance in developing countries. Johan et al. (2024) found that achieving firm performance in the BRICS countries (Brazil, Russia, India, China, and South Africa) requires efficient CCC management. A shorter CCC helps manage cash flows effectively, avoiding over- or underinvestment in inventory, receivables, and debt costs. Using data from manufacturing firms in Egypt, Kenya, Nigeria, and South Africa for 2002–2009, Ukaegbu (2014) found a strong negative relationship between profitability, measured through net operating profit, and CCC across different industrialization typologies. The study also found a positive relationship between profitability and inventory turnover and firm size and an inverse relationship between accounts receivables and profitability. This suggests that firms should have policies to fast-track accounts receivables collection to enhance profitability.
Some studies take a more comprehensive approach and focus on developing countries. For example, in the manufacturing sector, studies in Pakistan (Raheman et al., 2010; Anser & Malik, 2013) reveal that firms benefit from minimizing receivables and inventory while extending payables. Raheman et al. (2010) explored the impact of working capital management on the corporate performance of manufacturing companies in Pakistan. Their results showed that CCC inverse impacts firms' net operating profit. Anser and Malik (2013) examined the effect of CCC on profitability in Pakistan's manufacturing sector. They developed a regression model using return on equity and return on assets as dependent variables, while firm size, debt ratio, and CCC were independent variables. Their study revealed a negative relationship between CCC and profitability measures, suggesting that firms should reduce the accounts collection and inventory selling period while extending the payment period to increase profitability. Linh and Mohanlingam (2018) observed similar dynamics in Thailand's agriculture and food industries, where optimized CCC management enhanced profitability.
2.2. CCC and Firm’s Performance: Review of Studies on Industry-Specific Firms
The second strand of literature we review concerns studies on CCC and firms' performance on the industry-specific. The role of cash as a component of working capital varies by industry. We first look at such studies and evidence on developed countries. For example, Carnes et al. (2023) found that cash enables firms to obtain higher margins and shorten CCCs, which allows cash-rich firms to enjoy higher performance. However, the benefits of cash are contextual and vary based on the nature of ties with trading partners, as relational ties attenuate them. Fernandes et al. (2021) found a concave relationship between cash holdings and profitability in the banking sector, suggesting diminishing returns from excessive liquidity. Their analysis of banks from developed and emerging markets over 2000–2017 revealed that while higher cash holdings initially correlate with increased profitability, this relationship becomes negative at higher cash holdings. This inverted U-shaped pattern suggests that excess cash may lead to inefficiencies or lower returns beyond a certain point, highlighting the importance of optimizing rather than maximizing cash reserves. These patterns illustrate a trade-off between liquidity and operational efficiency, with non-linear dynamics often observed in cash-intensive industries. During economic downturns, Chen, Chou, and Lu (2018) noted that pre-saved cash helped financially constrained firms maintain investments, dividends, and acquisitions, emphasizing cash as a critical buffer during crises. However, Panigrahi (2013) reported positive CCC-profitability relationships in Indian cement firms, indicating industry-specific variations in optimal liquidity strategies. Industry-specific studies also provide evidence of CCC's role in firm performance focused on developing countries. Credit access and industry requirements often shape cash management strategies in developing countries. Nwude and Igwebuike (2018) found a negative CCC-profitability relationship in Nigerian insurance firms, while Yazdanfar and Ohman (2014) emphasized reducing receivables and inventory in SMEs to enhance performance. These findings support the findings of Zakari and Saidu (2016), who observed positive CCC-performance correlations in Nigerian ICT companies, underlining sector-specific differences.
Studies also evidence the role of CCC on firms' profitability for un-listed companies and SMEs. Garcia-Teruel and Martinez-Solano (2007) investigated the effects of working capital management on the profitability of Small and Medium Enterprises (SMEs) in Spain. They found a negative relationship between SMEs' profitability and the number of days of accounts receivable and inventory. The authors emphasized the importance of working capital management for value creation in SMEs and suggested that they minimize CCC to a rational extent. Yazdanfar and Ohman (2014) reached similar conclusions for Swedish SMEs, implying that efficient CCC management enables smaller firms to optimize liquidity and maintain competitiveness. In Africa, Mathuva (2010) studied firms listed on the Nairobi Stock Exchange (NSE) and found an inverse relationship between the accounts collection period and profitability. The study also found direct relationships between the inventory conversion period, average payment period, and profitability. These findings are also supported by Kipkemoi et al. (2018), who highlighted inventory management as a critical factor for a firm's performance. Similarly, Atnafu and Balda (2018) found that firms with better inventory and receivables management outperform their peers in Ethiopia.
2.3. CCC and Firm’s Performance: Review of Studies on the Non-Linearity of CCC Impact
Research into the relationship between the cash conversion cycle (CCC) and profitability has revealed complex, non-linear dynamics that challenge traditional linear assumptions. Earlier studies frequently characterized the CCC-profitability link as linear, highlighting that reductions in the CCC invariably enhance firm performance by improving liquidity and reducing financing costs. However, more recent evidence highlights a non-linear relationship, suggesting the presence of an optimal CCC range that maximizes profitability, beyond which either excessive lengthening or shortening can diminish performance. The theoretical basis for a non-linear relationship comes from the trade-offs inherent in working capital management. For instance, while more extended receivable periods or higher inventory levels may support sales growth and operational continuity, they tie up cash and increase holding costs, eroding profitability. On the other hand, excessively reducing receivables and inventory to shorten the CCC may weaken customer satisfaction and disrupt production continuity, leading to lost sales opportunities and a sensitive risk of operational inefficiencies. Empirical findings corroborate this theory. Baños-Caballero et al. (2012) demonstrated that the relationship between working capital and profitability follows an inverted U-shape in the context of Spanish SMEs, emphasizing an optimal CCC range. Their analysis indicates that excessively high and low working capital levels are associated with reduced profitability due to high costs or operational disruptions (Baños-Caballero et al., 2012; Wetzel & Hofmann, 2019). Similarly, Zeidan and Shapir (2017) provided evidence from a case study on MRV, a Brazilian firm, showing that operational improvements reducing the CCC from 508 days to 351 days significantly enhanced shareholder value, free cash flow, and profitability, underscoring the value-destructive potential of overinvestment in working capital (Zeidan & Shapir, 2017).
The CCC's impact on firm value also exhibits non-linear patterns. Effective CCC management enhances cash flow and operating efficiency, directly contributing to an increased shareholder value. On the other hand, inefficiencies stemming from aggressive CCC reductions or excessive expansion can compromise profitability and erode firm value (Zeidan & Shapir, 2017). Such findings are echoed by Wetzel and Hofmann (2019), who demonstrated that firms with supply chain finance (SCF)-oriented working capital strategies tend to achieve higher profitability and optimized CCC levels compared to firms adopting purely self-centered approaches (Wetzel & Hofmann, 2019). The evolving literature suggests that reconciling linear and non-linear perspectives on the CCC-profitability relationship requires a better understanding of factors, including industry dynamics, firm size, and financial constraints. Yazdanfar and Öhman (2014) observed that CCC efficiency yields more profitability benefits for smaller firms and those operating under constrained credit environments, as efficient cash management reduces reliance on costly external financing (Yazdanfar & Öhman, 2014; Baños-Caballero et al., 2012).
2.4. CCC and Firm’s Performance: The Impact of Economic Crises
In the fourth strand of related studies, we review those concerned with the impact of economic and financial crises on enhancing the cash conversion cycle's (CCC) effect on firm performance. Economic and financial crises influence the cash conversion cycle (CCC) dynamics and impact firm performance. During economic uncertainty, liquidity constraints, and diminished demand, the CCC becomes critical for firms to maintain operational efficiency and financial stability. Crises create a context where the interaction between working capital components and firm performance intensifies, amplifying the significance of efficient CCC management. Economic contractions, financial market disruptions, or widespread liquidity shortages typically mark crises. For example, the 2008–2009 global financial crisis was characterized by reduced credit availability and demand shocks, severely impacting firms' operational cycles. These crises are particularly significant for firms reliant on external financing and those sensitive to demand changes (Castellares & Salas, 2019; Nguyen & Qian, 2014). The importance of liquidity increases during crises. Firms with shorter CCCs often demonstrate resilience by efficiently converting inventory and receivables into cash, thereby mitigating reliance on external financing. Chen et al. (2018) and Carnes et al. (2023) highlight that firms with optimized CCC management experienced better financial performance during downturns by maintaining liquidity buffers. Demand shocks, a hallmark of financial crises, disproportionately impact firms with inefficient CCCs. Nguyen and Qian (2014) emphasize that the primary adverse effect during the 2008–2009 crisis was a collapse in demand, underscoring the need for firms to maintain lean and efficient operational cycles. Firms with shorter CCCs adapted better to the reduced-demand environment, maintaining profitability despite external pressures. Similarly, Chen, Chou, and Lu (2018) extended the discussion to the role of pre-saved cash in financially constrained firms during economic downturns. Their study, spanning the 2000 dot-com crash and the 2008 financial crisis, provided evidence that in China, firms with more pre-saved cash maintained capital investments and dividends, engaged in acquisitions, and were less likely to default during these periods. This suggests that cash reserves can serve as a critical buffer, enabling firms to navigate financial turbulence more effectively.
The sparse literature studying the role of economic crises on CCC’s impact on firm profitability reveals that economic and financial crises increase CCC's impact on firm performance, making liquidity management critical. Efficient CCC practices mitigate the adverse effects of crises and enable firms to sustain their economic activity and performance during periods of economic uncertainty. This further emphasizes the need to explore CCC dynamics across different industries and crisis contexts.
2.5. Hypothesis Development
The allocation of resources between working capital, particularly cash and non-current assets, is a fundamental decision for firms. This trade-off captures a critical balance between liquidity and profitability. The primary benefit of holding working capital lies in its provision of liquidity, enabling firms to meet short-term obligations, maintain operational continuity, and respond to unforeseen expenditures. On the other hand, the principal cost is the opportunity cost of foregoing potentially higher returns from investments in non-current assets. The decision to allocate resources between working capital, particularly cash and non-current assets, presents a fundamental trade-off for firms. This trade-off reflects the balance between liquidity and profitability: the primary benefit of holding working capital is liquidity, while the principal cost is the opportunity cost of preceding potentially higher returns from investing in non-current assets.
Holding excessive working capital entails significant opportunity costs. Non-current assets, such as property, plant, and equipment, often yield higher returns in the long term. Investment in such assets can drive growth, enhance operational capacity, and create competitive advantages. Firms that overly prioritize working capital may miss these opportunities, leading to lower profitability and shareholder value. For instance, studies such as those by Panigrahi (2013) and Zakari and Saidu (2016) demonstrate that specific industries benefit from investing in fixed assets rather than maintaining high liquidity, particularly during stable economic periods. On the other hand, working capital provides liquidity, enabling firms to meet short-term obligations and maintain operational continuity. Liquidity is crucial for managing supply chains, securing trade credit, and responding to unforeseen expenditures. Carnes et al. (2023) and Fernandes et al. (2021) emphasize that cash holdings can improve operational flexibility and reduce the need for external financing. However, the diminishing returns from excessive cash holdings highlight the non-linear nature of this trade-off, as seen in the inverted U-shaped relationship between cash holdings and profitability.
Firms seek to hold the level of working capital that optimizes this trade-off, balancing liquidity with profitability. This balance is not static and varies based on internal and external factors, such as firm size, industry characteristics, and economic conditions. For instance, Chen, Chou, and Lu (2018) highlight that firms with pre-saved cash were better equipped to sustain operations during economic downturns, demonstrating the dynamic nature of liquidity's value.
The relative magnitude of the costs and benefits of holding working capital shifts significantly between crisis and non-crisis periods. The opportunity cost of holding excessive liquidity is higher during stable economic conditions. Firms are incentivized to invest in non-current assets that generate long-term returns. Studies such as those by Ukaegbu (2014) and Vahid et al. (2012) underscore that minimizing CCC during non-crisis periods enhances profitability by allowing firms to allocate resources toward value-creating investments. Firms may adopt aggressive working capital policies, reducing cash holdings to reinvest in growth opportunities. In contrast, the benefits of liquidity become paramount during crises. Economic instability increases uncertainty, disrupts cash flows, and constrains access to external financing. Liquidity cushions enable firms to navigate these challenges, sustain operations, and seize strategic opportunities (e.g., acquisitions distressed asset purchases). Chen, Chou, and Lu (2018) show that firms with higher cash reserves maintained capital investments and avoided default during crises. Similarly, Yazdanfar and Ohman (2014) highlight that efficient working capital management is critical for SMEs, particularly in periods of financial stress.
Building on these arguments, we hypothesize that the trade-off between working capital and non-current assets is dynamic and influenced by economic conditions. In non-crisis periods, the opportunity cost of holding excessive working capital is higher, leading firms to prioritize investments in non-current assets. Consequently, firms with lower CCCs are expected to exhibit higher profitability due to the efficient allocation of resources toward value-generating activities. In crisis periods, the advantage of liquidity becomes paramount. Firms with higher working capital (or cash) are better positioned to navigate uncertainty, maintain operational continuity, and capitalize on strategic opportunities. This suggests that the relationship between CCC and profitability is non-linear, with the optimal CCC varying based on macroeconomic conditions. The non-linear dynamics of this relationship indicate that firms with excessively high or low CCCs may experience diminished returns. While low CCCs improve profitability during stable periods, overly aggressive reductions may compromise operational stability during crises. Conversely, high CCCs provide resilience during downturns but may erode profitability in normal conditions.
Building on these theoretical perspectives, we propose the following hypotheses to examine the relationship between CCC and firm performance:
Hypothesis 1: Other things being equal, the shorter the CCC, the better the firm's performance. A shorter CCC reflects efficient working capital management, enabling firms to minimize holding costs and reduce reliance on external financing. This efficiency translates into improved profitability, as evidenced by studies linking CCC reductions to enhanced shareholder value and operational performance in both developed and emerging markets (Zeidan & Shapir, 2017; Ukaegbu, 2014).
Hypothesis 2: There is a non-linear relationship between CCC and a firm's performance. The relationship between CCC and performance is not strictly linear. While moderate CCC reductions enhance profitability, excessive reductions may compromise customer satisfaction and operational continuity, leading to diminishing returns. This inverted U-shaped dynamic is consistent with findings highlighting an optimal CCC range for maximizing profitability (Baños-Caballero et al., 2012).
Hypothesis 3: The CCC effect on profitability diminishes during economic crises.
Liquidity becomes more valuable during crises due to heightened uncertainty and restricted credit access. While efficient CCC management remains essential, broader economic pressures may overshadow its incremental impact on profitability. Firms prioritize survival strategies, such as maintaining liquidity buffers, over aggressive CCC reductions. This rationale aligns with evidence from crisis periods, where liquidity emerges as a key determinant of resilience (Chen et al., 2018; Zaher & Marquez Illescas, 2022).
3. Data and Methodology
3.1. Data
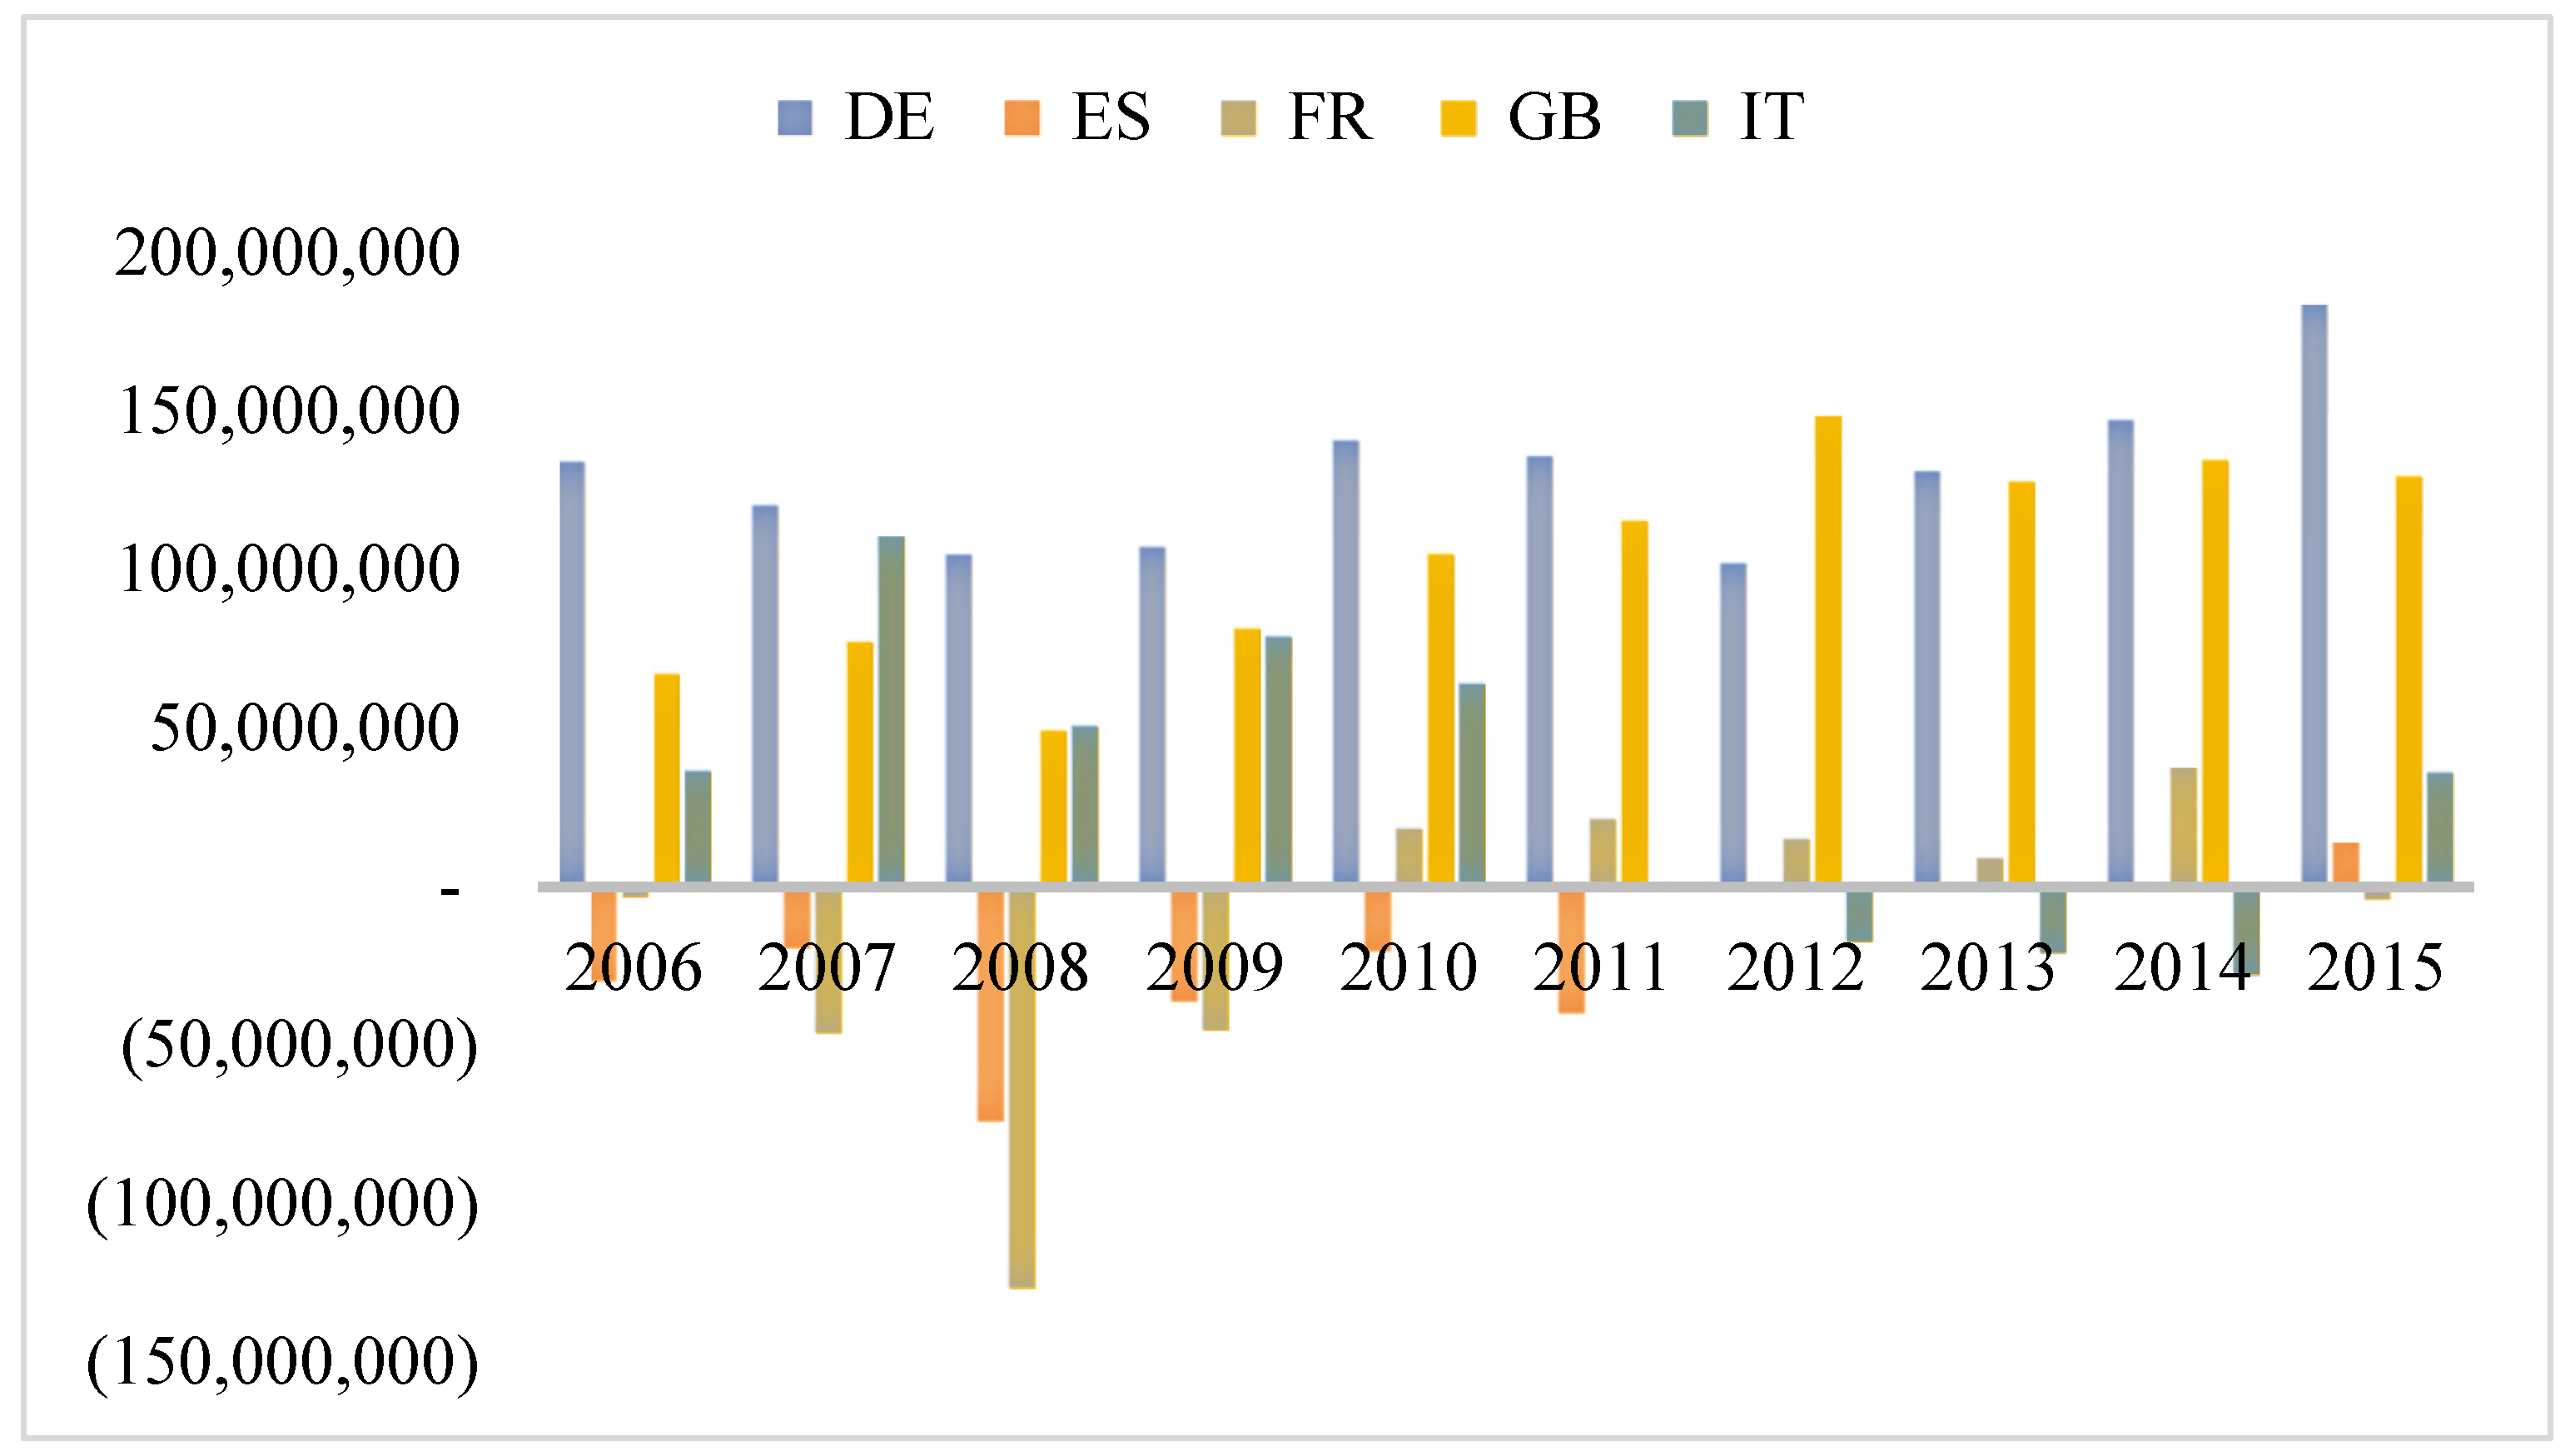
Data used in this study are selected and extracted from the Amadeus database, provided by Bureau van Dijk, covering the period 2006-2015. Firms operating in different business sectors in countries such as Germany (DE), Spain (ES), France (FR), Great Britain (GB), and Italy (IT).
The data are organized as panel data and corrected for routine and conceptual checks. The sample does not include non-usual observations (CCC derivatives older than one year). There are 41,185 observations, and the data are fairly distributed over the ten years. The sample composition is as follows: Great Britain 15,666 or 38%, Germany 9,571 or 23%, Italy 6,128 or 15%, France 5,904 or 14%, and Spain 3,916 or 10%.
Accordingly,
Figure 1 shows that, on average, firms in Germany and Great Britain have operated with positive working capital. Firms in Spain have negative working capital, and only in 2015 did they operate with positive working capital. Firms in France from 2010-2014 have positive working capital and negative values for the rest of the years. Finally, firms in Italy for the period 2012-2014 have negative working capital, and for the rest of the years, they have operated with positive values.
Overall, these preliminary results show differences within and across countries, and consequently, no unique strategy or policy can be expected to manage CCC.
Undoubtedly, firms would prefer to tighten the collection period and expand the payment period, consequently increasing short-term liquidity. They would probably also prefer to use more non-interest-bearing funding sources (by suppliers, i.e., obtained trade credit) rather than financial debt to finance business activities.
In this study, we use two measures of profitability: (1) return on assets (ROA, hereafter) and (2) net margin ratio (PRO, hereafter). ROA is defined as net income to total assets, and PRO is defined as net income to operating revenue. The reason behind using two profitability measures is that whereas PRO captures effects only from the income statement, ROA combines the income statement and balance sheet.
In addition, one of the ways to measure working capital management is the Cash Conversion Cycle (see, e.g., among others, Attari & Raza, 2012; Anser & Malik, 2013; Yazdanfar & Ohman, 2014; Aminu & Zainudin, 2015). Thus, the cash conversion cycle is "the net time interval between actual cash expenditures on a firm's purchase of productive resources and the ultimate recovery of cash receipts from product sales" (Richards & Laughlin, 1980). Accordingly, the Cash Conversion Cycle (CCC) could be more beneficial to decision-makers in the business operation period compared to the working capital conventional and static formula calculated as the difference between current assets and current liabilities.
In our study, CCC is calculated as the inventory conversion period (ICP) + Debt collection period (CP) – Creditors deferral period (CRP). In addition, the CCC components are calculated as: (1) Inventory conversion period (ICP) = Stock / (Operating revenue / 360); (2) Debtors collection period (CP) = Debtors / (Operating revenue / 360); and (3) Creditors deferral period (CRP) = Creditors / (Operating revenue / 360).
The rest of the independent variables, shown in
Table 1, are defined as follows: financial leverage (LEV) is defined as total debt to total assets; the firm's size (SIZE) is measured as the logarithm of total assets; tangibility ratio (TAN) is measured by the ratio of fixed assets to total assets; cash flow ratio (CF) is defined as cash flow to current liabilities, and inventory investment (INV) is measured by the ratio of stock to total assets.
Table 2 shows the descriptive statistics and correlation coefficients for all variables used in this study. The data shows that the average return on assets is 4.8%, the average profit is 6.3%, and the average CCC is 42 days. The firm's leverage ratio is relatively low, 0.19. The tangibility ratio is 0.1, and the cash flow ratio is 12.4. The inventory investment is moderate, 0.13.
The correlation coefficients show that all dependent variables (CCC, LEV, SIZE, TAN, CF, and INV) are weakly negatively correlated with return on assets. They also show that profit is negatively correlated with CCC, LEV, and INV and positively correlated with SIZE, TAN, and CF. The correlation coefficients among independent variables are small (weak correlation), which is the first sign of the nonpresence of multicollinearity.
3.2. Methodology
Considering previous studies, we employ an unbalanced panel data methodology. The two measures of the firm's performance, ROA and PRO, are regressed on CCC, squared CCC, and control variables. The study employs the unbalanced panel data regression for both ROA and PRO for the period of no economic crises (periods during which a country where the firm operates has had a positive real GDP growth) and the periods of economic crises (periods during which a country where the firm operates has had a positive real GDP growth).
Equation (1) shows that firm profitability measured with ROA is a function of cash conversion cycle (CCC), squared CCC, financial leverage (LEV), firm size (SIZE), tangibility ratio (TAN), cash flow ratio (CF), and inventory investment (INV). Equation (2) shows that firm profitability measured with PRO is a function of cash conversion cycle (CCC), squared CCC, financial leverage (LEV), firm size (SIZE), tangibility ratio (TAN), cash flow ratio (CF), and inventory investment (INV). The motivation for using the control variables is informed from the literature review (Li & Mauer, 2016; Bontempi, Bottazzi, and Golinelli, 2020; Bonaimé, Hankins, and Jordan, 2016; Grundy & Verwijmeren, 2020; Afrifa & Padachi, 2016; Altaf & Shah, 2018; Baños-Caballero, García-Teruel, and Martínez-Solano, 2014; Atnafu & Balda, 2018; Khan, 2020; and Kipkemoi, Kiru, and Koima, 2018).
Further, testing whether a non-linear relationship exists (U-shaped or inverted) between firm profitability and CCC requires squared CCC to be included in the regression model. Several prior studies confirmed a non-linear relationship between profitability and CCC (e.g., Deari et al., 2024; Deari et al., 2024; Fernandes et al., 2021).
Therefore, the general panel regression model, which has to be estimated, can be written as follows:
Both panel regressions (equations 1 and 2) are estimated for the country's crises (when the country experiences a negative real GDP growth) and the non-crises period (when the country experiences a positive real GDP growth). The study ends with three estimated equations for each dependent variable (e.g., ROA and PRO). It estimates the entire sample, the sub-sample for the period with crises, and the sub-sample for the period without crises.
4. Empirical Findings and Discussions
In this section, we conduct an econometric estimation of equations 1 and 2. These equations measure the effect of cash conversion period, financial leverage, size, tangibility, cash flow ratio, and inventory investment on profitability. In addition, the study estimates equations 1 and 2 for the entire sample, for the subsample with crises, and for the subsample without crises (by splitting the sample into two subsamples).
First, we test for stationarity of the series used in the regression analysis. The results are presented in
Table 3 below.
The study uses two stationarity tests: Augmented Dickey-Fuller (ADF) and Phillips-Perron (PP). The Augmented Dickey-Fuller (ADF) test uses τ (tau) estimated statistics. The null hypothesis in both tests (ADF and PP) is that there is a unit root (unit root process). Rejecting the null means that the series is stationary at the level of measurement. The results suggest we can reject the null and conclude that there is insufficient evidence on unit root processes. The only variable not satisfying this condition is SIZE when considering the ADF test. We confidently say that the series' stationery is satisfactory, thus avoiding spurious regressions.
Next, we estimate equations 1 and 2, including only CCC and squared CCC. The results of such an estimation are presented in
Table 4 below.
The regression results in
Table 4 show no clear conclusion about the effect of CCC and squared CCC alone on the firm's profitability. The coefficient of CCC is statistically significant only for PRO, and the coefficient of squared CCC is statistically significantly different from zero for ROA (the entire sample), PRO (the entire sample), and PRO without crises. This inconclusiveness leads us to estimate the equations 1 and 2, including all dependent variables.
Next, we estimate the regressions using all control (dependent) variables and CCC and squared CCC. Six estimated results are summarized in
Table 5. The estimated method is that of unbalanced panel data fixed effect. This method is justified because the study uses short panel data (i.e., ten years of data from over 6043 firms). Because of the short period and, relative to that, an extensive set of panel units, the panel least square is one of the estimation techniques that best estimates the unbiased and efficient estimates.
Table 5 presents a summary of the regression results. We follow Kukeli et al.'s 2023 battery of tests and justification of techniques to produce the estimates reported.
The results presented in
Table 5 offer a better picture of the impact of CCC and squared CCC on ROA and PRO, with and without crises. We proceed with testing for heteroscedasticity as a primary source of efficient estimates.
The FE panel data models do not pass the Breusch-Pagan/Cook-Weisberg heteroscedasticity test. As Green (2008) suggests, we run a Weighted Least Square (WLS) panel regression to correct for heteroscedasticity, where the weights are based on per-unit error variances. The new regressions have a better overall fit, shown by a higher adjusted R-square, and all coefficients (but CF) are statistically significantly important and different than zero at all three conventional levels of significance (1%, 5%, and 10% significance level).
The results of WLS unbalanced panel data estimations are in
Table 6 below.
Overall, equations 1 and 2 estimates using the unbalanced panel data Weighted Least Squares (WLS) method yield satisfactory results. An issue identified with WLS estimates is CF. The effect of CF on ROA and PRO is not statistically significant (except for estimation for the subsample of crises). The Wald test for omitting variables suggests that CF should be removed from the estimation. We run a Wald test for omitting variables, namely, omitting CF. In both cases, the Wald test strongly suggests that CF be omitted from the regressions for ROA and PRO. The Wald test for ROA has an F = 0.042 and P(F) = 0.83; for PRO, it has an F = 0.3297 and a P(F) = 0.56. In both cases, we fail to reject Wald's test null hypothesis: the regression coefficient is zero. We re-run the WLS unbalanced panel data estimation (equations 1 and 2), omitting CF. The results are in the
Table 7 below.
5. Discussion of Results
The regression analysis results in
Table 7 provide a comprehensive understanding of the relationships between CCC, squared CCC, and the control variables in the variation of corporate performance, measured in terms of Return on Assets (ROA) and Profit (PRO). The analysis spans different conditions, including the entire sample, periods with crises, and periods without crises. It is important to notice that both CCC and squared CCC are statistically significantly different than zero at a 1 percent significant level for ROA and PRO for the entire sample and crises and non-crises. The adjusted R-squared values suggest that the models explain a moderate to substantial portion of the variability in ROA and PRO.
Because of the squared CCC, its marginal effect can be calculated using the partial derivative of ROA and PRO concerning CCC. These effects range from 0.000054 for ROA and ROA without crises to 0.0001 for ROA with crises. Results show that CCC has a nonlinear effect on ROA, and the effect is magnified during crises. Additionally, there is a strong inverted U-shape of the effect of CCC on firms' return to assets.
We calculate the CCC marginal effects on profit margin (PRO) using the abovementioned method. These effects show an inverted U-shape of the CCC effect on PRO for the entire sample and the sample of firms with crises. The marginal effect in both these cases is negative, and its value varies from -0.000088 for the entire sample to -0.00038 for the sample of firms during crises. The marginal effect of the sub-sample without crises is 0.00001, small and positive, hence an inverted U-shape of the effect of CCC on the firm’s profit margin. These marginal effects show increased CCC sharply decreases the profit margin during crises. The non-linear relationship indicated by CCC2 in ROA suggests diminishing returns, corroborating Chang's (2018) finding that the benefits of reducing CCC taper off or reverse at lower levels.
Next, using Baños-Caballero et al. (2014), we calculate the optimal (maximum for inverted U-shape and the minimum for U-shape) level of CCC. The maximum performance will be achieved at:
where,
> 0 and < 0 (for more see, Baños-Caballero et al., 2014) ).
The mean value of CCC (
Table 2) is 42. Using the estimated coefficients of
Table 7 and the mean values of CCC, we calculate the optimums (maximums) of 93 days for ROA, 92 days for ROA with no crises, 130 days for ROA with crises, and 73 for PRO without crises.
Next, we discuss the effects of control variables on ROA and PRO. Leverage (LEV) consistently shows a negative and highly significant impact on ROA and PRO across all conditions. The coefficients for ROA range from -0.054 to -0.058, indicating a stable negative effect of leverage on asset returns. For PRO, the negative impact is less substantial, with coefficients between -0.039 and -0.055. This suggests that higher leverage adversely affects profitability less significantly than asset returns. The consistent negative impact of leverage on both ROA and PRO, particularly its more substantial effect on ROA, supports the findings of Bontempi, Bottazzi, and Golinelli (2020). Their work highlighted how leverage choices significantly impact firm performance, with higher leverage often leading to lower profitability due to increased financial risk and costs.
The firm size (SIZE) variable negatively impacts ROA across all conditions, with coefficients from -0.0018 to -0.01. This indicates that larger firms tend to have less asset returns. On the contrary, for PRO, Size has a positive and significant relationship, with coefficients ranging from 0.019 to 0.021. This implies that larger firms have a higher profit margin, possibly due to the economies of scale. The positive impact of firm size on PRO, in contrast to its negative impact on ROA, can be linked to the work of Li and Mauer (2016). They found that larger firms, while potentially enjoying economies of scale and better asset utilization (reflected in higher ROA), might face challenges in profitability due to complexities in managing more extensive operations. This dichotomy between ROA and PRO regarding firm size mirrors the regression findings.
Asset tangibility (TAN) exhibits a negative and significant impact on ROA, with coefficients from -0.0062 to -0.012, highlighting that firms with less tangible assets tend to perform better regarding asset returns. For PRO, however, the relationship is negative and significant, especially pronounced during crisis periods with coefficients between –0.1 compared to -0.01 for the noncrises period. This suggests that tangible assets might burden performance, especially during crises, due to higher maintenance or depreciation costs. The negative impact on a firm’s performance, especially during non-crisis periods, might be explained by the maintenance and depreciation costs associated with tangible assets, as discussed in Fernandes, Mendes, and Leite (2021), who noted the cost implications of asset management in banks and other sectors.
The stock inventory variable (INV) negatively affects ROA and PRO significantly across all conditions. The impact is more subdued for ROA, with coefficients around -0.024 to -0.035. For PRO, the negative impact is much more substantial, with coefficients from -0.10 to -0.11, indicating that higher stock inventories are detrimental to profitability, possibly due to holding costs or inefficiencies in inventory management. The negative impact of stock inventory on ROA and PRO, with a more substantial effect on profit, aligns with Zeidan and Shapir's (2017) evidence that effective working capital management, including inventory reduction, enhances profitability. High inventory levels can tie up capital and increase holding costs, reducing profitability, as shown in the regression analysis.
6. Conclusions
This study investigates whether the effects of CCC on firm performance are nonlinear and whether economic crises matter for profitability. The results reveal strong evidence of the nonlinearity of the effect of CCC on firms’ performance, with different lengths of CCC within and across countries, providing evidence in favor of hypotheses 1 and 2. Similarly, the study provides evidence that the nonlinear effect of CCC firm’s performance differs during crises and noncrise periods, supporting hypothesis 3. The relationship between firm performance (measured by ROA and PRO) and CCC was examined by adding firm characteristics such as financial leverage (LEV), firm size (SIZE), tangibility ratio (TAN), cash flow ratio (CF), and inventory investment (Stockinv). Except for CF, these control variables significantly influence performance (assets return and profit margin).
Therefore, the regression results highlight distinct relationships between financial metrics and corporate performance. While leverage, tangibility, and stock inventory consistently show negative impacts, firm size affects ROA and PRO differently. The role of CCC is decisive and nonlinear, affecting asset returns and profitability and emphasizing the complexity of working capital management in financial performance.
Based on the regression results and the supporting literature, several policy implications can be drawn up for firms seeking to optimize their performance. Firms should aim to optimize their CCC to enhance performance. Given the negative impact of leverage on both ROA and PRO, firms should carefully manage their debt levels to avoid excessive financial risk. The negative effect of tangible assets and inventory investment in ROA and PRO highlights the importance of managing maintenance costs and reducing access stocks.
The study’s limitations are due to a specific region, country, and period chosen to capture the crisis's effect on the relationship between CCC and firm performance. The study limits the econometric analysis to unbalanced panel data weighted least square method. Addressing possible issues of endogeneity could be an extension of this study.
Future research on the relationship between the Cash Conversion Cycle (CCC) and corporate performance can focus on areas to extend the current study. Such an extension could involve investigating the nonlinearity and the crisis effect for different industries and small and medium enterprises.
References
- Afrifa, G. A. & Padachi, K. (2016). Working capital level influence on SME profitability, Journal of Small Business and Enterprise Development, 23(1), 44–63. [CrossRef]
- Altaf, N. & Shah, F. A. (2018). How does working capital management affect the profitability of Indian companies? Journal of Advances in Management Research, 15(3), 347−366. [CrossRef]
- Aminu, Y. and Zainudin, N. 2015. A review of the anatomy of working capital management theories and the relevant linkages to working capital components: A theoretical building approach. European Journal of Business and Management, 7(2), 10-18.
- Anser, R. and Malik, Q. A. 2013. Cash conversion cycle and firms' profitability–A study of listed manufacturing companies of Pakistan, IOSR Journal of Business and Management, 8(2), 83-87.
- Atnafu, D., and Balda, A. 2018. The Impact of Inventory Management Practice on Firms' Competitiveness and Organizational Performance: Empirical Evidence from Micro and Small Enterprises in Ethiopia. Cogent Business & Management, 5(1), 1503219. [CrossRef]
- Attari, M. A. and Raza, K. 2012. The optimal relationship of cash conversion cycle with firm size and profitability, International Journal of Academic Research in Business and Social Sciences, 2(4), 189.
- Baños-Caballero, S., García-Teruel, P. J. and Martínez-Solano, P. 2014. Working capital management, corporate performance, and financial constraints, Journal of Business Research, 67(3), 332−338. [CrossRef]
- Baños-Caballero, S., García-Teruel, P.J. and Martínez-Solano, P. 2012. How does working capital management affect the profitability of Spanish SMEs?, Small Bus Econ, 39, 517–529. [CrossRef]
- Bonaimé, A. A., Hankins, K. W. and Jordan, B. D. 2016. The cost of financial flexibility: Evidence from share repurchases, Journal of Corporate Finance, 38, 345-362. [CrossRef]
- Bontempi, M. E., Bottazzi, L., and Golinelli, R. 2020. A multilevel index of heterogeneous short-term and long-term debt dynamics, Journal of Corporate Finance, 64, 101666. [CrossRef]
- Carnes, C. M., Cavanaugh, J., David, P. & O’Brien, J. (2023). Cash creates value for supply chain systems, but who appropriates that value? Journal of Business Research, 161, 113834. [CrossRef]
- Castellares, R. and Salas, J. 2019. Contractual imperfections and the impact of crises on trade: Evidence from industry-level data, Journal of International Economics, 116, 33-49. [CrossRef]
- Chang, C. (2018). Cash conversion cycle and corporate performance: Global evidence, International Review of Economics & Finance, 56, 568–581. [CrossRef]
- Chen, C. C., Huang, H. H., & Lee, C. I. (2022). Supply chain, product pricing, and dynamic capital structure, International Review of Economics & Finance, 80, 938–952.
- Chen, C.H., Choy, S.K. & Tan, Y. (2022). The cash conversion cycle spread: International evidence. Journal of Banking and Finance, 140, 106517. [CrossRef]
- Chen, H. C., Chou, R. K., & Lu, C. L. (2018). Saving for a rainy day: Evidence from the 2000 dot-com crash and the 2008 credit crisis, Journal of Corporate Finance, 48, 680–699. [CrossRef]
- Chen, X., Zheng, G. & Chai, D. (2022). The cash conversion cycle spread in China. Pacific-Basin Finance Journal, 73, 101769. [CrossRef]
- Deari, F. and Palomba, G. 2024. Does the Cash Conversion Cycle Affect Firm Profitability? Some Empirical Evidence from Listed Firms in North Macedonia, Zagreb International Review of Economics & Business, 27(1), 63-77. [CrossRef]
- Deari, F., Kukeli, A., Barbuta-Misu, N. and Virlanuta, F. O. 2024. Does working capital management affect firm profitability? Evidence from European Union countries, Journal of Economic and Administrative Sciences, 40(5), 1060-1080. [CrossRef]
- Fernandes, G., dos Santos Mendes, L. and de Oliveira Leite, R. 2021. Cash holdings and profitability of banks in developed and emerging markets. International Review of Economics & Finance, 71, 880-895. [CrossRef]
- Green, W. H. (2018). Econometric Analysis. Pearson.
- Grundy, B. D. and Verwijmeren, P. 2020. The external financing of investment, Journal of Corporate Finance, 65, 101745. [CrossRef]
- Johan, S., Kayani, U.N., Naeem, M.A. and Karim, S. 2024. How effective is the cash conversion cycle in improving firm performance? Evidence from BRICS. Emerging Markets Review, 59, 101114. [CrossRef]
- Juan García-Teruel, P. and Martínez-Solano, P. 2007. Effects of working capital management on SME profitability, International Journal of Managerial Finance, 3(2), 164-177. [CrossRef]
- Khan, M. S. R. (2020). The Effects of Inventory Management Capability on Performance of the Firm: Business Strategies as a Mediating Role. Asian Finance & Banking Review, 4(2), 1-10. [CrossRef]
- Kipkemoi, P., Kiru, K., and Koima, J. K. 2018. Effect of Inventory and Cash Conversion Cycles on Financial Performance of Listed Commercial and Service Firms in Nairobi Securities Exchange Kenya. Scholars Journal of Economics, Business and Management, 5(11), 997-1002. [CrossRef]
- Kukeli, A., Forrester, R., Deari, F., & Martinez, J. (2023). Nonperforming Loans in Central-East European Countries: Empirical Investigation of Macroeconomic, Policy, and Global Risk Determinants. Global Business and Economics Review, 9(3), 265–286. [CrossRef]
- Li, J. Y. and Mauer, D. C. 2016. Financing uncertain growth, Journal of Corporate Finance, 41, 241-261.
- Linh, N. T. P., and Mohanlingam, S. 2018. The effects of cash conversion cycle on profitability: An insight into the agriculture and food industries in Thailand, Asian Journal of Business and Accounting, 11(1), 97-119. [CrossRef]
- Mathuva, M. D. (2010). The influence of working capital management components on corporate profitability: A survey on Kenyan Listed Firms, Research Journal of Business Management, 4(1), 1-11. [CrossRef]
- Nguyen, H. & Qian, R. (2014). Demand collapse or credit crunch to firms? Evidence from the World Bank's financial crisis survey in Eastern Europe, Journal of International Money and Finance, 47, 125–144. [CrossRef]
- Nobanee, H., Abdullatif, M. and AlHajjar, M. 2011. Cash conversion cycle and firm's performance of Japanese firms, Asian Review of Accounting, 19(2), 147-156. [CrossRef]
- Nwude, E. C., Agbo, E. I. and Christian Ibe-Lamberts, C. I. L. 2018. Effect of cash conversion cycle on the profitability of public listed insurance companies, International Journal of Economics and Financial Issues, 8(1), 111-117. https://www.econjournals.com/index.php/ijefi/article/view/5874.
- Panigrahi, C. M. A. 2013. Cash conversion cycle and firms’ profitability–A study of cement manufacturing companies of India, International Journal of Current Research, 5(6), 1484-1488.
- Philipp Wetzel, Ph. and Hofmann, E. 2019. Supply chain finance, financial constraints and corporate performance: An explorative network analysis and future research agenda, International Journal of Production Economics, 216, 364-383. [CrossRef]
- Raheman, A., Afza, T., Qayyum, A. and Bodla, M. A. (2010).) Working capital management and corporate performance of manufacturing sector in Pakistan, International Research Journal of Finance and Economics, 47(1), 151-163.
- Rey-Ares, L., Fernández-López, S. and Rodeiro-Pazos, D. 2021. Impact of working capital management on profitability for Spanish fish canning companies, Marine Policy, 130. [CrossRef]
- Richards, V. D. & Laughlin, E. J. (1980). A cash conversion cycle approach to liquidity analysis, Financial Management, 9(1), 32–38. [CrossRef]
- Ukaegbu, B. (2014). The significance of working capital management in determining firm profitability: Evidence from African developing economies. Research in International Business and Finance, 31, 1–16. [CrossRef]
- Vahid, T. K., Elham, G., Mohsen, A.K. and Mohammadreza, E. 2012. Working capital management and corporate performance: evidence from Iranian companies. Procedia - Social and Behavioral Sciences, 62, 1313 – 1318. [CrossRef]
- Wang, B. (2019). The cash conversion cycle spread. Journal of Financial Economics, 133(2), 472–497. [CrossRef]
- Yazdanfar, D. and Öhman, P. 2014. The impact of cash conversion cycle on firm profitability: An empirical study based on Swedish data, International Journal of Managerial Finance, 10(4), 442-452. [CrossRef]
- Zaher, H. and Illescas, G. M. 2022, May 06-07. The Cash Conversion Cycle: A Systematic Literature Review. 81st International Scientific Conference on Economic and Social Development – "Green Economy & Sustainable Development," Cakovec. Available online: https://www.esd-conference.com/upload/book_of_proceedings/Book_of_Proceedings_esdCakovec2022_Online.pdf.
- Zakari, M. and Saidu, S. 2016. The impact of cash conversion cycle on firm profitability: Evidence from Nigerian listed telecommunication companies, Journal of Finance and Accounting, 4(6), 342-350. [CrossRef]
- Zeidan, R. & Shapir, O. M. (2017). Cash conversion cycle and value-enhancing operations: Theory and evidence for a free lunch, Journal of Corporate Finance, 45, 203–219. [CrossRef]
|
Disclaimer/Publisher’s Note: The statements, opinions and data contained in all publications are solely those of the individual author(s) and contributor(s) and not of MDPI and/or the editor(s). MDPI and/or the editor(s) disclaim responsibility for any injury to people or property resulting from any ideas, methods, instructions or products referred to in the content. |
© 2024 by the authors. Licensee MDPI, Basel, Switzerland. This article is an open access article distributed under the terms and conditions of the Creative Commons Attribution (CC BY) license (http://creativecommons.org/licenses/by/4.0/).