Preprint
Article

This version is not peer-reviewed.

Structural Characteristics and Properties of the RNA-Binding PROTEIN hnRNPK at Multiple Physical States

A peer-reviewed article of this preprint also exists.

Submitted:

28 December 2024

Posted:

30 December 2024

You are already at the latest version

Abstract

Heterogeneous nuclear ribonuclear protein K (hnRNPK) is an RNA-binding protein with low-complexity domains (LCDs) that regulate its behavior under stress conditions. This study demonstrates the ability to control hnRNPK’s transitions into four distinct material states—monomer, soluble aggregate, liquid droplet, and fibrillar hydrogel—by modulating environmental factors such as temperature and protein concentration. Importantly, the phase-separated and hydrogel states are newly identified for hnRNPK, marking a significant advancement in understanding its material properties. A combination of biophysical techniques, including DLS and SEC-LS, was used to further characterize hnRNPK in monomeric and soluble aggregate states. Structural methods, such as SANS, SAXS, and TEM, revealed the elongated morphology of the hnRNPK monomer. Environmental perturbations, such as decreased temperature or crowding agents, drove hnRNPK into phase-separated or gel-like states, each with distinct biophysical characteristics. These novel states were further analyzed using SEM, X-ray diffraction, and fluorescence microscopy. Collectively, these results demonstrate the complex behaviors of hnRNPK under different conditions and illustrate the properties of the protein in each material state. Transitions of hnRNPK upon condition changes could potentially affect functions of hnRNPK, playing a significant role in regulation of hnRNPK-involved processes in the cell.

Keywords: 
;  ;  ;  ;  ;  ;  ;  

1. Introduction

The intracellular environment is densely packed with biological materials [1], leading to macromolecular crowding effects that influence protein structure, function, behavior, and stability [2]. Proteins exhibit dynamic physical states that can change under varying conditions [3], allowing functional flexibility [4]. These transitions, which depend heavily on environmental factors [5,6], enable proteins to shift from their native state to various forms such as solid-like aggregates, gels, or liquid-like droplets [7,8,9]. This adaptability helps protect proteins from degradation [10] and allows them to function in membraneless compartments or organelles [11,12,13]. Despite these transitions, proteins are prone to aggregation under stress. To counter this, cells employ molecular chaperones to assist in protein folding and maintain their native states [14,15]. Additionally, low-complexity domains (LCDs) play a key role in promoting transitions that protect proteins under changing conditions such as temperature, concentration, or pH [16,17].
Heterogeneous nuclear ribonucleoprotein K (hnRNPK), a DNA and RNA-binding protein [18,19], abundant in the nucleus, cytoplasm, and mitochondria [20]. hnRNPK contains low complexity domains (LCDs) identified using the SEG algorithm [21] from PlaToLoCo [22]. As a central signaling hub, hnRNPK regulates various cellular processes through its multiple domains, including three K-homologous (KH) domains, an RGG domain, and a K-interactive (KI) region [23]. hnRNPK has been observed in three material states: monomer, soluble aggregate (uncharacterized), and KH3 domain crystals [24,25].
Figure 1. Domain map of full-length hnRNPK used in this study NLS (amino acids 21-37), KH1 (amino acids 46-98), KH2 (amino acids 149-197), KI (amino acids 236-273), RGG (amino acids 236-335), KNS (amino acids 338-361), KH3 (amino acids 391-439); and sequences of hnRNPK low complexity domains in red arrows (bottom of Figure 1).
Preprints 144406 g001
Environmental stressors, such as heat shock and mutations, can cause proteins to adopt abnormal conformations, exposing hydrophobic regions and leading to irreversible aggregation [26]. The aggregation propensity varies significantly among different proteins. RNA-binding proteins with low complexity domains (LCDs), such as FUS and TDP-43, are particularly prone to aggregation and are linked to neuromuscular disorders like amyotrophic lateral sclerosis (ALS) [27].
The low complexity domains LCDs are regions in proteins composed of a limited subset of amino acids, often resulting in intrinsically disordered structures [28]. These domains can initiate protein aggregation in vitro, as observed with the LCD fragments of U1-70K [29]. In addition to aggregation, LCDs can facilitate liquid-liquid phase separation, underscoring their role in the phase behavior of RNA-binding proteins, which is crucial for the formation of membraneless organelles [9,30]. Moreover, LCDs alone can drive the formation of protein hydrogels, as demonstrated by the prion-like LCDs of FUS and RBM14 forming amyloid-like fibrils under specific conditions [17,31].
This study investigates the transitions of hnRNPK, a protein containing both nucleic acid-binding domains and low-complexity domains (LCDs) that are prone to aggregation, phase separation, and gelation [29,30,31,32,33]. Previous research focused on stabilizing hnRNPK to prevent aggregation, but provided limited insights into its properties and transition from monomer to aggregate [24]. Herein, we employed dynamic light scattering (DLS) to measure changes in hnRNPK’s hydrodynamic diameter, revealing that aggregation is a dynamic process influenced by temperature and protein concentration. Light scattering and TEM further characterized the distinct monomeric and aggregated states of hnRNPK, illustrating the measured stoichiometry of novel structures of hnRNPK monomer and aggregate. Additional small-angle X-ray scattering (SAXS) and small-angle neutron scattering (SANS) experiments provided structural details, showing an elongated monomer shape.
Notably, at low temperatures and high concentrations, GFP-hnRNPK formed a hydrogel with an amyloid-like fibril structure, confirmed by scanning electron microscope (SEM) and X-ray diffraction. In the presence of PEG 8000, GFP-hnRNPK phase separated into liquid droplets, observed via fluorescence microscopy. Further experiments demonstrated the vital role of PEG 8000 and salt concentrations on phase behavior of hnRNPK.
Collectively, these results demonstrated the complicated behaviors of hnRNPK, resulting in four distinct material states: disperse monomer, soluble aggregate, liquid condensate, and hydrogel. The emergence of two novel states, hydrogel and liquid condensate, together with structural characterization of monomeric and aggregate states of hnRNPK, suggests the exciting potential of hnRNPK transitions as a cellular mechanism to regulate the protein’s functions in the cell.

2. Results

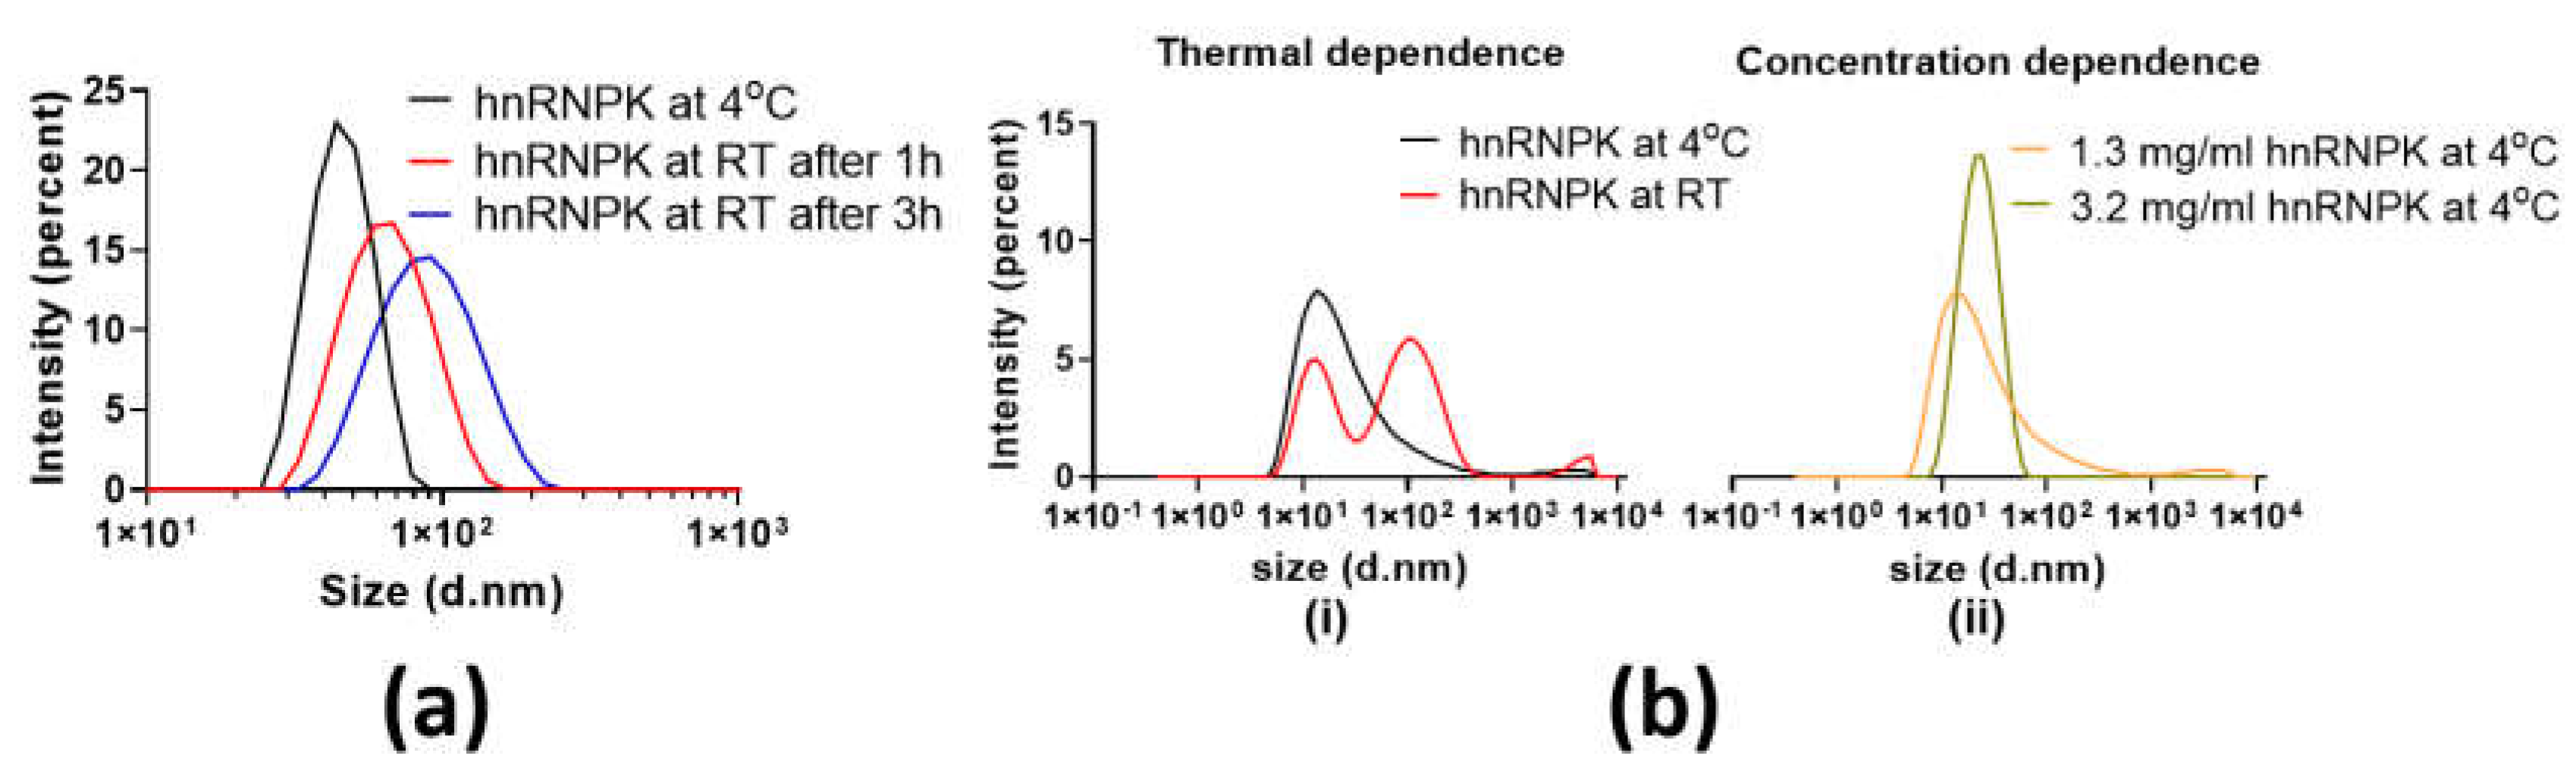
2.1. The Unstable Nature of hnRNPK

Prior study has reported the instability of the hnRNPK protein and its tendency to aggregate in solution [24]. The same aggregation phenomenon was observed during hnRNPK purification in this study. To identify what factors inducing hnRNPK aggregation, DLS was employed to investigate the solution properties of hnRNPK over time and in varying conditions by monitoring the change in the hydrodynamic diameter of the hnRNPK protein. hnRNPK is unstable and quickly aggregates immediately after secondary purification using SEC, therefore freshly purified hnRNPK protein was used to minimize the impact of swift aggregation. To avoid variation between hnRNPK purification, all hnRNPK samples used for DLS experiments came from the same batch of purification.
DLS analysis reveals the behavior of hnRNPK upon temperature change. At 4oC, a 0.5 mg/ml hnRNPK sample has a peak at 43.8 nm (Figure 2a-black line). The same sample incubated at room temperature for one, and three hours shows an increase in size of particles to 68.1 nm (Figure 2a-red line) and 91.3 nm (Figure 2a–blue line), respectively, with reduced peak height and increased peak width. These results show a clear increase in the diameter of hnRNPK particle upon raising the temperature.
Having observed the instability of hnRNPK at room temperature, we next used DLS to further quantify the impact of temperature and concentration on freshly purified hnRNPK protein in order to obtain better insight into behaviors of hnRNPK protein upon condition changes.
At 4oC, a freshly purified hnRNPK sample at 1.3 mg/ml had one single peak at 13.5 nm in diameter, followed by a long tail and a small peak of aggregate at 3580.0 nm. At 4oC, the freshly purified hnRNPK protein was substantially smaller (13.5 nm). Upon raising temperature to 25oC, the peak at 13.5 nm was reduced in height, indicating a reduction in the number of particles at this size. At the same time, a major second peak is observed at 105.7 nm, together with another small peak of aggregate at 5560.0 nm (Figure 2b(i)) with clear resolution between three peaks. Intriguingly, hnRNPK protein aggregates changes from a single peak to bimodal distribution in Figure 2b(i), while the shift is monomodal distribution in Figure 2a, suggesting hnRNPK protein might take different modes of self-association during aggregation process.This DLS data indicates the impact of temperature on hnRNPK, increasing the size of hnRNPK particles overtime.
The same protein sample was concentrated from 1.3 mg/ml to 3.2 mg/ml to assess the impact of protein concentration on hnRNPK aggregation. DLS measurements revealed a similar increase in size of hnRNPK upon rising protein concentration at 4oC. After being concentrated from 1.3 mg/ml to 3.2 mg/ml, the main peak moves from 13.5 nm to 21.0 nm with higher peak height and becomes symmetrical as the long tail from the 1.3 mg/ml hnRNPK sample disappears (Figure 2b(ii)). Both samples have small aggregate peaks at 3580 nm for 1.3 mg/ml sample and 5560 nm for 3.2 mg/ml sample. The substantial increase of the peak height at higher protein concentration indicates the existence of larger species, resulting in stronger scattering intensity. The DLS analysis unravels the significant impact of the temperature and concentration, as two key factors on hnRNPK’s behavior, driving the protein into aggregation upon condition changes.

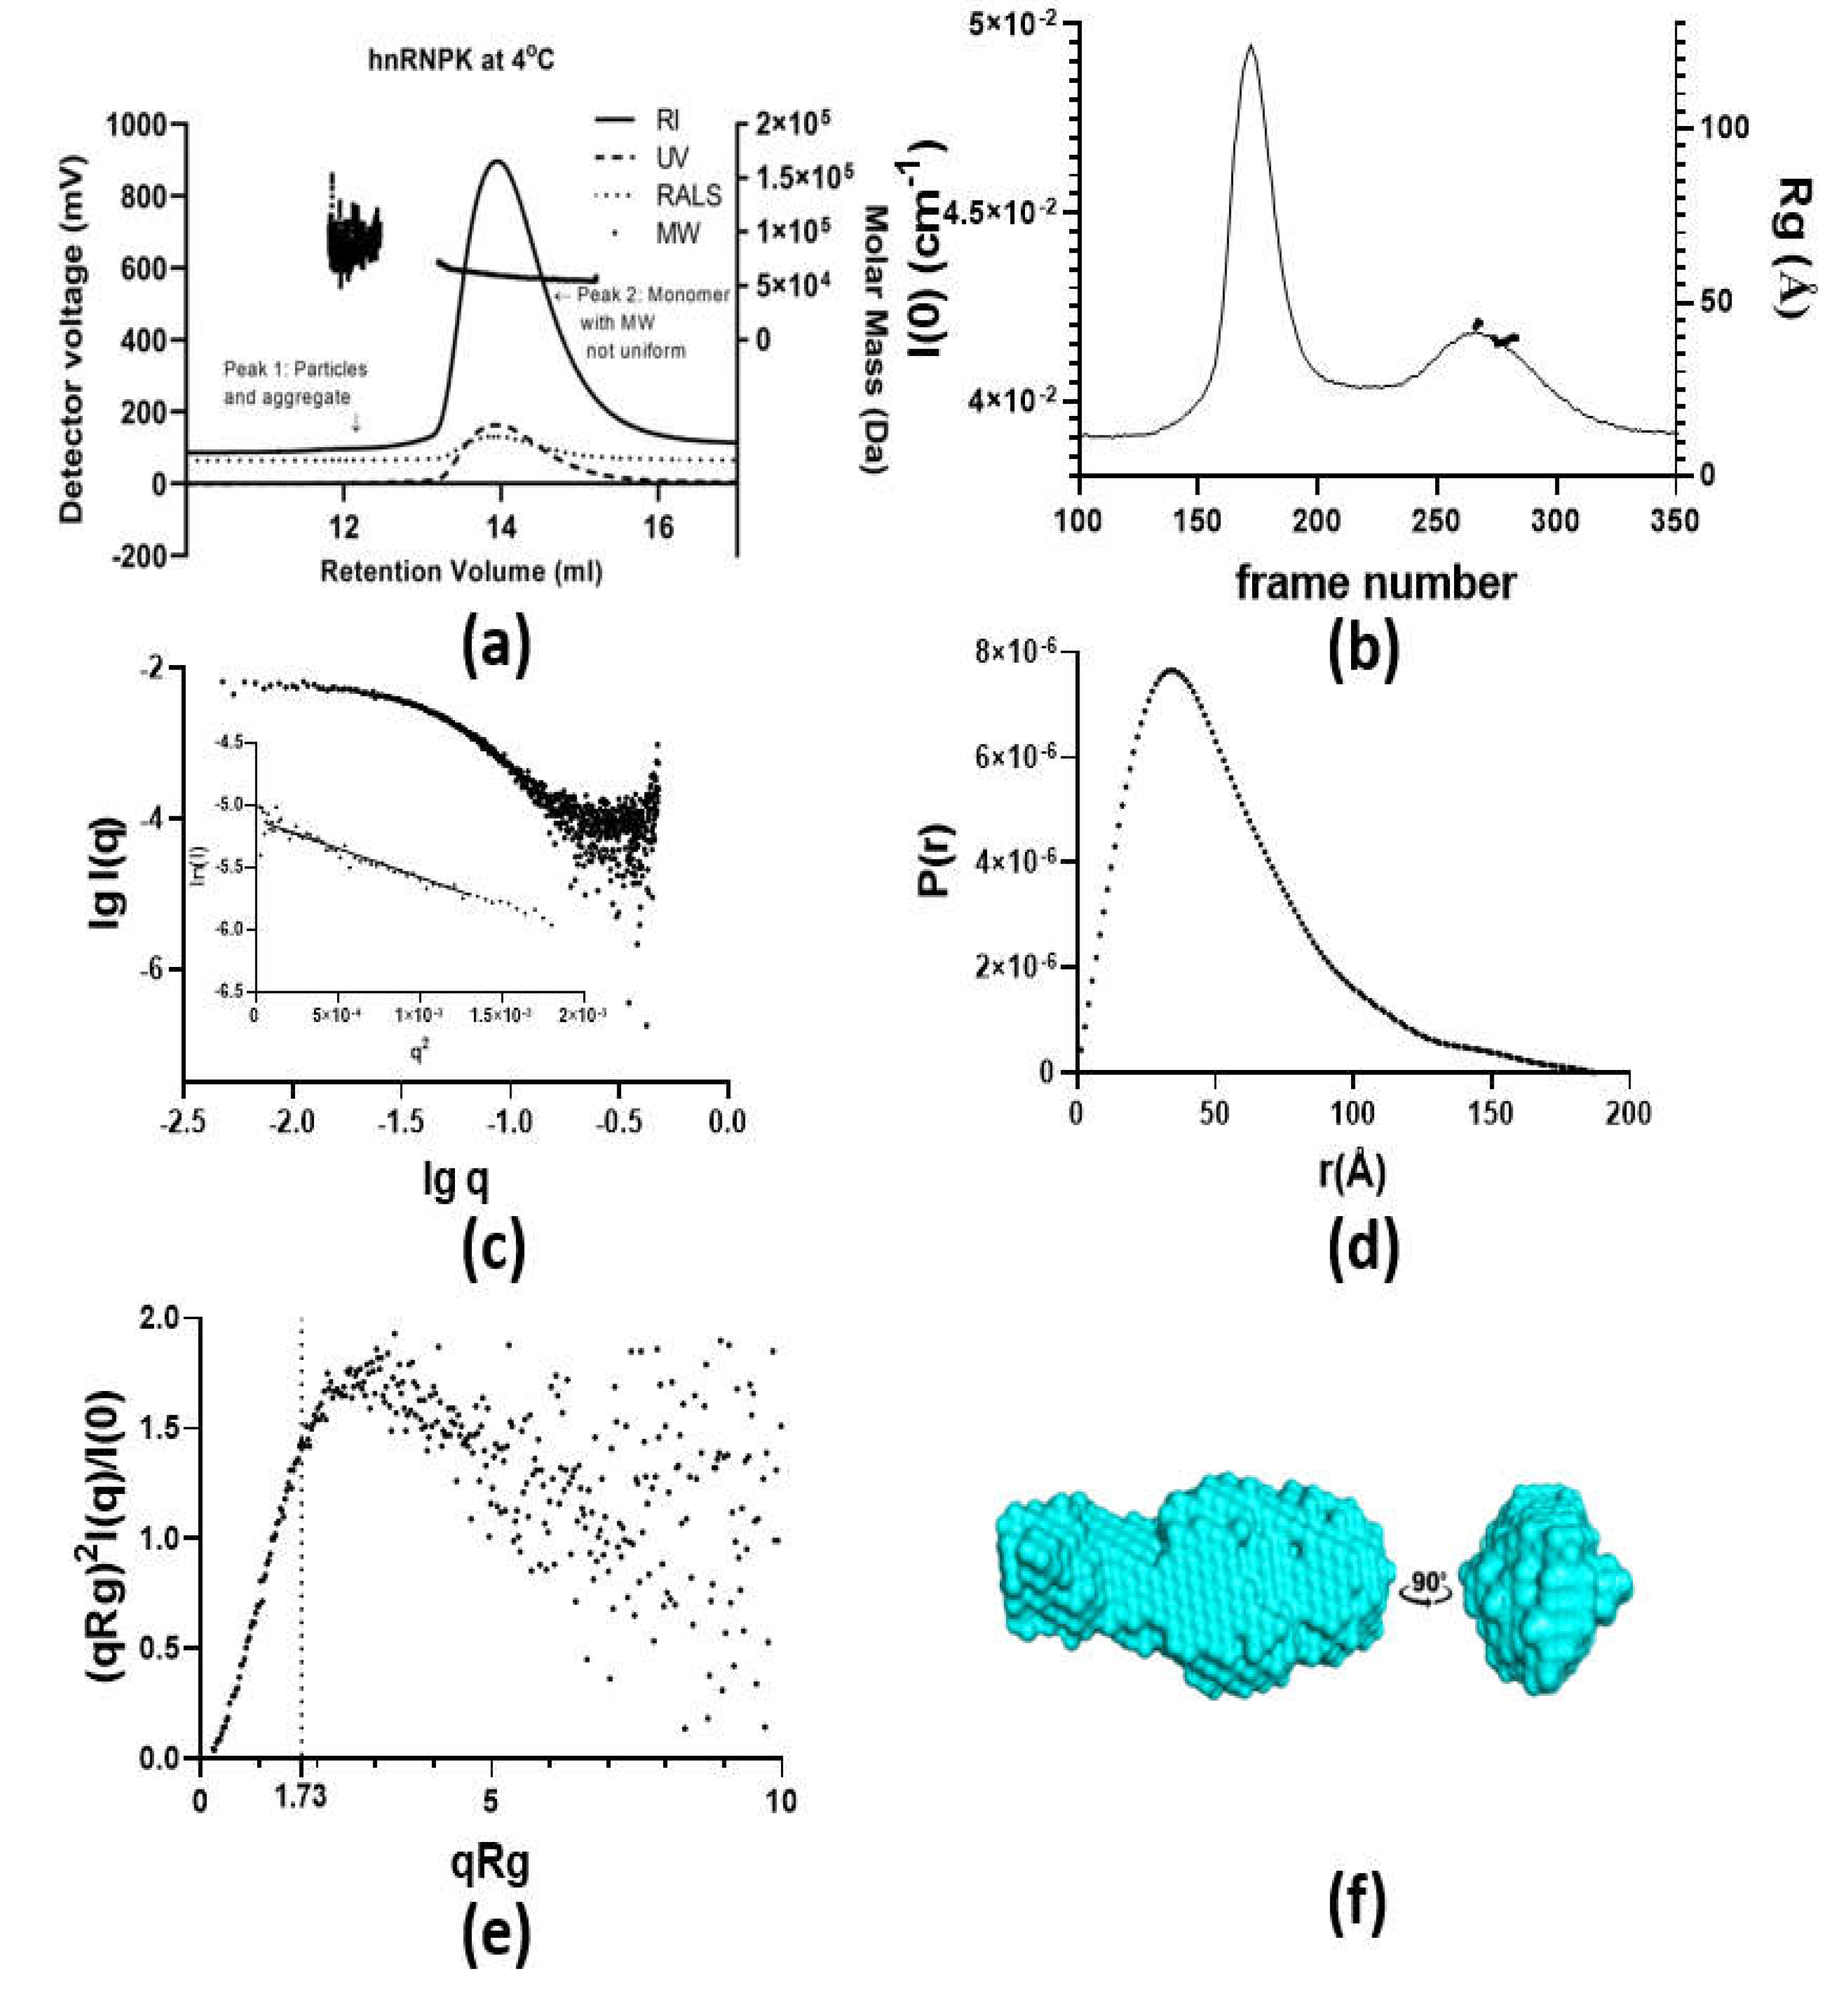
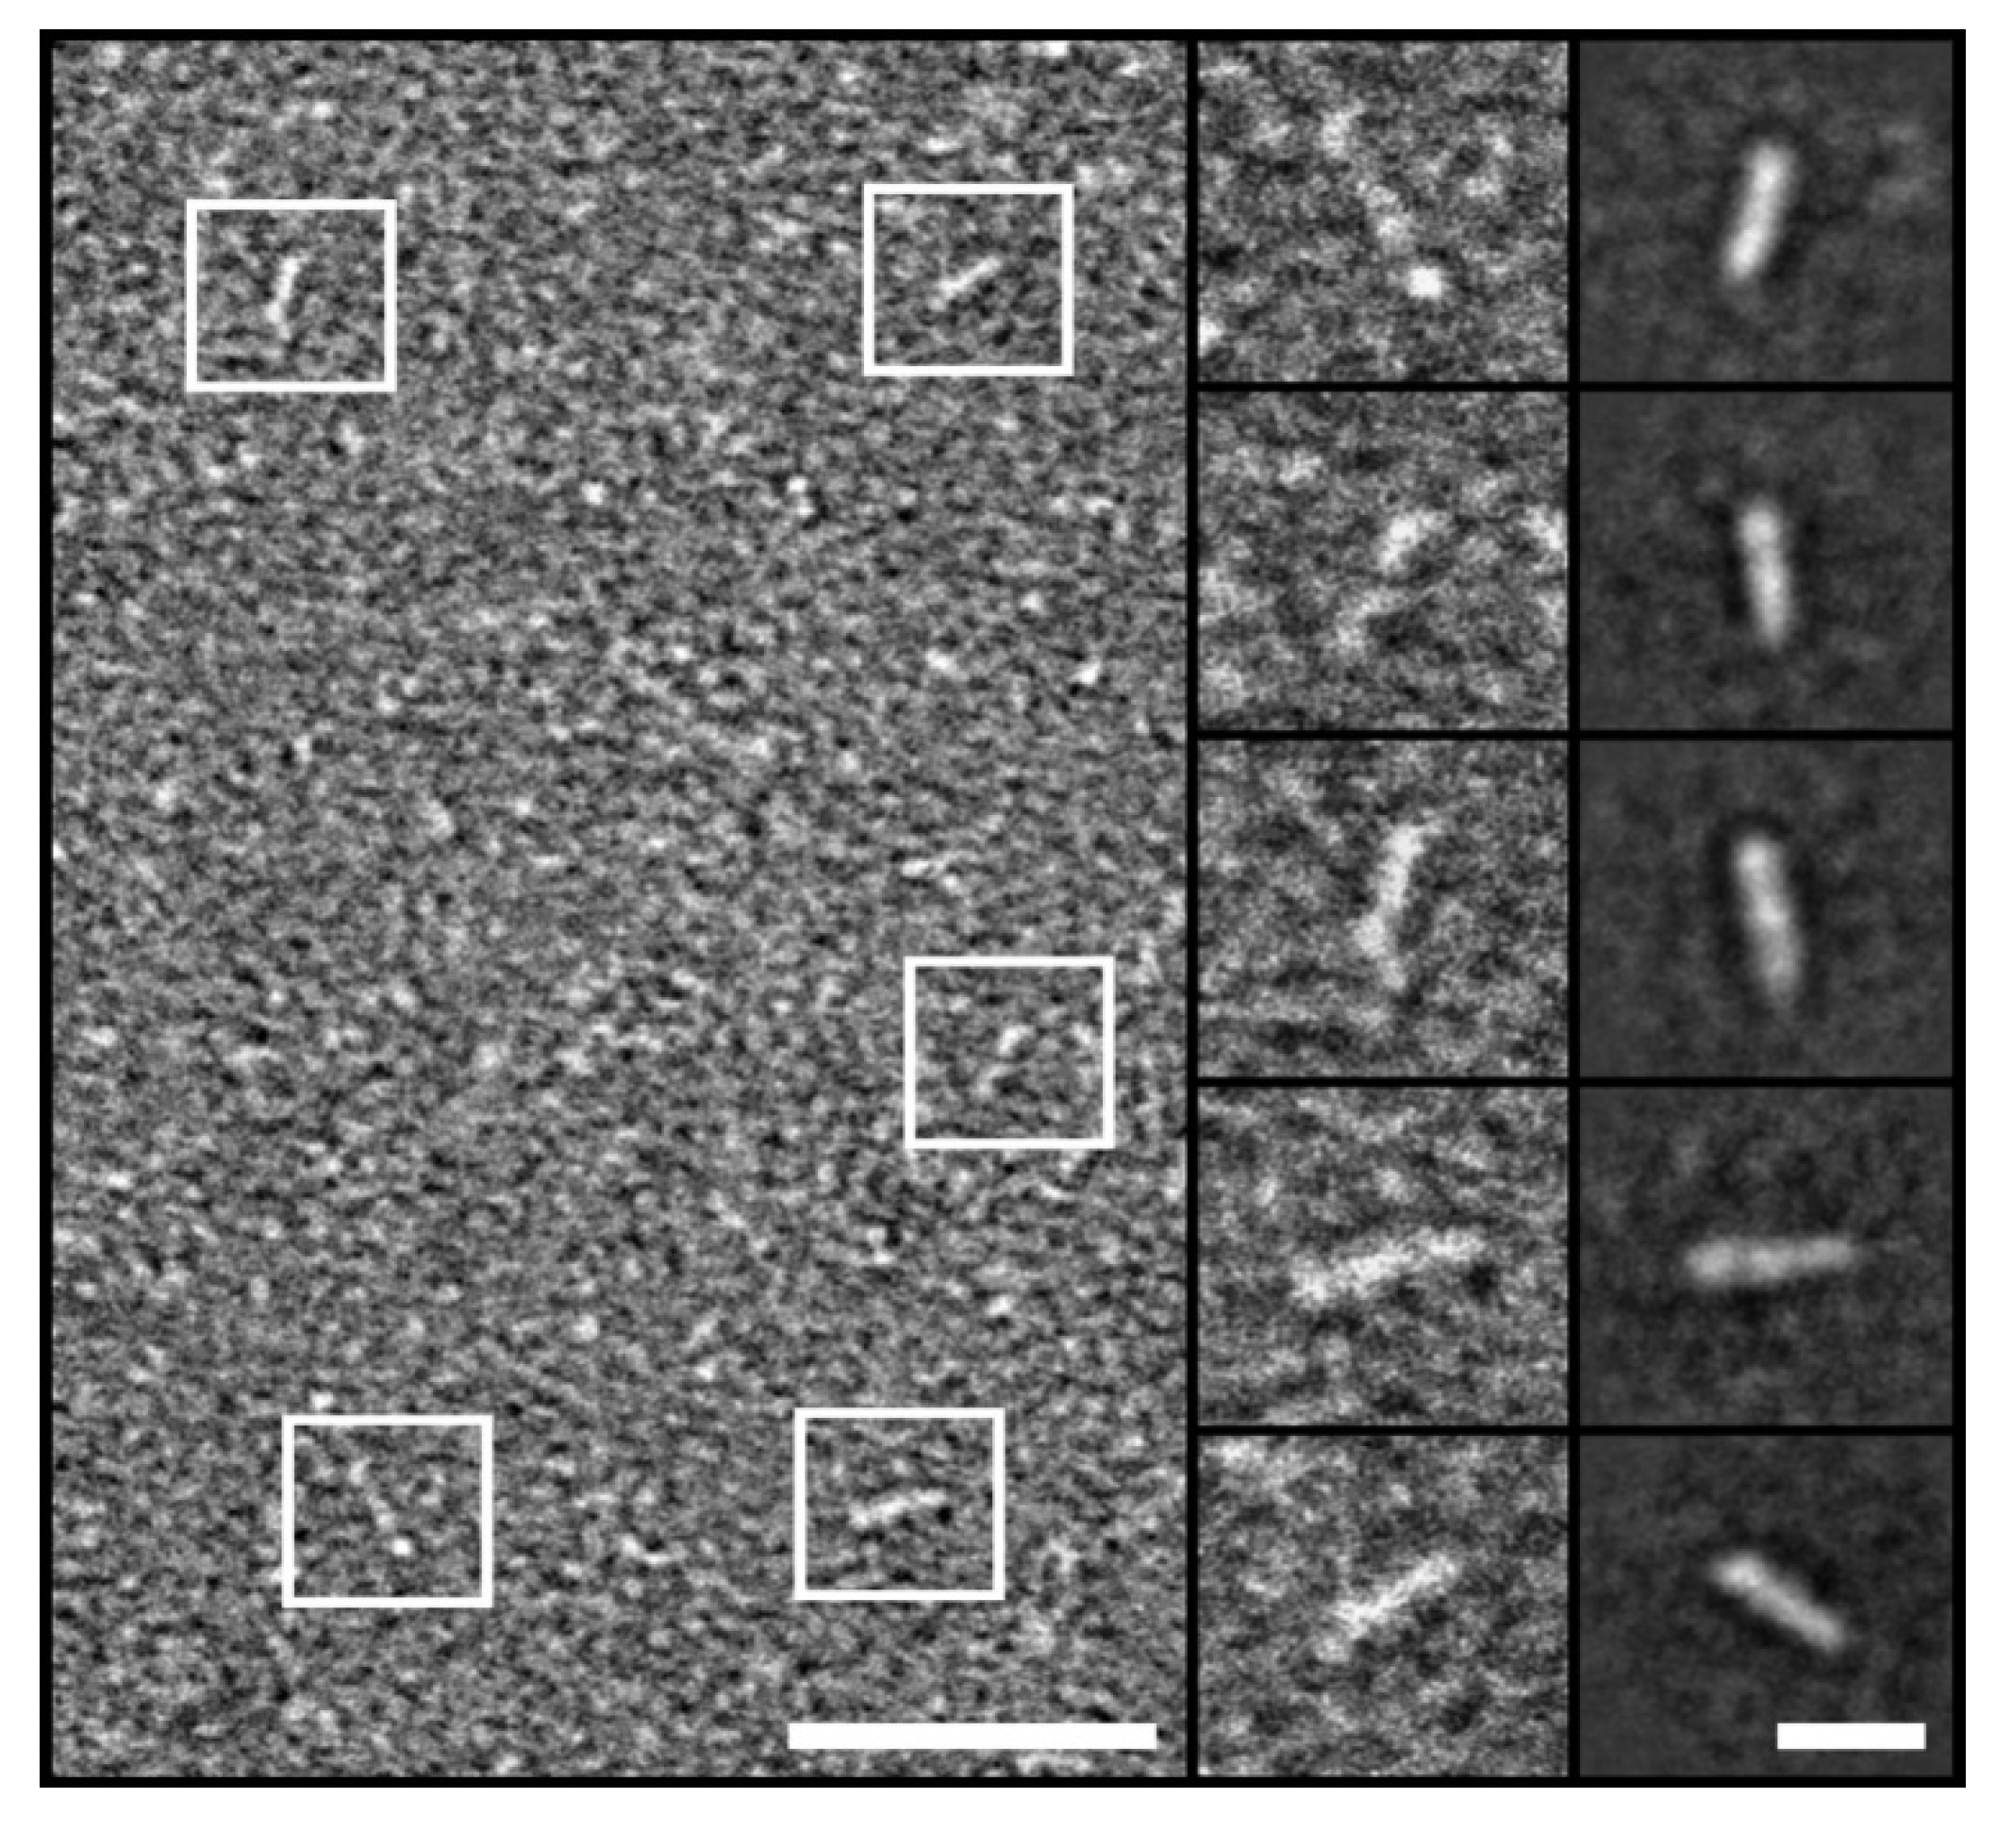
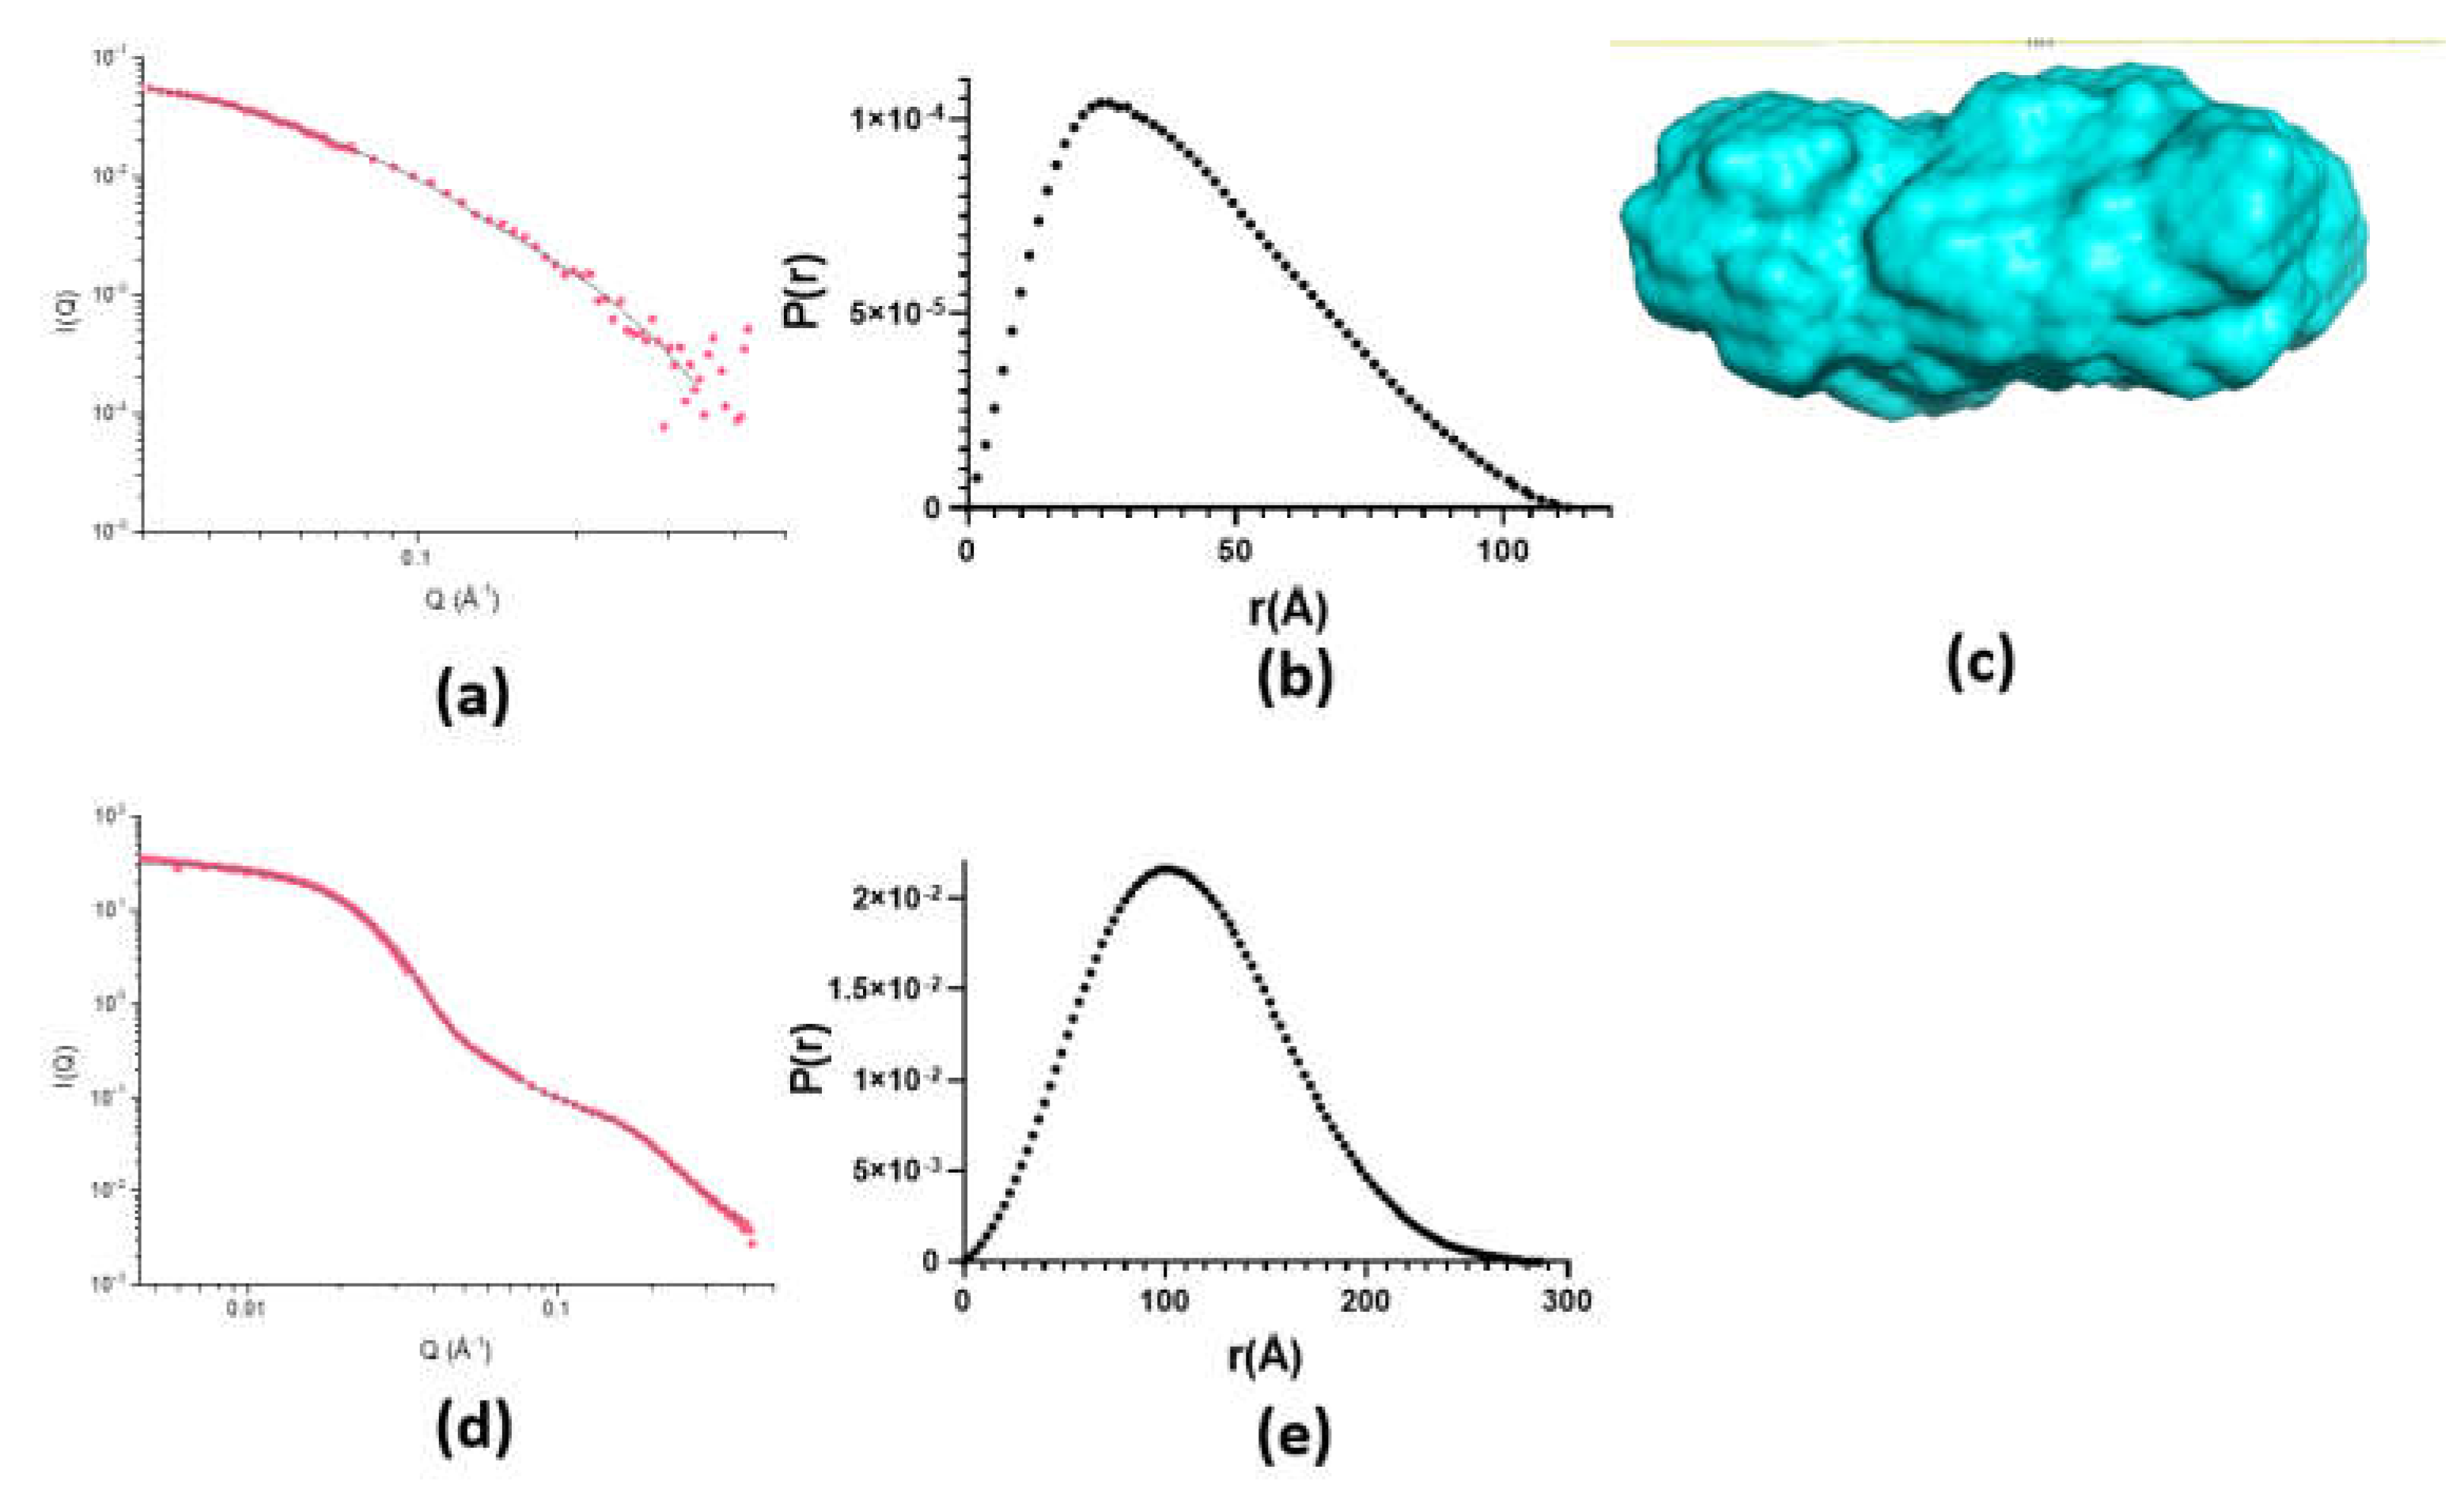
2.2. Monomeric State of hnRNPK

Based on our finding that the temperature and concentration can drive hnRNPK into aggregation, we therefore designed a series of experiments using low concentrations of hnRNPK at low temperature to characterize hnRNPK protein in its monomeric state.
We first used SEC-LS at room temperature to determine the molar mass (MM) and homogeneity of hnRNPK particles when the hnRNPK sample was kept at 4oC. The theoretical MM of the full-length wild-type hnRNPK monomer with an additional glycine residue at the N-terminus, used in this study, is 51033 Da. SEC-LS analysis can be used to compare the measured MM of hnRNPK to the theoretical MM of the measured samples and reveal the stoichiometry of the hnRNPK sample kept at 4oC. The elution profile displays a small shoulder, followed by a major peak with good resolution (Figure 3a). The small shoulder (Peak 1) is eluted at 12.4 ml with an estimated MM of 101.32 kDa (Table 1). The MM distribution shows a wide range (49.0-152.9 kDa), most probably representing a small number of protein stoichiometries (1-3 molecules). The major peak (peak 2) elutes at 13.9 ml, exhibiting a MM value of 59.1 kDa (Table 1), suggesting the majority of particles in peak 2 are hnRNPK monomers. The molar mass points, distributed linearly across the major peak, range from 54.0 kDa to 73.0 kDa. This MM distribution indicates homogeneity of hnRNPK as the protein was kept at low temperature and low concentration. A slight slope of MM distribution across peak 2, indicates that at this condition, there is still a small amount of hnRNPK aggregate coexisting together with the majority of hnRNPK monomer in solution. In combination with DLS, SEC-LS showed that 4oC and low protein concentration was sufficient to maintain the majority of hnRNPK in the monomeric state. Based on these results, we designed SAXS and negative stain transmission electron microscopy (TEM) experiments in an optimal condition to study the structure of hnRNPK monomer.
Using SEC-sy-SAXS (Table 2), we observed that while the protein sample was kept at 4oC, it displayed heterogeneity as both aggregate and monomer were present in the sample. The chromatography trace following I(0) for the separation of 6.2 mg/ml hnRNPK at 4oC shows two well separated peaks (Figure 3b). The first peak, with high intensity, is due to large polydisperse aggregated protein as no Rg could be established from the scattering data. The second peak, on the other hand, contains scattering data which can be used for further analysis, when background subtracted using buffer-only frames from an appropriate part of the experiment. The MM distribution across peak 2 varies from 40 to 210 kDa, suggesting the presence of multiple oligomers along with monomeric hnRNPK (S1—Supplementary data). The MM variation of hnRNPK at 4oC from SAXS resembles such values observed in SEC-LS, ranging from 49.0–152.9 kDa (Table 2). SAXS samples were subjected for sample delivery process to the Australian Synchrotron. The higher MM of hnRNPK measured from SAXS is perhaps due to the effect of freeze-thaw cycles in comparison to freshly purified hnRNPK immediately used after purification for SEC-LS experiments at 4oC. The MM distribution of hnRNPK at 4oC measured by SAXS and SEC-LS indicates hetero-oligomerisation of hnRNPK, while multiple oligomeric states of hnRNPK coexist with monomeric hnRNPK in solution.
SEC-SAXS can resolve heterogeneous sample into multiple populations of elution. The scattering data, from frames 360–379 (buffer), and 273–283 (protein sample), were averaged to study hnRNPK monomer at 4oC. By studying this trait of SEC-SAXS, solution structure of interested homogeneous population can be determined [34]. Due to complex behaviors of hnRNPK sample at 4oC, selecting appropriate scattering frames is a decisive step to analyze solution structure of monomeric hnRNPK, eliminating out any sudden increase in MM value to ensure the homogeneity of hnRNPK monomers [35].
The log I(q) vs log q plot shows the X-ray scattering of hnRNPK particles in the averaged frames from the second peak. The plot is linear and approaching the y-axis horizontally at low angles (Figure 3c). In addition, the Guinier plot of the scattering data displays linear behavior (inset-Figure 3c), despite a minimal up-tick at the lowest resolution, most probably due to the presence of some large particles.
The MM, estimated by Bayesian probability calculation, is one of the primary parameters derived from SAXS analysis to demonstrate the solution state of protein sample [35]. The estimated MM of hnRNPK sample is 54.4 kDa (Table 2) with 6.7% deviation from the theoretical MM of hnRNPK monomer, confirming this set of scattering data derived from hnRNPK particles at their monomeric state.
The P(r) distribution shows a smooth, concave curve with a peak at approximately 4.0 nm, and an extended tail that approaches zero at Dmax of 18.7 nm (Figure 3d). This distribution indicates that the hnRNPK monomer in solution adopts a globular, elongated shape. The interpretation of the extended tail depends on whether higher oligomeric species are contaminating the hnRNPK monomer. In the absence of contamination, given that the selected scattering frames have estimated molecular masses closely aligned with the theoretical molecular mass of the hnRNPK monomer (51 kDa), the globular, compact particles would exhibit a bell-shaped P(r) distribution, while the extended tail could be attributed to the flexibility of unfolded particles. Despite careful selection of scattering frames to focus on hnRNPK monomers, the low resolution of size exclusion chromatography implies a potential contamination by higher oligomeric hnRNPK species, with estimated molecular masses ranging from 40 to 210 kDa (Figure S1). The presence of a few hnRNPK oligomers could also explain the extended tail from 11 to 18 nm in the P(r) distribution.
The dimensionless Kratky plot initially rises sharply to a peak at low qRg (ca. 1.8), and then gradually drops down toward the x-axis, suggesting that the hnRNPK monomer possesses an ordered structure with a degree of flexibility (Figure 3e). The plot becomes too noisy to interpret above the qRg value of 5.
From the scattering data, 20 independent bead models were generated using DAMMIF program [36]. The final normalized spatial discrepancy (NSD) is 0.651 (Table 2), which suggests that most of the models are very similar in shape. The 20 models were averaged using DAMAVER [37], producing a representative ab initio model of hnRNPK monomer with elongated shape as shown in Figure 3f. Moreover, the χ2 of 0.26 (Table 2), indicates an extremely good fit between the model and scattering data (the error model employed at the SAXSWAXS beamline of the Australian Synchrotron results in the χ2 of 0.25 representing ideal fit). The ab initio model in Figure 3f is the most accurate solution structure representing either flexible hnRNPK monomers or hnRNPK monomers with mixed scattering signals from a few higher MM hnRNPK oligomers.
To further characterize the morphology of hnRNPK monomer, we carried out TEM experiments beginning with a low concentration of hnRNPK protein. The preparation of TEM grids with hnRNPK protein was performed on ice to minimize hnRNPK aggregation. TEM images show that at low concentration of 2.48 µM (ca. 0.13 mg/ml), hnRNPK protein particles were well distributed over the grids. The overview panel of Figure 4 reveals raw hnRNPK particles which are highlighted in white boxes. The contrast of images is sufficient to identify and select raw hnRNPK particles from the background as shown in the first column of Figure 4. From the raw particles, 2D averaging was performed to produce five distinct 2D class averages with elongated shapes, each was averaged from around 20 raw particles. The length of these five 2D averages ranges from 10.8 nm to 13.5 nm. The images suggest a structure with 2-3 regions of higher electron density, which may reflect the domain organization of hnRNPK. The overall size and shape of the hnRNPK particles imaged by TEM is in agreement with the solution structure of the hnRNPK monomer SAXS profile.

2.3. Aggregation State of hnRNPK

Having characterised the properties and structure of the hnRNPK monomer, we next set out to characterize hnRNPK aggregates induced by incubation at room temperature. SEC-LS was again used to investigate the stoichiometry and homogeneity of hnRNPK, while TEM and SAXS experiments were carried out to study the structure of hnRNPK.
The SEC-LS elution profile of hnRNPK at room temperature indicates an increase of protein aggregates compared to the hnRNPK sample at 4oC (Figure 3a), as larger species can be observed from the chromatogram. The MM distributions of peak 1 and peak 2 overlap each other with poor resolution between two peaks (Figure 5a). Peak 1 (12.5 ml) had a MM of 146.9 kDa, with MM points varying from 114.8 kDa to 282.4 kDa, strongly suggesting polydisperse aggregation. Similarly, the majority of protein particles in peak 2 (13.6 ml) increases in size in comparison to the sample at 4oC (13.9 ml) from 59.1 kDa to 78.0 kDa (Table 1). The MM distribution of peak 2 is markedly uneven as the MM values vary from 138.0 kDa to 51.0 kDa, indicating heterogeneity of sample across peak 2 with higher oligomeric states of hnRNPK formed due to the effect of room temperature on the sample. Together with DLS, SEC-LS analysis illustrates the impact of temperature on hnRNPK aggregation, establishing the specific condition for us to further study the aggregation process of hnRNPK protein.
Having observed the aggregation of hnRNPK induced by room temperature, we next used SEC-sy-SAXS to investigate the solution structure of hnRNPK aggregate. The frames used to generate data were 51- 102 for buffer, and 305–321 for protein sample. The I(0) trace of hnRNPK at room temperature displays one large peak along three small peaks and a noisy background, (Figure 5b), suggesting heterogeneity for hnRNPK sample at room temperature. The noisy background is perhaps due to a minimal degree of air in the SAXS system causing the issue.
The log I(q) vs log q plot, the primary data of hnRNPK sample at room temperature (Figure 5c), is in linear form and horizontal at low log q values. The scattering data shows linear behavior in the Guinier region (inset-Figure 5c).
The P(r) distribution shows a maximum peak at 10.0-11.0 nm and approaches the x-axis smoothly at Dmax at 41.0 nm (Figure 5d), indicating a substantial increase in size in comparison to the protein sample at 4oC. Despite the fact that the hnRNPK concentration of the room temperature sample was 0.82 mg/ml compared to 6.2 mg/ml of the 4oC sample, the maximum dimension of the P(r) from the room temperature sample (Figure 5d) is much higher than the value of the 4oC sample (Figure 3d). The increase in dimension and area under the P(r) curve even at lower protein concentration is clear evidence of hnRNPK aggregation at room temperature.
The Kratky plot shows a maximum value of 1.4 at qRg value of 2.5, dropping down toward the x-axis to form a partly bell shape before rising at qRg value of 7 (Figure 5e). Given the large size of hnRNPK aggregate, the Kratky plot most probably represents a globular oligomeric structure with some degree of polydispersity.
The established molecular mass of hnRNPK particles at room temperature is 873.1 kDa (Table 2), evidently showing aggregate of hnRNPK formed in the solution. An attempt has been made to generate an ab initio model of hnRNPK aggregate, however the final NSD is 1.1 suggesting a wide variety of classes from the calculations (Table 2). This result indicates the high polydispersity of hnRNPK aggregates, which makes the bead modeling an inappropriate approach to illustrate the structure of hnRNPK aggregate in solution.
In order to further characterize the morphology of the hnRNPK aggregate, TEM was performed, using TEM grids of hnRNPK prepared at room temperature, to visualize the effect of temperature on the overall shape of hnRNPK protein. The TEM images display hnRNPK aggregates as several separated clumps and a big cluster with diameters varying from 22 nm to 200 nm (Figure 5f), which is in agreement with SAXS analysis of hnRNPK aggregate showing a highly polydisperse protein sample in solution. This is consistent with the highly uneven molar mass distribution of hnRNPK recorded by the SEC-LS result, showing the coexistence of multiple higher order hnRNPK species in solution at room temperature.

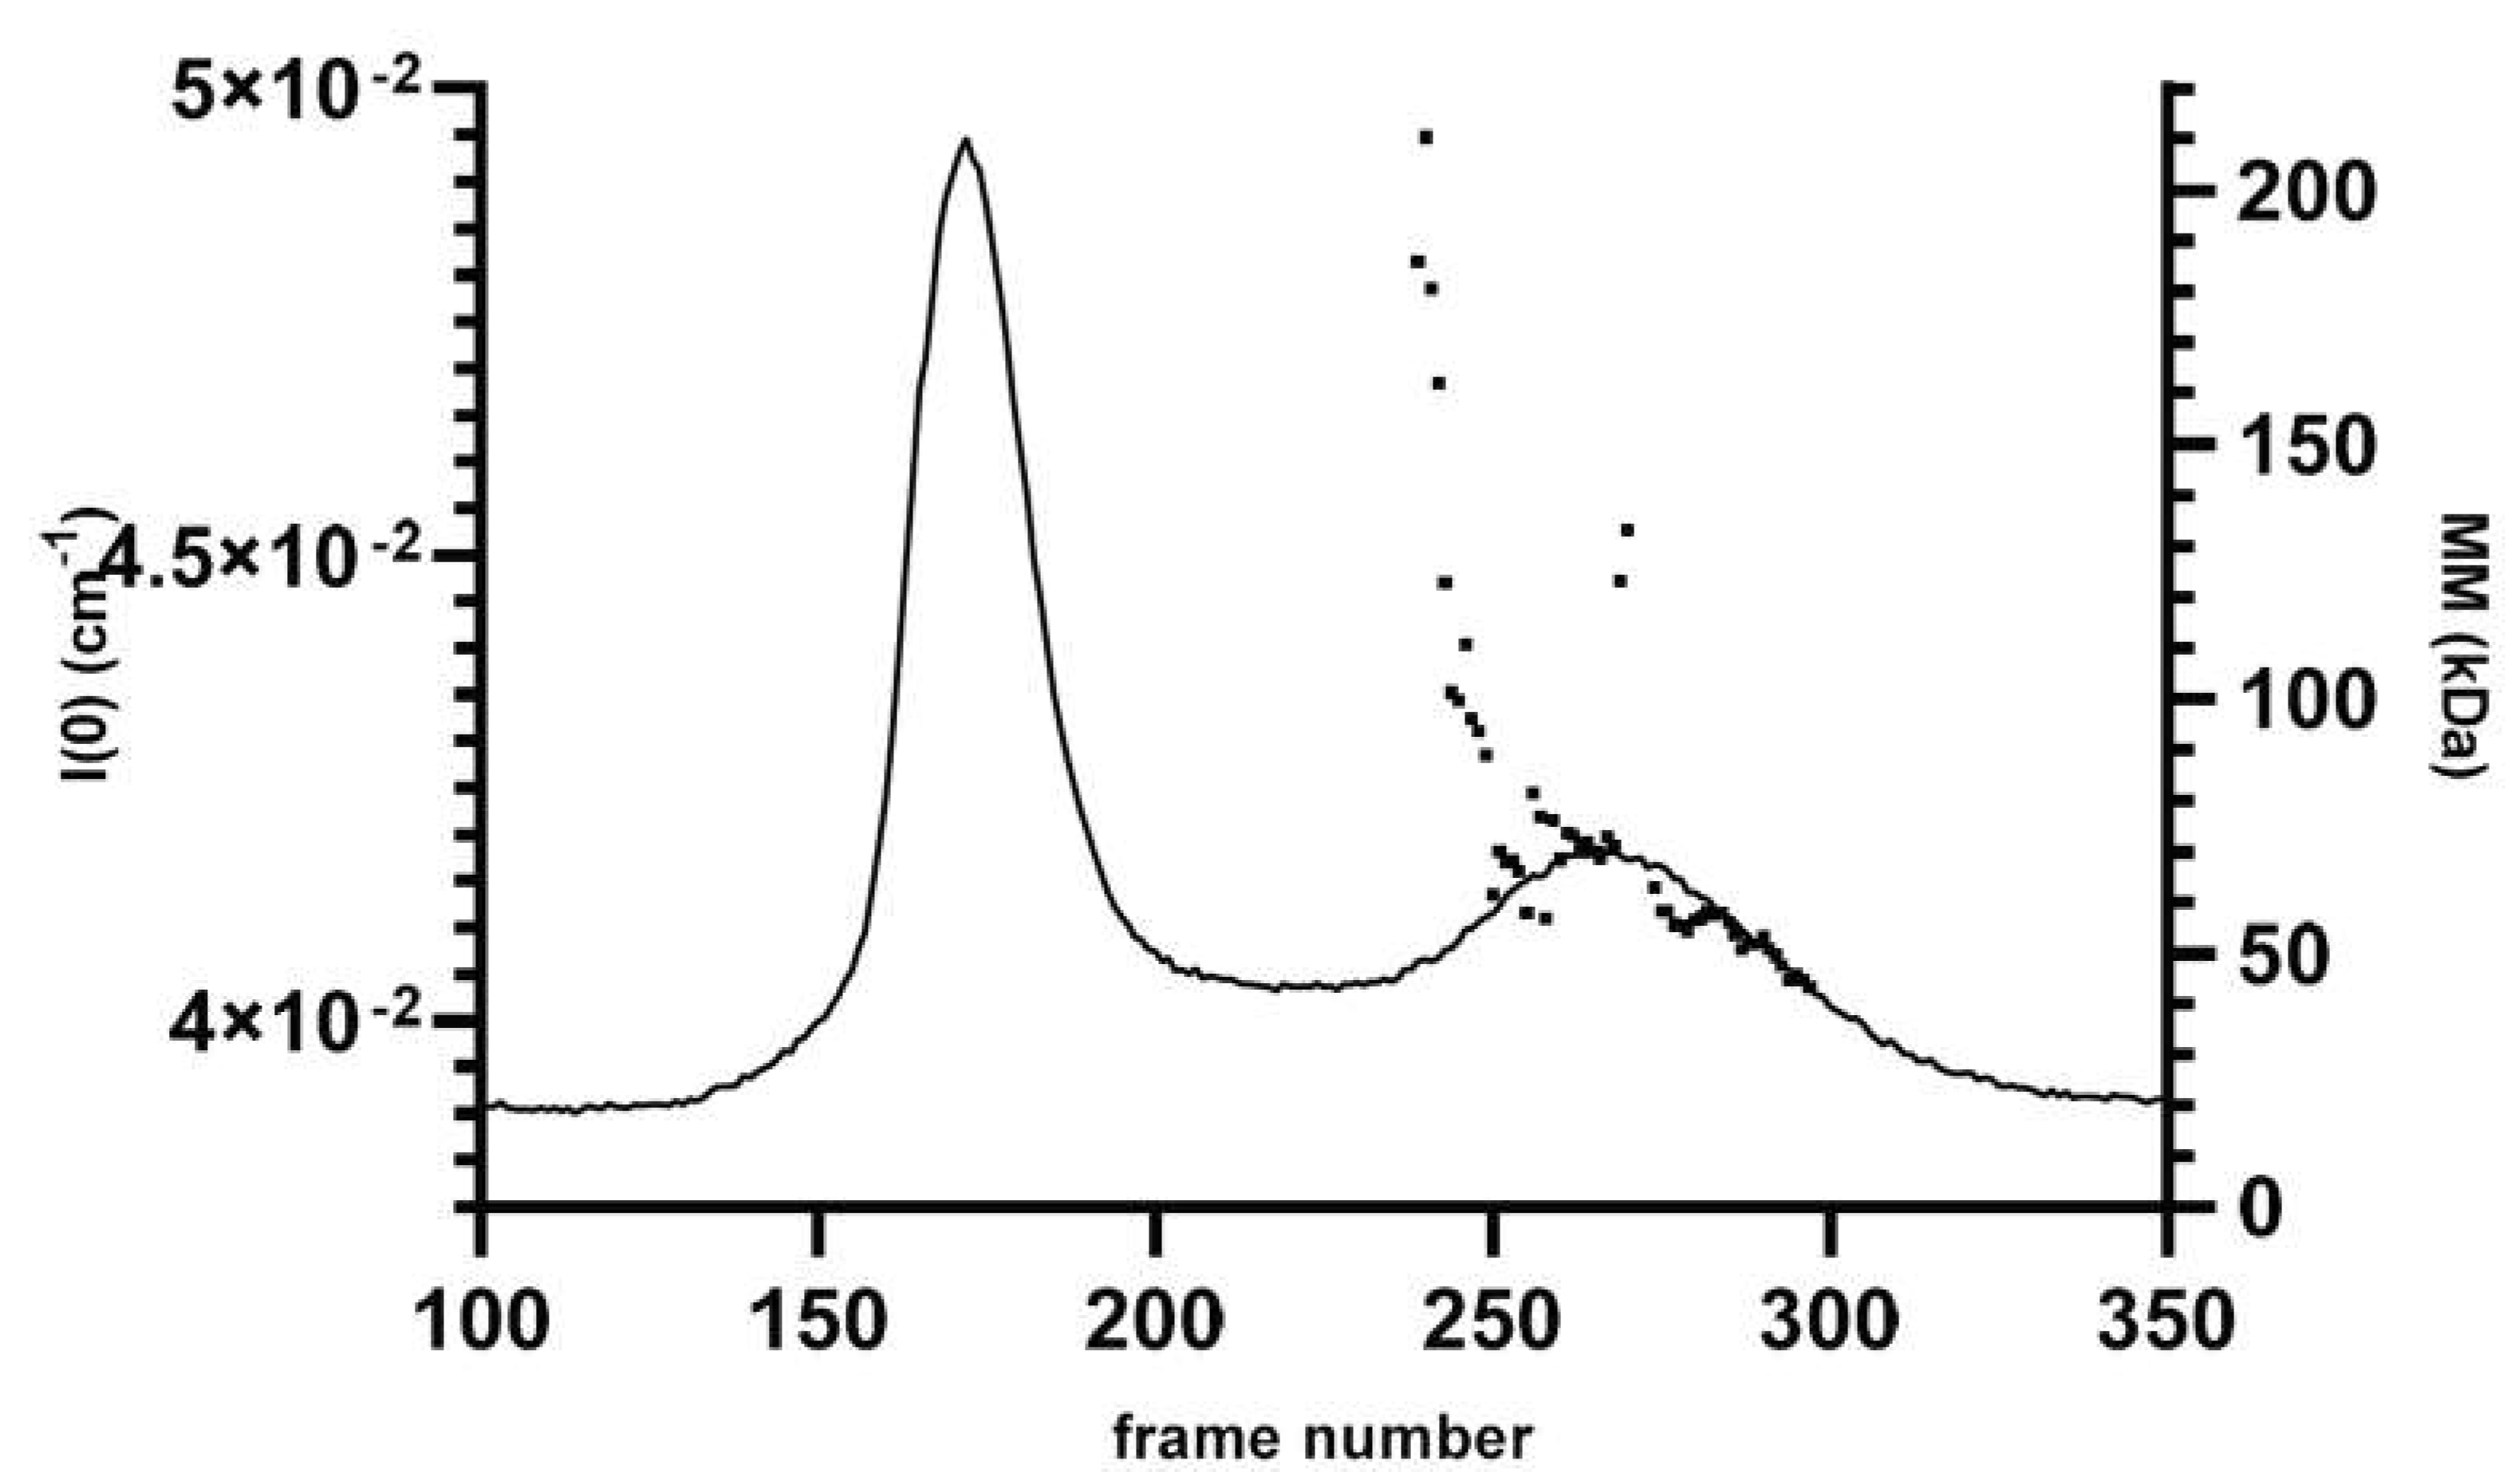
2.4. Characterization of hnRNPK Monomer in Mixture with Aggregates

Having established the structures of hnRNPK monomer and aggregate, next we performed a SANS experiment to further characterize the structure of monomeric hnRNPK within heterogeneous sample. SANS relies on contrast variation mixing hydrogenated and deuterated hnRNPK (H-hnRNPK:D-hnRNPK) at a certain ratio (H:D), enabling us to determine the structure of hydrogenated components within a multi-component complex. Given the negative impact of high temperature and concentration to hnRNPK monomer, hydrogenated hnRNPK was purified at 4oC and maintained at a concentration of 1.1 mg/ml to minimize aggregation. The optimal H:D ratio was 1:25 with 1.1 mg/ml of hydrogenated hnRNPK mixed with deuterated hnRNPK to achieve a total concentration of 26.6 mg/ml. While the low concentration of 1.1 mg/ml minimized aggregation of H-hnRNPK, it was sufficiently strong to extract the scattering signal of the hydrogenated monomer from the mixture. At the same time, our previous DLS analysis at room temperature suggests that at 20oC, it is highly possible the 26.6 mg/ml H-hnRNPK:D-hnRNPK mixture will form aggregates due to the impact of high concentration and temperature.
SANS analysis in Figure 6a shows the background subtracted SANS data of hnRNPK from the 1:25 (H:D) mass ratio sample. To prevent scattering signals from protein aggregates overlapping the signals from the hydrogenous hnRNPK sample, the bulk of the protein present was deuterated and contrast matched in buffers containing ~100% D2O. Hydrogenous protein was visible in D2O solutions at concentration of 1.1 mg/ml, thus the resulting scattering was from the individual hydrogenous hnRNPK particles distributed randomly throughout the deuterated hnRNPK bulk condensate. In addition, using unmatched buffers, we were able to measure the scattering of the whole aggregate.
The scattering profile of the 1:25 (H:D) sample in the low q region under 0.02 Å-1 is relatively linear. The estimated molecular mass (MM) of protein measured from SANS data is approximately 67.5 kDa (Table 2) [38,39]. The measured MM of the hydrogenous hnRNPK particles is close to the theoretical MM of hnRNPK monomer at 51033 Da, confirming that the H-hnRNPK maintained at low temperature and low concentration was indeed hnRNPK monomer. The P(r) distribution of H-hnRNPK has a concave curve shape, with a peak at 25-30 Å and a long smooth tail approaching the x-axis (Figure 6b). The P(r) profile of the H-hnRNPK suggests an elongated shape for H-hnRNPK protein, which is slightly more compact compared to hnRNPK monomer measured from SAXS experiment with Dmax from SANS and SAXS are 11.2 nm and 18.7 nm respectively (Table 2).
The program DAMMIF [36] was used to generate 20 independent ab initio models from the scattering data, revealing an uniform elongated shape of hnRNPK monomers for 20 models. The final normalized spatial discrepancy (NSD) is 0.893 which is relatively high (Table 2), indicating good similarity in shape between models which were then averaged using DAMAVER [37].
SANS analysis of hnRNPK aggregate was carried using 28.9 mg/ml hydrogenated hnRNPK protein. Figure 6c shows the background subtracted SANS data of hnRNPK in deuterated buffer solution. The scattering data have been reduced to log[I(q)] vs log(q), descending gradually at low q region. Such scattering profile suggests aggregate formation in hnRNPK sample [40].In addition, the estimated molecular mass (MM) of the 28.9 mg/ml hnRNPK sample measured from SANS data is approximately 1267.9 kDa (Table 2) [38,39]. The high measured MM of the sample confirms aggregation of the sample at high concentration.
The P(r) profile of hnRNPK aggregate has a relatively symmetrical shape, with a short tail approaching x-axis at 28-29 nm (Figure 6e). The P(r) distribution of hnRNPK aggregate is in agreement with SASView analysis, suggesting an overall ellipsoidal shape of hnRNPK aggregate with a Dmax value of 28.6 nm (Table 2).
The SANS analysis is in agreement with the DLS data showing the negative impact of high temperature and concentration on hnRNPK aggregation overtime. Collectively, our DLS and SANS data illustrate the molecular basis of hnRNPK transition from monomer to aggregate. Specifically, SANS data suggests that H-hnRNPK monomer retains its elongated structure when forming larger aggregates due to the impact of the 20oC temperature and the high concentration of 26.6 mg/ml of the 1:25 (H:D) mixture. Although the SANS result suggest a similar elongated shape of hnRNPK monomer, the Dmaxvalue recorded by SANS is only 11.2 nm, substantially shorter than such values recorded by TEM (up to 13.5 nm) and SAXS (18.7 nm) (Table 2). This shorter Dmax of SANS may be the result of a large compaction from aggregates on hnRNPK monomers, reducing the length of the monomers. Meanwhile, SANS data of hnRNPK aggregate shows an averaged structure with Dmax value of 28.6 nm. In consistency with SAXS, and TEM results of hnRNPK aggregate, the SANS model again demonstrates hnRNPK aggregation as an ever-changing process, resulting in a various sizes of hnRNPK aggregates.

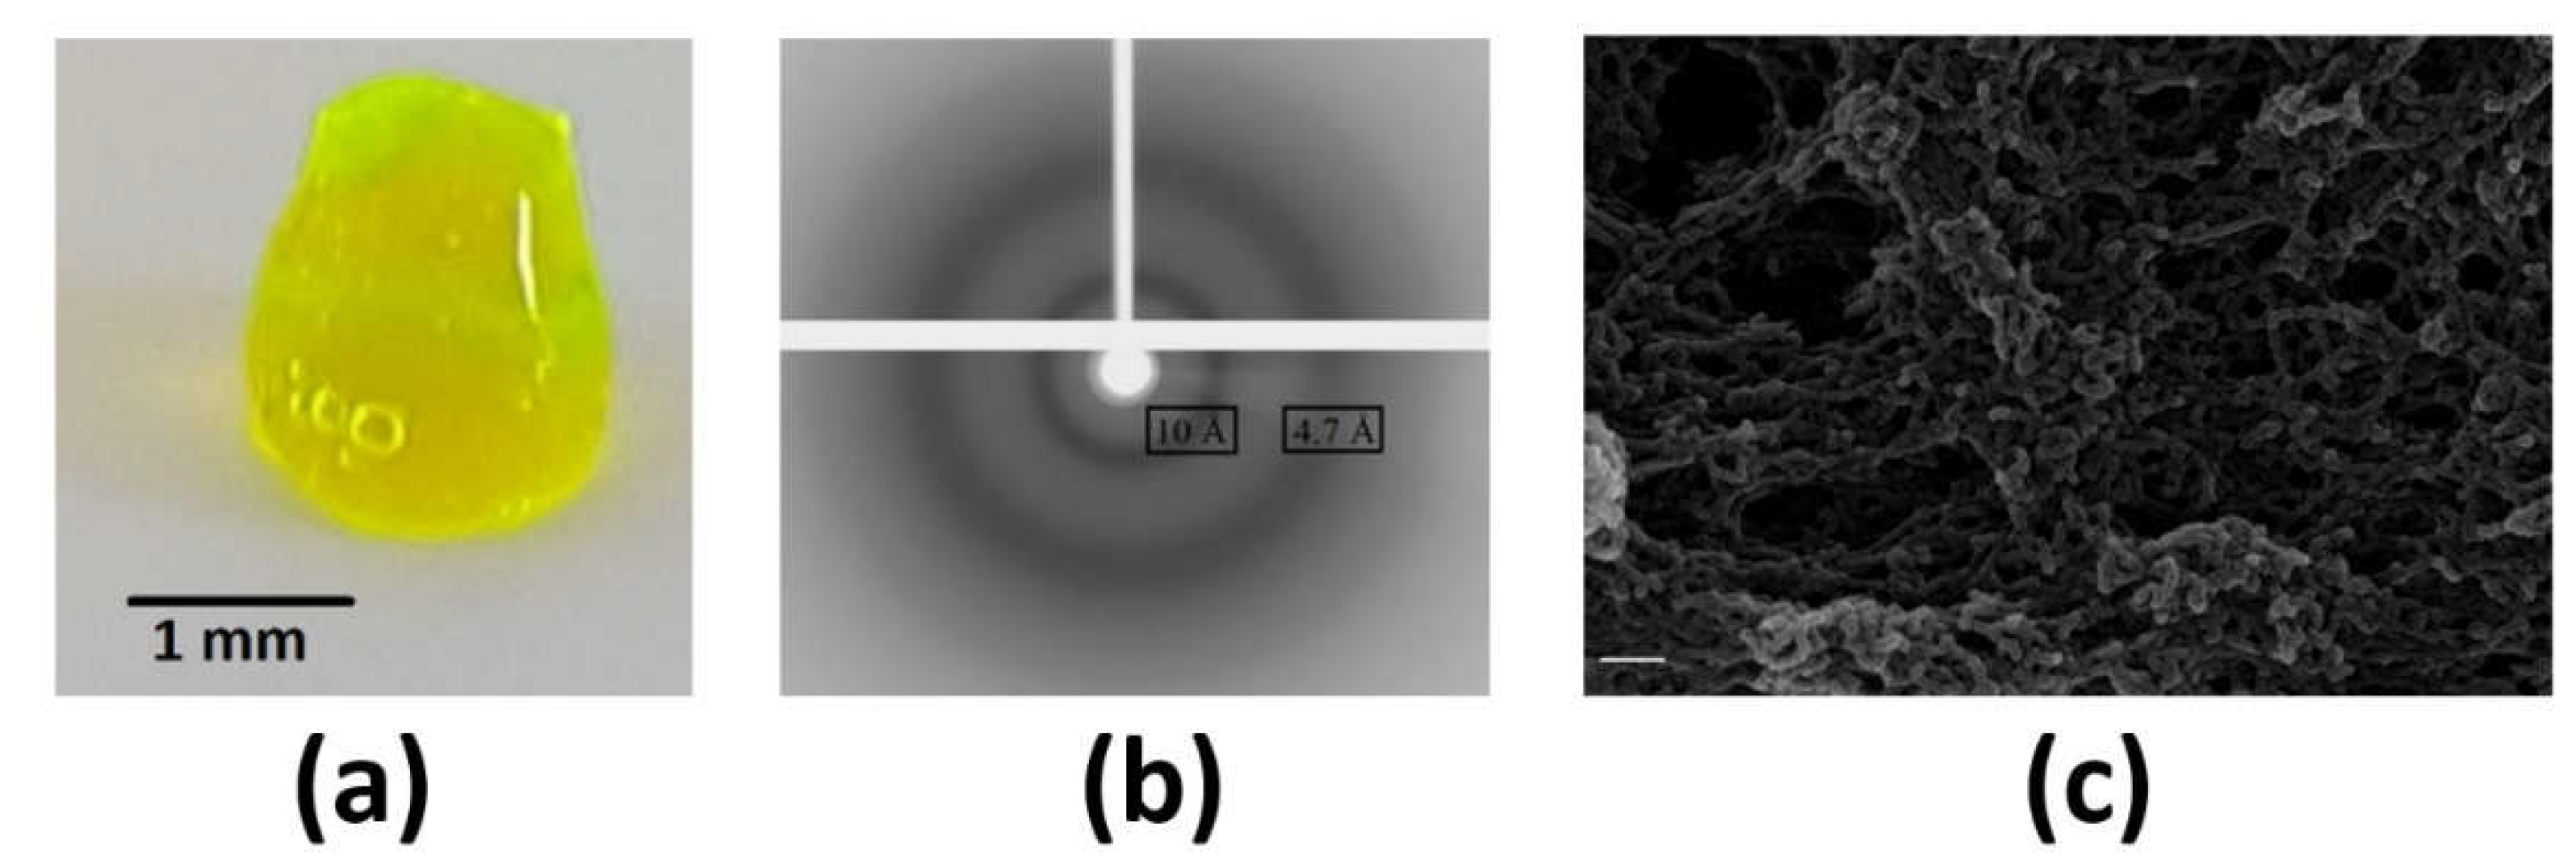
2.5. Hydrogel of hnRNPK

hnRNPK contains several low complexity domains (LCDs) within its sequence as demonstrated in Figure 1. Given the ability of LCDs in driving hydrogel formation in protein such as FUS and hnRNPKA2 in vitro [41,42], hnRNPK was tested whether it can form hydrogel as other proteins possessing prion-like LCDs. After being purified, concentrated and dialyzed in gel filtration buffer overnight at 4oC, gelation of eGFP-hnRNPK occurred as shown in Figure 7a. Beside two common material states, monomer and aggregate, hydrogel is a novel material state of hnRNPK observed in in vitro assays. Further experiment to study the biophysical properties of eGFP-hnRNPK hydrogel was performed using X-ray diffraction which reveals 2 diffraction rings at 4.7 Å and 10 Å (Figure 7b). These two diffraction patterns are characteristic signals of the cross-β structure existing in amyloid fibrils [43]. In addition, scanning EM also displays a fibrillar mesh surface of eGFP-hnRNPK (Figure 7c). Together, this data reveals for the first time the ability of eGFP-hnRNPK to form a fibrillar hydrogel in vitro, with amyloid-like structure.

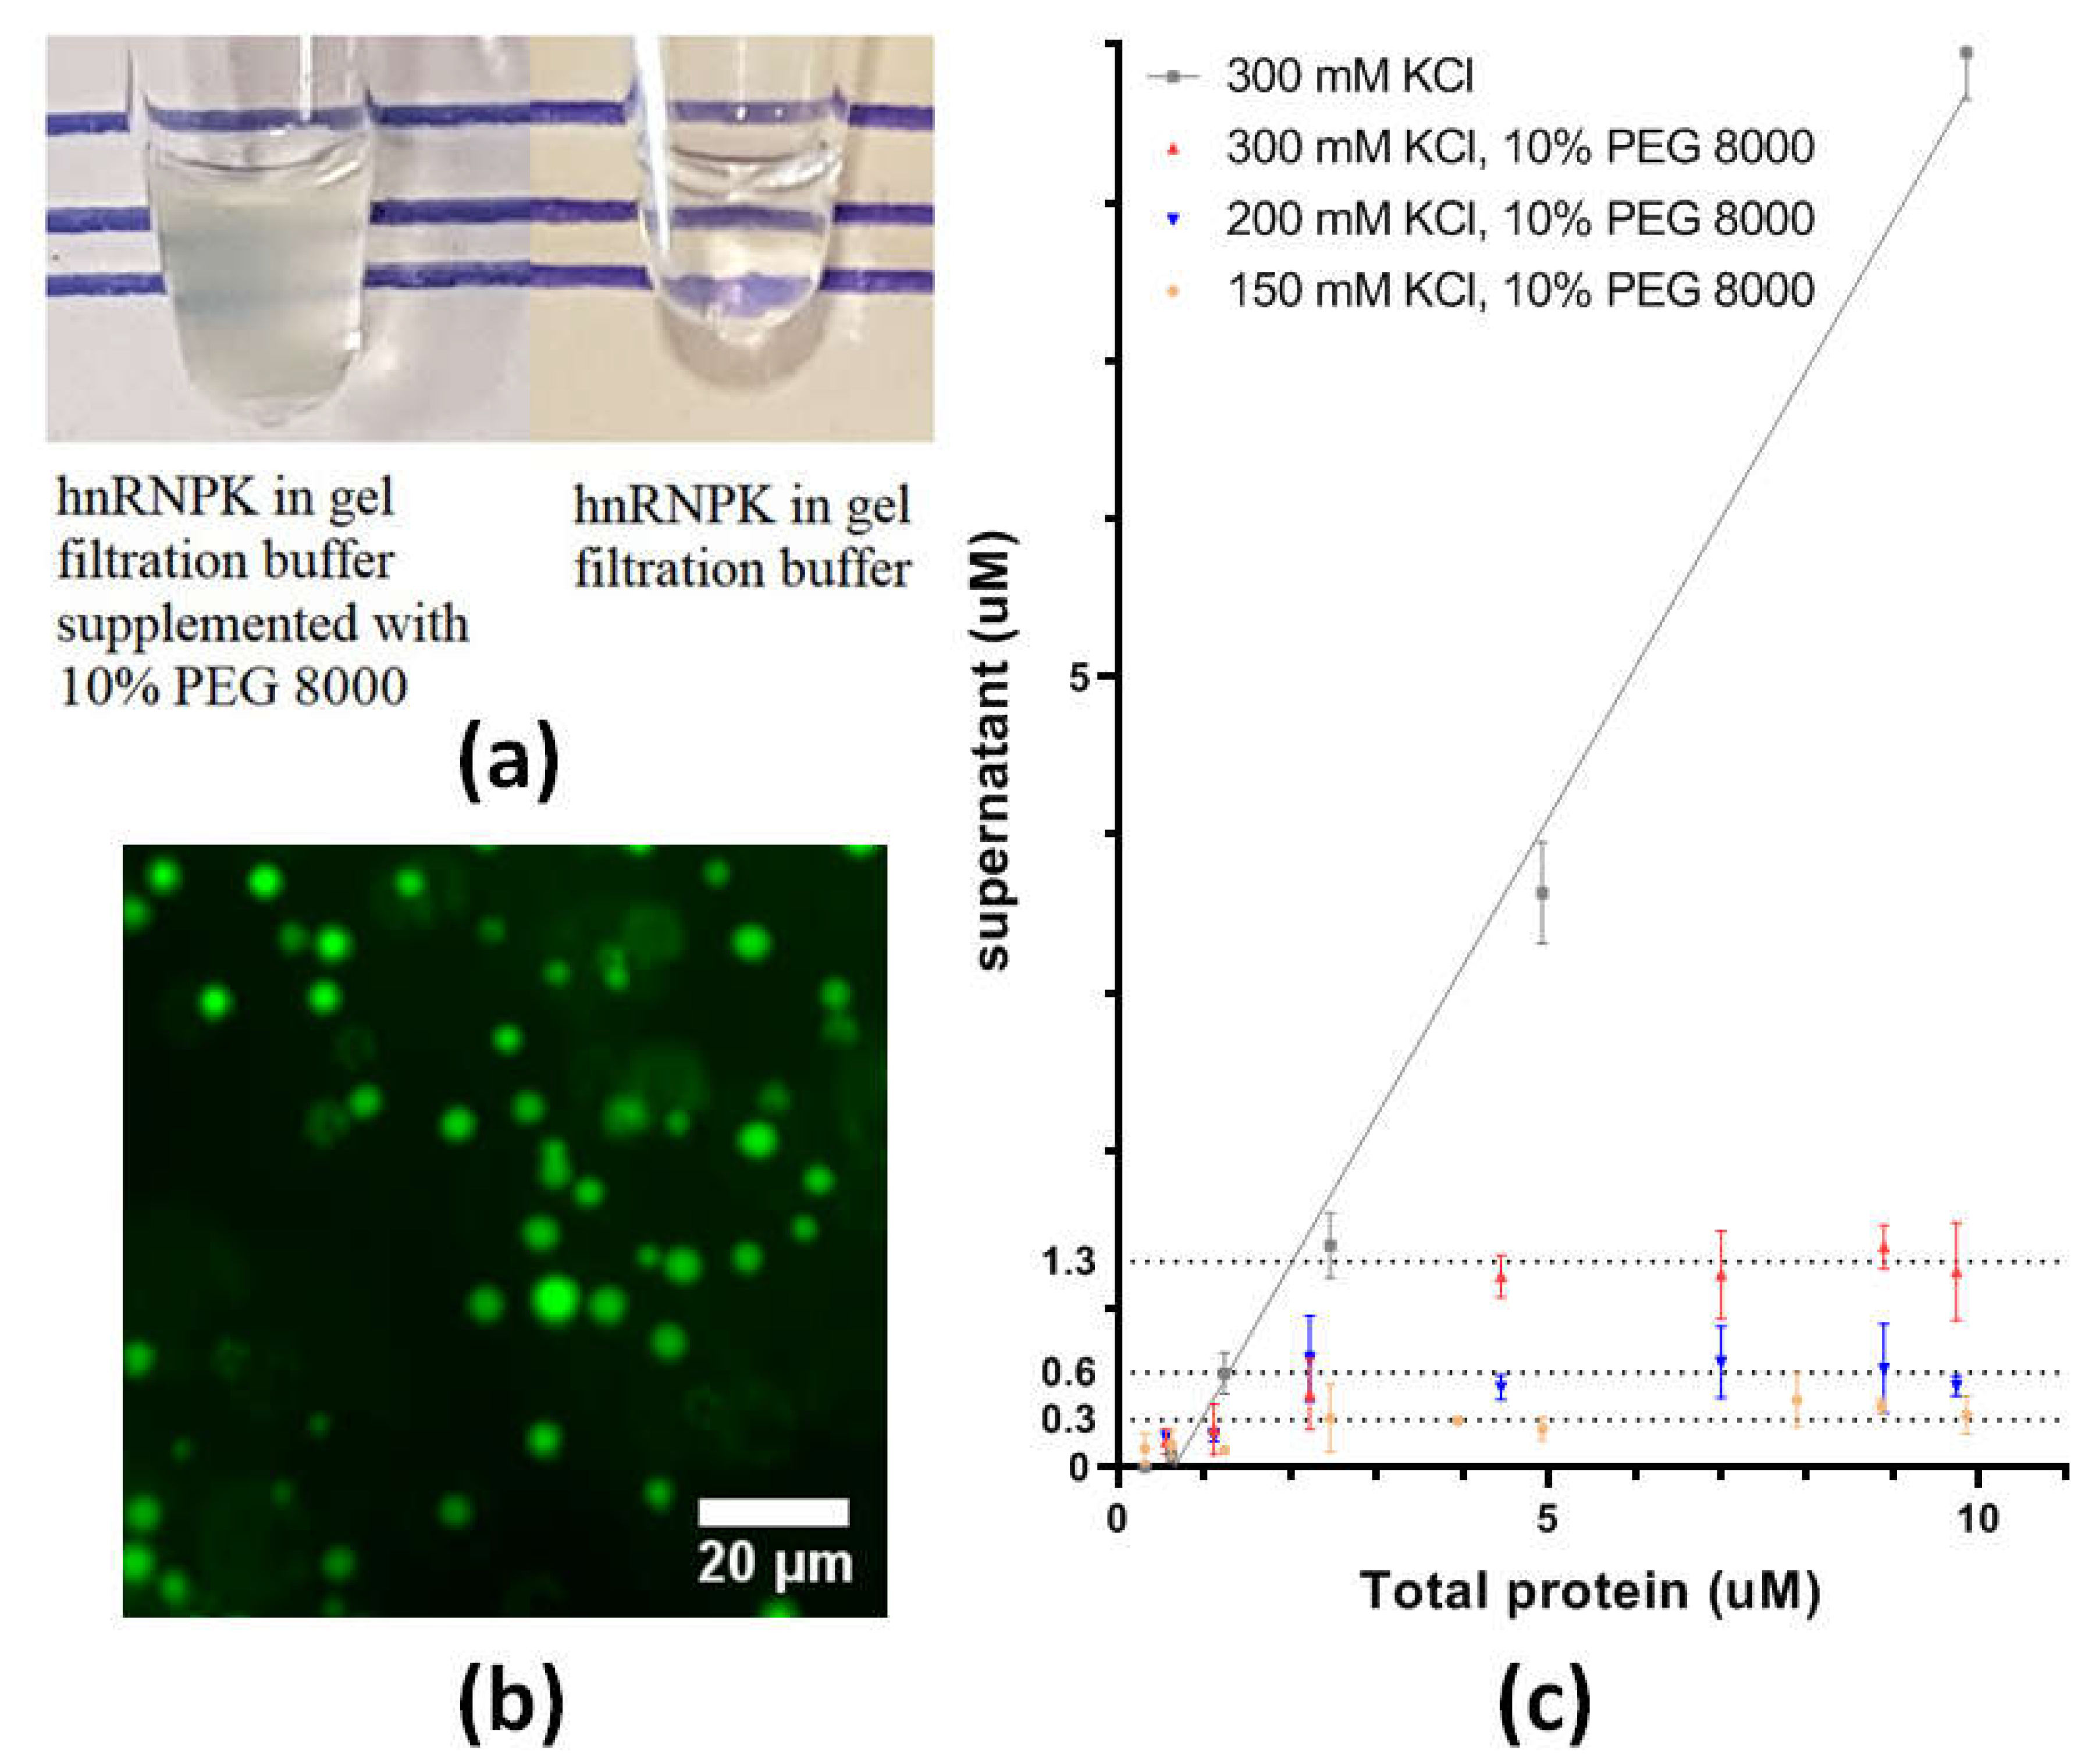
2.6. Phase Separation of hnRNPK

LCDs have been linked to liquid-liquid phase separation (LLPS) of proteins, where the protein can partition into a condensed phase forming liquid-like droplets. LLPS is commonly observed in nuclear RNA binding proteins, and is implicated in the formation of membraneless organelle structures in the cell nucleus including nucleoli and paraspeckles, of which hnRNPK is a component. To explore the potential of hnRNPK to phase separate, we used a crowding agent, PEG 8000, to induce phase separation of eGFP-hnRNPK. In experiments carried out on ice, dilution of eGFP-hnRNPK into gel filtration buffer at various KCl concentrations produced clear solutions. In contrast, the addition of 10% PEG 8000 in gel filtration buffer turned eGFP-hnRNPK solution turbid, indicating the protein had precipitated in some form (Figure 8a). Fluorescence microscopy of eGFP-hnRNPK confirms the phenomenon as LLPS, with the formation of spherical droplets suspended in the solution (Figure 8b).
Salt concentration has a crucial role in protein phase separation, influencing phase behaviors of proteins as the salt concentration varies in the solution. To further quantify the effect of PEG 8000 and KCl concentration on eGFP-hnRNPK phase separation, we carried out a centrifuge assay to assess the phase separation induced by PEG 8000 at different KCl concentrations. Upon phase separation, eGFP-hnRNPK co-exists in two separated phases, dilute phase and dense phase, in the solution. Centrifugation sedimented the dense phase from the protein depleted-dilute phase. We measured the concentration of eGFP-hnRNPK in the dilute phase, also known as the saturation concentration (Csat), to evaluate the phase separation of eGFP-hnRNPK at different conditions. In the presence of PEG 8000, eGFP-hnRNPK in all three conditions phase separated to different degrees (Figure 8c). Specifically, eGFP-hnRNPK, diluted in gel filtration buffer alone (), shows no sign of phase separation with the measured protein concentration of ca. 10 µM (Figure 8c). In the presence of 10% PEG 8000 (), substantial reduction of hnRNPK concentration in the supernatant to 1.3 µM indicates a high level of phase separation induced by PEG 8000. Strikingly, the decrease of the KCl concentration to 200 mM () and 150 mM (), reduces the Csat of eGFP-hnRNPK in the two conditions to 0.6 µM and 0.3 µM respectively (Figure 8c). The variety of Csat at different KCl concentrations indicates the impact of the salt concentration in phase separation of eGFP-hnRNPK as the lowest KCl concentration at 150 mM depleted the most eGFP-hnRNPK protein out the dilute phase into the dense phase. In comparison, higher KCl concentrations in the other two conditions, 200 mM and 300 mM KCl, allow more eGFP-hnRNPK protein to remain in the dilute phase. Various phase behaviors of eGFP-hnRNPK at different salt concentrations have proven the significance of a stable physiological salt concentration in the cells. Stress may change this balance in the cell which in turn depletes eGFP-hnRNPK from the cellular processes.

3. Discussion

Proteins have been found to exist in multiple material states. The transitions of protein monomer to other physical states, such as protein aggregates or liquid-liquid droplets, play significant roles in the pathogenesis of several neurodegenerative conditions [44,45]. Prior study has demonstrated hnRNPK aggregation in vitro, and successfully used stabilizing additives to reverse and protect hnRNPK monomers from aggregation, with the stoichiometry of hnRNPK monomers confirmed by AUC [24]. In this study, we have demonstrated the substantial impact of temperature and concentration on hnRNPK aggregation. By controlling these two factors, we were able to achieve an optimized condition maintaining freshly purified hnRNPK monomer at 4oC and low concentration to partially prevent hnRNPK aggregate. The beneficial effect of 4oC and low protein concentration enabled us to go beyond stoichiometry value, determining the structure of hnRNPK monomer out of highly heterogeneous hnRNPK sample. The measured stoichiometry data of hnRNPK by SEC-LS at 4oC confirmed the monomeric state of hnRNPK, while TEM and SAXS revealed the novel structure of full-length hnRNPK monomers as elongated shape particles.
Monomer of hnRNPK has been investigated by three distinct techniques in our study, TEM, SAXS, and SANS. Consistently, data from all three approaches reported a similar morphology of hnRNPK proteins as elongated-shape particles. Despite the consistent morphology, the maximum dimensions of hnRNPK measured by TEM, SAXS, and SANS, vary considerably ranging from 11.2 nm (SANS), 18.7 nm (SAXS), and 10.8 nm–13.5 nm (TEM). The variation of Dmax might be due to different conditions of hnRNPK, causing different extent of interparticle interaction between hnRNPK proteins. In addition, during TEM grid preparation, dehydration of samples can lead to protein shrinkage and subsequently reduce protein length in comparison to Dmaxvalue measured by SAXS [46]. The beneficial impact of low temperature and concentration has sustained a part of highly heterogeneous hnRNPK sample at its monomeric form, which is the small peak following a strong aggregation peak of hnRNPK in SAXS scattering profile of hnRNPK sample at 4oC (Figure 3b). The heterogeneity of hnRNPK sample at 4oC, as shown in the aggregation peak in SAXS, together with the aforementioned flexibility of hnRNPK possibly caused by LCDs represent a major hurdle for crystallization of full-length hnRNPK protein. Instead, crystallization of hnRNPK truncates containing individual domains, namely KH1, KH2, NLS, KNS domains, might be a more reliable alternative to avoid the issue of full-length hnRNPK’s instability. Another approach to solve full-length hnRNPK’s structure is cryo-EM, now that we have successfully obtained the low resolution structure of hnRNPK protein using TEM. Addition effort with cryo-EM technique might allow us to make a step further achieving atomic structure of full-length hnRNPK protein.
Despite the beneficial impact of low temperature (4oC) and low protein concentration, hnRNPK aggregate was detected simultaneously with hnRNPK monomer (Figure 3b). Room temperature and high protein concentration, inducing hnRNPK aggregation, allow us to study the volatile changes of hnRNPK protein during aggregation. High temperature and concentration has a significant impact on hnRNPK, increasing both the hydrodynamic size and molecular mass of hnRNPK overtime. Additionally, a combination of SAXS and TEM showed large structures of hnRNPK aggregates at various sizes, ranging from 22 to 200 nm. As hnRNPK aggregation was irreversible and completely changed the stoichiometry and morphology of hnRNPK sample compared to hnRNPK monomer, we therefore define hnRNPK soluble aggregate as the second material state of hnRNPK protein.
Phase separation of protein is a crucial process to form membraneless compartments or organelles in the cell including stress granules and paraspeckles [47,48]. Many proteins containing low complexity domains (LCDs) have been found in these membraneless organelles [16,29,41]. These proteins can undergo phase separation in vitro upon changes in condition such as temperature, salt concentration or crowding agents [33,49,50], for example FUS, tau, or α-synuclein [51,52]. hnRNPK is an RNA-binding protein with several LCDs in its sequence. This protein has proven to be one of six proteins essential for paraspeckle formation. Indeed, the introduction of PEG 8000 supplemented with protein in solution has resulted in phase separation of hnRNPK, a novel state of this protein up to now. PEG 8000 has proven its effect on affecting the phase behavior of FUS, facilitating condensation of the full-length FUS protein [53]. The crowding agent PEG 8000 is able to induce phase separation of hnRNPK, reorganizing hnRNPK protein into dilute phase and dense phase with substantial protein concentration difference. Additionally, fluorescence microscopy revealed spherical droplets suspending in solution. The round shape, caused by surface tension, indicates the liquid-like property of the droplets [9]. Salt concentration has a significant impact on phase behaviors of many proteins, inducing phase separation on FUS [54,55], TDP-43 [56,57], and BRD4 proteins [58,59]. Despite the fact that low-salt conditions alone does not lead to hnRNPK phase separation, the protein phase separates in a salt concentration-dependent manner in the presence of PEG 8000, reaffirming the importance of salt to hnRNPK phase separation.
The LCDs of RNA-binding proteins have been linked to protein gelation, driving proteins into a hydrogel-like state. Two essential paraspeckle proteins, FUS and RBM14, are among these proteins, forming hydrogel at high concentration and low temperature [31,60]. hnRNPK is another essential paraspeckle protein, containing both LCDs and RNA-binding domains. In our in vitro experiments, hnRNPK has been observed to adopt hydrogel form. Additional studies using X-ray diffraction and SEM revealed the amyloid characteristics of hnRNPK hydrogel which are similar to the hydrogels of FUS and RBM14.
Despite the beneficial effect of low temperature and low concentration, hnRNPK aggregation still occurs with high heterogeneity in solution. The heterogeneity of hnRNPK represents a major hurdle for functional and structural studies of the protein. Therefore, additional effort is required to establish an optimal condition favoring hnRNPK monomer over its aggregation form. Here, we also described two novel material states of hnRNPK, liquid-liquid phase separation, and hydrogel, as well as the properties of hnRNPK protein at each state. Phase separation has a critical role in mediating formation of membraneless organelles such as paraspeckle [47], while hydrogel formation of proteins is an essential cellular process, responsible for both normal physiology and pathology [61]. The ability of hnRNPK to transform from monomer to aggregates, liquid-like droplets, and hydrogel demonstrates the flexibility of hnRNPK to adapt to condition changes, enabling the protein to maintain its functions in a wide range of conditions. Here, we propose a hypothesis that the transitions of hnRNPK protein between different states are protective cellular mechanisms. These mechanisms are employed to regulate multiple hnRNPK-involved cellular processes during stress by transforming hnRNPK protein to appropriate physical state to maintain hnRNPK functions. Therefore, further functional studies of hnRNPK at different physical states, aggregation, phase-separated, hydrogel states, are required to test this theory.

4. Materials and Methods

4.1. Protein Expression and Purification

The full-length wild-type hnRNPK protein with an additional glycine residue at the N-terminus was cloned into plasmid pETM-11, forming a 6xHis-eGFP-hnRNPK fusion protein. The 6xHis-eGFP-hnRNPK protein in hydrogenated media (H-protein) was overexpressed in Escherichia coli Rosetta2(DE3) cells in 500 mL of LB media supplemented with 50 µg/mL kanamycin, 34 µg/mL chloramphenicol, and 0.5 mM IPTG at 25oC for 16 hours.
The expression of the deuterated 6xHis-eGFP-hnRNPK protein (D-protein) was carried out in E. coli BL21(DE3) using a 2 L bioreactor (Real Time Engineering). For D-protein expression, expression media, with 90% D2O and hydrogenated glycerol (40 g/L) as a carbon source was used to reach a deuteration level of 75%. The expression culture (LB media), supplemented with 50 µg/mL kanamycin, and 34 µg/mL chloramphenicol, was inoculated with 54 mL of starter culture and grown at 37oC until the optical density at 600 nm reached 37. The expression culture was then induced by 0.5 mM IPTG and incubated at 20oC for 16 hours.
For protein purification, harvested cells were resuspended in lysis buffer [50 mM HEPES, 2 M KCl, 20 mM imidazole, 100 mM dithiothreitol (DTT), EDTA-free protease inhibitor cocktail (Sigma Aldrich), pH 7.4] on ice. Suspended cells were lysed using a high-pressure homogenizer (Emulsiflex C5; Avestin). Lysate was clarified by centrifugation at 24,000 g at 4oC for 45 min. The supernatant was filtered through a 0.22 µm syringe filter (Merck Milipore) before being loaded to a 5 mL Hi-trap column charged with NiCl2 (GE Healthcare). GFP-hnRNPK was eluted with hnRNPK elution buffer (50 mM HEPES, 2 M KCl, 500 mM imidazole, pH 7.4). Peak fractions were pooled, incubated with in-house produced His-tagged TEV protease, and dialyzed in hnRNPK gel filtration buffer (50 mM HEPES, 300 mM KCl, pH 7.4) supplemented with 1 mM DTT for 16 hours at 4oC. The digest was then passed through a 5 mL Hi-trap column to separate the cleaved hnRNPK from the mixture. HnRNPK was concentrated to 5mL [Amicon Ultra Centrifugal filter (EMD Milipore)] and applied to a HiLoad 16/60 Superdex 200 preparative-grade column (GE Healthcare) equilibrated with hnRNPK gel filtration buffer. Purified hnRNPK was concentrated to the desired concentrations for further experiments using a 30 kDaAmicon centrifugal concentrator (Merck Millipore). Purified protein was evaluated by SDS-PAGE stained with Coomassie blue. To achieve 98% deuteration, purified D-protein was dialysed for 6 hours into deuterated size exclusion buffer using a 10 000 MWCO Slide-A-Lyzer dialysis cassette (Thermo Scientific).

4.2. Gelation

GFP-tagged hnRNPK was concentrated to 11.5 mg/ml and dialyzed in buffer (50 mM HEPES, 300 mM KCl, pH 7.4) at 4oC overnight. Dialyzed protein was centrifuged at 3000 x g at 4oC for 10 min to separate soluble fraction and hydrogel. Hydrogel was kept at 4oC for 48 hours in a sealed tube to gelate into a more rigid form.

4.3. X-ray Diffraction

GFP-hnRNPK hydrogel was placed onto a nylon CryoLoop and mounted on an XtaLab Synergy-S X-ray generator (Rigaku Oxford Diffraction). X-ray diffraction imaging was conducted at room temperature with 10 minute exposure time using the CrystalisPro software version 1.171.40_64.14a (Rigaku Oxford Diffraction).

4.4. Scanning Electron Microscopy (SEM)

GFP-hnRNPK hydrogel was mounted onto a coverslip coated with poly-L-lysine. The hydrogel was fixed using 2.5% glutaraldehyde at 4oC for 2 hours, then washed with ethanol for dehydration. The dried sample was mounted on a SEM aluminum stub with double –sided carbon tape, and coated with gold. Imaging was carried out using a variable-pressure field-emission scanning electron microscope (1555, Carl Zeiss; Centre for Microscopy, Characterisation and Analysis, University of Western Australia) at 10 kV.

4.5. Fluorescence Microscopy

GFP-hnRNPK sample was prepared in a series of 20 µL sample solution in the presence of 10% PEG 8000 (50 mM HEPES, 300 mM KCl, pH 7.4, 10% PEG 8000) in a micro 384-well plate. The plate was imaged immediately using an ECLIPSE Ti2 Inverted Research Microscope (Nikon) at room temperature. The images obtained from the fluorescence microscope were processed using FIJI software [62].

4.6. Saturation Concentration Determination by Centrifugation

In order to evaluate the impact of PEG 8000 and salt concentrations to the phase separation of hnRNPK, three conditions containing 10% PEG 8000 in combination with different KCl concentrations (300 mM, 150 mM, or 100 mM KCl) were tested compared to a negative control using size exclusion buffer to dilute hnRNPK sample. After diluting, protein samples were centrifuged at 10 000 x g for 10 min at 4oC to separate the condensed phase from the dilute phase. The hnRNPK absorbance at 280nm of the dilute phase was measured using a NanoDrop Spectrophotometer (Thermo Scientific). The hnRNPK concentration was then calculated using the extinction coefficient at 280 nm of 41830 M-1cm-1 obtained from the ExPasyProtparam online tool [63]. Each measurement was carried out in triplicate.

4.7. Dynamic Light Scattering (DLS)

Protein and solvents were filtered through 0.22 µm syringe filters (Merck Milipore). Solvents was used later to rinse plastic disposable cuvettes before using, while protein subsequently was centrifuged at 16000 g at 4oC for 15 min to eliminate any insoluble aggregate or contaminants. Plastic disposable cuvettes were pre-cooled on ice to contain samples measured at 4oC. The cuvettes were sealed by parafilm after being filled with samples to avoid introduction of dust or contaminants into solution. To measure the change in size caused by thermal alteration, the same cuvettes were equilibrated at 25oC for at least 30 min before remeasurment. Each measurement was performed with at least three replicates. Dynamic light scattering (DLS) data were recorded using a Malvern ZetasizerNanoZS DLS (Malvern Instruments) and Zetasizer Software v7.11. Scattering light was recorded at 173o backscatter optic to minimize the effect of multiple scattering, dust, and supramolecular contamination on the measurement.

4.8. Size-Exclusion Chromatography Coupled to Light Scattering (SEC-LS)

SEC-LS measurements of hnRNPK were performed at room temperature. The SEC-LS system includes a Superdex 200 Increase 10/300 column (GE Healthcare) for sample separation, ViscotekGPCmax liquid chromatography system, a UV detector 2600 (recording at 280 nm), and a TDA 305 (Malvern Panalytical) (measuring RALS, and RI signals). The sample vial holder temperature was set at 4oC.

4.9. Small-Angle X-ray Scattering (SAXS)

SAXS data were collected at the SAXS/WAXS beamline of the Australian Synchrotron coupled to size exclusion chromatography (SEC-SY-SAXS) [64]. The setup includes an inline Superdex 200 Increase 5/150 column (GE Healthcare) attached to a Shimadzu HPLC system. Samples of hnRNPK were maintained at 4oC or 25oC during measurement. Samples were injected to SEC-SY-SAXS system and eluted directly into a continuous flow cell capillary where scattering data were collected using a Pilatus 1M detector [65]. Data was reduced using ScatterBrain [66]. Primary data processing was performed using the ATSAS software package [67]. SAXS data analysis statistics are presented in Table 1. Additional ensemble optimization were carried out using EOM [68].

4.10. Small-Angle Neutron Scattering (SANS)

SANS measurements were carried out at the Australian Nuclear Science and Technology Organization (ANSTO) OPAL reactor, using the QUOKKA neutron scattering instrument. hnRNPK samples were loaded into quartz Hellma QS-120 cells with a 2 mm pathlength for measurement. Data was collected using a neutron wavelength of 6 Å and a wavelength resolution of ∆λ/λ= 0.1. Data was reduced using Igor Pro software (Wavemetrics). Scattering data was processed using SASView software [69]. Further analysis was perform using PRIMUS [70], GNOM [71], and DAMMIF [36] from the ATSAS package [67].

4.11. Transmission Electron Microscopy (TEM)

For grid preparation, 5µl of the diluted sample were adsorbed to glow-discharged 400 mesh carbon coated Parlodion copper grids washed with three drops of water, incubated with 3 μl of tobacco mosaic virus containing solution (kindly provided by R. Diaz Avalos, Institute of Molecular Biophysics, Florida State University) further washed with two drops of water and finally stained with two drops of 2% (w/v) uranyl acetate. Grids were imaged using a Tecnai12 transmission electron microscope (FEI, Eindhoven, the Netherlands) operating at 120 kV. Electron micrographs were recorded on a 4096 by 4096 pixel charged-coupled device camera (TVIPS F416) at a nominal magnification of ×67 000 yielding a final pixel size of 0.198 nm on the specimen level. Micrographs were processed by reference-free alignment on manually selected particles from micrographs using the EMAN2 image processing package [72]. The extracted particles were aligned and classified by multivariate statistical analysis yielding two-dimensional (2D) class averages.

Author Contributions

My contribution to this work was the mutagenesis, expression of hnRNPK in hydrogenated media, purification, DLS, SEC-LS, SAXS data analysis of hnRNPK, SANS data analysis using ATSAS, and TEM data collection of hnRNPK monomer. Moreover, I carried out saturation concentration determination, and fluorescence microscopy of hnRNPK phase separation. Additionally, I performed hnRNPK hydrogel formation experiments, X-ray diffraction of eGFP-hnRNPK hydrogel. Amanda Lewis and Philippe Ringler provided technical advice and performed TEM data analysis of hnRNPK monomer. In addition, Amanda Lewis and Diwei Ho carried out SEM data collection and analysis of eGFP-hnRNPK hydrogel, as well as TEM data collection and analysis of hnRNPK aggregate. Alice D Matthews expressed, purified hnRNPK in hydrogenated media for SANS experiment, and performed SANS data collection. Anthony Duff expressed hnRNPK protein in deuterated media for SANS experiments. Manuel Brunner analysed SANS data using SASView and wrote one part of the first draft of the manuscript on SANS results using SASView. I wrote the manuscript apart for the SANS analysis using SASView, prepared figures and tables, and edited for the finalized version of the manuscript. Charles S. Bond contributed to editing this manuscript. The other authors contributed reagents and/or technical advice.

Funding

This work was supported by the National Health and Medical Research Council (NHMRC APP1147496) and Australian Research Council (ARC DP160102435, LE120100092 and LE140100096). Vietnam International Education Development (VIED) and the University of Western Australia. Bacterial expression vectors pETM11 was a gift from Dr. Gunter Stier (EMBL, Heidelberg, Germany; https://www.embl.de).

Data Availability Statement

SAXS and SANS data is in progress of submission to SASBDB.

Conflicts of Interest

The authors declare no conflicts of interest.

Abbreviations

The following abbreviations are used in this manuscript:
hnRNPK Heterogeneous nuclear ribonucleoprotein K
DLS Dynamic light scattering
SEC-LS Size-exclusion chromatography coupled to light scattering
SAXS Small-angle X-ray scattering
SANS small-angle neutron scattering
TEM Transmission electron microscopy
SEM Scanning electron microscopy
LCD Low complexity domain
KH K-homologous domains
KI K-interactive region
ALS Amyotrophic lateral sclerosis
DTT Dithiothreitol
MM Molecular mass
Csat Saturation concentration

Appendix

Scheme A1. Scattering profile of hnRNPK at 4oC. Plot of I(0) trace and molecular mass distribution from SEC-SAXS of hnRNPK at 4oC. The scattering data were selected from frames 360–371 for buffer, and 239–297 for hnRNPK sample.
Preprints 144406 sch001

References

  1. Zimmerman, S.B.; Trach, S.O. Estimation of macromolecule concentrations and excluded volume effects for the cytoplasm of Escherichia coli. 2005, 222, 599–620. [CrossRef]
  2. Kuznetsova, I.M.; Turoverov, K.K.; Uversky, V.N. What Macromolecular Crowding Can Do to a Protein. Int. J. Mol. Sci. 2014, 15, 23090–23140. [Google Scholar] [CrossRef]
  3. Leibly, D.J.; Nguyen, T.N.; Kao, L.T.; Hewitt, S.N.; Barrett, L.K.; Van Voorhis, W.C. Stabilizing Additives Added during Cell Lysis Aid in the Solubilization of Recombinant Proteins. PLOS ONE 2012, 7, e52482. [Google Scholar] [CrossRef] [PubMed]
  4. Foit, L.; Morgan, G.J.; Kern, M.J.; Steimer, L.R.; von Hacht, A.A.; Titchmarsh, J.; Warriner, S.L.; Radford, S.E.; Bardwell, J.C. Optimizing Protein Stability In Vivo. Mol. Cell 2009, 36, 861–871. [Google Scholar] [CrossRef] [PubMed]
  5. Arakawa, T. and S.N. Timasheff, Theory of protein solubility. Methods Enzymol, 1985. 114: p. 49-77.
  6. Schmidt, C.L.A. , Proteins, Amino Acids and Peptides as Ions and Dipolar Ions (Cohn, Edwin J.; Edsall, John T.). Journal of Chemical Education, 1943. 20(8): p. 415.
  7. Rousseau, F. Schymkowitz, and L. Serrano, Protein aggregation and amyloidosis: confusion of the kinds? Curr Opin Struct Biol, 2006. 16(1): p. 118-26.
  8. Jonker, A.M.; Löwik, D.W.P.M.; van Hest, J.C.M. Peptide- and Protein-Based Hydrogels. Chem. Mater. 2011, 24, 759–773. [Google Scholar] [CrossRef]
  9. Boeynaems, S.; Alberti, S.; Fawzi, N.L.; Mittag, T.; Polymenidou, M.; Rousseau, F.; Schymkowitz, J.; Shorter, J.; Wolozin, B.; van den Bosch, L.; et al. Protein Phase Separation: A New Phase in Cell Biology. Trends Cell Biol. 2018, 28, 420–435. [Google Scholar] [CrossRef]
  10. Díaz-Villanueva, J.F.; Díaz-Molina, R.; García-González, V. Protein Folding and Mechanisms of Proteostasis. Int. J. Mol. Sci. 2015, 16, 17193–17230. [Google Scholar] [CrossRef]
  11. Banani, S.F.; Lee, H.O.; Hyman, A.A.; Rosen, M.K. Biomolecular condensates: organizers of cellular biochemistry. Nat. Rev. Mol. Cell Biol. 2017, 18, 285–298. [Google Scholar] [CrossRef]
  12. Shin, Y.; Brangwynne, C.P. Liquid phase condensation in cell physiology and disease. Science 2017, 357, eaaf4382. [Google Scholar] [CrossRef]
  13. Alberti, S. The wisdom of crowds: regulating cell function through condensed states of living matter. J. Cell Sci. 2017, 130, 2789–2796. [Google Scholar] [CrossRef]
  14. Balchin, D.; Hayer-Hartl, M.; Hartl, F.U. In vivo aspects of protein folding and quality control. Science 2016, 353, aac4354. [Google Scholar] [CrossRef]
  15. Chiti, F.; Dobson, C.M. Protein Misfolding, Amyloid Formation, and Human Disease: A Summary of Progress Over the Last Decade. Annu. Rev. Biochem. 2017, 86, 27–68. [Google Scholar] [CrossRef] [PubMed]
  16. Martin, E.W.; Mittag, T. Relationship of Sequence and Phase Separation in Protein Low-Complexity Regions. Biochemistry 2018, 57, 2478–2487. [Google Scholar] [CrossRef]
  17. Kato, M.; Lin, Y.; McKnight, S.L. Cross-β polymerization and hydrogel formation by low-complexity sequence proteins. Methods 2017, 126, 3–11. [Google Scholar] [CrossRef] [PubMed]
  18. Xu, Y.; Wu, W.; Han, Q.; Wang, Y.; Li, C.; Zhang, P.; Xu, H. Post-translational modification control of RNA-binding protein hnRNPK function. Open Biol. 2019, 9, 180239. [Google Scholar] [CrossRef]
  19. Nakamoto, M.Y.; Lammer, N.C.; Batey, R.T.; Wuttke, D.S. hnRNPK recognition of the B motif of Xist and other biological RNAs. Nucleic Acids Res. 2020, 48, 9320–9335. [Google Scholar] [CrossRef]
  20. Bomsztyk, K.; Denisenko, O.; Ostrowski, J. hnRNP K: One protein multiple processes. BioEssays 2004, 26, 629–638. [Google Scholar] [CrossRef]
  21. Wootton, J.C.; Federhen, S. Statistics of local complexity in amino acid sequences and sequence databases. 2001, 17, 149–163. [Google Scholar] [CrossRef]
  22. Jarnot, P.; Ziemska-Legiecka, J.; Dobson, L.; Merski, M.; Mier, P.; A Andrade-Navarro, M.; Hancock, J.M.; Dosztányi, Z.; Paladin, L.; Necci, M.; et al. PlaToLoCo: the first web meta-server for visualization and annotation of low complexity regions in proteins. Nucleic Acids Res. 2020, 48, W77–W84. [Google Scholar] [CrossRef]
  23. Poenisch, M.; Metz, P.; Blankenburg, H.; Ruggieri, A.; Lee, J.-Y.; Rupp, D.; Rebhan, I.; Diederich, K.; Kaderali, L.; Domingues, F.S.; et al. Identification of HNRNPK as Regulator of Hepatitis C Virus Particle Production. PLOS Pathog. 2015, 11, e1004573. [Google Scholar] [CrossRef]
  24. Moritz, B.; Lilie, H.; Vries, I.S.N.-D.; Urlaub, H.; Wahle, E.; Ostareck-Lederer, A.; Ostareck, D.H. Biophysical and biochemical analysis of hnRNP K: arginine methylation, reversible aggregation and combinatorial binding to nucleic acids. Biol. Chem. 2014, 395, 837–853. [Google Scholar] [CrossRef]
  25. Backe, P.H.; Messias, A.C.; Ravelli, R.B.; Sattler, M.; Cusack, S. X-Ray Crystallographic and NMR Studies of the Third KH Domain of hnRNP K in Complex with Single-Stranded Nucleic Acids. Structure 2005, 13, 1055–1067. [Google Scholar] [CrossRef] [PubMed]
  26. Oromendia, A.B.; Dodgson, S.E.; Amon, A. Aneuploidy causes proteotoxic stress in yeast. Genes Dev. 2012, 26, 2696–2708. [Google Scholar] [CrossRef] [PubMed]
  27. McAlary, L.; Plotkin, S.S.; Yerbury, J.J.; Cashman, N.R. Prion-Like Propagation of Protein Misfolding and Aggregation in Amyotrophic Lateral Sclerosis. Front. Mol. Neurosci. 2019, 12, 262. [Google Scholar] [CrossRef]
  28. Cascarina, S.M.; King, D.C.; Nishimura, E.O.; Ross, E.D. LCD-Composer: an intuitive, composition-centric method enabling the identification and detailed functional mapping of low-complexity domains. NAR Genom. Bioinform. 2021, 3, lqab048. [Google Scholar] [CrossRef]
  29. Xue, S.; Gong, R.; He, F.; Li, Y.; Wang, Y.; Tan, T.; Luo, S.-Z. Low-complexity domain of U1-70K modulates phase separation and aggregation through distinctive basic-acidic motifs. Sci. Adv. 2019, 5, eaax5349. [Google Scholar] [CrossRef]
  30. Fritzsching, K.J.; Yang, Y.; Pogue, E.M.; Rayman, J.B.; Kandel, E.R.; McDermott, A.E. Micellar TIA1 with folded RNA binding domains as a model for reversible stress granule formation. Proc. Natl. Acad. Sci. 2020, 117, 31832–31837. [Google Scholar] [CrossRef]
  31. Hennig, S.; Kong, G.; Mannen, T.; Sadowska, A.; Kobelke, S.; Blythe, A.; Knott, G.J.; Iyer, K.S.; Ho, D.; Newcombe, E.A.; et al. Prion-like domains in RNA binding proteins are essential for building subnuclear paraspeckles. J. Cell Biol. 2015, 210, 529–539. [Google Scholar] [CrossRef]
  32. Johnson, B.S., et al., TDP-43 is intrinsically aggregation-prone, and amyotrophic lateral sclerosis-linked mutations accelerate aggregation and increase toxicity. J Biol Chem, 2009. 284(30): p. 20329-39.
  33. Alberti, S.; Saha, S.; Woodruff, J.B.; Franzmann, T.M.; Wang, J.; Hyman, A.A. A User’s Guide for Phase Separation Assays with Purified Proteins. 2018, 430, 4806–4820. [Google Scholar] [CrossRef]
  34. Rahman, S.K., Minimizing Heterogeneity of Protein Samples for Metal Transporter Proteins Using SAXS and Metal Radioisotopes. Methods Mol Biol, 2021. 2199: p. 151–156.
  35. Hajizadeh, N.R.; Franke, D.; Jeffries, C.M.; Svergun, D.I. Consensus Bayesian assessment of protein molecular mass from solution X-ray scattering data. Sci. Rep. 2018, 8, 1–13. [Google Scholar] [CrossRef]
  36. Franke, D.; Svergun, D.I. DAMMIF, a program for rapid ab-initio shape determination in small-angle scattering. J Appl Crystallogr, 2009. 42(Pt 2): p. 342-346.
  37. Volkov, V.V.; Svergun, D.I. Uniqueness of ab initio shape determination in small-angle scattering. J. Appl. Crystallogr. 2003, 36, 860–864. [Google Scholar] [CrossRef]
  38. Sarachan, K.L.; Curtis, J.E.; Krueger, S. Small-angle scattering contrast calculator for protein and nucleic acid complexes in solution. J. Appl. Crystallogr. 2013, 46, 1889–1893. [Google Scholar] [CrossRef]
  39. Loupiac, C.; Bonetti, M.; Pin, S.; Calmettes, P. High-pressure effects on horse heart metmyoglobin studied by small-angle neutron scattering. Eur. J. Biochem. 2002, 269, 4731–4737. [Google Scholar] [CrossRef] [PubMed]
  40. VanOudenhove, J.; Anderson, E.; Krueger, S.; Cole, J.L. Analysis of PKR Structure by Small-Angle Scattering. 2009, 387, 910–920. [Google Scholar] [CrossRef]
  41. Murray, D.T.; Kato, M.; Lin, Y.; Thurber, K.R.; Hung, I.; McKnight, S.L.; Tycko, R. Structure of FUS Protein Fibrils and Its Relevance to Self-Assembly and Phase Separation of Low-Complexity Domains. 2017, 171, 615–627. e16. [CrossRef]
  42. Xiang, S.; Kato, M.; Wu, L.C.; Lin, Y.; Ding, M.; Zhang, Y.; Yu, Y.; McKnight, S.L. The LC Domain of hnRNPA2 Adopts Similar Conformations in Hydrogel Polymers, Liquid-like Droplets, and Nuclei. Cell 2015, 163, 829–839. [Google Scholar] [CrossRef]
  43. Makin, O.S.; Serpell, L.C. Structures for amyloid fibrils. The FEBS Journal, 2005. 272(23): p. 5950-5961.
  44. Ross, C.A.; Poirier, M.A. Protein aggregation and neurodegenerative disease. Nat. Med. 2004, 10, S10–S17. [Google Scholar] [CrossRef]
  45. Zbinden, A.; Pérez-Berlanga, M.; De Rossi, P.; Polymenidou, M. Phase Separation and Neurodegenerative Diseases: A Disturbance in the Force. Dev. Cell 2020, 55, 45–68. [Google Scholar] [CrossRef]
  46. Sung, J.J.; Pardeshi, N.N.; Mulder, A.M.; Mulligan, S.K.; Quispe, J.; On, K.; Carragher, B.; Potter, C.S.; Carpenter, J.F.; Schneemann, A. Transmission Electron Microscopy as an Orthogonal Method to Characterize Protein Aggregates. J. Pharm. Sci. 2015, 104, 750–759. [Google Scholar] [CrossRef]
  47. Fox, A.H.; Nakagawa, S.; Hirose, T.; Bond, C.S. Paraspeckles: Where Long Noncoding RNA Meets Phase Separation. Trends Biochem. Sci. 2017, 43, 124–135. [Google Scholar] [CrossRef]
  48. Molliex, A.; Temirov, J.; Lee, J.; Coughlin, M.; Kanagaraj, A.P.; Kim, H.J.; Mittag, T.; Taylor, J.P. Phase Separation by Low Complexity Domains Promotes Stress Granule Assembly and Drives Pathological Fibrillization. Cell 2015, 163, 123–133. [Google Scholar] [CrossRef]
  49. Alberti, S.; Gladfelter, A.; Mittag, T. Considerations and Challenges in Studying Liquid-Liquid Phase Separation and Biomolecular Condensates. Cell 2019, 176, 419–434. [Google Scholar] [CrossRef]
  50. Julius, K.; Weine, J.; Gao, M.; Latarius, J.; Elbers, M.; Paulus, M.; Tolan, M.; Winter, R. Impact of Macromolecular Crowding and Compression on Protein–Protein Interactions and Liquid–Liquid Phase Separation Phenomena. Macromolecules 2019, 52, 1772–1784. [Google Scholar] [CrossRef]
  51. Elbaum-Garfinkle, S. Matter over mind: Liquid phase separation and neurodegeneration. J. Biol. Chem. 2019, 294, 7160–7168. [Google Scholar] [CrossRef] [PubMed]
  52. Stroo, E.; Koopman, M.; Nollen, E.A.A.; Mata-Cabana, A. Cellular Regulation of Amyloid Formation in Aging and Disease. Front. Neurosci. 2017, 11, 64. [Google Scholar] [CrossRef] [PubMed]
  53. Kaur, T.; Alshareedah, I.; Wang, W.; Ngo, J.; Moosa, M.M.; Banerjee, P.R. Molecular Crowding Tunes Material States of Ribonucleoprotein Condensates. Biomolecules 2019, 9, 71. [Google Scholar] [CrossRef] [PubMed]
  54. Qamar, S.; Wang, G.; Randle, S.J.; Ruggeri, F.S.; Varela, J.A.; Lin, J.Q.; Phillips, E.C.; Miyashita, A.; Williams, D.; Ströhl, F.; et al. FUS Phase Separation Is Modulated by a Molecular Chaperone and Methylation of Arginine Cation-π Interactions. Cell 2018, 173, 720–734.e15. [Google Scholar] [CrossRef]
  55. George-Hyslop, P.S.; Lin, J.Q.; Miyashita, A.; Phillips, E.C.; Qamar, S.; Randle, S.J.; Wang, G. The physiological and pathological biophysics of phase separation and gelation of RNA binding proteins in amyotrophic lateral sclerosis and fronto-temporal lobar degeneration. Brain Res. 2018, 1693, 11–23. [Google Scholar] [CrossRef]
  56. Wang, A., et al., A single N-terminal phosphomimic disrupts TDP-43 polymerization, phase separation, and RNA splicing. EMBO J, 2018. 37(5).
  57. McGurk, L.; Gomes, E.; Guo, L.; Mojsilovic-Petrovic, J.; Tran, V.; Kalb, R.G.; Shorter, J.; Bonini, N.M. Poly(ADP-Ribose) Prevents Pathological Phase Separation of TDP-43 by Promoting Liquid Demixing and Stress Granule Localization. 71. [CrossRef]
  58. Han, X.; Yu, D.; Gu, R.; Jia, Y.; Wang, Q.; Jaganathan, A.; Yang, X.; Yu, M.; Babault, N.; Zhao, C.; et al. Roles of the BRD4 short isoform in phase separation and active gene transcription. Nat. Struct. Mol. Biol. 2020, 27, 333–341. [Google Scholar] [CrossRef]
  59. Sabari, B.R.; Dall’Agnese, A.; Boija, A.; Klein, I.A.; Coffey, E.L.; Shrinivas, K.; Abraham, B.J.; Hannett, N.M.; Zamudio, A.V.; Manteiga, J.C.; et al. Coactivator condensation at super-enhancers links phase separation and gene control. Science 2018, 361, eaar3958. [Google Scholar] [CrossRef]
  60. Kato, M.; Han, T.W.; Xie, S.; Shi, K.; Du, X.; Wu, L.C.; Mirzaei, H.; Goldsmith, E.J.; Longgood, J.; Pei, J.; et al. Cell-free Formation of RNA Granules: Low Complexity Sequence Domains Form Dynamic Fibers within Hydrogels. 2012, 149, 753–767. [Google Scholar] [CrossRef]
  61. Jean, L.; Foley, A.C.; Vaux, D.J.T. The Physiological and Pathological Implications of the Formation of Hydrogels, with a Specific Focus on Amyloid Polypeptides. Biomolecules 2017, 7, 70. [Google Scholar] [CrossRef]
  62. Schindelin, J.; Arganda-Carreras, I.; Frise, E.; Kaynig, V.; Longair, M.; Pietzsch, T.; Preibisch, S.; Rueden, C.; Saalfeld, S.; Schmid, B.; et al. Fiji: an open-source platform for biological-image analysis. Nat. Methods 2012, 9, 676–682. [Google Scholar] [CrossRef] [PubMed]
  63. Gasteiger, E., et al., Protein Identification and Analysis Tools on the ExPASy Server, in The Proteomics Protocols Handbook, J.M. Walker, Editor. 2005, Humana Press: Totowa, NJ. p. 571-607.
  64. Gully, B.S.; Cowieson, N.; Stanley, W.A.; Shearston, K.; Small, I.D.; Barkan, A.; Bond, C.S. The solution structure of the pentatricopeptide repeat protein PPR10 upon binding atpH RNA. Nucleic Acids Res. 2015, 43, 1918–1926. [Google Scholar] [CrossRef] [PubMed]
  65. Kirby, N.M.; Mudie, S.T.; Hawley, A.M.; Cookson, D.J.; Mertens, H.D.T.; Cowieson, N.; Samardzic-Boban, V. A low-background-intensity focusing small-angle X-ray scattering undulator beamline. J. Appl. Crystallogr. 2013, 46, 1670–1680. [Google Scholar] [CrossRef]
  66. http://archive.synchrotron.org.au/aussyncbeamlines/saxswaxs/software-saxswaxs, S. http://archive.synchrotron.org.au/aussyncbeamlines/saxswaxs/software-saxswaxs, S.
  67. Petoukhov, M.V., et al., New developments in the ATSAS program package for small-angle scattering data analysis. J Appl Crystallogr, 2012. 45(Pt 2): p. 342-350.
  68. Tria, G.; Mertens, H.D.T.; Kachala, M.; Svergun, D.I. Advanced ensemble modelling of flexible macromolecules using X-ray solution scattering. IUCrJ 2015, 2, 207–217. [Google Scholar] [CrossRef]
  69. https://www.sasview.org/, S. https://www.sasview.org/, S.
  70. Konarev, P.V.; Volkov, V.V.; Sokolova, A.V.; Koch, M.H.J.; Svergun, D.I. PRIMUS: A Windows PC-based system for small-angle scattering data analysis. J. Appl. Crystallogr. 2003, 36, 1277–1282. [Google Scholar] [CrossRef]
  71. Semenyuk, A.V.; Svergun, D.I. GNOM – a program package for small-angle scattering data processing. J. Appl. Crystallogr. 1991, 24, 537–540. [Google Scholar] [CrossRef]
  72. Tang, G.; Peng, L.; Baldwin, P.R.; Mann, D.S.; Jiang, W.; Rees, I.; Ludtke, S.J. EMAN2: An extensible image processing suite for electron microscopy. J. Struct. Biol. 2007, 157, 38–46. [Google Scholar] [CrossRef]
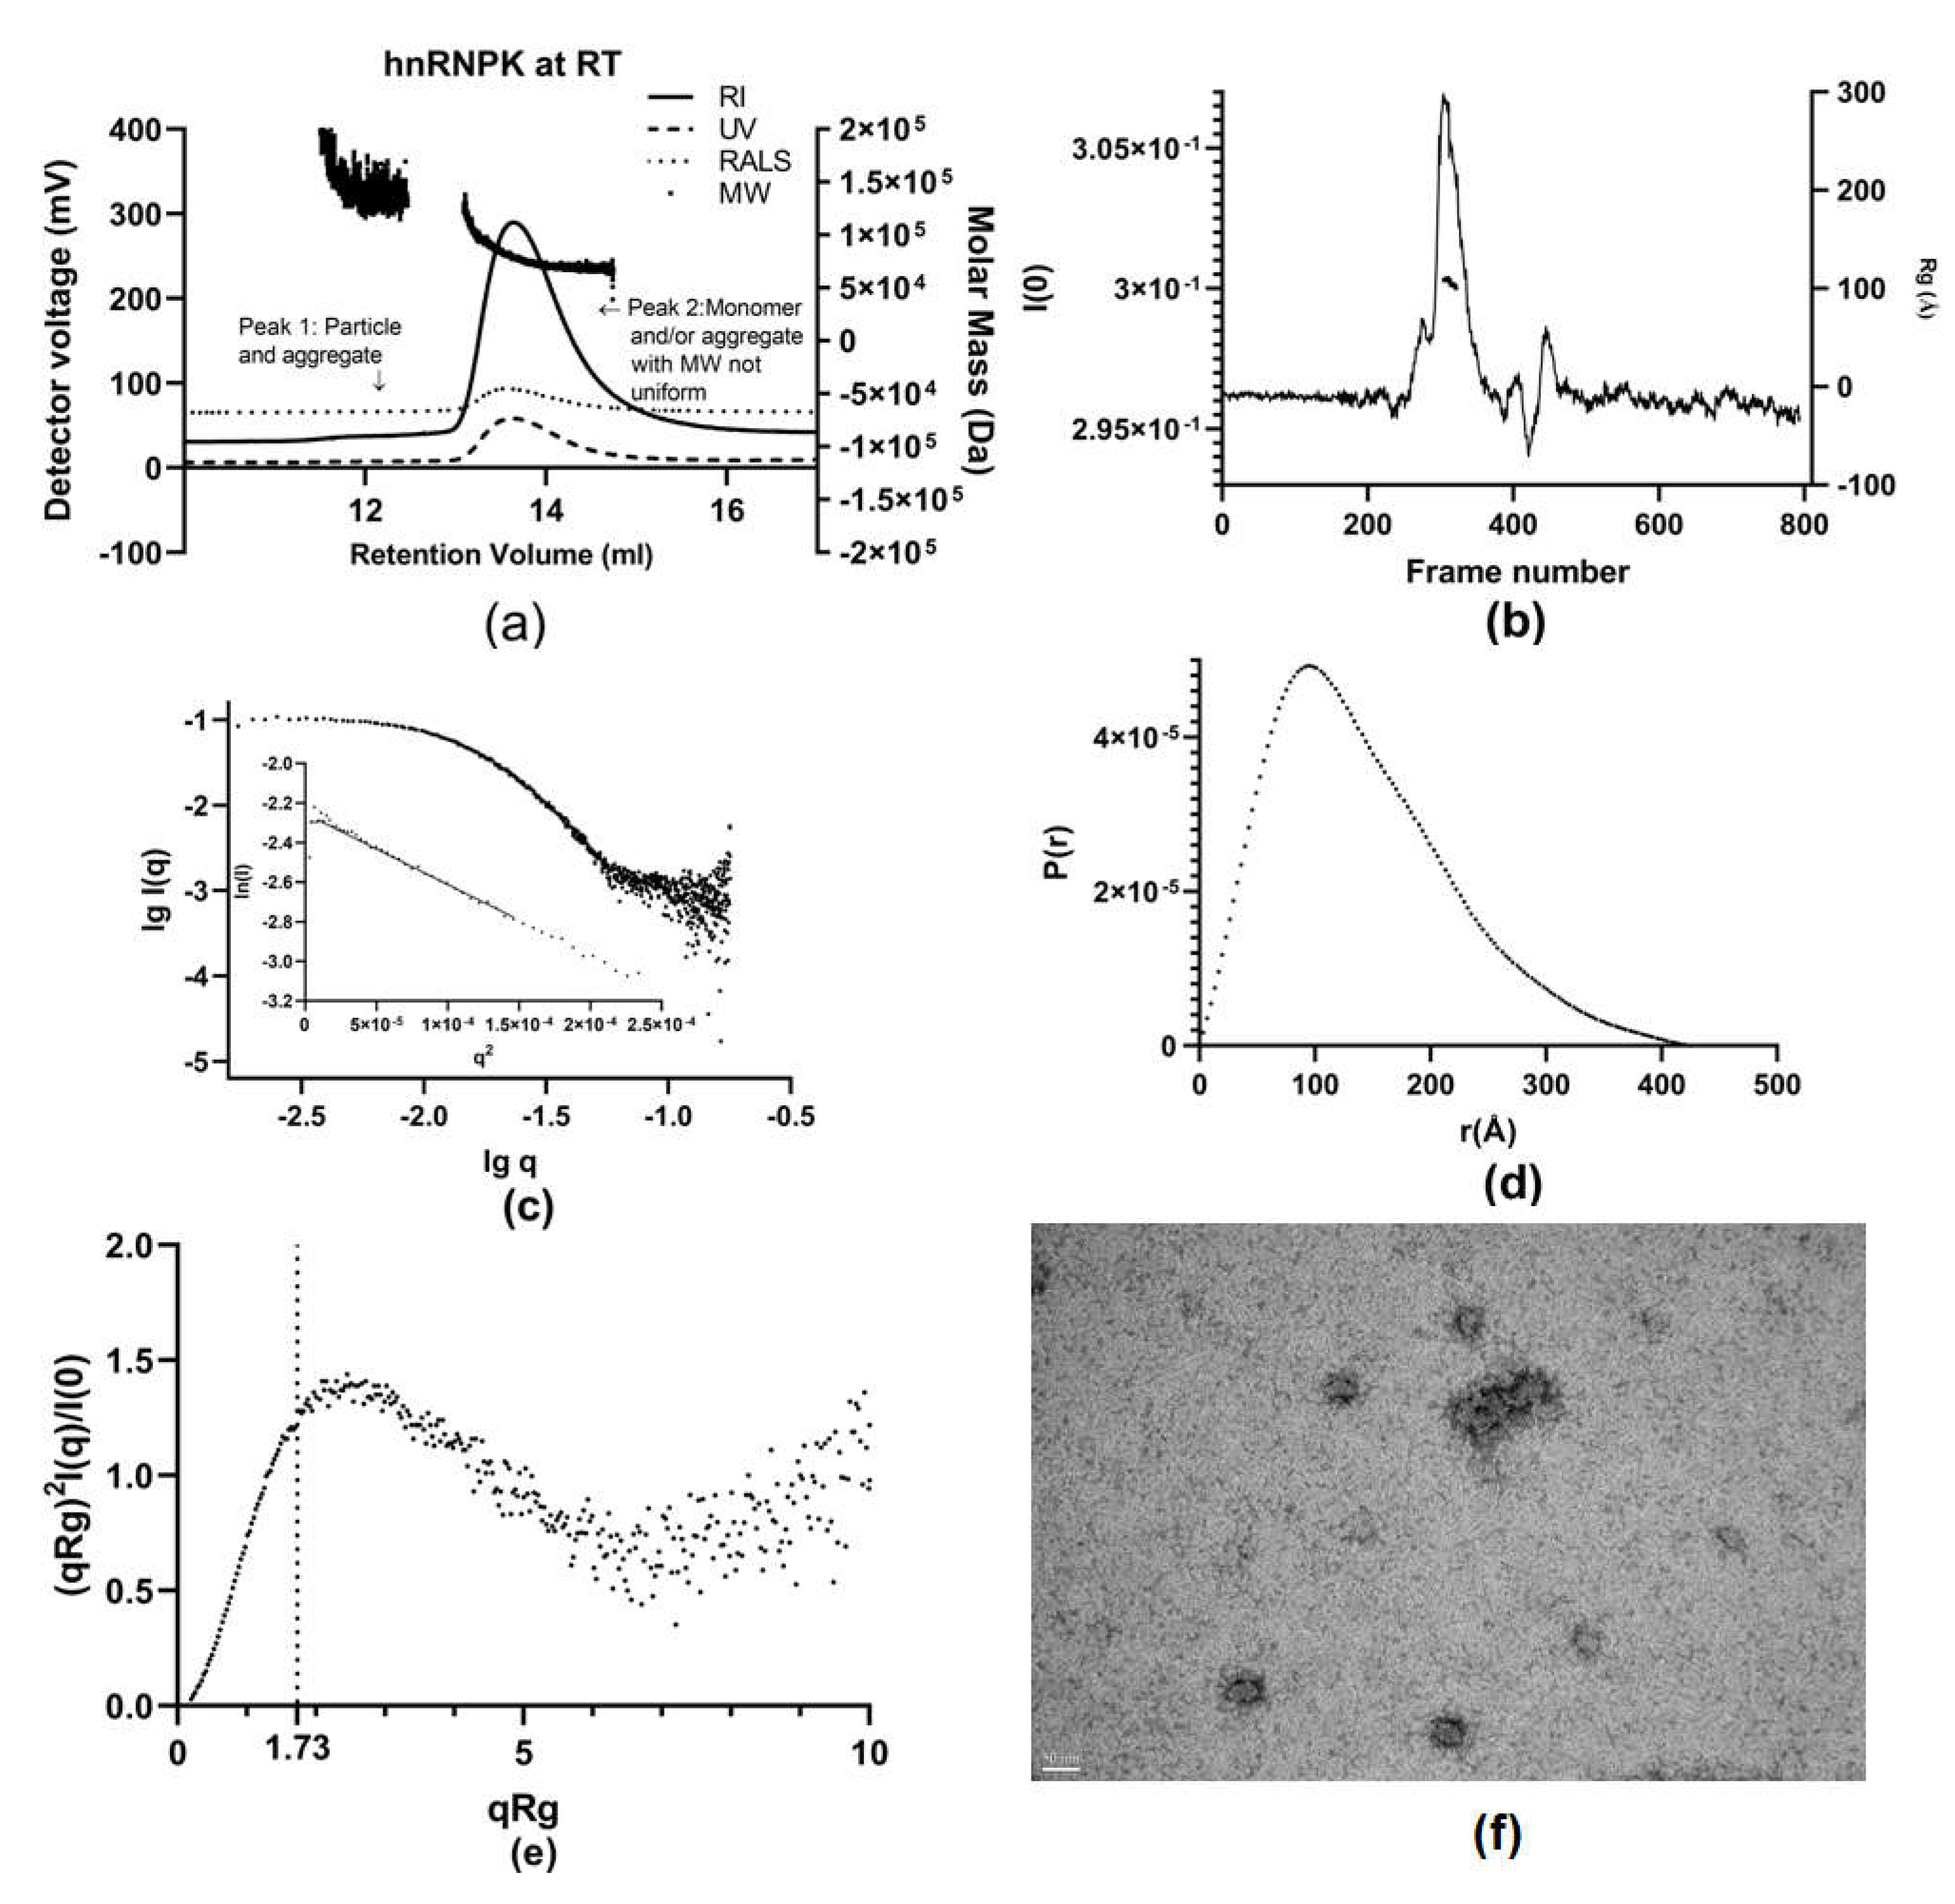
Figure 2. DLS measurement of the hydrodynamic diameter of hnRNPK derived from size distribution by intensity. (a) hnRNPK aggregation over time. DLS traces of 0.5 mg/ml hnRNPK at 4oC, at 25oC after 1 hour, and at 25oC after 3 hours. (b) Impact of temperature and concentration on hnRNPK aggregation. (i) DLS traces of 1.3 mg/ml hnRNPK at 4oC, and at 25oC after 2.5 hours; (ii) DLS traces of 1.3 mg/ml and 3.2 mg/ml hnRNPK at 4oC.
Preprints 144406 g002
Figure 3. Stoichiometry and structure of hnRNPK at 4oC. (a) SEC-LS of hnRNPK at 4oC with RI, UV, RALS traces, and molecular mass distribution. (b) Plot of I(0) trace for the SEC-SAXS of hnRNPK at 4oC. (c) log I(q) vs log q plot and Guinier plot. (d) The P(r) profile. (e) Dimensionless Kratky plot of the scattering data. (f) Ab initio model of hnRNPK at 4oC.
Preprints 144406 g003
Figure 4. Structural analyses of hnRNPK by negative stain transmission electron microscopy. The left, overview image showing well distributed particles, 5 particles are highlighted (white boxes), scale bar: 50 nm. Insets: First column, 2x enlarged views of the 5 representative particles highlighted in the corresponding overview. Second column, 5 2D class averages, each obtained by averaging about 20 particles. Scale bar: 10 nm, all inset boxes are 25 by 25 nm.
Preprints 144406 g004
Figure 5. Stoichimetry and solution structure of hnRNPK at room temperature. (a) SEC-LS of hnRNPK at room temperature with RI, UV, RALS traces, and molecular mass distribution. (b) Plot of I(0) trace for the SEC-SAXS of hnRNPK at room temperature. (c) log I(q) vs log q plot and Guinier plot. (d) The P(r) profile. (e) Dimensionless Kratky plot of the scattering data. (f) TEM of hnRNPK’s aggregate at room temperature, scale bar: 50 nm.
Preprints 144406 g005
Figure 6. Solution structure of hnRNPK derived from SANS (a) Background subtracted SANS data for hydrogenous and deuterated hnRNPK (H:D = 1:25) in deuterated buffer with 1.1 mg/ml of unmatched hnRNPK in a total concentration of 26.6 mg/ml (b) The P(r) profile of 1:25 (H:D) hnRNPK sample. (c) Ab initio model of hnRNPK monomer from SANS scattering profile. (d) Background subtracted SANS data for hydrogenous hnRNPK in deuterated buffer at a concentration of 28.9 mg/mL (e) The P(r) profile of hnRNPK aggregates.
Preprints 144406 g006
Figure 7. Gelation of eGFP-hnRNPK induced at low temperature and high protein concentration. (a) image of eGFP-hnRNPK at hydrogel form. Bar 1 mm(b) X-ray diffraction of eGFP-hnRNPK hydrogel with typical amyloid rings at 4.7 Å and 10 Å. (c) SEM image of eGFP-hnRNPK hydrogel showing fibrillar structure. Bar 200 nm.
Preprints 144406 g007
Figure 8. Liquid phase separation of eGFP-hnRNPK. (a) Addition of 10% PEG 8000 induces phase separation of hnRNPK. (b) Fluorescence microscopy of eGFP-hnRNPK droplets induced by 10% PEG 8000 reveals liquid droplets. (c) Measurement of the saturation concentration of eGFP-hnRNPK phase separation induced at three different salt concentratio.ns.
Preprints 144406 g008
Table 1. Parameters of SEC-LS for hnRNPK at room temperature and 4oC.
Peak 1 Peak 2
Elution volume (ml) Measured MW (kDa) MW distribution
(kDa)
Stoichiometry Elution volume (ml) Measured MW (kDa) MW distribution
(kDa)
Stoichiometry
hnRNPK at 4oC 12.4 101.3 49.0-152.9 1.98:1 14.0 59.1 54.0-73.0 1.16:1
hnRNPK at RT 12.5 146.9 114.8-282.4 2.88:1 13.6 78.0 51.0-138.0 1.53:1
Table 2. SANS and SEC-SAXS derived structural parameters of hnRNPK.
Sample hnRNPK at 25o C hnRNPK at 4o C Hydrogenated
hnRNPK monomer
Hydrogenated
hnRNPK aggregate
Data Collection Parameters
Instrument Australian Synchrotron SAXS/WAXS beamline QUOKKA, SANS beamline, ANSTO
q range (Å-1) 0.0031-0.0751 0.0080-0.4800 0.0060-0.42 0.0060-0.0824
Concentration (mg/ml) 0.82 6.20 1.1 (unmatched);
26.6 (total)
28.9 (unmatched)
Sample
temperature (oC)

22o C

4oC

20o C

20o C
Structural Parameters
I(0), cm-1, from Guinier 0.1036±0.001000 0.0062±0.000075 0.0692 ± 0.001500 34.1000 ± 0.000880
Rg, Å, from Guinier 106.0±1.40 39.4±2.96 28.8 ± 0.90 88.48 ± 0.01
I(0), cm-1, from P(r) 0.109300±0.0010280 0.006347±0.0002068 0.074000 ± 0.0011000 34.120000 ± 0.0008103
Rg, Å, from P(r)
113.9±1.710000

44.0±2.695000

32.9 ± 0.600000

88.71 ±0.004509
Dmax, nm 42.5 18.7 11.2 28.6
P(r) Quality estimate
0.6733

0.6411

0.5840

0.6500
Molecular Mass Estimation by Bayesian Probability
Estimated Molecular mass, Mr(kDa) 873.1 54.4
67.5

1267.9
MW Probability, % 32.6 21.5
Credibility Interval (kDa) 614.5, 1013.1 46.2, 63.1
Credibility Interval Probability, % 93.2 93.1
Calculated Mrfrom sequence (kDa) 51.0 51.0
Estimated Ratio/state
Aggregate

Monomer

Monomer

Aggregate
DAMMIF (default parameters, 20 calculations)
Symmetry, anisotropy assumptions P1, none P1, none P1, none
P1, none
χ2 0.2892 0.2594 0.6888 1454
NSD (standard deviation)
1.094 (0.078)

0.651 (0.037)

0.893 (0.048)

0.708 (0.056)
Resolution (from SASRES) (Å)
97 ± 7

39 ± 3

40 ± 3

85 ± 6
Disclaimer/Publisher’s Note: The statements, opinions and data contained in all publications are solely those of the individual author(s) and contributor(s) and not of MDPI and/or the editor(s). MDPI and/or the editor(s) disclaim responsibility for any injury to people or property resulting from any ideas, methods, instructions or products referred to in the content.
Copyright: This open access article is published under a Creative Commons CC BY 4.0 license, which permit the free download, distribution, and reuse, provided that the author and preprint are cited in any reuse.
Prerpints.org logo

Preprints.org is a free preprint server supported by MDPI in Basel, Switzerland.

Subscribe

Disclaimer

Terms of Use

Privacy Policy

Privacy Settings

© 2025 MDPI (Basel, Switzerland) unless otherwise stated