
Submitted:
28 December 2024
Posted:
30 December 2024
You are already at the latest version
Abstract
Background/Objectives: Cutaneous leishmaniasis caused by Leishmania amazonensis is a significant public health issue. This study aimed to evaluate an eco-friendly, thermosensitive nanogel, developed using a low-energy, solvent-free method, incorporating F127 and Carbopol 974P copolymers, and enriched with Pectis brevipedunculata essential oil (EOPb) for its leishmanicidal and anti-inflammatory properties. Methods: The nanogel was prepared and characterized through FTIR, DLS, SEM, and AFM to confirm the incorporation of EOPb, stability and rheological properties. In vitro leishmanicidal activity was evaluated on Leishmania amazonensis promastigotes, and in vivo anti-inflammatory effects were assessed using a rat paw edema model. Results: In vitro, nGF3 (EOPb-loaded nanogel) demonstrated significant leishmanicidal activity, with promastigote mortality rates exceeding 80% at 24 h and 90% at 48 h. In vivo, nGF1, nGF2, and nGF3 exhibited anti-inflammatory effects, with nGF2 and nGF3 reducing edema by 62.7% at 2 h post-treatment. The empty nanogel (nGF0) showed minimal anti-inflammatory activity. Conclusions: The eco-friendly EOPb-loaded nanogel (nGF3) demonstrated strong leishmanicidal and anti-inflammatory effects, presenting a promising candidate for cutaneous leishmaniasis treatment. Further studies are necessary to explore its clinical potential.
Keywords:
Eco-friendly Nanogel
; Leishmanicidal Activity
; Anti-inflammatory Effects
1. Introduction
Leishmaniasis represents a significant global health challenge, affecting millions in diverse geographical regions, particularly in tropical and subtropical areas [1,2]. This parasitic disease, caused by various species of Leishmania and transmitted by sandflies, manifests itself in cutaneous [3], mucocutaneous [4], and visceral forms [5], each presenting distinct clinical complexities and health burdens [6]. Although often neglected within the broader scope of public health initiatives, leishmaniasis remains endemic in more than 90 countries, with an estimated 700,000 to 1 million new cases each year. Current control measures are limited by socioeconomic factors, challenges in vector control, and the lack of an effective vaccine, making the disease’s persistence a critical concern. Addressing the multidimensional aspects of leishmaniasis demands a coordinated global response, integrating scientific, medical, and socio-political strategies to reduce its impact on affected populations [7].
Current treatments for leishmaniasis primarily rely on a limited array of drugs, including antimonials, amphotericin B, miltefosine, and paromomycin [8]. These treatments, while effective, pose several challenges: many have significant toxicity, require prolonged administration, and often demand hospitalization, especially in cases requiring intravenous medication [9,10]. The efficacy of these drugs also varies by Leishmania species and geographical location, complicating treatment protocols. Furthermore, drug resistance is emerging in some regions, exacerbating treatment difficulties and underscoring the need for alternative therapies [11]. For public health systems, particularly in endemic areas, the financial burden of leishmaniasis treatment is substantial. High drug costs, combined with the need for infrastructure to support safe administration and follow-up care, strain limited healthcare budgets, often redirecting resources from other critical areas. This economic strain highlights the urgent need for investment in the development of affordable, effective, and accessible therapies that can alleviate the financial and operational pressures on public health systems worldwide [12].
Natural products are gaining attention as promising alternatives for developing effective and sustainable treatments for leishmaniasis, with the Amazon rainforest recognized as a rich reservoir of biologically active species [13]. This extensive biodiversity encompasses a variety of aromatic plants, which produce essential oils with well-established antimicrobial and antiparasitic properties [14]. Natural products (NP) from Amazon rainforest species, particularly essential oils (EO) that are abundant in terpenoids, phenolic compounds, and other bioactive molecules, represent an innovative approach for the formulation of anti-leishmanial therapies [15,16,17]. Recent research has focused on incorporating of EO into nanotechnological delivery systems, such as nanoparticles and liposomes, to enhance their therapeutic efficacy [18,19]. By encapsulating bioactive compounds in nanoscale carriers, these advanced formulations can improve drug stability, target specificity, and bioavailability, while reducing toxicity [20]. Utilizing Amazon rainforest EO in nanotechnology-driven treatment strategies not only holds promise for more effective and accessible leishmaniasis therapies but also supports the sustainable use of rainforest resources, bridging biodiversity conservation with innovation in global health [21].
Among these formulations, nanogels represent an innovative and highly effective approach for treating cutaneous lesions caused by cutaneous leishmaniasis (CL). Nanogels stand out due to their unique characteristics, such as high loading capacity and controlled release of active compounds, which make them ideal carriers for EO. These oils are particularly valued for their potent anti-inflammatory properties, alongside their antimicrobial and wound-healing effects. By promoting the reduction of inflammation, EO can help accelerate the healing process of lesions while simultaneously reducing local parasitic burden. Furthermore, the topical application of nanogels enables targeted, sustained delivery of the active compounds, ensuring enhanced therapeutic efficacy at the infection site and minimizing potential systemic side effects [22,23].
Nanogels have emerged as a promising platform for the controlled release of EO, offering significant potential for advancing wound healing and infection prevention [24,25,26]. Incorporating EO into nanogel formulations enhances their antimicrobial, anti-inflammatory, and regenerative properties, making them highly effective for skin repair [27]. Nanogels, characterized by their high loading capacity and controlled release mechanisms, offer sustained therapeutic effects directly at the wound site, aiding in tissue recovery and reducing the risk of infection [28]. By incorporating essential oils, these systems further enhance localized efficacy through targeted delivery while simultaneously minimizing systemic side effects [29]. Despite the promise demonstrated by nanogels as therapeutic platforms for delivering essential oils, particularly in antimicrobial and wound care applications, the number of published studies specifically focusing on EO-loaded nanogels with leishmanicidal and anti-inflammatory activities remains limited [30]. While essential oil-loaded nanogels show considerable potential for localized and controlled drug delivery, their application in the treatment of leishmaniasis has yet to be fully explored. Further research is needed to optimize these formulations and to comprehensively evaluate their therapeutic efficacy, particularly for targeting both the parasite and the inflammatory processes associated with the CL. This gap highlights a critical opportunity for advancing EO-based nanogel systems as innovative and multifunctional tools for managing complex infectious diseases like leishmaniasis.
This study aims to broaden the antimicrobial applications of Pectis brevipedunculata (Asteraceae) essential oil (EOPb) loaded F127/974P nanogel formulations. The genus Pectis, part of the Asteraceae family, includes Pectis brevipedunculata, a plant found in tropical and subtropical regions of the Americas, particularly in Brazil, Argentina, and Uruguay [31]. Known for its therapeutic properties, including anti-inflammatory and antimicrobial effects, P. brevipedunculata has been used traditionally for various health benefits. Its essential oils, rich in monoterpenes such as neral, geranial, a-pinene, and limonene, exhibit strong antimicrobial activity, making the plant a promising candidate for developing natural antimicrobial agents and sustainable therapeutic applications [32,33]. In a prior investigation by our research group demonstrated promising larvicidal activity of EOPb-loaded nanogel against Aedes aegyptilarvae, achieving effective inactivation without cytotoxic effects when tested with the unloaded nanogel [34]. Based on these findings, the current work evaluates the in vitro activity of the nanogel against promastigote forms of Leishmania (Leishmania) amazonensis (LLa), along with its in vivo anti-inflammatory potential using the carrageenan-induced model of rat paw edema.
These findings suggest that the nanogel (nGF) shows strong potential as a multifunctional nanocarrier. It demonstrates time- and concentration-dependent efficacy against Leishmania amazonensis promastigotes, with significant potency even at lower concentrations. Mortality rates of 38.15% at 24 h and 33.03% at 48 h were observed, with the cytotoxic effect attributed to the OEPbcomposition in the gel matrix. Additionally, in vivo studies showed that nanogel application at OEPb concentrations of 0.25%, 0.50%, and 1% achieved maximum efficacy 2 h after inflammatory agent inoculation, with edema reductions of 44.1%, 62.7%, and 54.4%, respectively. This ecofriendly nanogel, developed through a low-energy, solvent-free process, presents a sustainable and innovative approach to wound treatment that offers potential as an effective therapeutic solution for CL. By leveraging the potent bioactive properties of EOPb within a biodegradable gel matrix, this formulation aligns environmental responsibility with therapeutic efficacy, positioning it as a promising alternative for sustainable, targeted treatment in the management of leishmaniasis-related skin lesions.
2. Materials and Methods
2.1. Materials
Pluronic F127 (poly(ethylene oxide)-poly(propylene oxide)-poly(ethylene oxide) triblock copolymer (MW = 12,600 g/mol; (EOPOEO)), ultrapure water, anhydrous sodium sulfate (≥99%), sodium chloride (≥99%), deuterated chloroform (CDCl), alkane standard mixture XTT (2,3-bis(2-methoxy-4-nitro-5-sulfophenyl)-5-[(phenylamino)carbonyl]-2H-tetrazolium hydroxide), PMS (N-methyl dibenzopyrazine methyl sulfate), penicillin, streptomycin, fetal bovine serum and amphotericin B were commercially acquired from the Merck company (Rahway, NJ, USA). Carbopol 974P NF polymer was provided by IMCD Brasil (São Paulo, SP, Brazil).
2.2. Plant Material
P. brevipedunculata (Pb) was collected from the Universidade Federal do Maranhão (UFMA) campus in São Luís, Maranhão, Brazil (2° 33’ 20.5"S, 44° 18’ 32.7"W). A voucher specimen (No. 5287) was deposited at the Rosa Mochel Herbarium (SLUI), Universidade Estadual do Maranhão (UEMA), São Luís, MA, Brazil. Plant collection a(D)ered to Brazilian biodiversity protection regulations, registered under SisGen code AAFB38B.
2.3. Extraction Procedure
The essential oil from Pb (EOPb) was extracted via hydrodistillation using a Clevenger-type apparatus following the methodology described in a previous study [34]. Air-dried Pb (300 g) was cut into small pieces using pruning shears to optimize extraction efficiency. The plant material was then combined with 500 mL of distilled water in a flask and hydrodistilled for 3 h following reflux onset. Post-extraction, the oil/water mixture was centrifuged at 3500 rpm for 10 min at 25 °C. Remaining water was removed by treating the mixture with anhydrous sodium sulfate, yielding a final EOPb yield of 0.80% based on initial plant material weight (Figure 1).
2.4. CG–MS and NMR analyses of EOPb
The OEPb analyses were conducted utilizing GC–MS and NMR techniques, following previously established methodologies [34]. Briefly, the GC and GC-MS analyses were performed using Shimadzu systems, employing a fused capillary column (RXi-1MS) with helium carrier gas. The temperature program consisted of optimized settings, with samples (10 mg/mL in CHCl injected at a 1:50 split ratio. Retention indices were determined using n-alkane standards, and peak areas and retention times were measured to calculate relative amounts. GC–MS analyses utilized a Shimadzu QP2010 SE system with AOC-20i auto-injector, employing identical conditions to GC. EO components were identified by comparing retention times, indices, and MS spectra with standards and literature data (ADAMS and FFNSC libraries). NMR spectra 1H, 13C and DEPT 13C) were acquired on a BRUKER Avance III HD spectrometer (11.75 Tesla, 500.13 MHz and 125.76 MHz). Samples were dissolved in deuterated chloroform (CDCl) with chemical shifts reported in ppm relative to tetramethylsilane (TMS) as internal reference.
2.5. Preparation of Nanogel Formulations and Stability Evaluation
The nanogel formulations were developed according to a previously published paper [34]. F127 copolymer (20% w/w) was gradually introduced into cold distilled water maintained in an ice bath (5–10 °C), with gentle stirring to facilitate hydration of each copolymer flake. Subsequently, 974P (0.2% w/w) was added incrementally, and the solution was gently stirred at 5–10 °C until complete dissolution was achieved. Subsequently, EOPb was added dropwise to the mixture while stirring continuously for 30 min. The solution was refrigerated overnight at 5 °C to ensure complete solubility of all components (Figure 1). The formulations were labeled according to the OEPb concentration (% w/w): nGF0 (prepared without OEPb), nGF1 (containing 0.25%), nGF2 (containing 0.50%), and nGF3 (containing 1.0%). To assess the impact of temperature on the physical and chemical stability of nanogel formulations, accelerated stability tests and shelf-life tests were conducted according to the methodology described in the previously published work [34], following ANVISA and US Pharmacopeia guidelines.Chemical stability was analyzed using GC-MS by comparing EOPb chromatograph profiles over a 28-day period.
2.6. FTIR Analysis
FTIR analyses were performed in reflectance mode using a Shimadzu Tracer-100 FTIR spectrophotometer (Kyoto, Japan). Nanogel samples were freeze-dried and compressed into pellets with KBr, while pure OEPb was analyzed using Attenuated Total Reflectance (ATR) mode. The spectrometer was equipped with a horizontal ATR accessory, featuring a ZnSe crystal window (PIKE Technologies) for ATR-FTIR measurements. The spectra were collected within the 400-4000 cm-1 range, with a resolution of 8 cm-1 and 50 scans. For sample preparation, the material was evenly applied to the ATR crystal surface. After each spectrum was acquired, the crystal window was thoroughly cleaned with hexane and acetone before proceeding with further measurements. The UV−Vis absorption spectra of the nanogels, prepared at a concentration of 5.0 x 10⁻³ g/mL in water, were recorded at room temperature using a Shimadzu UV−Vis 1800 spectrophotometer (Kyoto, Japan).
2.7. DLS Analysis
Average hydrodynamic diameters (D) analyses were determined by dynamic light scattering (DLS) in water at 25 °C and 40 mW semiconductor laser of 658 nm with a Litesizer 500 (Anton Paar GmbH) instrument (Module BM 10). The D measurement was performed using a quartz cuvette of 3.0 mL. The potential was performed using a low-volume cuvette (Univette). All the measurements were performed in triplicate (mean ± SD).
2.8. Scanning Electron Microscope (SEM)
The morphology of nGF0 and nGF3 was examined using SEM analysis. The samples were initially frozen in liquid nitrogen at -196 °C and then lyophilized for 24 h using a Thermo Micro Modulyo freeze dryer (Thermo Electron Corporation, Pittsburgh, PA, USA). After lyophilization, the samples were coated with a thin layer of metal using a BAL-TEC SCD 050 Sputter Coater (Balzers, Liechtenstein), and their morphology was analyzed at magnifications of 100x and 50x using a FEI Quanta 250 microscope (Thermo Fisher Scientific, Karlsruhe, Germany).
2.9. Atomic Force Microscopy (AFM)
AFM analysis, a Multimode 8 microscope (Bruker, Santa Barbara, CA, USA) was employed, operating in PeakForce Quantitative Nanomechanics (QNM) mode. In this mode, the probe oscillated at 1 kHz, below its resonance frequency, acquiring force curves with each oscillation cycle. Concurrently with force curve acquisition, we obtained nanomechanical properties such as Young’s modulus and adhesion. The probes used in this study had a nominal spring constant of 0.4 N/m and a tip radius of 2 nm (probe brand), with a scan resolution of 256 x 256 lines and a scan frequency of 0.5 Hz per acquired map. Young’s modulus data were derived using the Derjaguin-Muller-Toporov (DMT) model, which characterizes the interaction between an undeformed conical probe and a rigid sample plane. According to the DMT model, force applied to the DMT model between the surfaces is expressed as [35].
E is Young’s modulus, Poisson’s ratio, indentation depth, and R is the tip radius. Adhesion measurements were calculated from the force curves during the probe-sample interaction. Adhesion is the maximum resistance the AFM probe encounters when detaching from the sample surface [36]. This resistance manifests as a downward deflection of the cantilever due to attractive forces. Consequently, the adhesion force is identified as the maximum negative force recorded during the retraction phase of the force cycle [37,38].
2.10. in vitro Assay against Promastigotes of Leishmania (Leishmania) amazonensis (LLa)
LLa(strain PH8) cells were cultured in 199 culture medium, supplemented with 10% inactivated fetal bovine serum and antibiotics (100 UI/mL penicillin and 0.1 mg/mL streptomycin). The cultures were incubated at 27 °C with constant subculturing. In 96-well plates, the culture of LLa promastigotes was seeded in RPMI 1640 medium, resulting in a final concentration of 2 × 10⁷ leishmania/mL after the addition of the compounds. The nanogels were diluted in RPMI 1640 medium and added at concentrations ranging from 2.2–0.7 mg/mL in OEPb. The plates were then incubated at 27 °C for 24, 48, and 72 h. The viability of the promastigotes was determined using the colorimetric XTT method. A mixture containing 20% of XTT:PMS and 60% of NaCl solutin (at concentration of the 0.9%) was added to the plates. The plates were then incubated for 4 h at 37 °C with 5% CO. After this period, absorbance was measured using a spectrophotometer with filters set to 450–620 nm, and the percentage of inhibition was estimated by comparison with untreated cells. Amphotericin B was used as a positive control. The experiments were conducted in triplicate and in the absence of light. The percentage of mortality was calculated based on a logarithmic regression of the control curve made only with Leishmania and culture medium, starting with a concentration of 2 × 10⁷ leishmania/mL and diluted in a ratio of two down to a concentration of 6.25 × 10⁵ leishmania/mL.
2.11. in vivo Evaluation of the Anti-Inflammatory Activity of Nanogels
To characterize the anti-inflammatory effect of the produced nanogels, the carrageenan-induced paw edema experimental protocol was performed in adult male Swiss mice, following the methodology of Sulaiman et al. (2010) with modifications. Approved by the Ethics Committee of CEP-UFMA (Research Ethics Committee of AGEUFMA), under approval code 23115.038817/2024-44, on 1 May 2024. Topical formulations nGF0–nGF3 were evaluated against diclofenac sodium gel 10 mg/g, which was selected as the standard anti-inflammatory topical drug. The animals were divided into six groups (n=5), as follows: Control, which received NaCl 0.9% saline solution; Groups II, III, and IV, which received nGF1, nGF2, and nGF3, respectively; Group V received nGF0, and Group VI received diclofenac sodium gel 10 mg/g. After 1 hour, acute inflammation was induced in the right hind paws of the animals by intraplantar injection of 0.05 ml of carrageenan (1% w/v). A digital caliper was utilized to measure the increase in paw thickness (Ct) immediately following the carrageenan injection (0 h) and then every hour for 4 h thereafter. Any increase in paw thickness was considered an indicator of inflammation (Figure 2). The calculate inflammation inhibition is expressed as:
Where is the paw measurement after carrageenan treatment at time t, and is the initial (basal) paw measurement.
2.12. Statistical analysis
For the statistical analysis, data were evaluated using a single-criterion approach through ANOVA, followed by Tukey’s post-test for pairwise comparisons and Kruskal-Wallis with Dunn’s post-hoc test for non-parametric data. Statistical significance was determined based on predefined criteria. All statistical analyses and graphical representations were performed using Prism 9 software (GraphPad, San Diego, CA, USA). Values with statistically significant differences were explicitly highlighted.
3. Results and Discussion
3.1. Development of the Nanogels
According to our previous publication, the chemical composition of OEPb was analyzed using GC-MS, identifying thirteen components that accounted for 91.17% of the oil’s composition. The major component was citral, comprising 64.58% of the oil, represented by two isomeric oxygenated monoterpenes: geranial (36.06%) and neral (28.52%). Other significant constituents included -pinene (15.73%) and limonene (8.28%). The chemical structures of the major compounds were confirmed through 1H and 13C NMR [34]. As stated in our previous publication, a variety of combinations of F127 and 974P percentages were evaluated to identify the ideal formulation that would enable thermosensible behavior in the nanogel. Combinations of 5-10:0.1-0.3% did not exhibit a sol-gel transition, remaining liquid at both 5 °C and 30 °C. In contrast, the 20:0.1-0.3% combinations stayed liquid at 5 °C and transitioned to a semi-solid state at 30 °C, with the 20:0.2% formulation being optimized for a rapid sol-to-gel transition. This combination allowed for the incorporation of EOPb, and formulations with up to 1% of EOPb were stable, transparent, and free from phase separation, even after accelerated stability tests. In contrast, the nanogel at EOPb concentration above 1% led to instability and phase separation. Thus, the formulations nGF1-nGF3 (Figure 1F that proved to be stable after accelerated stability tests, shelf-life assays, and exhibited thermosensitive behavior with a rapid sol-gel transition were selected for this study.
3.2. Spectroscopy Characterization of the Nanogels
For the spectroscopic characterization assays, the nanogel containing the maximum percentage of EOPb (nGF3) was selected. In our previous study, we demonstrated that the chemical stability of nGF3 could be assessed through GC analysis, revealing a high similarity between the chromatographic profiles of EOPb and nGF3. EOPb and nGF3 [34]. Both showed the same elution order: -pinene, limonene, geranial, and neral, ensuring that the composition of EOPb is preserved even after the nanoencapsulation process within the F127/974P polymeric matrix.
The FTIR spectrum of EOPb was performed to support the CG-EM and NMR characterization, confirming the encapsulation of EOPb on F127/974P matrix. In the FTIR spectrum of EOPb, the main absorption bands observed confirm the presence of four key compounds, validating the CG-EM and NMR characterization (Tab. Table 1). The absorption bands between 2954−-2920 cm correspond to the symmetric and asymmetric stretching of C—H bonds associated with aldehyde and hydrocarbon groups. The bands at 1442 and 1377 cm indicate C—H bending vibrations of alkane groups, while the high-intensity band at 1674 cm and the low-intensity band between 887–789 cm are associated with C=C bonds in trisubstituted alkenes. The small shoulder at 1712 cm corresponds to the C=O stretching of conjugated aldehyde groups. In the FTIR of nGF3 was observed the strong and sharp absorption band at 3676 cm-1 results from a pronounced redshift with = 112 cm from the band at 3564 cm observed in the empty nanogel nGF0 spectrum (Figure S8). This findings suggests that a reduction in energy is necessary for the stretching of O—H bonds. This is likely attributable to the ability of EOPb molecules to interfere with some interactions within the F127/974P blend, allowing them to integrate into the nGF3 matrix. The absorption band observed at 3384 cm in nGF0 has shifted to 3340 cm, reflecting a blue shift of 44 cm. This change may be indicative of the establishment of new intermolecular hydrogen bonds between the F127/974P blend and the predominant components of EOPb, suggesting that the more hydrophobic EOPb molecules are preferentially situated within the PPO chains of F127. This interpretation is supported by the heightened energy needed for the anti-symmetric stretching of C—H bonds, which is evidenced by the blue shift to 19 cm when comparated the absorption band at 2904 cm in nGF0 to 2885 cm in the nGF3 spectra. This change indicates a significant enhancement in the hydrophobic interactions within the system, which is further supported by the morphological changes observed in the nGF0 to nGF3 nanogels, as demonstrated below through SEM and AFM analyses.
The size of nGF0 and nGF3 were quantitatively assessed through DLS analysis (Tab. Table 2). This technique has become essential for evaluating the size distribution of nanoparticles in solution. By examining the variations in scattered light intensity due to Brownian motion, DLS offers critical insights into the D and PDI of nanogels, which are vital for determining the homogeneity and stability of the formulations. DLS measurements were carried out in solution systems, diluted to a concentration below 1% (w/v). Under these conditions, which are below the critical micellar concentration (CMC) of F127, the demicellization process is favored, resulting in a decrease in the number of smaller particles. This phenomenon occurs because the total entropy of the system allows smaller particles to aggregate into larger particles, resulting in a (D) of 661.03 ± 6.1 nm.
When 1% of EOPb is solubilized in F127/974P polymeric matrix the (D) reduces to 30.44 ± 12.1 nm indicating a wide particle dispersion within the solution. In accordance with morphologic analysis, the EOPb significantly alters the morphology of the nanogel, leading to a well-defined polymeric organization, with a average size of 40.58 ± 7.98 which are relatively smaller than those calculated for the micellar domains in nGF0. Nanoparticles aimed for drug delivery typically range from 10 to 200 nm in size; thus, selecting the optimal size is critical for enhancing the efficacy of drug delivery systems. It is well-established that F127 tends to self-assemble into spherical aggregates in dilute solutions. This size range is optimal because nanoparticles of this dimension demonstrate favorable traits, such as increased cellular uptake, extended circulation times in the bloodstream, and improved biodistribution. The potential measurements were found to be near zero for both nGF0 and nGF3, signifying minimal electrostatic repulsion among particles, which suggests that the stability of the system remained largely unaffected.
3.3. Morphological Characterization of the Nanogels
The SEM technique surged as an indispensable tool for unraveling the intricate landscapes of nano and microstructured formulations. This technique, well-known for its high-resolution imaging capabilities, is crucial in characterizing materials at scales that are often significant in pharmaceutical formulations for a comprehensive understanding of their properties and potential applications. SEM analysis allows examining the surface and cross-sectional morphology of the freeze-dried nGF0 and nGF3 formulations. The SEM micrographs of nGF0 (Figure 3) show that the F127 and 974P polymer blend has a morphological pattern consisting of the porous nature of the matrix with interconnected channel-like structures characteristic of the cross-linked arrangement of 974P polymer chains, as a result of intermolecular hydrogen bonding. SEM images also allow us to observe that a non-uniform surface layer covers the internal porous regions (Figure 3B and Figure 3C). These morphological characteristics can help explain the properties of nGF0. The porous distribution can be filled by the liquid phase, causing the viscosity of nGF0 to be high due to strong hydrogen bonds with the water.
However, the addition of 1% EOPb at nGF0 significantly alters the morphology of nanoformulation. The SEM micrographs of nGF3 show well-defined planar regions with porous absence in all analyzed materials (Figure 4). As observed by FTIR analysis, the strong intermolecular interaction between EOPb and PEO polymer chains prevents the formation of pores during the freeze-dried process. Furthermore, the cross-sectional morphology of the nGF3 shows thick planes organized in layers (Figure 5). These morphologic characteristics support the physical properties of nGF3. The strong interaction polymer-EOPb can help explain its high viscosity, and the well-defined structural organization in layers allows for easy movement of the planes, reflecting macroscopically in a material with soft texture and high spreadability.
AFM analyses were employed to obtain morphological details of the nGF0 and nGF3 formulations. AFM provided high-resolution images of the gel structures at the nanoscale, offering insights into the particle size, shape, and surface characteristics such as Young’s modulus, and adhesion force. The topographic maps presented in Figure 6 reveal detailed structural characteristics of the nGF0 formulation. Two distinct domains are indicated by the yellow and green arrows Figure 6A. The domain indicated by the yellow arrow corresponds to a relatively flat region with an average height of 5.92 ± 3.00 nm (n = 15), resulting from strong intermolecular interactions between the F127 and 974P polymers. On the other hand, the domain indicated by the green arrows shows relatively spherical geometries, with an average height of 108.74 ± 19.41 nm (n = 19) and an average diameter of 279.09 ± 38.93 nm (n = 20), indicating the formation of F127 micelles Figure 6A and Figure 6B.
As observed through FTIR, the F127 micelles are stabilized by cross-linked hydrogen bonds with the 974P chains. The presence of these distinct domains suggests the contribution of Van Der Waals forces during the formation of the F127/974P polymer blend, leading to the formation of a highly stable structural network, with height values and geometries consistent with the expected characteristics based on the properties of the individual components. The topographic analysis of the nGF0 nanogel also reveals the presence of a third domain, characterized by a micellar cubic structure, as illustrated in Figure 6C. This observation is intriguing as it suggests the formation of a distinct phase coexisting with the spherical and flat domains. Studies previously reported in the literature have demonstrated the polymorphic behavior of amphiphilic block copolymers at concentrations above 5% by mass. Gel phases with diverse structures, including lamellar, normal and reverse hexagonal, normal and reverse bicontinuous cubic, and normal and reverse micellar cubic phases, have been documented in the literature, supporting our findings [39,40,41].
Figure 7A and Figure 7B detail the Young’s modulus values for the domains of the nGF0 system shown in the previous micrographs. The measurements of Young’s modulus provide insights into the mechanical properties of the structural domains. It is observed that both the relatively spherical micellar structures and the cubic forms of F127 predominantly exhibit lower Young’s modulus values. In contrast, the flat domains, resulting from the strong intermolecular interactions between F127 and 974P, display relatively higher values. These findings are consistent with observations that the F127/974P domains form more rigid flat structures, characterized by brighter regions in Young’s modulus maps. Meanwhile, the micellar structures of F127, in the absence of OEPb, are empty, contributing to a greater fluidity and softness of these domains, as evidenced by the darker regions in the maps.
Adhesion force analyses stem from a combination of four distinct interactions between the AFM probe and the sample surface: van der Waals, electrostatic, capillary, and chemical forces [37,38]. It is essential to delineate the individual contributions of each interaction to the overall adhesion phenomenon. Consistency in probe material composition, geometric parameters (such as tip radius and shape), and environmental conditions (including temperature and relative humidity) is imperative to ensure reproducibility and comparability of the analyses. This standardization allows elucidation of how variations in adhesion contrast between samples reflect underlying surface composition heterogeneities. Additionally, the geometric characteristics of the probe, particularly its conical shape, play a significant role in minimizing contact angle and consequently reducing the influence of capillary forces [38]. Systematic investigation of adhesion forces is crucial to gain comprehensive insights into the complex intermolecular interactions that govern the AFM probe-sample interactions, providing additional support for the interpretation that the domains exerting the highest adhesion forces on the AFM probe result from the strong hydrogen bonds between F127 and 974P (Figure 7C and Figure 7D). In contrast, the central regions of the F127 micelles result in weak adhesion forces, as a response to the dipole and induced dipole interactions (Keesom and Debye forces) between the PPO hydrophobic chains and the AFM probe. Additionally, the micellar structures exhibit moderately clear outlines with median adhesion force values, corroborating the interpretation that these structures are stabilized by hydrogen bonds cross-linked with the planar domains of F127/974P.
The AFM micrographs acquired for the nanogel nGF3 reveal a distinct morphological pattern compared to the nGF0 material, clearly attributed to the incorporation of 1% (w/w) of EOPb. The topographic maps of nGF3 (Figure 8A and Figure 8C) indicate that the regions marked with red arrows (Figure 8A and Figure 8B) are probably associated with the EO molecules incorporated on the surface of the nanogel, forming well-defined and organized layered structures with an average height of 7.39 ± 0.79 nm (n = 17). The absence of spherical and cubic geometry domains in the nGF3 material suggests a significant restructuring of the micellar architecture driven by the incorporation of EOPb(indicated by the green arrows in Figure 8C and Figure 8D). According to FTIR analyzes, the incorporation of EOPb into the nGF0 matrix significantly increases the intensity and energy of the band associated with the C—H vibrational modes, suggesting a strong interaction between EOPb molecules and the PPO chains of the F127 micelles, as well as the pores formed by the intermolecular interactions F127–974P. Small areas with an average height of 1.37 ± 0.21 nm (n = 20) and an average size of 40.58 ± 7.98 nm (n = 20) are observed, which are relatively smaller than those calculated for the micellar domains of nGF0.
Young’s modulus analyses for the nanogel nGF3 support the elucidation of its mechanical properties. Regions with higher concentrations of EOPb reveal lower Young’s modulus values compared to regions with lower concentrations, confirming the emollient characteristic of EOPb (Figure 9A and Figure 9B). The adhesion force maps shown in 8A and 8B corroborate these characteristics, as regions with higher concentrations of EOPb exhibit lower adhesion force values due to weaker Van der Waals interactions (Figure 9C and Figure 9D).
3.4. In Vitro Leishmanicidal Activity of Nanogel
The results of our in vitro investigation into the leishmanicidal activity of the nanogel formulations are presented in Figure 10. Initially, the empty nanogel (nGF0) was evaluated to assess the toxicity of the nanoformulation excipients in the leishmanicidal response, which did not exhibit any antileishmanial activity against promastigotes ofLLa. This result confirms the inert nature of the vehicle (i.e., only the formulation excipients), as it does not induce any leishmanicidal activity. In contrast, nGF3 exhibited substantial antileishmanial activity across all concentrations tested at both 24 and 48 h. Notably, at the highest concentration (2.2 to 0.28 mg/mL in EOPb), nGF3 achieved a promastigote mortality rate exceeding 80% at 24 h, with an increase to over 90% at 48 h. These findings suggest a time- and concentration-dependent efficacy, with nGF3 demonstrating significant potency against LLa. At lower concentration, nGF3 still maintained a notable level of activity, achieving mortality rates of 46% and 68% at 24 and 48 h, respectively. Thus, it is evident that the cytotoxic potential of the nGF3 nanogel is attributed to the OEPb composition within the gel matrix. The pronounced antileishmanial effects observed for nGF3 highlight its potential as a topical treatment option for cutaneous leishmaniasis. Given the high rates of promastigote mortality achieved, particularly at prolonged exposure, nGF3 presents itself as a promising candidate for further investigation. This efficacy supports the possibility of developing an effective localized therapy that may reduce systemic exposure and associated toxicity. Further studies to elucidate the mechanism of action, along with in vivo testing, are warranted to advance the development of nGF3 as a therapeutic agent for cutaneous leishmaniasis treatment.
3.5. In Vivo Evaluation of the Anti-Inflammatory Potential of Nanogels
The results of the anti-inflammatory activity of the nanogels are presented in Figure 11. Upon analysis, it was observed that treatments with the nanogels, namely nGF1, nGF2, and nGF3, exhibited peak efficacy at 2 h post-inoculation of the inflammatory agent, resulting in edema reductions of 44.1 ± 5.8%, 62.7 ± 4.4%, and 54.4 ± 6.7%, respectively. These effects demonstrated statistically significant anti-inflammatory potential comparable to that of the standard treatment, diclofenac sodium gel at 10 mg/g (65.5 ± 5.5%). However, this anti-inflammatory effect was not sustained in subsequent time points for any of the formulations or the standard drug. Notably, the graphical data indicate a relatively diminished effect for nGF1 compared to the other groups, which included diclofenac sodium, nGF2, and nGF3. Additionally, treatment with nGF0 exhibited low edema inhibition at the 2 h mark (14.9 ± 4.7%), with a significant statistical difference observed between this group and the other treatments (p < 0.001). Collectively, these findings suggest that the nanogels at the three concentrations analyzed possess anti-inflammatory action that is independent of dosage; however, further studies are warranted, particularly for nGF2 and nGF3. The transient nature of the observed effects indicates that while these formulations demonstrate promise, their efficacy may be limited in duration, highlighting the need for optimization in formulation or delivery methods. Future investigations should explore the underlying mechanisms of action, as well as the potential for sustained release or combination therapies that could enhance their anti-inflammatory properties over extended periods.
4. Conclusions
This study demonstrated that the ecofriendly nanogels loaded with EOPb exhibit significant potential as multifunctional therapeutic systems for the treatment of cutaneous leishmaniasis. The nanoformulations displayed high leishmanicidal efficacy in vitro, achieving mortality rates above 90% within 48 h, as well as notable anti-inflammatory properties in vivo, with a maximum edema reduction of 62.7%. Spectroscopic and morphological characterizations confirmed the chemical stability and structural integrity of the nanogels, preserving the bioactive composition of EOPb after the nanoencapsulation process. Future studies should explore the mechanical aspects underlying the leishmanicidal and anti-inflammatory effects of the nanogels, as well as conduct clinical trials and field tests to validate their effectiveness in real-world settings. Furthermore, investigating the broader therapeutic applications of these nanogels could significantly contribute to sustainable and targeted strategies for combating leishmaniasis and other neglected diseases. The integration of nanotechnological systems like nGF3 underscores the importance of Amazonian natural products in pharmaceutical innovation, advancing environmentally responsible and effective solutions to global health challenges..
Author Contributions
Conceptualization, data curation, methodology, investigation, writing-original draft, writing—review and editing, E.M.M.; conceptualization, data curation, methodology, formal analysis, L.G.S.A, L.M.R.A, E.R.D.R., R.M.R., R.C.C., G.C.S.M., D.S.S.L.L-N., M.J.S.G., M.V.C.L., M.P.S. and E.V.C.; conceptualization, data curation, methodology, investigation, writing-original draft, writing—review and editing, visualization, supervision, project administration, R.S.G. All authors have read and agreed to the published version of the manuscript.
Funding
This research was funded by the Postgraduate Program in Chemistry (PPGQuim), Federal University of Maranhão (UFMA), São Luís, MA, Brazil. The authors thank the Coordination for the Improvement of Higher Education Personnel (CAPES) and the National Council for Scientific and Technological Development (CNPq) for their financial support through the Master’s scholarships provided to the students of the PPGQuim (grant: PVCET3179-2022). They also thank the Foundation for the Support of Research and Scientific and Technological Development of Maranhão (FAPEMA) for funding the research initiation grant for the Institutional Scientific Initiation Scholarship Program (PIBIC/AGEUFMA Grant: PVCET3179-2022). E.V.C. thanks the National Council for Scientific and Technological Development (CNPq) and the National Institutes of Science and Technology (INCT/CNPq grant: 465357/2014-8) for their financial support.
Institutional Review Board Statement
The study was conducted in accordance with the Declaration of Helsinki, and approved by the Ethics Committee of CEP-UFMA (Research Ethics Committee of AGEUFMA), under approval code 23115.038817/2024-44, on 1 May 2024.
Informed Consent Statement
Not applicable.
Data Availability Statement
Not applicable.
Acknowledgments
The authors would like to extend their special thanks to IMCD Brazil (São Paulo, SP, Brazil) for kindly providing the 974P NF polymer used in this study. The author, E.V.C., also thanks Central Analítica—Centro de Apoio Multidisciplinar—Universidade Federal do Amazonas (CA/CAM/UFAM) for supporting the NMR analysis.
Conflicts of Interest
The data presented in this study are available in this article. Conflicts of Interest: The authors declare no conflicts of interest.
References
- Peixoto, C.O. Health, science and development: the emergence of American cutaneous leishmaniasis as a medical and public health challenge in Amazonas state, Brazil. Hist. Cienc. Saude Manguinhos 2020, 27, 741–761. [Google Scholar] [CrossRef] [PubMed]
- Kato, H. Epidemiology of Leishmaniasis: Risk factors for its pathology and infection. Parasitol. Int. 2025, 105, 102999. [Google Scholar] [CrossRef] [PubMed]
- de Vries, H.J.C.; Schallig, H.D. Cutaneous Leishmaniasis: A 2022 Updated Narrative Review into Diagnosis and Management Developments. Am. J. Clin. Dermatol. 2022, 23, 823–840. [Google Scholar] [CrossRef]
- Sanz Sánchez, C.I.; Rodríguez Pastor, E.; Cabanás Vega, R. Lingual Mucocutaneous Leishmaniasis. Acta Otorrinolaringol. Esp. (Engl. Ed.) 2021, 72, 403–404. [Google Scholar] [CrossRef]
- Safavi, M.; Eshaghi, H.; Hajihassani, Z. Visceral Leishmaniasis: Kala-azar. Diagn. Cytopathol. 2021, 49, 446–448. [Google Scholar] [CrossRef]
- Cosma, C.; Maia, C.; Khan, N.; Infantino, M.; Del Riccio, M. Leishmaniasis in Humans and Animals: A One Health Approach for Surveillance, Prevention and Control in a Changing World. Trop. Med. Infect. Dis. 2024, 9. [Google Scholar] [CrossRef] [PubMed]
- World Health Organization (WHO). Leishmaniasis: Epidemiological Update and Strategies for Control. WHO Technical Report Series 2023, 1025, 1–50. [Google Scholar]
- Burza, S.; Croft, S.L.; Boelaert, M. Leishmaniasis. Lancet 2018, 392, 951–970. [Google Scholar] [CrossRef] [PubMed]
- Alvar, J.; Vélez, I.D.; Bern, C.; Herrero, M.; Desjeux, P.; Cano, J.; Jannin, J.; den Boer, M. Leishmaniasis Worldwide and Global Estimates of Its Incidence. PLoS One 2012, 7. [Google Scholar] [CrossRef] [PubMed]
- Olivier, M.; Sacks, D. New Insights into the Immunopathology and Treatment of Leishmaniasis. Nature Reviews Clinical Oncology 2021, 18, 518–535. [Google Scholar]
- Ponte-Sucre, A.; Gamarro, F.; Dujardin, J.C.; Barrett, M.P.; López-Vélez, R.; García-Hernández, R.; Pountain, A.W.; Mwenechanya, R.; Papadopoulou, B. Drug resistance and treatment failure in leishmaniasis: A 21st century challenge. PLoS Negl. Trop. Dis. 2017, 11. [Google Scholar] [CrossRef] [PubMed]
- World Health Organization (WHO). The case for investing in public health. WHO Regional Office for Europe, Available at: https://www.euro.who.int/en/health-topics. 2013.
- Afonso, R.C.; Yien, R.M.K.; de Siqueira, L.B.O.; Simas, N.K.; Dos Santos Matos, A.P.; Ricci-Júnior, E. Promising natural products for the treatment of cutaneous leishmaniasis: A review of in vitro and in vivo studies. Exp. Parasitol. 2023, 251, 108554. [Google Scholar] [CrossRef]
- Cortes, S.; Bruno de Sousa, C.; Morais, T.; Lago, J.; Campino, L. Potential of the natural products against leishmaniasis in Old World - a review of in-vitro studies. Pathog. Glob. Health 2020, 114, 170–182. [Google Scholar] [CrossRef] [PubMed]
- Essid, R.; Ayed, A.; Djebali, K.; Saad, H.; Srasra, M.; Othmani, Y.; Fares, N.; Jallouli, S.; Abid, I.; Alothman, M.R.; Limam, F.; Tabbene, O. Anti-Candida and Anti-Leishmanial Activities of Encapsulated Cinnamomum verum Essential Oil in Chitosan Nanoparticles. Molecules 2023, 28. [Google Scholar] [CrossRef]
- da Costa, C.S.; Marques, E.M.; do Nascimento, J.R.; Lima, V.A.S.; Santos-Oliveira, R.; Figueredo, A.S.; de Jesus, C.M.; de Souza Nunes, G.C.; Brandão, C.M.; de Jesus, E.T.; Sa, M.C.; Tanaka, A.A.; Braga, G.; Santos, A.C.F.; de Lima, R.B.; Silva, L.A.; Alencar, L.M.R.; da Rocha, C.Q.; Gonçalves, R.S. Design of Liquid Formulation Based on F127-Loaded Natural Dimeric Flavonoids as a New Perspective Treatment for Leishmaniasis. Pharmaceutics 2024, 16. [Google Scholar] [CrossRef]
- de Oliveira, M.C.; Balbinot, R.B.; Villa Nova, M.; Gonçalves, R.S.; Bidóia, D.L.; Caetano, W.; Nakamura, C.V.; Bruschi, M.L. Development of Environmentally Responsive Self-Emulsifying System Containing Copaiba Oil-Resin for Leishmaniasis Oral Treatment. Pharmaceutics 2023, 15. [Google Scholar] [CrossRef] [PubMed]
- Li, S.; Cheng, X.; Wang, C. A review on traditional uses, phytochemistry, pharmacology, pharmacokinetics and toxicology of the genus Peganum. J. Ethnopharmacol. 2017, 203, 127–162. [Google Scholar] [CrossRef]
- Parvizi, M.M.; Handjani, F.; Moein, M.; Hatam, G.; Nimrouzi, M.; Hassanzadeh, J.; Hamidizadeh, N.; Khorrami, H.R.; Zarshenas, M.M. Efficacy of cryotherapy plus topical Juniperus excelsa M. Bieb cream versus cryotherapy plus placebo in the treatment of Old World cutaneous leishmaniasis: A triple-blind randomized controlled clinical trial. PLoS Negl. Trop. Dis. 2017, 11. [Google Scholar] [CrossRef]
- Liu, Q.; Huang, H.; Chen, H.; Lin, J.; Wang, Q. Food-Grade Nanoemulsions: Preparation, Stability and Application in Encapsulation of Bioactive Compounds. Molecules 2019, 24. [Google Scholar] [CrossRef] [PubMed]
- Monzote, L.; Herrera, I.; Satyal, P.; Setzer, W.N. In-Vitro Evaluation of 52 Commercially-Available Essential Oils Against Leishmania amazonensis. Molecules 2019, 24, 1248. [Google Scholar] [CrossRef] [PubMed]
- Borges, R.S.; Ortiz, B.L.S.; Pereira, A.C.M.; Keita, H.; Carvalho, J.C.T. Rosmarinus officinalis essential oil: A review of its phytochemistry, anti-inflammatory activity, and mechanisms of action involved. J. Ethnopharmacol. 2019, 229, 29–45. [Google Scholar] [CrossRef] [PubMed]
- Stojanović, N.M.; Ranđelović, P.J.; Simonović, M.; Radić, M.; Todorović, S.; Corrigan, M.; Harkin, A.; Boylan, F. Essential Oil Constituents as Anti-Inflammatory and Neuroprotective Agents: An Insight through Microglia Modulation. Int. J. Mol. Sci. 2024, 25. [Google Scholar] [CrossRef]
- Monzote, L.; Herrera, I.; Satyal, P.; Setzer, W.N. In-Vitro Evaluation of 52 Commercially-Available Essential Oils Against Leishmania amazonensis. Molecules 2019, 24, 1248. [Google Scholar] [CrossRef] [PubMed]
- Ribeiro, F.P.R.A.; Matos, L.F.; Queiroz, D.B.; Botelho, M.A.; Barreto, D.R.S.S.; Lima, R.S.; Ribeiro, L.A.A.; Menezes, I.R.A.; Coutinho, H.D.M.; Almeida, J.R.G.S. Wound Healing Effect of Lippia sidoides and Myracrodruon urundeuva Nanogel. Chem. Biodivers. 2024, 21. [Google Scholar]
- Kowalczyk, A.; Twarowski, B.; Fecka, I.; Tuberoso, C.I.G.; Jerković, I. Thymol as a Component of Chitosan Systems—Several New Applications in Medicine: A Comprehensive Review. Plants (Basel) 2024, 13. [Google Scholar] [CrossRef]
- Esmaeili, F.; Zahmatkeshan, M.; Yousefpoor, Y.; Alipanah, H.; Safari, E.; Osanloo, M. Anti-inflammatory and anti-nociceptive effects of Cinnamon and Clove essential oils nanogels: an in vivo study. BMC Complement. Med. Ther. 2022, 22. [Google Scholar] [CrossRef]
- Nazeam, J.A.; Ragab, G.M.; El-Gazar, A.A.; El-Mancy, S.S.; Jamil, L.; Fayez, S.M. Topical Nano Clove/Thyme Gel against Genetically Identified Clinical Skin Isolates: In Vivo Targeting Behavioral Alteration and IGF-1/pFOXO-1/PPAR γ Cues. Molecules 2021, 26. [Google Scholar] [CrossRef] [PubMed]
- Younas, A.; Asad, M.; Wan, X.; Zhang, Y.; Ma, X.; Wang, L.; Gu, H.; Shang, H.; Zhang, N. Oregano essential oil-infused mucin microneedle patch for the treatment of hypertrophic scar. Int. J. Pharm. 2024, 665, 124748. [Google Scholar] [CrossRef] [PubMed]
- Zarenezhad, E.; Agholi, M.; Ghanbariasad, A.; Ranjbar, A.; Osanloo, M. A nanoemulsion-based nanogel of Citrus limon essential oil with leishmanicidal activity against Leishmania tropica and Leishmania major. J. Parasit. Dis. 2021, 45, 441–448. [Google Scholar] [CrossRef] [PubMed]
- Pereira, S. L.; Marques, A. M.; Sudo, R. T.; Kaplan, M. A.; Zapata-Sudo, G. Vasodilator Activity of the Essential Oil from Aerial Parts of Pectis brevipedunculataand Its Main Constituent Citral in Rat Aorta. Molecules 2013, 18, 3072–3085. [Google Scholar] [CrossRef]
- Santos, S. R.; Melo, M. A.; Cardoso, A. V.; Santos, R. L.; de Sousa, D. P.; Cavalcanti, S. C. Structure-Activity Relationships of Larvicidal Monoterpenes and Derivatives against Aedes aegyptiLinn. Chemosphere 2011, 84, 150–153. [Google Scholar] [CrossRef] [PubMed]
- Limane, B. B.; Ezzine, O.; Dhahri, S.; Ben Jamaa, M. L. Essential Oils from Two Eucalyptus from Tunisia and Their Insecticidal Action on Orgyia trigotephras (Lepidoptera, Lymantriidae). Biol. Res. 2014, 47. [Google Scholar]
- Marques, E.M.; Andrade, L.G.S.; Alencar, L.M.R.; Rates, E.R.D.; Ribeiro, R.M.; Carvalho, R.C.; Nunes, G.C.S.; Lera-Nonose, D.S.S.; Gonçalves, M.J.S.; Lonardoni, M.V.C.; Souza, M.P.; Costa, E.V.; Gonçalves, R.S. Nanotechnological formulation Incorporating Pectis brevipedunculata (Asteraceae) Essential Oil: An Ecofriendly Approach for Leishmanicidal and Anti-Inflammatory Therapy. Journal of Pharmaceutics 2024, 1, 0–16. [Google Scholar]
- Hellwig, J.; Karlsson, R.-M. P.; Wågberg, L.; Pettersson, T. Measuring Elasticity of Wet Cellulose Beads with an AFM Colloidal Probe Using a Linearized DMT Model. Anal. Methods 2017, 9, 4019–4022. [Google Scholar] [CrossRef]
- Derjaguin, B. V.; Muller, V. M.; Toporov, Yu. P. Effect of Contact Deformations on the Adhesion of Particles. J. Colloid Interface Sci. 1975, 53, 314–326. [Google Scholar] [CrossRef]
- Rates, E. R. D.; Almeida, C. D.; Costa, E. P. F.; Farias, R. J. M.; Santos-Oliveira, R.; Alencar, L. M. R. Layer-by-Layer Investigation of Ultrastructures and Biomechanics of Human Cornea. Int. J. Mol. Sci. 2022, 23. [Google Scholar] [CrossRef]
- Dias Rates, E. R.; Almeida, C. D.; de Paula Fiod Costa, E.; Jansen de Mello Farias, R.; Santos-Oliveira, R.; Rebelo Alencar, L. M. Evaluation of Biophysical Alterations in the Epithelial and Endothelial Layer of Patients with Bullous Keratopathy. Exp. Eye Res. 2024, 240, 109791. [Google Scholar] [CrossRef] [PubMed]
- Lee, S. J.; Cho, A.; Kim, K. T. Morphological Diversity from the Solution Self-Assembly of Block Copolymer Blends Containing High Molecular-Weight Hydrophobic Blocks. Macromol. Rapid Commun. 2022, 43. [Google Scholar] [CrossRef]
- Li, X.; Gao, Y.; Boott, C. E.; Winnik, M. A.; Manners, I. Non-Covalent Synthesis of Supermicelles with Complex Architectures Using Spatially Confined Hydrogen-Bonding Interactions. Nat. Commun. 2015, 6, 8127. [Google Scholar] [CrossRef] [PubMed]
- Almgren, M.; Brown, W.; Hvidt, S. Self-Aggregation and Phase Behavior of Poly(ethylene oxide)-Poly(propylene oxide)-Poly(ethylene oxide) Block Copolymers in Aqueous Solution. Colloid Polym. Sci. 1995, 273, 2–15. [Google Scholar]
Figure 1.
Experimental sequence for the OEPb extraction procedure: collection of Pb (A), air drying of the plant material (B), grinding and hydrodistillation under controlled conditions (C), followed by drying and storage of OEPb in a sealed amber vial (D). The nanogel preparation methodology was performed using a low-energy, solvent-free procedure (E). Photograph of the nanogels nGF1–nGF3 (F), along with a schematic representation of the structural organization of the F127/974P polymer blend and OEPb-loading F127 micelles (G).
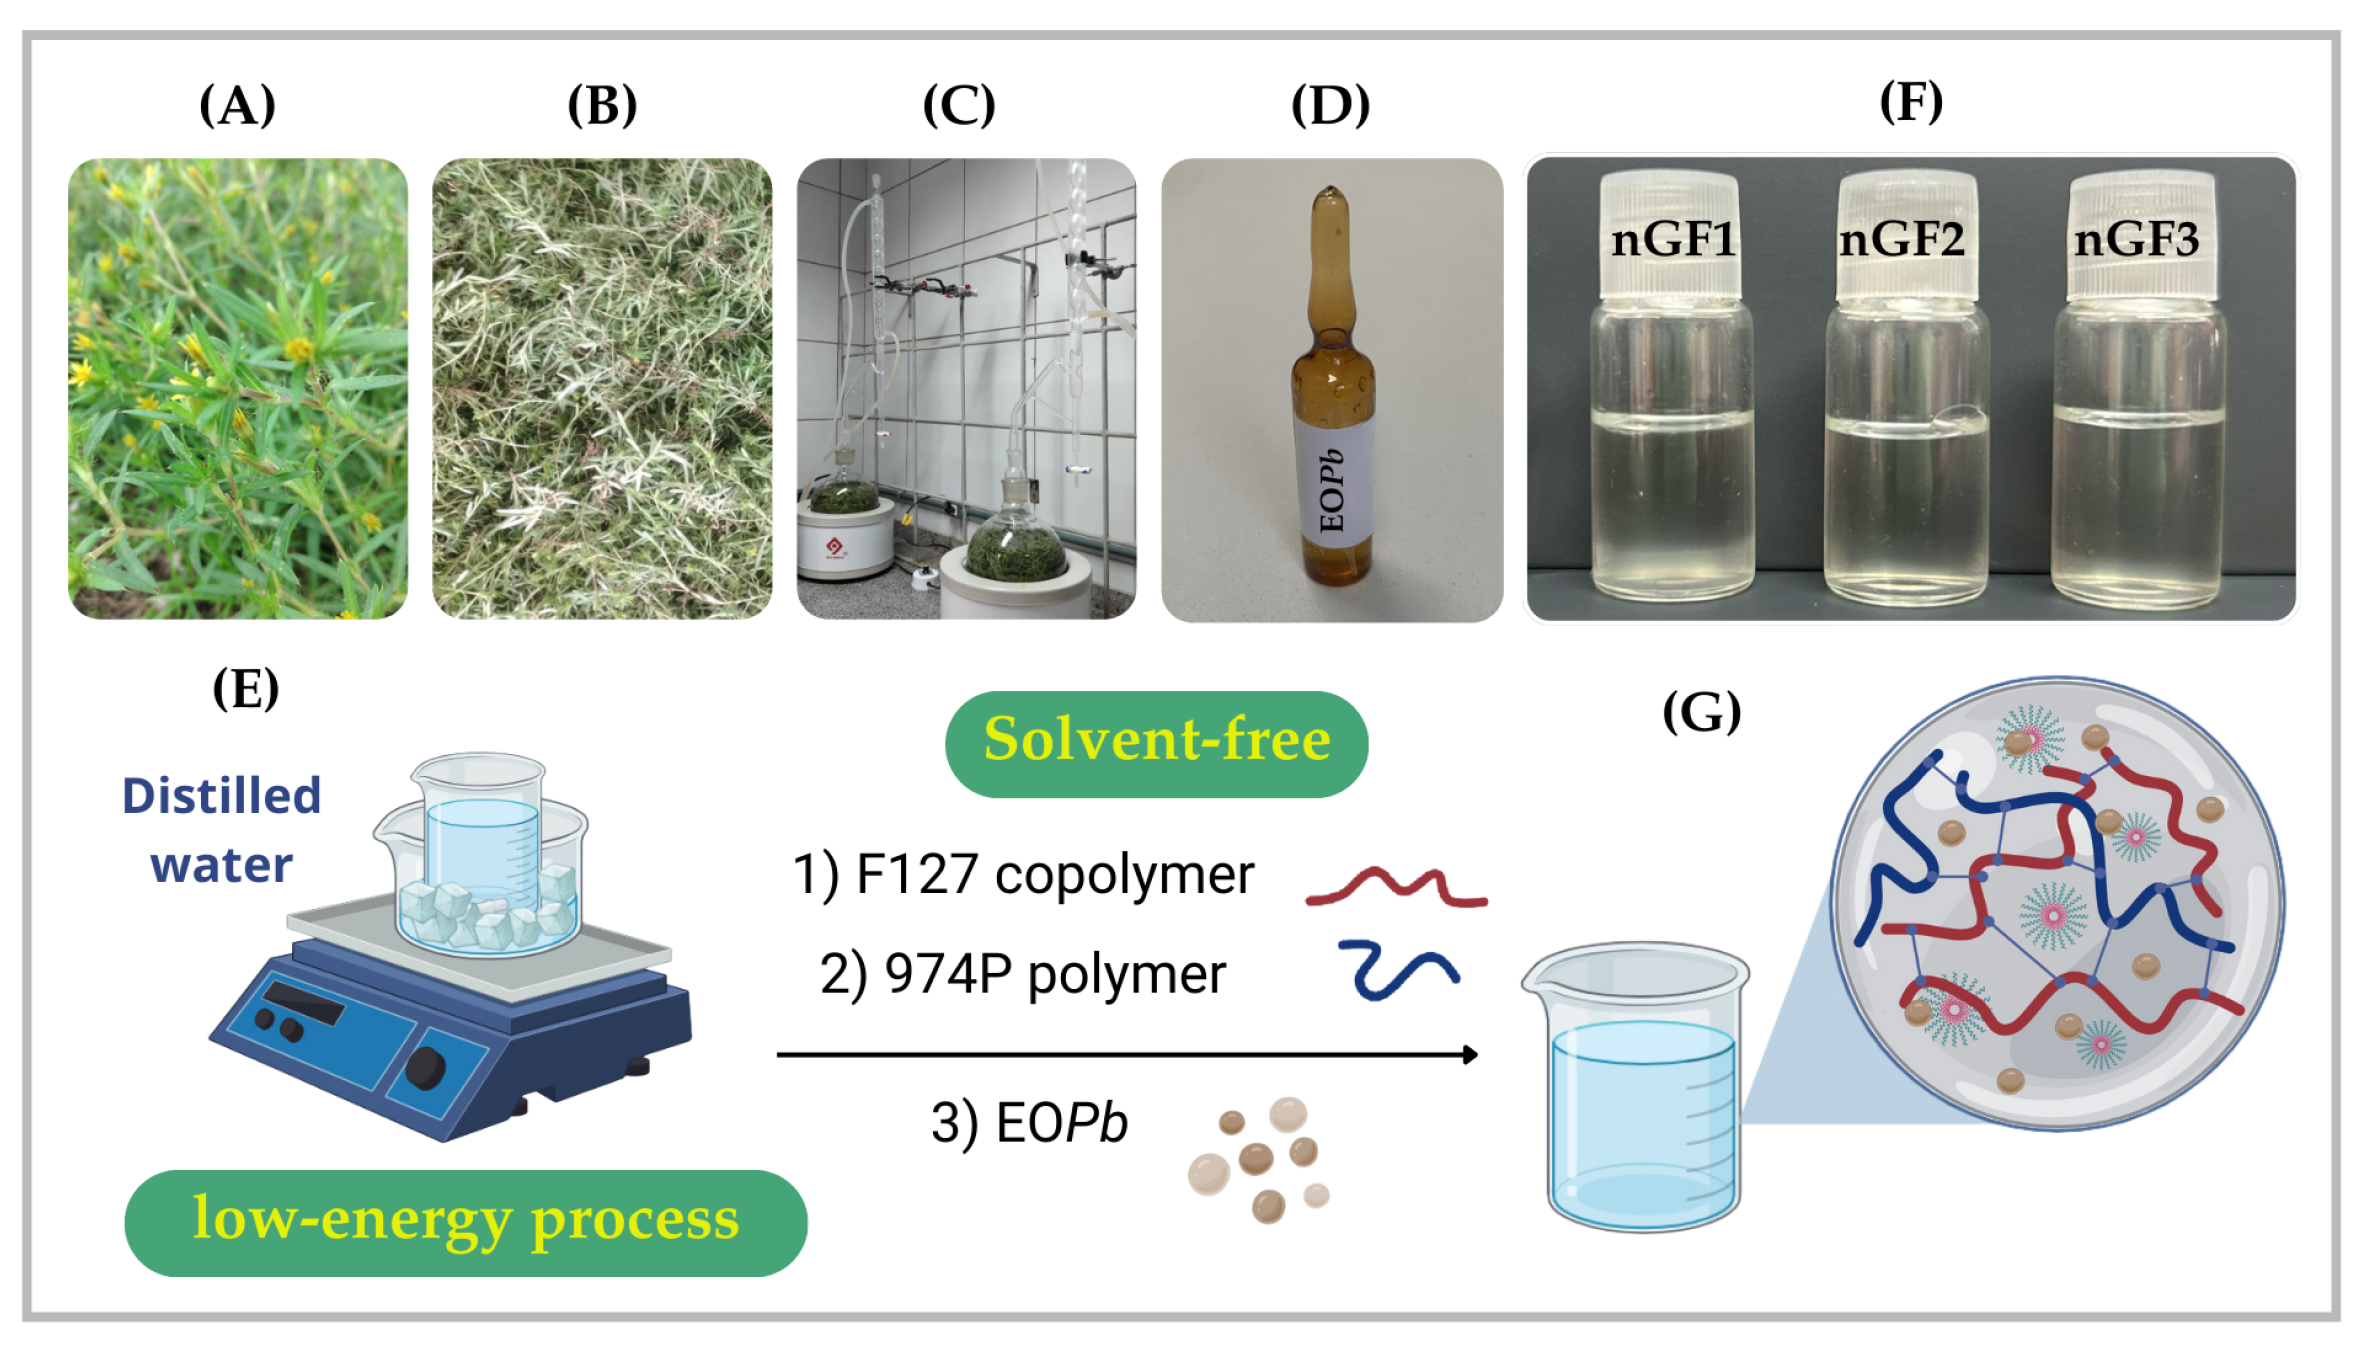
Figure 2.
Experimental sequence for in vivo evaluation of the anti-inflammatory potential of nanogels.
Figure 2.
Experimental sequence for in vivo evaluation of the anti-inflammatory potential of nanogels.
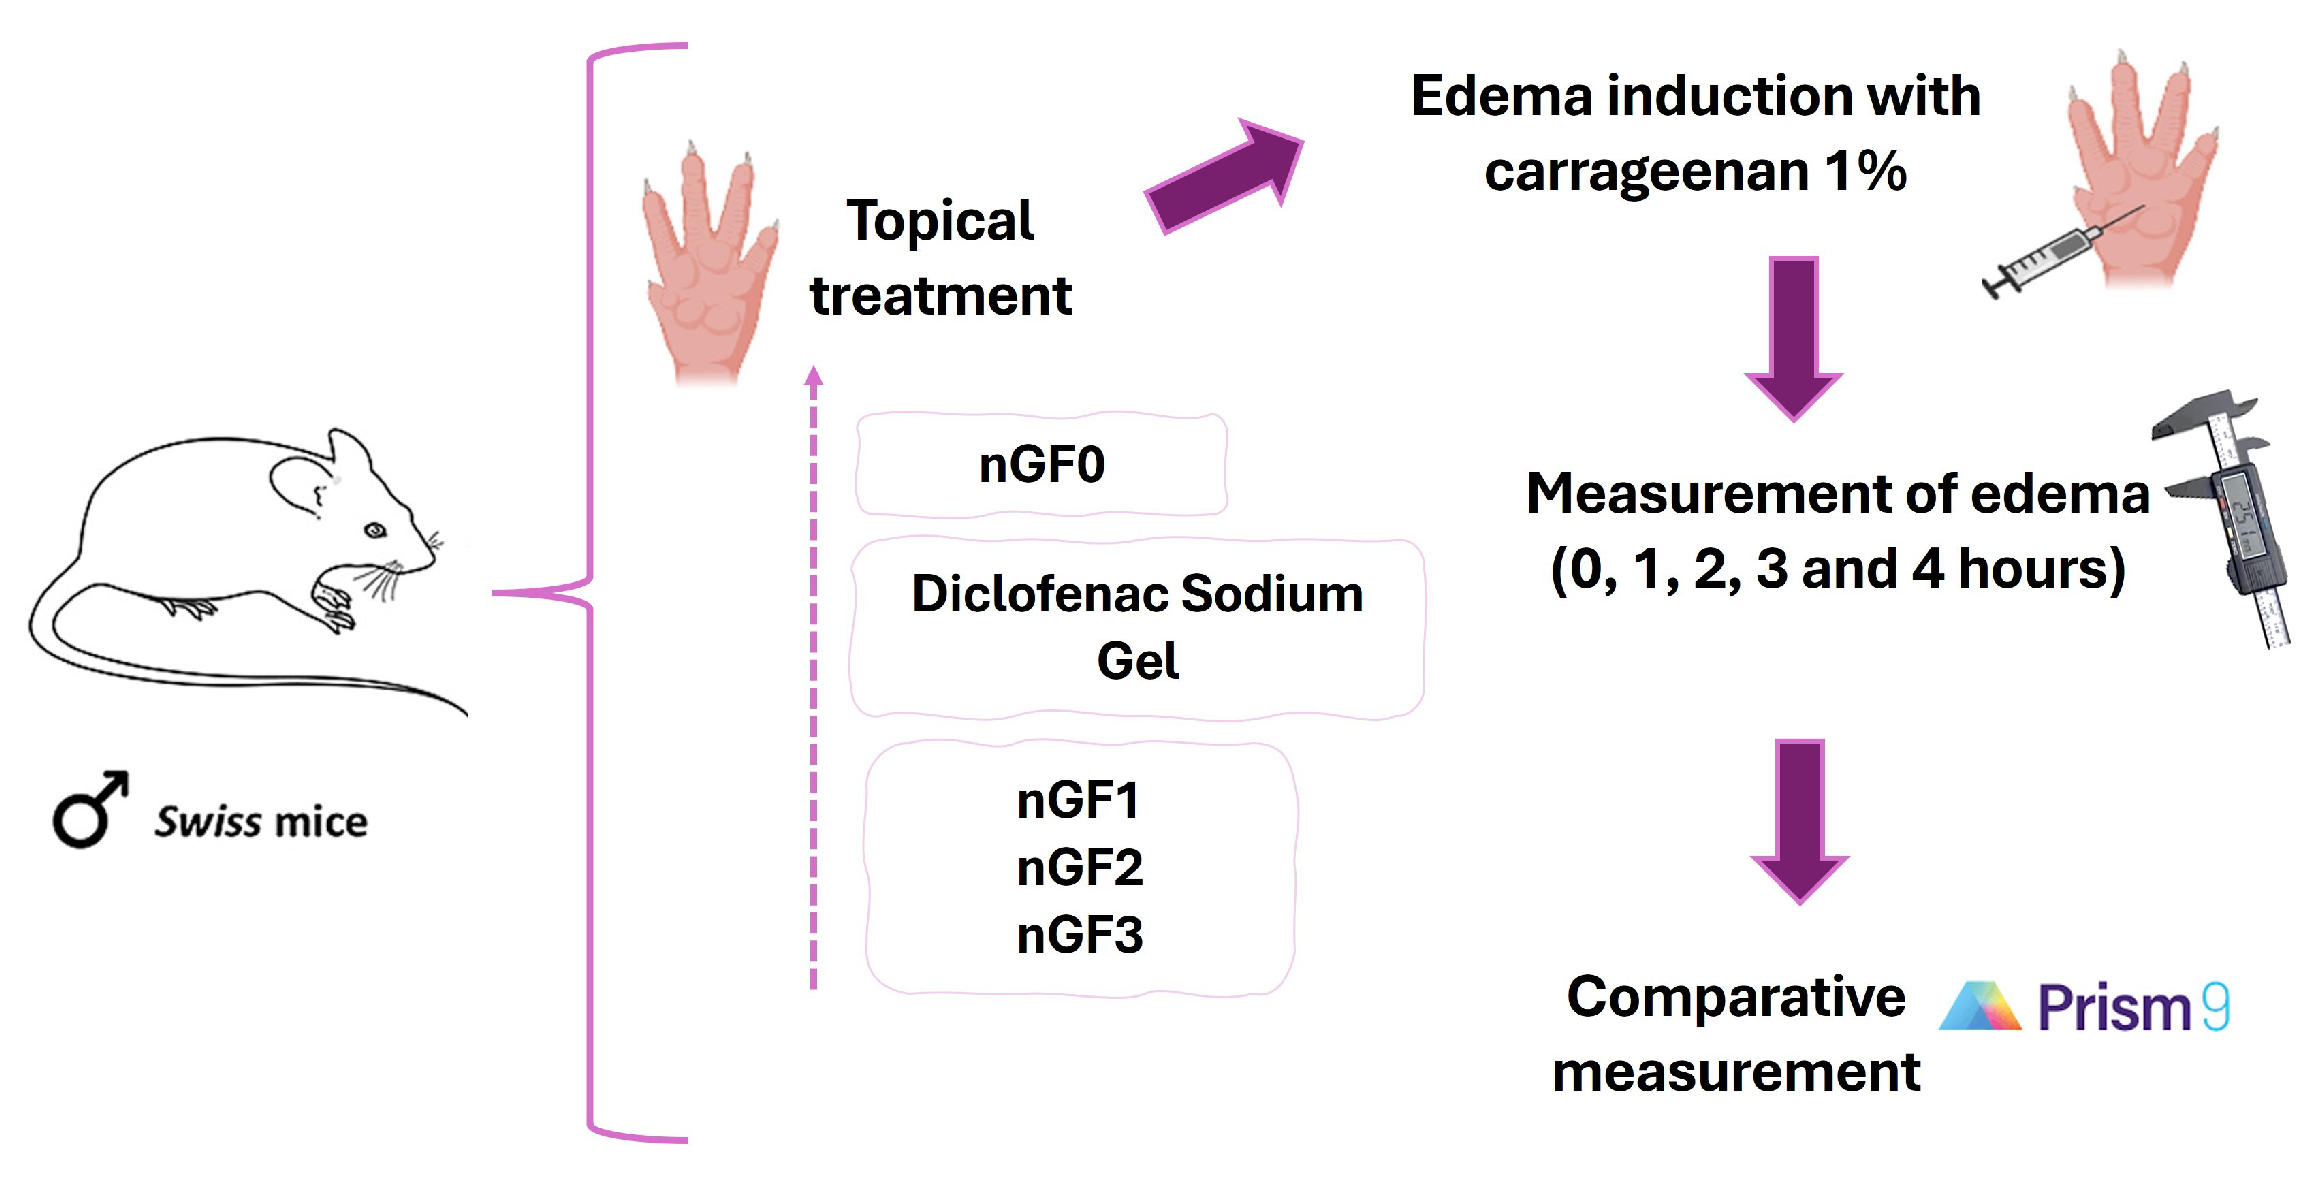
Figure 3.
SEM micrographs of nGF0 at a magnification of 1000x (A), 2000x (B), and (C), and 5000x (D) after the freeze-dried process.
Figure 3.
SEM micrographs of nGF0 at a magnification of 1000x (A), 2000x (B), and (C), and 5000x (D) after the freeze-dried process.
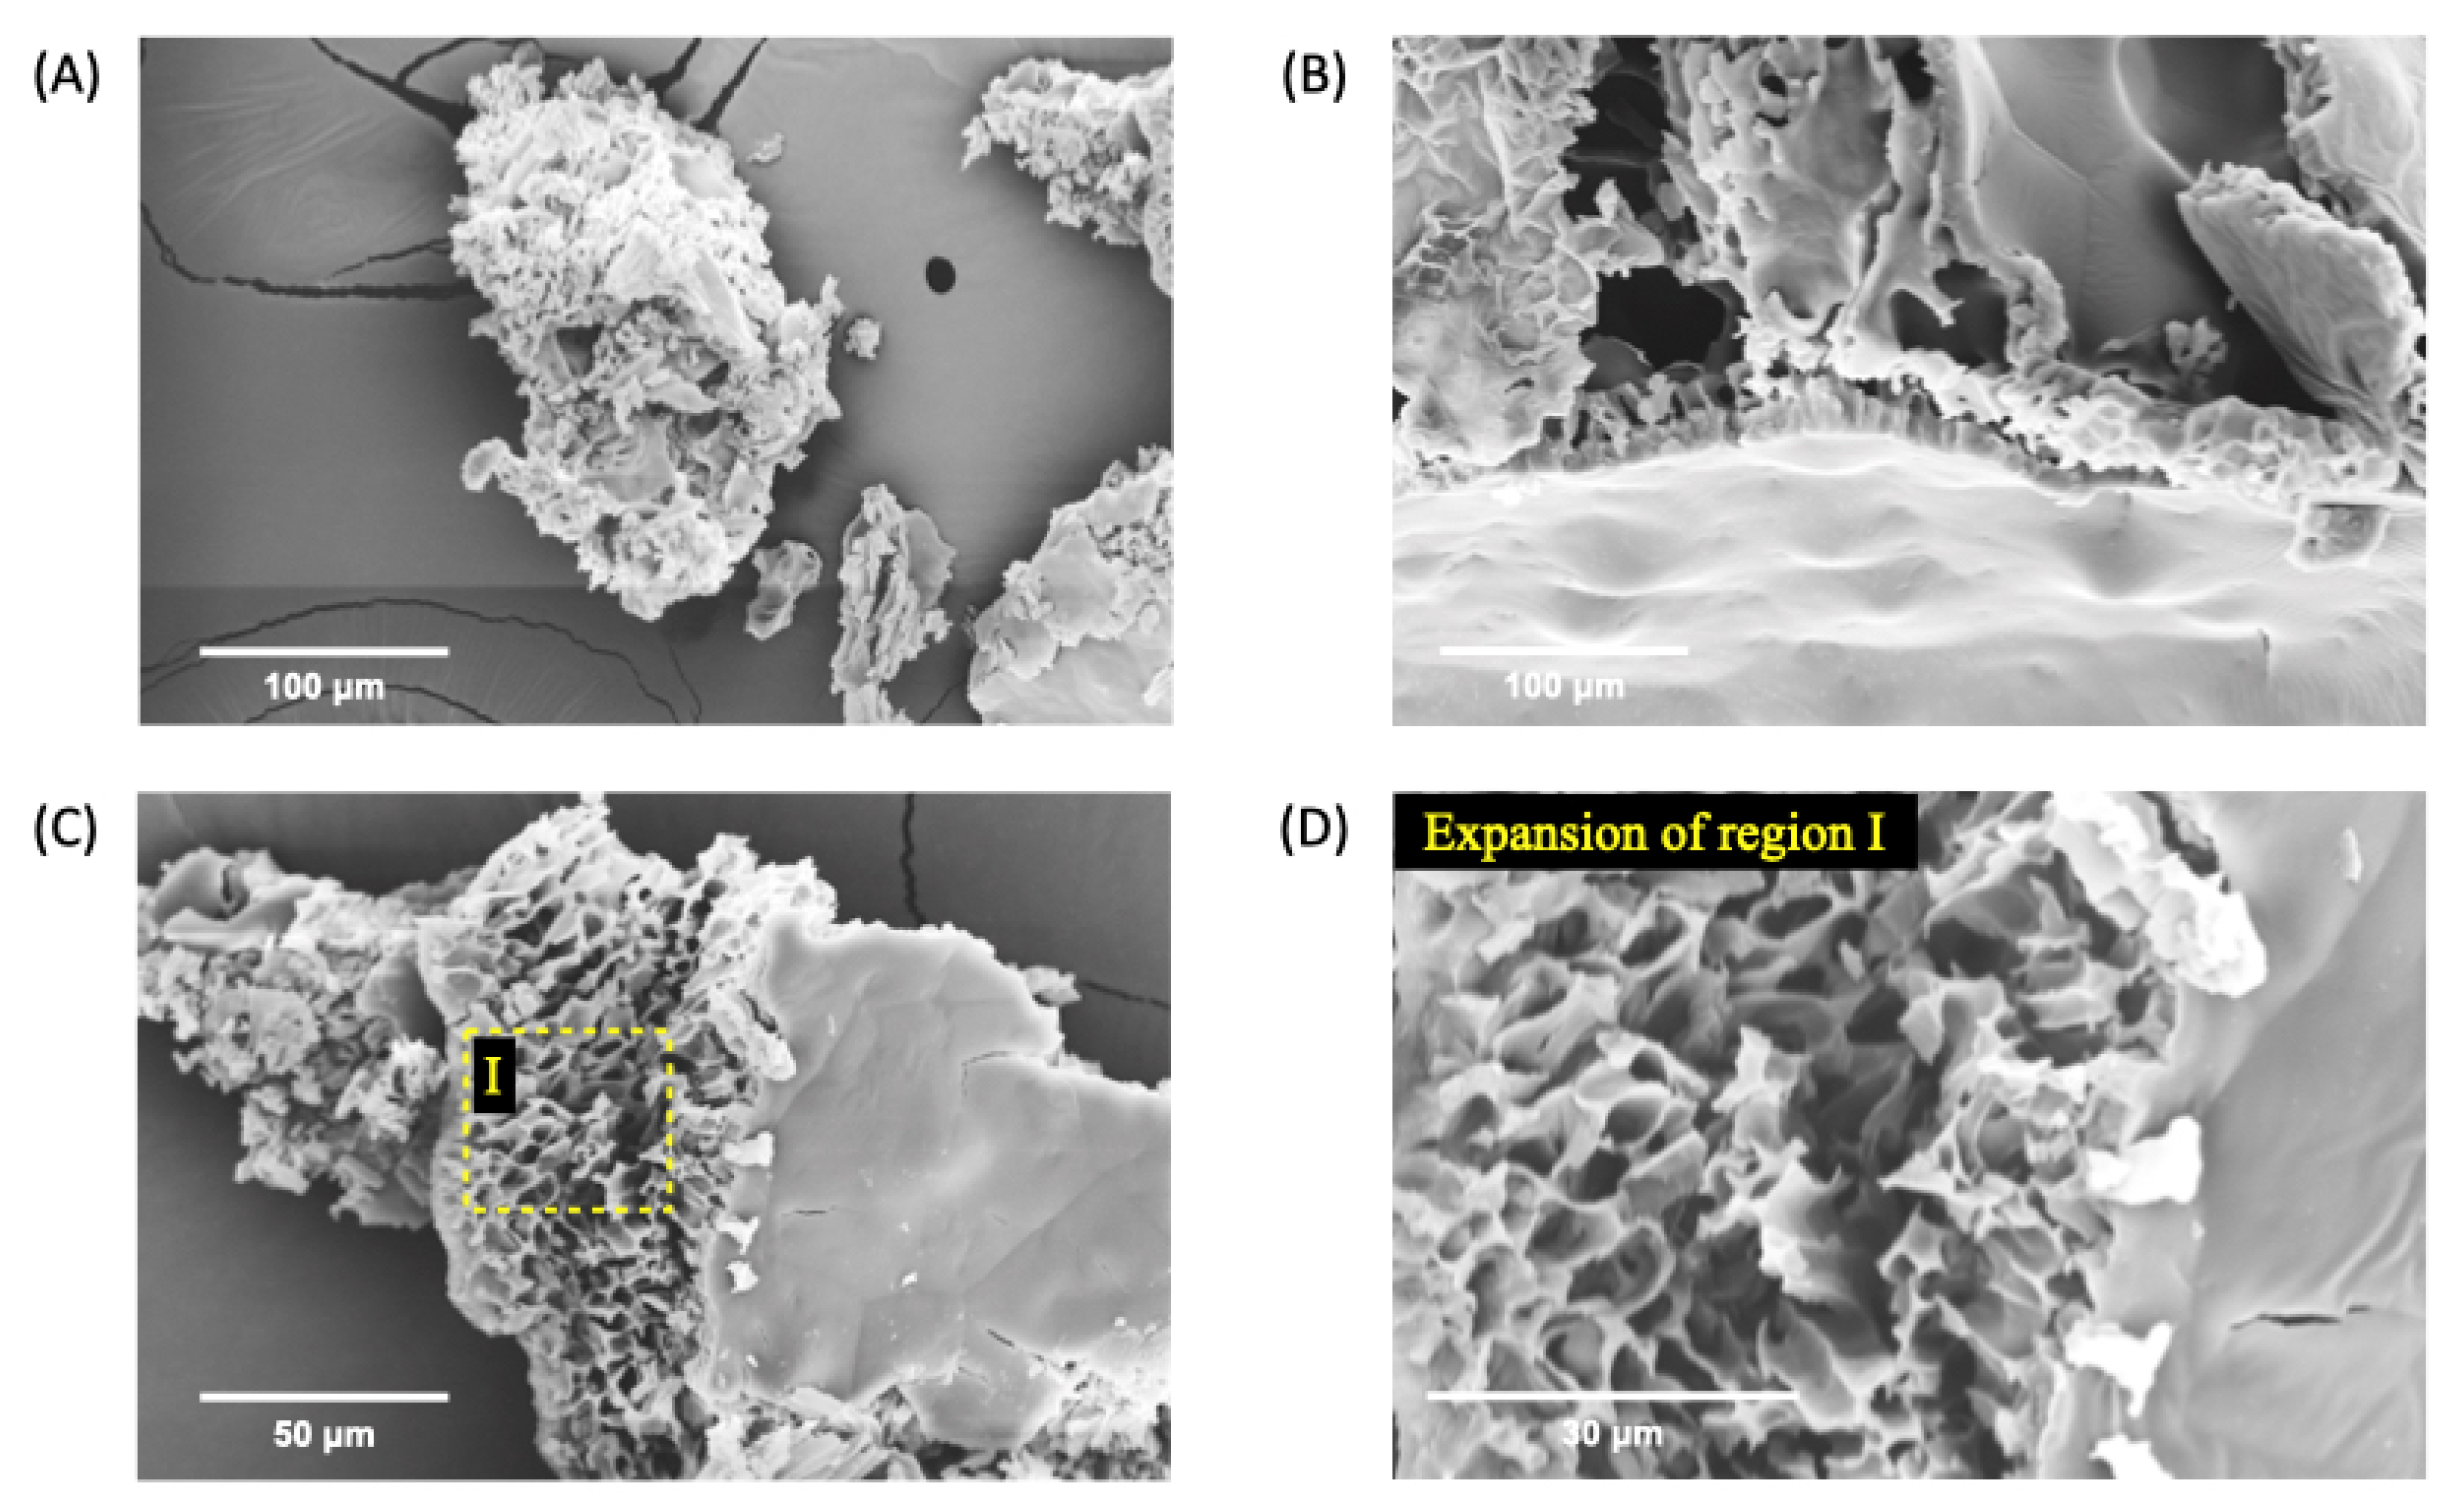
Figure 4.
SEM micrographs of nGF3 at a magnification of 500x (A), 1000x (B), 2000x (C), and 5000x (D) after the freeze-dried process. The SEM micrographs show well-defined planar regions with the absence of pores.
Figure 4.
SEM micrographs of nGF3 at a magnification of 500x (A), 1000x (B), 2000x (C), and 5000x (D) after the freeze-dried process. The SEM micrographs show well-defined planar regions with the absence of pores.
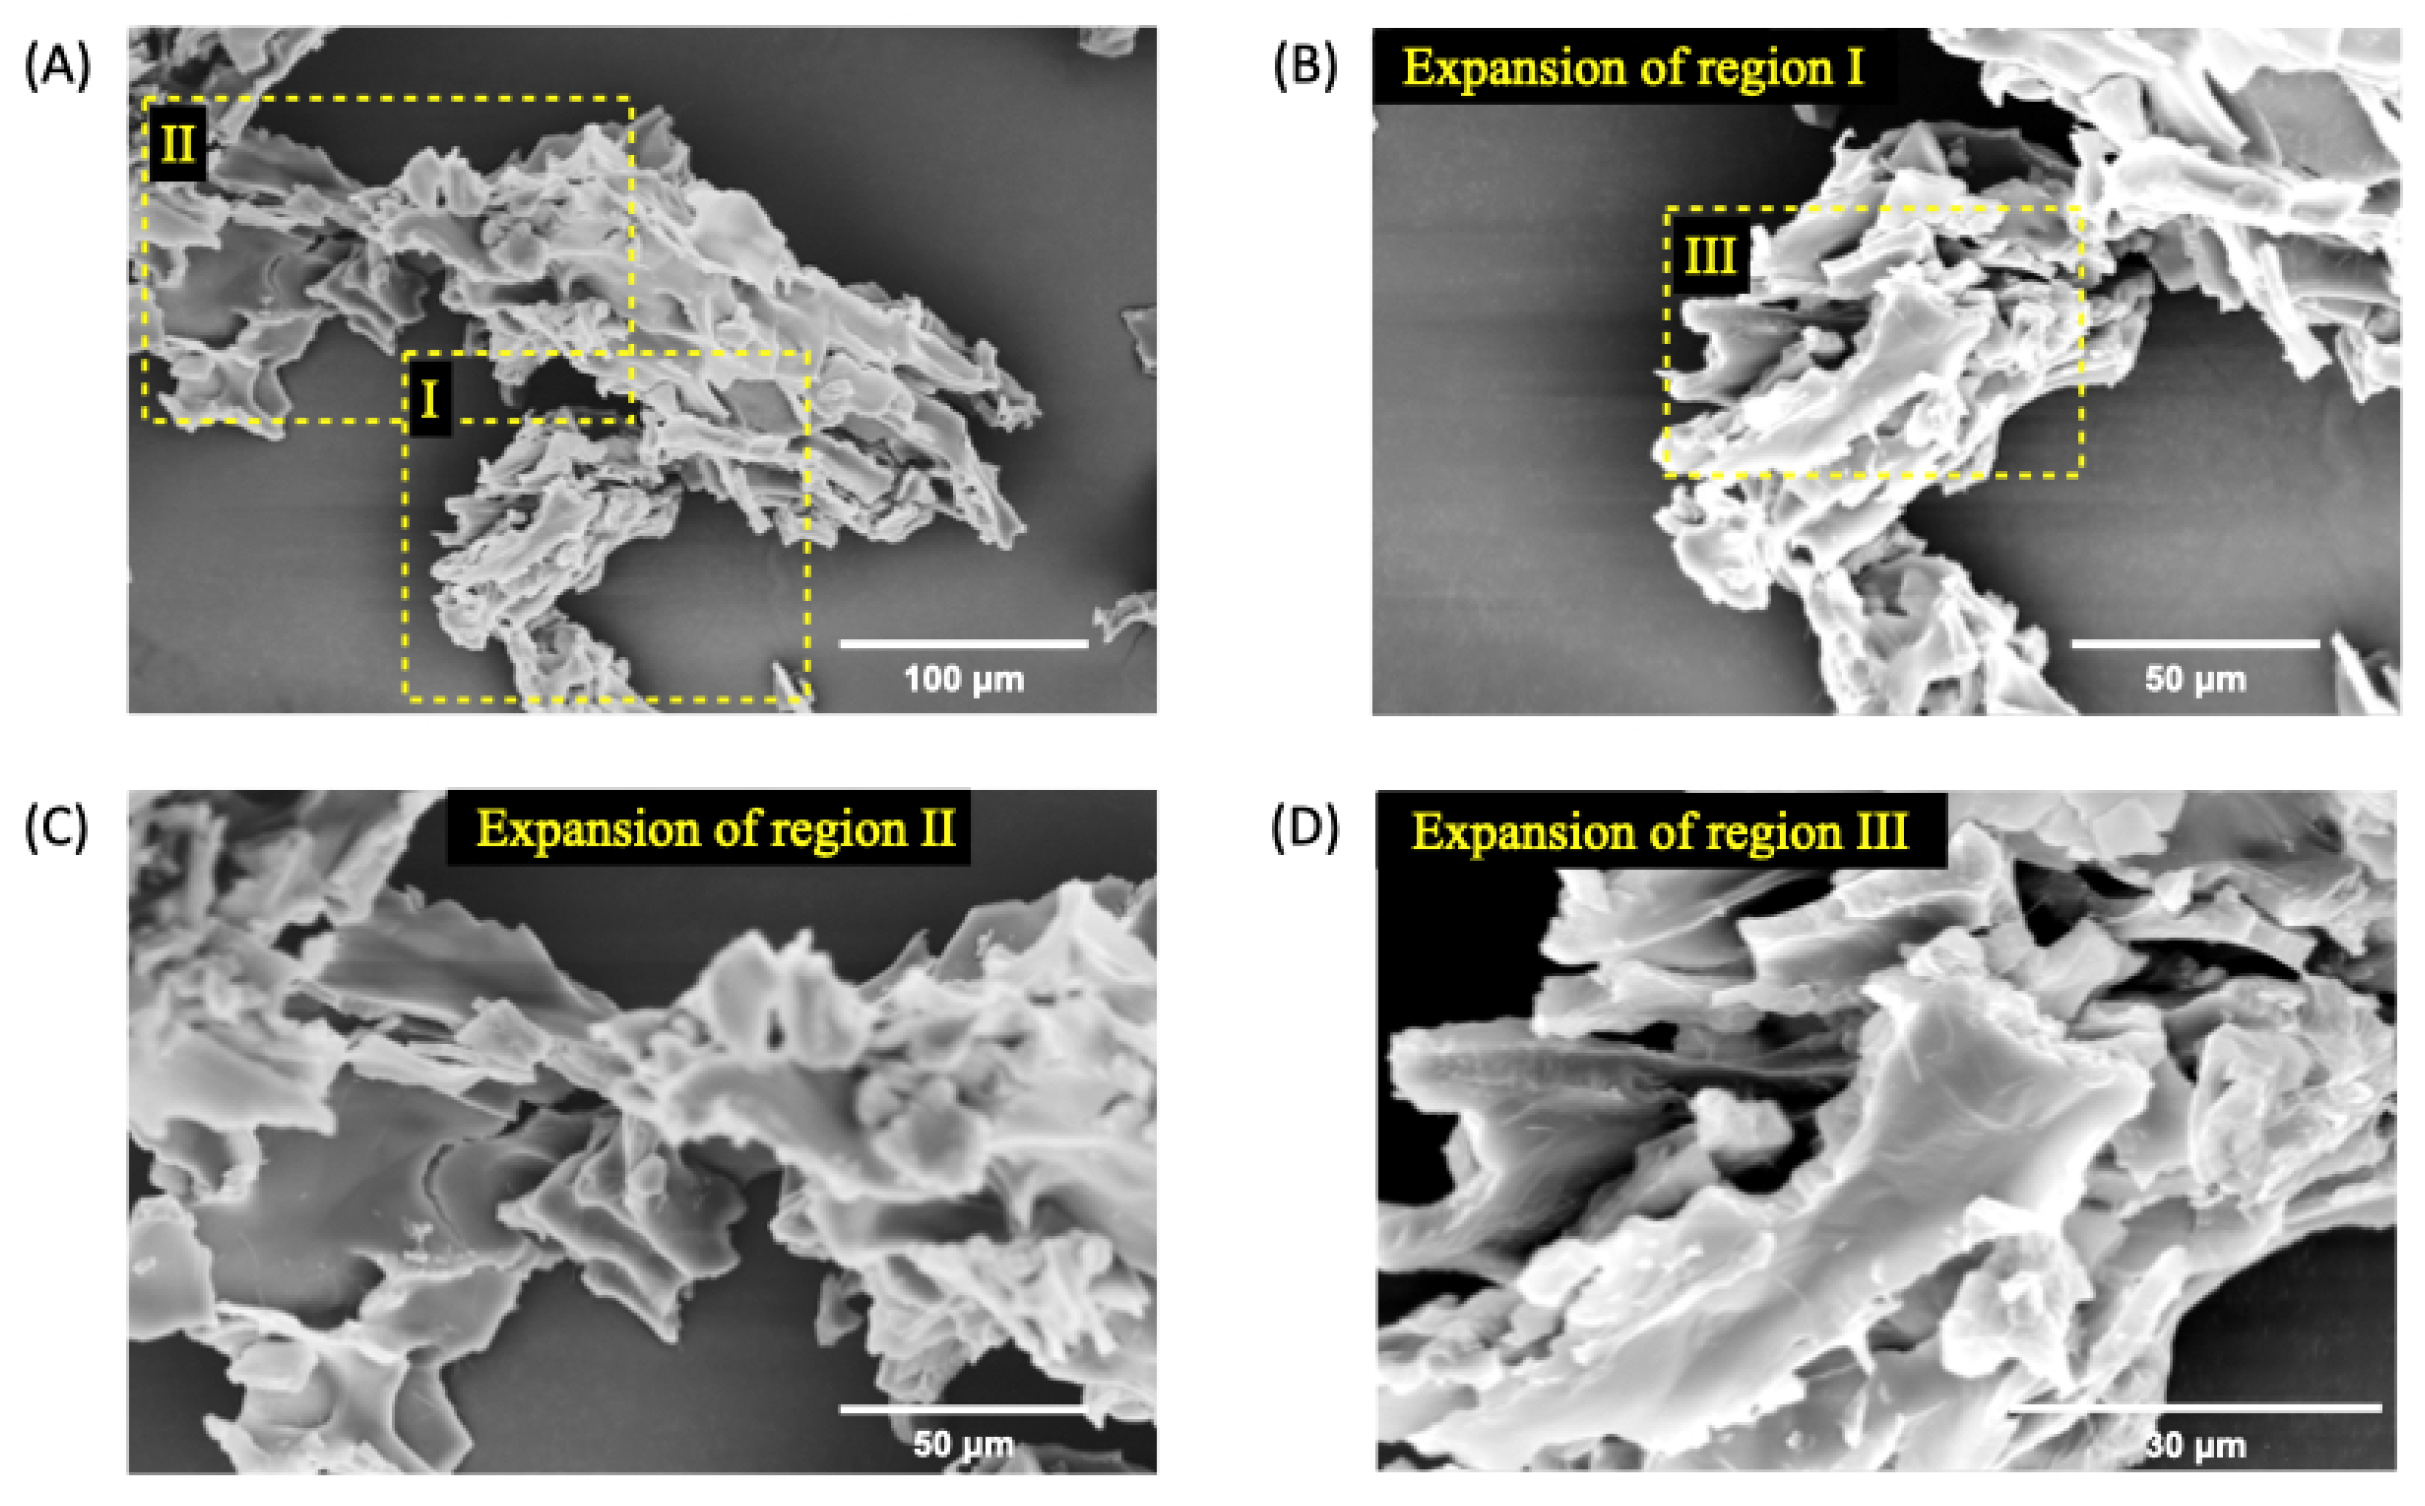
Figure 5.
SEM micrographs of nGF3 at a magnification of 1000x (A), 2000x (B), and (C), and 5000x (D) after the freeze-dried process. The SEM micrographs show thick planes organized in layers.
Figure 5.
SEM micrographs of nGF3 at a magnification of 1000x (A), 2000x (B), and (C), and 5000x (D) after the freeze-dried process. The SEM micrographs show thick planes organized in layers.
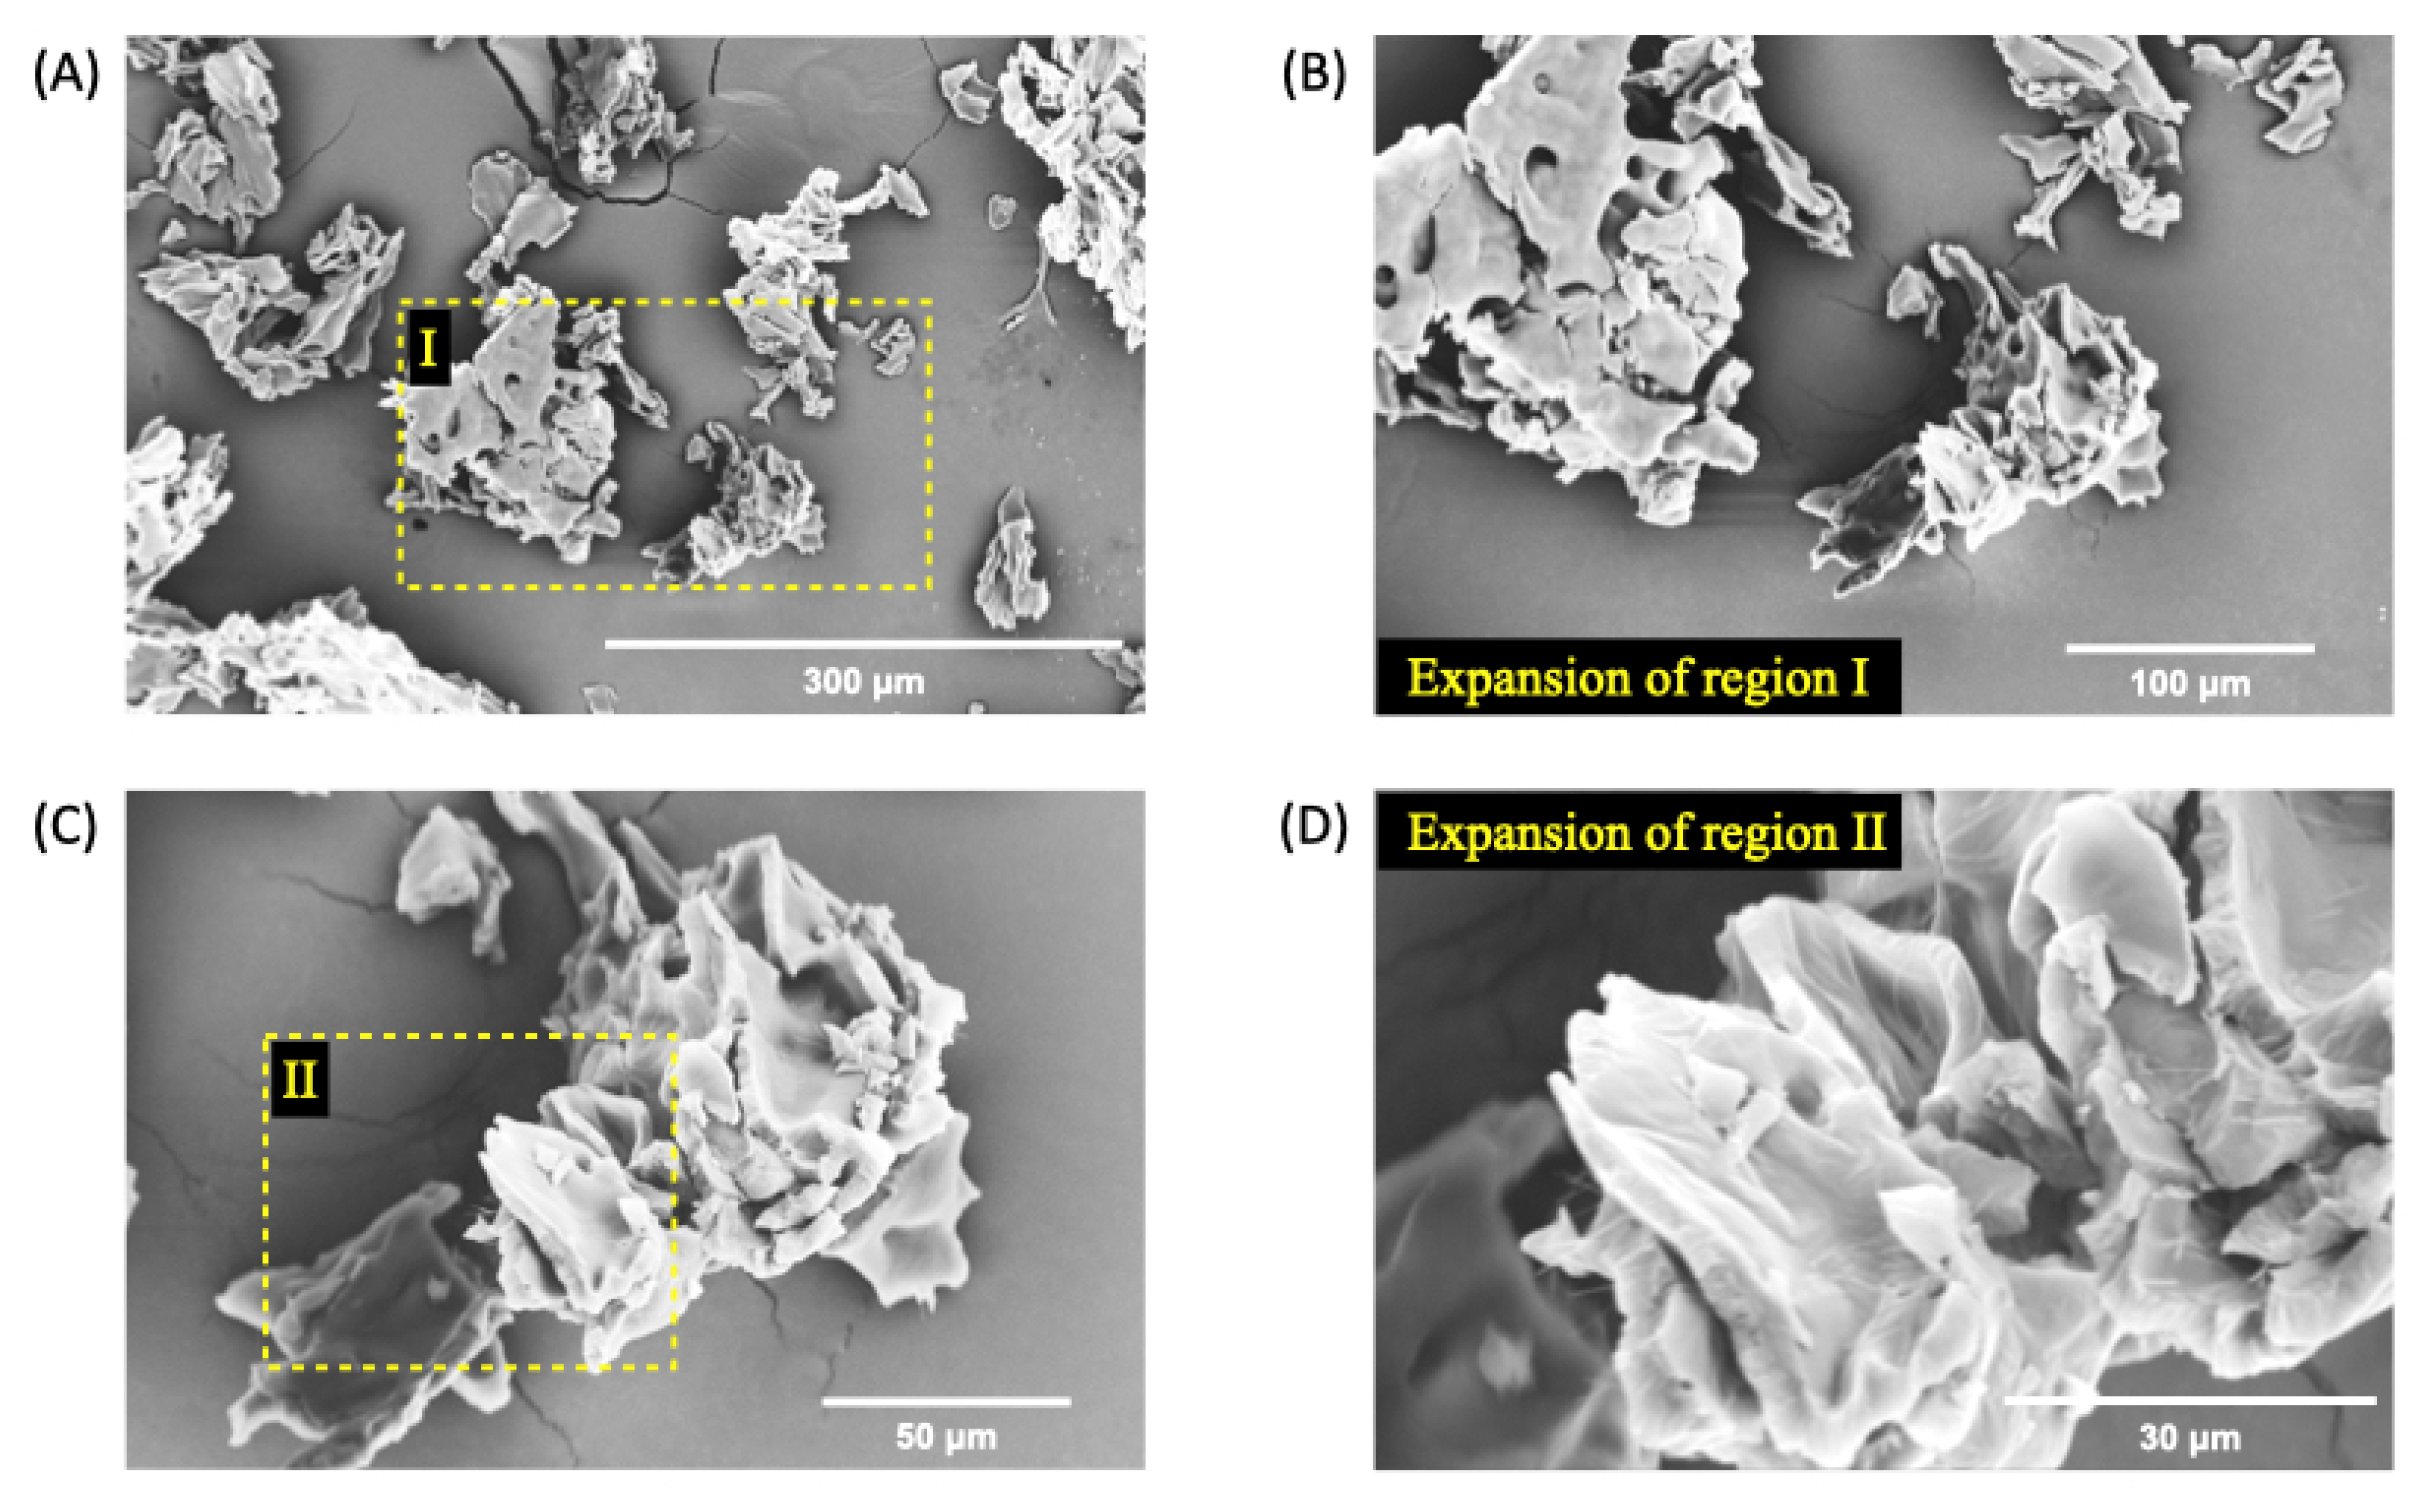
Figure 6.
AFM topographic maps of the nGF0 nanogel. (A) Yellow arrows indicate spherical structures formed by F127 micelles, with an average height of 108.74 ± 19.41 nm (n = 19), and green arrows indicate flat regions with an average height of 5.92 ± 3.00 nm (n = 15). (B) and (D) Expanded 3D micrographs showing the spherical structures in detail. (C) Cubic micellar structures formed by aggregational processes of F127 micelles.
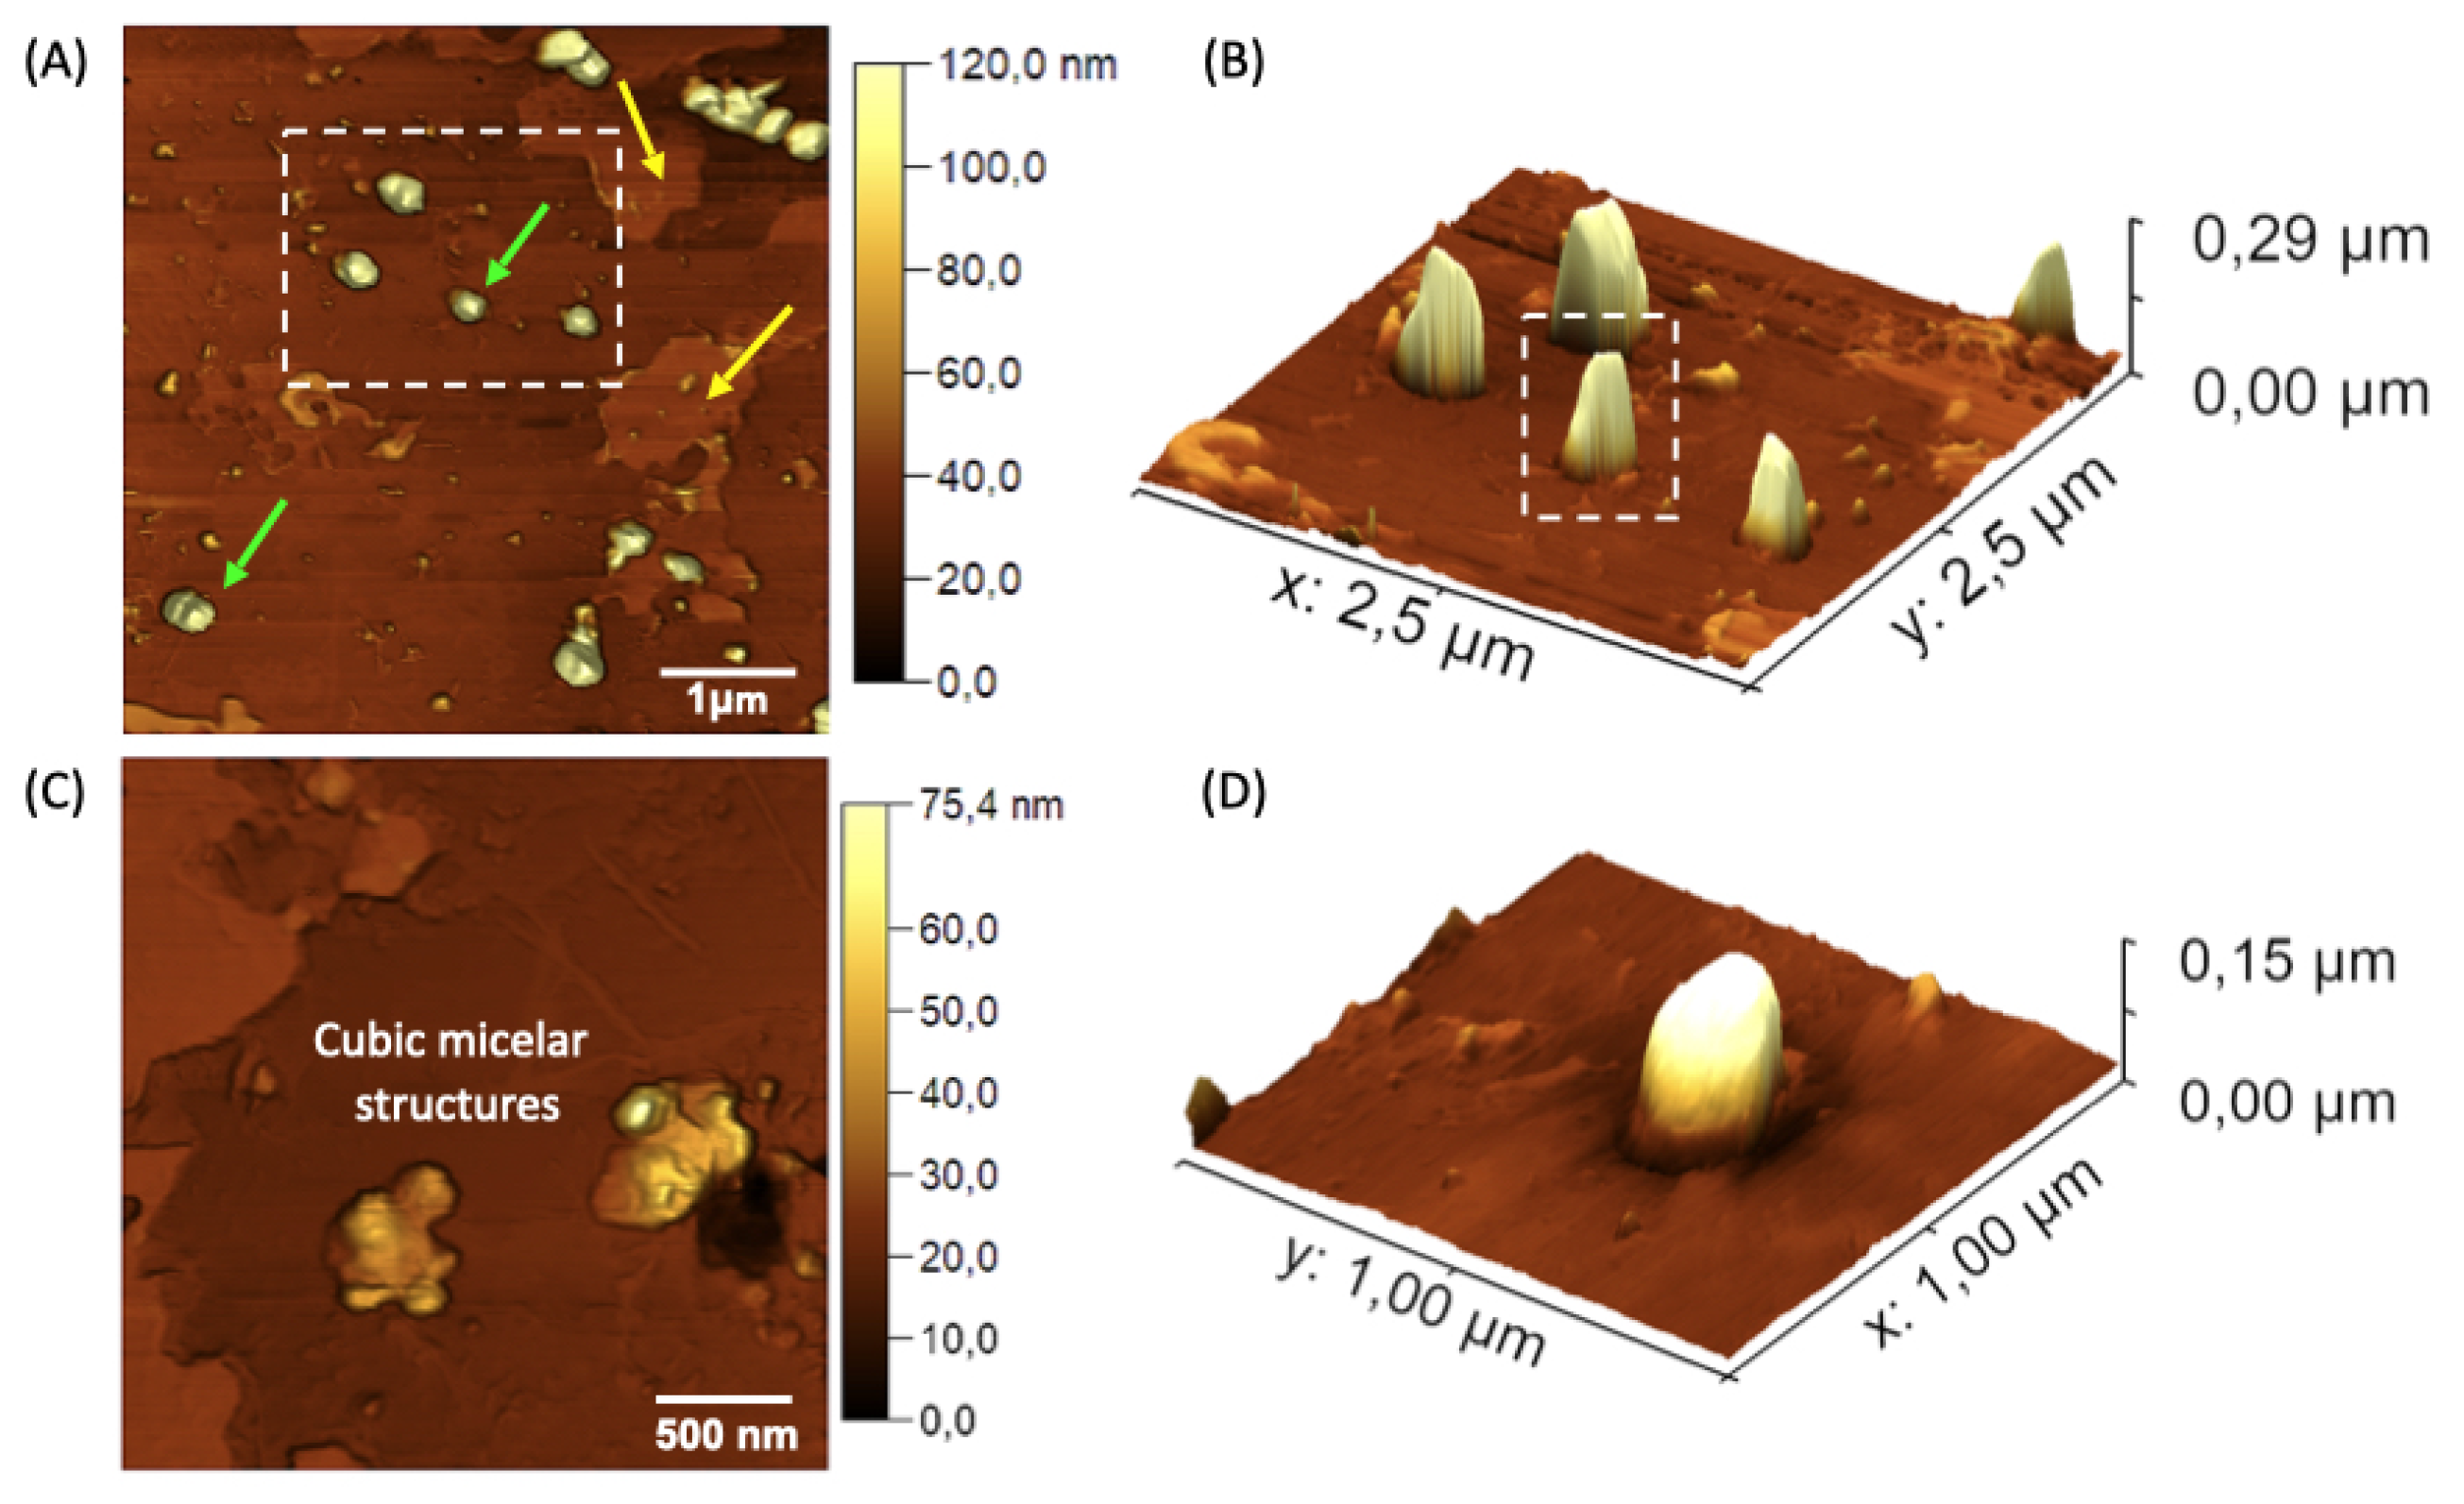
Figure 7.
Young’s modulus maps (A) and (B), and adhesion force maps (C) and (D) were acquired for the different domains observed in the nGF0.
Figure 7.
Young’s modulus maps (A) and (B), and adhesion force maps (C) and (D) were acquired for the different domains observed in the nGF0.
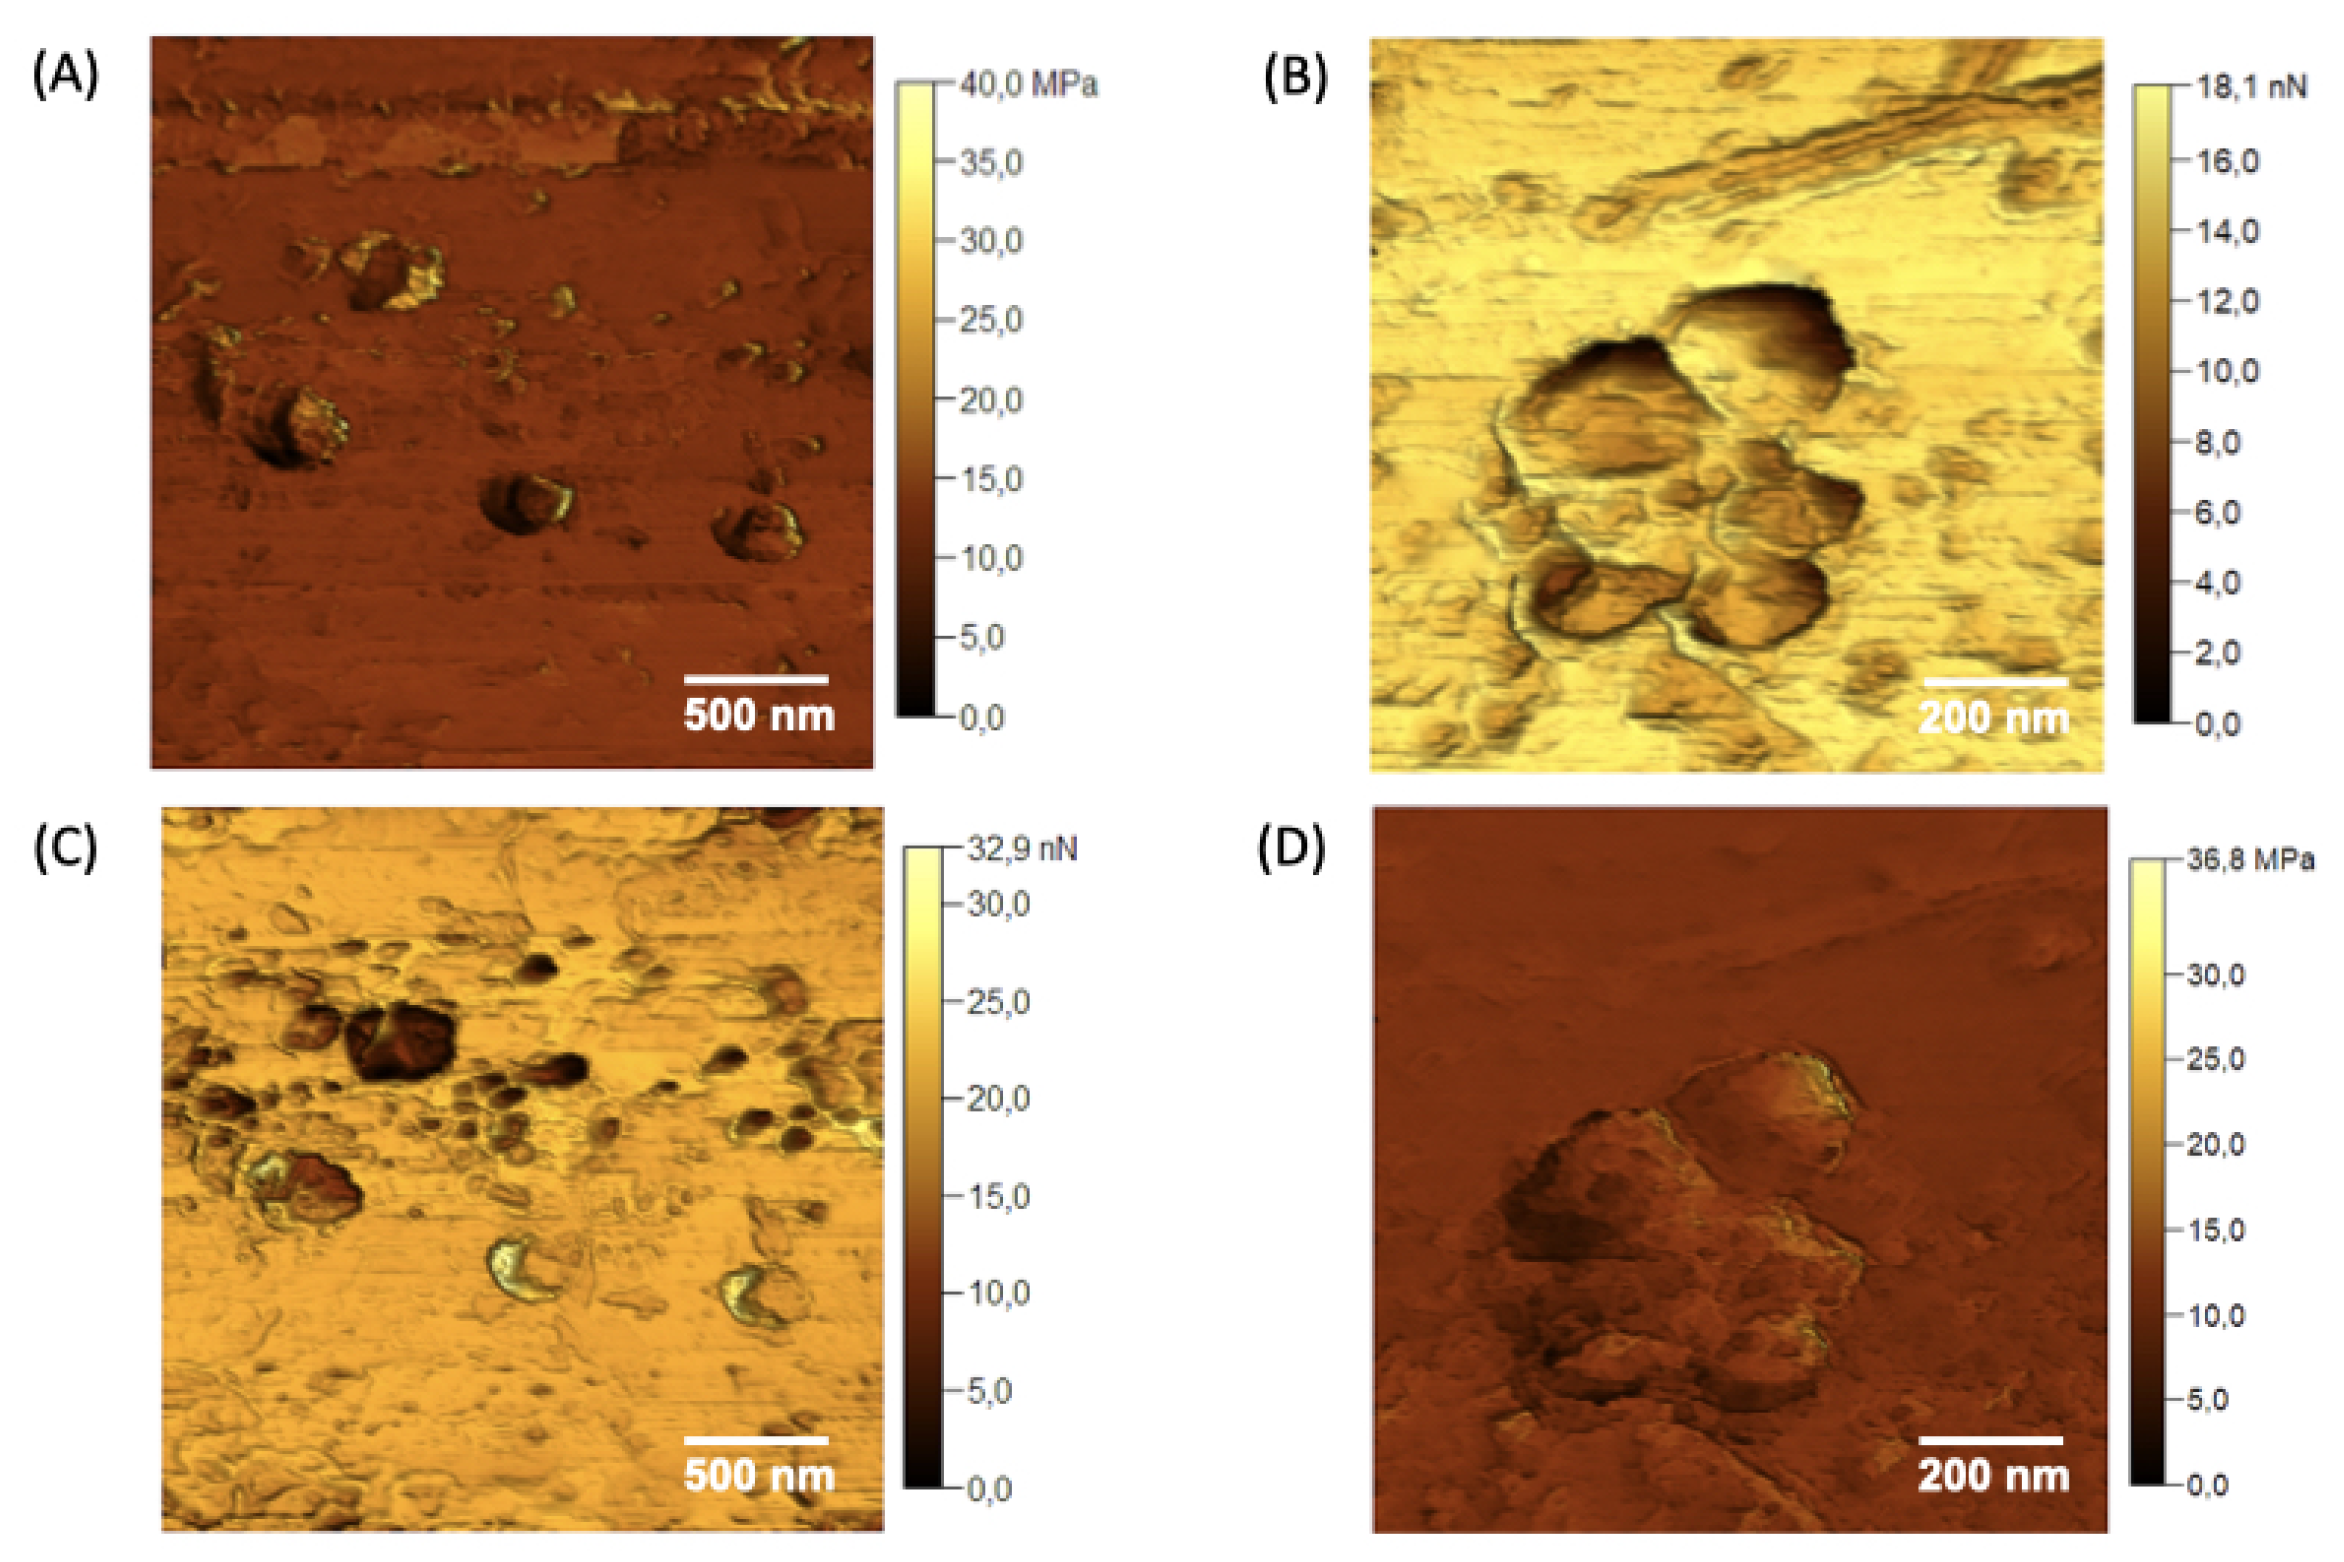
Figure 8.
Topographical AFM maps of the nanogel nGF3. (A) Red arrows indicate flat structures formed by the presence of EOPbon the surface of the nGF0 matrix, with an average height of 7.39 ± 0.79 nm (n = 17). (B) Green arrows indicate the incorporation of EOPb into the F127 micellar structures and the pores of the nGF0 material, with average height values of 1.37 ± 0.21 nm (n = 20) and size of 40.58 ± 7.98 nm (n = 20. (C) and (D) 3D micrographs showing the flat nGF3 structures.
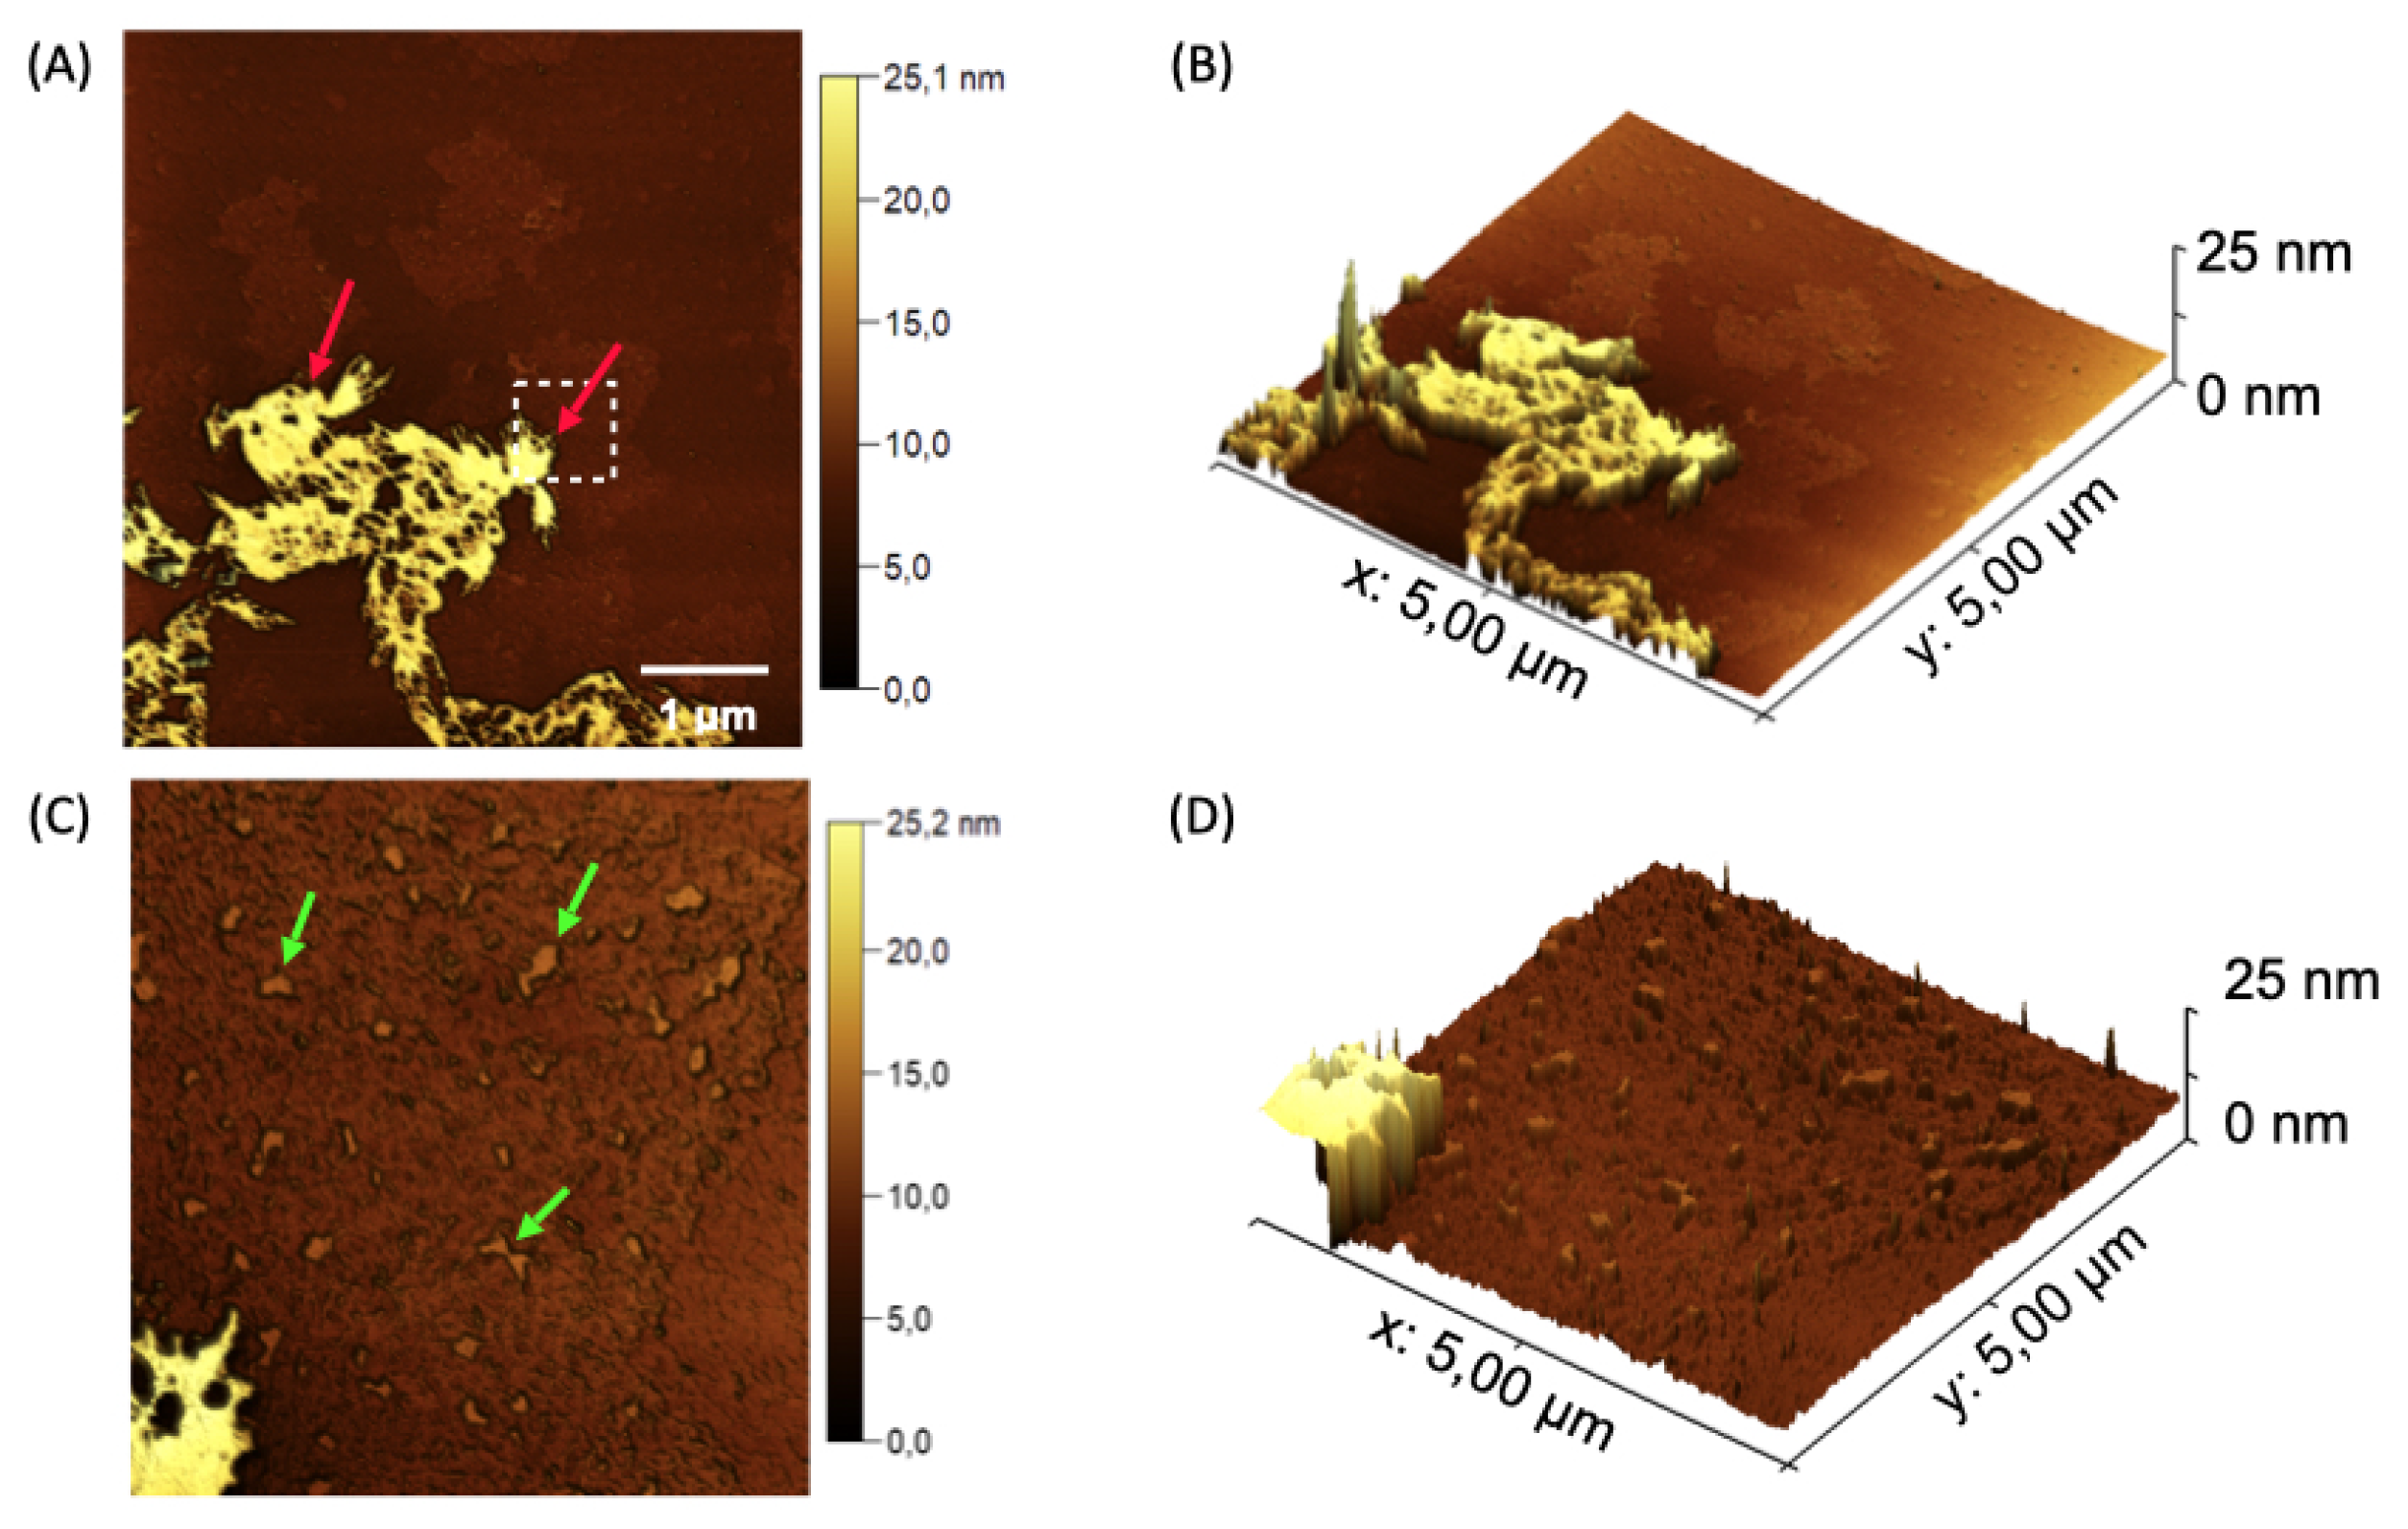
Figure 9.
Maps of Young’s modulus (A) and (B), and adhesion forces (C) and (D) acquired for the nanogel nGF3.
Figure 9.
Maps of Young’s modulus (A) and (B), and adhesion forces (C) and (D) acquired for the nanogel nGF3.
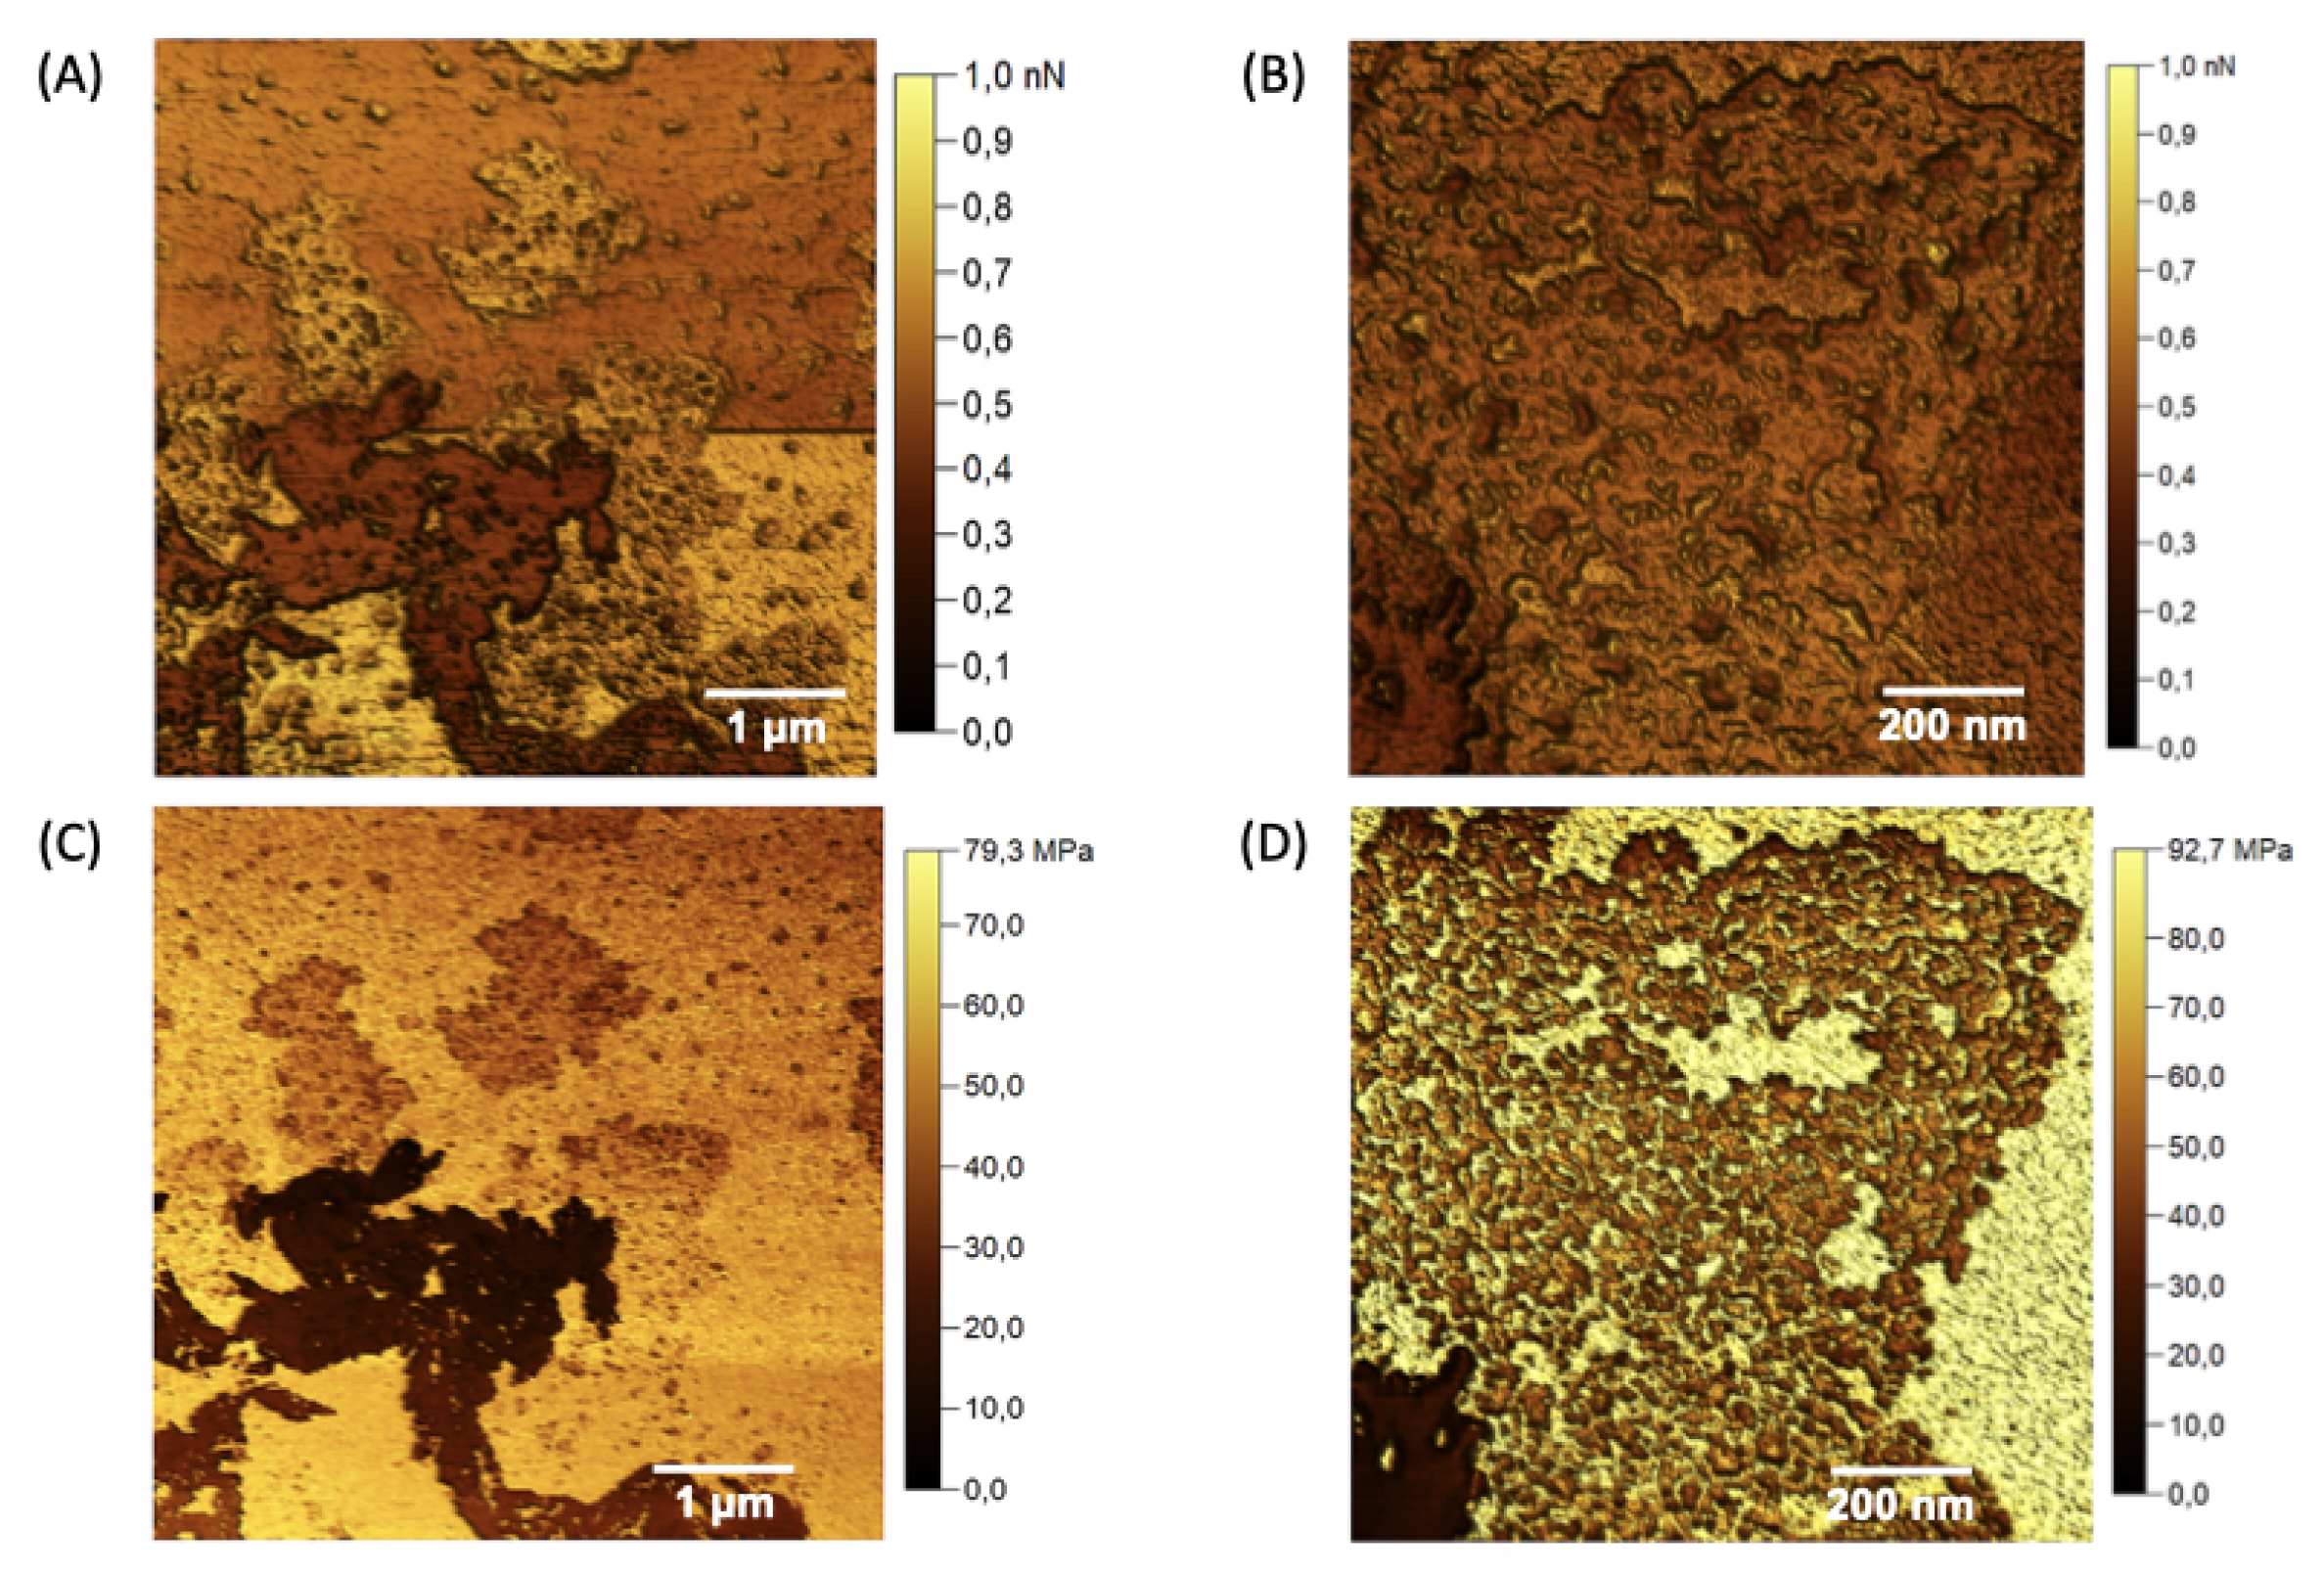
Figure 10.
in vitro leishmanicidal activity of nanogel formulation (nGF3) demonstrating concentration and time dependent efficacy against LLa (p < 0.05, Kruskal-Wallis with Dunn’s post-hoc test).
Figure 10.
in vitro leishmanicidal activity of nanogel formulation (nGF3) demonstrating concentration and time dependent efficacy against LLa (p < 0.05, Kruskal-Wallis with Dunn’s post-hoc test).
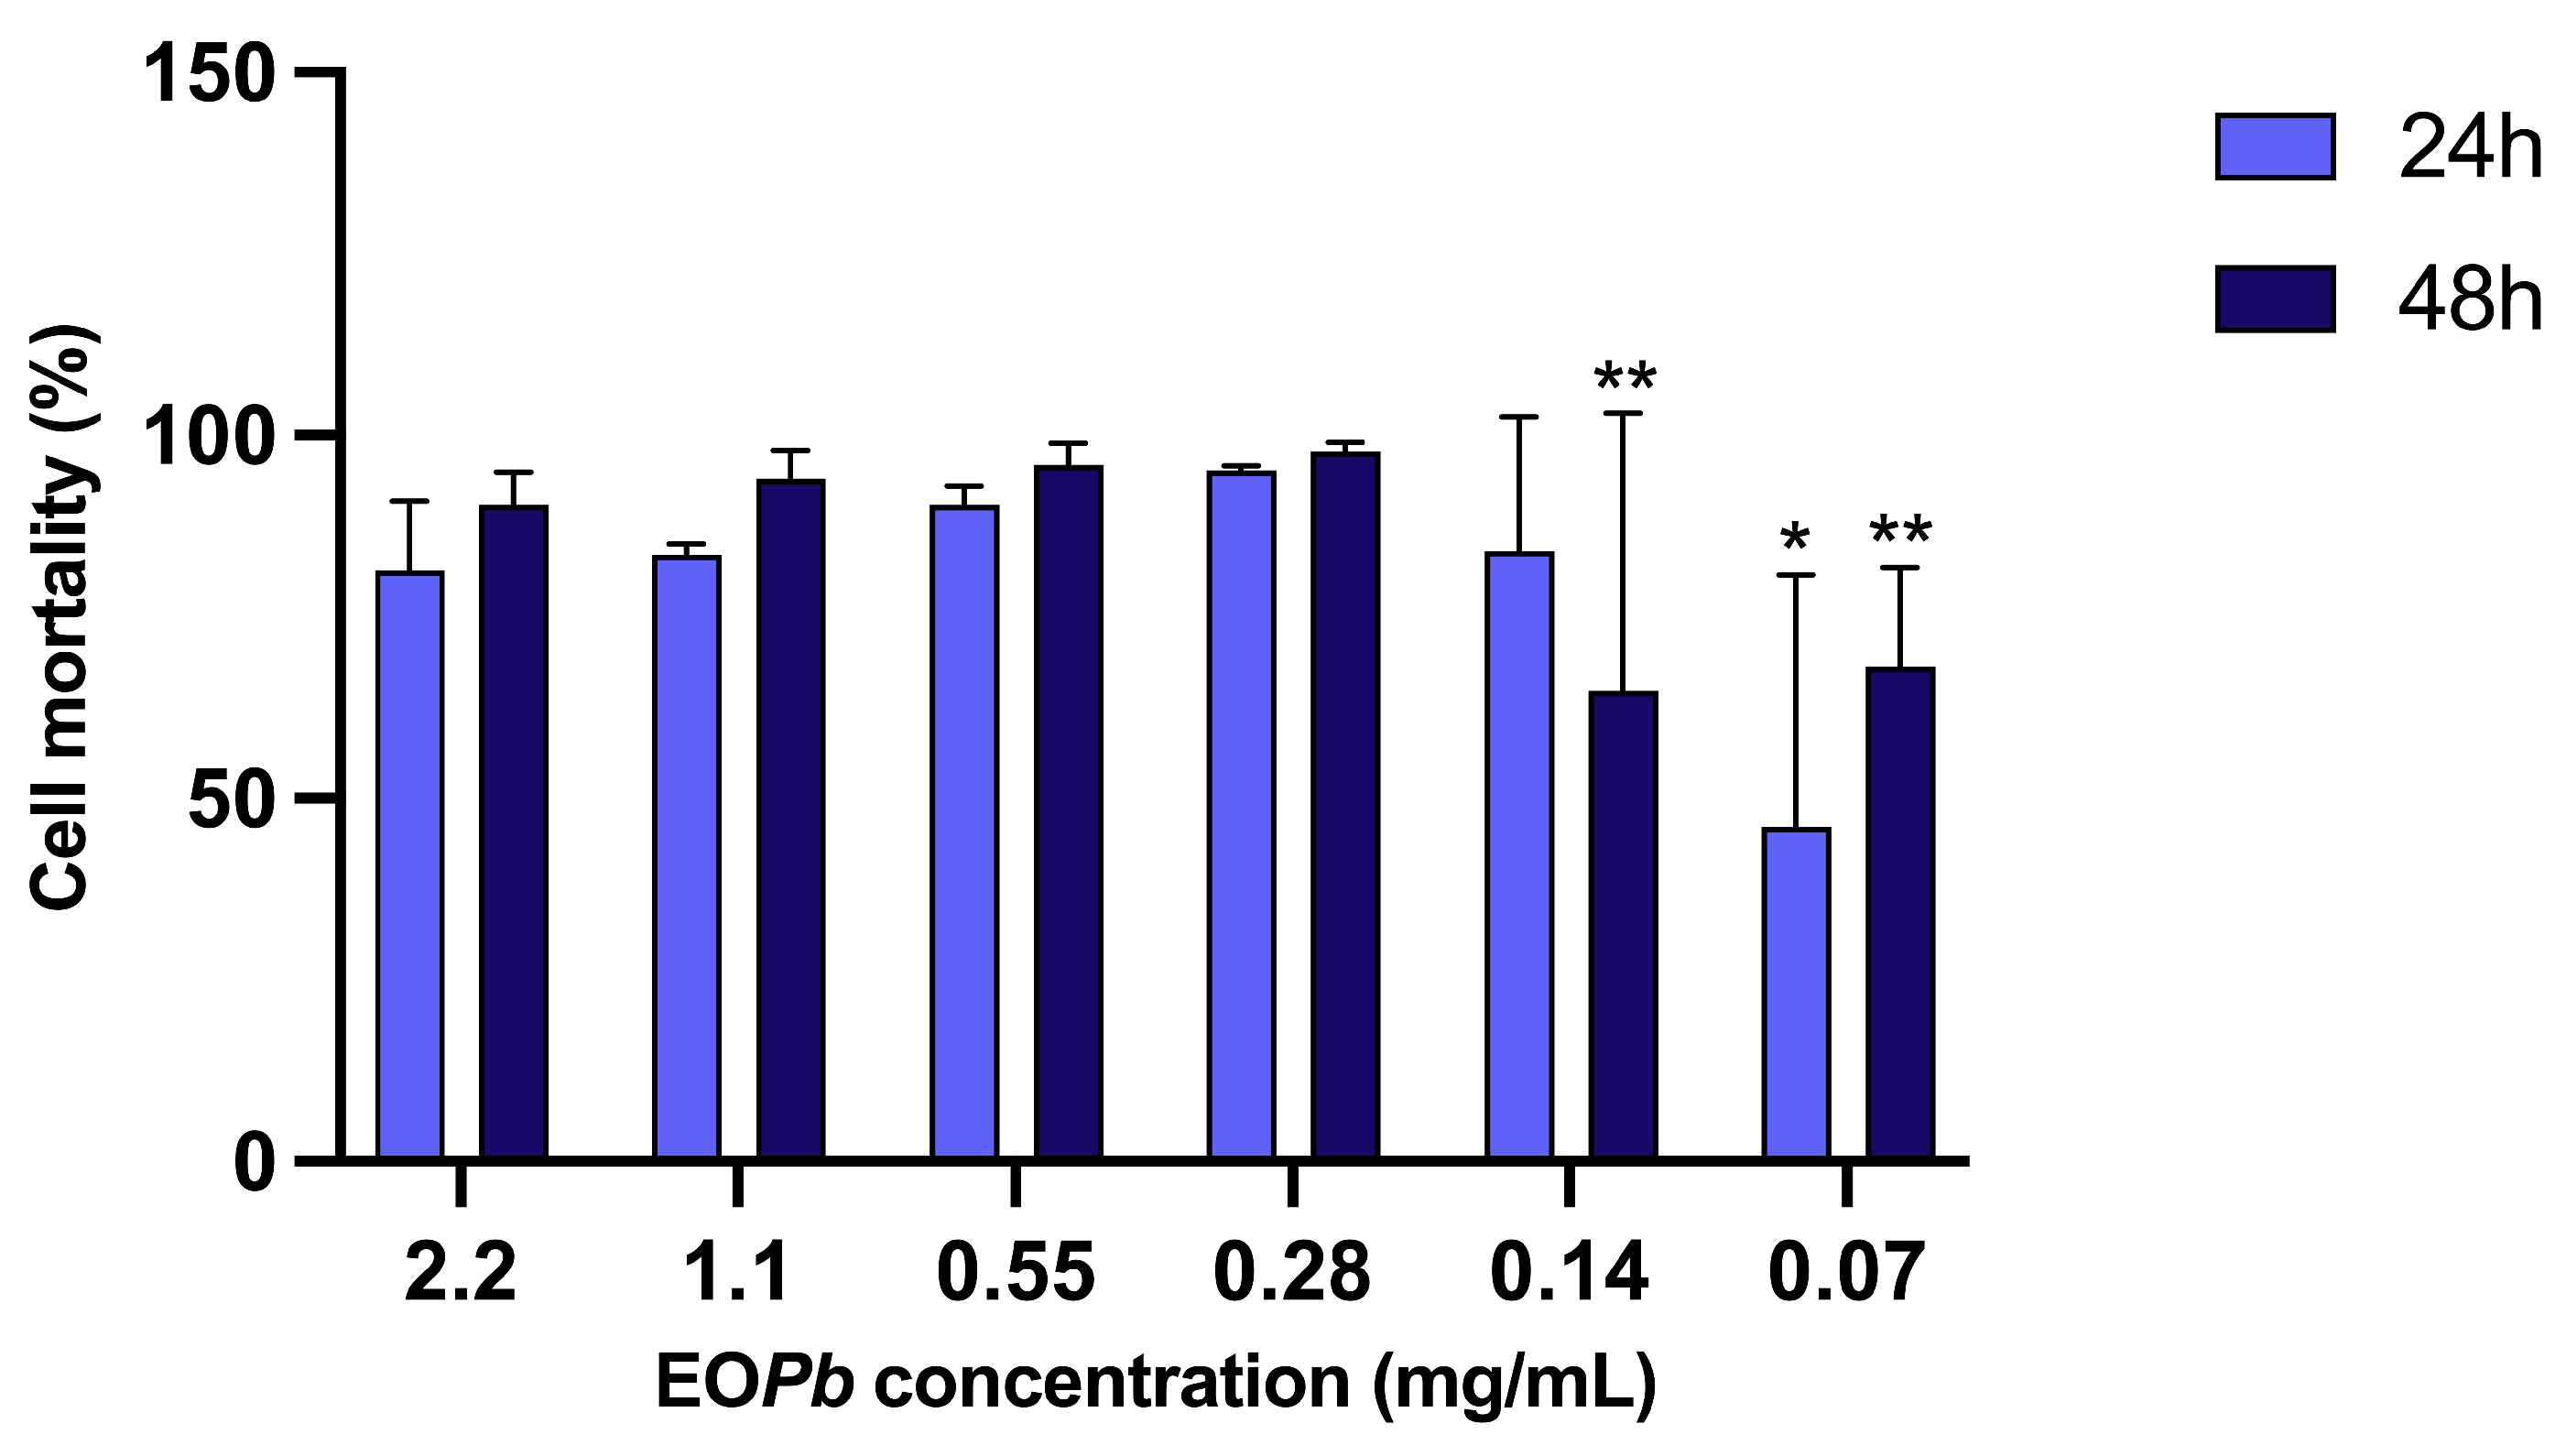
Figure 11.
Topical anti-inflammatory action of nanogels in an experimental paw edema model in mice (p < 0.05, ANOVA, Tukey Test).
Figure 11.
Topical anti-inflammatory action of nanogels in an experimental paw edema model in mice (p < 0.05, ANOVA, Tukey Test).
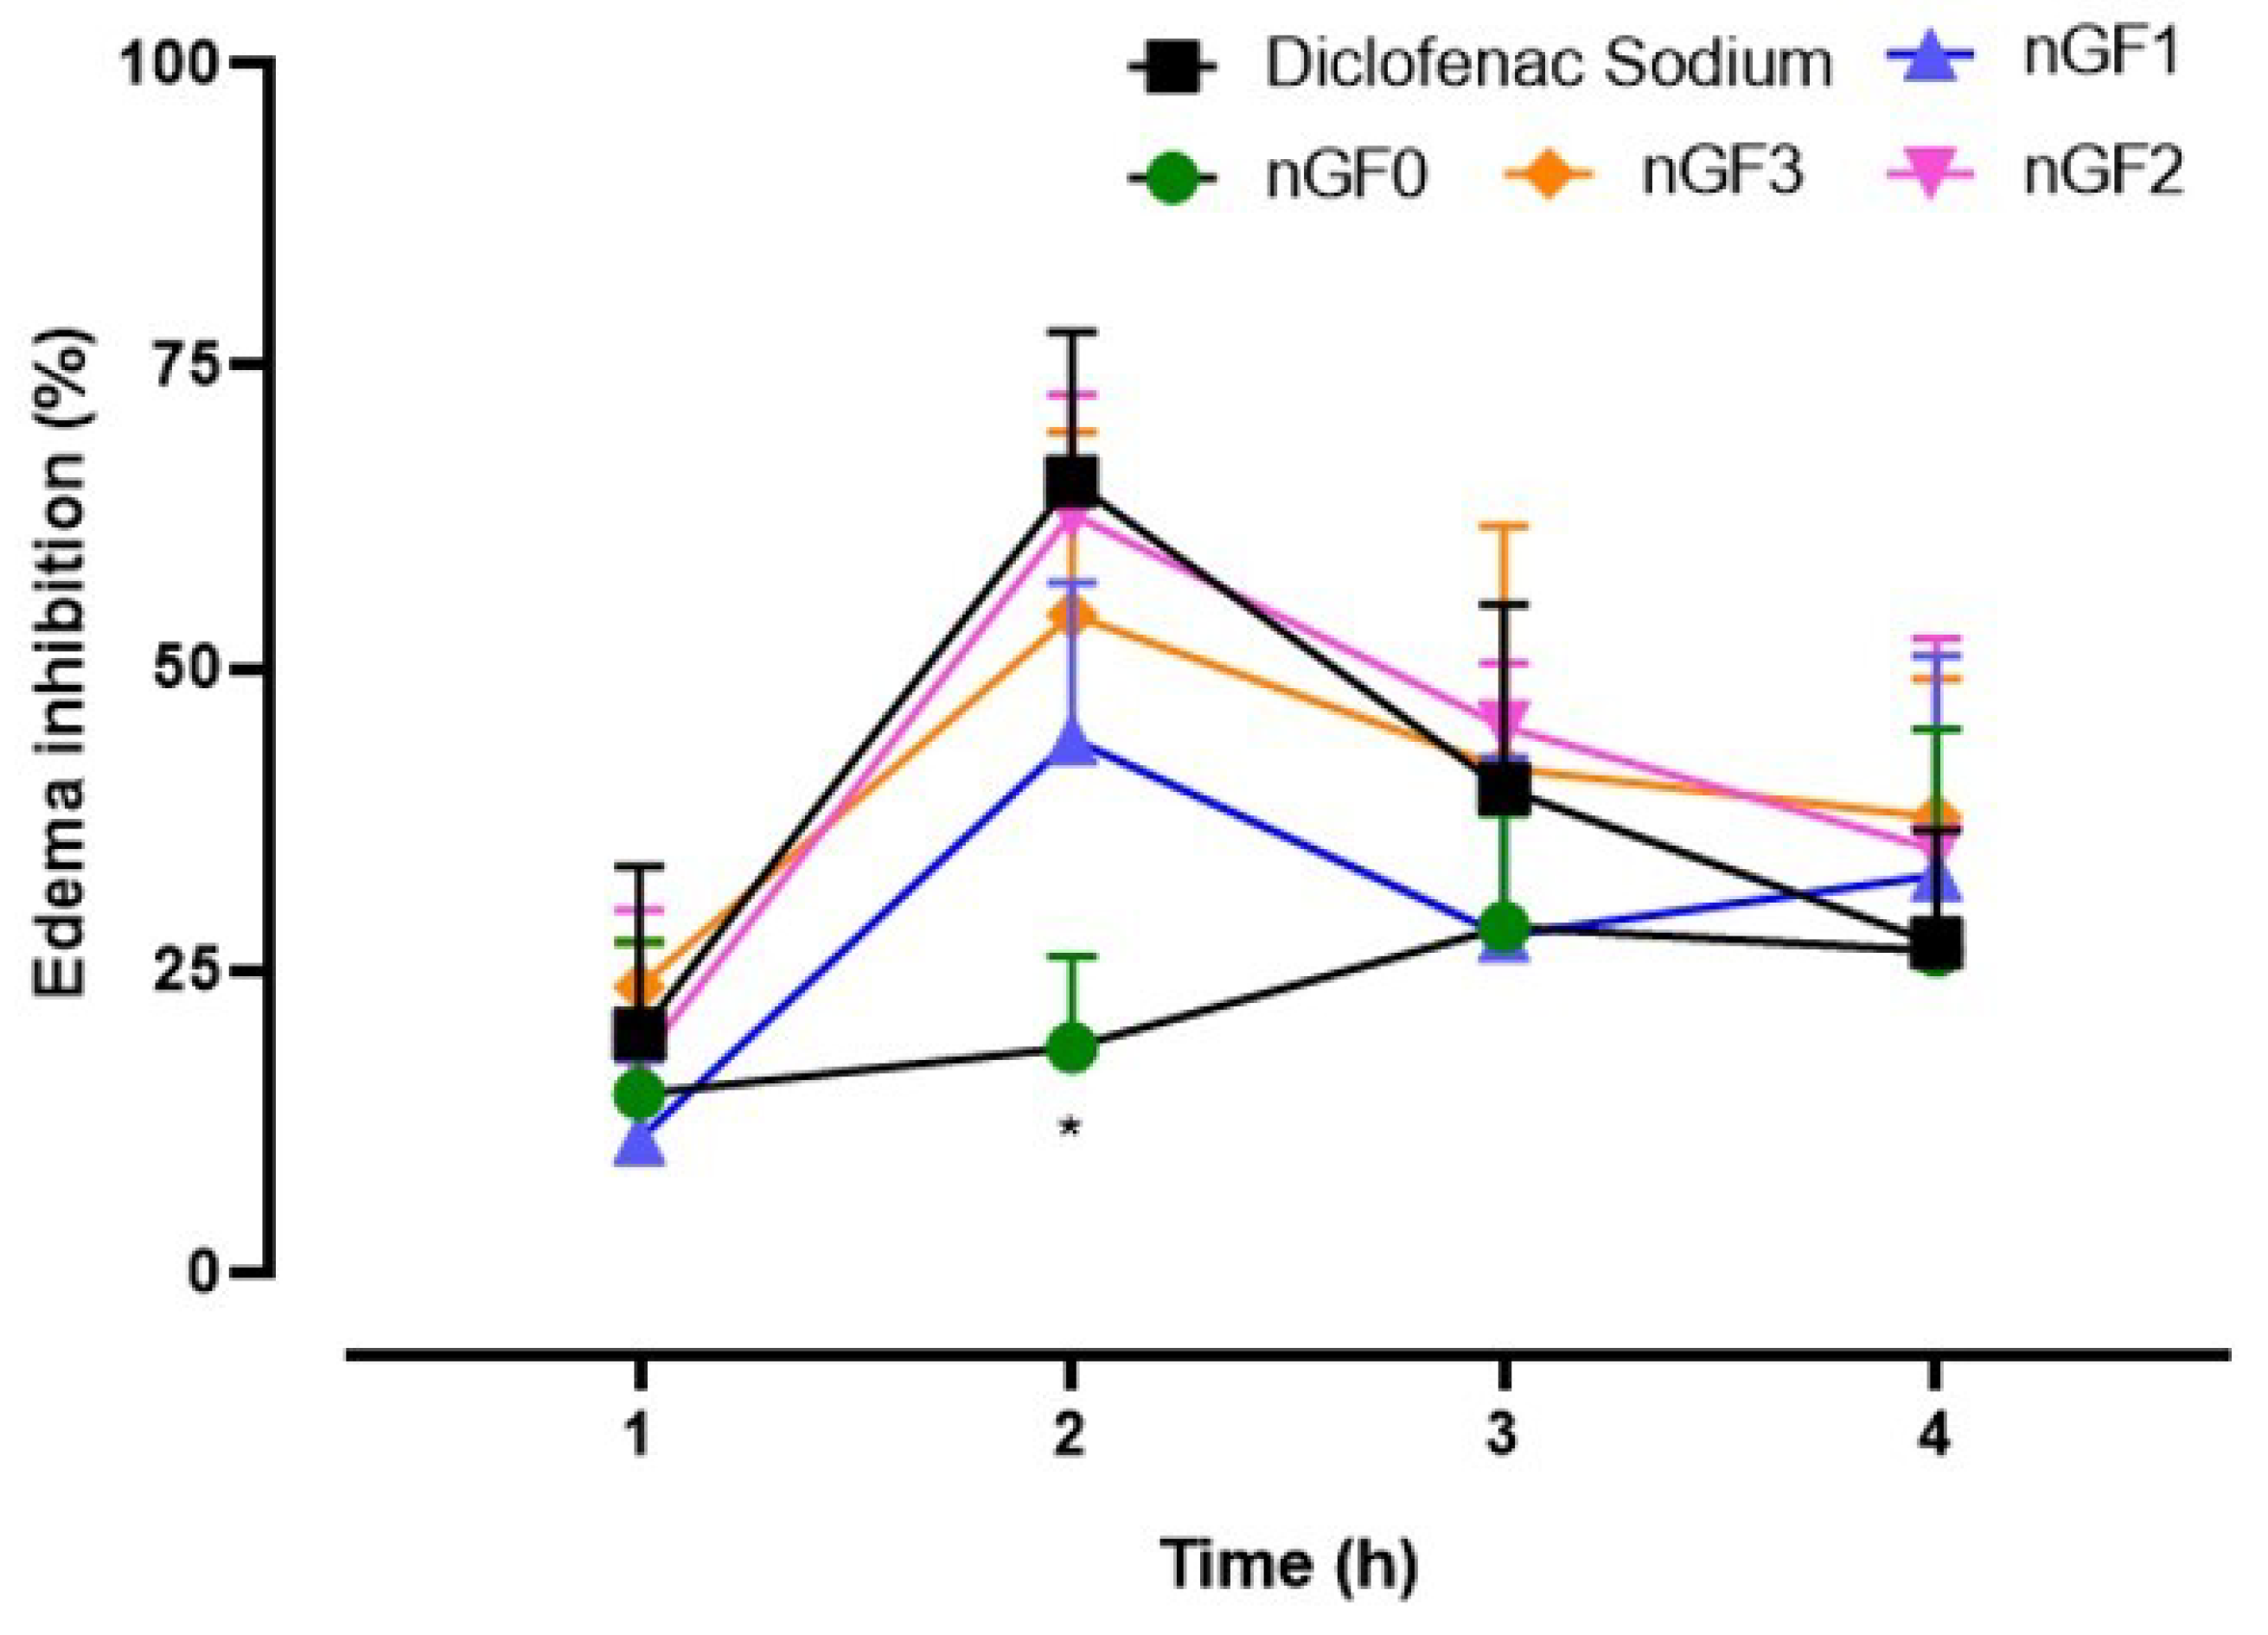

Table 1.
Infrared Spectroscopy data for EOPb and nGF3 Compounds
| Compound | Wavenumber (cm) | Assignment | Compound class |
|---|---|---|---|
| 2954 | C—H stretching | Alkene | |
| 2920 | C—H stretching | Alkane | |
| 2870 | C—H stretching | Aldehyde | |
| EOPb | 1712 | C=O stretching | Aldehyde |
| 1674 | C=C stretching | Alkene | |
| 1442 | C—H scissoring | Alkane | |
| 1377 | C—H rock | Alkane | |
| 1141 | C—O stretching | Aldehyde | |
| 840 | C=O bending | Aldehyde | |
| nGF3 | 3676 | O—H stretching | Alcohol |
| 3340 | O—H stretching | Hydrogen bond | |
| 1732 | C=O stretching | Aldehyde | |
| 1103 | C—O—H stretching | Ether |
Table 2.
Particle size measurements (nm) of nGF0 and nGF3 nanogels obtained using DLS and AFM techniques, expressed as D ± Standard Deviation (SD), PDI, Height (H) and Diameter (D) ± SD.
Table 2.
Particle size measurements (nm) of nGF0 and nGF3 nanogels obtained using DLS and AFM techniques, expressed as D ± Standard Deviation (SD), PDI, Height (H) and Diameter (D) ± SD.
| Measurement | nGF0 | nGF3 |
|---|---|---|
| DLS: D ± SD; PDI | 661.03 ± 6.1; 0.34 | 30.44 ± 12.1; 0.54 |
| AFM: D ± DS (nm) | 279.09 ± 38.93 | 40.58 ± 7.98 |
| AFM: H ± DS (nm) | 108.74 ± 19.41 | 1.37 ± 0.21 |
Disclaimer/Publisher’s Note: The statements, opinions and data contained in all publications are solely those of the individual author(s) and contributor(s) and not of MDPI and/or the editor(s). MDPI and/or the editor(s) disclaim responsibility for any injury to people or property resulting from any ideas, methods, instructions or products referred to in the content. |
© 2024 by the authors. Licensee MDPI, Basel, Switzerland. This article is an open access article distributed under the terms and conditions of the Creative Commons Attribution (CC BY) license (https://creativecommons.org/licenses/by/4.0/).
Copyright: This open access article is published under a Creative Commons CC BY 4.0 license, which permit the free download, distribution, and reuse, provided that the author and preprint are cited in any reuse.


