
Submitted:
03 January 2025
Posted:
06 January 2025
You are already at the latest version
Abstract
Huanglongbing (HLB), caused mainly by Candidatus Liberibacter asiaticus (CLas), is a devastating disease which threatens citrus production worldwide, manifesting as leaf greening, fruit deformation and yield losses. This study generated a comprehensive co-expression network analysis using RNA-seq data from 17 public datasets and ap-plied Weighted Gene Co-expression Network Analysis (WGCNA) to identify gene modules associated with citrus species, tissue types and days post infection (DPI).
Key modules were identified among different conditions. We found a significant gene enrichment involved in stress responses, metabolic processes, ribosomal protein syn-thesis; chloroplast and plastid functions; cellular structure; intracellular organization, and stress responses. These findings provide a molecular framework for understanding HLB pathogenesis and host tolerance.
By elucidating module-specific functions and their correlation with species- and tis-sue-specific responses, this study provides a robust foundation for identifying key ge-netic targets. These insights facilitate breeding programs focused on developing HLB-tolerant citrus cultivars, contributing to the long-term sustainability and resili-ence of global citrus production.
Keywords:
HLB
; Citrus varieties tolerance
; Gene co-expression network
; RNA-Seq analysis
1. Introduction
Huanglongbing (HLB), also known as citrus greening, is one of the most severe threats to citrus production worldwide, characterized by yellowing leaves, deformed fruit, and tree death [1,2,3].This disease, originally documented in southern China[4], was later associated with citrus dieback in India during the 1700s [5,6], leading to the hypothesis that HLB first emerged in India before spreading to China [2,3]. In 1929, a similar disorder was observed in South Africa, distinguished by the incomplete color development at the stylar end of affected fruits [7,8]. The disease spread throughout Asia, the Middle East and Africa up to the 1990s [9]. For decades, HLB was confined to Asian and African countries until it was discovered in the Americas. The disease was discovered in Brazil in 2004 [10] and the following year in Florida, USA [11]. Now affecting more than 53 countries in Asia, the Americas, Africa, Oceania, and the Caribbean [12], HLB continues to cause significant damage worldwide. These new outbreaks were significant not only because of the large losses that followed, but also because they gave new impetus to research into all aspects of HLB. This disease remains a major risk to citrus production worldwide and a worrying threat to growers in Europe, where it is still absent.
The disease reduces fruit production and quality, leading to lower market prices and consumer demand, while increased management costs, including pest control and removal of infected plants, further exacerbate the substantial economic losses—reported in the billions—affecting farmers, suppliers, and the entire citrus supply chain [13]. Despite these challenges, ongoing research aims to develop more effective management practices and resistant citrus varieties to mitigate the impact of HLB.
Most commercial citrus cultivars worldwide are highly susceptible to HLB, which affects various citrus species, including orange, mandarin, lemon, and grapefruit trees, causing severe damage [14]. The widespread monoculture of a few citrus varieties has led to reduced genetic diversity, which facilitates the rapid spread of HLB among the citrus population [15]. Diverse citrus cultivars have been shown to be more tolerant to huanglongbing HLB, such as the trifoliate orange trees and their hybrids, and the citron and its hybrids, like lemons [15,16]. Over time, other HLB-tolerant species have been identified, including the mandarin hybrid Sugar Belle [17] and several wild species such as Citrus ichangensis '2586', Citrus latipes, sour pummelo, and kaffir lime [18,19,20,21]. The ‘Jackson’ grapefruit-like hybrid has shown significant tolerance compared to the susceptible ‘Marsh’ grapefruit [22]. More recently, Australian lime species and hybrids have also been recognized for their tolerance [15,23,24,25,26]. Persian triploid lime (Citrus latifolia) exhibits greater tolerance to HLB than diploid varieties due to superior detoxification processes and physiological traits, such as enhanced callose synthesis in response to infection [27].
To effectively control HLB, it is critical to understand the diversity in responses across citrus cultivars and identify varieties with potential tolerance traits.
The global spread of HLB disease is influenced by several interrelated factors, including the role of its insect vector, climate change, and agricultural practices, all of which are crucial to the effective management and control of the disease. HLB is caused by three species of Candidatus Liberibacter: Candidatus Liberibacter asiaticus (CLas), Candidatus Liberibacter africanus (CLaf), and Candidatus Liberibacter americanus (CLam). These species are Gram-negative, phloem-colonizing, psyllid-transmitted, fastidious bacteria classified in the order Rhizobiales (class Alphaproteobacteria) [1,28,29,30]. Among them, CLas is the most widespread, transmitted by the Asian citrus psyllid, Diaphorina citri, while CLaf is spread by the African citrus psyllid, Trioza erytreae transmitting the pathogen through feeding on infected plants [1,30]. Studies have shown that nearly all life stages of D. citri can harbor the pathogen, facilitating widespread transmission [31]. Climate variability also plays a significant role in influencing the population dynamics of D. citri, thereby affecting the incidence of HLB. Changes in temperature and rainfall patterns can alter the distribution and lifecycle of the psyllid, potentially leading to an increase in outbreaks [9,32].
The HLB spread rate is further exacerbated by agricultural practices, like moving infected but asymptomatic plants across regions [9].
Once CLas infects the host plant, it significantly disrupts physiological and biochemical processes, exhibiting complex interactions with both plant and insect hosts that enhance vector transmission [29,33]. One of the primary mechanisms involves the abscisic acid (ABA) signaling pathway, which upregulates callose synthase (CsCalS11) expression, leading to increased callose production in response to CLas-associated PAMPs like flagellin[30,34]. Elevated ABA levels activate the CsABI5-CsCalS11 module, essential for callose synthesis [34]. However, CLas also suppresses citrus innate immune responses through proteins such as LasP235 and Effector 3 [35]. While these proteins initially promote callose deposition as part of the plant's defense response, CLas can later inhibit or modulate this process. Transmission electron microscopy shows reduced sieve pore diameter in infected leaves, correlating with callose accumulation and impaired phloem function, further aggravating phloem blockage and the disease's impact on citrus health and productivity [36,37]. Furthermore, CLas secretory protein SDE3 inhibits host autophagy by degrading CsATG8 proteins, which are crucial for plant immunity, further promoting disease progression and enhancing virulence in citrus and other plants like Arabidopsis thaliana and Nicotiana benthamiana [38]. CLas infection also causes a decline in photosynthetic efficiency by reducing chlorophyll levels, increasing cell membrane permeability, and altering reactive oxygen species (ROS) scavenging [39]. Different citrus cultivars exhibit varying responses to CLas; for example, rough lemon trees can rejuvenate despite showing symptoms, while sweet orange trees suffer continuous growth inhibition and eventual dieback [40]. Rough lemon appears to maintain better phloem transport and higher expression of defense-related genes compared to sweet orange, suggesting that robust phloem transport is key to HLB tolerance [40,41].
In recent years, numerous publicly available RNA-Seq datasets related to HLB have emerged (e.g., [42,43,44,45]. These studies provide a unique opportunity to explore the molecular basis of citrus responses to CLas infection by re-analyzing and integrating these valuable resources.
Weighted gene co-expression network analysis (WGCNA) is a powerful computational tool used to study complex biological systems, such as plant-pathogen interactions [46]. WGCNA uncovers intricate relationships between genes across tissues and plant varieties, providing a robust framework for unraveling the genetic mechanisms underlying these interactions [47,48]. This method allows researchers to identify co-expressed gene modules that correlate with specific traits, such as disease resistance. In addition, WGCNA can reveal tissue-specific gene expression patterns, which are critical for understanding how different plant parts respond to pathogen attack [49]. For example, WGCNA identified modules associated with resistance pathways in Amorphophallus, highlighting the role of specific genes in different tissues during pathogen infection [49]. Similarly, in wheat infected by Puccinia striiformis, WGCNA highlighted core defense-related genes, such as heat shock proteins and protein kinases, involved in plant defense mechanisms [47]. Recently, Li et al. (2024) showed that hub genes were positively correlated with CLas infection in Citrus sinensis, including key genes such as Leaf rust 10 disease-resistance locus receptor-like protein kinase-like, ERF9, and TrxR1, providing insights into the transcriptional regulation during CLas infection.
In this study, we aimed to apply WGCNA to explore gene co-expression networks across multiple tissue types (e.g., leaf, root) and citrus cultivars to identify key regulatory genes and pathways involved in the plant response to HLB infection. By integrating RNA-seq data from different sources, we aim to uncover tissue-specific gene expression patterns and pathways perturbed by CLas, ultimately contributing to a deeper understanding of the molecular mechanisms underlying citrus resilience or susceptibility to HLB. This research provides an insight into gene co-expression networks across a wide range of citrus species, tissues and infection stages, setting the stage for future studies and potential breeding strategies targeting HLB resistance
2. Results
2.1. Evaluation of RNA-Seq Aligners and Selection of Citrus Reference Genome for Optimal Mapping Efficiency.
We analyzed RNA-seq data from 293 samples across five Citrus species and nine tissue types (Supplementary Table S1). To assess mapping efficiency, we compared two widely used RNA-seq aligners, STAR and HISAT2, using both the Citrus sinensis DHSO v3.0 and Citrus clementina v1.0 reference genomes. STAR consistently achieved higher mapping rates across all samples and genomes, with a median of 88.88% (±4.57) uniquely mapped reads for C. sinensis DHSO v3.0, compared to a median of 78.06% (±5.77) for HISAT2 on the same genome (Table 1, Supplementary Figure S1). Similar trends were observed for the C. clementina v1.0 genome, where STAR also outperformed HISAT2 (median 89.75% vs. 80.87%).
These findings align with the distinct approaches of the two aligners. STAR uses a maximum mappable seed search combined with suffix arrays, allowing it to rapidly achieve high mapping efficiency, particularly for large datasets [51]. On the other hand, HISAT2 employs a hierarchical indexing strategy and a graph-based approach, which, while efficient for spliced read alignment, resulted in slightly lower mapping efficiency in our dataset [52]. Despite HISAT2’s strengths in handling spliced reads, STAR’s superior speed and sensitivity made it the preferred aligner for our study.
Although both genomes provided similar mapping efficiencies, we selected the C. sinensis DHSO v3.0 for all downstream analyses due to its improved completeness and annotation quality. This choice contributed to a more reliable dataset for downstream gene expression and co-expression analyses, ensuring higher statistical power and biological accuracy.
2.2. Quality Control and Data Retention for Further Analyses
Following post-alignment quality control, 230 RNA-Seq samples with alignment rates above the established 60% cutoff were retained for downstream analyses. These samples, mapped to C. sinensis DHSO v3.0 using STAR, demonstrated a median alignment rate of 88.88% (±4.57). The remaining samples, which showed alignment rates below 60%, were excluded to maintain data reliability for subsequent differential expression and co-expression studies (Figure 1).
2.3. Gene Expression Profiling and Principal Component Analysis
Gene expression levels were quantified at the transcript level, resulting in an initial set of 49,567 transcripts. After filtering out low-expressed genes (those with zero variance or missing values), a final set of 32,401 transcripts was retained for analysis. To ensure comparability across samples and reduce technical noise, the count data were transformed to stabilize variance, enabling reliable downstream analyses.
Multidimensional Scaling analysis analysis (MDS) revealed that the first two principal components explained 35% of the total variance, with the primary source of variation being tissue type. Samples were clearly clustered according to tissue type, indicating distinct tissue-specific expression patterns. In contrast, differences between HLB-treated and control samples were less pronounced, suggesting that the impact of HLB on gene expression may be more subtle or tissue-specific (Figure 2).
While tissue type was the main driver of variation, we observed minimal clustering by Citrus species (Supplementary Figure S2-A). This suggests that the effect of species-specific genetic background on gene expression patterns is less pronounced than tissue-specific effects. In addition, the inclusion of samples from multiple bioprojects with different experimental conditions and sequencing platforms likely contributed to the observed dispersion in the MDS plot (Supplementary Figure S2-B).
2.4. Clustering of Gene Expression Samples
To further investigate the clustering of gene expression profiles and to identify potential outliers, Pearson correlation was used as a distance metric. The resulting dendrogram, shown in Supplementary Figure S3, revealed clear sample groupings. A height cutoff of 1.5 was applied to exclude 28 outlier samples that likely reflected technical variability, retaining 202 high-quality samples for subsequent analyses. This step enhanced the reliability of the dataset, reducing the influence of outliers on differential expression and co-expression network analyses.
2.5. Weighted Co-Expression Network Construction and Module Trait Analysis
The normalized expression values were used to build the weighted gene co-expression network using the ‘WGCNA’ package. A soft-thresholding power of β = 8 was chosen to achieve a scale-free topology, with an R2 value of 0.944 (Figure 3A-B). This value balanced network connectivity with biological interpretability. At this threshold, 49 initial modules were identified (Supplementary Figure S5). Modules with eigengene correlations >0.75 were merged, resulting in 41 final modules (Figure 3C; Supplementary Figure S5).
The distribution of genes per module is detailed in Supplementary Table S2, with key modules including ‘turquoise’ (15.20%, 4,927 genes), ‘blue’ (9.65%, 3,127 genes), and ‘brown’ (8.87%, 2,875 genes). A total of 437 genes (1.34%) remained unclustered, forming the ‘grey60’ module.
The network was constructed using ‘signed’ adjacency to capture positive and negative correlations, critical for understanding the complex responses of citrus species and tissues to HLB under diverse conditions. Module-trait correlations (Figure 4; Supplementary Figure S5) revealed significant associations between modules and key variables: citrus species, tissue type, and DPI. Functional annotation of selected modules provided insights into potential biological roles in HLB responses.
2.6. Gene Significance and Module Membership Results
For the Citrus species trait, the co-expression analysis identified 242 genes with high correlations to citrus species, predominantly within the darkturquoise (positive correlation) and sienna3 (negative correlation) modules (Figure 4). Of these genes, only 17.36% (42 genes) were functionally annotated (Supplementary Table S2). This set may represent key molecular factors contributing to species-specific responses to HLB, providing a foundation for further exploration into resilience mechanisms across different citrus varieties.
The darkturquoise module, consisting of 987 genes, was associated with several key biological processes based on functional annotations from STRING and ClueGO. Using STRING with a species-specific analysis for Citrus sinensis and a confidence score cutoff of 0.4, we observed enrichment in genes related to cellular stress responses and metabolic processes, including the regulation of reactive oxygen species (ROS) and secondary metabolite biosynthesis pathways (Supplementary Table S3). One of the interesting findings in this module was the presence of genes involved in ribosomal protein synthesis, including Ribosomal protein S27a and Ribosomal protein L40e, which are part of the Ribosomal L40e family (InterPro domain IPR001975). These proteins are associated with essential functions in protein synthesis and cellular stress response mechanisms. The Ribosomal L40e gene family was particularly highlighted in the analysis with a significant FDR value (3.7E-4).
Additionally, the ClueGO analysis provided further insights, identifying three main functional groups: carotenoid biosynthesis (LOC102577969), manganese ion transmembrane transporter activity (LOC102617741), and protein peptidyl-prolyl isomerization (LOC102609233 and LOC102623858), linked to key processes like metabolite production, metal ion homeostasis, and protein folding (Figure 5). These functions were identified using a two-sided hypergeometric test with Bonferroni correction and GO Fusion enabled to group terms with a Kappa score threshold of 0.3. While the annotation highlighted important biological pathways, a substantial portion of genes in the module remained unannotated, suggesting the need for further exploration to uncover additional biological roles.
Due to the limited number of genes, the sienna3 module could not be annotated.
For Tissue type, 197 genes showed strong associations, primarily located in the brown (positive correlation) and black (negative correlation) modules (Figure 4). Functional annotation was achieved for 23.86% (47 genes) of this set, potentially indicating tissue-specific expression patterns in response to HLB infection (Supplementary Table S2). These genes may play roles in physiological adaptations specific to different tissues, such as defense mechanisms in leaves or metabolic adjustments in roots.
The brown module, encompassing 2,875 genes, is a prominent component of the co-expression network. Functional enrichment analyses using STRING and ClueGO revealed its significant role in chloroplast and plastid functions, essential for photosynthesis and energy metabolism. STRING analysis identified key functional categories such as chloroplast (FDR: 6.64E-17), plastid (FDR: 1.51E-16), and plastid compartments (FDR: 1.58E-15), highlighting the module's involvement in various plant biosynthetic pathways, particularly under stress conditions like HLB infection (Supplementary Table S3). Additionally, ClueGO identified enriched functional groups related to cytoplasm, intracellular membrane-bounded organelles, regulation of cellular processes, and organelle envelopes, further underscoring the module's importance in regulating chloroplast and plastid functions (Figure 6). Overall, these analyses suggest the brown module's central role in the plant's stress response during HLB infection, with its identified genes serving as potential targets for future research on HLB tolerance in citrus plants.
Regarding DPI, the analysis identified 41 genes with strong correlations. These genes were grouped within the lightyellow, blue, and yellow (positive correlation) and the purple (negative correlation) modules (Figure 4). Functional annotations were available for 26.83% (11 genes) in this set, which may provide insights into the temporal dynamics of gene expression in response to HLB (Supplementary Table S2). These genes highlight shifts in expression over time, potentially related to disease progression and defense responses.
The yellow module, comprising 2,401 genes, demonstrated strong functional associations based on annotations from STRING and ClueGO. Utilizing STRING with a species-specific analysis for C. sinensis and applying a confidence score cutoff of 0.4, we identified enrichment in genes involved in cellular structure and organization, particularly highlighting intracellular anatomical structures (p-value: 5.49E-9) and cellular response to stress (p-value: 6.03E-6) (Supplementary Table S3). Notable genes included those associated with the cytoplasm and membrane-bounded organelles, underscoring their roles in maintaining cellular integrity and function. The presence of stress-responsive genes, such as LOC102607298 and LOC102610142, suggests an adaptive mechanism to environmental stressors, evidenced by significant p-values (LOC102607298: 6.03E-6).
Moreover, the ClueGO analysis further elucidated the functional landscape of this module, classifying the genes into key functional groups, including cellular component organization, transport, and metabolic processes. Specifically, cellular component organization (Group 2) included genes like HMG and LOC102612408, which are critical for maintaining the structural organization of cells. The transport group (Group 3) identified several genes involved in the movement of substances across membranes, crucial for nutrient uptake and waste elimination (Figure 7). These findings were validated using a two-sided hypergeometric test with Bonferroni correction. Overall, while the annotations provided valuable insights into the biological roles of the yellow module, a substantial number of genes remain unannotated, indicating the need for further research to unravel their potential contributions to cellular processes.
2.7. Differential Gene Expression Analysis Across Selected Citrus Bioprojects
After identifying the modules most closely related to the selected variables—dpi (MEyellow), citrus species (MEdarkturquoise), and tissue type (MEbrown)—we examined differential gene expression across various conditions, treatments, citrus species, and tissues by selecting six relevant bioprojects: (1) 203307, which included mature and immature fruit and leaf samples from orange plants; (2) 417324, a study on infected versus uninfected orange leaves sampled at 56, 126, 182, and 322 dpi; (3) 557834, which analyzed leaf and spine samples from grapefruit plants with (W) and without thorn (TL), including mutants (T); (4) 629966, an analysis of orange feeder root samples taken at 0, 3, and 9 dpi, with Hoagland solution supplementation post-infection; (5) 739186, which analyzed symptomatic (S) versus asymptomatic (A) infected leaf samples of mandarin across four seasons (fall, spring, summer, winter); and (6) 755969, a comparison of infected leaf samples between finger lime and orange (extra data could be found in Supplementary Table S1). Reads from each dataset were processed independently through low-quality read removal, mapping against the C. sinensis DHSO v3.0 genome, read counting, and differential gene expression analysis with DESeq2 as detailed in the Materials and Methods. DEGs were filtered based on the modules of interest (MEyellow, MEdarkturquoise, MEbrown), then categorized into up and downregulated genes. An UpSet plot (Figure 8) was generated to highlight shared DEGs across different conditions, with panel A illustrating consistently upregulated genes and panel B showing consistently downregulated genes across multiple experimental conditions (Supplementary Table S4).
When analyzing the differentially expressed genes (DEGs), 338 genes in the 'brown' module were identified as upregulated and shared between conditions p557834_TL_vs_W and p557834_T_vs_W. Among these, 53 genes are associated with photosynthesis (GO:0015979), highlighting a significant regulatory response in key pathways for energy production and metabolic precursors, with a highly significant false discovery rate (FDR = 1.42E-48). Furthermore, 27 of these genes are specifically involved in light reactions of photosynthesis (GO:0019684), indicating a fine-tuned response in energy processes triggered by the treatment.
For the 'yellow' module, four upregulated genes - Cs_ont_6g021000.1, Cs_ont_6g018030.1, Cs_ont_8g022870.1 and Cs_ont_2g019500.1 - were identified in interactions with p417324-182-dpi, p417324-322-dpi, p739186-spring and p755969-lim-vs-or. These genes are involved in several biological processes and molecular functions, including DNA repair and interstrand cross-link repair, which are key to genomic stability. These processes include 'interstrand cross-link repair' (GO:0036297), 'meiosis I cell cycle process' (GO:0061982), 'DNA repair' (GO:0006281) and 'homologous chromosome pairing in meiosis' (GO:0007129). At the molecular level, significant functions identified are '5-flap endonuclease activity' (GO:0017108) and 'flap-structured DNA binding' (GO:0070336). The enrichment scores and low false discovery rates for these GO terms highlight the role of these genes in maintaining genomic integrity through repair mechanisms and meiosis-specific stages, suggesting involvement in the treatments and conditions under investigation.
In the darkturquoise module, 89 genes were identified as upregulated across the analyzed conditions, with Cs_ont_7g002890.1 selected as a key gene of interest. This gene is associated with the conditions p417324-56-dpi, p557834_TL_vs_W, and p557834_T_vs_W. It is involved in processes such as ‘response to other organisms’ (GO:0051707), ‘defense response to other organisms’ (GO:0098542) and ‘response to stress’ (GO:0006950), which are central to stress and defense responses. Enrichment analyses also revealed secondary metabolism and detoxification pathways. This gene is involved in the ‘Diterpenoid Biosynthesis’ pathway in KEGG, which is essential for the synthesis of defense-related compounds. In Reactome, it is involved in pathways such as ‘Cytochrome P450 - arranged by substrate type’ and ‘Phase I - Functionalization of compounds’, highlighting roles in the processing of xenobiotic and endogenous compounds that are critical for plant defense against environmental stressors and pathogens.
The brown module contains 38 downregulated genes associated with treatments p417324-322-dpi.txt and p739186-spring.txt. These genes are associated with several biological processes, including xanthophyll biosynthesis (GO:0016123), a carotenoid pathway associated with photosynthesis and protection against oxidative stress (involving five genes). Other related processes include terpenoid metabolism (GO:0006721), which is important for plant defense (involving six genes), and chloroplast localization (GO:0009507), which is essential for photosynthesis (involving 20 genes). Protein interactions reveal clustering in the xanthophyll biosynthesis and violaxanthin de-epoxidase activity pathways, key to light damage regulation in plants. These genes are also involved in the carotenoid biosynthesis pathway (KEGG map00906), which is critical for oxidative stress protection and photosynthesis. These data suggest that downregulated genes in the yellow module influence plant stress responses, particularly those related to photosynthesis and protective pigment synthesis.
The yellow module also includes 811 downregulated genes associated with bioproject 755969 that are linked to essential cellular processes. Notable categories such as 'cellular processes' (GO:0009987) and 'molecular binding' (GO:0005488) highlight the broad impact of these genes on cellular functions. They are mainly localized in intracellular components, organelles and cellular structures, with a notable involvement in metal ion transport (KW-0406), which is crucial for several metabolic processes. These results suggest that downregulation of genes in this module could enhance infection tolerance by modulating key cellular processes, particularly those related to intracellular organization and metal ion transport.
For downregulated genes in the darkturquoise module, 239 genes were identified across the analyzed conditions, with Cs_ont_9g027170.1 selected as the primary gene of interest. This gene is associated with p417324-182-dpi, p629966-9-dpi, and p739186-spring, and participates in folic acid biosynthetic processes vital for plant growth and resilience. Folic acid, a key B vitamin, supports DNA/RNA synthesis, cell division, and amino acid metabolism. In plants, low folate levels resulting from gene downregulation can lead to slower growth, malformed leaves and roots, chlorosis from reduced chlorophyll synthesis, decreased seed production, and heightened disease susceptibility. The gene is implicated in one-carbon metabolism (GO:0006730), small molecule metabolism (GO:0044281), and the biosynthesis of folic acid (GO:0009396) and tetrahydrofolate (GO:0046654). Functionally, it shows involvement in ‘tetrahydrofolylpolyglutamate synthase’ (GO:0004326) and ‘ATP-binding’ (GO:0005524) activities, with cellular localizations in the mitochondrion (GO:0005739) and cytosol (GO:0005829), crucial for metabolite synthesis and energy processing. STRING analysis shows interactions in folic acid and tetrahydrofolate synthesis pathways, and KEGG pathway map00790 further supports its role in folate synthesis, with additional links to vitamin and cofactor metabolism in Reactome (MAP-196757). This downregulation suggests a reduced metabolic capacity for folate synthesis, impacting growth and stress responses.
3. Discussion
Numerous studies have investigated the response of citrus to HLB disease [13] Over the past 15 years, the increasing use of large-scale plant sequencing technologies has enabled significant advances in transcriptome analysis, particularly through RNA sequencing [53,54]. Among these, the study by Martinelli et al. (2012) marked a pivotal transition from microarray to RNA-Seq technologies, providing deeper insights into citrus-pathogen interactions. The public availability of multiple datasets has also facilitated co-expression analysis, which critically depends on the number of available samples, data quality, and experimental design—factors that are essential for maximizing statistical power and minimizing the likelihood of false positives [56]. While in silico studies exploring the interaction between CLas and citrus have been reported [50,57], this work provides the first comprehensive analysis covering multiple citrus species, diverse tissues and different stages of infection. Previous studies relied on a range of datasets, such as metabolic pathway analysis using 13 samples from three bioprojects [57], or co-expression networks using 66 samples from six bioprojects, primarily using differential expression analysis to assess gene function [50].
In this study, data from 17 bioprojects (293 samples) were integrated to construct a global co-expression network of citrus plants affected by HLB. This large-scale approach allowed the identification of 41 biologically meaningful modules associated with key experimental factors, including citrus species (e.g., sweet orange and mandarin), tissue type (e.g., leaves, fruits, roots), and days post-infection (DPI), representing different stages of HLB progression. By leveraging a significantly larger and more diverse dataset, this study provides a deep understanding of citrus-pathogen interactions and highlights potential gene regulatory hubs and pathways relevant to HLB disease progression.
The darkturquoise module, closely associated with citrus species, exhibited a strong enrichment in stress response pathways, highlighting its role in species-specific defenses against HLB. Functional enrichment analyses revealed processes such as reactive oxygen species (ROS) regulation, secondary metabolite biosynthesis, and ribosomal protein synthesis, aligning with evidence that CLas infection induces ROS production, damaging phloem tissues and exacerbating HLB symptoms [36,58]. Antioxidant mechanisms, such as glutathione-S-transferases (GSTs), and secondary metabolites like terpenoids and flavonoids, are well-documented for mitigating oxidative stress and restricting pathogen growth in citrus [59–64]. While these specific components were not directly annotated among the module's genes, their established roles in ROS detoxification and secondary metabolite biosynthesis suggest that similar mechanisms could be active within this module. Hormonal signaling pathways—including abscisic acid (ABA), salicylic acid (SA), and jasmonic acid (JA)—key regulators of immune responses in tolerant citrus genotypes [36], may also be indirectly represented in the module's gene set. Although receptor-like kinases (RLKs), key players in pathogen recognition and immune activation, were not identified, their known roles suggest that this module contributes to species-specific defense mechanisms. The presence of ribosomal components indicates that the module may support rapid protein synthesis, essential for cellular repair and reprogramming gene expression under stress conditions [65,66]. Further supporting its relevance, two key genes within this module were examined through DEG analysis across multiple bioprojects. The upregulated gene Cs_ont_7g002890.1, linked to diterpenoid biosynthesis and detoxification pathways, was detected in early infection stages in susceptible orange genotypes, possibly as a rapid defense response, and in two grapefruit genotypes—a thornless line and a mutant with partial recovery—suggesting its association with tolerance mechanisms. Conversely, the downregulated gene Cs_ont_9g027170.1 was identified in feeder roots of orange trees at 9 dpi, in long-term infected mandarins during spring, and in oranges at 182 dpi, potentially reflecting metabolic adjustments in tissues experiencing prolonged stress and nutrient imbalances.
The brown module, closely associated with tissue-specific expression patterns, plays a pivotal role in coordinating chloroplast and plastid functions, which are critical for maintaining photosynthesis and energy metabolism under HLB-induced stress. Genes in this module showed a strong positive correlation with tissue traits, suggesting that distinct organs activate specialized metabolic or defense pathways in response to CLas infection. This tissue specificity reflects how particular organs prioritize processes such as photosynthesis, defense, or carbohydrate partitioning to adapt to infection, consistent with studies linking phloem blockage, abnormal starch accumulation, and chlorotic symptoms to HLB-induced stress [67,68]. HLB infection disrupts photosynthetic processes and chloroplast homeostasis, leading to decreased chlorophyll fluorescence, chloroplast degradation, impaired energy metabolism, and starch granule accumulation in chloroplasts, which further compromise functionality [19,62,69]. Differential physiological and molecular responses among citrus varieties have shown heightened stress responses in some species, such as increased ROS scavenging enzymes, proline accumulation, and starch content in infected tissues [39]. STRING and ClueGO analyses further emphasized the biological significance of this module in regulating intracellular organelle functions, particularly chloroplast homeostasis and cellular metabolic adjustments, consistent with systemic effects of CLas infection, including callose deposition, phloem collapse, and reactive oxygen species (ROS) production, which impair energy and sugar metabolism pathways [58,70]. Among the most prominent genes in this module are those encoding plastid lipid-associated proteins, photosystem I and II subunits, and chlorophyll-binding proteins. Their altered expression, including components such as LHCb1, PSBT, and PSB27, underscores the inhibition of photosynthetic machinery as a hallmark of HLB-induced stress [18]. The transcriptional shifts observed in the brown module highlight a metabolic reprogramming aimed at mitigating HLB-induced damage, particularly in pathways related to photosynthesis and oxidative stress protection. In tolerant grapefruit, the upregulation of genes involved in photosynthesis and light reactions underscores the importance of maintaining energy production and metabolic precursors to preserve chloroplast integrity under infection. In contrast, susceptible citrus species, such as orange and mandarin, exhibit significant downregulation of genes associated with xanthophyll biosynthesis and terpenoid metabolism, pathways crucial for photoprotection and defense. Xanthophylls, such as neoxanthin, play a key role in this context by absorbing excess light energy to drive photosynthesis while preventing the formation of reactive oxygen species (ROS) that can cause cellular damage [71]. This aligns with studies showing that more tolerant citrus species, such as C. ichangensis, experience less disruption in photosynthetic and starch metabolism genes, thereby preserving chloroplast function during infection [18,21].
The yellow module, closely associated with days post-infection (DPI), underscores its dynamic role in coordinating cellular responses during HLB progression. This module encompasses genes involved in nuclear and cytoplasmic functions, such as transcriptional regulation, protein complexes, and amino acid metabolism, highlighting the active engagement of cellular pathways in response to infection. Transcription factors (TFs) such as WRKY and ethylene-responsive factors (ERFs) are critical components, with families like WRKY showing differential expression between tolerant and susceptible genotypes. In C. sinensis (susceptible genotype) and Poncirus trifoliata (tolerant genotype), 52 and 51 WRKY TFs were identified, respectively, with significant expression changes observed post-infection and after salicylic acid treatment [72]. WRKYs like WRKY60, WRKY70, WRKY40, and WRKY33 are upregulated in young citrus leaves 32 weeks post-artificial CLas infection in C. sinensis, with WRKY48 reported as the only factor consistently modulated across multiple transcriptomic datasets (Balan et al., 2018). In tolerant genotypes, WRKY factors are generally upregulated, while in susceptible species, many are repressed, suggesting their role in susceptibility or resistance [73]. ERFs like ERF9 contribute to defense pathways and transcriptional reprogramming during Clas invasion [50]. AP2-EREBPs such as SHN1 and CRF1 are induced in young, infected leaves, with specific members like WRI1 and ERE-BPs showing upregulation in field-symptomatic leaves [57]. Other transcriptional regulators, including MYBs and MADS-box TFs, are associated with HLB tolerance in resistant genotypes [57]. Amino acid metabolism plays a crucial role in plant defense, with genes like shikimate dehydrogenase, chorismate mutase, and homoserine dehydrogenase strongly upregulated in young leaves 32 weeks after infection [57]. Amino acids like lysine and tyrosine serve as precursors for salicylic acid and phenolic compounds involved in systemic acquired resistance [74,75]. The ubiquitin-proteasome system is also critical [76], as pathogens like CLas exploit it to alter host metabolism and facilitate amino acid availability, with differential expressions of genes like E3 ubiquitin ligases observed between P. trifoliata and C. sinensis [62,77]. The upregulation of receptors like leucine-rich repeat receptor-like kinases (LRR-RLKs) and G-type lectin S-receptor kinases in tolerant genotypes, and their downregulation in susceptible plants, suggests their involvement in immune responses [57]. Heat shock proteins (HSPs), such as HSP70 and HSP82, are reduced in HLB-infected trees, compromising cellular homeostasis [55,78]. Collectively, these findings underscore the importance of transcriptional reprogramming, metabolic adaptation, and protein turnover in shaping plant responses to HLB, reflecting the yellow module's role in coordinating cellular responses over time [63,79].
These findings highlight the importance of transcriptional reprogramming, metabolic adaptation, and protein turnover in shaping the plant’s response to HLB infection. The integration of these mechanisms underscores the complexity of host-pathogen interactions and offers valuable insights into potential targets for early diagnostic and therapeutic interventions [63,79]. Furthermore, the significant proportion of unannotated genes in the darkturquoise, brown, and yellow modules points to the need for further research to uncover their potential contributions to citrus defense mechanisms. Together, these findings emphasize the central role of these modules in orchestrating stress responses and pathogen defense, while providing a promising framework for future studies aimed at unraveling their uncharacterized genetic components and their potential role in HLB tolerance mechanisms.
4. Materials and Methods
4.1. Data Acquisition
We selected 17 bioprojects related to Huanglongbing (HLB) treatment and various Citrus species, along with other treatment conditions. A total of 293 RNA-seq samples were obtained from the Sequence Read Archive (SRA) (NCBI), spanning five Citrus species or hybrids: grapefruit (Citrus × paradisi), lemon (Citrus × limon), lime (Citrus × aurantiifolia), mandarin (Citrus reticulata), and sweet orange (Citrus × sinensis). These samples cover nine tissue types, including buds, calyx abscission zone, fruit, leaf, midribs, thorn, feeder roots, roots, and protoplasts derived from embryogenic calli. Detailed information on the SRA studies and associated metadata can be found in Supplementary Table S1.
4.2. Quality Control and Mapping of Data
Sequence quality for each sample was assessed using FastQC (Andrews, 2010). Adaptors and low-quality reads were removed with Trimmomatic v0.39 (Bolger et al., 2014).The samples were aligned to both Citrus sinensis DHSO v3.0 [69] and Citrus clementina v1.0 [81] reference genomes, and mapping efficiency was evaluated based on uniquely mapped reads for STAR v2.7.10b [51] and the ‘aligned concordantly exactly 1 time’ metric for HISAT2 v2.2.1 [82] aligners with default parameters. This multi-alignment approach was used to compare alignment percentages between the clementine and sweet orange genomes, and the genome with the highest alignment efficiency was selected for further analysis. Samples with less than 60% alignment were excluded. Gene expression levels were quantified using featureCounts v2.0.3 [83], assigning counts to ‘transcript_id’ instead of ‘gene_id’, as the goal of the study was to focus on transcript-level gene expression.
4.3. Data Normalization and Outlier Detection
Count data were normalized using a variance-stabilizing transformation (VST) from the DESeq2 R package v1.30.1 [84] to reduce the influence of high-count values and stabilize variance across expression levels, making the data suitable for downstream analyses. Outlier detection was performed using hierarchical clustering with Pearson correlation as the similarity measure. Sample dissimilarity was calculated as 1−correlation, and clustering was conducted with the average linkage method. A dendrogram was generated to visualize sample relationships, and a height cutoff of 1.5 was applied to exclude outliers. This step minimized the influence of technical variability, leaving high-quality samples for further analyses, including differential expression and co-expression network construction. A workflow summarizing the analysis pipeline is presented in Supplementary Figure S6.
4.4. Weighted Gene Co-Expression Network Analysis
A weighted gene co-expression network analysis (WGCNA) was performed to identify clusters of highly correlated genes and potential regulatory candidates or biomarkers [46]. The analysis was conducted using the WGCNA R package (v1.7.1). Pearson correlation was initially used as a similarity measure to calculate adjacency, which was then transformed into a signed topological overlap matrix (TOM) to minimize noise and spurious associations. The network construction parameters, such as soft-thresholding power (β), merge cut height, and minimum module size, were optimized to fit a scale-free topology. The soft-thresholding power was selected using the function pickSoftThreshold, which analyzes network topology to choose an appropriate power. Based on the approximate scale-free topology criteria, we selected a power suitable for a high scale-free topology fit (R2 ≥ 0.90) with an acceptable level of network connectivity. For module detection, the deep split parameter was set to 2, the merge cut height was set to 0.25, and the minimum module size was set to 30 genes. This process allowed the identification of distinct modules, which were further analyzed for biological relevance.
4.5. Gene Significance (GS) and Module Membership (MM) Evaluation
To evaluate the association of each gene with traits of interest (citrus species, tissue, days post-infection (DPI), and treatment), Gene Significance (GS) was defined as the correlation between the gene expression and the trait in question. Similarly, Module Membership (MM) was calculated as the correlation between the module eigengene and each gene's expression profile. These values allow us to assess the importance of genes within their respective modules and their relationship with the traits under study.
4.6. Functional Annotation and Network Visualization
The protein sequences of Citrus sinensis DHSO v3.0 were initially unannotated. To address this, we used the Uniprot protein database specific to Citrus sinensis (taxonomy_id: 2711), accessed on 1st September 2024 (https://www.uniprot.org/uniprotkb?query=%28taxonomy_id%3A2711%29). Protein alignments were conducted using the blastp command from BLAST+ v2.16.0 to identify the best matches, selecting candidates based on the lowest e-values, with a cut-off set at 0.001. This approach enabled us to integrate high-quality, curated data from Uniprot into our dataset, effectively linking Uniprot identifiers to our protein sequences, as no direct mapping to UniprotID or entrezgeneID was previously available. The annotated and merged dataset was subsequently used for downstream analysis. For functional annotation and exploration of protein-protein interaction networks, we utilized Cytoscape v3.10.2 [85], along with stringApp v2.1.1 [86] and ClueGO v2.5.10 [87], integrated with CluePedia v1.5.10 for enhanced pathway insights. These analyses focused on modules associated with key study variables—days post infection (dpi), citrus species, and tissue type—all of which showed strong correlations with gene expression patterns. Shared DEGs across different conditions in each bioproject were identified, and their intersections were visualized using an UpSet plot generated with the UpSetR package, highlighting genes that are consistently differentially expressed across varying conditions. These shared DEGs were subsequently analyzed for functional interactions and annotations using the previously described protein dataset and STRING-based network tools.
5. Conclusions
This study presents a comprehensive co-expression network analysis of HLB-affected citrus plants, providing new insights into the molecular basis of the disease. The identification of 41 biologically significant modules, including darkturquoise, brown, and yellow, underscores key pathways implicated in species-specific defenses, tissue-specific metabolic adaptations, and dynamic infection responses. Functional analyses highlight the critical roles of oxidative stress regulation, photosynthesis and transcriptional reprogramming in HLB progression and tolerance. These findings provide a valuable resource for citrus breeders, enabling them to prioritize genes and pathways associated with HLB tolerance in breeding programs. This foundational research paves the way for developing innovative strategies for HLB management, such as employing gene editing to enhance plant defenses. To advance our understanding of HLB pathogenesis, further experimental validation of the functional significance of these co-expression modules is essential.
Supplementary Materials
The following supporting information can be downloaded at the website of this paper posted on Preprints.org. Figure S1: Statistical summary of mapping performance (STAR vs. HISAT2); Figure S2: Multidimensional Scaling analysis analysis (MDS) showing distinct clustering of 230 RNA-seq samples by Citrus species (3A) and bioprojects (3B); Figure S3: Hierarchical clustering dendrogram of gene expression samples based on Pearson correlation; Figure S4: Hierarchical clustering of module eigengenes based on their correlation; Figure S5: Eigengene network and module-trait relationships; Figure S6: Bioinformatic workflow describing sample processing for co-expression network analysis and differential expression analysis (DEGs); Table S1: Detailed information on RNA-seq samples and alignment comparison (STAR vs. HISAT2); Table S2: Gene count and functional annotation for modules, focusing on darkturquoise, brown, and yellow modules; Table S3: Results of functional enrichment analysis for identified modules (STRING); Table S4: Functional enrichment analysis of differentially expressed genes (DEGs) identified in the UpSet plots for key modules.
Author Contributions
R.M., S.M., M.R., G.C, P. F. planned and designed the research. R.M. performed the experiments. R.M., S.M., M.R. and P.F. analyzed the data. R.M., S.M., C.G., M.R., G.C. and P.F. wrote the manuscript. G.S.A. supplied the resources. M.S., M.R. and P.F. reviewed and validated the manuscript with the contribution of all authors. All authors have read and agreed to the published version of the manuscript.
Funding
This research was funded by the National Institute of Agricultural Technology, Secretariat for Agriculture, Livestock and Fisheries, Ministry of Economy 2019-PD-E4-I101-001; 2023-PD-L01-I106; 2023-PE-L01-I051.
Data Availability Statement
All data is in the public domain.
Acknowledgments
This work used computational resources from BIOCAD, IABIMo- UEDD INTA CONICET, Programa de Sustentabilidad y Competitividad Forestal/BID 2853/Oc-Ar, Consorcio Argentino de Tecnología Genómica, MinCyT PPL 2011 004. We also acknowledge the Galaxy Team and the European Galaxy server (https://usegalaxy.eu) for providing access to their platform and tools, which facilitated data analysis in this study. The Galaxy platform is a free and open resource for scientific research, and its availability greatly contributed to the success of this work.
Conflicts of Interest
The authors declare no conflict of interest.
References
- Bové, J.M. Huanglongbing: A Destructive, Newly-Emerging, Century-Old Disease of Citrus. Journal of Plant Pathology 2006, 88, 7–37. [Google Scholar]
- Gottwald, T.R. Current Epidemiological Understanding of Citrus Huanglongbing *. Annu. Rev. Phytopathol 2010, 48, 119–139. [Google Scholar] [CrossRef]
- Ghosh, D.; Kokane, S.; Savita, B.K.; Kumar, P.; Sharma, A.K.; Ozcan, A.; Kokane, A.; Santra, S. Huanglongbing Pandemic: Current Challenges and Emerging Management Strategies. Plants 2023, 12. [Google Scholar] [CrossRef] [PubMed]
- Reinking, O.A. Diseases of Economic Plants in Southern China. Philippine Agriculturist 1919, 8, 109–134. [Google Scholar]
- Husain, M.A. Dina Nath The Citrus Psylla (Diaphorina Citri, Kuw.) Psyllidae: Homoptera. Memoirs of the Dept. Agri. India Entomol. Series 1927, 10, 5–27. [Google Scholar]
- Capoor, S.P. Decline of Citrus Trees in India. Bull Natl Inst Sci India 1963, 24, 48–64. [Google Scholar]
- Van der Merwe, A.J.; Anderssen, F.G. Chromium and Manganese Toxicity. Is It Important in Transvaal Citrus Growing? Farm 1937, 12, 439–440. [Google Scholar]
- Ghosh, D.; Kokane, S.; Savita, B.K.; Kumar, P.; Sharma, A.K.; Ozcan, A.; Kokane, A.; Santra, S. Huanglongbing Pandemic: Current Challenges and Emerging Management Strategies. Plants 2023, 12, 160. [Google Scholar] [CrossRef] [PubMed]
- Boa, E. Citrus Huanglongbing (Greening) Disease. Plant Health Cases 2023. [Google Scholar] [CrossRef]
- Coletta-Filho, H.D.; Targon, M.L.P.N.; Takita, M.A.; De Negri, J.D.; Pompeu, J.; Machado, M.A.; do Amaral, A.M.; Muller, G.W. First Report of the Causal Agent of Huanglongbing (“Candidatus Liberibacter Asiaticus”) in Brazil. Plant Dis 2004, 88, 1382. [Google Scholar] [CrossRef]
- Halbert, S.E. The Discovery of Huanglongbing in Florida. In Proceedings of the International Citrus Canker and Huanglongbing Research Workshop, Orlando, FL, USA, 7–11 November 2005. [Google Scholar]
- European and Mediterranean Plant Protection Organization ‘Candidatus Liberibacter Asiaticus’. EPPO Datasheets on Pests Recommended for Regulation. Available online: https://gd.eppo.int/taxon/LIBEAS/distribution (accessed on 14 September 2024).
- Usman, H.M.; Saleem, U.; Shafique, T. Decoding Huanglongbing: Understanding the Origins, Impacts, and Remedies for Citrus Greening. Phytopathogenomics and Disease Control 2023, 2, 13–20. [Google Scholar] [CrossRef]
- Dala-Paula, B.M.; Plotto, A.; Bai, J.; Manthey, J.A.; Baldwin, E.A.; Ferrarezi, R.S.; Gloria, M.B.A. Effect of Huanglongbing or Greening Disease on Orange Juice Quality, a Review. Front Plant Sci 2019, 9, 1–19. [Google Scholar] [CrossRef] [PubMed]
- Weber, K.C.; Mahmoud, L.M.; Stanton, D.; Welker, S.; Qiu, W.; Grosser, J.W.; Levy, A.; Dutt, M. Insights into the Mechanism of Huanglongbing Tolerance in the Australian Finger Lime (Citrus Australasica). Front Plant Sci 2022, 13. [Google Scholar] [CrossRef] [PubMed]
- Peng, Z.; Bredeson, J.V.; Wu, G.A.; Shu, S.; Rawat, N.; Du, D.; Parajuli, S.; Yu, Q.; You, Q.; Rokhsar, D.S.; et al. A Chromosome-Scale Reference Genome of Trifoliate Orange (Poncirus Trifoliata) Provides Insights into Disease Resistance, Cold Tolerance and Genome Evolution in Citrus. Plant Journal 2020, 104, 1215–1232. [Google Scholar] [CrossRef] [PubMed]
- Killiny, N.; Jones, S.E.; Nehela, Y.; Hijaz, F.; Dutt, M.; Gmitter, F.G.; Grosser, J.W. All Roads Lead to Rome: Towards Understanding Different Avenues of Tolerance to Huanglongbing in Citrus Cultivars. Plant Physiology and Biochemistry 2018, 129, 1–10. [Google Scholar] [CrossRef] [PubMed]
- Wu, H.; Hu, Y.; Fu, S.; Zhou, C.; Wang, X. Coordination of Multiple Regulation Pathways Contributes to the Tolerance of a Wild Citrus Species (Citrus Ichangensis ‘2586’) against Huanglongbing. Physiol Mol Plant Pathol 2020, 109. [Google Scholar] [CrossRef]
- Folimonova, S.Y.; Robertson, C.J.; Garnsey, S.M.; Gowda, S.; Dawson, W.O. Examination of the Responses of Different Genotypes of Citrus to Huanglongbing (Citrus Greening) under Different Conditions. Phytopathology 2009, 99, 1346–1354. [Google Scholar] [CrossRef] [PubMed]
- Zou, X.; Bai, X.; Wen, Q.; Xie, Z.; Wu, L.; Peng, A.; He, Y.; Xu, L.; Chen, S. Comparative Analysis of Tolerant and Susceptible Citrus Reveals the Role of Methyl Salicylate Signaling in the Response to Huanglongbing. J Plant Growth Regul 2019, 38, 1516–1528. [Google Scholar] [CrossRef]
- Hu, Y.; Zhong, X.; Liu, X.; Lou, B.; Zhou, C.; Wang, X. Comparative Transcriptome Analysis Unveils the Tolerance Mechanisms of Citrus Hystrix in Response to “Candidatus Liberibacter Asiaticus” Infection. PLoS One 2017, 12. [Google Scholar] [CrossRef]
- Wang, Y.; Zhou, L.; Yu, X.; Stover, E.; Luo, F.; Duan, Y. Transcriptome Profiling of Huanglongbing (HLB) Tolerant and Susceptible Citrus Plants Reveals the Role of Basal Resistance in HLB Tolerance. Front Plant Sci 2016, 7. [Google Scholar] [CrossRef]
- Ramadugu, C.; Keremane, M.L.; Halbert, S.E.; Duan, Y.P.; Roose, M.L.; Stover, E.; Lee, R.F. Long-Term Field Evaluation Reveals Huanglongbing Resistance in Citrus Relatives. Plant Dis 2016, 100, 1858–1869. [Google Scholar] [CrossRef]
- Miles, G.P.; Stover, E.; Ramadugu, C.; Keremane, M.L.; Lee, R.F. Apparent Tolerance to Huanglongbing in Citrus and Citrus-Related Germplasm. HortScience 2017, 52, 31–39. [Google Scholar] [CrossRef]
- Alves, M.N.; Lopes, S.A.; Raiol-Junior, L.L.; Wulff, N.A.; Girardi, E.A.; Ollitrault, P.; Peña, L. Resistance to ‘Candidatus Liberibacter Asiaticus,’ the Huanglongbing Associated Bacterium, in Sexually and/or Graft-Compatible Citrus Relatives. Front Plant Sci 2021, 11. [Google Scholar] [CrossRef] [PubMed]
- Huang, C.Y.; Niu, D.D.; Kund, G.; Jones, M.; Albrecht, U.; Nguyen, L.; Bui, C.; Ramadugu, C.; Bowman, K.D.; Trumble, J.; et al. Identification of Citrus Immune Regulators Involved in Defence against Huanglongbing Using a New Functional Screening System. Plant Biotechnol J 2021, 19, 757–766. [Google Scholar] [CrossRef] [PubMed]
- Sivager, G.; Calvez, L.; Bruyere, S.; Boisne-Noc, R.; Brat, P.; Gros, O.; Ollitrault, P.; Morillon, R. Specific Physiological and Anatomical Traits Associated With Polyploidy and Better Detoxification Processes Contribute to Improved Huanglongbing Tolerance of the Persian Lime Compared With the Mexican Lime. Front Plant Sci 2021, 12. [Google Scholar] [CrossRef]
- Thapa, S.P.; De Francesco, A.; Trinh, J.; Gurung, F.B.; Pang, Z.; Vidalakis, G.; Wang, N.; Ancona, V.; Ma, W.; Coaker, G. Genome-Wide Analyses of Liberibacter Species Provides Insights into Evolution, Phylogenetic Relationships, and Virulence Factors. Mol Plant Pathol 2020, 21, 716–731. [Google Scholar] [CrossRef] [PubMed]
- Batarseh, T.N.; Batarseh, S.N.; Morales-Cruz, A.; Gaut, B.S. Comparative Genomics of the Liberibacter Genus Reveals Widespread Diversity in Genomic Content and Positive Selection History. Front Microbiol 2023, 14. [Google Scholar] [CrossRef] [PubMed]
- Wang, N.; Pierson, E.A.; Setubal, J.C.; Xu, J.; Levy, J.G.; Zhang, Y.; Li, J.; Rangel, L.T.; Martins, J. The Candidatus Liberibacter-Host Interface: Insights into Pathogenesis Mechanisms and Disease Control. Annu Rev Phytopathol 2017. [Google Scholar] [CrossRef] [PubMed]
- Guo, C.F.; Kong, W.Z.; Mukangango, M.; Hu, Y.W.; Liu, Y.T.; Sang, W.; Qiu, B.L. Distribution and Dynamic Changes of Huanglongbing Pathogen in Its Insect Vector Diaphorina Citri. Front Cell Infect Microbiol 2024, 14. [Google Scholar] [CrossRef] [PubMed]
- Endarto, O.; Wicaksono, R.C.; Wuryantini, S.; Tarno, H.; Nurindah. Climate Change Mitigation and Seasonal Infestation Patterns of Citrus Psyllid Diaphorina Citri: Implications for Managing Huanglongbing (HLB) Disease in Tangerine Citrus. IOP Conference Series: Earth and Environmental Science 2024, 1346, 012003. [Google Scholar] [CrossRef]
- Pierson, E.A.; Cubero, J.; Roper, C.; Brown, J.K.; Bock, C.H.; Wang, N. ‘Candidatus Liberibacter’ Pathosystems at the Forefront of Agricultural and Biological Research Challenges. Phytopathology 2022, 112, 7–10. [Google Scholar] [CrossRef] [PubMed]
- Yao, L.; Guo, X.; Su, J.; Zhang, Q.; Lian, M.; Xue, H.; Li, Q.; He, Y.; Zou, X.; Song, Z.; et al. ABA-CsABI5-CsCalS11 Module Upregulates Callose Deposition of Citrus Infected with Candidatus Liberibacter Asiaticus. Hortic Res 2024, 11. [Google Scholar] [CrossRef]
- Basu, S.; Huynh, L.; Zhang, S.; Rabara, R.; Nguyen, H.; Velásquez Guzmán, J.; Hao, G.; Miles, G.; Shi, Q.; Stover, E.; et al. Two Liberibacter Proteins Combine to Suppress Critical Innate Immune Defenses in Citrus. Front Plant Sci 2022, 13. [Google Scholar] [CrossRef]
- Pandey, S.S.; Xu, J.; Achor, D.S.; Li, J.; Wang, N. Microscopic and Transcriptomic Analyses of Early Events Triggered by ‘Candidatus Liberibacter Asiaticus’ in Young Flushes of Huanglongbing-Positive Citrus Trees. Phytopathology 2023, 113, 985–997. [Google Scholar] [CrossRef] [PubMed]
- Bernardini, C.; Turner, D.; Wang, C.; Welker, S.; Achor, D.; Artiga, Y.A.; Turgeon, R.; Levy, A. Candidatus Liberibacter Asiaticus Reduces Callose and reactive Oxygen Species Production in the Phloem. bioRxiv 2022. [Google Scholar]
- Shi, J.; Gong, Y.; Shi, H.; Ma, X.; Zhu, Y.; Yang, F.; Wang, D.; Fu, Y.; Lin, Y.; Yang, N.; et al. ‘Candidatus Liberibacter Asiaticus’ Secretory Protein SDE3 Inhibits Host Autophagy to Promote Huanglongbing Disease in Citrus. Autophagy 2023, 19, 2558–2574. [Google Scholar] [CrossRef]
- Wu, F.; Liu, L.; Fox, E.G.P.; Deng, X.; Xu, M.; Zheng, Z.; Li, X.; Fu, J.; Zhu, H.; Huang, J.; et al. Physiological Variables Influenced by ‘Candidatus Liberibacter Asiaticus’ Infection in Two Citrus Species. Plant Dis 2023, 107, 1769–1776. [Google Scholar] [CrossRef] [PubMed]
- Fan, J.; Chen, C.; Yu, Q.; Khalaf, A.; Achor, D.S.; Brlansky, R.H.; Moore, G.A.; Li, Z.G.; Gmitter, F.G. Comparative Transcriptional and Anatomical Analyses of Tolerant Rough Lemon and Susceptible Sweet Orange in Response to “Candidatus Liberibacter Asiaticus” Infection. Molecular Plant-Microbe Interactions 2012, 25, 1396–1407. [Google Scholar] [CrossRef]
- Yu, Q.; Chen, C.; Du, D.; Huang, M.; Yao, J.; Yu, F.; Brlansky, R.H.; Gmitter, F.G. Reprogramming of a Defense Signaling Pathway in Rough Lemon and Sweet Orange Is a Critical Element of the Early Response to Candidatus Liberibacter Asiaticus. Hortic Res 2017, 4. [Google Scholar] [CrossRef] [PubMed]
- Ribeiro, C.; Xu, J.; Hendrich, C.; Pandey, S.S.; Yu, Q.; Jr, F.G.G.; Wang, N. Seasonal Transcriptome Profiling of Susceptible and Tolerant Citrus Cultivars to Citrus Huanglongbing. Phytopathology 2023, 113, 286–298. [Google Scholar] [CrossRef] [PubMed]
- Zhuo, X.; Yu, Q.; Russo, R.; Zhang, Y.; Wei, X.; Wang, Y.Z.; Holden, P.M.; Gmitter, F.G. Role of Long Non-Coding RNA in Regulatory Network Response to Candidatus Liberibacter Asiaticus in Citrus. Front Plant Sci 2023, 14, 1–17. [Google Scholar] [CrossRef]
- Weber, K.C.; Mahmoud, L.M.; Stanton, D.; Welker, S.; Qiu, W.; Grosser, J.W.; Levy, A.; Dutt, M. Insights into the Mechanism of Huanglongbing Tolerance in the Australian Finger Lime (Citrus Australasica). Front Plant Sci 2022, 13. [Google Scholar] [CrossRef] [PubMed]
- Wei, X.; Mira, A.; Yu, Q.; Gmitter, F.G. The Mechanism of Citrus Host Defense Response Repression at Early Stages of Infection by Feeding of Diaphorina Citri Transmitting Candidatus Liberibacter Asiaticus. Front Plant Sci 2021, 12, 1–22. [Google Scholar] [CrossRef]
- Langfelder, P.; Horvath, S. WGCNA: An R Package for Weighted Correlation Network Analysis. BMC Bioinformatics 2008, 9. [Google Scholar] [CrossRef]
- Wang, Y.; Zhang, K.; Chen, D.; Liu, K.; Chen, W.; He, F.; Tong, Z.; Luo, Q. Co-Expression Network Analysis and Identification of Core Genes in the Interaction between Wheat and Puccinia Striiformis f. Sp. Tritici. Arch Microbiol 2024, 206, 241. [Google Scholar] [CrossRef] [PubMed]
- Peng, J.; Wang, P.; Fang, H.; Zheng, J.; Zhong, C.; Yang, Y.; Yu, W. Weighted Gene Co-Expression Analysis Network-Based Analysis on the Candidate Pathways and Hub Genes in Eggplant Bacterial Wilt-Resistance: A Plant Research Study. Int J Mol Sci 2021, 22, 13279. [Google Scholar] [CrossRef]
- Gao, P.; Wei, H.; Liu, J.; Chen, Z.; Qi, Y.; Wu, Z.; Huang, F.; Yu, L. Weighted Gene Coexpression Network Analysis of Candidate Pathways and Genes in Soft Rot Resistance of Amorphophallus. Journal of the American Society for Horticultural Science 2022, 147, 322–333. [Google Scholar] [CrossRef]
- Li, R.; Wang, X.; Hu, Y.; Huang, G. Analysis of Huanglongbing-Associated RNA-Seq Data Reveals Disturbances in Biological Processes within Citrus Spp. Triggered by Candidatus Liberibacter Asiaticus Infection. Front Plant Sci 2024, 15. [Google Scholar] [CrossRef]
- Dobin, A.; Davis, C.A.; Schlesinger, F.; Drenkow, J.; Zaleski, C.; Jha, S.; Batut, P.; Chaisson, M.; Gingeras, T.R. STAR: Ultrafast Universal RNA-Seq Aligner. Bioinformatics 2013, 29, 15–21. [Google Scholar] [CrossRef]
- Bianchi, A.; Di Marco, A.; Pellegrini, C. Comparing HISAT and STAR-Based Pipelines for RNA-Seq Data Analysis: A Real Experience. In Proceedings of the IEEE Symposium on Computer-Based Medical Systems; Institute of Electrical and Electronics Engineers Inc., 2023; Vol. 2023, pp. 218–224. [Google Scholar]
- Wang, Z.; Gerstein, M.; Snyder, M. RNA-Seq: A Revolutionary Tool for Transcriptomics. Nat Rev Genet 2009, 10, 57–63. [Google Scholar] [CrossRef] [PubMed]
- Martin, L.B.B.; Fei, Z.; Giovannoni, J.J.; Rose, J.K.C. Catalyzing Plant Science Research with RNA-Seq. Front Plant Sci 2013, 4. [Google Scholar] [CrossRef] [PubMed]
- Martinelli, F.; Uratsu, S.L.; Albrecht, U.; Reagan, R.L.; Phu, M.L.; Britton, M.; Buffalo, V.; Fass, J.; Leicht, E.; Zhao, W.; et al. Transcriptome Profiling of Citrus Fruit Response to Huanglongbing Disease. PLoS One 2012, 7. [Google Scholar] [CrossRef] [PubMed]
- van Dam, S.; Võsa, U.; van der Graaf, A.; Franke, L.; de Magalhães, J.P. Gene Co-Expression Analysis for Functional Classification and Gene-Disease Predictions. Brief Bioinform 2018, 19, 575–592. [Google Scholar] [CrossRef] [PubMed]
- Balan, B.; Ibáñez, A.M.; Dandekar, A.M.; Caruso, T.; Martinelli, F. Identifying Host Molecular Features Strongly Linked With Responses to Huanglongbing Disease in Citrus Leaves. Front Plant Sci 2018, 9, 1–13. [Google Scholar] [CrossRef] [PubMed]
- Ma, W.; Pang, Z.; Huang, X.; Xu, J.; Pandey, S.S.; Li, J.; Achor, D.S.; Vasconcelos, F.N.C.; Hendrich, C.; Huang, Y.; et al. Citrus Huanglongbing Is a Pathogen-Triggered Immune Disease That Can Be Mitigated with Antioxidants and Gibberellin. Nat Commun 2022, 13. [Google Scholar] [CrossRef]
- Hijaz, F.; Manthey, J.A.; Van der Merwe, D.; Killiny, N. Nucleotides, Micro- and Macro-Nutrients, Limonoids, Flavonoids, and Hydroxycinnamates Composition in the Phloem Sap of Sweet Orange. Plant Signal Behav 2016, 11. [Google Scholar] [CrossRef] [PubMed]
- Medicine National Academies of Sciences, Engineering; Division on Earth and Life Studies. A Review of the Citrus Greening Research and Development Efforts Supported by the Citrus Research and Development Foundation: Fighting a Ravaging Disease; National Academies Press: Washington, DC, 2018; ISBN 9780309472142. [Google Scholar]
- Albrecht, U.; Fiehn, O.; Bowman, K.D. Metabolic Variations in Different Citrus Rootstock Cultivars Associated with Different Responses to Huanglongbing. Plant Physiology and Biochemistry 2016, 107, 33–44. [Google Scholar] [CrossRef] [PubMed]
- Killiny, N.; Nehela, Y. Metabolomic Response to Huanglongbing: Role of Carboxylic Compounds in Citrus Sinensis Response to “candidatus Liberibacter Asiaticus” and Its Vector, Diaphorina Citri. Molecular Plant-Microbe Interactions 2017, 30, 666–678. [Google Scholar] [CrossRef] [PubMed]
- Martinelli, F.; Dandekar, A.M. Genetic Mechanisms of the Devious Intruder Candidatus Liberibacter in Citrus. Front Plant Sci 2017, 8. [Google Scholar] [CrossRef]
- Hijaz, F.; Manthey, J.; Folimonova, S.Y.; Davis, C.L.; Jones, S.E.; Reyes-De-Corcuera, J.I. An HPLC-MS Characterization of the Changes in Sweet Leaf Metabolite Profile Following Infection by the Bacterial Pathogen Candidatus Liberibacter Asiaticus. PLoS One 2013, 11. [Google Scholar] [CrossRef]
- Wang, Y.; Zhou, L.; Yu, X.; Stover, E.; Luo, F.; Duan, Y. Transcriptome Profiling of Huanglongbing (HLB) Tolerant and Susceptible Citrus Plants Reveals the Role of Basal Resistance in HLB Tolerance. Front Plant Sci 2016, 7. [Google Scholar] [CrossRef] [PubMed]
- Wu, B.; Yu, Q.; Deng, Z.; Duan, Y.; Luo, F.; Gmitter, F. A Chromosome-Level Phased Genome Enabling Allele-Level Studies in Sweet Orange: A Case Study on Citrus Huanglongbing Tolerance. Hortic Res 2023, 10. [Google Scholar] [CrossRef] [PubMed]
- Cimò, G.; Lo Bianco, R.; Gonzalez, P.; Bandaranayake, W.; Etxeberria, E.; Syvertsen, J.P. Carbohydrate and Nutritional Responses to Stem Girdling and Drought Stress with Respect to Understanding Symptoms of Huanglongbing in Citrus. HortScience 2013, 48, 920–928. [Google Scholar] [CrossRef]
- Achor, D.S.; Etxeberria, E.; Wang, N.; Folimonova, S.Y.; Chung, K.R.; Albrigo, L.G. Sequence of Anatomical Symptom Observations in Citrus Affected with Huanglongbing Disease. Plant Pathol J (Faisalabad) 2010, 9, 56–64. [Google Scholar] [CrossRef]
- Wu, B.; Yu, Q.; Deng, Z.; Duan, Y.; Luo, F.; Gmitter, F. A Chromosome-Level Phased Genome Enabling Allele-Level Studies in Sweet Orange: A Case Study on Citrus Huanglongbing Tolerance. Hortic Res 2023, 10. [Google Scholar] [CrossRef]
- Jain, M.; Munoz-Bodnar, A.; Gabriel, D.W. ‘Candidatus Liberibacter Asiaticus’ Peroxiredoxin (LasBCP) Suppresses Oxylipin-Mediated Defense Signaling in Citrus. J Plant Physiol 2019, 236, 61–65. [Google Scholar] [CrossRef]
- Giossi, C.; Cartaxana, P.; Cruz, S. Photoprotective Role of Neoxanthin in Plants and Algae. Molecules 2020, 25, 4617. [Google Scholar] [CrossRef]
- Dai, W.S.; Peng, T.; Wang, M.; Liu, J.H. Genome-Wide Identification and Comparative Expression Profiling of the WRKY Transcription Factor Family in Two Citrus Species with Different Candidatus Liberibacter Asiaticus Susceptibility. BMC Plant Biol 2023, 23. [Google Scholar] [CrossRef] [PubMed]
- Curtolo, M.; de Souza Pacheco, I.; Boava, L.P.; Takita, M.A.; Granato, L.M.; Galdeano, D.M.; de Souza, A.A.; Cristofani-Yaly, M.; Machado, M.A. Wide-Ranging Transcriptomic Analysis of Poncirus Trifoliata, Citrus Sunki, Citrus Sinensis and Contrasting Hybrids Reveals HLB Tolerance Mechanisms. Sci Rep 2020, 10. [Google Scholar] [CrossRef] [PubMed]
- Hartmann, M.; Zeier, J. L-Lysine Metabolism to N-Hydroxypipecolic Acid: An Integral Immune-Activating Pathway in Plants. Plant Journal 2018, 96, 5–21. [Google Scholar] [CrossRef] [PubMed]
- Zeier, J. New Insights into the Regulation of Plant Immunity by Amino Acid Metabolic Pathways. Plant Cell Environ 2013, 36, 2085–2103. [Google Scholar] [CrossRef]
- Hershko, A.; Ciechanover, A. The Ubiquitin System. Annu Rev Biochem 1998, 67, 425–479. [Google Scholar] [CrossRef] [PubMed]
- Killiny, N.; Hijaz, F. Amino Acids Implicated in Plant Defense Are Higher in Candidatus Liberibacter Asiaticus-Tolerant Citrus Varieties. Plant Signal Behav 2016, 11, 1–10. [Google Scholar] [CrossRef] [PubMed]
- Nwugo, C.C.; Doud, M.S.; Duan, Y.; Lin, H. Proteomics Analysis Reveals Novel Host Molecular Mechanisms Associated with Thermotherapy of ’Ca. Liberibacter Asiaticus’-Infected Citrus Plants. BMC Plant Biol 2016, 16. [Google Scholar] [CrossRef] [PubMed]
- Ibáñez, A.M.; Martinelli, F.; Reagan, R.L.; Uratsu, S.L.; Vo, A.; Tinoco, M.A.; Phu, M.L.; Chen, Y.; Rocke, D.M.; Dandekar, A.M. Transcriptome and Metabolome Analysis of Citrus Fruit to Elucidate Puffing Disorder. Plant Science 2014, 217–218, 87–98. [Google Scholar] [CrossRef] [PubMed]
- Bolger, A.M.; Lohse, M.; Usadel, B. Trimmomatic: A Flexible Trimmer for Illumina Sequence Data. Bioinformatics 2014, 30, 2114–2120. [Google Scholar] [CrossRef] [PubMed]
- Wu, G.A.; Prochnik, S.; Jenkins, J.; Salse, J.; Hellsten, U.; Murat, F.; Perrier, X.; Ruiz, M.; Scalabrin, S.; Terol, J.; et al. Sequencing of Diverse Mandarin, Pummelo and Orange Genomes Reveals Complex History of Admixture during Citrus Domestication. Nat Biotechnol 2014, 32, 656–662. [Google Scholar] [CrossRef]
- Kim, D.; Langmead, B.; Salzberg, S.L. HISAT: A Fast Spliced Aligner with Low Memory Requirements. Nat Methods 2015, 12, 357–360. [Google Scholar] [CrossRef] [PubMed]
- Liao, Y.; Smyth, G.K.; Shi, W. FeatureCounts: An Efficient General Purpose Program for Assigning Sequence Reads to Genomic Features. Bioinformatics 2014, 30, 923–930. [Google Scholar] [CrossRef]
- Love, M.I.; Huber, W.; Anders, S. Moderated Estimation of Fold Change and Dispersion for RNA-Seq Data with DESeq2. Genome Biol 2014, 15. [Google Scholar] [CrossRef]
- Shannon, P.; Markiel, A.; Ozier, O.; Baliga, N.S.; Wang, J.T.; Ramage, D.; Amin, N.; Schwikowski, B.; Ideker, T. Cytoscape: A Software Environment for Integrated Models of Biomolecular Interaction Networks. Genome Res 2003, 13, 2498–2504. [Google Scholar] [CrossRef] [PubMed]
- Doncheva, N.T.; Morris, J.H.; Gorodkin, J.; Jensen, L.J. Cytoscape StringApp: Network Analysis and Visualization of Proteomics Data. J Proteome Res 2019, 18, 623–632. [Google Scholar] [CrossRef] [PubMed]
- Bindea, G.; Mlecnik, B.; Hackl, H.; Charoentong, P.; Tosolini, M.; Kirilovsky, A.; Fridman, W.H.; Pagès, F.; Trajanoski, Z.; Galon, J. ClueGO: A Cytoscape Plug-in to Decipher Functionally Grouped Gene Ontology and Pathway Annotation Networks. Bioinformatics 2009, 25, 1091–1093. [Google Scholar] [CrossRef]
Figure 1.
Comparison of alignment efficiency using HISAT2 and STAR aligners with C. clementina v1 and C. sinensis DHSO v3 reference genomes. Boxplots show the percentage of aligned reads across different Bioprojects. The red line marks the 60% alignment threshold, below which samples were excluded from downstream.
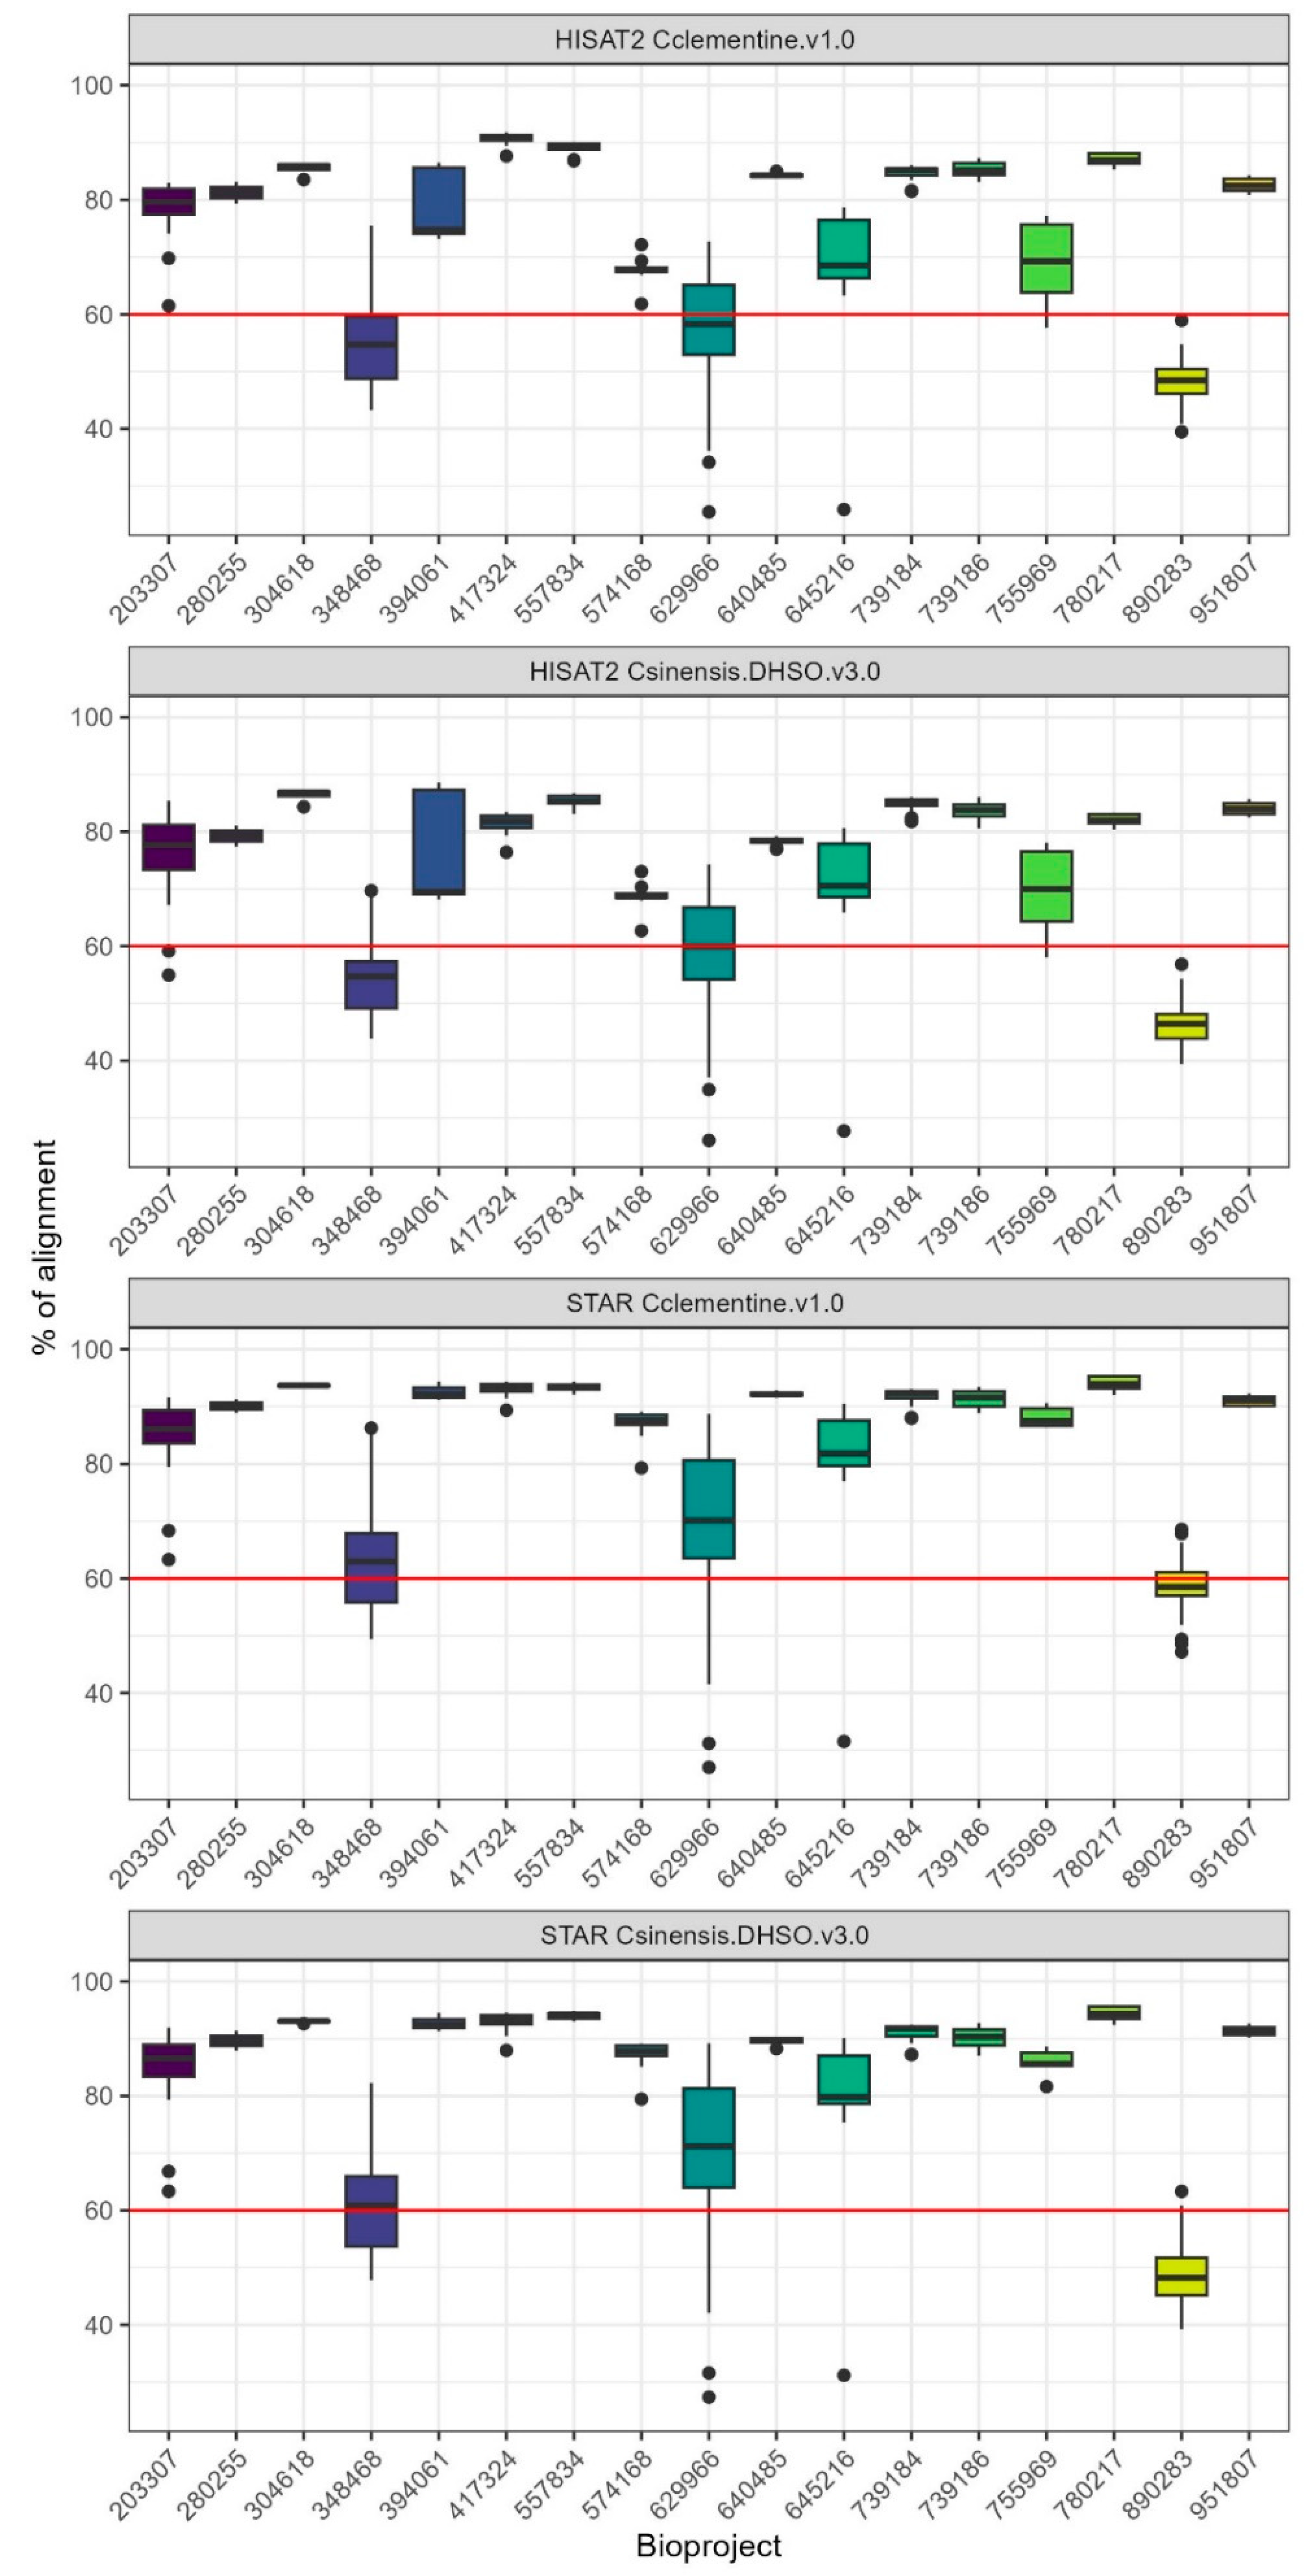
Figure 2.
MDS plot shows distinct clustering of 230 RNA-seq samples by tissue type, highlighting tissue-specific gene expression patterns.
Figure 2.
MDS plot shows distinct clustering of 230 RNA-seq samples by tissue type, highlighting tissue-specific gene expression patterns.
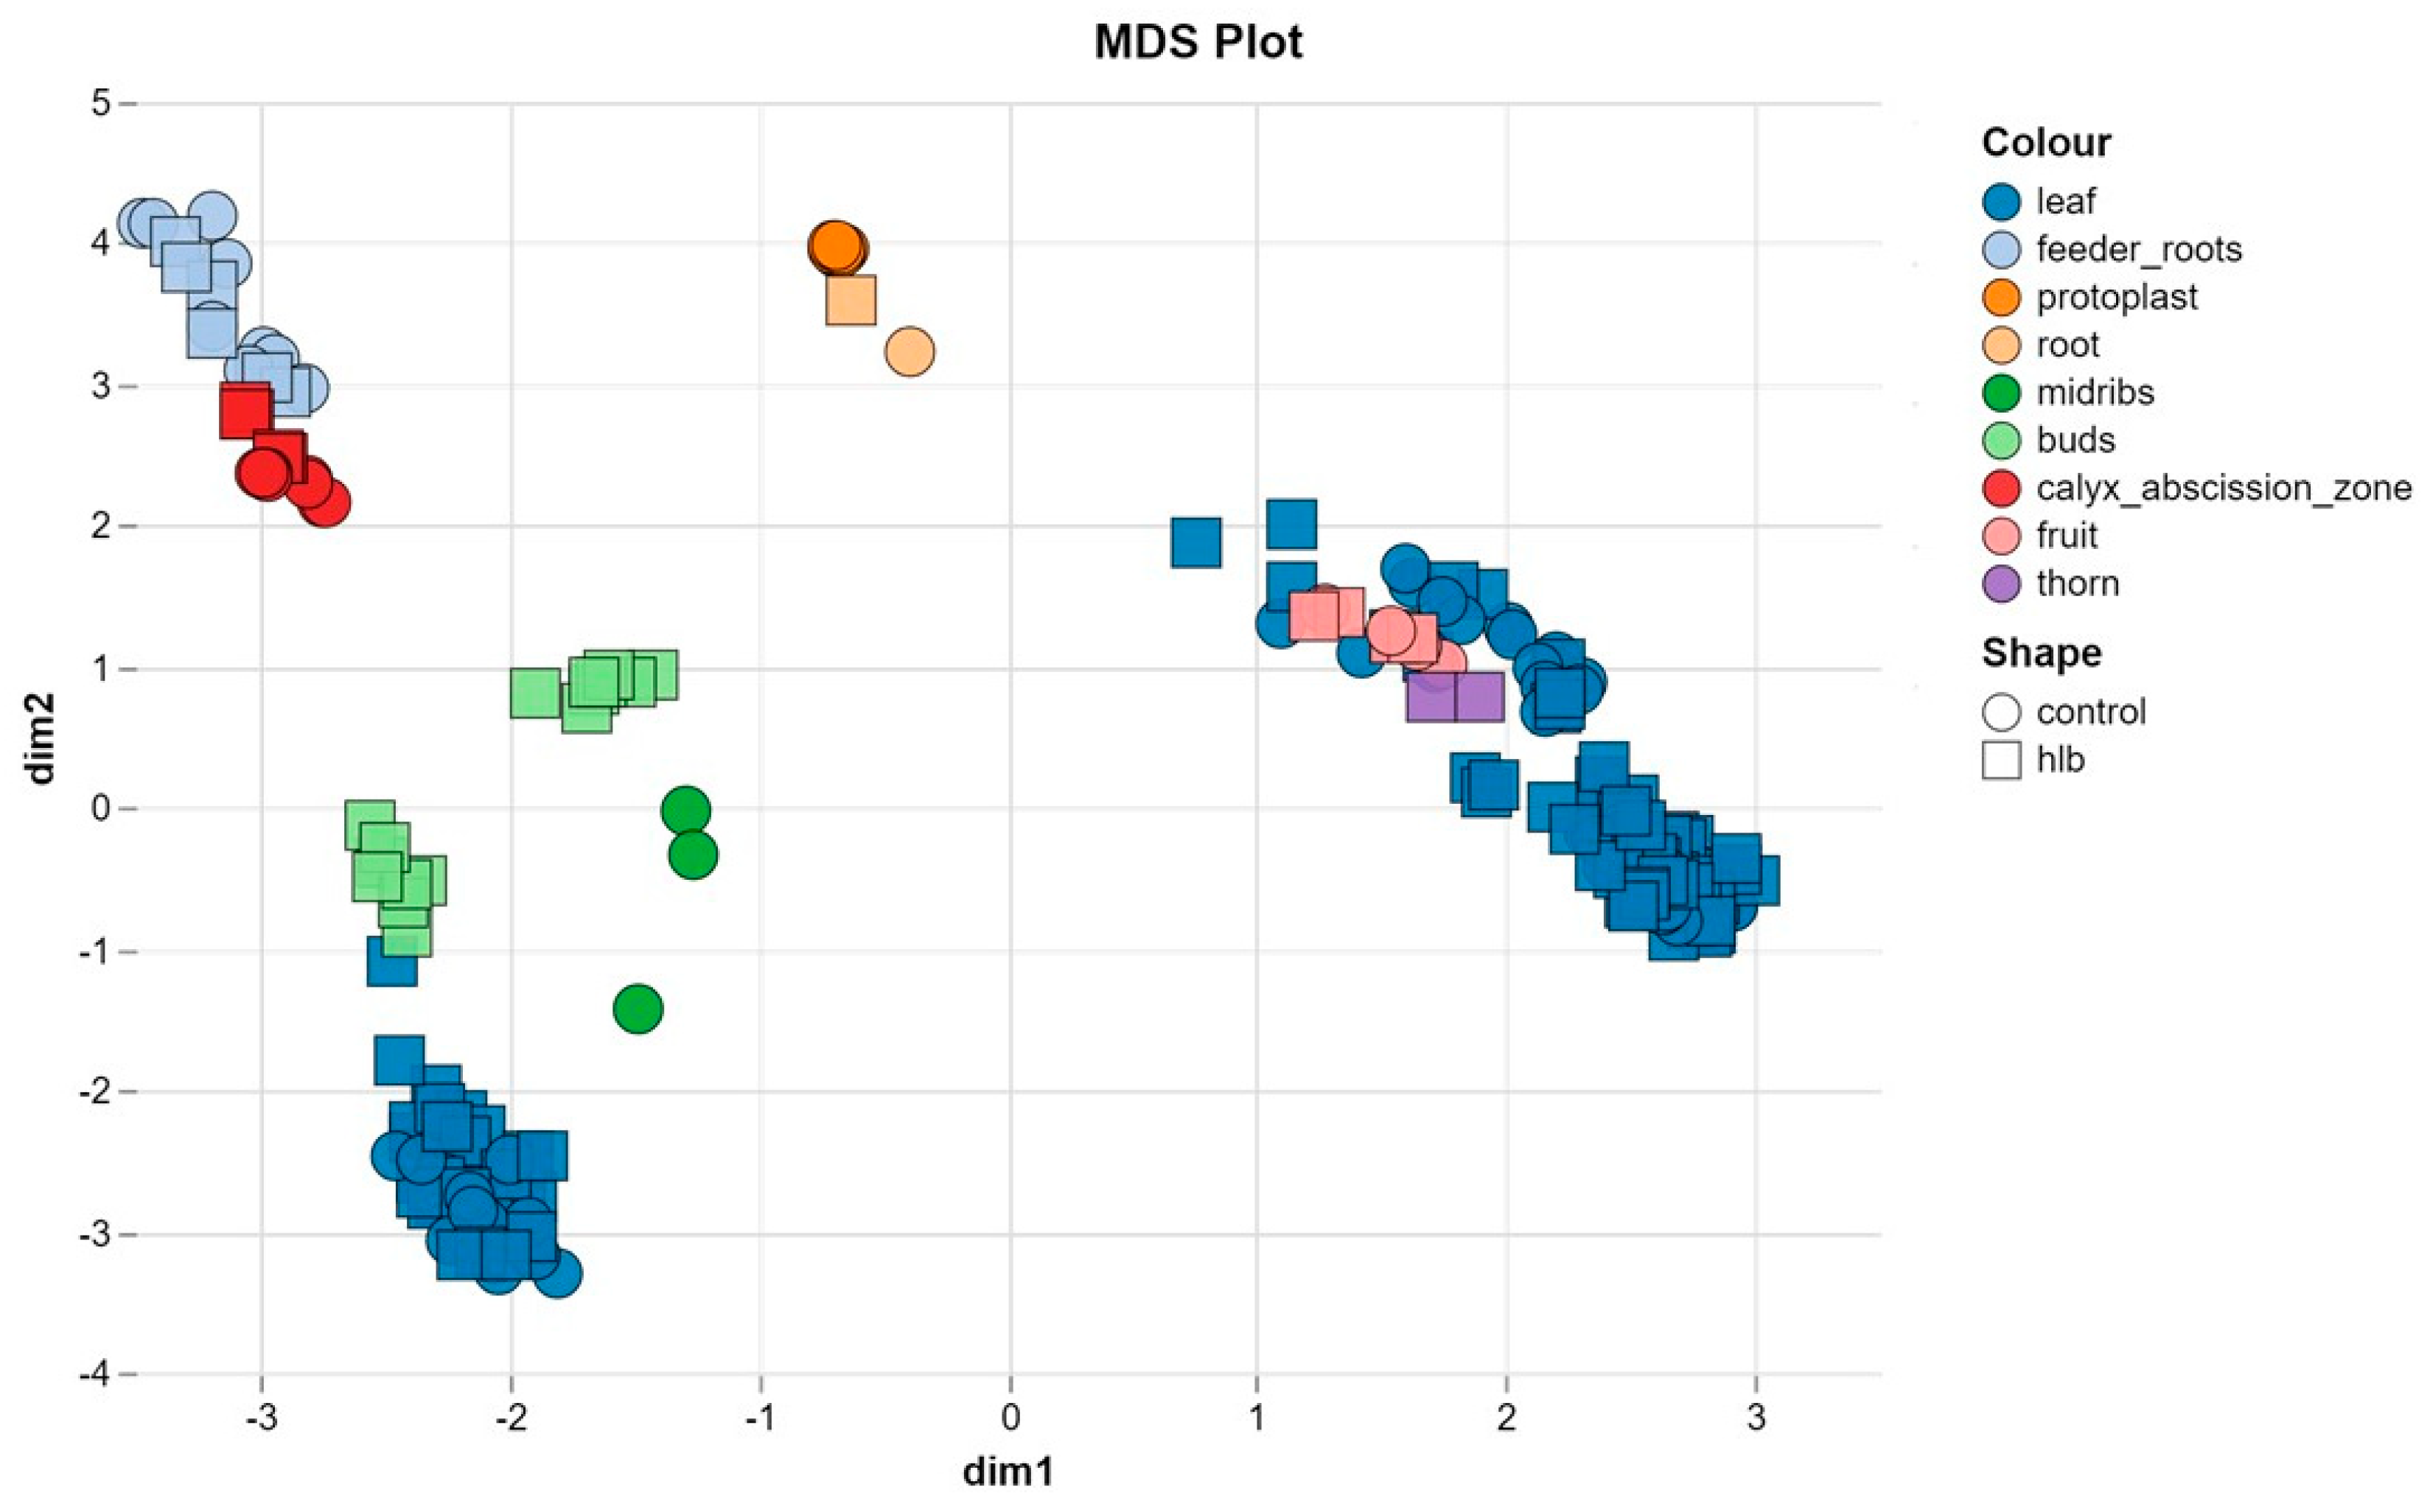
Figure 3.
Selection of soft-thresholding power and module merging in the co-expression network analysis. (A) Scale-free topology fit index (R2) across soft-thresholding powers. (B) Mean connectivity plot indicating power 8 as the optimal balance. (C) Module merging process, reducing module count to 41 based on eigengene correlation.
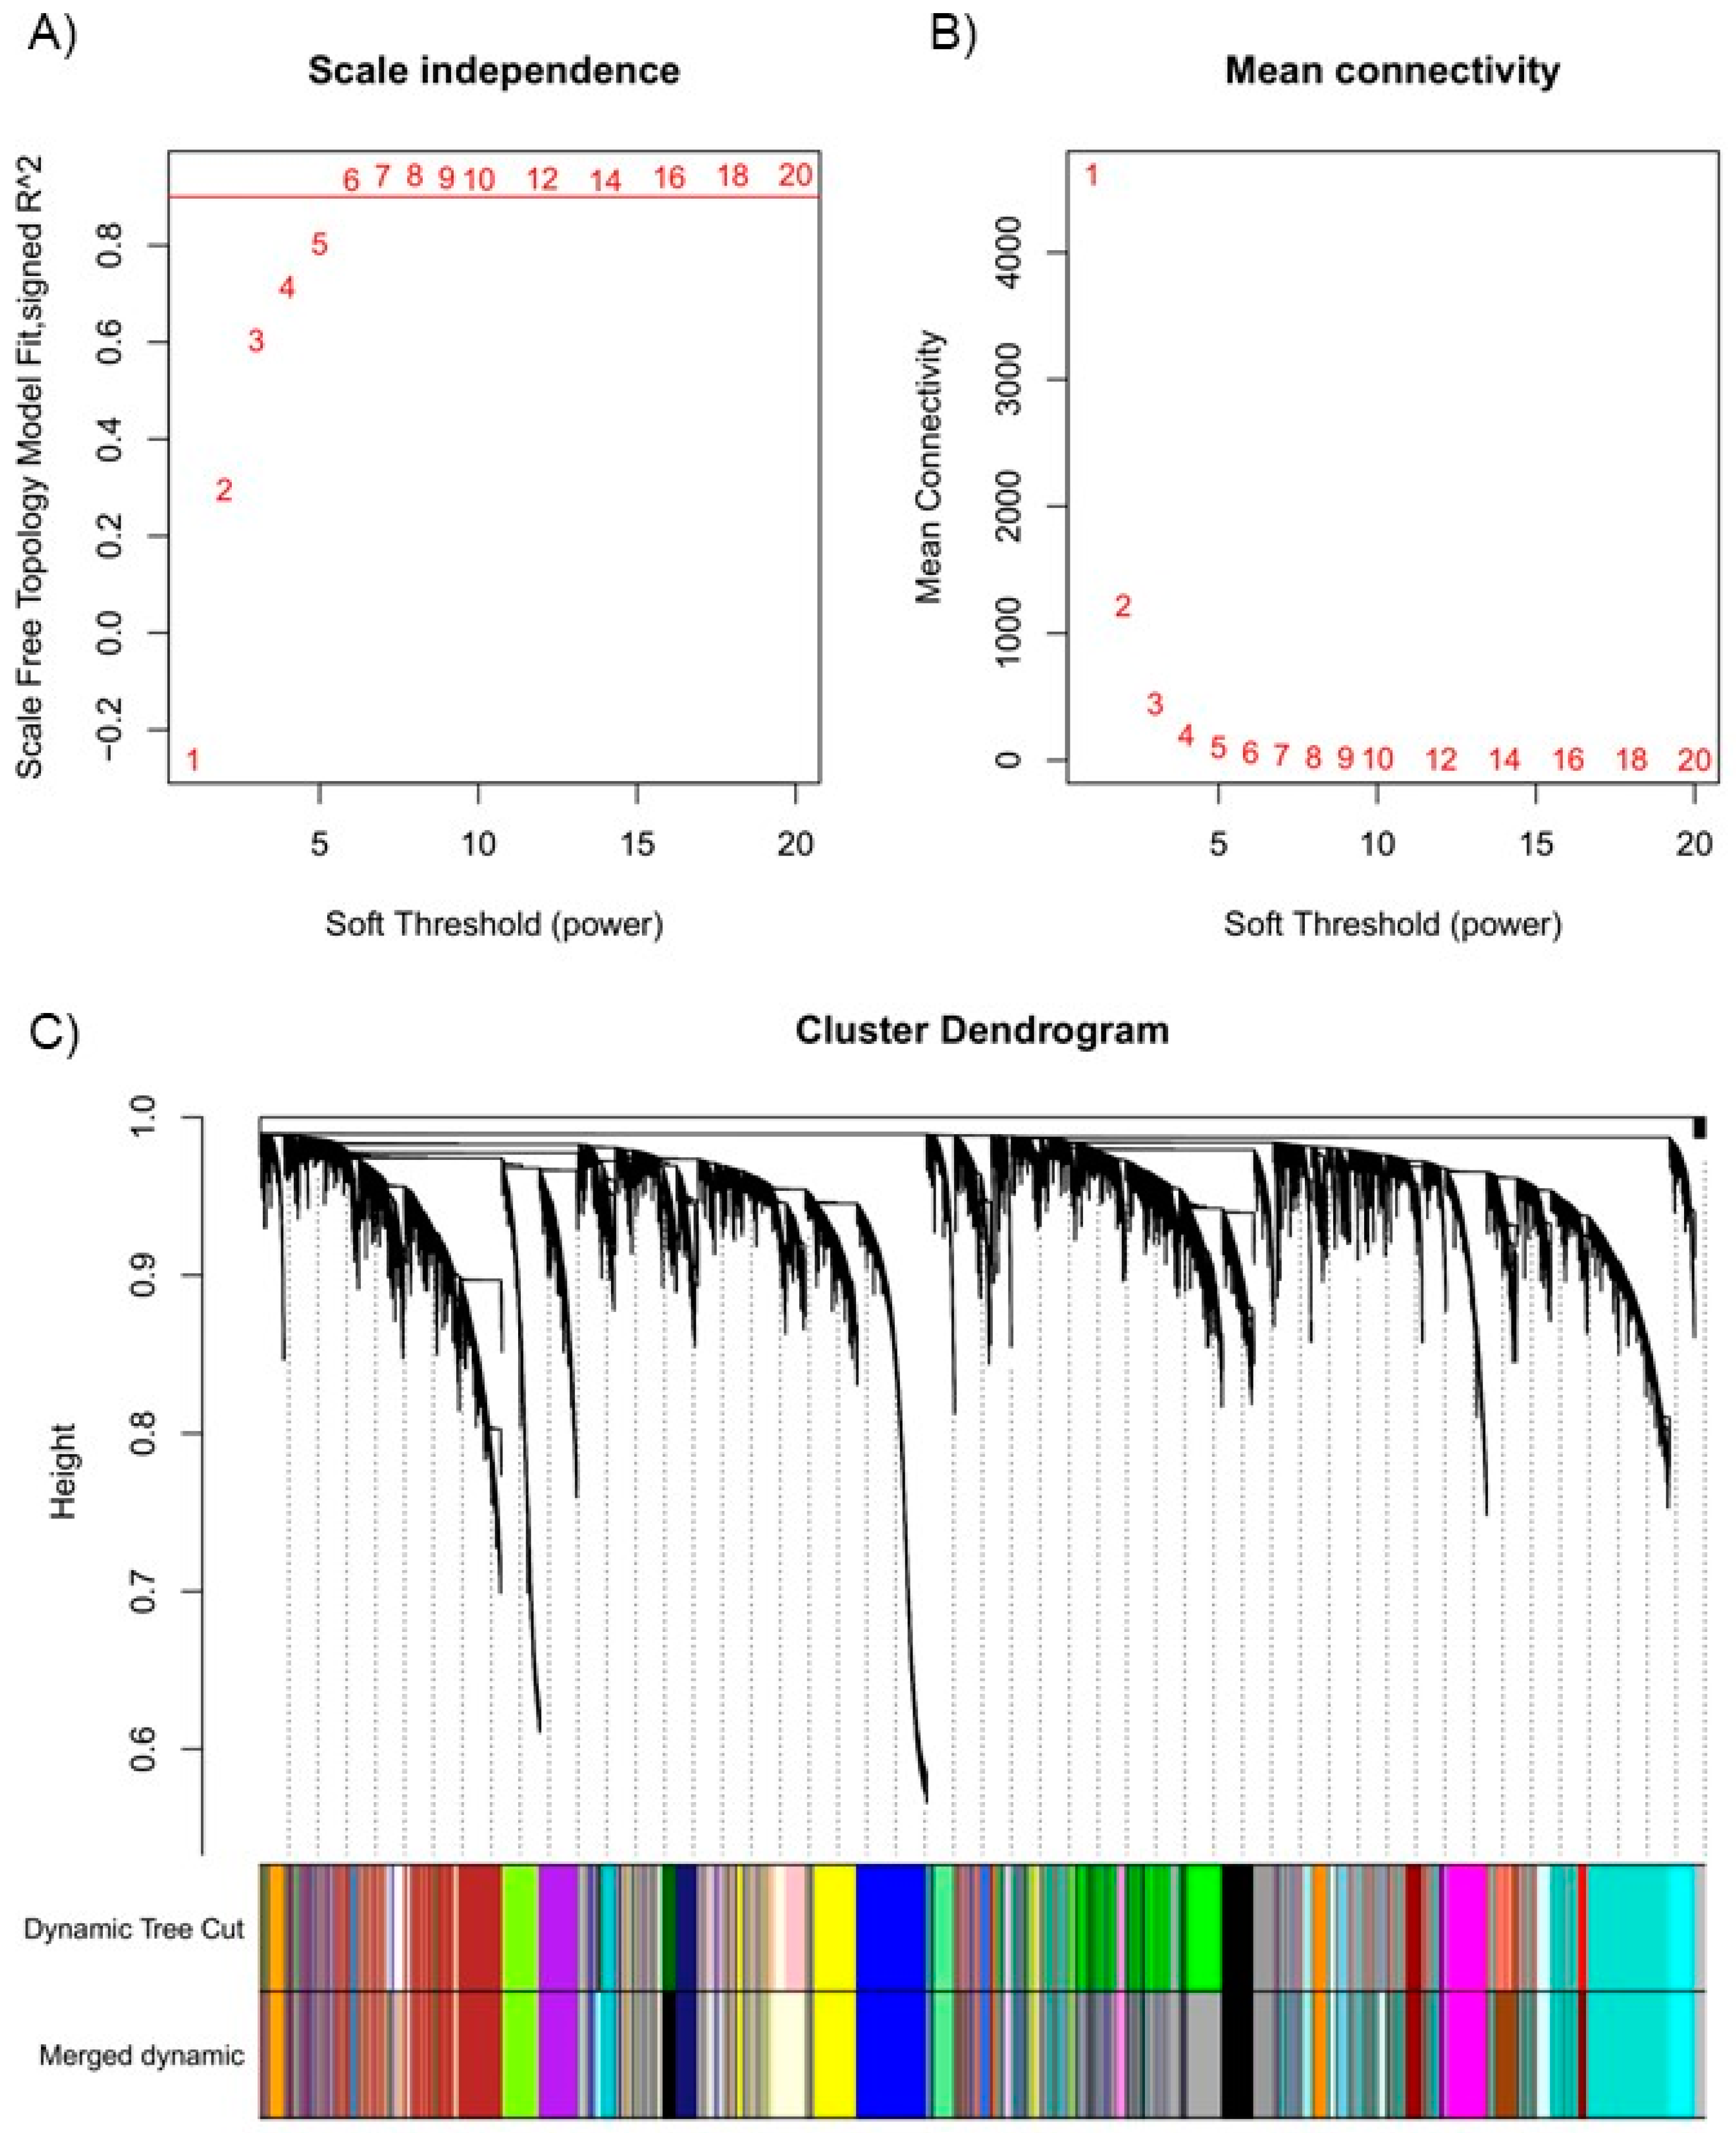
Figure 4.
Module–trait relationships: Heatmap showing the correlation between module eigengenes and biological traits of interest, including citrus variety, tissue type, and days post-infection (DPI). Each cell contains the correlation coefficient and associated p-value, with color intensity reflecting the strength and direction of the correlation (red for positive and blue for negative correlations).
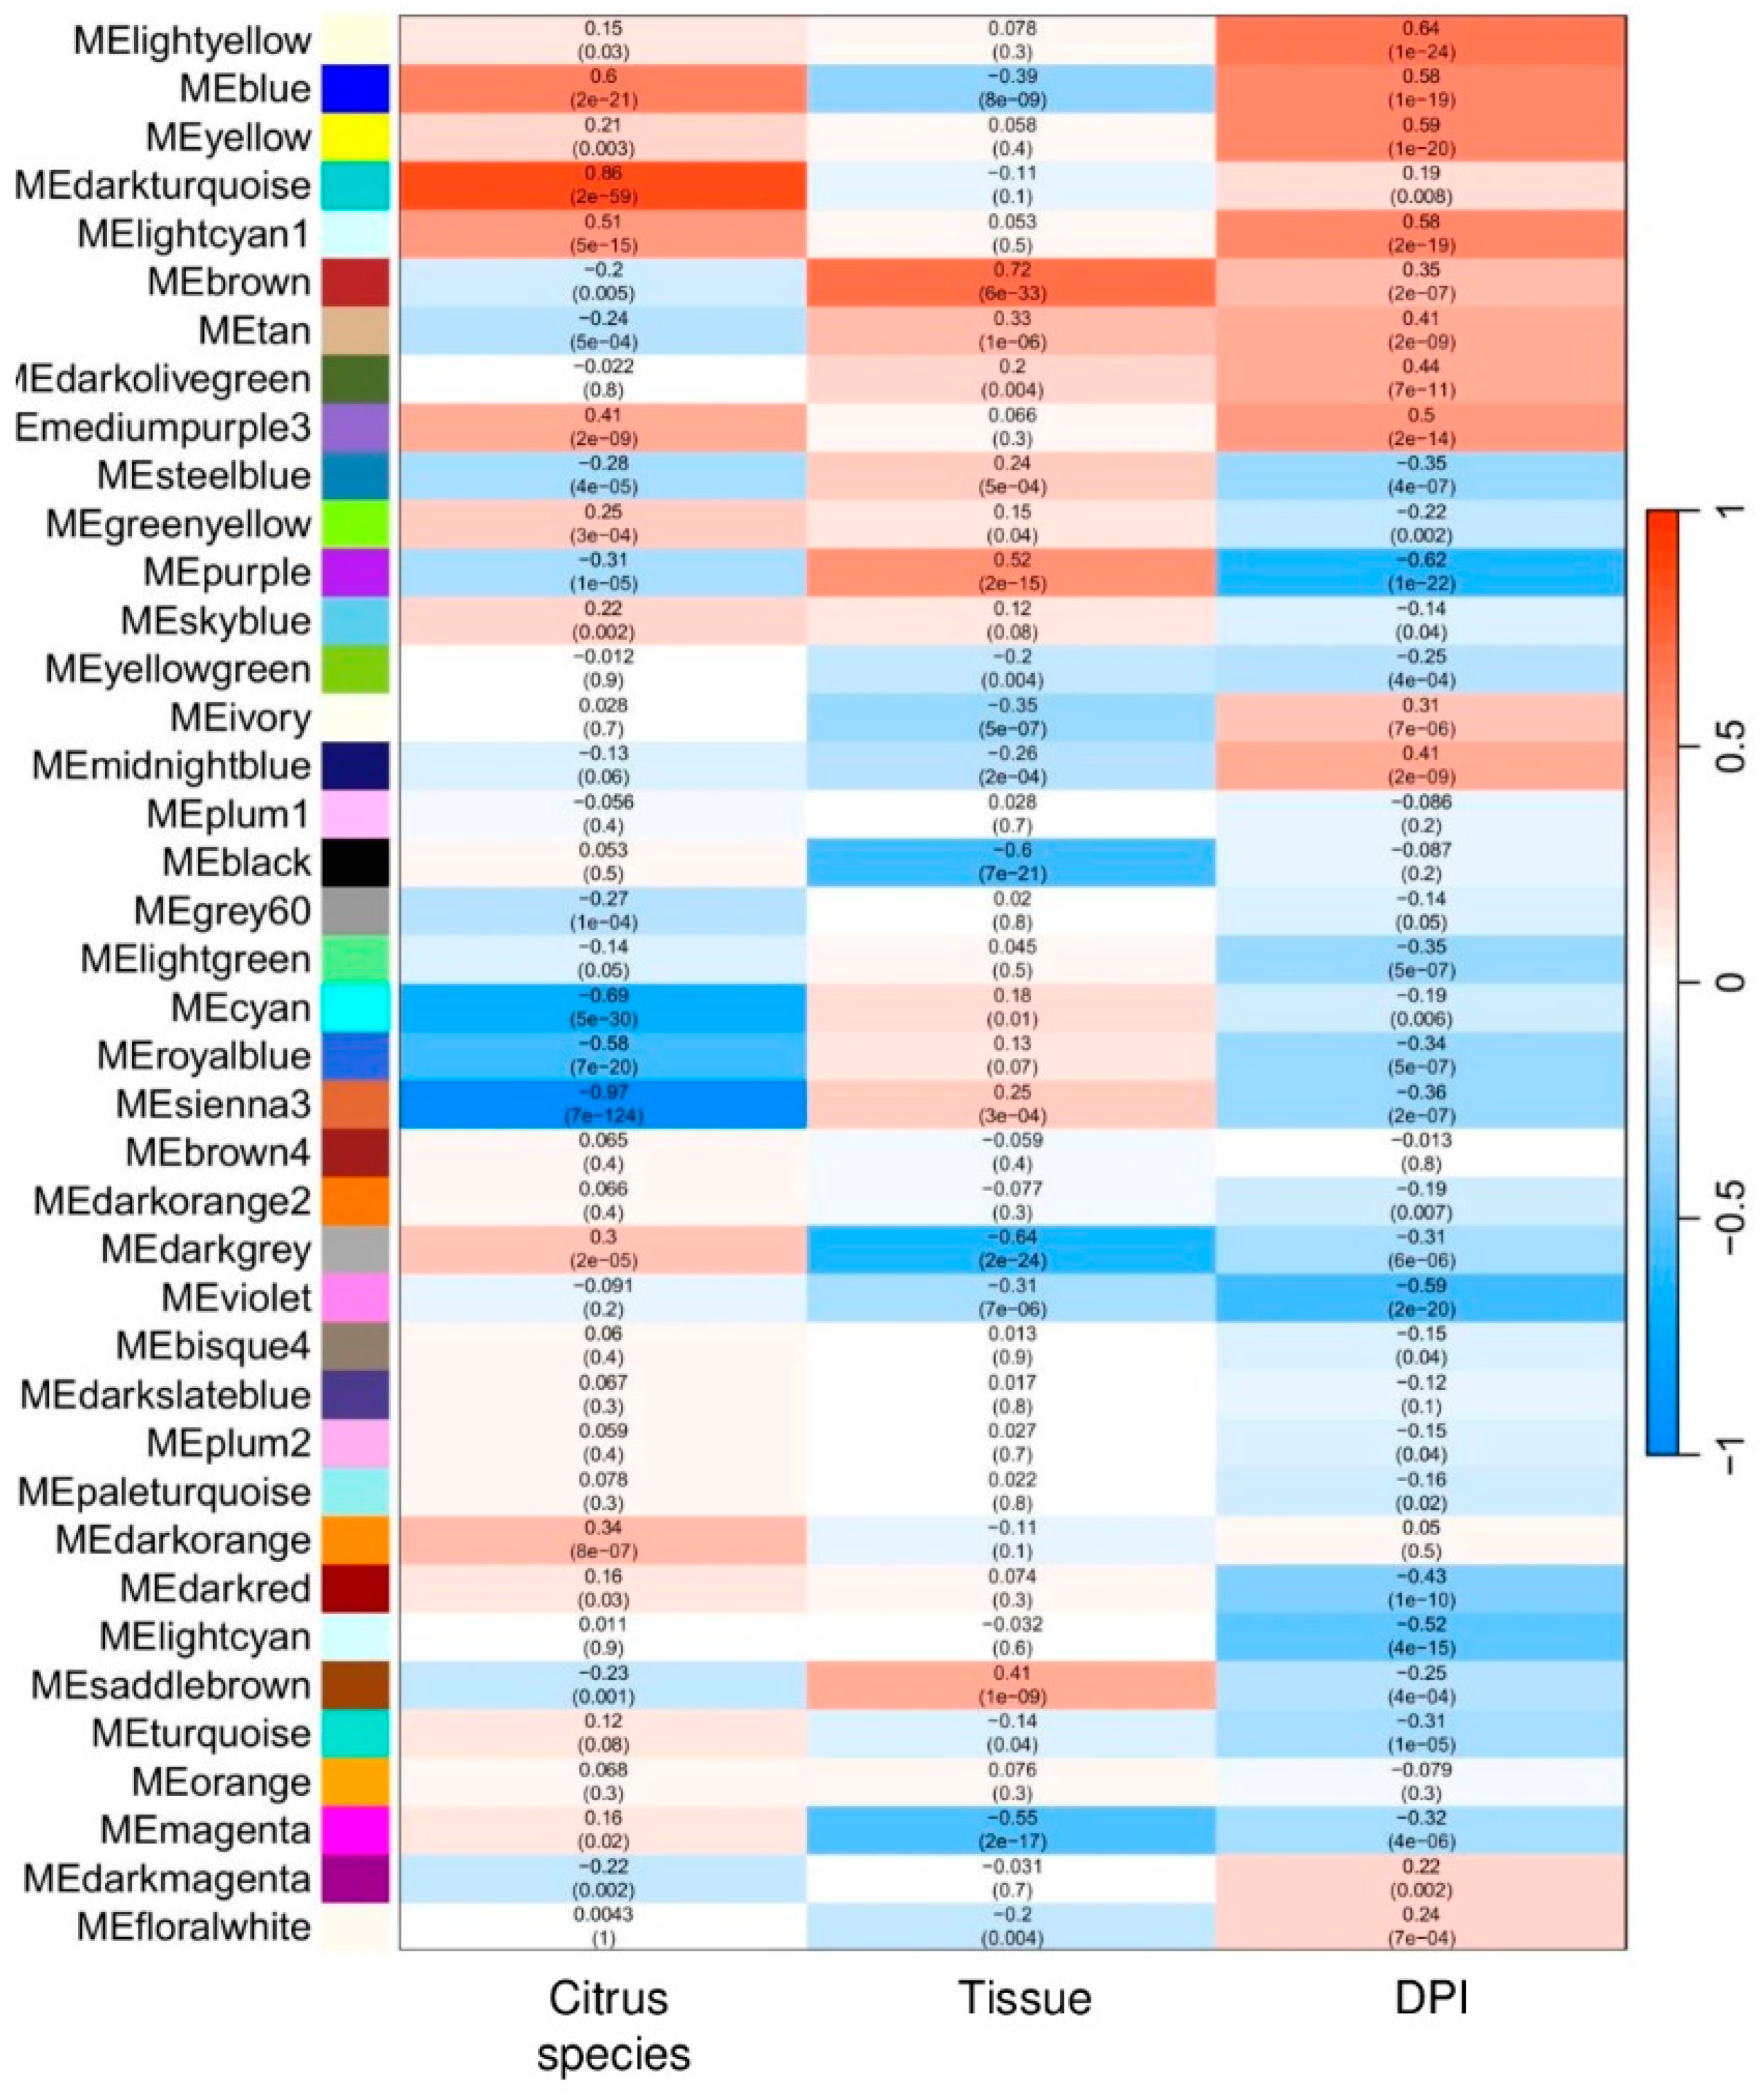
Figure 5.
Functional enrichment analysis of key genes in the darkturquoise module using ClueGO. The analysis identified pathways associated with carotenoid biosynthesis, manganese ion transmembrane transport, and protein peptidyl-prolyl isomerization, suggesting roles in metabolite production, metal ion homeostasis, and protein folding. These pathways may contribute to species-specific responses to HLB in citrus.
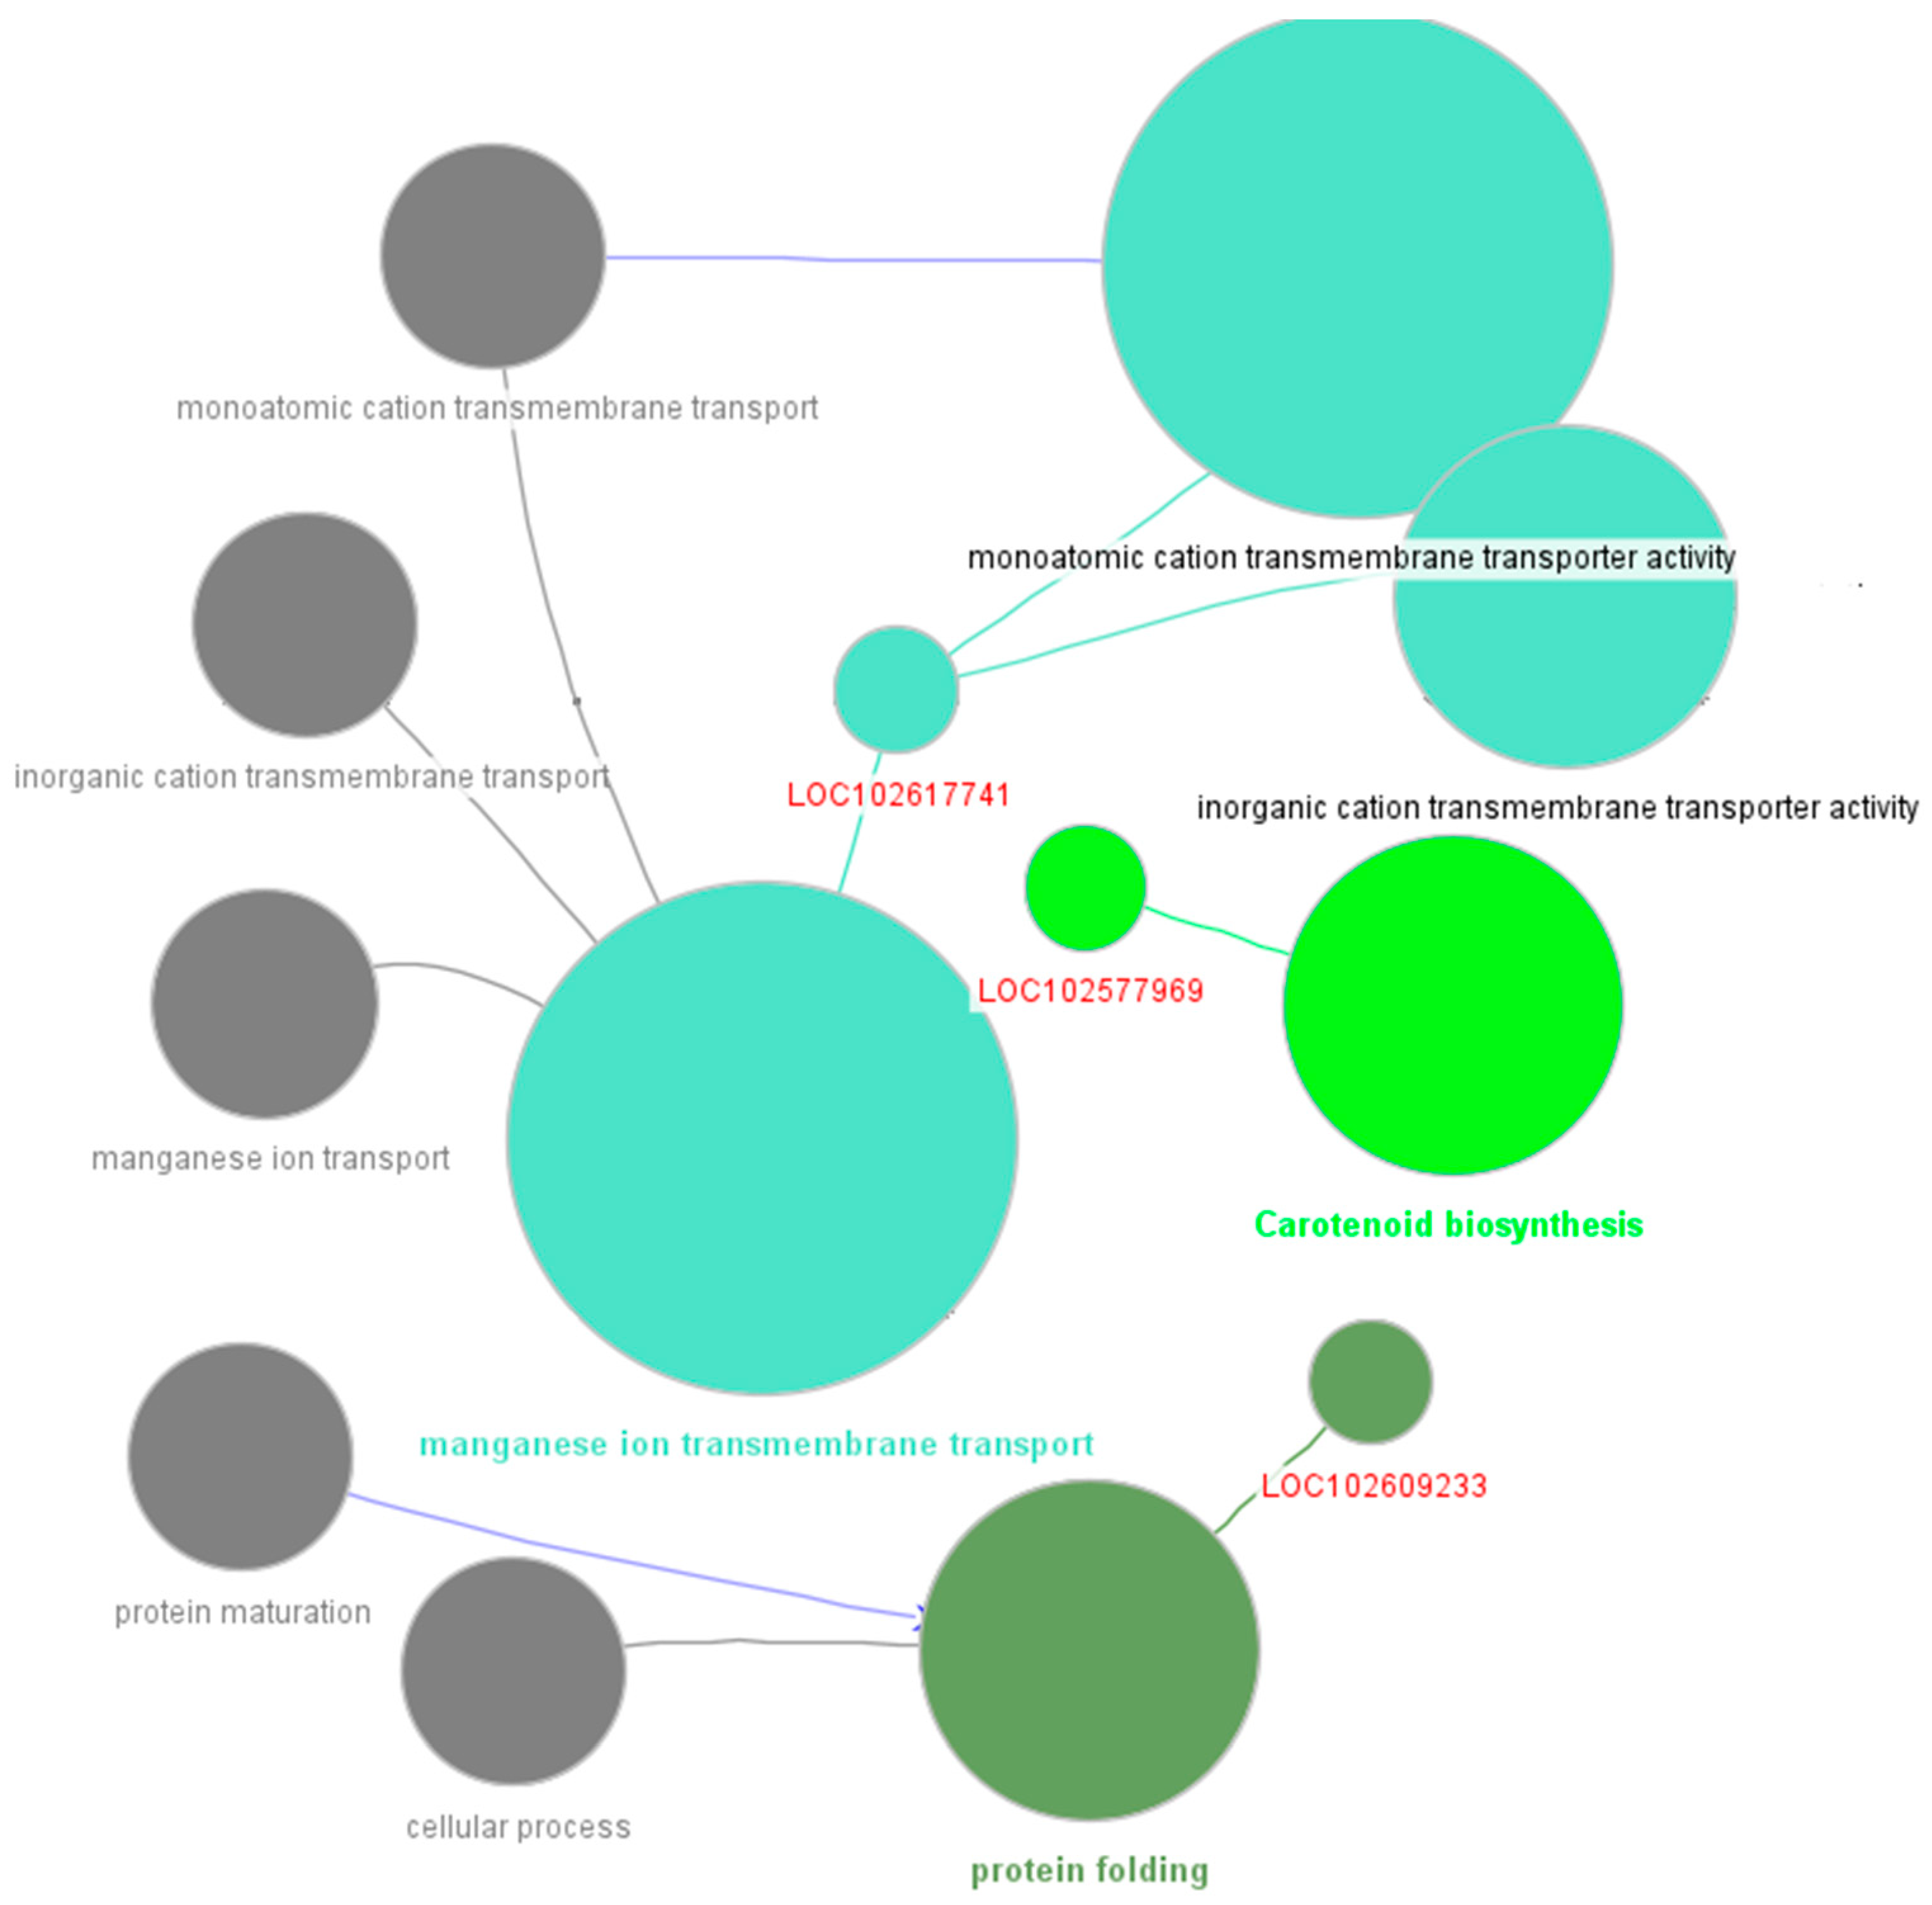
Figure 6.
Functional Enrichment and Gene Significance for Genes in the Brown Module in Response to HLB Infection: Chloroplast and Plastid Pathway Involvement.
Figure 6.
Functional Enrichment and Gene Significance for Genes in the Brown Module in Response to HLB Infection: Chloroplast and Plastid Pathway Involvement.
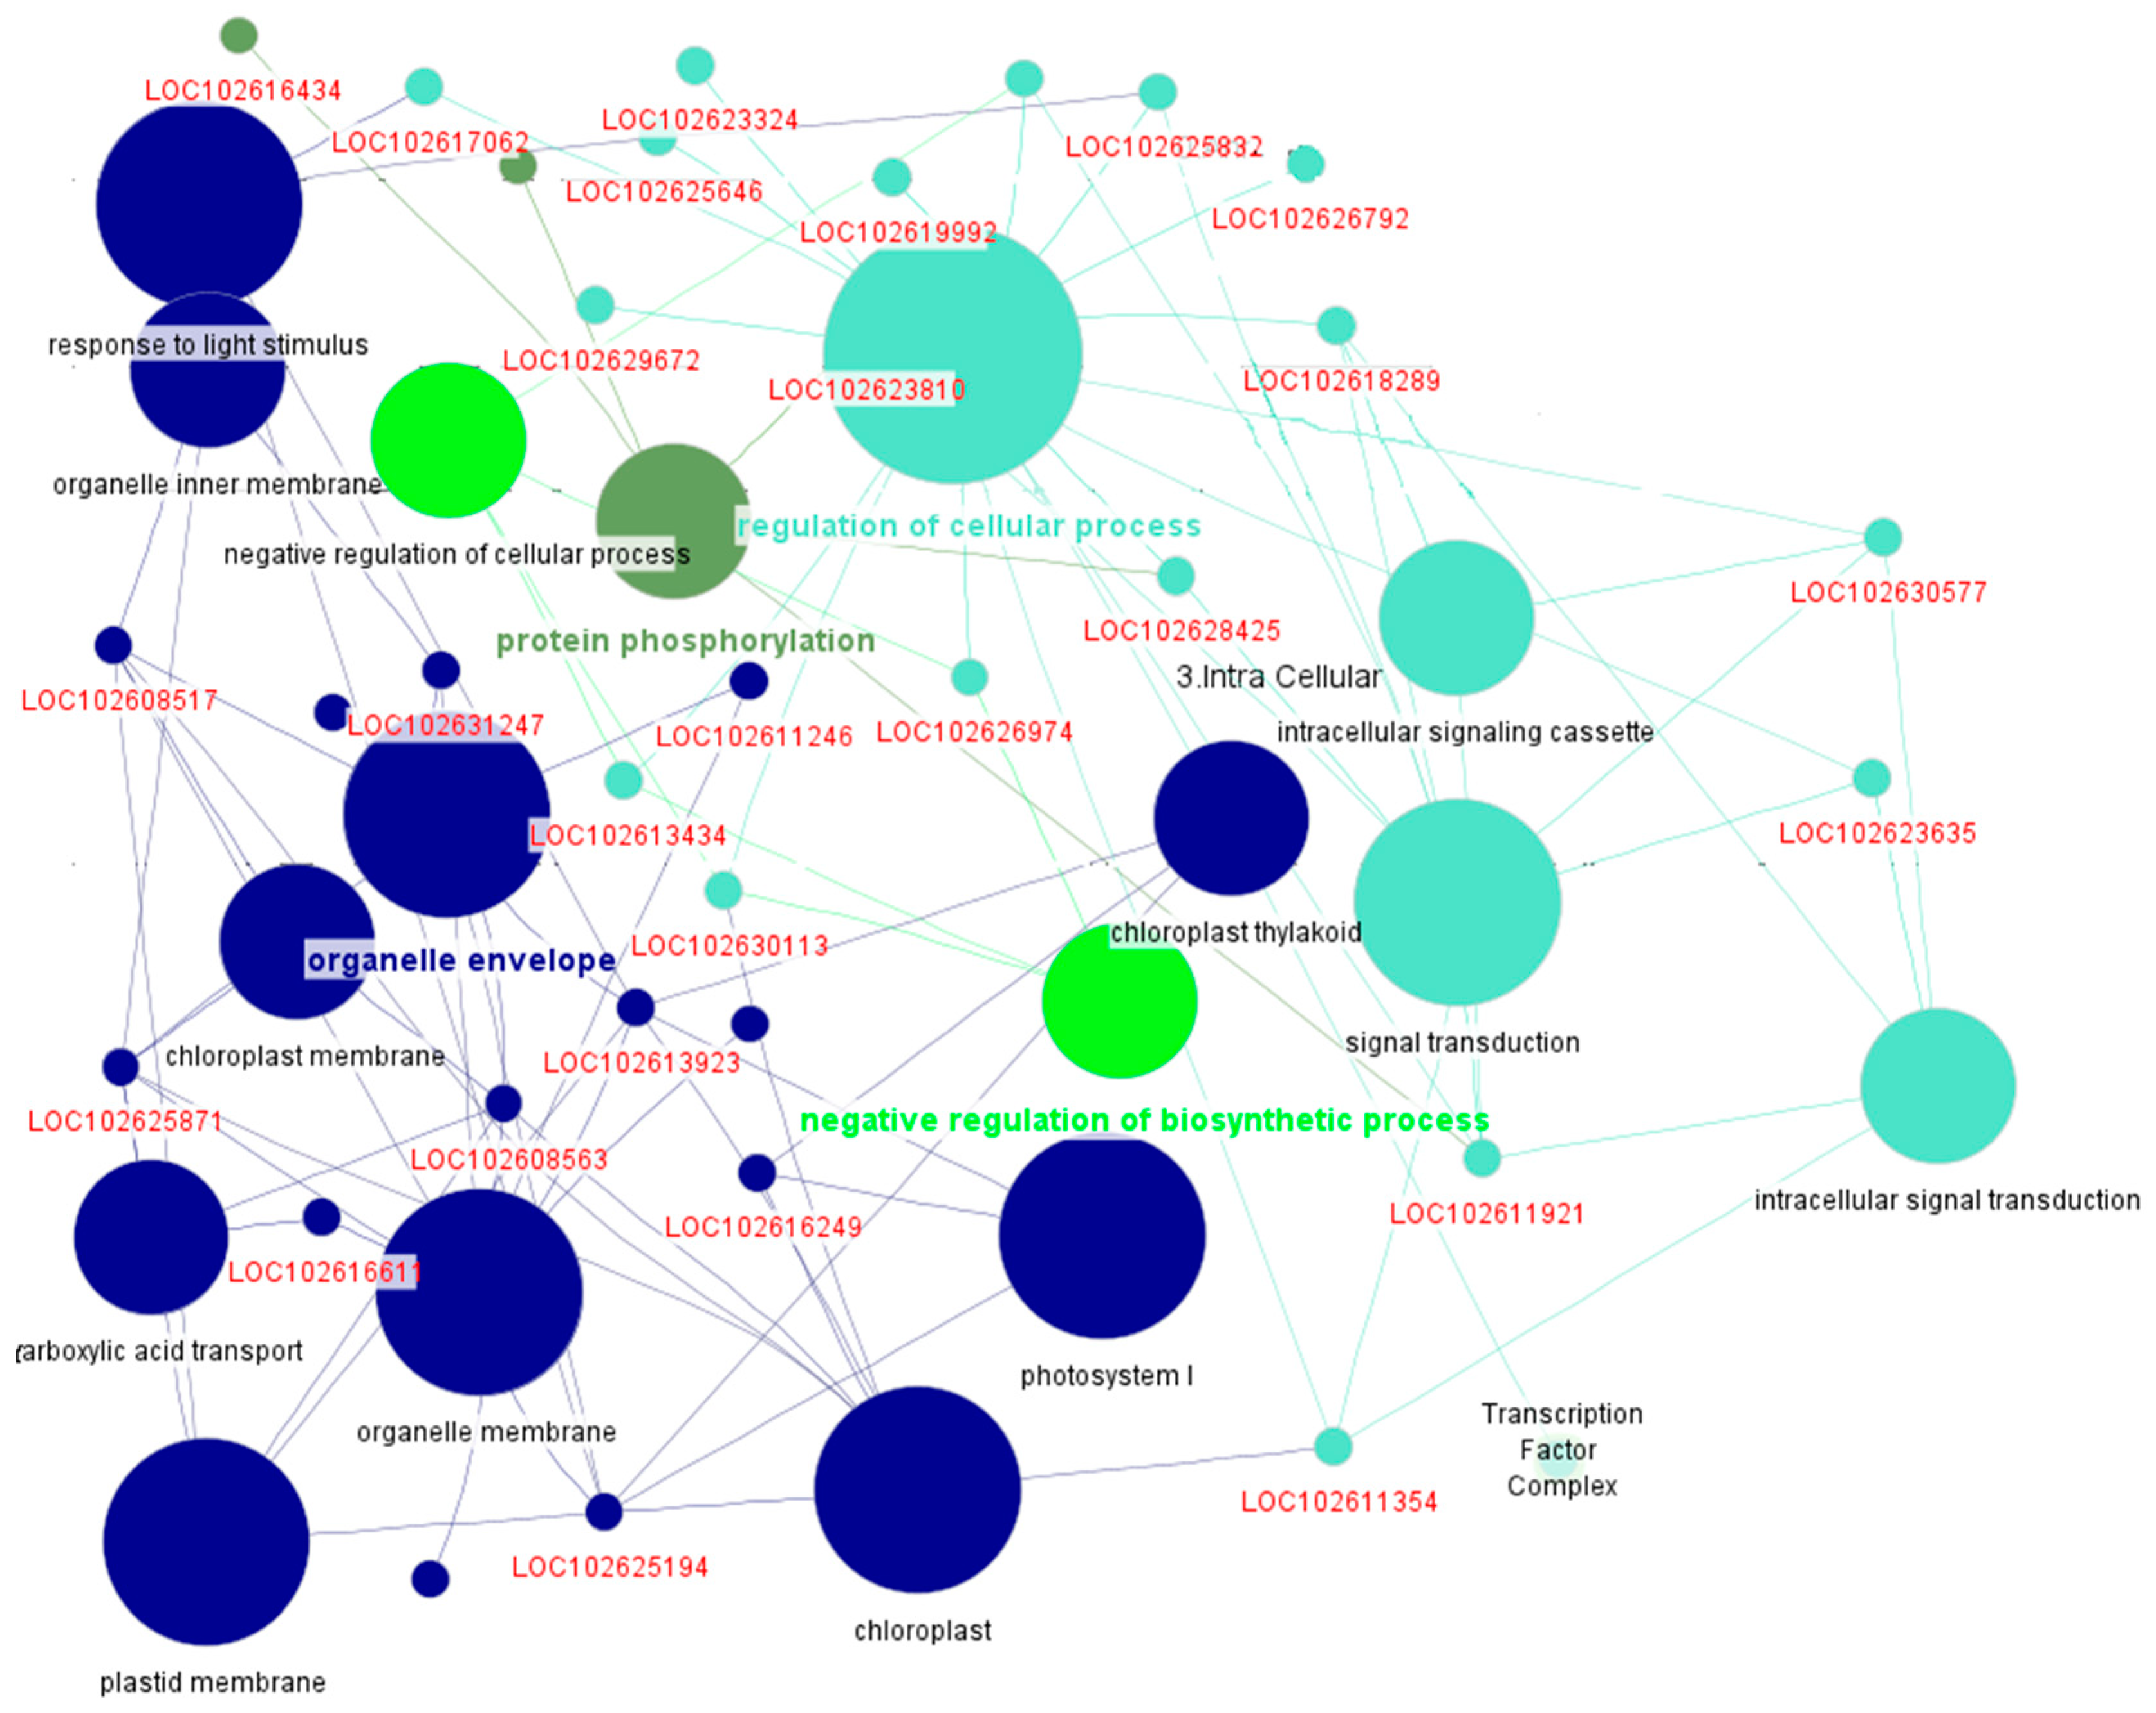
Figure 7.
Functional enrichment of the yellow module linked to DPI in HLB-infected Citrus spp., highlighting roles in cellular structure, stress response, and metabolic processes.
Figure 7.
Functional enrichment of the yellow module linked to DPI in HLB-infected Citrus spp., highlighting roles in cellular structure, stress response, and metabolic processes.
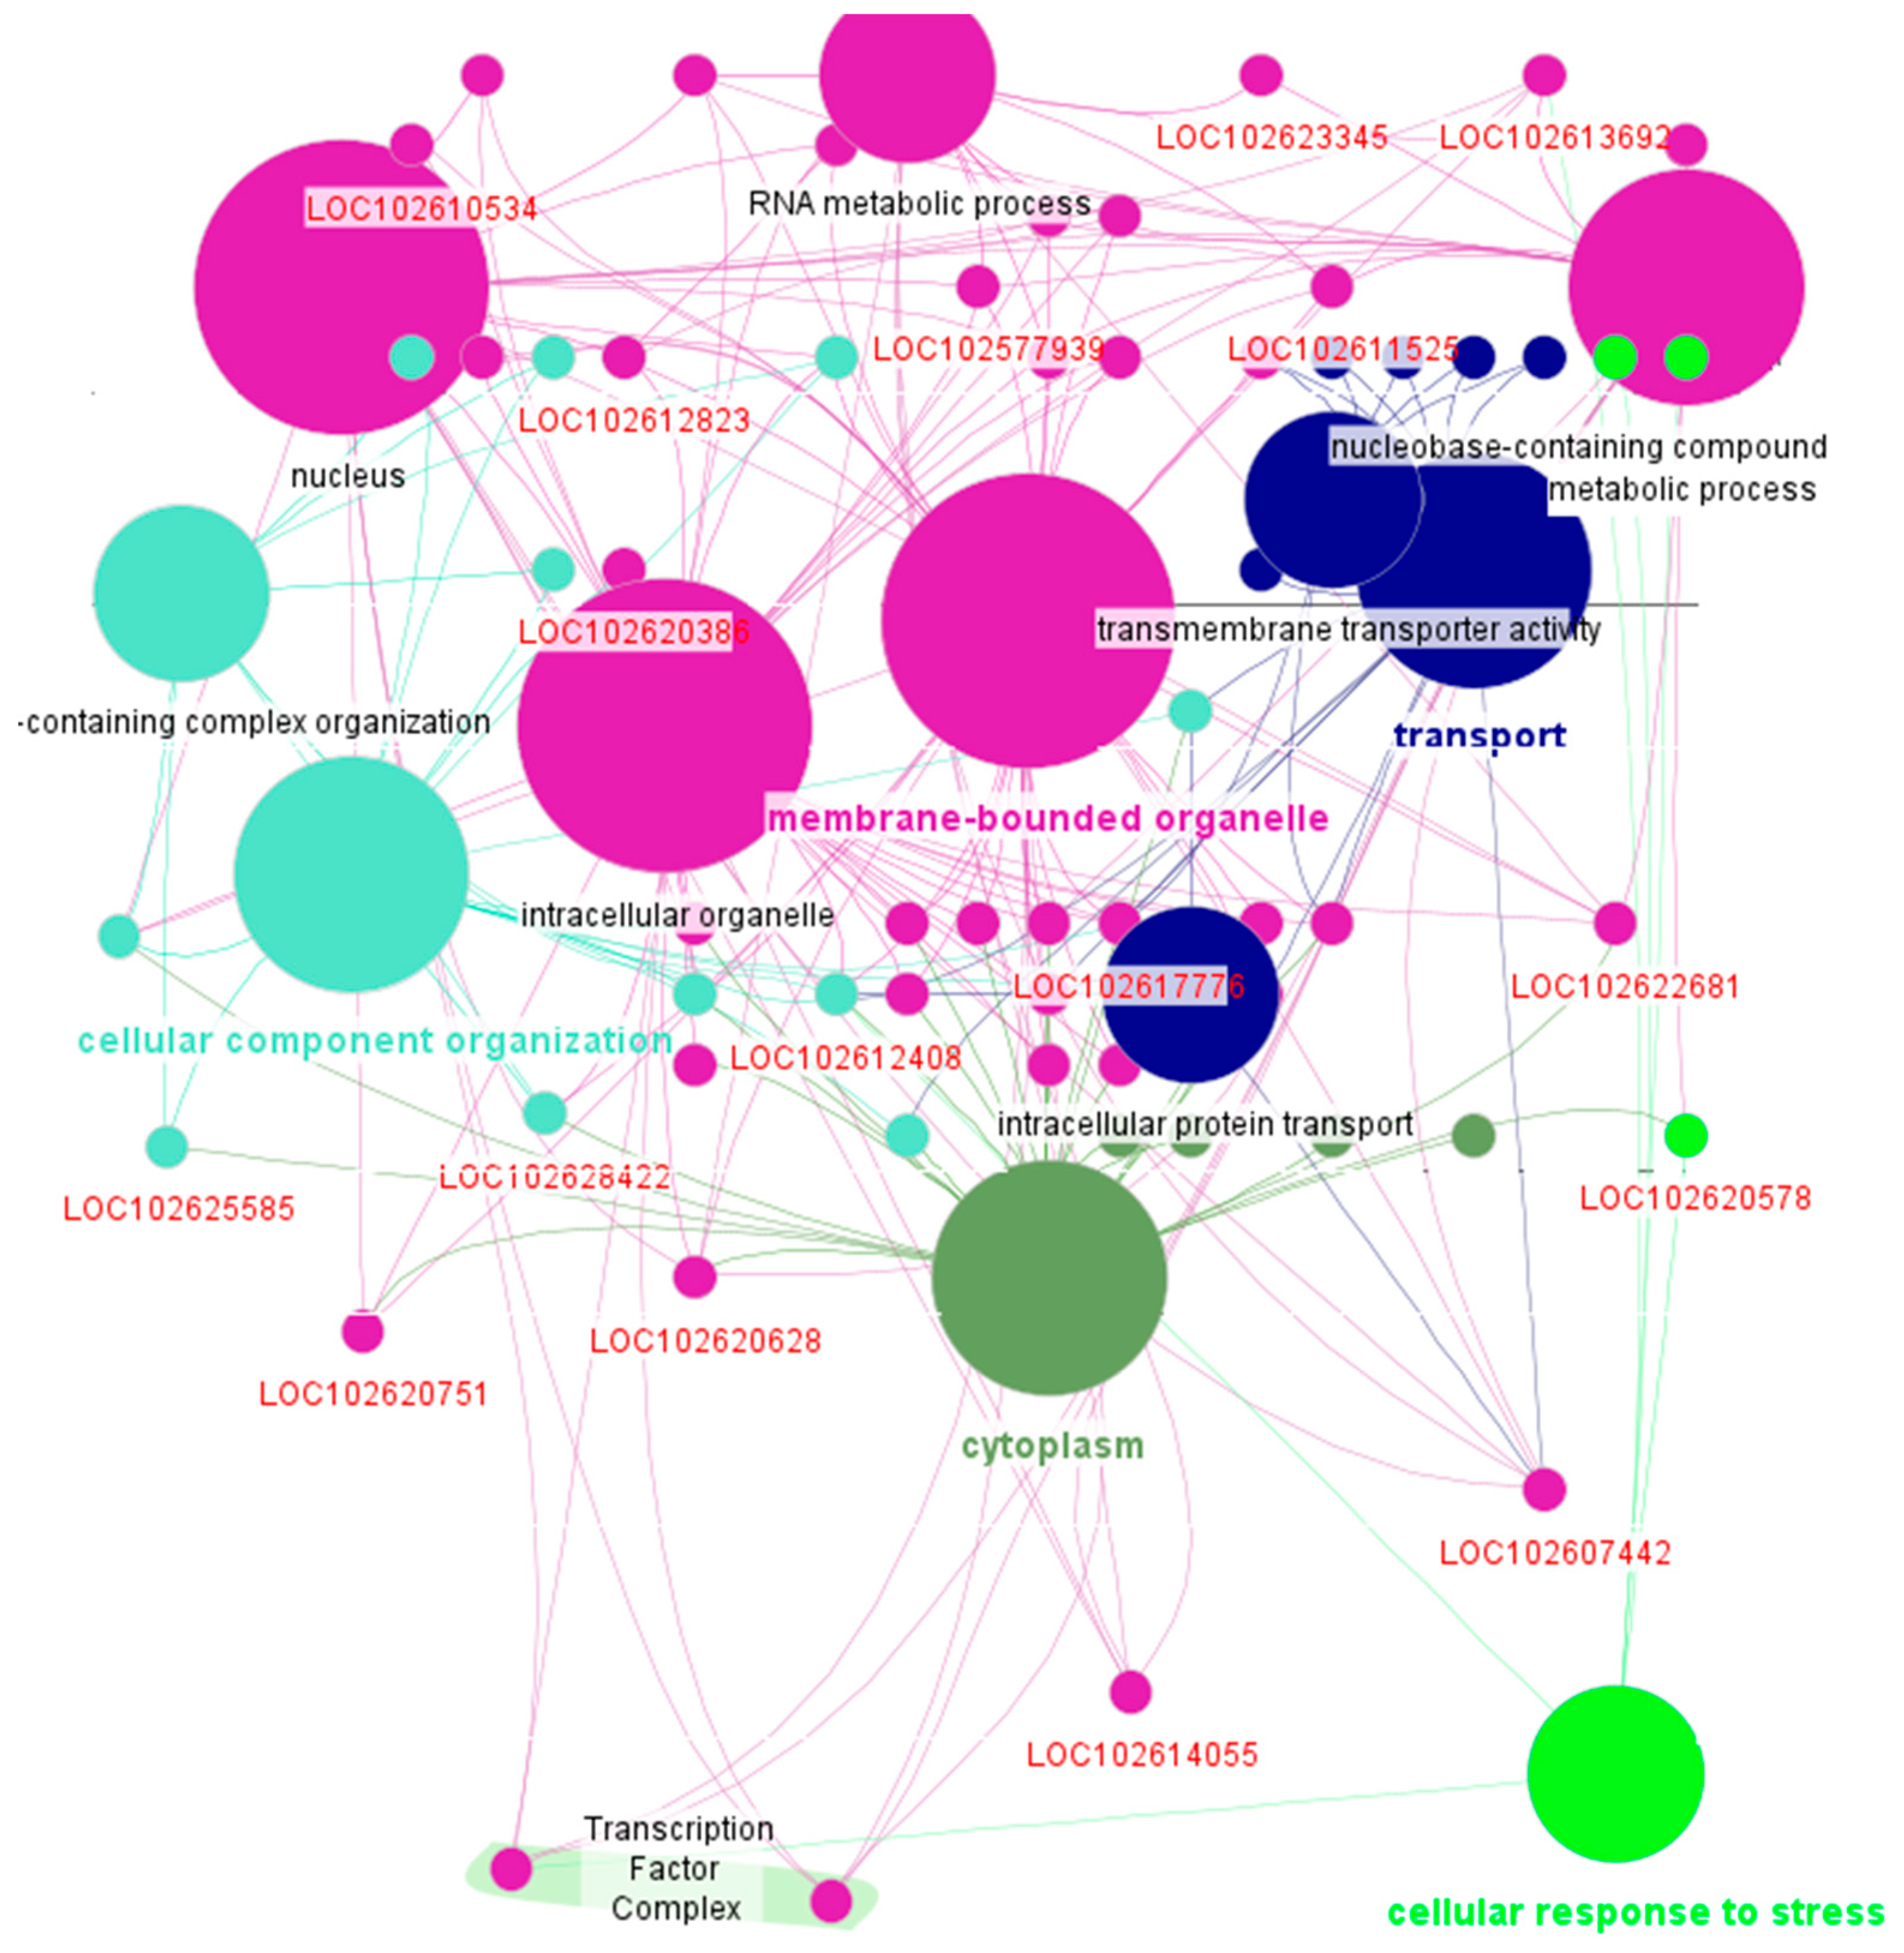
Figure 8.
Upset diagram of differentially expressed genes (A) overexpressed genes (B) underexpressed genes. Consistent gene expression patterns are shown across different variables (dpi, citrus species, tissue type), revealing possible common pathways. Comparisons are labeled as follows: p203307_fr_im, p203307_fr_m, and p203307_lf_m represent orange fruit and leaf samples mature and immature; p417324-56-dpi, p417324-126-dpi, etc., indicate infected orange leaves at different days post-infection; p557834_T_vs_W, p557834_TL_vs_W, and p557834_TL_vs_T compare thornless, wild-type, and thorny grapefruit plants; p629966-0-dpi, p629966-3-dpi, and p629966-9-dpi represent orange feeder roots post-infection; p739186-fall, p739186-spring, etc., denote symptomatic versus asymptomatic mandarin leaf samples across seasons; and p755969-lim-vs-or compares finger lime and orange leaves. Full details are provided in Supplementary Table S1.
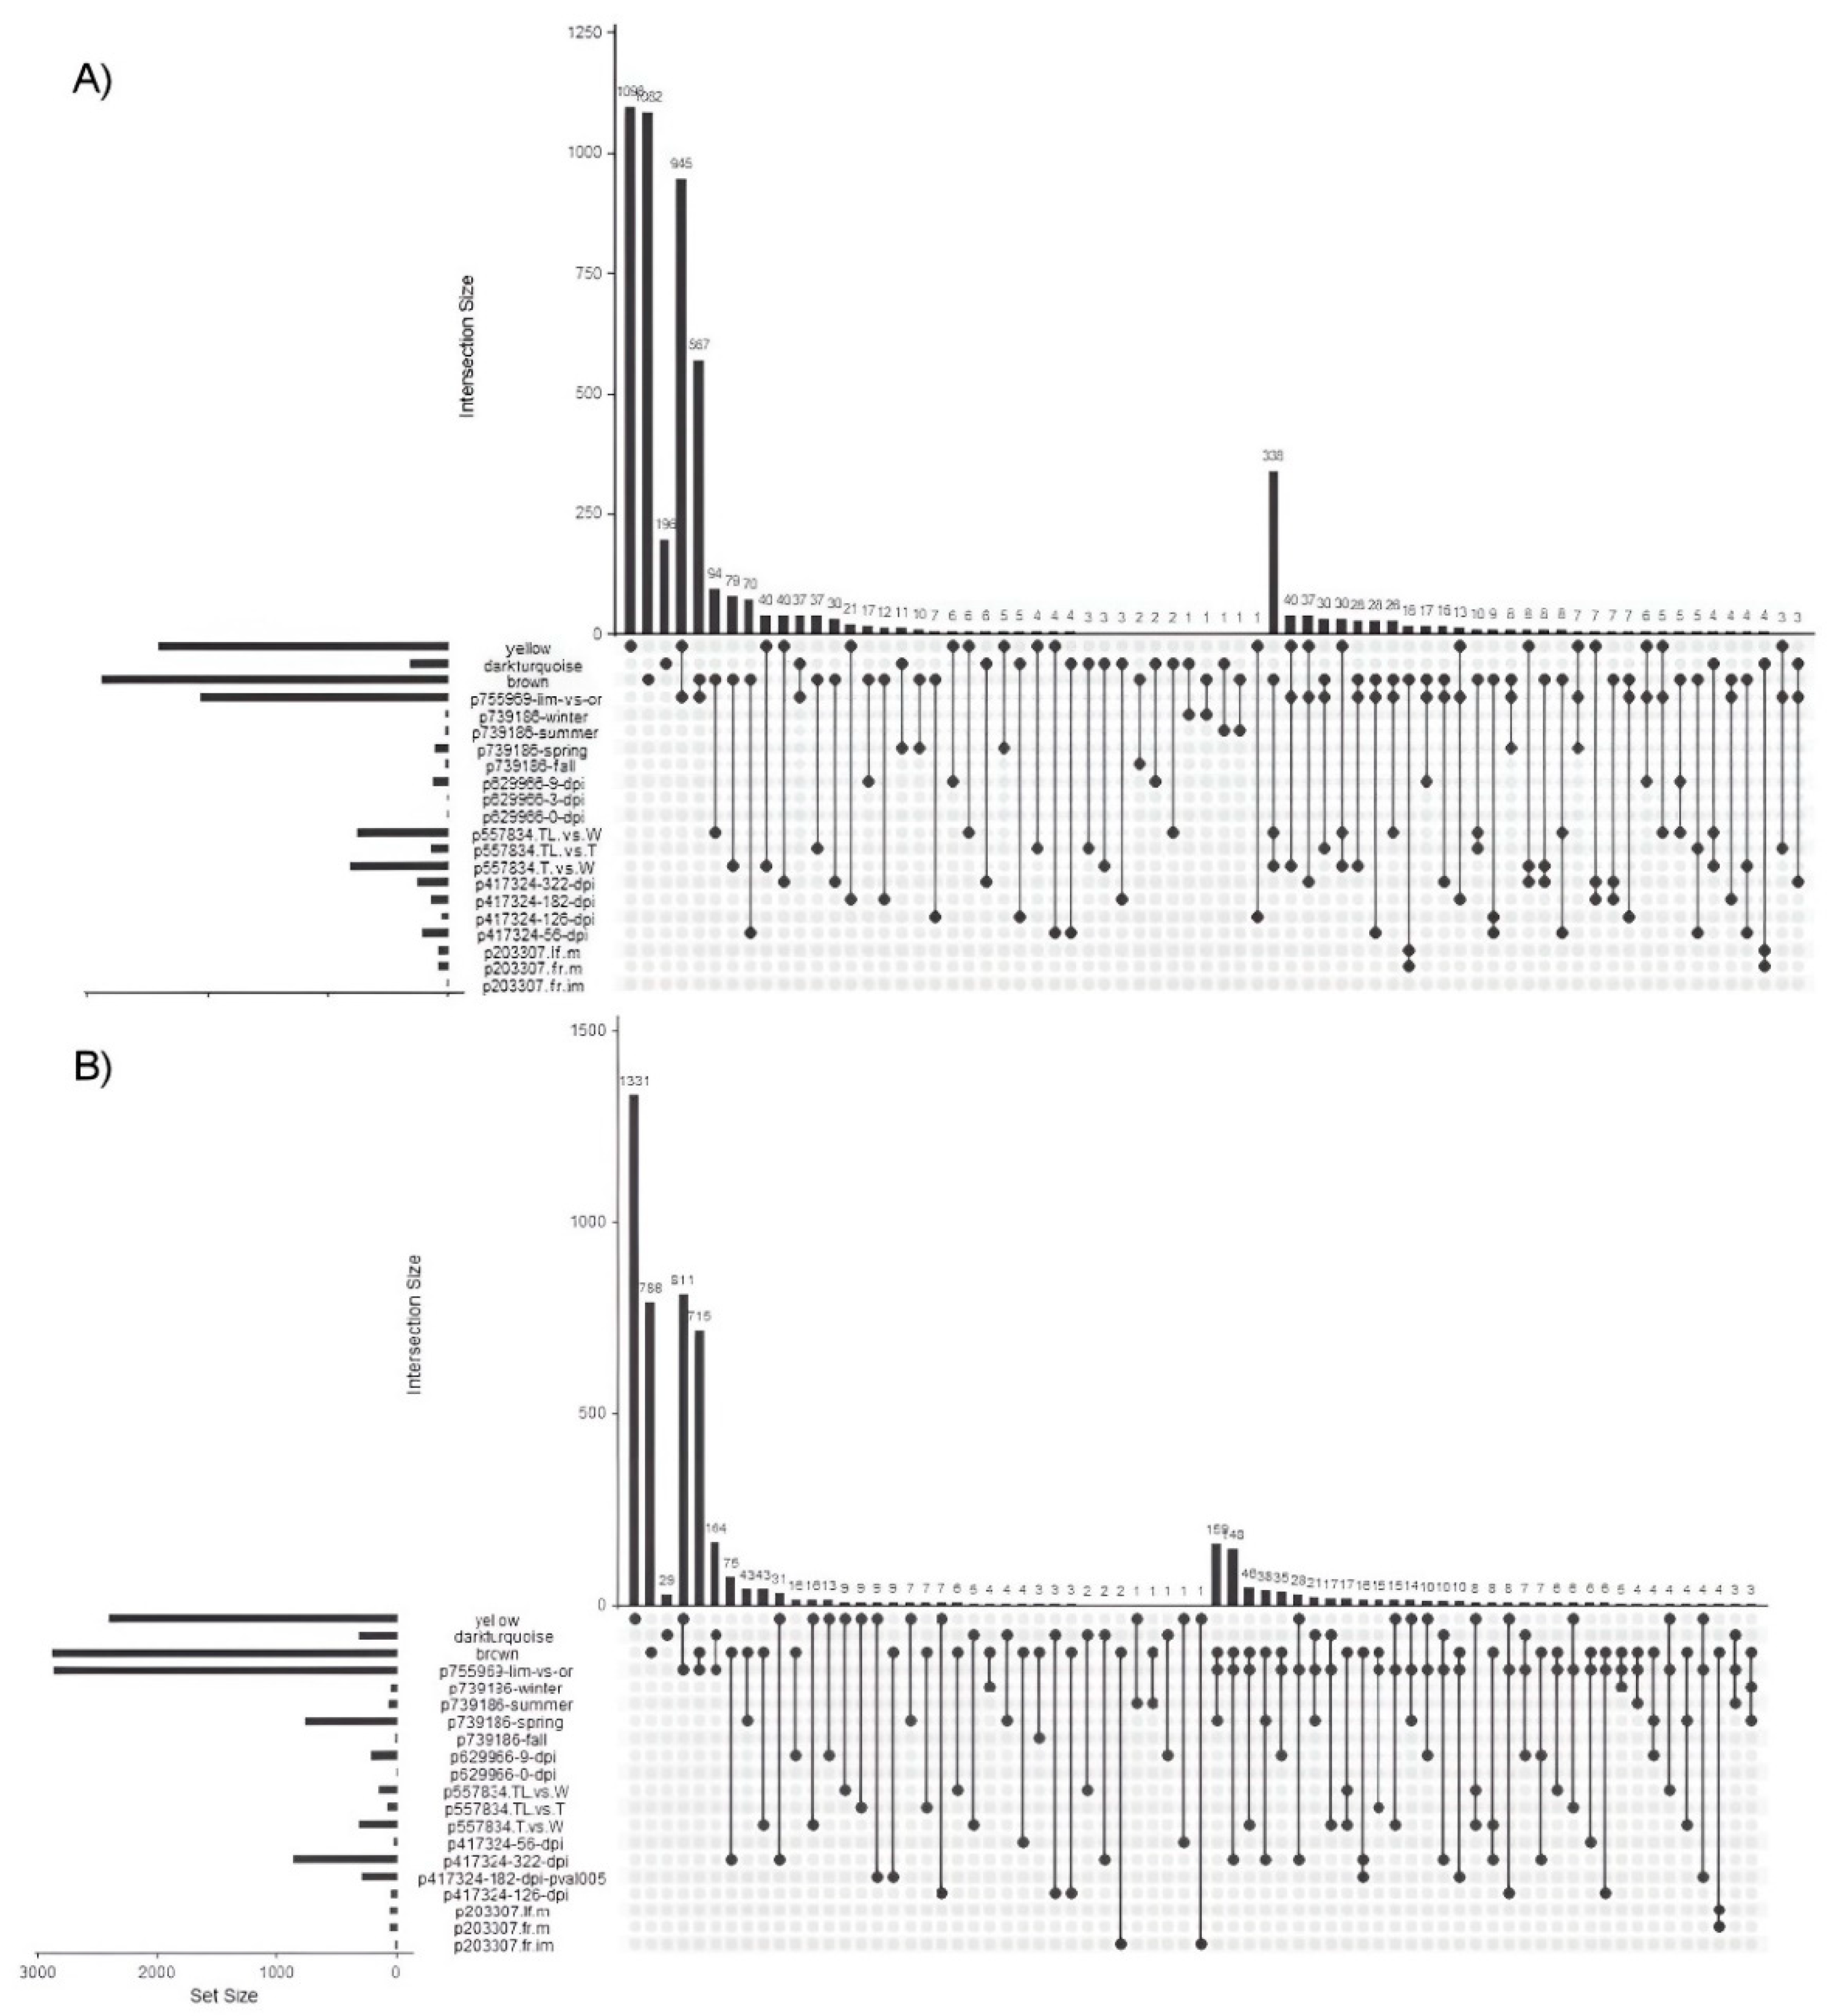

Table 1.
Descriptive statistics of the percentage of reads mapped to the C. sinensis DHSO v3.0 and C. clementina v1.0 reference genomes using the STAR and HISAT2 alignment tools.
Table 1.
Descriptive statistics of the percentage of reads mapped to the C. sinensis DHSO v3.0 and C. clementina v1.0 reference genomes using the STAR and HISAT2 alignment tools.
| Aligner | Genome | Minimum (%) | Q1 (%) | Median (%) | Q3 (%) | Maximum (%) |
|---|---|---|---|---|---|---|
| STAR | C. sinensis DHSO v3.0 | 23.02 | 63.53 | 88.88 | 92.1 | 95.71 |
| STAR | C. clementina v1.0 | 27 | 66.23 | 89.75 | 92.41 | 95.44 |
| HISAT2 | C. sinensis DHSO v3.0 | 19.17 | 56.05 | 78.06 | 83.3 | 88.6 |
| HISAT2 | C. clementina v1.0 | 14.73 | 55.63 | 80.87 | 85.52 | 91.81 |
analyses. HISAT2 and STAR aligners were tested, and samples with less than 60% alignment (highlighted by the red line) were discarded to ensure data quality.
Disclaimer/Publisher’s Note: The statements, opinions and data contained in all publications are solely those of the individual author(s) and contributor(s) and not of MDPI and/or the editor(s). MDPI and/or the editor(s) disclaim responsibility for any injury to people or property resulting from any ideas, methods, instructions or products referred to in the content. |
© 2025 by the authors. Licensee MDPI, Basel, Switzerland. This article is an open access article distributed under the terms and conditions of the Creative Commons Attribution (CC BY) license (http://creativecommons.org/licenses/by/4.0/).
Copyright: This open access article is published under a Creative Commons CC BY 4.0 license, which permit the free download, distribution, and reuse, provided that the author and preprint are cited in any reuse.


