Submitted:
06 January 2025
Posted:
07 January 2025
You are already at the latest version
Abstract
Visual positioning accuracy is crucial for ensuring the successful execution of nut disassembly and assembly tasks by a fastener-nut disassembly and assembly robot. However, disturbances such as on-site lighting changes, abnormal surface conditions of nuts, and complex backgrounds formed by ballast in complex railway environments can lead to poor visual positioning accuracy of the fastener nuts, thereby affecting the success rate of the robot's continuous disassembly and assembly operations. Additionally, the existing method of detecting fasteners first and then positioning nuts has poor applicability in the field. A direct positioning algorithm for spiral rail spikes that combines an improved Canny algorithm with shape feature similarity determination is proposed in response to these issues. Firstly, CLAHE enhances the image, reducing the impact of varying lighting conditions in outdoor work environments on image details. Then, to address the difficulties in extracting the edges of rail spikes caused by abnormal conditions such as water stains, rust, and oil stains on the nuts themselves, the Canny algorithm is improved through three stages: filtering optimization, gradient boosting, and adaptive thresholding, to reduce the impact of edge loss on subsequent rail spike positioning results. Finally, considering the issue of false fitting due to background interference, such as ballast in gradient Hough transformations, the differences in texture and shape features between the rail spike and interference areas are analyzed. The HOG is used to describe the shape features of the area to be screened, and the similarity between the screened area and the standard rail spike template features is compared based on the standard Euclidean distance to determine the rail spike area. Spiral rail spikes are discriminated based on shape features, and the center coordinates of the rail spike are obtained. Experiments were conducted using images collected from the field, and the results showed that the proposed algorithm, when faced with complex environments with multiple interferences, has a correct detection rate higher than 98% and a positioning error mean of 0.9mm. It exhibits excellent interference resistance and meets the visual positioning accuracy requirements for robot nut disassembly and assembly operations in actual working environments.
Keywords:
fastener-nut disassembly and assembly robot
; spiral rail spike
; complex environment
; improved Canny algorithm
; HOG feature similarity
; center positioning
1. Introduction
Fasteners are the main components of railway track systems to maintain the gauge and reduce noise and shock absorption, which play a crucial role in ensuring the stability of the track and the safe operation of vehicles [1,2]. Regular maintenance of railway fasteners is essential to ensure the normal operation of the railway system. The fastener maintenance process involves removing the nut first, then removing the rust, applying oil to the spiral rail spike, and finally tightening the nut [3]. The nut removal and assembly take the most time in the whole maintenance operation. However, at the present stage, the disassembly and assembly of fastener nuts are mainly based on traditional manual work [4], which has problems of high labor intensity, low efficiency, and significant quality fluctuation. Therefore, it is significant to realize robots' intelligent disassembly and assembly of fastener nuts. Fastener-nut position information is the key input parameter of robot disassembly and assembly, and its visual positioning accuracy directly determines whether the whole disassembly and assembly operation can be completed, so this paper focuses on the accurate positioning of fastener-nut to realize the intelligent disassembly and assembly of robot nut.
Domestic and foreign scholars have conducted extensive research on fastener positioning. Feng et al. [5] utilized the positional relationship between fasteners, rails, and sleepers to achieve fastener positioning by detecting the positions of rails and sleepers. However, the positioning accuracy was relatively low due to significant wear on the edges of rails and sleepers and discontinuous boundary features. Wu et al. [6] localized the fasteners using the contact edge of the cushion and sleeper combined with prior knowledge. However, the positioning accuracy was not ideal when the contact boundary was blurred. Sun et al. [7] constructed a feature map and then performed correlation sorting based on background and foreground scales to suppress background interference and complete fastener positioning. However, this algorithm did not consider the interference of a large amount of ballast in the background and was unsuitable for ballasted railway fastener positioning. Li et al. [8] combined pixel statistics and template matching to propose a local unidirectional template matching method for fastener positioning. However, the positioning results were unsatisfactory for fasteners with incomplete image edge collection. Sheng et al. [9], in response to the difficulty in positioning incomplete fasteners with shape loss, combined pixel statistics with template matching to propose a fastener positioning method that integrates the positional relationship of fasteners, but it was only applicable to ballastless railways. Bai et al. [10] achieved fastener localization through an optimized Faster R-CNN model, enhancing the algorithm's computational accuracy and operational speed. However, the dataset contains a limited variety of images, which may not ensure localization accuracy under actual working conditions. At present, research on railway fastener positioning focuses on obtaining the spatial position of the entire fastener. Still, it is difficult to accurately locate the center of the nut based solely on the position of the fastener.
Research on locating nut centers is relatively scarce. Li et al. [11] used the Hough transform to locate hexagonal nuts in power systems. Still, the railway environment is relatively complex, and the accuracy of this algorithm is low when used directly. Peng et al. [12] combined environmental suppression and iterative excitation to improve the Canny algorithm for extracting the contour of fasteners and proposed a multi-feature hierarchical positioning algorithm based on the gasket's circular contour and the nut's hexagonal feature. However, when the buckle's position is not in the center of the image, some gasket features may be obscured, leading to a decrease in final positioning accuracy. Liu et al. [13] used the least squares method for circle fitting after preprocessing the fastener image, and based on the texture feature differences between the rail spike area and the non-spike area, they used a voting algorithm to determine the rail spike area, thereby locating the center of the rail spike. However, areas with texture features similar to the fastener can lead to mispositioning, dramatically affecting the algorithm's final accuracy.
Interference in railway complex environments for visual positioning can be divided into three types: (1) Abnormal conditions such as nut water stains, rust, and oil stains cause edge blurring, which interferes with positioning; (2) Changes in on-site lighting interfere with positioning; (3) Cluttered backgrounds such as ballast interfere with positioning. The current method for locating nuts is to locate the center of the nut after the fastener has been identified. It does not fully consider the interference of the complex environment of the railway, so the positioning accuracy is poor when the method is applied to the robot disassembly operation. In response to this issue, this paper achieves accurate positioning in railway environments by improving the Canny algorithm and combining it with determining the shape characteristics of fasteners and nuts. In the assembly relationship of the fastening system, the centers of the nut, spiral rail spike, and spring clip are on the same axis. Compared to the nut, spring clip, and gauge plate, the spiral rail spike has a distinctive circular edge feature that is relatively stable, which helps to improve positioning accuracy. Therefore, by directly positioning the spiral rail spike's center, the robot's working position to assemble or disassemble the nut can be determined.
2. The Working Principle of Robots
As shown in Figure 1, the fastener-nut disassembly and assembly robot mainly comprises a master control system, a carrying platform, a robotic arm, a rotating sleeve, and a monocular camera. The camera is positioned above the fastener by a bracket at a certain height from the fastener. The working principle of the robot is as follows: It utilizes machine vision to capture the position information of the spiral spikes, which serves as a control input. The robot controller then issues commands to guide the carrier platform to move to the target location, ensuring that the center of the sleeve aligns directly above the spiral spike. Subsequently, the mechanical arm descends and rotates the sleeve to complete the nut removal or installation. Finally, the mechanical arm rises, concluding a single operation cycle. The robot completes the disassembly and assembly of all fastener nuts in the designated maintenance area by repeating the operation. In the entire workflow, visual positioning serves as a critical input parameter for robot motion control, and its positioning accuracy directly determines the success rate of the robot's task execution. Therefore, research on precise visual positioning algorithms for spiral rail spikes in rail environments holds immense significance for enhancing the efficiency and accuracy of robot operations in complex conditions.
3. Spiral Rail Spike Positioning Method
3.1. Overall Process of Positioning Method
The positioning method for spiral road nails includes three stages: image preprocessing, road nail edge detection, and center positioning of the road nail. In the image preprocessing stage, the detection area is enhanced by applying Contrast-Limited Adaptive Histogram Equalization (CLAHE) to limit contrast, which reduces the impact of lighting variations on subsequent positioning. In the edge detection stage, an improved Canny algorithm is proposed to extract the edge information of the image more effectively, aiming at the limitations of the traditional Canny algorithm in the face of abnormal spikes and its poor adaptability. In locating the center of the road stud, the gradient Hough transform is used to fit the circular features on the edge map, extract the road stud areas to be screened, and obtain the center coordinates of each region. At the same time, considering that non-railroad spike circular interference objects such as ballast are easily misfitted as circles, a method of comparing shape features is adopted. Histogram of Oriented Gradients (HOG) feature vectors are extracted for the detected circular areas. Then, feature similarity comparison is achieved by calculating the Standard Euclidean Distance (SED) between them and the HOG feature vectors of the template railroad spike image. This process eliminates circular areas that do not match the characteristics of railroad spikes, ultimately determining the areas of railroad spikes and locating their centers. The overall algorithm flow is shown in Figure 2.
3.2. Image Preprocessing
Because of the change of illumination, the input image will have the problem of insufficient contrast, which leads to the difficulty of feature extraction and is not conducive to the subsequent positioning process. Therefore, it is necessary to enhance the input fastener image. CLAHE [14] improves the adaptive histogram equalization (AHE), which limits the distribution of the histogram by setting a threshold to avoid the blocking effect and noise amplification when the AHE algorithm processes the image. Therefore, CLAHE enhances the image's contrast, highlights the spike characteristics, and avoids excessive image enhancement. As shown in Figure 3, the contrast of the enhanced image is significantly improved, and the edge is more apparent, which can provide reliable image data for subsequent spike positioning.
3.3. Improved Canny Algorithm for Image Edge Detection
3.3.1. Filter Optimization
In edge detection, the Gaussian filter in the traditional Canny algorithm makes it easy to blur the image edge. In contrast, the median and mean filters are not good at denoising when dealing with images with single-color features, thus affecting the detection results. Bilateral filtering [15] adds pixel similarity based on Gaussian filtering. It considers spatial proximity and pixel brightness values to determine their impact on output pixels to remove noise while maintaining edges. Therefore, this paper optimizes Gaussian filtering to bilateral filtering for image processing.
In the formula: the d(x,y,m,n) represents the domain kernel, r(x,y,m,n) represents the range kernel, ω(x,y,m,n) represents the weight coefficient, f(x,y) is the pixel value at pixel coordinate (x,y) in the buckle image, (m,n) is any point within the selected center (x,y) neighborhood, and fo(x,y) is the output pixel value after filtering of the buckle image.
3.3.2. Gradient Boosting
The traditional Canny operator only includes gradient information in the 0° and 90° directions [16], which can lead to imprecise edge localization when the edge gray-level changes are slow. For instance, when there is grease on the surface of a rail spike, the gray-level difference between the spike area and the background area is insignificant, making it easy to lose the edge information of the spike. This paper takes the Sobel operator as a template, integrating the 90° and 135° directions for gradient enhancement to improve the precision of edge extraction. The four-direction Sobel template is shown in Figure 4.
The gray value of the pixel point (x, y) is f(x, y), and the calculation method for the gray values g0,g45,g90, and g135 of the edge detection along the four directions are shown in the formula (5):
The gradient values in the directions of 45° and 135° are respectively fused to the directions of 0° and 90° for gradient enhancement. The gradient amplitude of the enhanced image is shown in formula (6), and the gradient direction of the image is shown in formula (7):
In the formula, G represents the magnitude of the pixel gradient, and θ represents the direction of the pixel gradient.
3.3.3. Adaptive Threshold Setting
The selection of double thresholds directly affects the result of edge detection. The double thresholds in the traditional Canny algorithm are fixed, and the adaptive ability is poor, so the detection effect is not good in the complex environment of the railway scene, and the edge discontinuity easily occurs, which leads to the difficulty of subsequent positioning. Therefore, this paper combines the OTSU algorithm [17] to achieve the adaptive setting of Canny thresholds.
The OTSU algorithm uses the one-dimensional gray histogram of the image to perform threshold segmentation. Assuming that there is a threshold value T, the pixels with a gray value less than or equal to T belong to the foreground, and the rest belong to the background, their occurrence probability and average gray value are calculated, and the maximum between-cluster variance of the foreground and the background is calculated as shown in formula (8):
In the formula, m1 is the mean grayscale value of the foreground pixels, m2 is the mean grayscale value of the background pixels, and mg is the overall mean grayscale value of the image. P1 is the proportion of foreground pixels, and P2 is the proportion of background pixels. By iterating through the grayscale levels of the image, the threshold T that maximizes the inter-class variance σ2 is considered the optimal threshold. Let the high threshold TH=T and the low threshold TL=T/2, thereby enhancing the adaptability of the entire algorithm.
3.4. Positioning Road Studs Through Shape Features
As shown in Figure 5, compared with the gradient Hough transform [18], the least squares circle fitting [19] requires more complex calculations, and the detection effect is not good when facing the railway environment. Therefore, after completing the image edge detection work, the gradient Hough transform is used for circle fitting processing to determine the center coordinates and corresponding radii of all the circular regions of the spiral rail spikes to be screened.
Standard image features include texture [20] and shape [21]. Considering that the gradient Hough transform mainly relies on the gradient line intersection of the edge features for cumulative calculation, the non-spike interferent of the edge feature circle, such as ballast, can easily be mistakenly identified as a circle meeting the detection radius range and its surface features are very similar to spikes. Hence, it isn't easy to distinguish them by texture features. Compared with the texture feature, its shape feature is not affected by various interference on the spot, and it is more stable and can be described. HOG feature [22,23] is an image feature description method. Its essence is the distribution statistics of gradient information in the image, which can capture the local shape of the image well. Compared with other feature representations, HOG is not sensitive to the illumination and geometric changes of the image and has higher detection accuracy and stability.
Therefore, after circle fitting, HOG features are used to describe the shape of the area to be screened, and finally, the area most similar to the shape features of the standard spike template can be determined as the spike area. At the same time, the final output of HOG feature extraction is a vector, so the similarity measurement of the HOG feature can be transformed into the similarity measurement of vectors. This paper uses the standard Euclidean distance SED of two feature vectors to measure their similarity, and the spike region screening is realized. The smaller the SED value is, the more similar the two vectors are, and vice versa. The specific steps of the screening algorithm are shown in Figure 6.
The calculation of SED is shown in formula (9):
In the formula, μi represents the mean of the ith component of the vector, σi represents the standard deviation of the ith element of the vector, and DA, B std is the standard Euclidean distance between vector A and vector B.
Due to the lack of scale invariance in HOG (Histogram of Oriented Gradients) features, it is necessary to standardize the image size when comparing HOG features. Additionally, the richer the specific shape features contained in the screening area, the higher the screening accuracy after similarity determination. Therefore, appropriately enlarging the detected circular area can improve the algorithm's accuracy. Analysis of the fastener image shows that the shape features of the hexagonal nut are specific and distinct. Thus, using the diameter of the circumscribed circle of the hexagonal nut as the side length and the center of the area to be screened as the centroid, a square is used as the enlarged area.
The diameter of the circumscribed circle of the nut in the image is given by formula (10):
In the formula, ρ is the image size ratio to the actual size, which can be measured experimentally; d is the diameter of the circumscribed circle, a known standard. Thus, D is a fixed value. Therefore, the detected circular area is enlarged by a factor of δD×δD, denoted as the area to be screened. Where δ is the increment of pixel size, the best screening effect is obtained when δ=20 by experiment.
The HOG feature vector of the offline, same-sized standard template image is denoted as Hsd. The collection of HOG feature vectors for the area to be screened is shown in formula (11):
In the formula, represents the feature vector of the ith area to be screened. By traversing the feature vector set I, the SED value between and Hsd is calculated as . The set of vector similarity measurements S is then given by formula (12).
The Hi rt that satisfies the condition in formula(13) is the feature vector of the fastener area, meaning that the area is a fastener area, and the center coordinates of this area are the center coordinates of the fastener.
4. Experiments
4.1. Experimental Samples
Image samples were collected on ballast railways in the Xi'an Railway Maintenance Section using a fastener-nut disassembly and assembly robot to verify the positioning effect of the algorithm in this paper under different interferences. The robot is used to verify the effectiveness of the algorithm presented in this paper for locating spiral rail spikes under various interferences. The camera model utilized for sample collection was the MV-HS050GC. In the collection process, the samples' illumination conditions and the surface state of the spikes are different to correspond to the complex environment in the actual railway maintenance. As shown in Figure 7, to make the comparative analysis more prominent, the samples are divided into four categories according to the surface state of the spike: normal, water stain, rust, and oil stain, and each category contains 100 images.
4.2. Image Filtering Experiment
After completing image enhancement, the proposed method is compared with Gaussian, median, and mean filtering. For a more intuitive qualitative analysis, the image of the fastener area after filtering is intercepted. Some experimental results are shown in Figure 8, in which the convolution kernel of Gaussian filtering, median filtering, mean filtering, and the filtering diameter of bilateral filtering are taken as 5. By comparison, it can be seen that Gaussian, median, and mean filtering blur some edge details of the spike in smoothing the image. In contrast, bilateral filtering can better ensure noise reduction while maintaining the edge of the spike.
At the same time, the signal-to-noise ratio (SNR) and peak signal-to-noise ratio (PSNR) are introduced as the evaluation indicators for the filtering effect of quantitative analysis. The higher the SNR value is, the better the filtering effect is, indicating that the helpful information in the image is higher than the interference information. The higher the PSNR value is, the closer the filtered image quality is to the original image, and the higher the image quality is. The comparison results are shown in Table 1. SNR and PSNR are defined as shown in formulas (14) and (15), respectively.
In the formula, Ps is the signal's average power, Pn is the average power of the noise, and SNR is in dB.
In the equation, f(i,j) is the gray value of the image at (i,j), g(i,j) is the gray value of the filtered image at (i,j), H and w are the length and width of the image, and the PSNR unit is dB.
From Table 1, it can be seen that the SNR value and PSNR value of the bilateral filtering algorithm used in this paper are higher than those of other filtering algorithms, so the noise reduction effect of bilateral filtering is better, the image quality is higher, and it will not introduce too much distortion.
4.3. Edge Detection Experiment
Edge contour detection of the fastener image was performed using both the traditional Canny algorithm and the improved Canny algorithm proposed in this paper, with some detection results shown in Figure 9.
As can be seen from Figure 9, the traditional Canny algorithm encounters edge loss to varying degrees when dealing with samples that have blurred surface features such as rust, water stains, and oil stains. In comparison, the improved Canny algorithm can obtain more complete edges of the spikes under different interferences.
To further demonstrate the effectiveness of the improved Canny algorithm, the gradient Hough transform is used to perform circle detection on the edge images obtained from both algorithms mentioned above. As shown in Figure 10, detecting a spike is defined as a successful detection, and the absence of detection is considered a failure. By comparing the accuracy of circle detection between the two, we can quantitatively illustrate the impact of the improved Canny algorithm on the subsequent spike circle fitting accuracy.
The gradient Hough correlation parameters remain unchanged, and the image circle detection results are shown in Table 2.
The traditional Canny algorithm contains less gradient information and weak edge detection capabilities. When there are rust and water stain interferences, the detection accuracy is significantly lower than that of the improved Canny algorithm. Especially when dealing with oil stains on road studs where edges are the most blurred and there are many noise points, many edges are lost, resulting in a circle detection accuracy of only 81%. The improved Canny algorithm, after optimization of filtering and enhancement of gradients, can better extract the edges of road studs, and the detection accuracy is improved by 9%, 3%, and 17%, respectively, in the presence of water stains, rust, and oil interference. At the same time, the sample also includes environmental interference, such as lighting changes. The traditional Canny algorithm does not have adaptive thresholding, making it difficult to achieve the best edge detection results and affecting the final circle detection accuracy. The improved Canny algorithm proposed in this paper can improve the accuracy of circle detection on fastener images in railway environments.
4.4. Screening Algorithm Experiment
After enlarging the screening area obtained by circle fitting, texture features, shape features, and the combination of texture features and shape features are used to screen and determine the spike area, and several screening algorithms are compared to verify their effectiveness. Among them, the texture features are described using second-order moments, the shape features are described using cosine values and SED, and the combined features are described using second-order moments combined with cosine values and SED. Examples of successful and unsuccessful screening are shown in Figure 11, and the success rates of different algorithms for locating spikes are shown in Figure 12.
Experimental results of different screening algorithms are analyzed. Under the shape feature comparison, the success rate of SED screening is higher than 97%, which is the best screening algorithm because SED effectively reduces the interference of data noise on the screening process and is the most direct and stable in characterizing the vector relationship. In contrast, the cosine value screening only uses the angle between feature vectors for similarity measurement, ignoring the absolute magnitude information of the vectors, with the highest screening success rate being only 60%. Regarding texture feature comparison, the interference area is similar in texture to the road stud area, and using the second moment as a screening criterion is highly prone to misjudgment, with a screening success rate below 75%. By combining shape feature and texture feature comparisons integrating the second moment with HOG feature similarity through mathematical operations for screening, the results are poor, with a screening success rate not exceeding 77%. The analysis indicates that the low screening rate of texture features in the fusion algorithm directly affects the overall results, and the need to adjust the weight of texture features and shape features under different conditions leads to poor robustness.
4.5. Parameter Selection Experiment
In this algorithm, the value of pixel size increment δ directly affects the success rate of screening, thus affecting the accuracy of spike center positioning. Therefore, the values of δ are 0, 10, 20, 30, and 40, respectively, in this paper, and the number of wrong samples under different values is tested to determine the value of δ through experiments. The experimental results for various values of δ are shown in Figure 13.
It can be seen from Figure 14 that when δ is 20, the screening error rate of the four types of samples is the lowest, which is universal. Therefore, the pixel size increment δ in this paper is 20.
4.6. Positioning Accuracy Experiment
In the entire set of image samples, the theoretical pixel center coordinates of the road stud are determined by taking the mean of multiple manual annotations, denoted as (x0, y0). The pixel center coordinates of the road stud obtained by the positioning algorithm are denoted as (x, y). Additionally, multiple annotations yield a pixel diameter of the road stud, Di = 54.45 pixels. The actual diameter of the road stud is Dr=24 mm. Thus, the scale factor λi-r=Di/Dr=2.3 pixels/mm. The positioning error, Err, can be calculated using the distance between two points and the scale factor. Err is a performance metric for algorithm evaluation and positioning accuracy analysis. In the sample, the road stud's position in the vertical direction of the image changes very little, but its position in the horizontal direction varies considerably. Therefore, the horizontal position of the road stud in the image is taken as the X-axis, and the positioning error Err as the Y-axis, resulting in the distribution of positioning errors for all sample road studs, as shown in Figure 14.
The graph shows that the positioning error is distributed from 0mm to 2mm, with an overall mean positioning error of 0.9mm. A tiny fraction of the positioning errors exceed 3mm, primarily due to severe oil contamination. In the railway environment, the loss of surface features of spiral rails due to severe oil contamination is only an isolated case; therefore, the positioning error demonstrated by the algorithm in this paper meets the requirements for robotic operations under railway environmental conditions. Additionally, the experimental results indicate that the positioning remains accurate even when the positions of the rail spikes are constantly changing.
4.7. Real-Time Analysis
The test environment is Inter (R) i7 CPU (2. 3GHz), the operating system is Windows 10, and the software environment is Python 3.7.6. It took 57.06 seconds to locate the spike center of all 400 experimental samples. That is, the location rate is seven frames per second. In the field experiment, the moving speed of the railway fastener-nut disassembly and assembly robot on the track is 0.3m/s, and the spike center can be accurately positioned in the movement process, which meets the visual positioning requirements of the robot nut intelligent disassembly and assembly operation.
4.8. Location Results
As shown in Figure 15, each category of image experimental samples includes nut abnormal conditions, lighting variations, and background ballast interference. The positioning results indicate that the algorithm presented in this paper strongly resists interference in accurate positioning and can meet the needs of intelligent nut disassembly and assembly in actual working environments.
5. Conclusions
This paper proposes a method for positioning a fastener-nut disassembly and assembly robot in complex environments of ballasted railways, aiming to achieve intelligent maintenance of fasteners. Firstly, the working mechanism of the robot was described, and it was established that spiral rail spikes would serve as the positioning targets. Then, by improving the Canny algorithm, the edge details of the abnormal surface state of the road studs were better captured, resulting in a road stud circular fitting success rate higher than 98%. Finally, by analyzing the texture and shape features of the rail spike area, a method combining HOG feature vectors and SED to determine the similarity of shape features for rail spike area screening is proposed, which eliminates the interference of background, such as ballast, during the localization process. The algorithm has a correct screening rate higher than 98%, with an average positioning error of 0.9mm, making it suitable for on-site nut and bolt removal robot operations.
This paper presents a method that can provide solutions for the intelligent operation of railway-related robots, but it still has certain limitations. In the next phase of research, it is necessary to consider the positioning effect when there is partial occlusion on the surface of spiral nails and the phenomenon where the image becomes blurred due to camera or robot movement, leading to a decrease in positioning accuracy.
Author Contributions
Conceptualization, M.Z. and X.C.; methodology, M.Z.; software, M.Z.; validation, G.C., X.W., P.W. and Y.L.; formal analysis, M.Z.; investigation, M.Z.; resources, X.W.; data curation, M.Z.; writing—original draft preparation, M.Z.; writing—review and editing, M.Z. and X.W.; visualization, M.Z.; supervision, P.W.; project administration, X.C.; funding acquisition, X.C. All authors have read and agreed to the published version of the manuscript.
Funding
The research was supported by the National Natural Science Foundation of China (No. 51975468) and the Key Research and Development Program of Shaanxi Province (No. 2024GX-YBXM-524).
Institutional Review Board Statement
Not applicable.
Informed Consent Statement
Not applicable.
Data Availability Statement
The data supporting this study's findings are available from the corresponding author upon reasonable request.
Acknowledgments
The authors would like to acknowledge the National Natural Science Foundation of China and the Key Research and Development Program of Shaanxi Province of China
Conflicts of Interest
The authors declare no conflicts of interest.
Abbreviations
The following abbreviations are used in this manuscript:
| CLAHE | Contrast Limited Adaptive Histogram Equalization |
| HOG | Histogram of Oriented Gradients |
| SED | Standard Euclidean Distance |
References
- Yuan, X.; Zhu, S.; Yuan, Z.; Zhai, W. Influence of rail fastener clamping force on vertical dynamic responses of wheel/rail system. J. Vib. Shock. 2020, 39, 17–24. [Google Scholar]
- Su, S.; Du, S.; Wei, X.; Lu, X. RFS-Net: Railway Track Fastener Segmentation Network With Shape Guidance. IEEE Transactions on Circuits and Systems for Video Technology. 2023, 33, 1398–1412. [Google Scholar] [CrossRef]
- Gao, H. Study on the calculation method of the fastener nut's critical rust thickness. J. Mach. Des. 2021, 38, 22–26. [Google Scholar]
- Liu, H.; Wang, J.; Huang, J.; Liu, W. Design of the internal combustion sleeper bolt wrench's torque display device[J]. Mod. Manuf. Engineering. 2018, (10), 107–112. [Google Scholar]
- Feng, H.; Jiang, Z.; Xie, F.; Yang, P.; Shi, J.; Chen, L. Automatic Fastener Classification and Defect Detection in Vision-based Railway Inspection Systems [U]. IEEE Transactions on Instrumentation and Measurement. 2014, 63, 877–888. [Google Scholar] [CrossRef]
- Wu, C.; Zheng, H. Railway fasteners positioning method by improved Census transform. J. Beijing Jiaotong Univ. 2019, 43, 58–63. [Google Scholar] [CrossRef]
- Sun, R.; Chen, X.; Li, L.; Zhen, S. Research on location method of track fasteners based on manifold sorting. J. Railw. Sci. Eng. 2020, 17, 288–296. [Google Scholar]
- Li, L.; Lv, Z.; Chen, X.; Qiu, Y.; Li, L.; Ma, A.; Zheng, S.; Chai, X. Research on track fastener positioning method based on local unidirectional template matching. Science Progress, 2021, 104(2).
- Sheng, Y.; Chen, X.; Lv, Z. A method for locating incomplete fasteners at the image edge using fastener position relationship. J. Railw. Sci. Eng. 2024, 21, 2252–2260. [Google Scholar]
- Bai, T.; Yang, J.; Xu, G.; Qiu, S. Research on railway fastener positioning based on Faster R-CNN. J. Railw. Sci. Eng. 2021, 18, 502–508. [Google Scholar]
- Li, R.; Geng, L.; Cheng, W. Nuts Positioning System Based on Machine Vision. Mach. Tl. Hyd. 2013, 41, 60–64. [Google Scholar]
- Peng, Z.; Wang, C.; Ma, Z.; Liu, H. A Multifeature Hierarchical Locating Algorithm for Hexagon Nut of Railway Fasteners. IEEE Transactions on Instrumentation and Measurement. 2020, 69, 693–99. [Google Scholar] [CrossRef]
- Liu, J.; Liu, H.; Ma, Z.; Teng, Y.; Liu, J. Three-stage Advancement Location Method for Center of Railway Fastener Nut. J. China. Railw. Soc. 2021, 43, 102–107. [Google Scholar]
- Wang, R.; Li, J.; Xu, Z. Dark-sort: multi-person tracking in underground coal mines using adaptive discrete weighting. IEEE Access. 2023, 11, 139422–139438. [Google Scholar] [CrossRef]
- Gavaskar, R.; Chaudhury, K. Fast Adaptive Bilateral Filtering. IEEE Transactions on Image Processing: a publication of the IEEE Signal Processing Society. 2019, 28, 779–790. [Google Scholar] [CrossRef] [PubMed]
- Canny, J. A computational approach to edge detection. IEEE Transactions on Pattern Analysis and Machine Intelligence. 1987, 8, 184–203. [Google Scholar]
- Otsu, N. A threshold selection method from gray-level histograms. IEEE Transactions on Systems, Man, and Cybernetics. 1979, 9, 62–66. [Google Scholar] [CrossRef]
- Lopez-Martinez, A.; Cuevas, F.J. Automatic circle detection on images using the Teaching Learning Based Optimization algorithm and gradient analysis. Appl Intell. 2019, 49, 2001–2016. [Google Scholar] [CrossRef]
- Luo, C.; Hu, X.; Peng, X. An Optimization Algorithm for Arc Extraction in Complex Background. Chin. J. Sens. Actuators. 2020, 33, 1183–1189. [Google Scholar]
- Lu, L.; Liu, Z.; Yang, T.; Chen, Y. Grayscale histogram and texture features of wake vortex image behind circular cylinder. J. Hydro. Eng. 2022, 41, 1–11. [Google Scholar]
- Liu, J.; Tang, J.; Lin, B.; Wang, D.; Zheng, H.; Wang, Y.; Li, P.; Zhong, W. Rust Spot Image Recognition of Coatings Based on HSV and Shape Feature. Chin. Surf. Eng. 2023, 36, 217–228. [Google Scholar]
- Zhou, H.; Yu, G. Research on pedestrian detection technology based on the SVM classifier trained by HOG and LTP features. Future Generation Computer Systems. 2021, 125, 604–615. [Google Scholar] [CrossRef]
- Wang, H.; Zuo, H.; Liu, Z.; Fei, H.; Liu, Y. Online Monitoring for Oil Wear Particle Images Based on HOG Feature Extraction and SVM Classification. J. Nanjing Univ. Aeronaut. Astronaut. 2022, 54, 1152–1158. [Google Scholar]
Figure 1.
Fastener-nut disassembly and assembly robot.
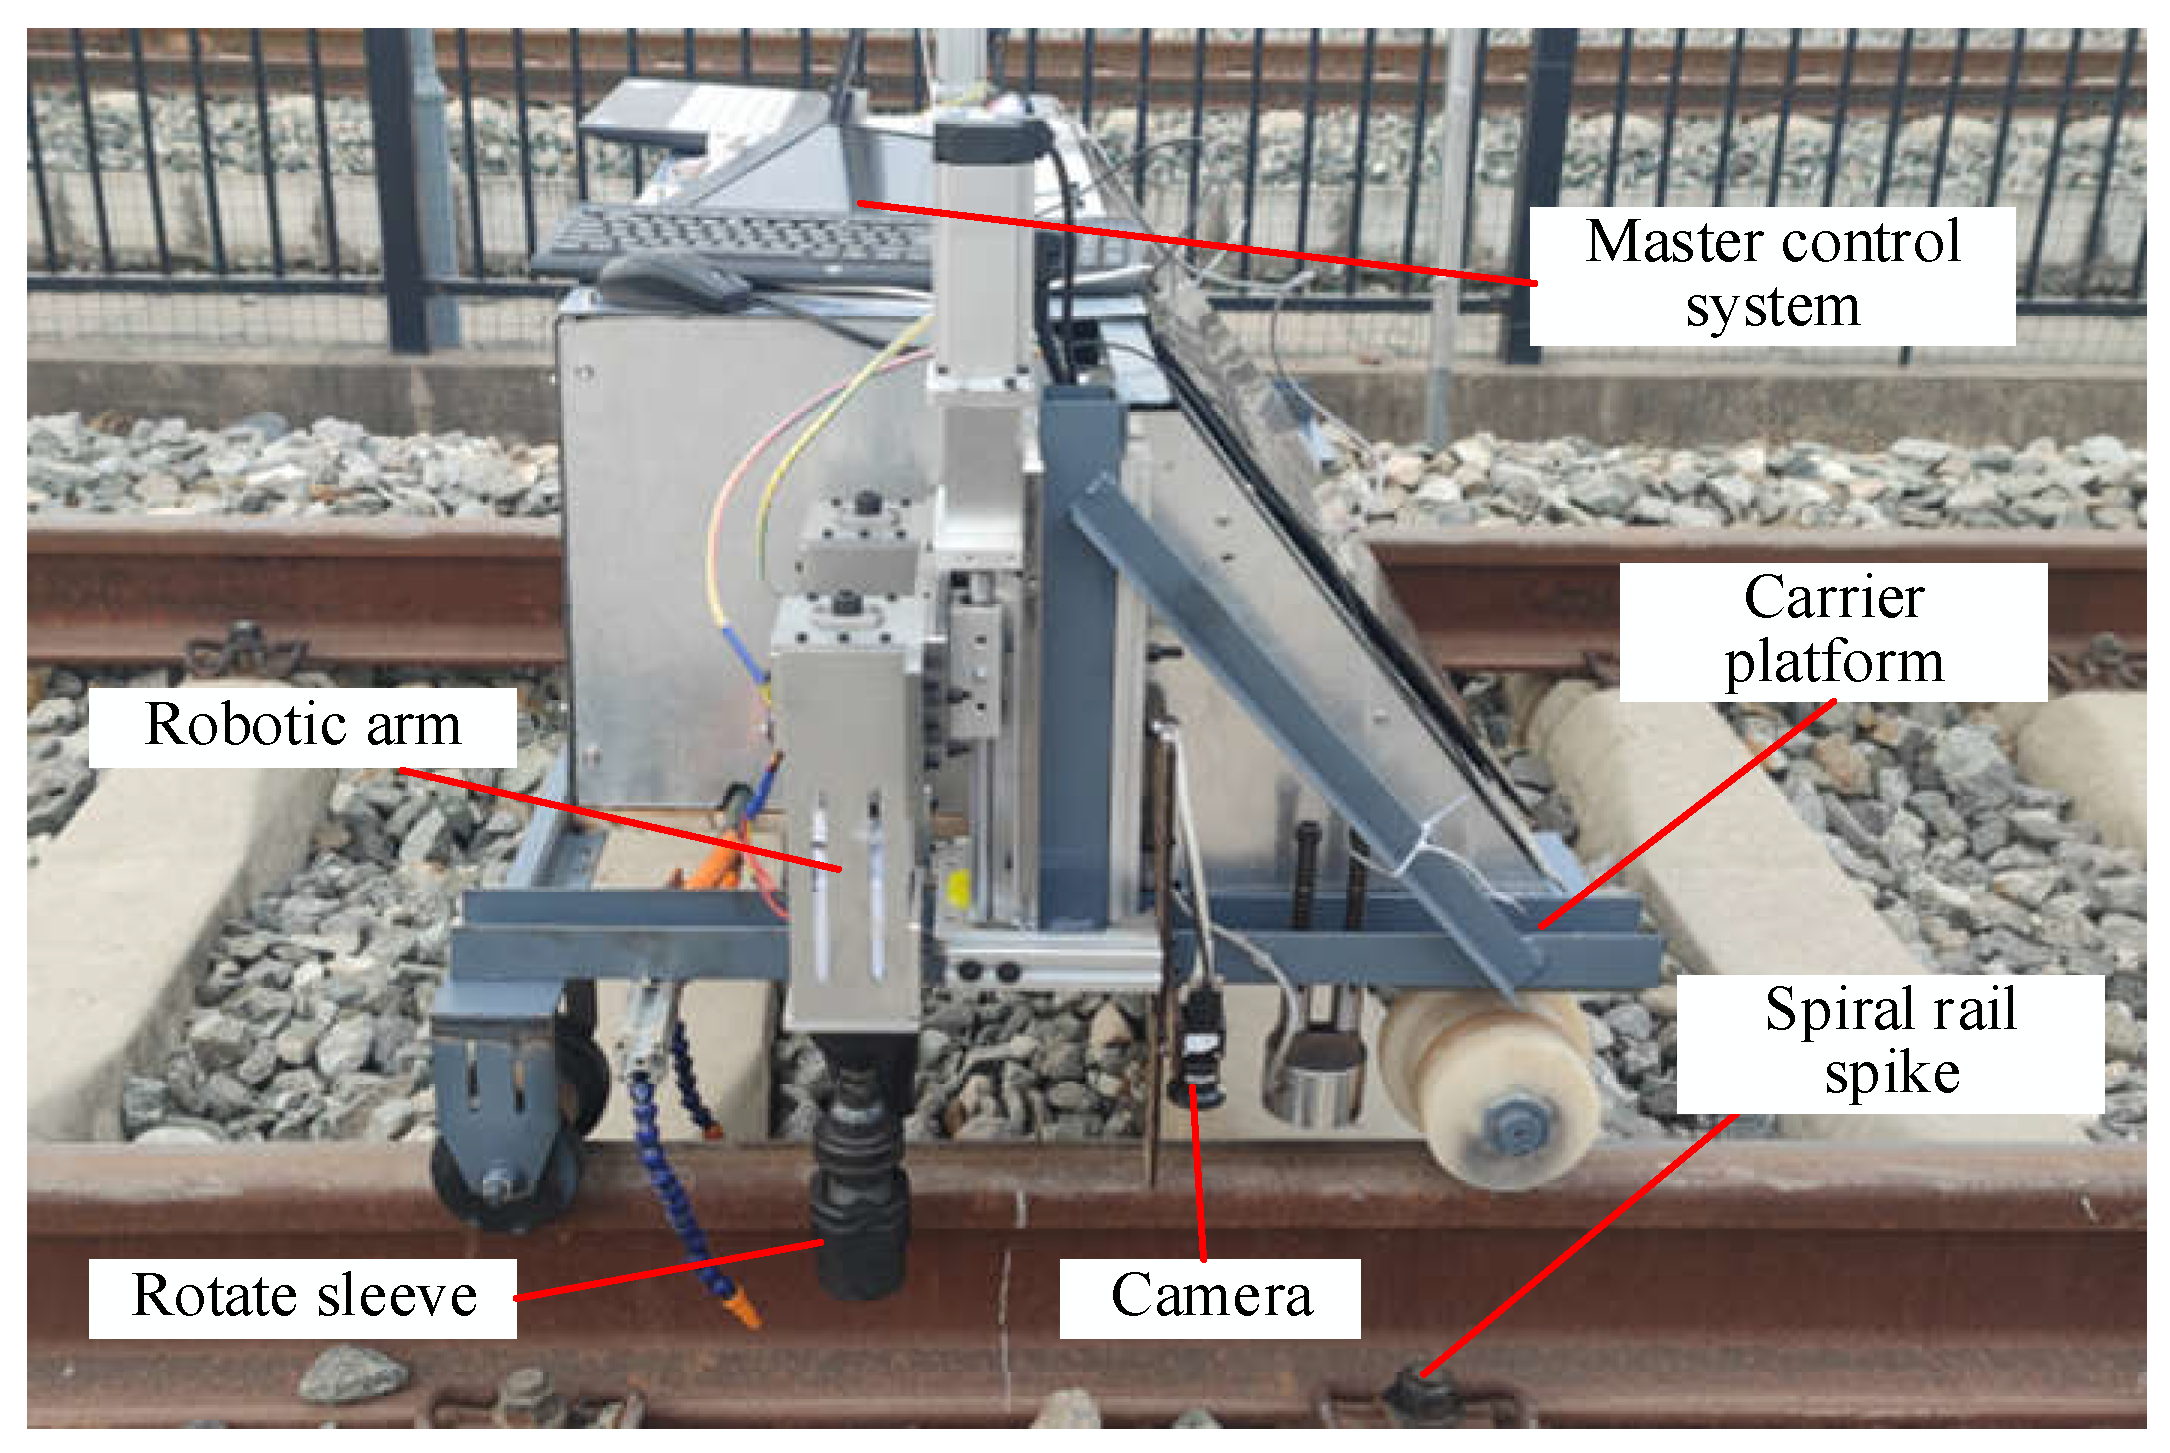
Figure 2.
Overall algorithmic process.
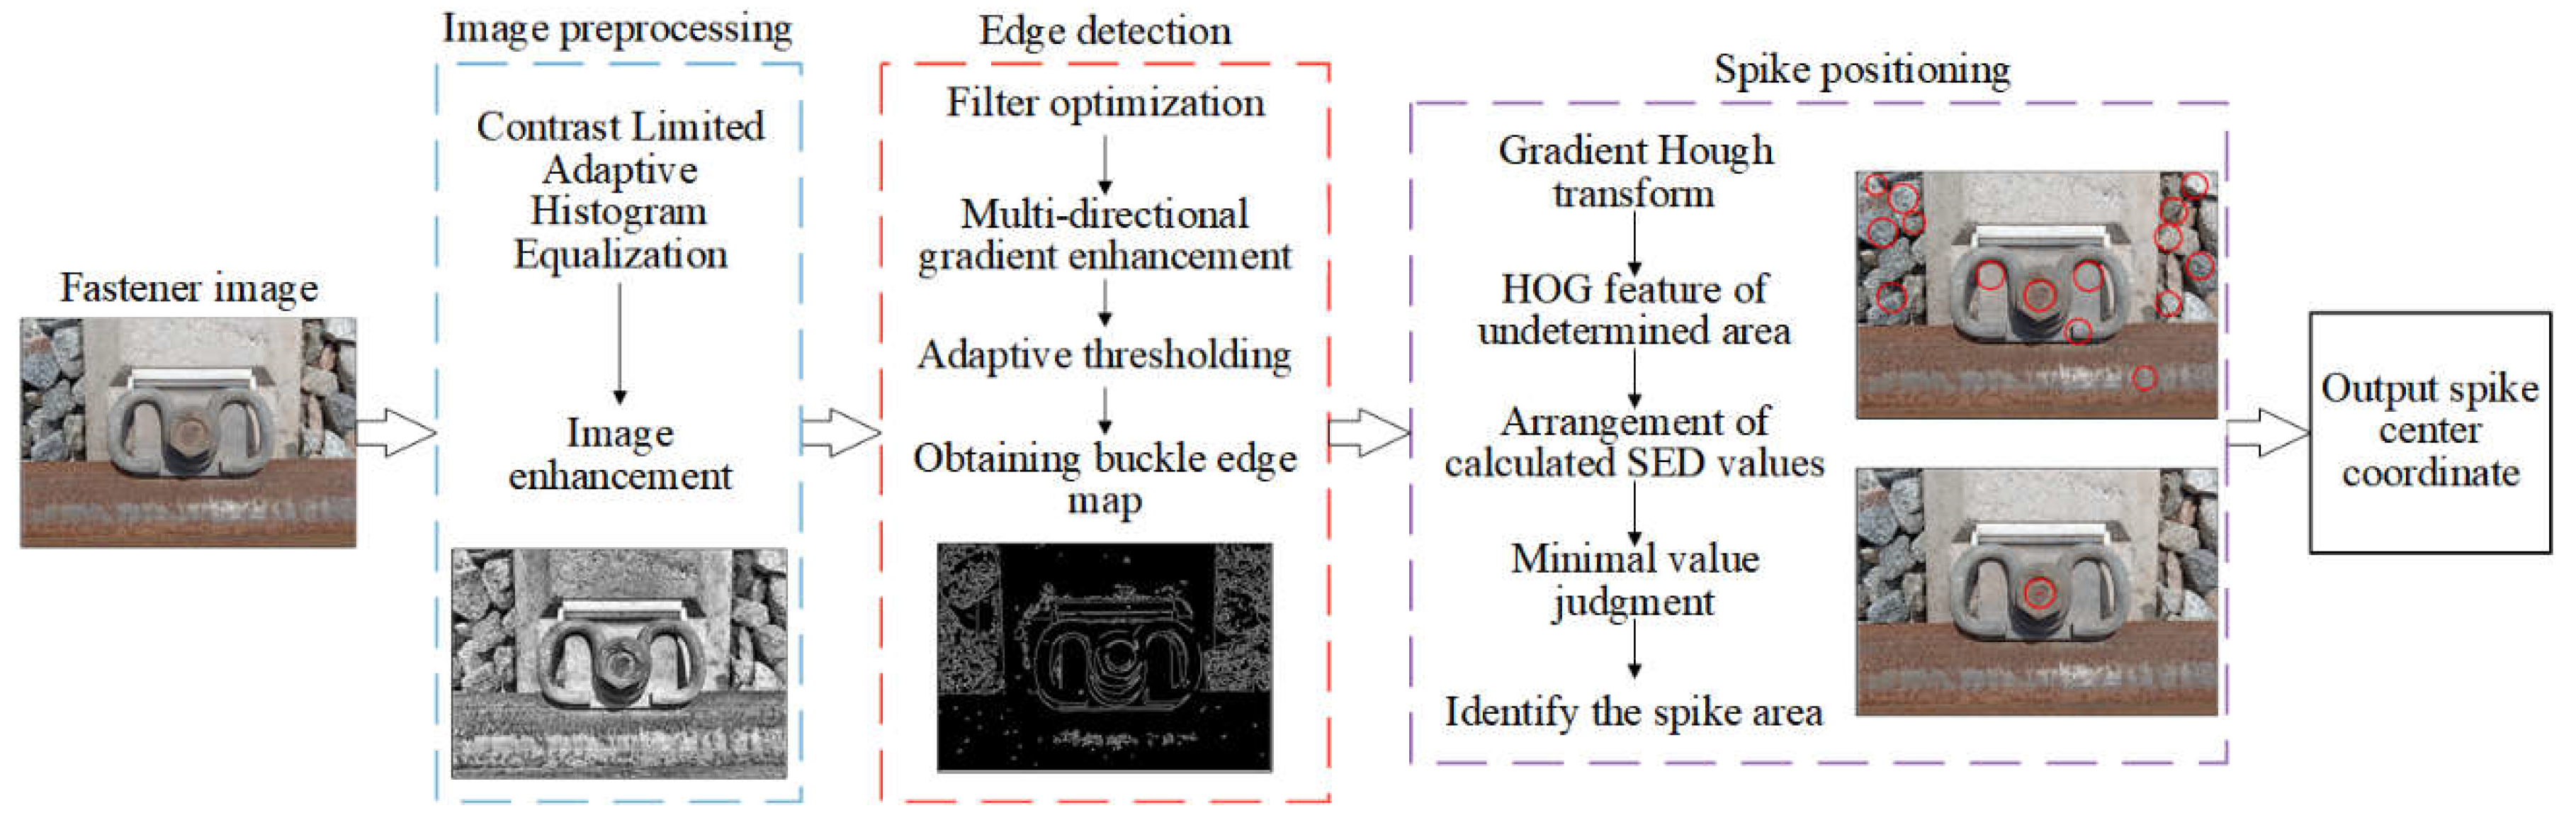
Figure 3.
Image enhancement results.
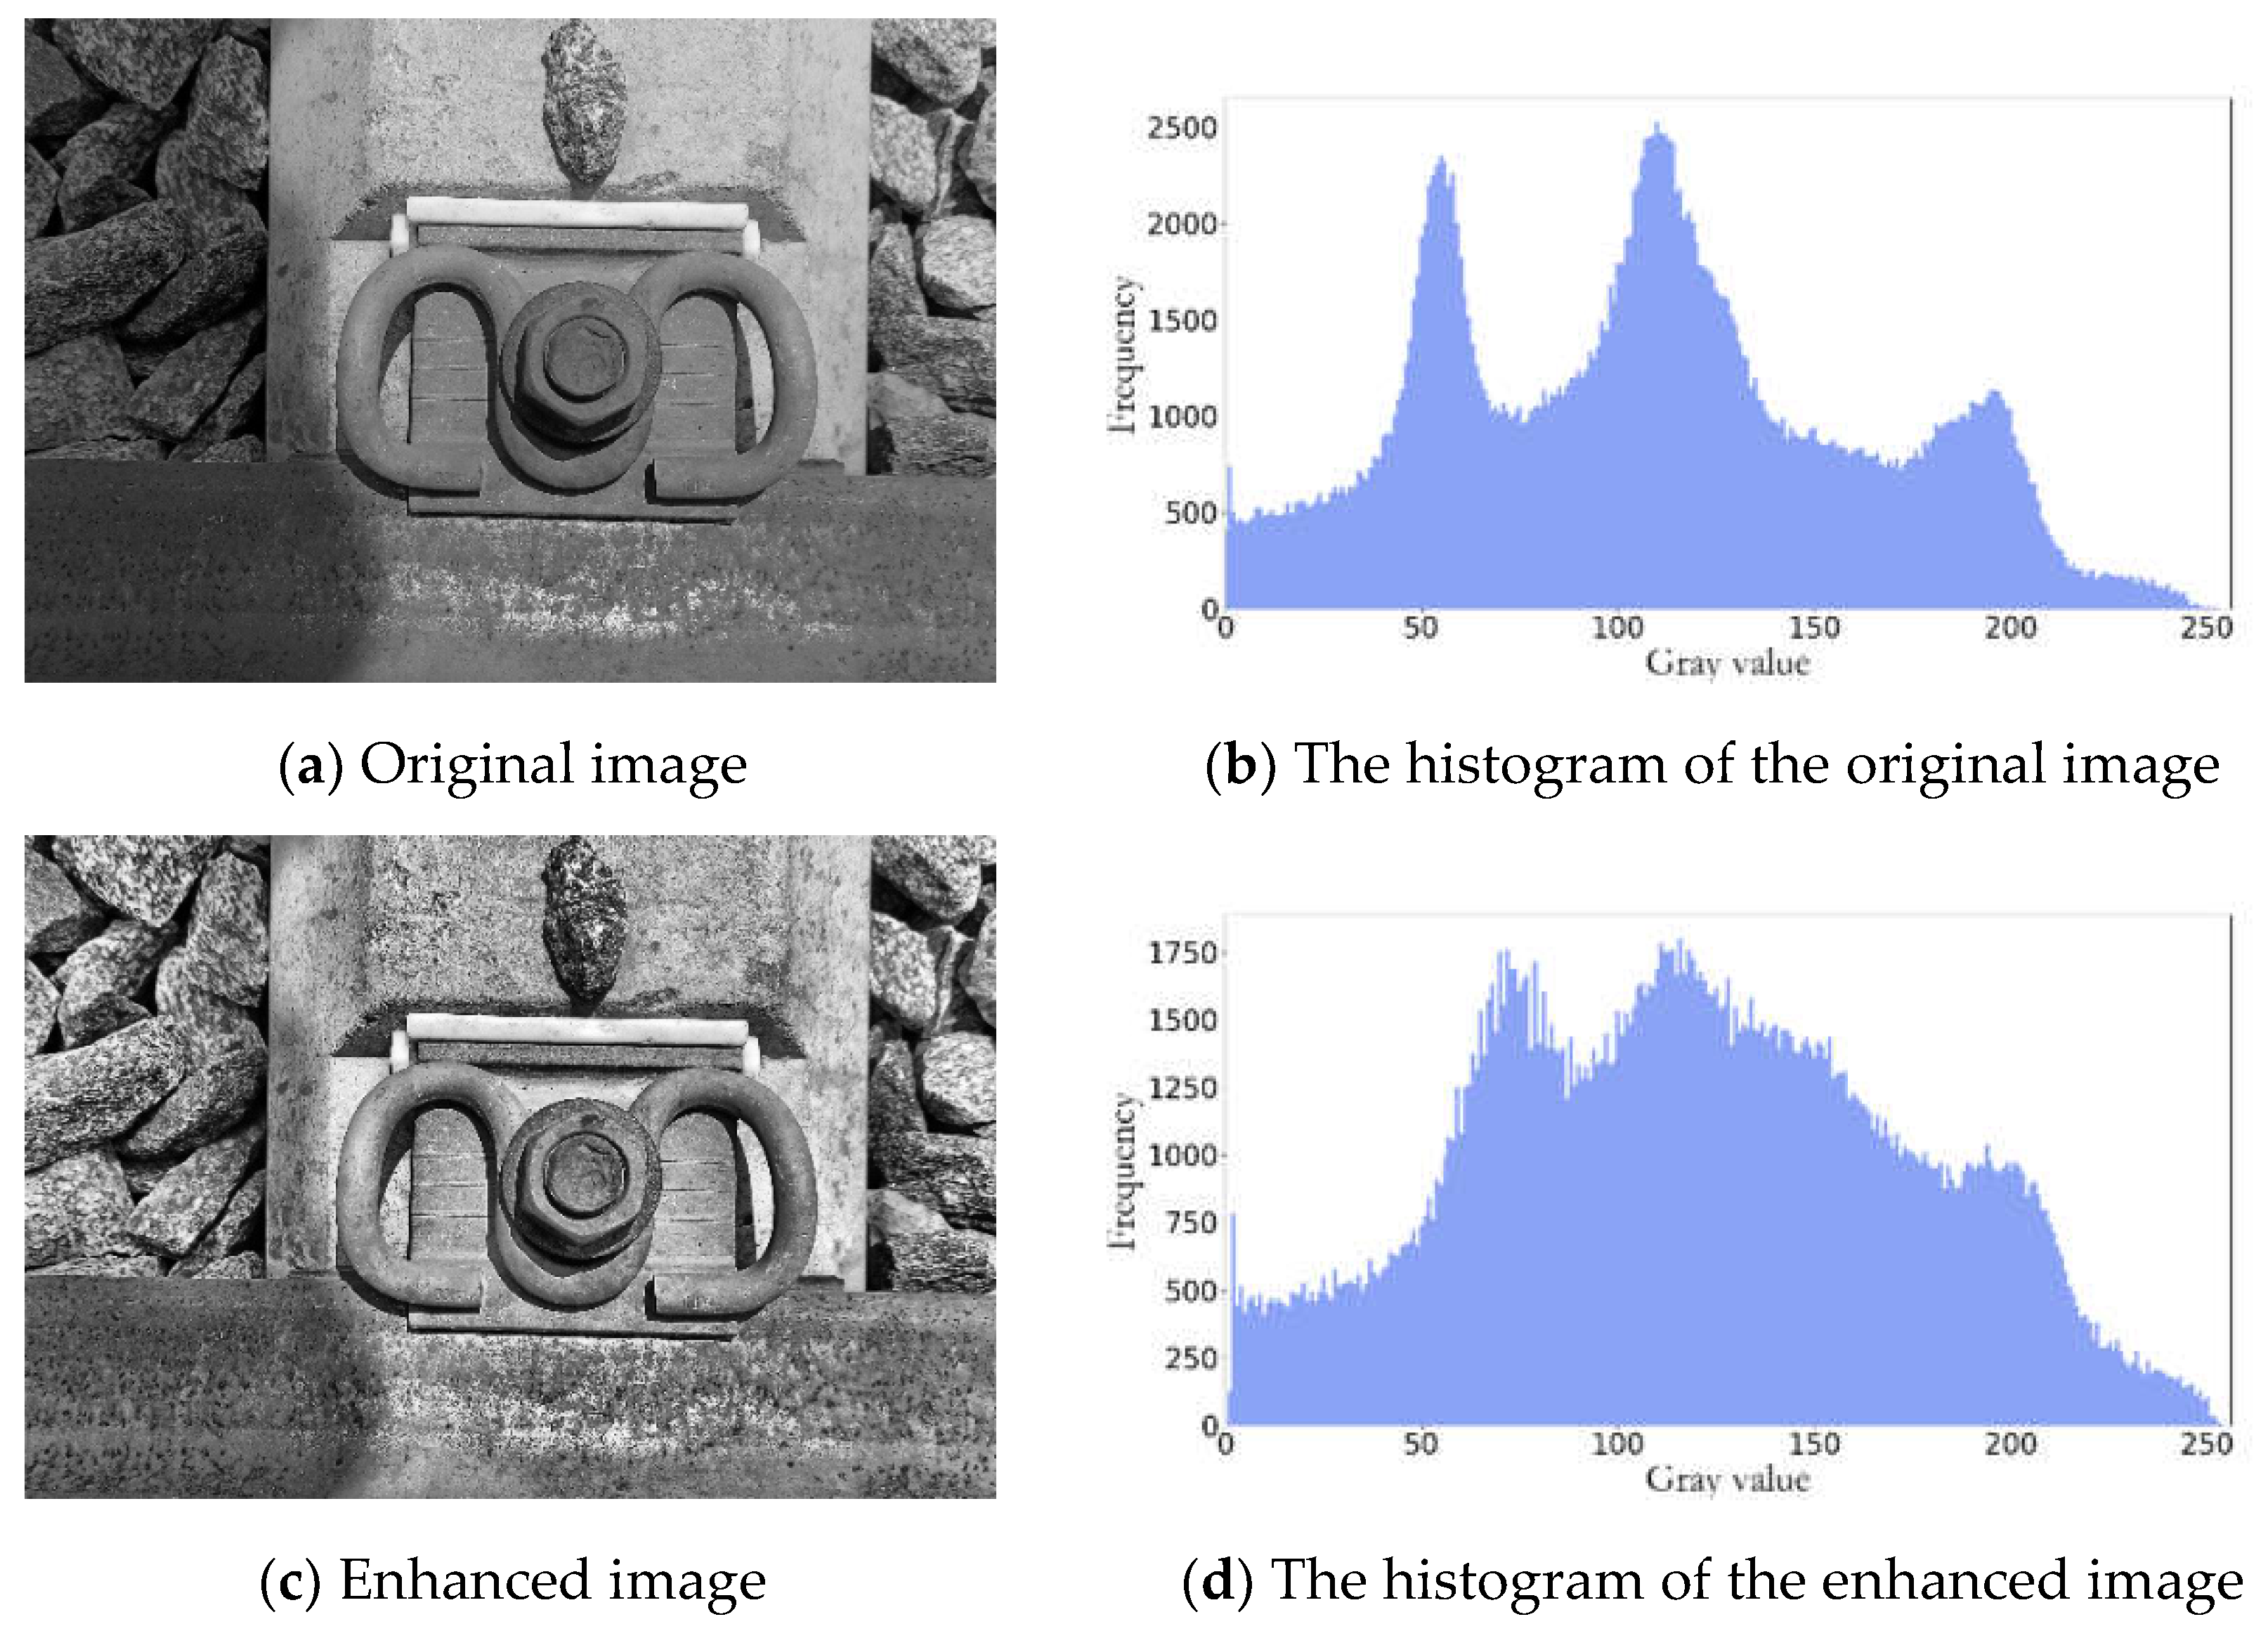
Figure 4.
Four-direction gradient template.
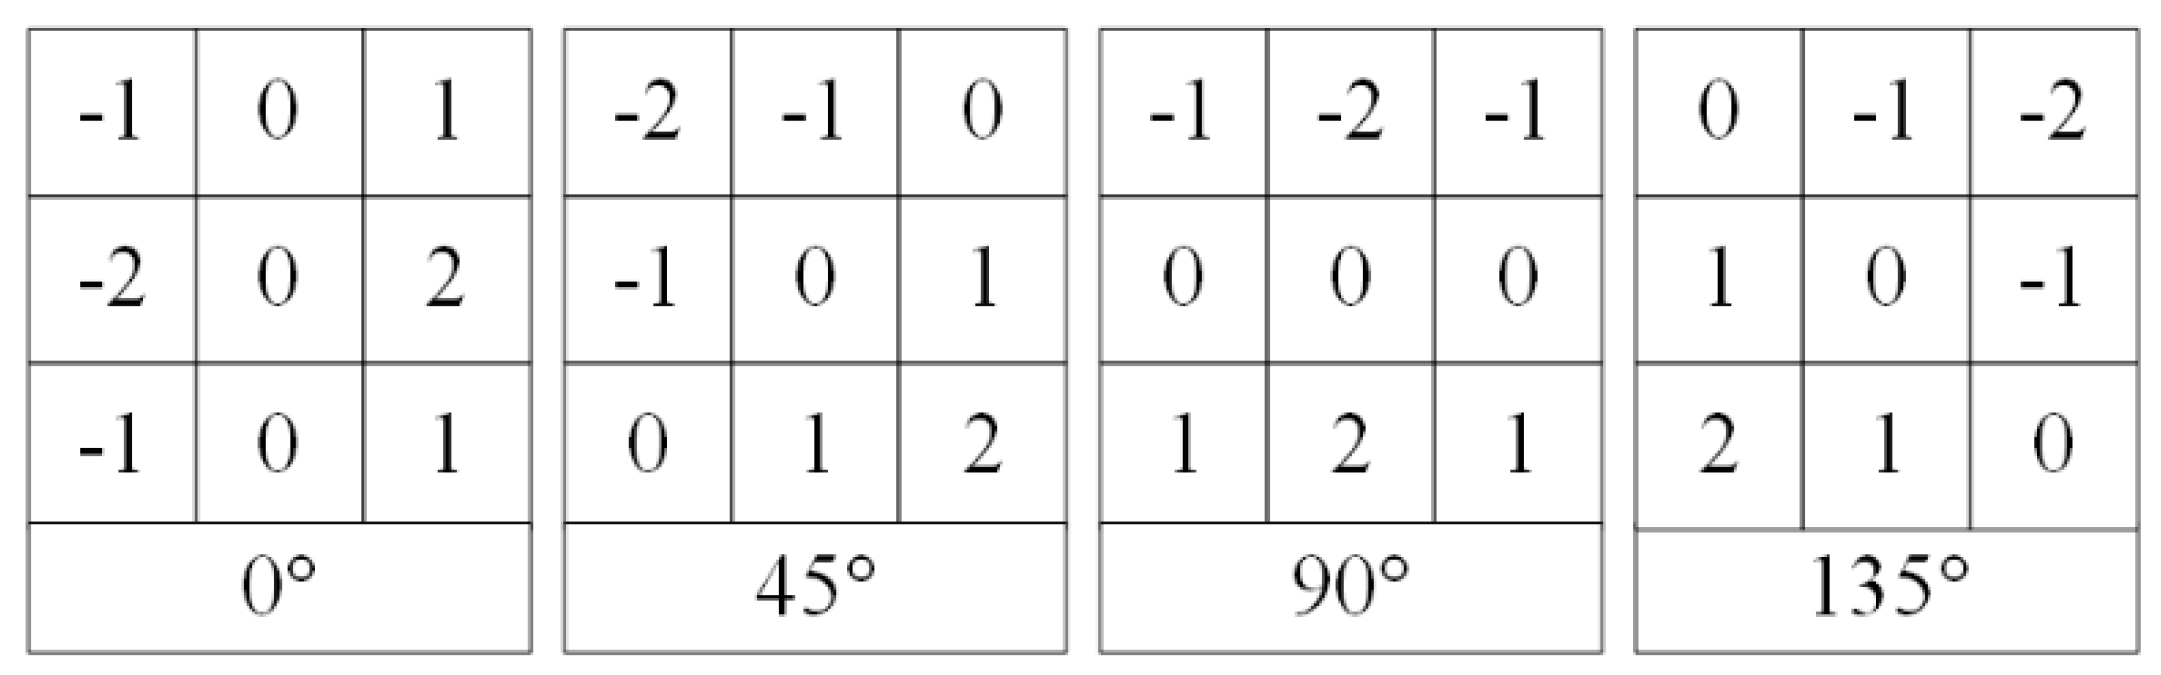
Figure 5.
Fitting results of two methods for circles.
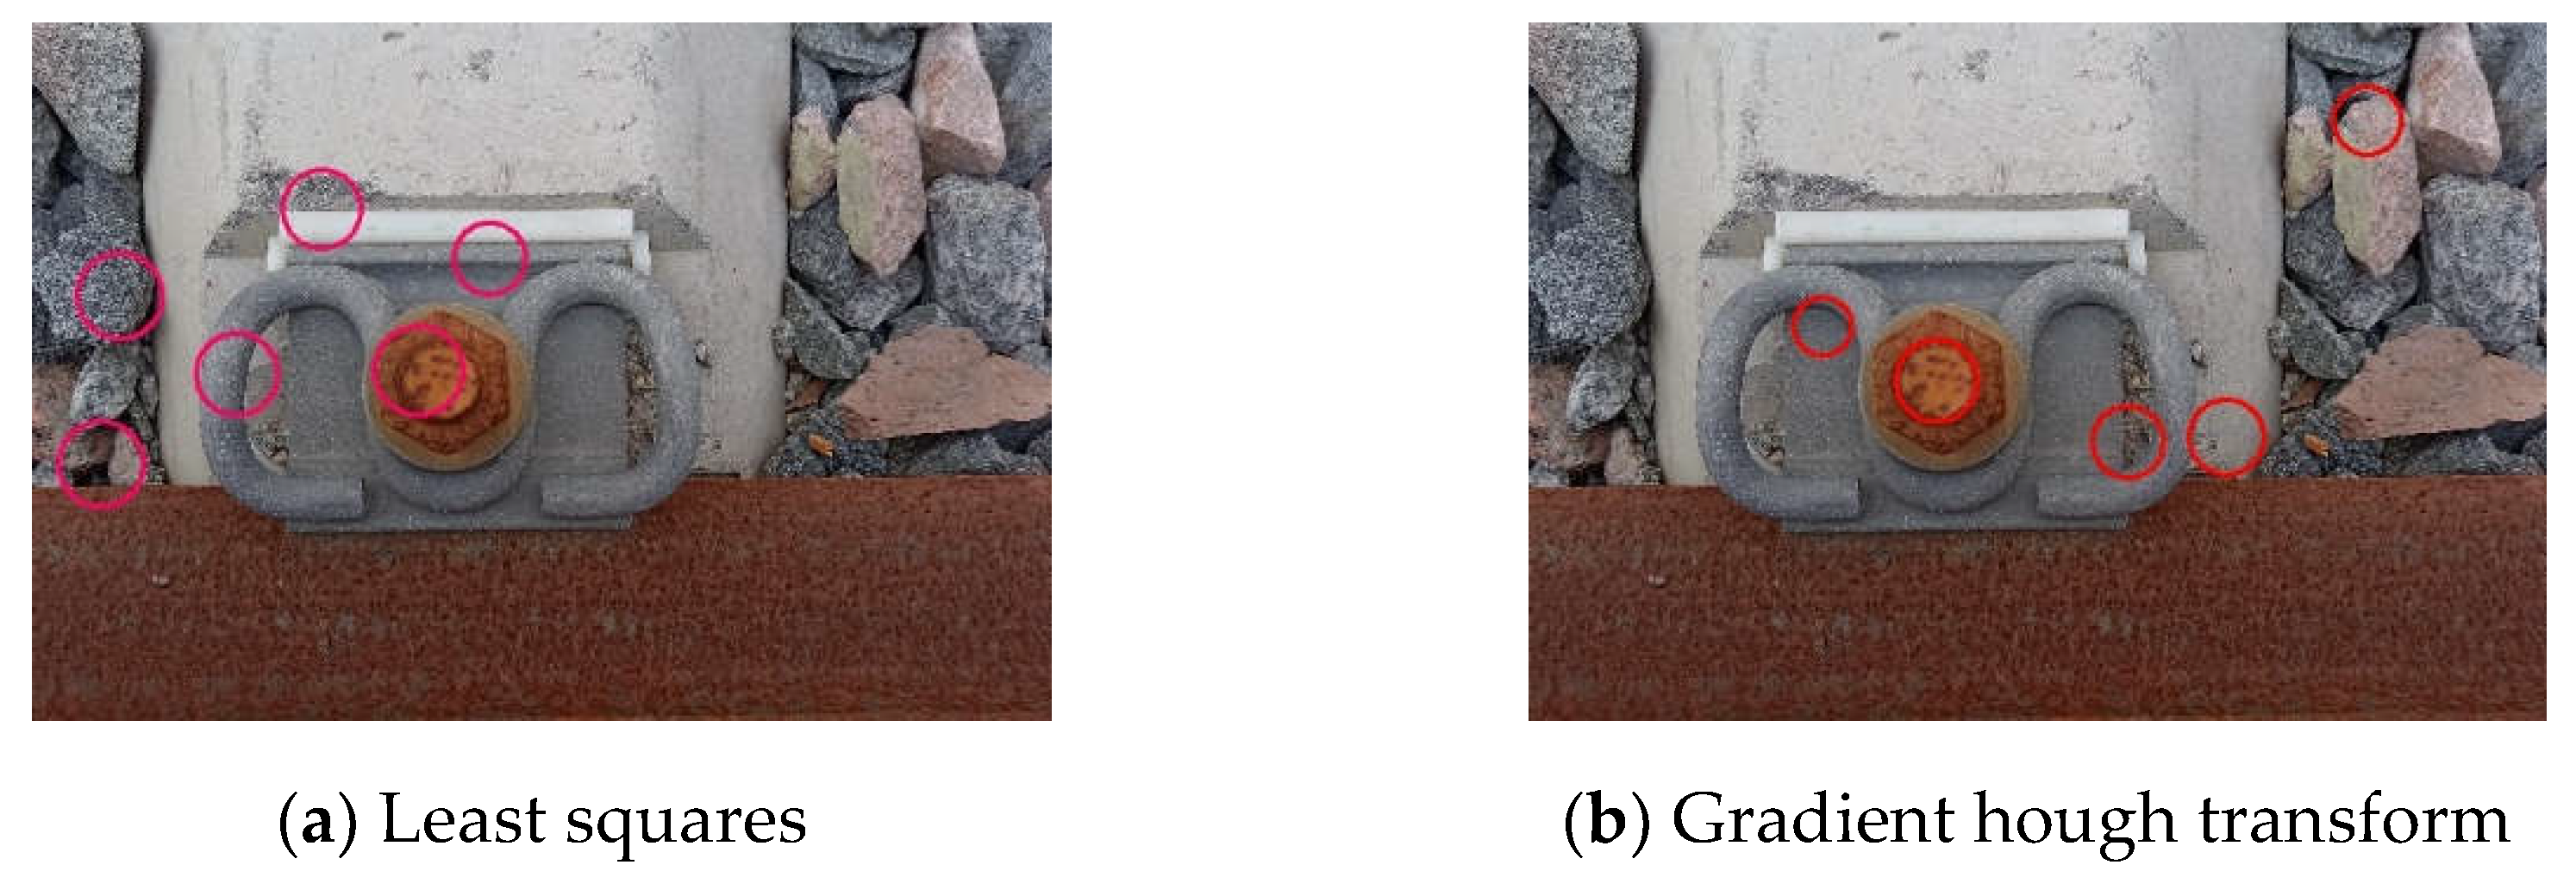
Figure 6.
Filtering algorithm flow.
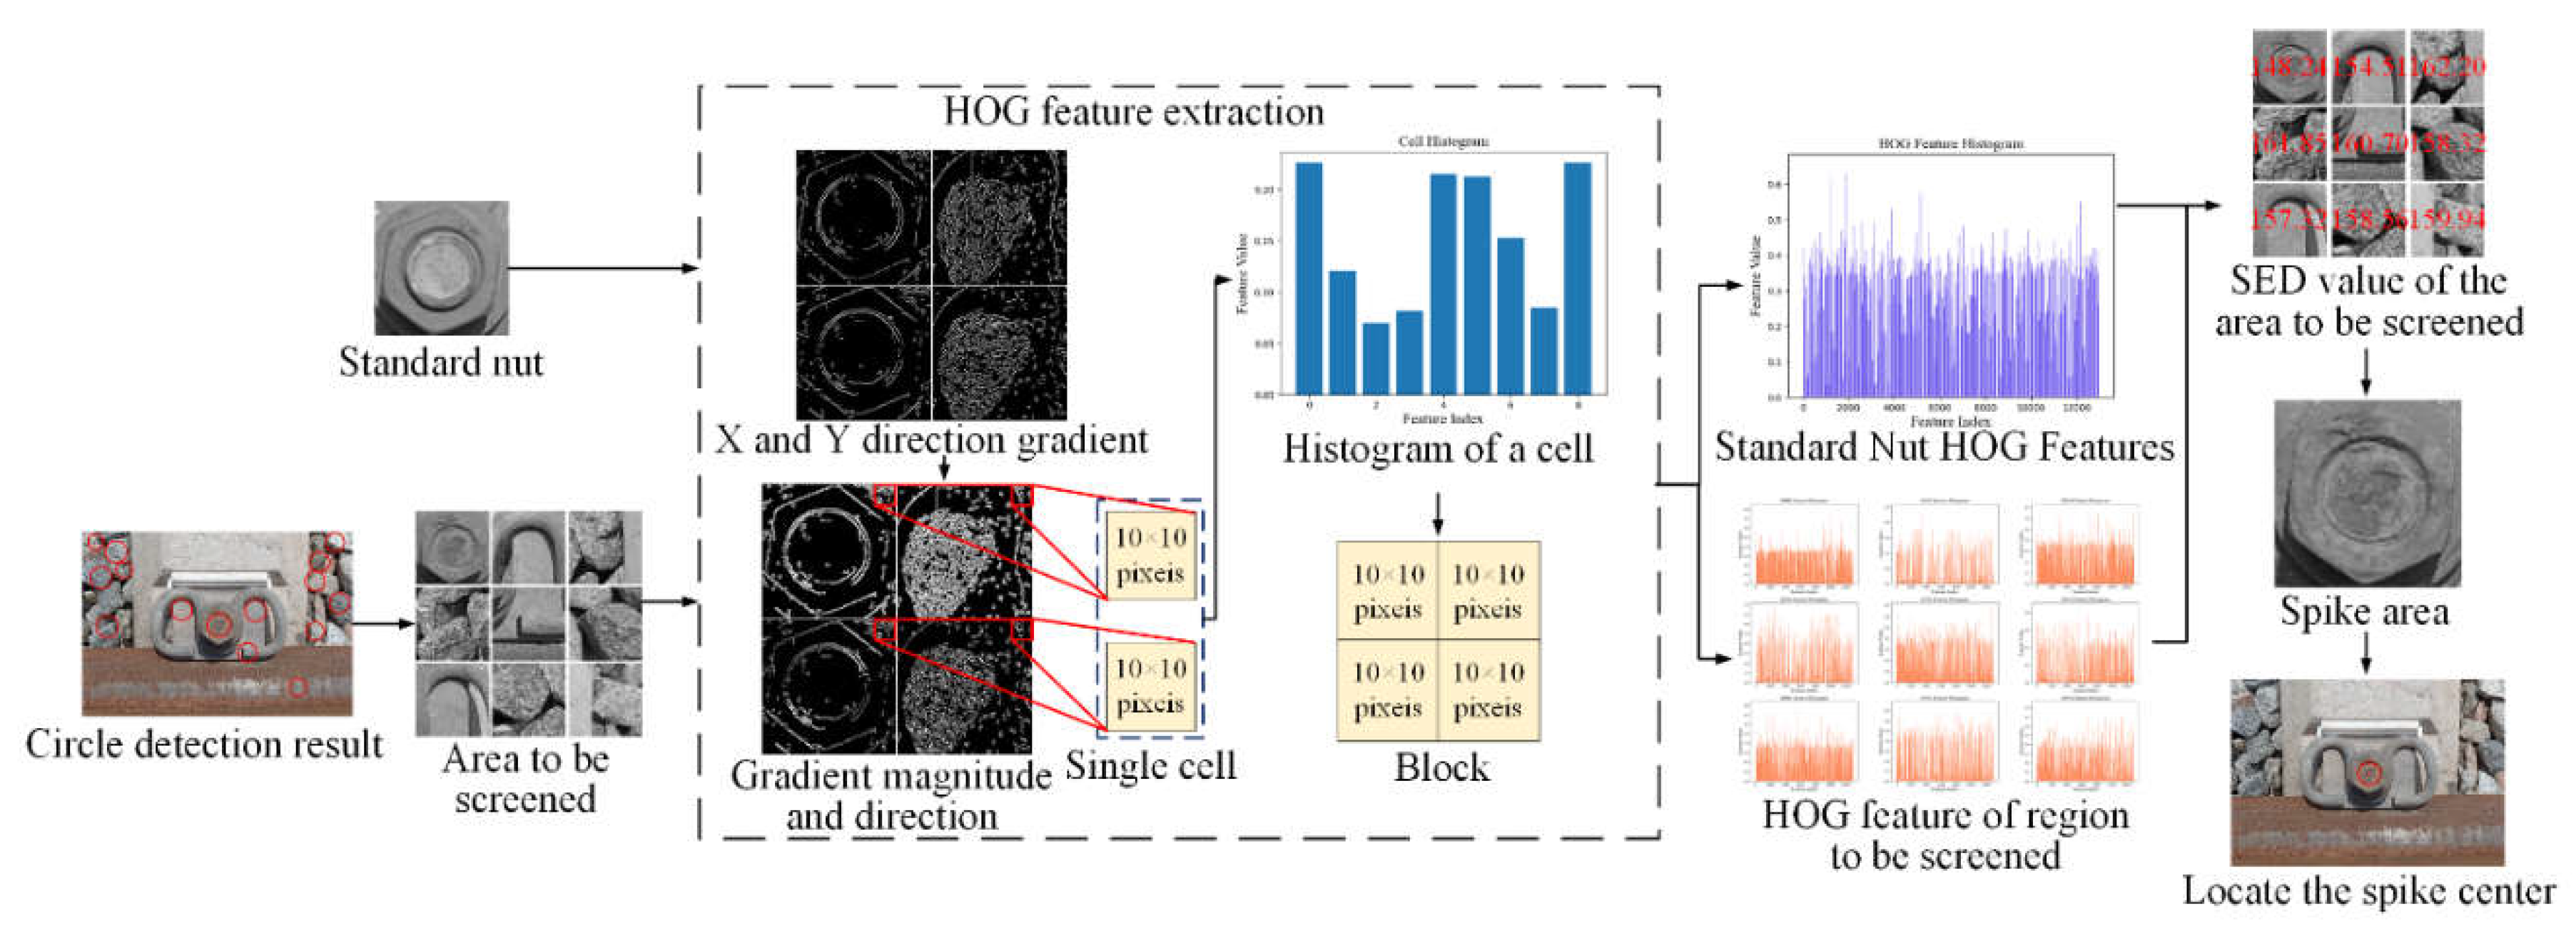
Figure 7.
Experimental sample classification.
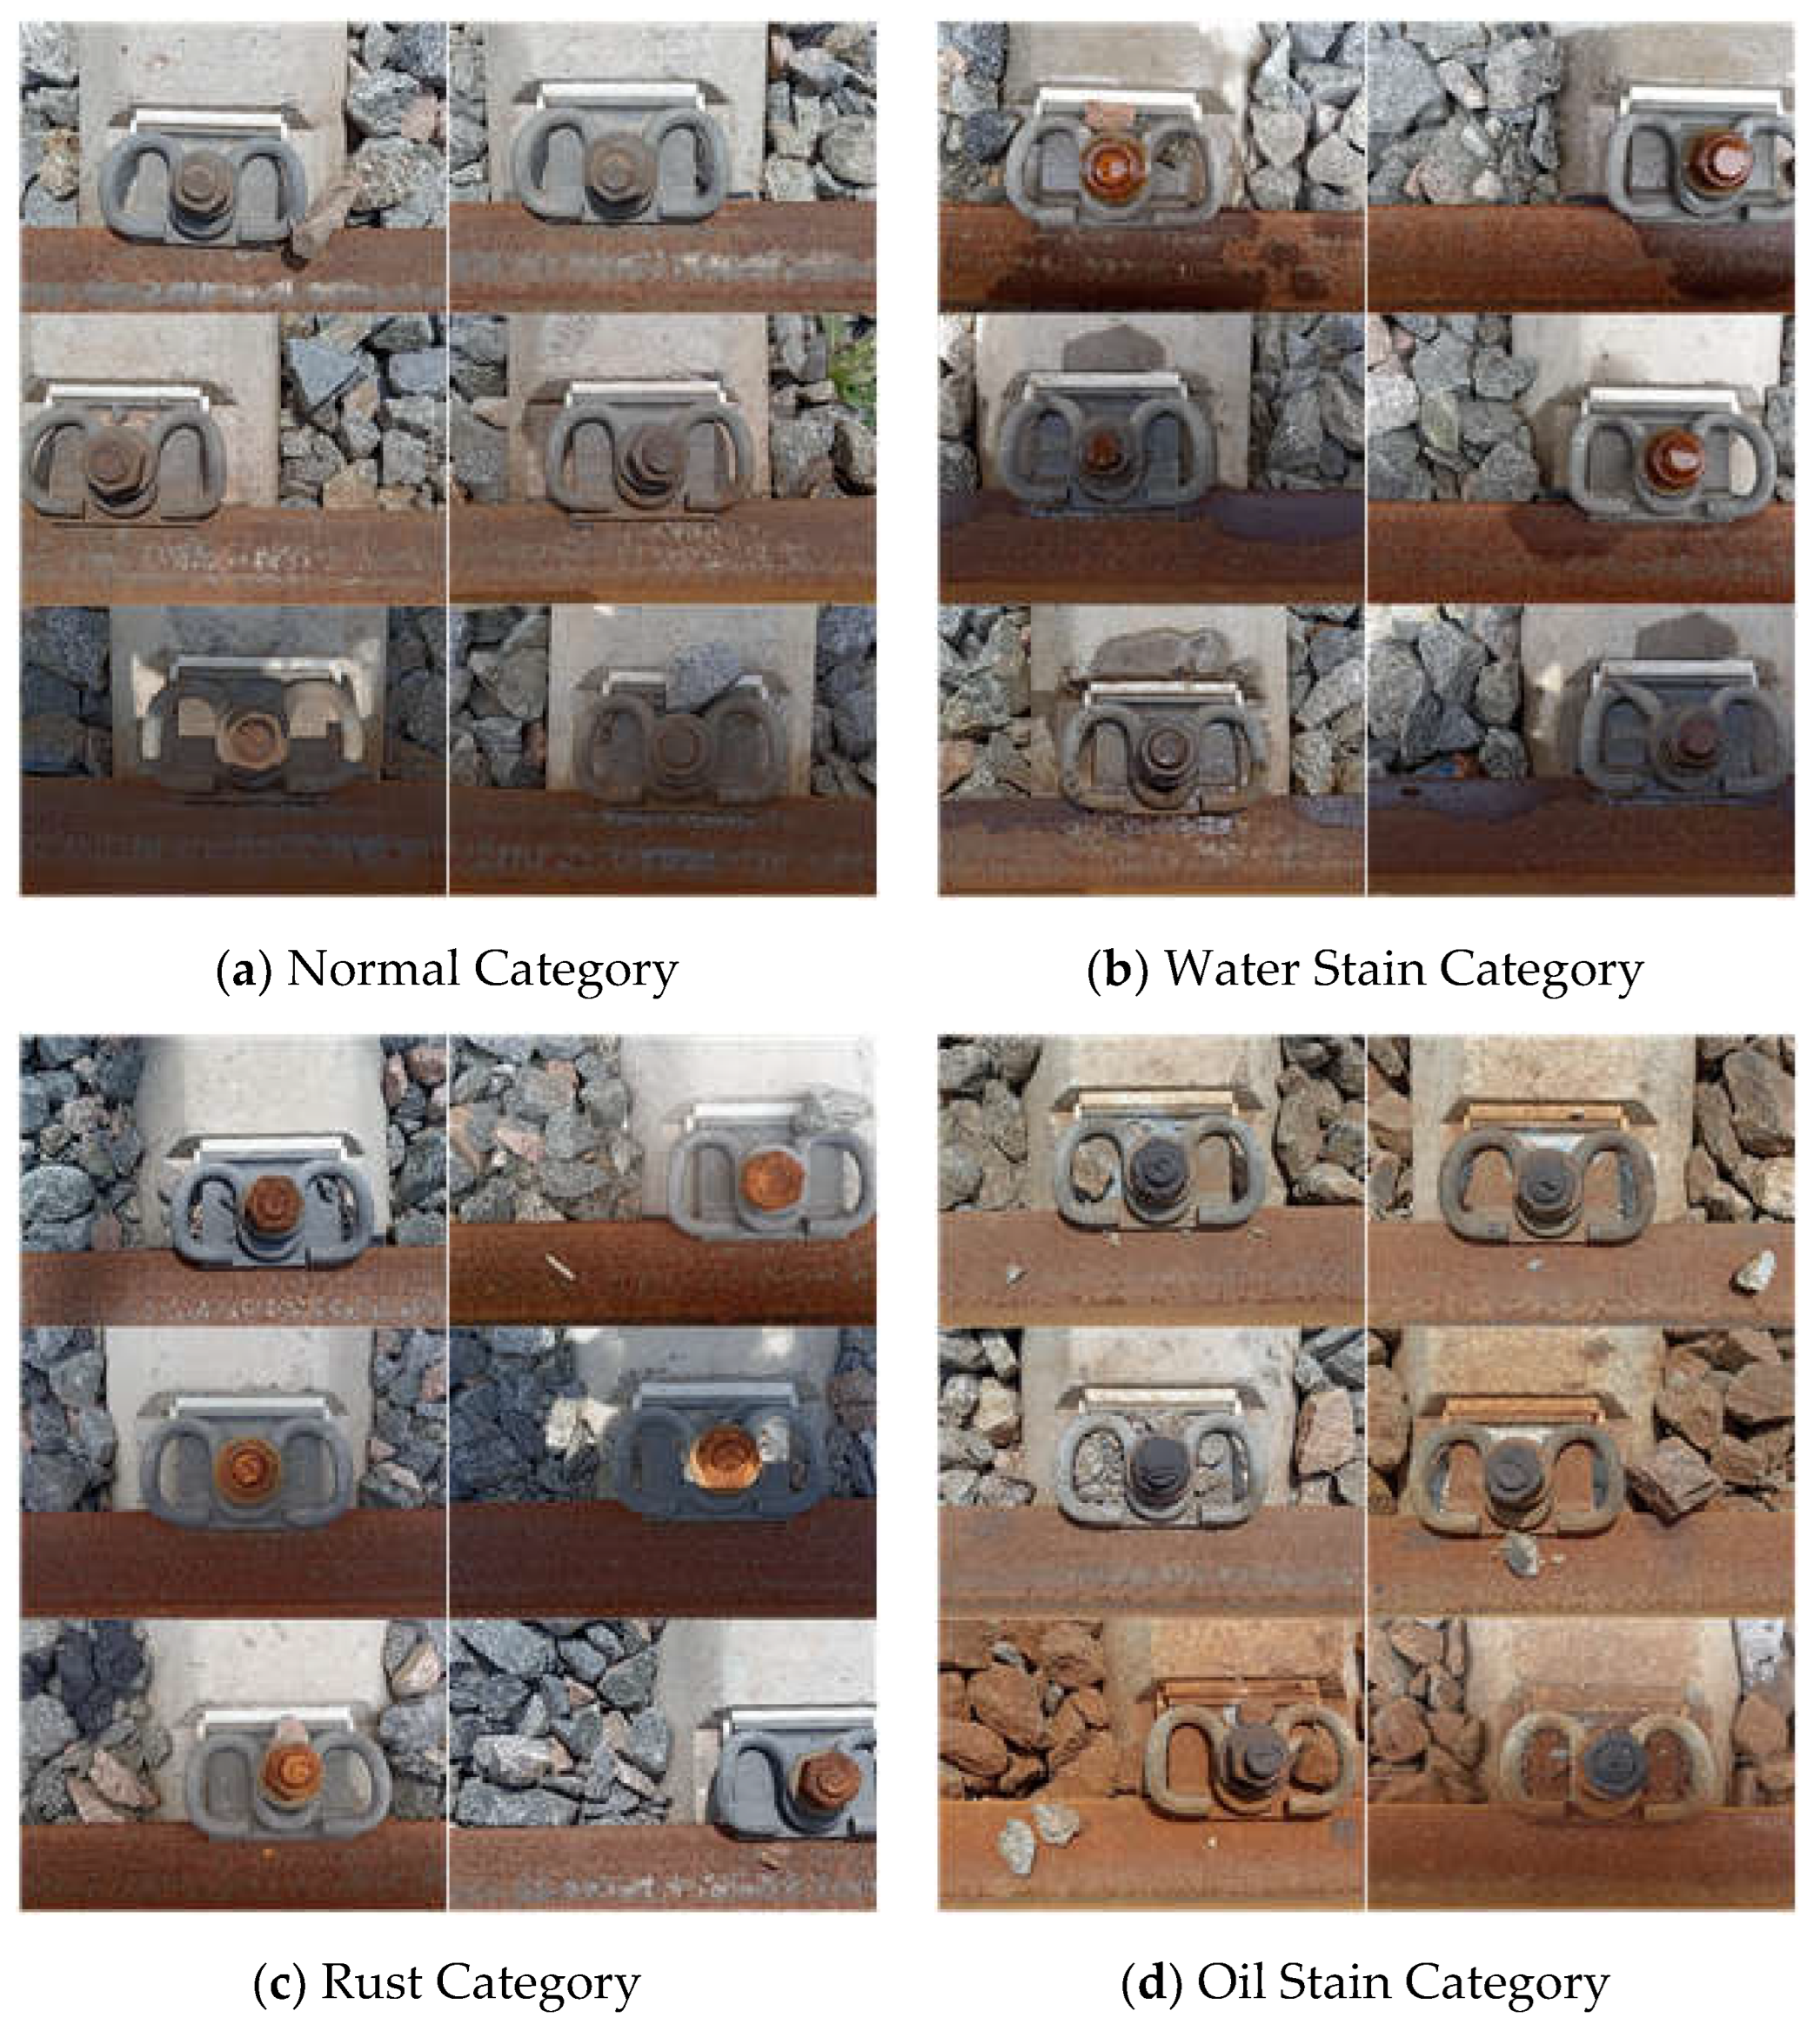
Figure 8.
Image filtering effect.
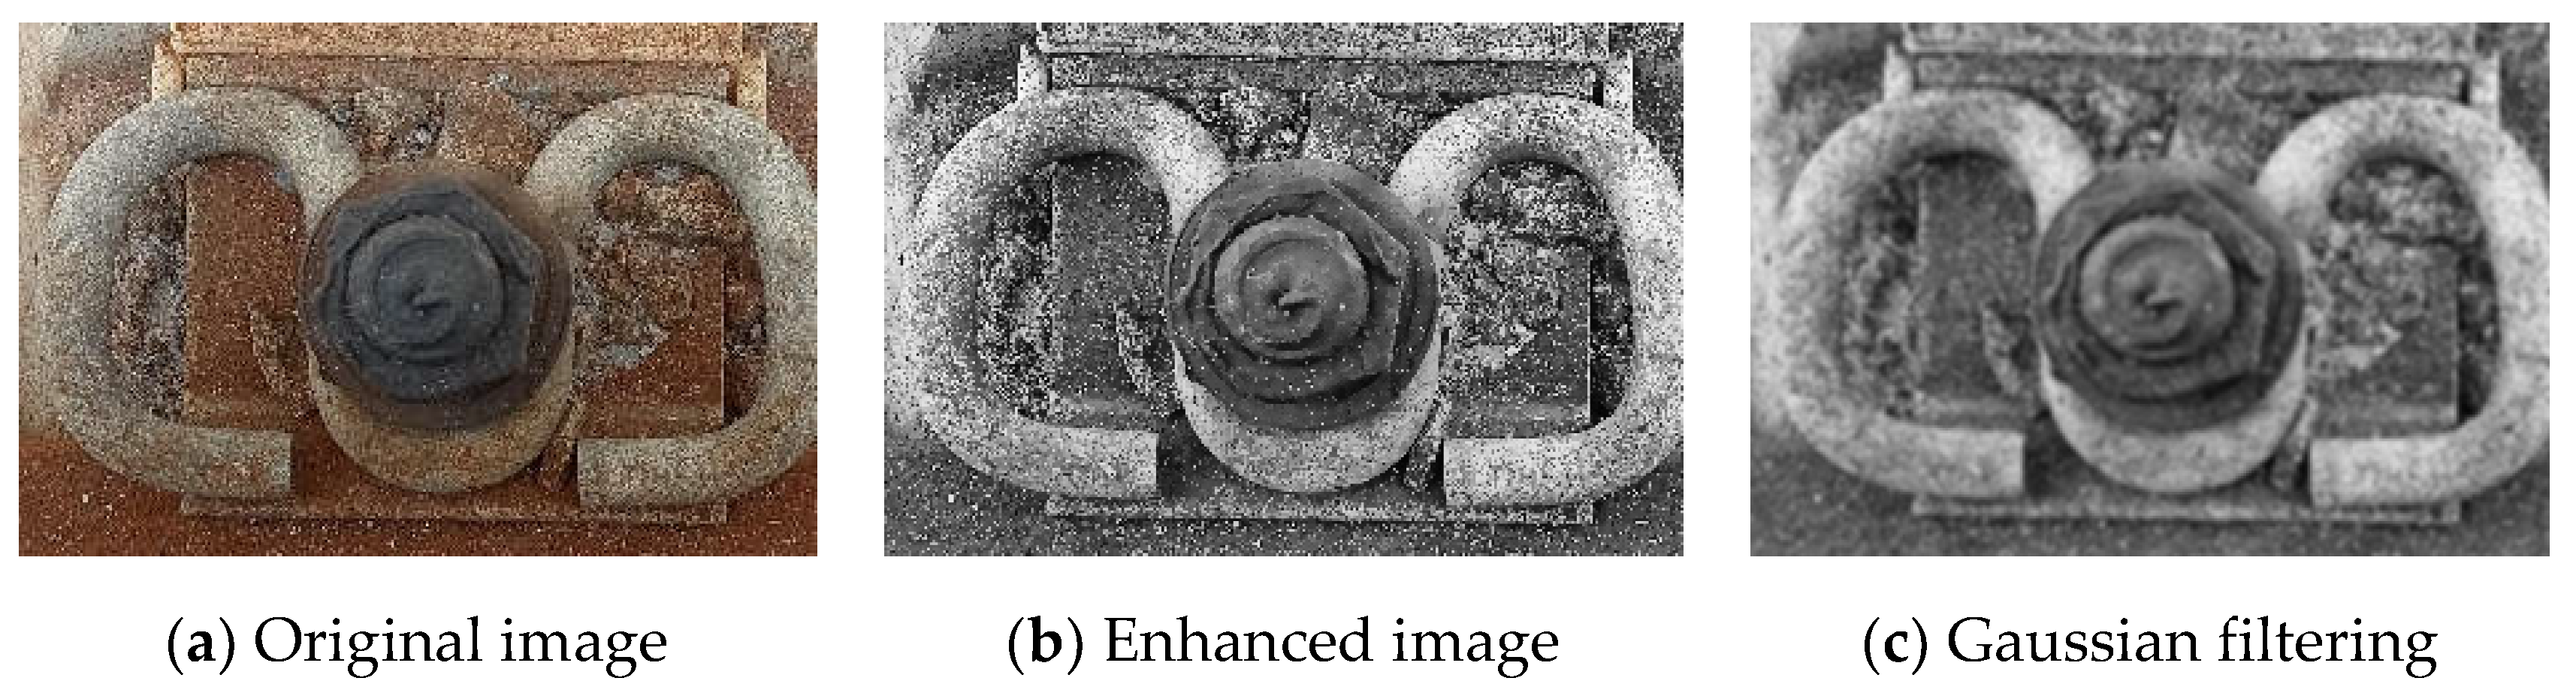
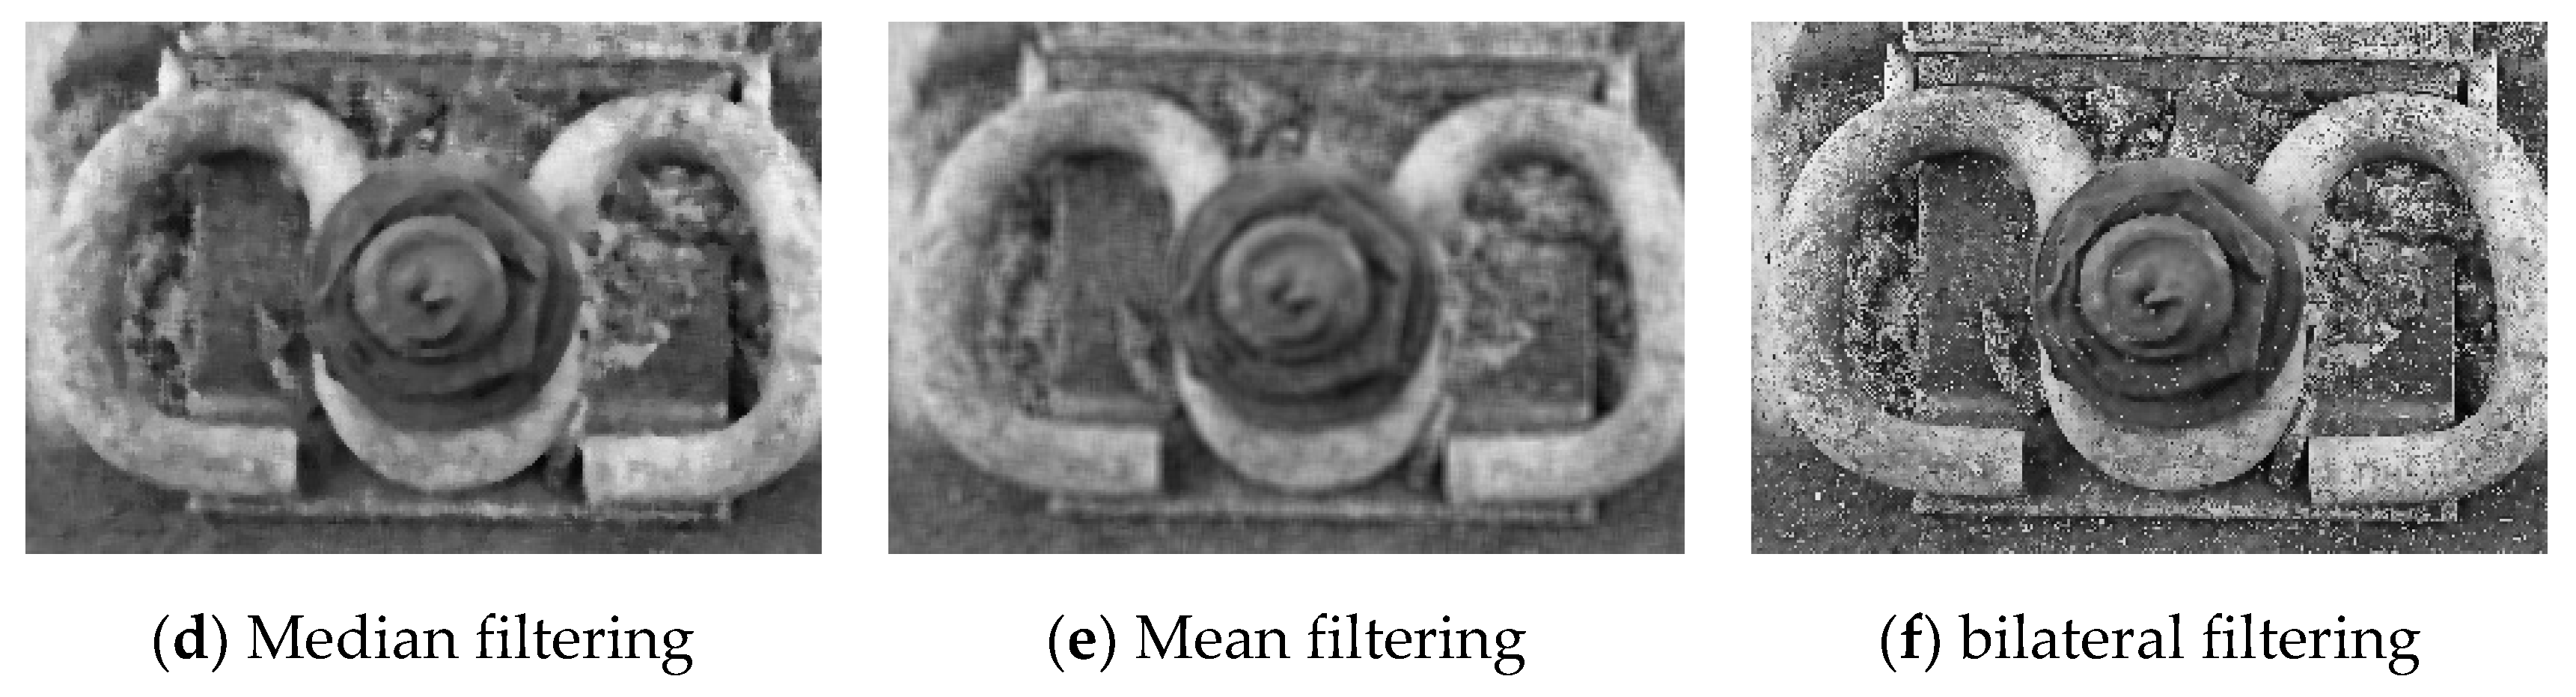
Figure 9.
Comparison of fastener edge inspection results.
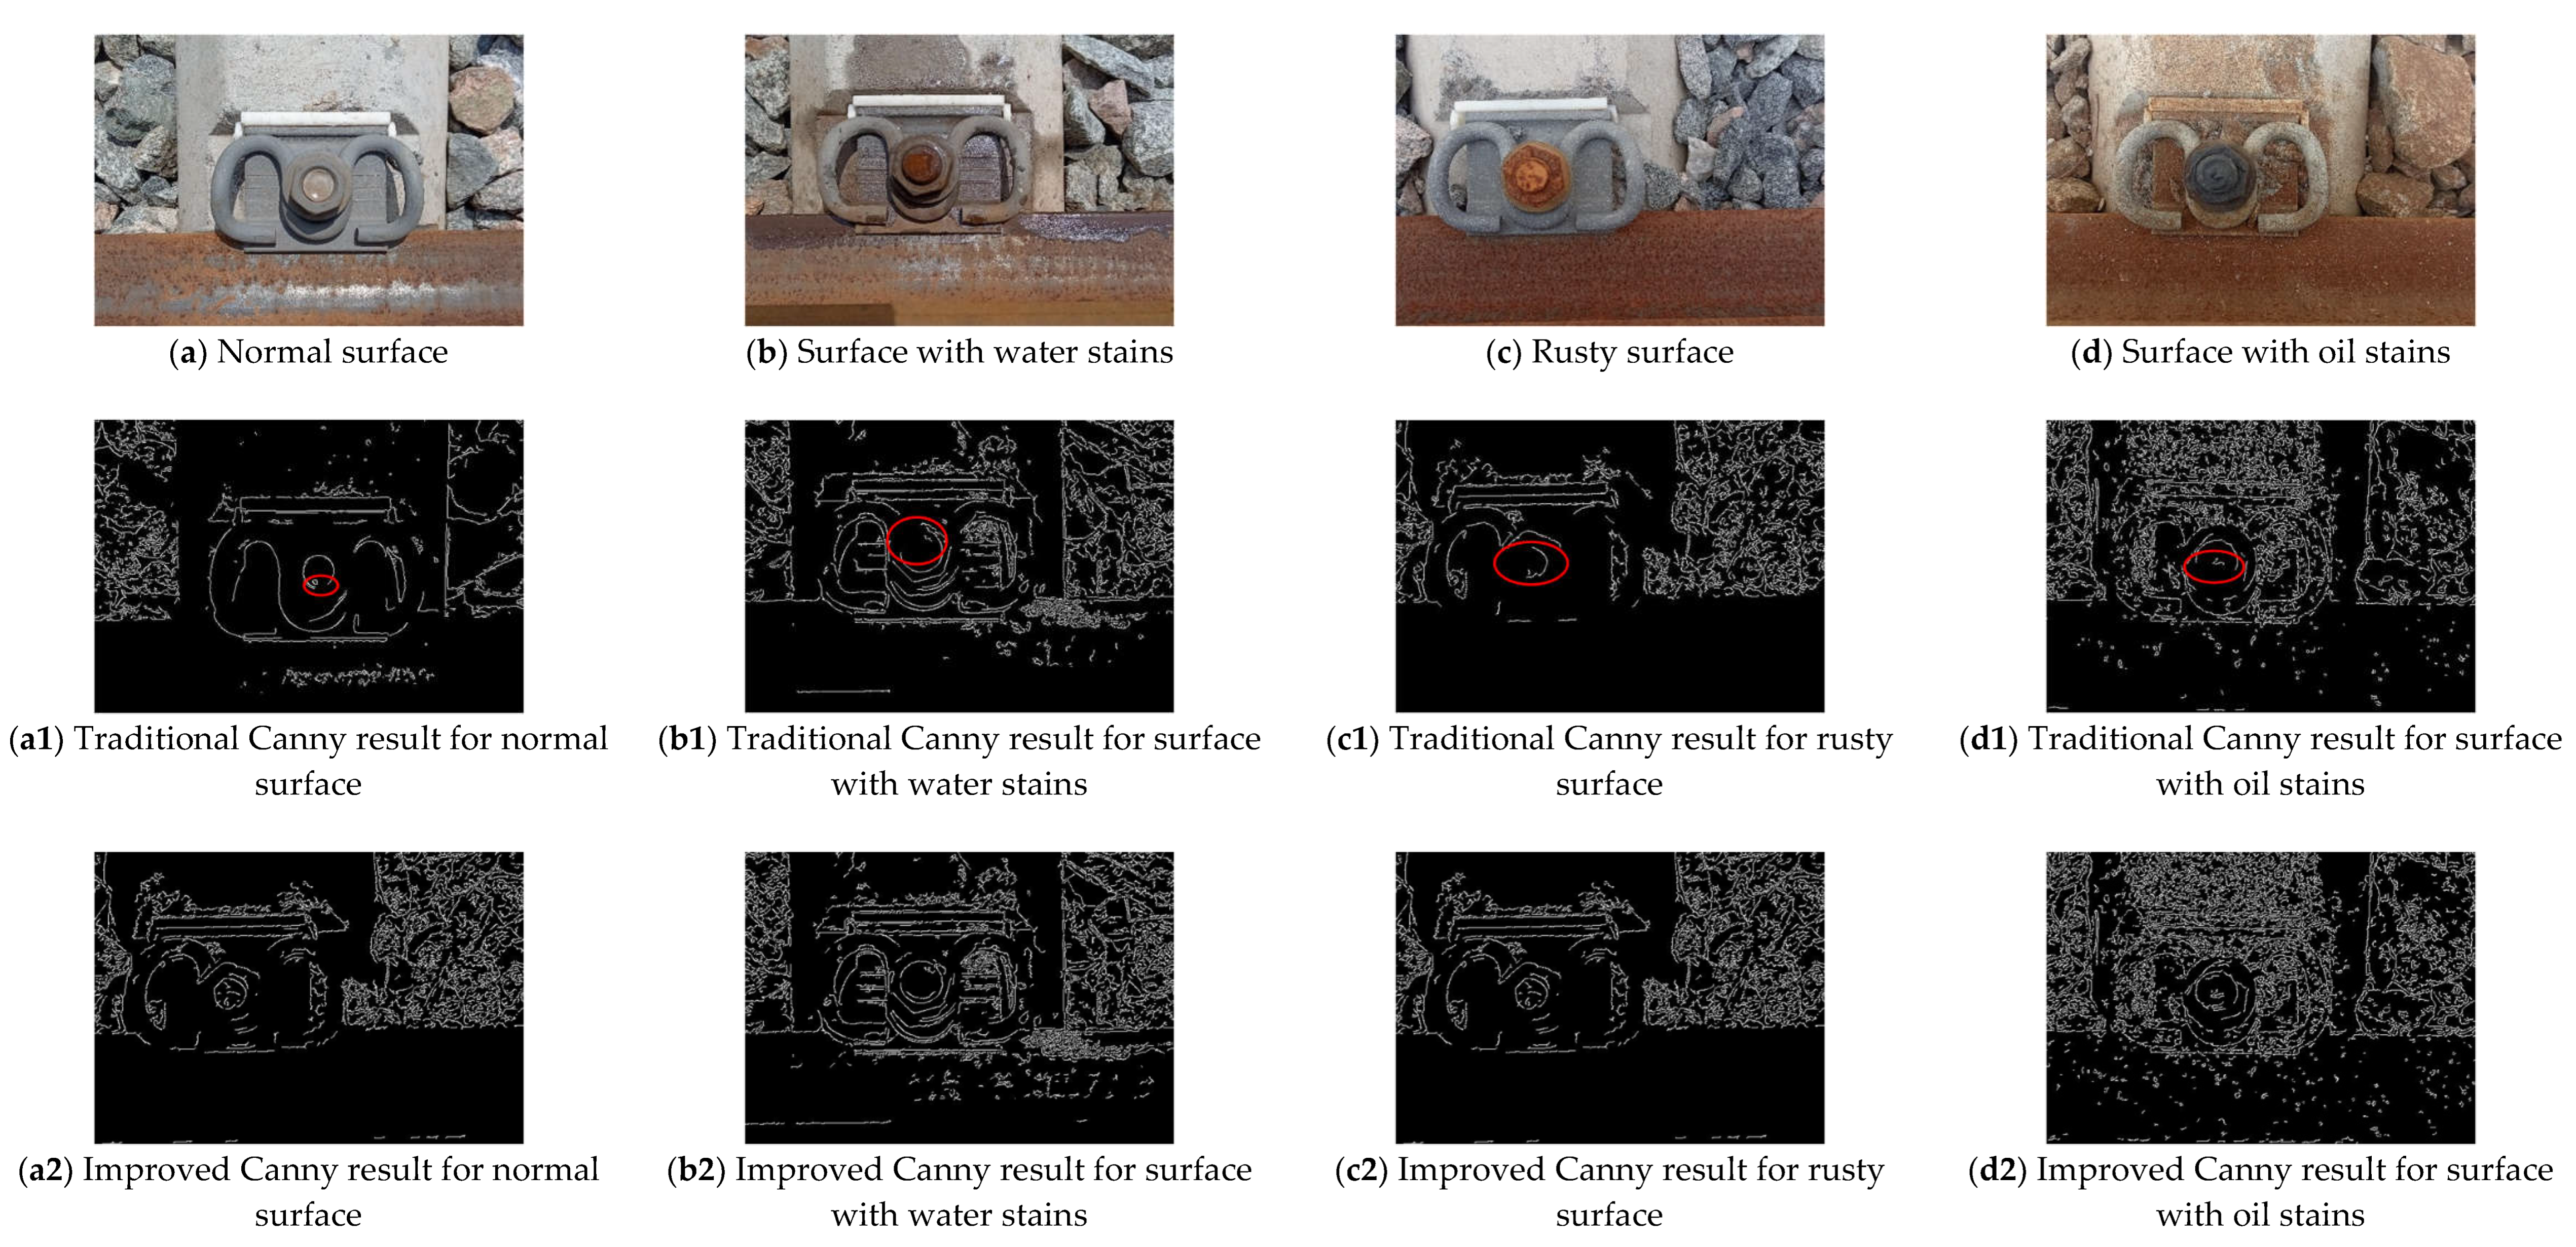
Figure 10.
Circle detection results.
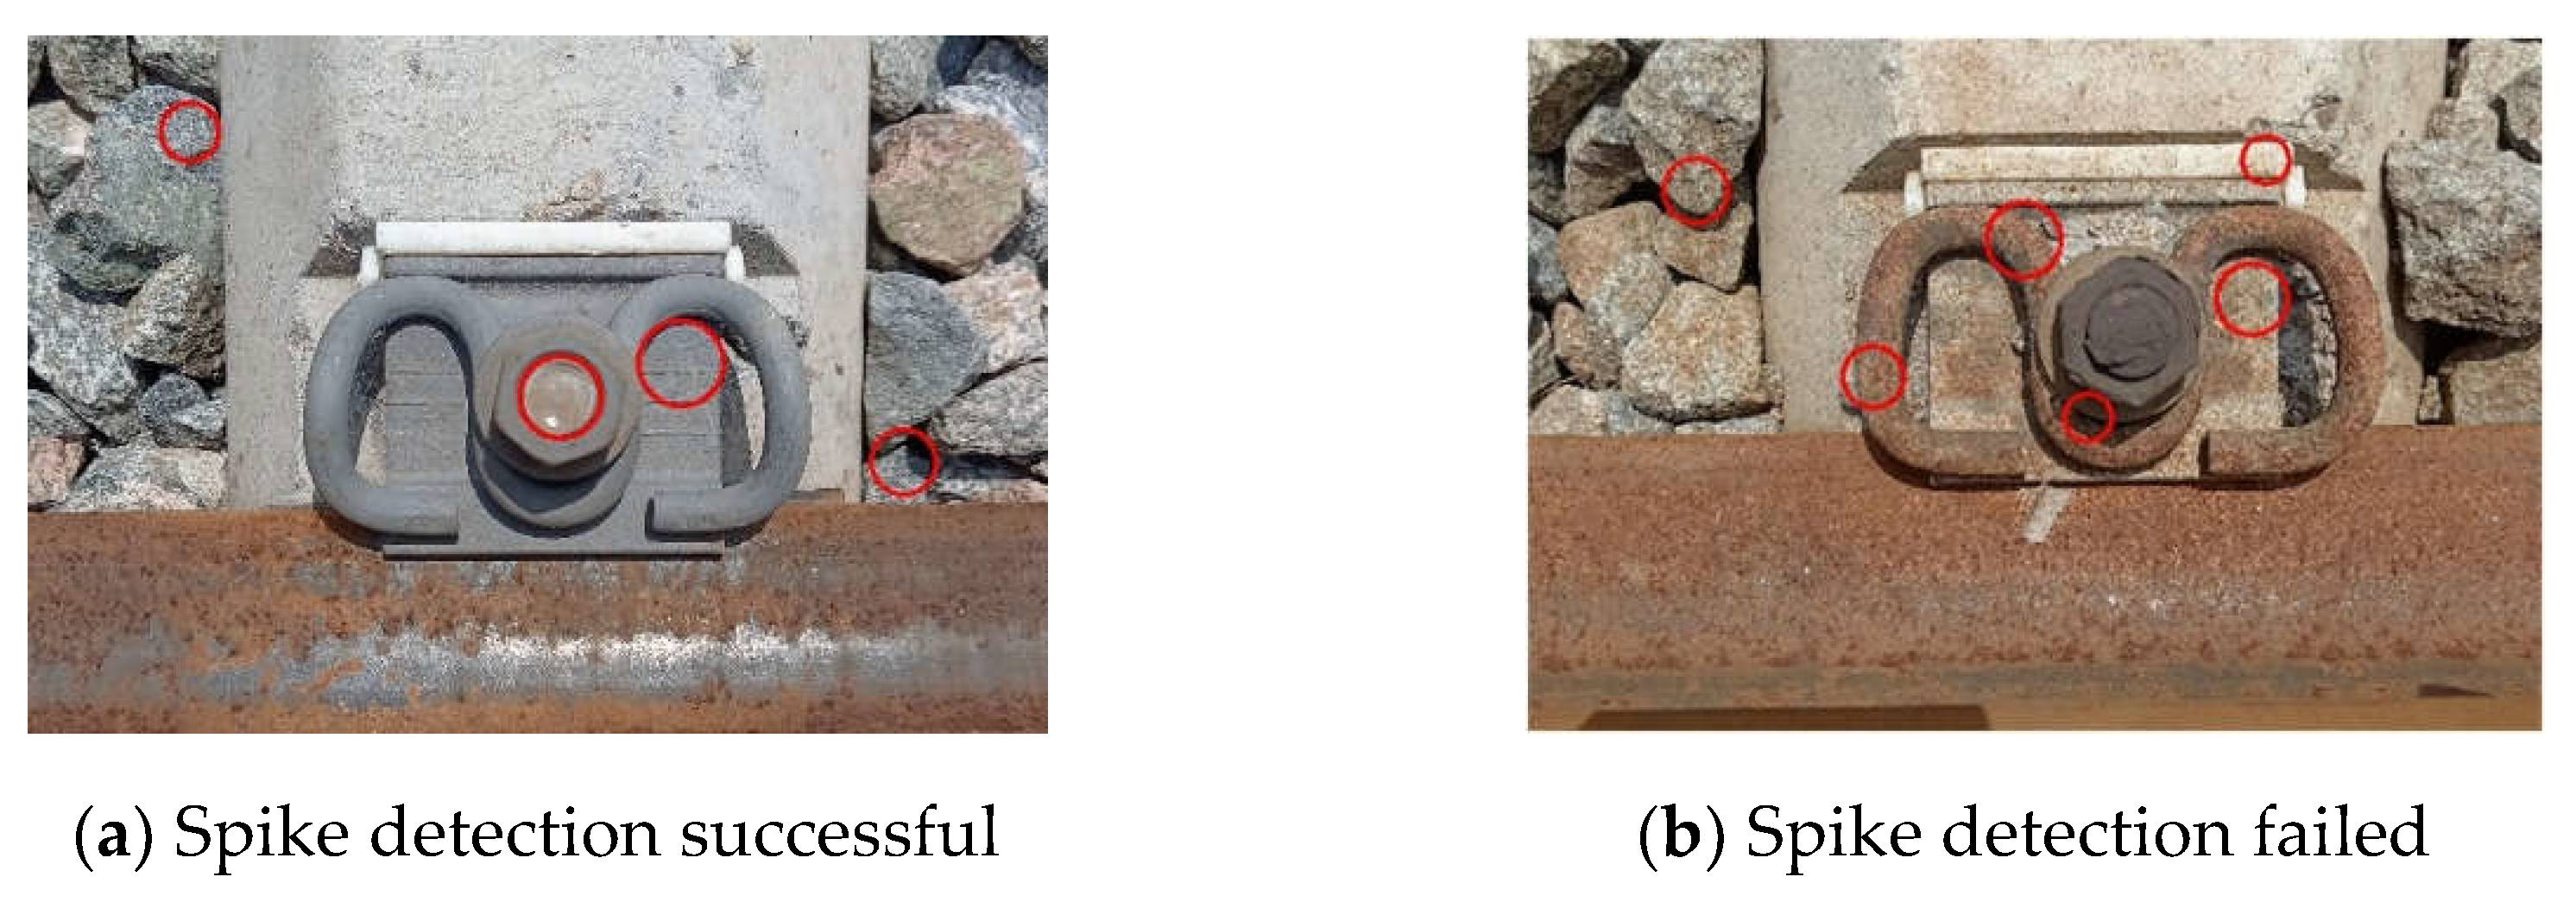
Figure 11.
Spike area screening results.
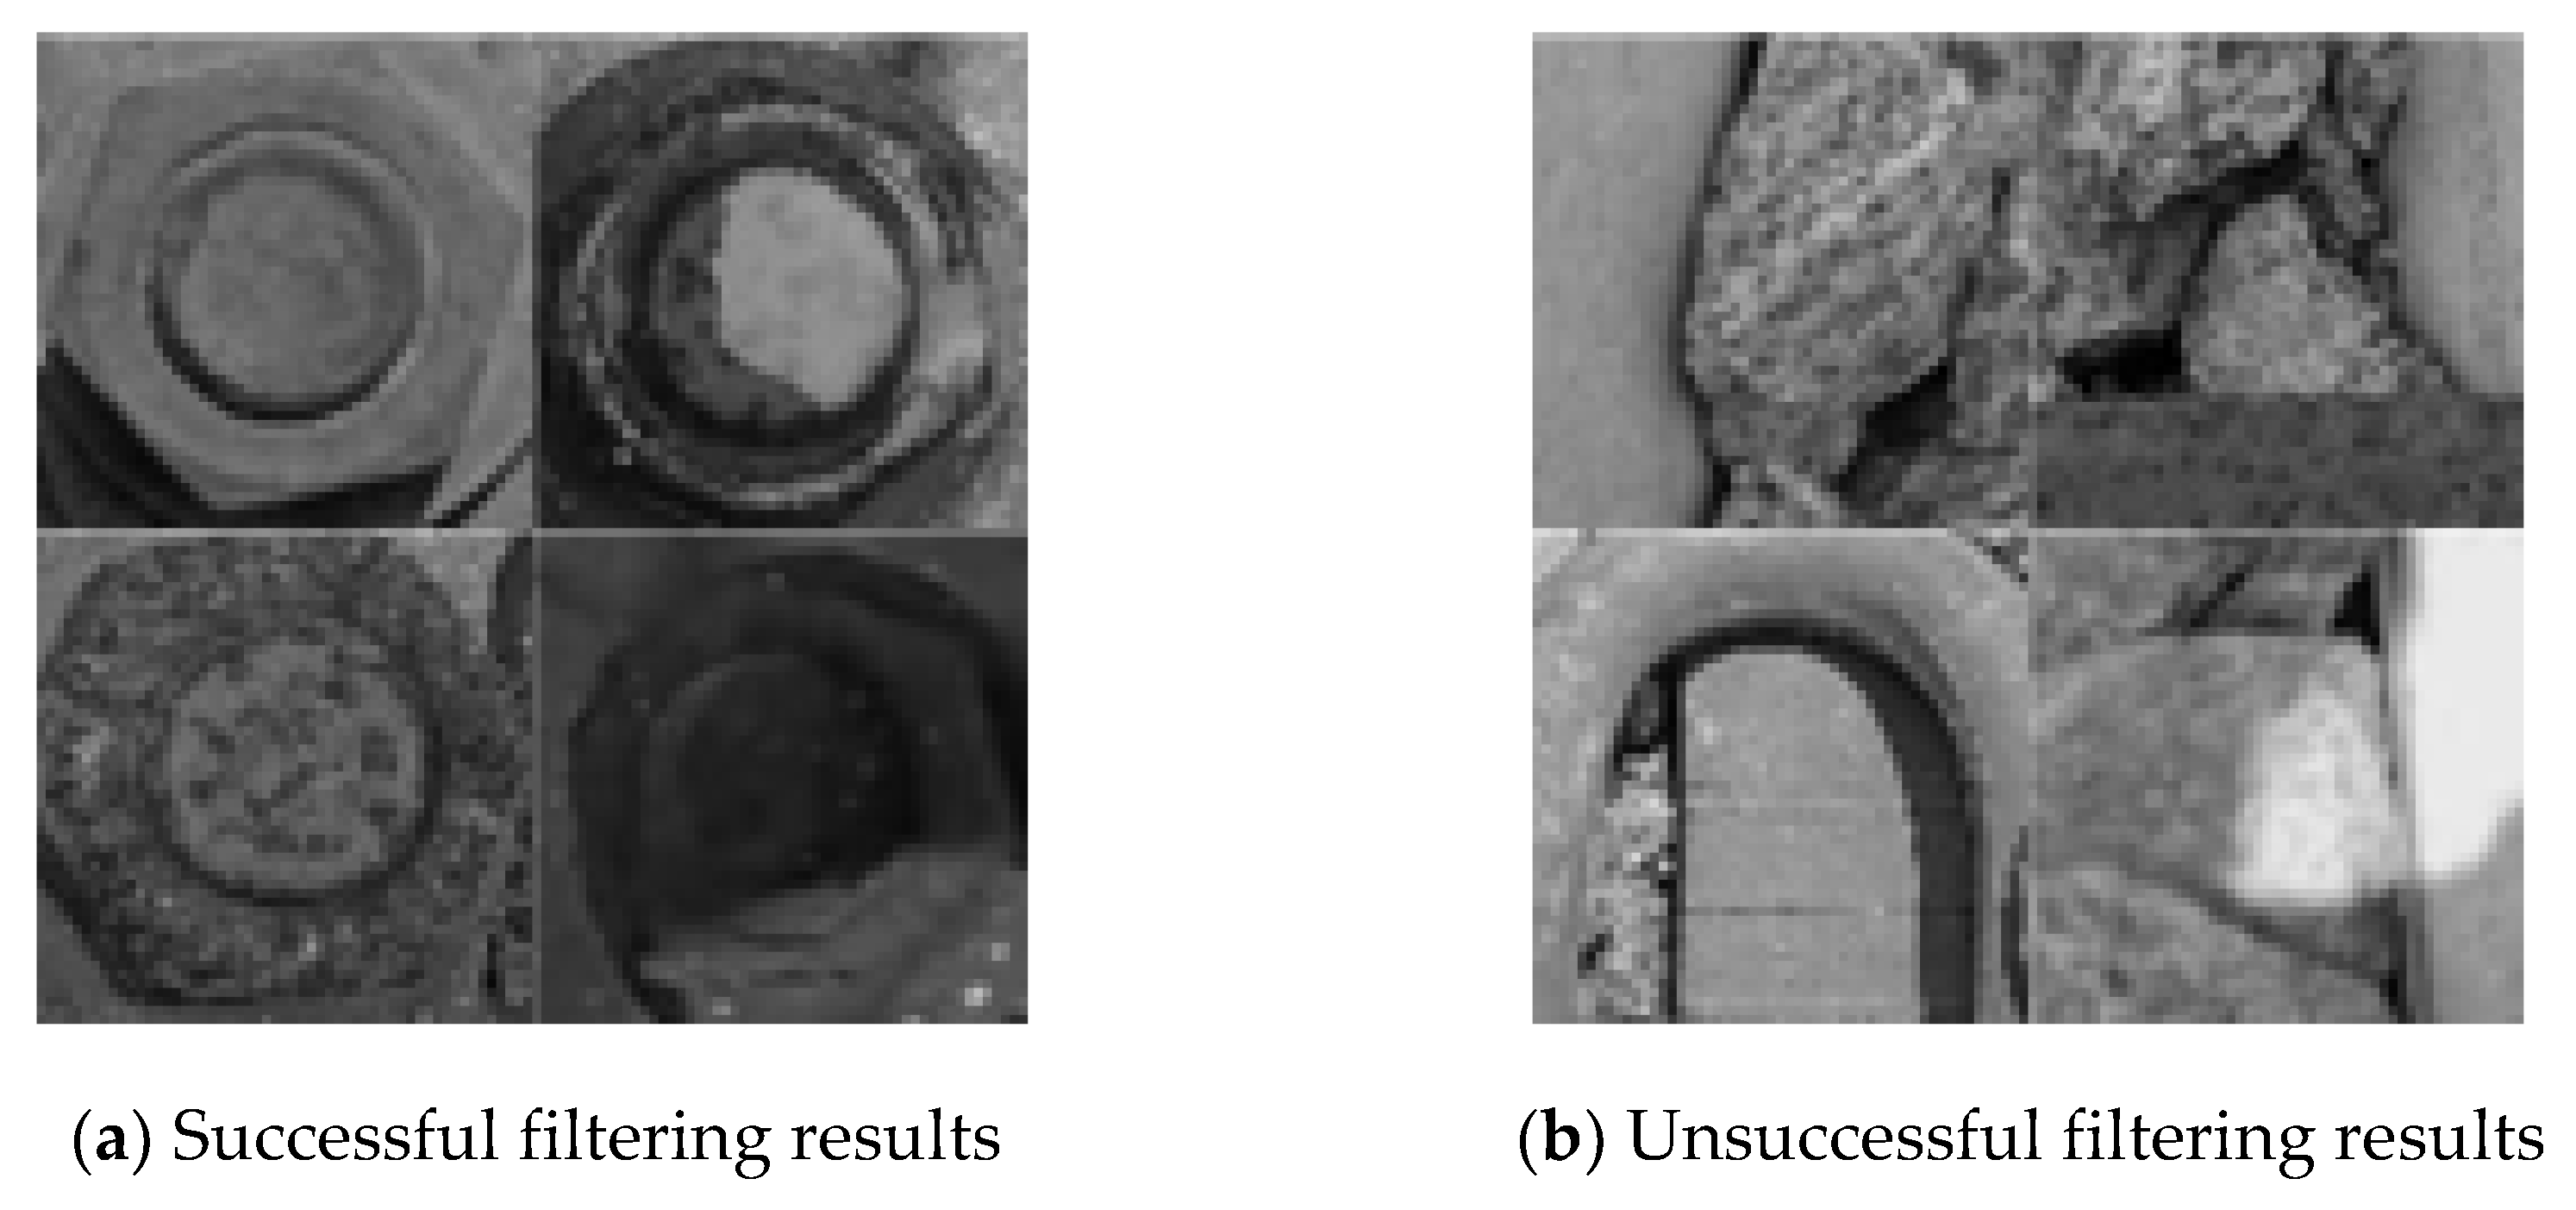
Figure 12.
The success rate of road nail area screening for different algorithms.
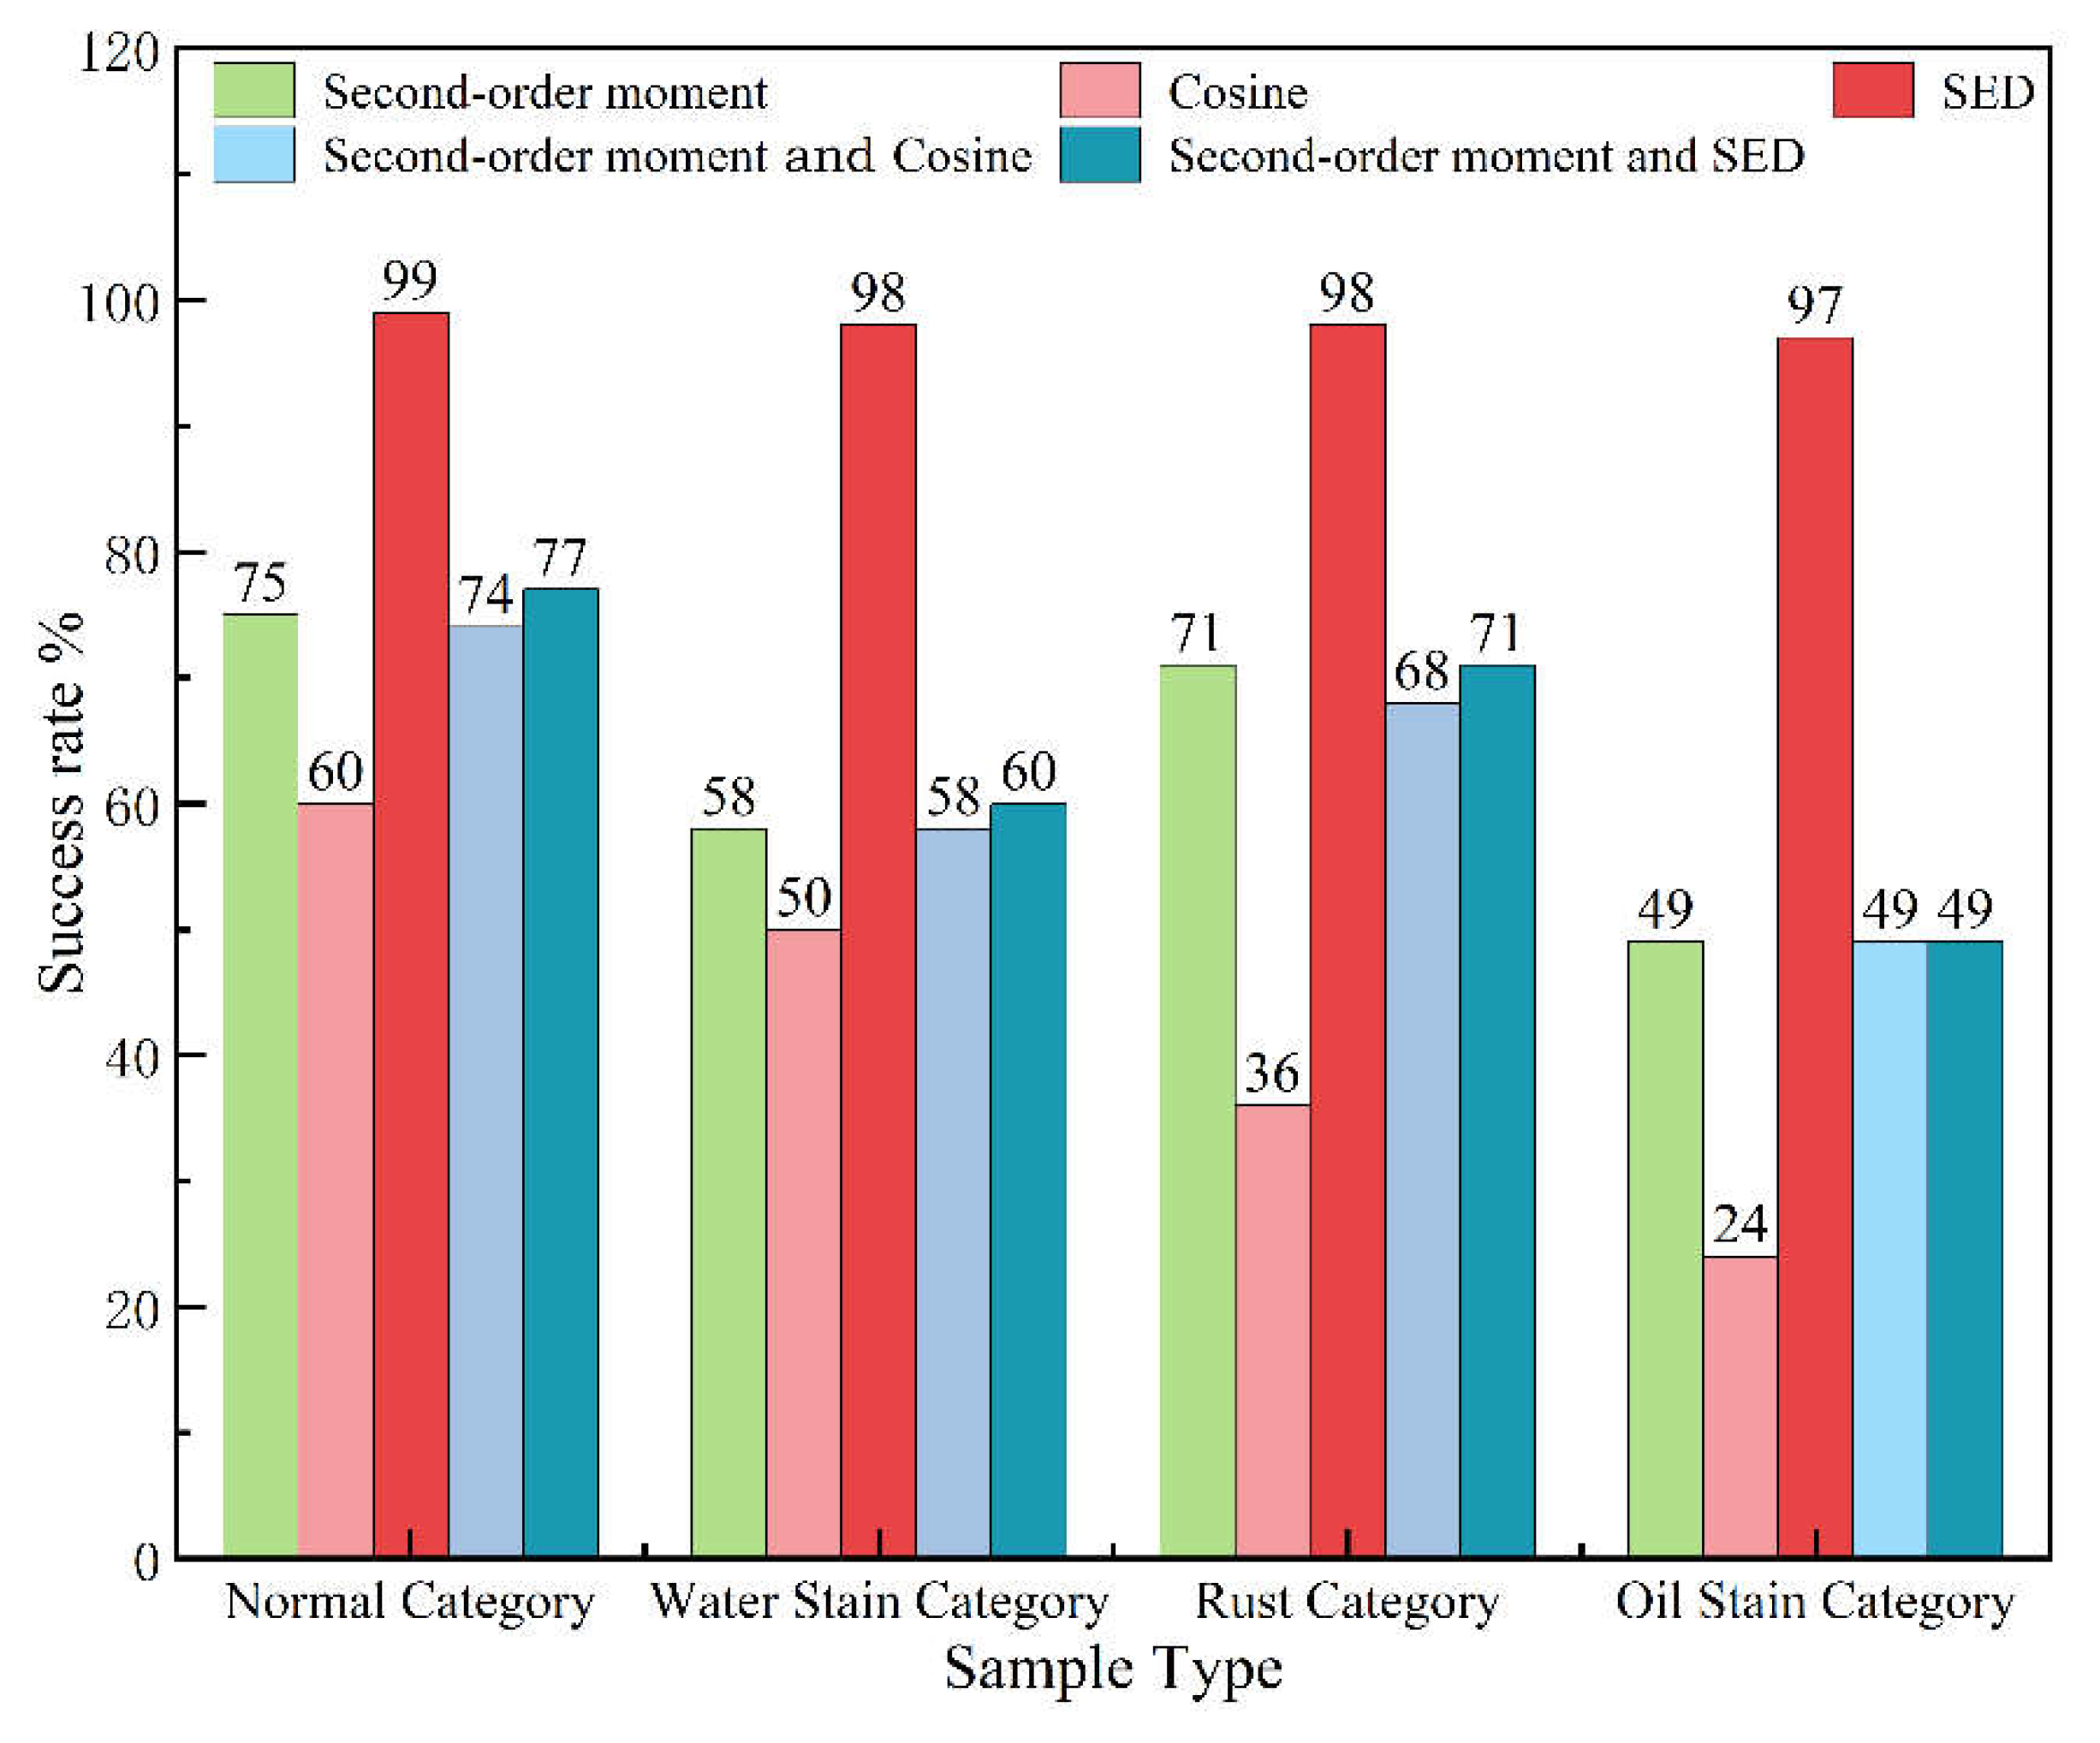
Figure 13.
Number of failed filtering of different size increment values.
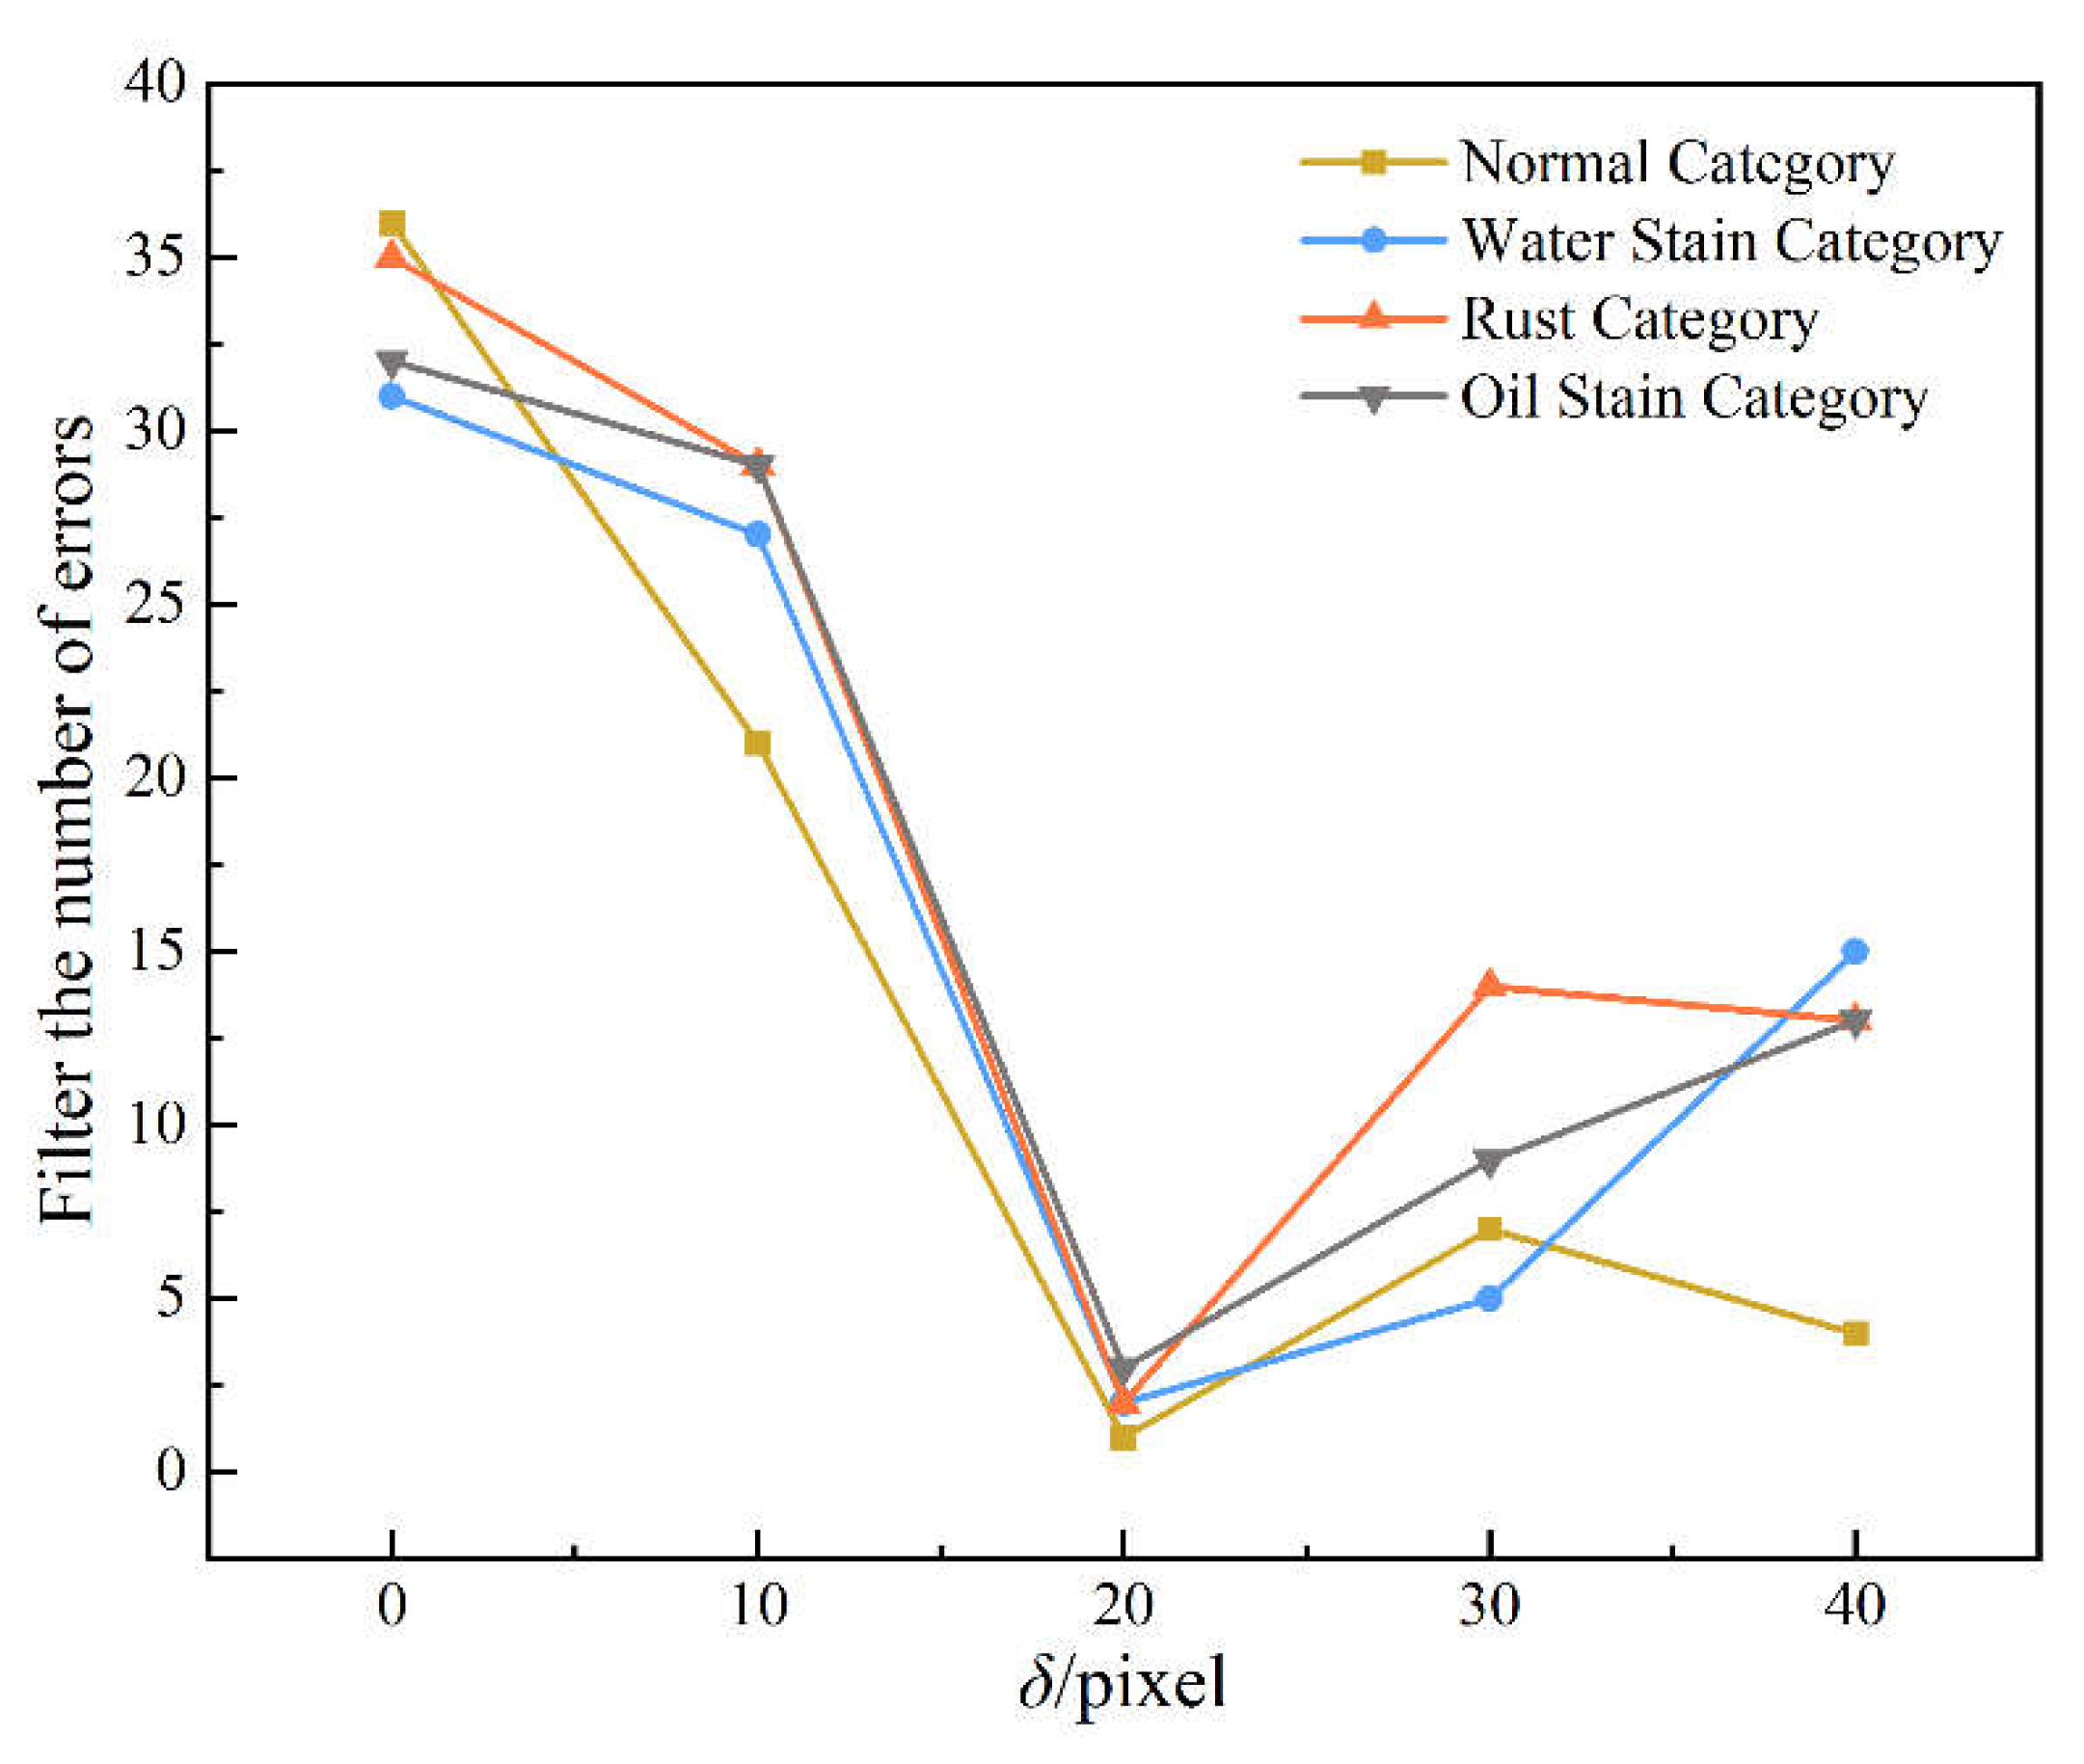
Figure 14.
Spike center positioning error.
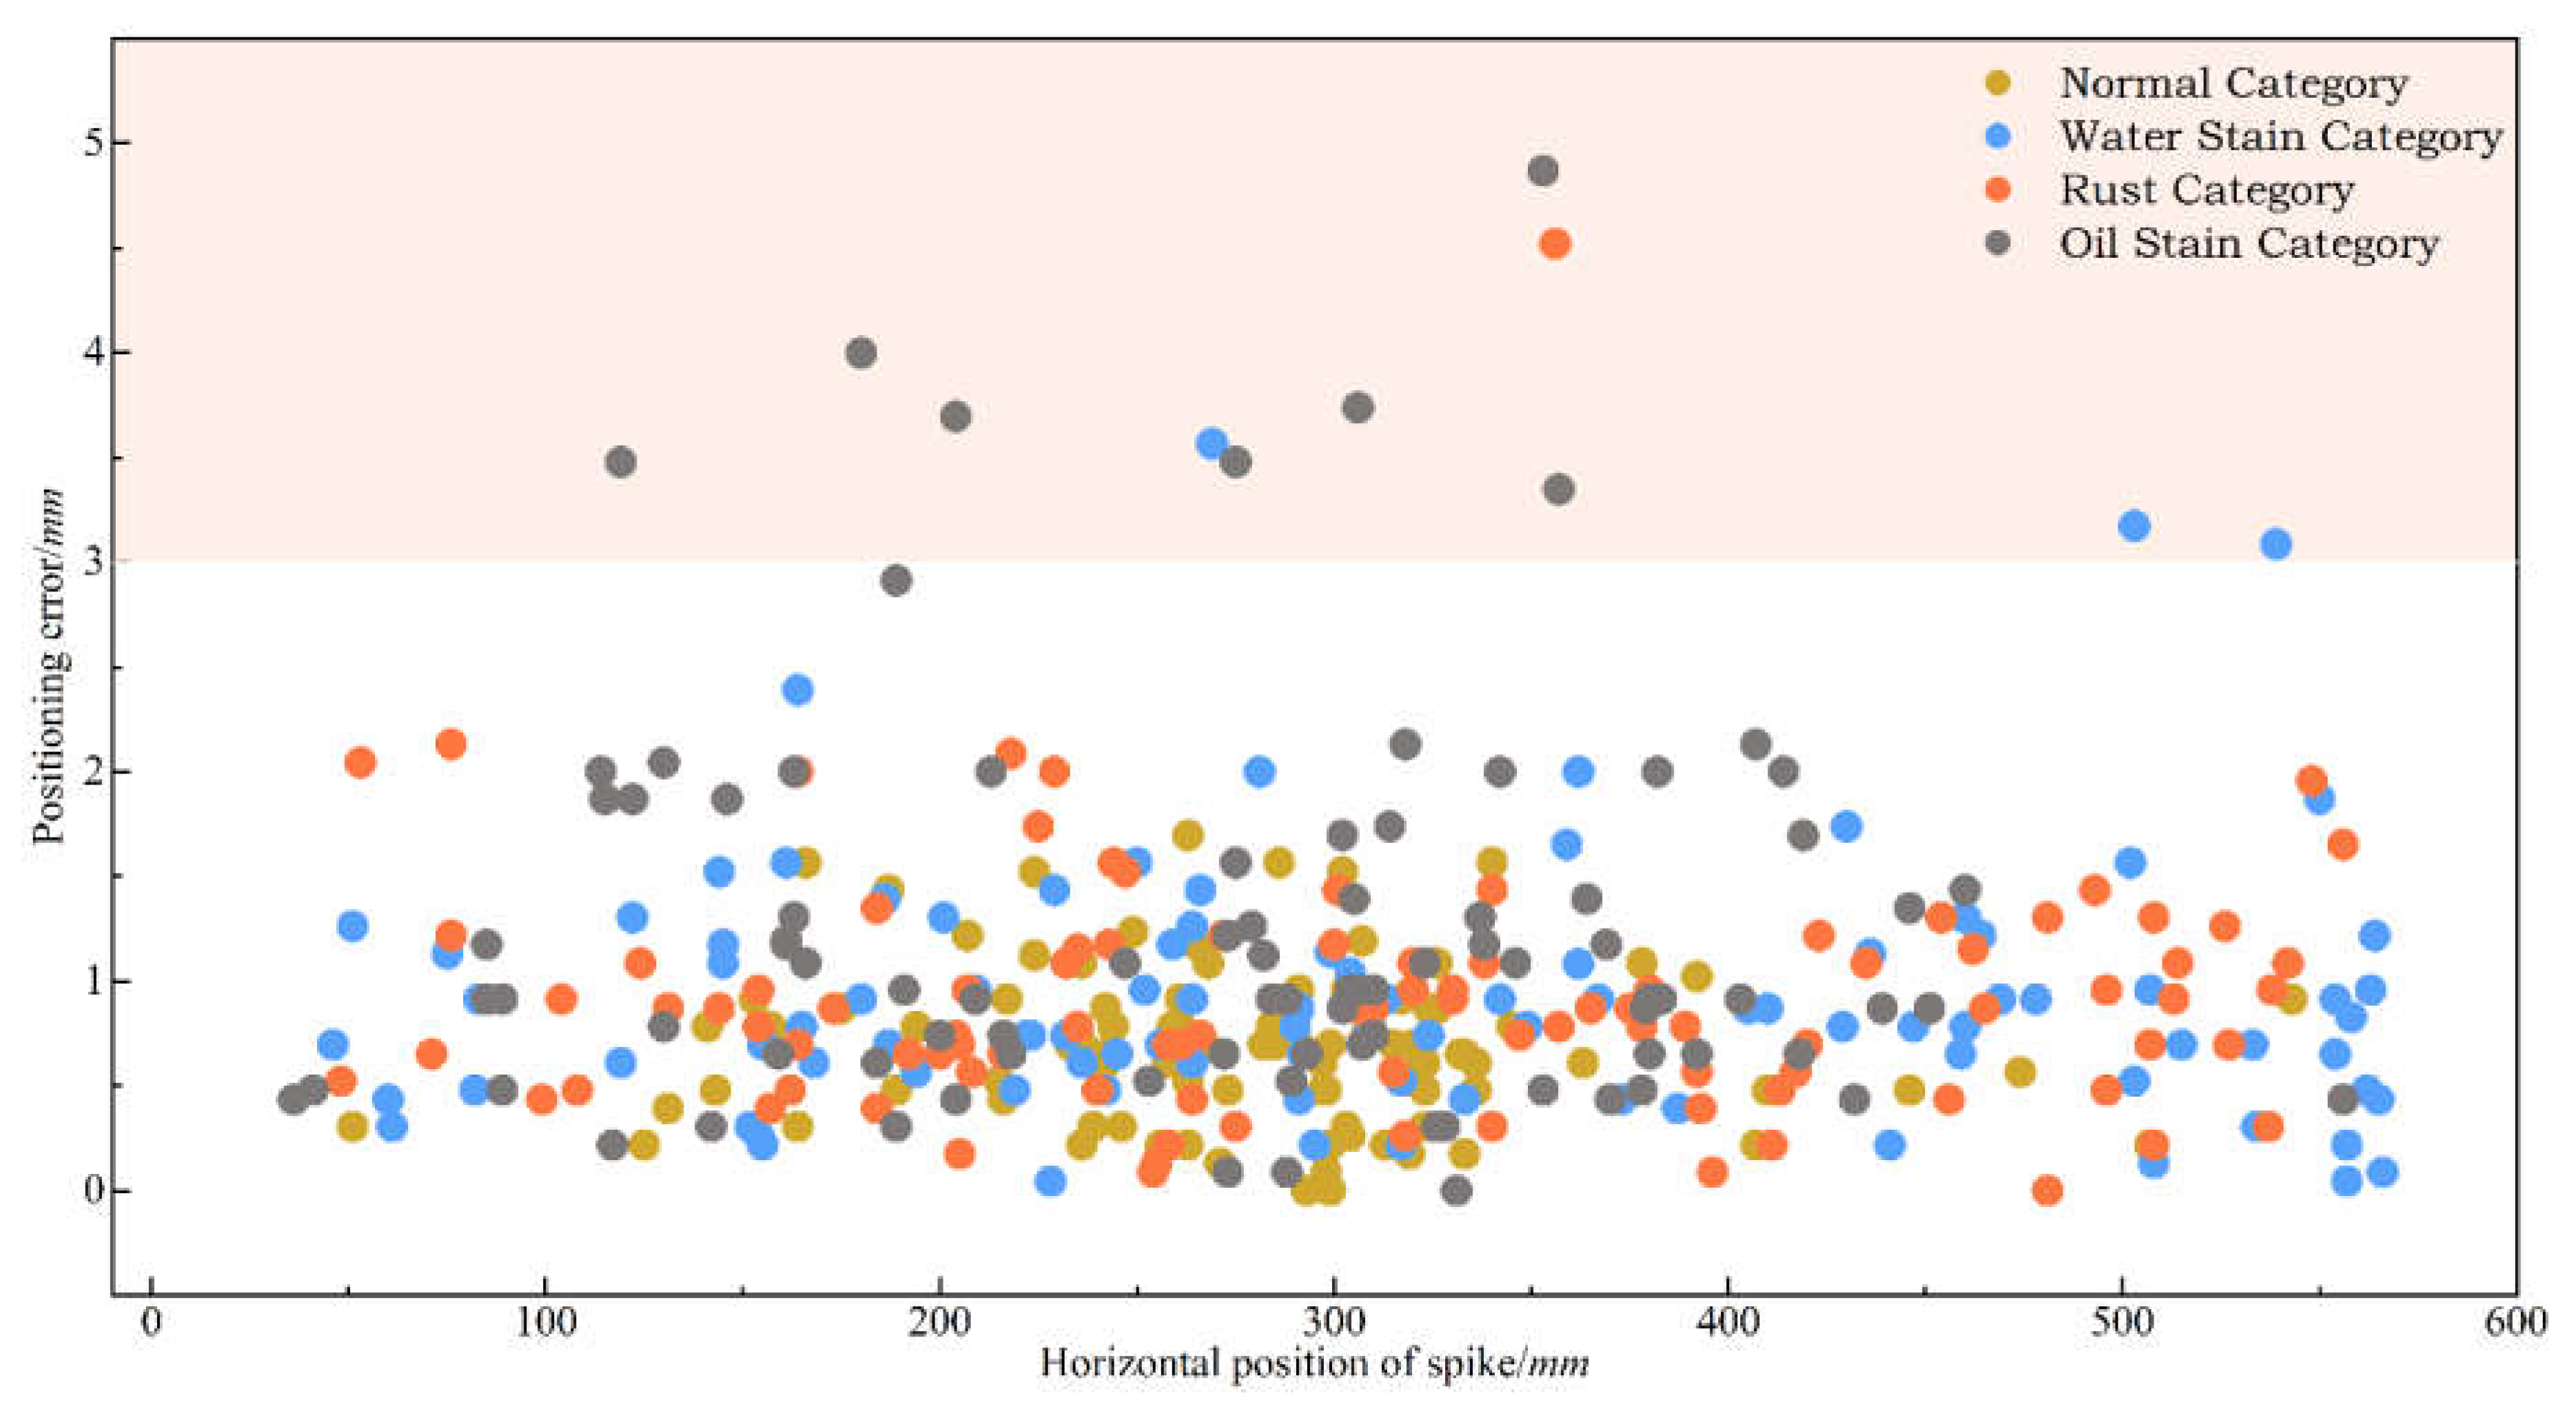
Figure 15.
Railway environment rail spike center positioning results.
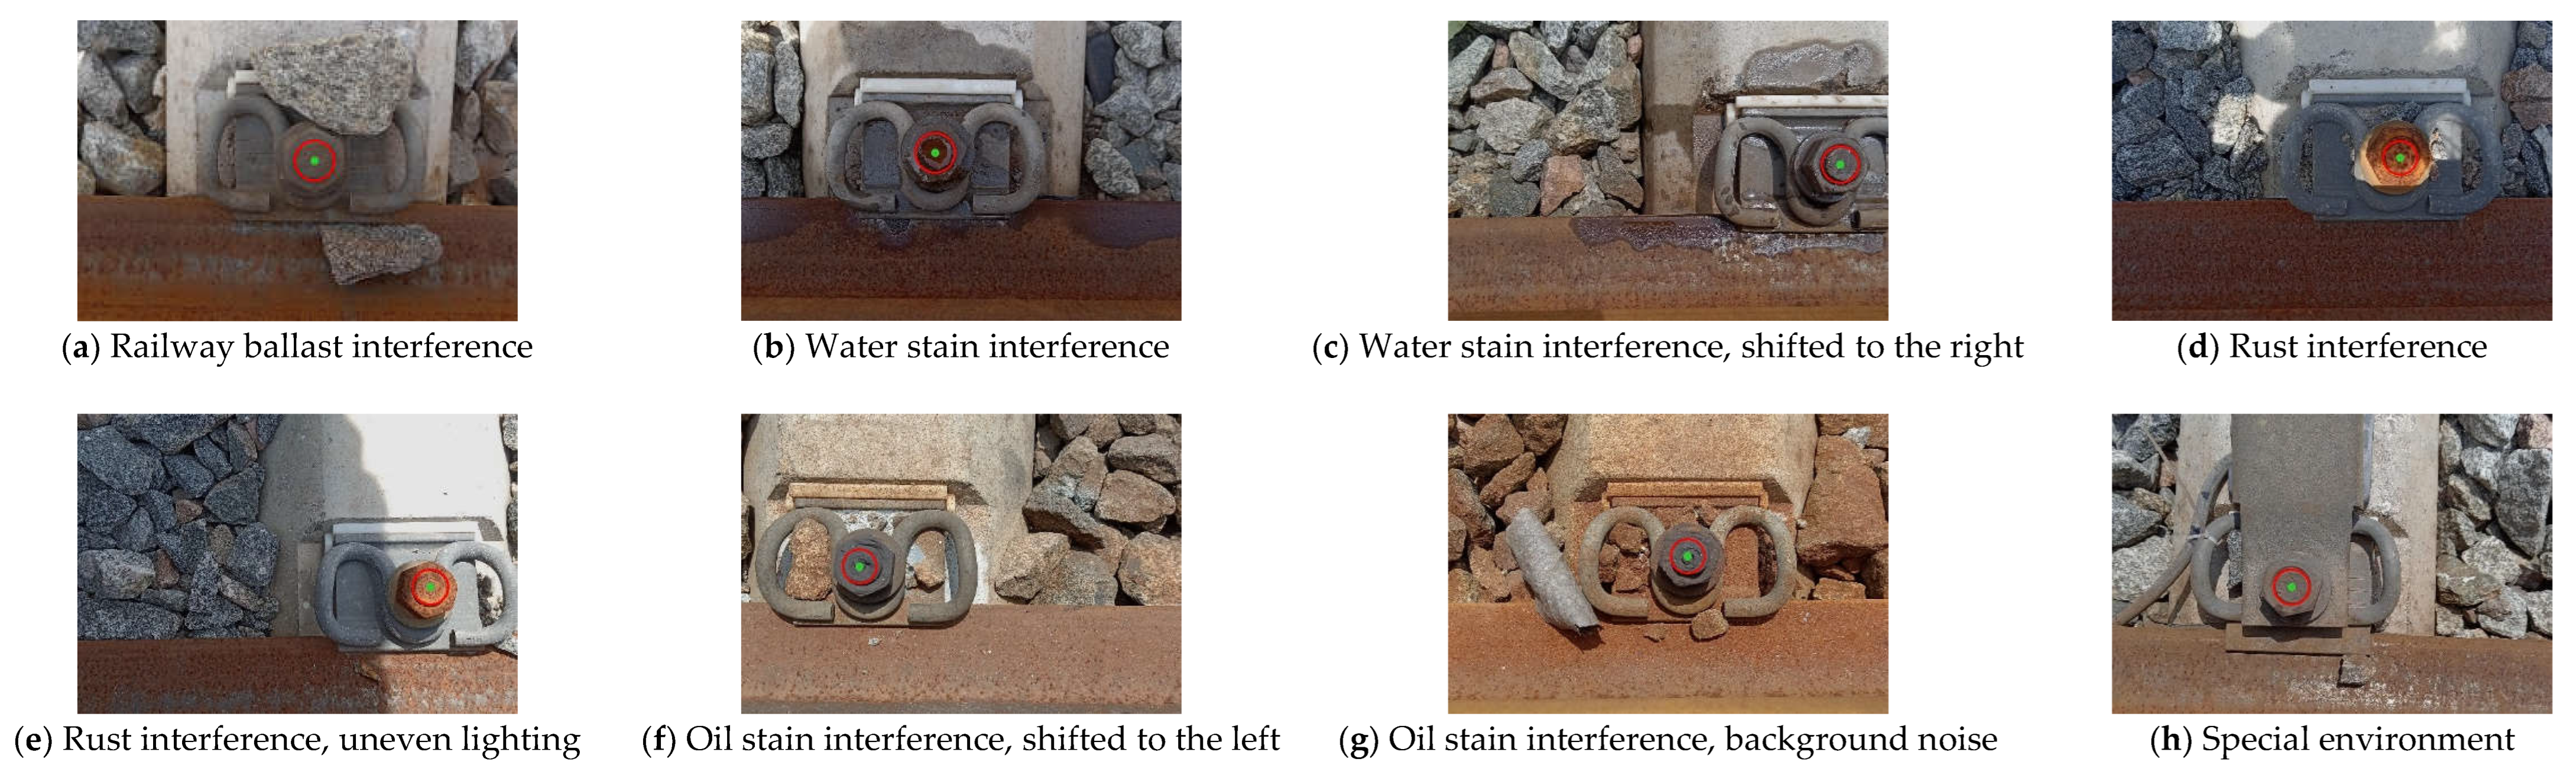

Table 1.
Filtering quality evaluation result.
| Filtering Algorithm |
Evaluation Index |
Normal Category |
Water Stain Category |
Rust Category |
Oil Stain Category |
|---|---|---|---|---|---|
| Gaussian filtering | SNR | 15.368 | 13.946 | 12.792 | 12.258 |
| PSNR | 20.035 | 19.238 | 18.305 | 18.096 | |
| Median filtering | SNR | 14.300 | 12.787 | 11.925 | 11.498 |
| PSNR | 18.969 | 18.079 | 17.438 | 17.335 | |
| Mean filtering | SNR | 14.543 | 13.201 | 12.316 | 11.749 |
| PSNR | 19.211 | 18.492 | 17.830 | 17.586 | |
| Bilateral filtering | SNR | 16.733 | 15.289 | 13.731 | 13.408 |
| PSNR | 21.401 | 20.581 | 19.245 | 19.246 |
Table 2.
Circle detection accuracy.
| Normal Category | Water Stain Category | Rust Category | Oil Stain Category | |
|---|---|---|---|---|
| Traditional Canny algorithm | 98% | 90% | 95% | 81% |
| Improved Canny algorithm | 99% | 99% | 99% | 98% |
Disclaimer/Publisher’s Note: The statements, opinions and data contained in all publications are solely those of the individual author(s) and contributor(s) and not of MDPI and/or the editor(s). MDPI and/or the editor(s) disclaim responsibility for any injury to people or property resulting from any ideas, methods, instructions or products referred to in the content. |
© 2025 by the authors. Licensee MDPI, Basel, Switzerland. This article is an open access article distributed under the terms and conditions of the Creative Commons Attribution (CC BY) license (http://creativecommons.org/licenses/by/4.0/).
Copyright: This open access article is published under a Creative Commons CC BY 4.0 license, which permit the free download, distribution, and reuse, provided that the author and preprint are cited in any reuse.


