Submitted:
06 January 2025
Posted:
07 January 2025
You are already at the latest version
Abstract
To address the need for sustainable aquaculture practices in Egypt, this study evaluates the technical efficiency of tilapia pond farming using Stochastic Frontier Analysis (SFA) with cross-sectional data at the farm level. The objective is to estimate technical efficiency and identify factors influencing sustainable productivity. Data was collected from 317 tilapia farms in Kafr El-Sheikh governorate. The findings highlight opportunities to enhance the sustainability and productivity of tilapia farming, with an average technical efficiency of 0.80. Key determinants of efficiency include the number of species cultured and the age of farming facilities. The results indicate that farms managed by older farmers tend to operate more efficiently. However, older facilities, higher levels of farmer education, and greater species diversity are associated with lower efficiency. These insights provide valuable guidance for improving aquaculture sustainability through targeted interventions in farm management and infrastructure development.
Keywords:
technical efficiency
; Egypt
; SFA
; aquaculture
; tilapia
1. Introduction
Aquaculture practices in Egypt date back to ancient times, and have evolved significantly over time, with continuous advancement since the establishment of the first commercial farm in 1954 [1]. In recent years, aquaculture has accounted for about 80 percent of the country's total fish production [2,3].
Although both extensive and intensive aquaculture production systems exist in Egypt, the semi-intensive system prevails, accounting for 86% of the total aquaculture production. Additionally, some specialized, less common practices-such as the raceway system introduced in 2018, aquaponics, and rice field aquaculture-are also present [2,4]. The majority of aquaculture production comes from inland farming, with tilapia, mullets, carp, and catfish comprising 60%, 20%, 13% and 1% of the total aquaculture production, respectively. On the other hand, marine species such as seabass, seabream and others are cultured in coastal areas representing about 6% of the production [2].
Further growth in Egyptian aquaculture production is anticipated, contingent upon the adoption of the latest production technologies and the relaxation of certain regulations. For instance, as noted by [4], aquaculture farmers are currently prohibited from using fresh water directly from the Nile River for fish farming. This restriction can lead to inefficiencies in production and could limit export opportunities.
Aquaculture production in Egypt has experienced a substantial growth over the past few decades, establishing the country as the leading producer in Africa and the sixth-largest globally with total production of 1.6 million tonnes recorded in 2020, projected to increase by approximately 20%, reaching 1.9 million tonnes by 2030 [5]. This growth can be attributed to the increase in fish demand amidst stable fisheries production, increased government investment in research and development to produce more productive and disease-resistant breeds, and the adoption of more efficient, modern technology [6,7,8].
The fish sector contributed in Egypt’s national agriculture income by 11% in 2019, with 79% of that production coming from aquaculture [2]. Nile tilapia, the third most farmed aquaculture species globally according to [5], is the predominant species in Egypt, accounting for 55% of the total domestic fish production, 86% of which is sourced from aquaculture [2].
In spite of these figures, the aquaculture industry has been facing several challenges that render its growth. [9] and [7] identified some of these challenges such as the prohibition on using irrigation water for fish farming, a lack of training for aquaculture personnel, the poor control of aquaculture diseases, low-quality feed, and the continuous increase in feed prices due to reliance on imports. additionally, the industry is contending with some broader challenges that necessitate changes in the production system of aquaculture such as climate change and global shifts in food production systems and markets [10] .
All these challenges may have played a role in the decline in production observed in 2020 compared to 2019 [5], and pose a major threat to the sustainability of Egyptian aquaculture production. Furthermore, they have adverse effects on the livelihood of aquaculture farmers and fish consumers. Given that aquaculture production in Egypt is largely dominated by smallholder farm and fish is one of the most affordable sources of protein, these challenges make poverty alleviation increasingly difficult to achieve.
The changes in Egyptian aquaculture production from 2000-2022, measured in thousand tonnes, are presented in Figure 1. The figure shows the substantial growth of aquaculture industry over the presented period until 2019 after which a slight decline in production is observed, which can be attributed to the challenges discussed earlier.
Given this complex and uncertain environment surrounding the industry, it is imperative to evaluate the performance of aquaculture farms and their capacity to overcome various challenges. Measuring the technical efficiency of aquaculture farms is crucial for evaluating their performance and identifying factors that can either promote or hinder the industry's growth. Such evaluations not only help characterize the aquaculture sector in Egypt and other developing countries but also contribute to the industry's growth and alignment with sustainable food systems. However, to the best of our knowledge, the technical efficiency of aquaculture farms in Egypt, including tilapia farms, has not been evaluated. This gap can be attributed to the lack of comprehensive characterization of the aquaculture industry in Egypt. Such characterization is vital, as it provides valuable insights for stakeholders, including farmers and policy makers, enabling them to enhance their understanding of the industry. Hence, this evaluation could improve the performance and sustainability of the industry.
Technical efficiency analysis has been used as a tool to assess the performance of the aquaculture sector and identify key factors impacting its growth. The main findings from this analysis that help researchers evaluate and compare the performance of the industry are 1) average technical efficiency, representing the overall efficiency of farms within the sector 2) distribution of the efficiency scores, illustrating the variations in efficiency levels among farms ,and 3) the impacts of various factors on efficiency, which show how different factors, such as input use, management practices, or environmental conditions, influence efficiency scores.
Average technical efficiency (ATE) can range from 0 to 1 where an efficiency score of 1 indicates that the decision-making unit (e.g., a farm) operates at maximum efficiency compared to other units. A score below 1 suggests that the production of this unit can be increased using the same level of inputs. Scholars have reported various scores of ATE for tilapia aquaculture farms across different countries, with values ranging from 0.47 to 0.97 [12,13,14,15,16,17,18,19,20]. For instance, in Malawi, [18] and [20] estimated ATE of tilapia aquaculture farms at 0.66 and 0.47 respectively. In Malaysia, [12] found that ATE freshwater aquaculture and tilapia aquaculture farms were 0.80 and 0.74 respectively. On the other hand, higher scores were reported in China, where [18] and [19] estimated ATE at 0.91 and 0.97, respectively.
The frequency distribution of technical efficiency scores reported in the literature shows significant variations among the decision-making units. Identifying the sources of these variations, referred to as inefficiency factors, is critical for improving the aquaculture industry by managing these factors properly. Numerous inefficiency factors have been examined in the literature for their impact on inefficiency in the aquaculture industry, with results often varying across farms and countries. Common examples include farmer demographics (age, education, experience, gender) , household characteristics, farm management practices, access to resources (credit, extension services), and farm infrastructure(size, facility age, culture system) [12,14,17,19,21,22,23].
In Malaysia, [12] found that education level , experience, household size positively influence technical efficiency while farmers’ age has a negative impact. On the other hand, [21] examined the technical efficiency of small-scale aquaculture farms in Myanmar and found that women’s empowerment, polyculture practices, and climate change adaptation strategies enhance technical efficiency.
In China, factors such as farmers’ age and culture system were found to positively associated with efficiency while experience and family size reduced efficiency [19]. In the Philippines, [17] found that farms with a larger farm area, older farmers, and higher education level tended to be more efficient, while [22] found that higher mortality rates, more schooling years and longer culture periods decreased efficiency, whereas increased fingerlings price improved it.
In Ghana,[23] found that older and more experienced farmers were less technically efficient than the younger ones, and male decision-makers outperformed female in efficiency. Interestingly, farmers with higher education levels and part-time fish farmers were found to be less efficient. Additionally, tenant-operated lands, earthen pond system, and farms receiving extension services demonstrated higher technical efficiency.
Due to variations in estimation methodologies, data availability, and country-specific conditions, the relationship between efficiency and its drivers is inconsistent across studies. In this study, four factors are considered due to data restrictions: farmer age and level of education, age of farm facility, and the number of species cultured. These factors have been widely studied in literature with conflicting findings. For instance, farmer age is often used as a proxy for experience and is positively linked to efficiency [17]. However, some studies show that younger farmers may adopt technologies more readily, invest in innovation, and benefit from available extension services, resulting in higher efficiency [12,14,23]. Similarly, while education is generally expected to improve efficiency [12] by enhancing knowledge and managerial skills, some studies report negative associations [23]. Furthermore, the number of fish species cultured on the farm has been reported as positively associated with efficiency [12,21], however, [10] found the opposite.
The primary objective of this paper is to evaluate the sustainability and performance of the Egyptian aquaculture sector, using tilapia pond farms as a proxy due to tilapia's dominance as the primary cultured species in the country. This study is the first to estimate the technical efficiency of aquaculture in Egypt, providing a novel analysis of tilapia pond farms using stochastic frontier analysis (SFA). The evaluation focuses on understanding the factors influencing efficiency and their implications for sustainable practices. By addressing efficiency dynamics, this study aims to contribute valuable insights toward improving the sustainability and productivity of Egypt's aquaculture sector
2. Materials and Methods
2.1. Efficiency Estimation
Technical efficiency is a measure of the ability of a firm to maximize its output using a fixed number of inputs. [24]vdeveloped Farrell’s measure of technical efficiency where the performance of a specific decision-making unit (DMU) is compared to other DMUs within the same industry. Two widely used methods for estimating technical efficiency are Data Envelopment Analysis (DEA) and SFA. Despite their different methodologies, both SFA and DEA are still prevalent in research due to advancements in computational techniques that have addressed many of their limitations.
DEA, introduced by [25], is a nonparametric approach for estimating technical efficiency using linear programming [26]. One of DEA strengths is its nonparametric nature, which means it does not require any assumptions about the functional form of the production technology or the distribution of the efficiency scores. However, the deterministic nature of DEA limits its ability to provide statistical inference through hypothesis testing and confidence interval construction.
SFA, on the other hand, is a parametric approach that typically uses maximum likelihood estimation to jointly estimate the efficiency scores and the efficiency effects model. Introduced by [27,28], SFA was recommended for assessing technical efficiency in various agricultural activities including fish farming [29]. While SFA allows for statistical inference, it requires assumptions about the functional form of production technology and the distribution of the inefficiency term. The challenge with these requirements is that misspecifications of the assumptions can lead to estimation errors. Based on the characteristics of DEA and SFA shown above, we chose SFA to estimate the technical efficiency.
Figure 2 shows the concept of SFA estimation. The deterministic frontier is the result of the production function used for estimation such as Cobb-Douglas and trans-log function assumes no random errors or inefficiency. The figure shows that firms 1 and 2, use X and X’ levels of input to produce the observed outputs A and A’ respectively.
SFA assumes that the distance between the observed value and the deterministic frontier can be decomposed into two components. The first component is the distance from A to F (and similarly from A’ and F’), which represents the inefficiency score of firms 1 and 2. The second component, from F to the deterministic frontier (and similarly from F’ to the deterministic frontier), represents the unobserved random error that is not included in the model. Points F and F’ are the estimated points assuming that there is no inefficiency, where all firms operate at the best practice and any deviation from the deterministic frontier is attributed solely to the random error.
2.2. Inefficiency Effects Estimation
Using SFA, inefficiency effects are estimated jointly with the efficiency scores using the model developed by [31]. This model allows for simultaneous estimation of the inefficiency effects and the efficiency scores, providing an integrated analysis of the factors influencing inefficiency.
2.3. Stochastic Frontier Model
To evaluate the efficiency of the aquaculture farms, we employed the stochastic production frontier methodology. Following the framework outlined by [27] and using a trans-log specification, the stochastic production frontier model can be expressed as follows:
where represents the value of fish produced by i-th aquaculture farm measured in Egyptian Pounds (EGP); is the value of the fingerlings stocked, in EGP; is the cost of labor, in EGP; is the quantity of feed used, in kilograms; is the area of the ponds in the farm, in hectare; the error term is decomposed into and . The component is the random error term, assumed to be independently and identically distributed as while is a nonnegative random variable associated with technical inefficiency, assumed to follow a half normal distribution with variance .
Following [31], the following model was utilized:
where are farm-specific variables associated with technical inefficiencies. is the age of the farmer; is the number of fish species cultured on the farm; is the education level of the farmer (0 = no education, 1 = elementary, 2 = middle school, 3 = high school, 4 = 2-year college degree, 5= bachelor’s degree, 6 = master’s level); is the age of the farm facilities; and and are parameters to be estimated.
In addition to estimating the inputs parameters (), we also estimate the variance parameters , representing the total variance of the error term and , indicating the proportion of the variance attributable to inefficiency. The value of ranges from zero to one, with values closer to one indicating that a greater proportion of variation can be attributed to inefficiency [31].
2.4. Data
This study utilized data from a cross-sectional survey conducted on aquaculture farms in Kafr El-Sheikh governorate, Egypt. Kafr El-Sheikh is the leading aquaculture-producing region in the country contributing 43.55% of the total aquaculture output [2]. The governorate is marked red in Figure 1.
The survey was designed to gather comprehensive data on both production and demographic variables. The production-related variables collected include output value, as well as inputs such as labour, feed, seeds, land where output value is measured in Egyptian pounds (EGP), the value of the seeds and labour is measured in EGP as well while feed input is measured in kilogram (kg) and land in measured in hectare.
Additionally, farm-specific data were collected such as the age of facilities measured in years from the facility establishment till the year of the survey collection (2017), farmers’ years of experience measured by the number of years from starting fish farming till 2017 and age, the number of species cultured taking values from 1 to 4, and education level of the farmers taking values from zero to 6 where zero indicates no education while 6 indicates having Master’s degree .
The original sample comprised 402 tilapia farms practicing both monoculture and polyculture. After cleaning the data to remove observations with missing or erroneous values, the final dataset used for analysis contained 317 observations. For further details on the data and the survey process, please refer to [34,35].
Table 1 presents the descriptive statistics for the variables included in the analysis, highlighting the variability among farms. The average production value was approximately 1 million EGP, with a wide range from 65 thousand to nearly 9 million EGP and a standard deviation slightly exceeding the mean, indicating substantial variability across farms. The average farm size was 5 hectares, with typical expenditures of around 50 thousand EGP on fingerlings and 30 thousand EGP on labor. On average, farms used approximately 46 tonnes of fish feed. For farm-specific variables, the farmers’ ages ranged from 18 to 75 years, with a mean age of 43 years. The number of fish species cultured on farms varied from 1 to 4, with an average of 2 species. Farmers’ education levels averaged 2, indicating that most had completed elementary-level education. Farm ages exhibited notable diversity, spanning from 1 to 50 years, with an average age of 12 years.
3. Results
3.1. Hypothesis Testing
The likelihood ratio test results, reported in Table 2, indicated that trans-log production function approximation is a better fit to the data than Cobb Douglas model.
The estimates of sigma squared () and gamma (, as shown in Table 3, are statistically significant at the 0.01 level. The statistical significance of confirms the adequacy of the model used for the analysis, demonstrating its strong goodness of fit.
The estimate, with a value of 0.63, indicates that 63% of the variation in output among the sample farms can be attributed to inefficiency, while the remaining 37% is due to random factors. This result highlights the importance of addressing inefficiency to improve farm performance. Additionally, the significance of suggests that the inefficiency effects model is a more appropriate choice for this analysis compared to the ordinary least squares (OLS) model.
3.1. Efficiency estimation
The maximum likelihood estimates, and the corresponding standard errors of the stochastic frontier model and the average technical efficiency (ATE) are presented in Table 3.
Since the trans-log functional form is used for the estimation, the marginal effects of inputs on production cannot be deduced directly from the estimated coefficients in the model because the trans-log functional form incorporates interaction terms between inputs. Instead, the average production elasticities are calculated using the individual coefficients presented in Table 3 by applying this formula:
where is the input elasticity of input k, is the coefficient of , and is the coefficient of interaction terms involving input .
The calculated production elasticities and the corresponding standard error are presented in Table 4.
The calculated production elasticities of feed, labor, and seeds were statistically significant at the level of 0.01 while that of land was not statistically significant at 0.1 level. Feed had the highest elasticity with a value of 0.85 indicating that, on average, increasing feed by 10% increases the output value by 8.5%. On the other hand, as the labor and seed costs increase by 10%, output value increases by 0.7% and 1.4% respectively. Returns to scale, calculated by summing up the production elasticities, is estimated to be 1.10. This value indicates that tilapia aquaculture farms in Egypt operate at a slightly increasing returns to scale.
ATE is estimated at 0.80 which means that the mean technical efficiency of tilapia farms in the study area is 80%. Therefore, tilapia production can be increased, on average, by 20% using the same level of inputs to reach full efficiency. The frequency distribution of the technical efficiency scores is presented in Table 5 and Figure 3.

Table 5.
Frequency distribution of technical efficiency scores.
| Technical efficiency range | Number of farms | Frequency (%) |
|---|---|---|
| <0.60 | 9 | 3% |
| 0.60-0.70 | 19 | 6% |
| 0.70-0.80 | 65 | 21% |
| 0.80-0.90 | 198 | 62% |
| 0.90-1.00 | 26 | 8% |
Figure 2.
Frequency distribution of technical efficiency scores.
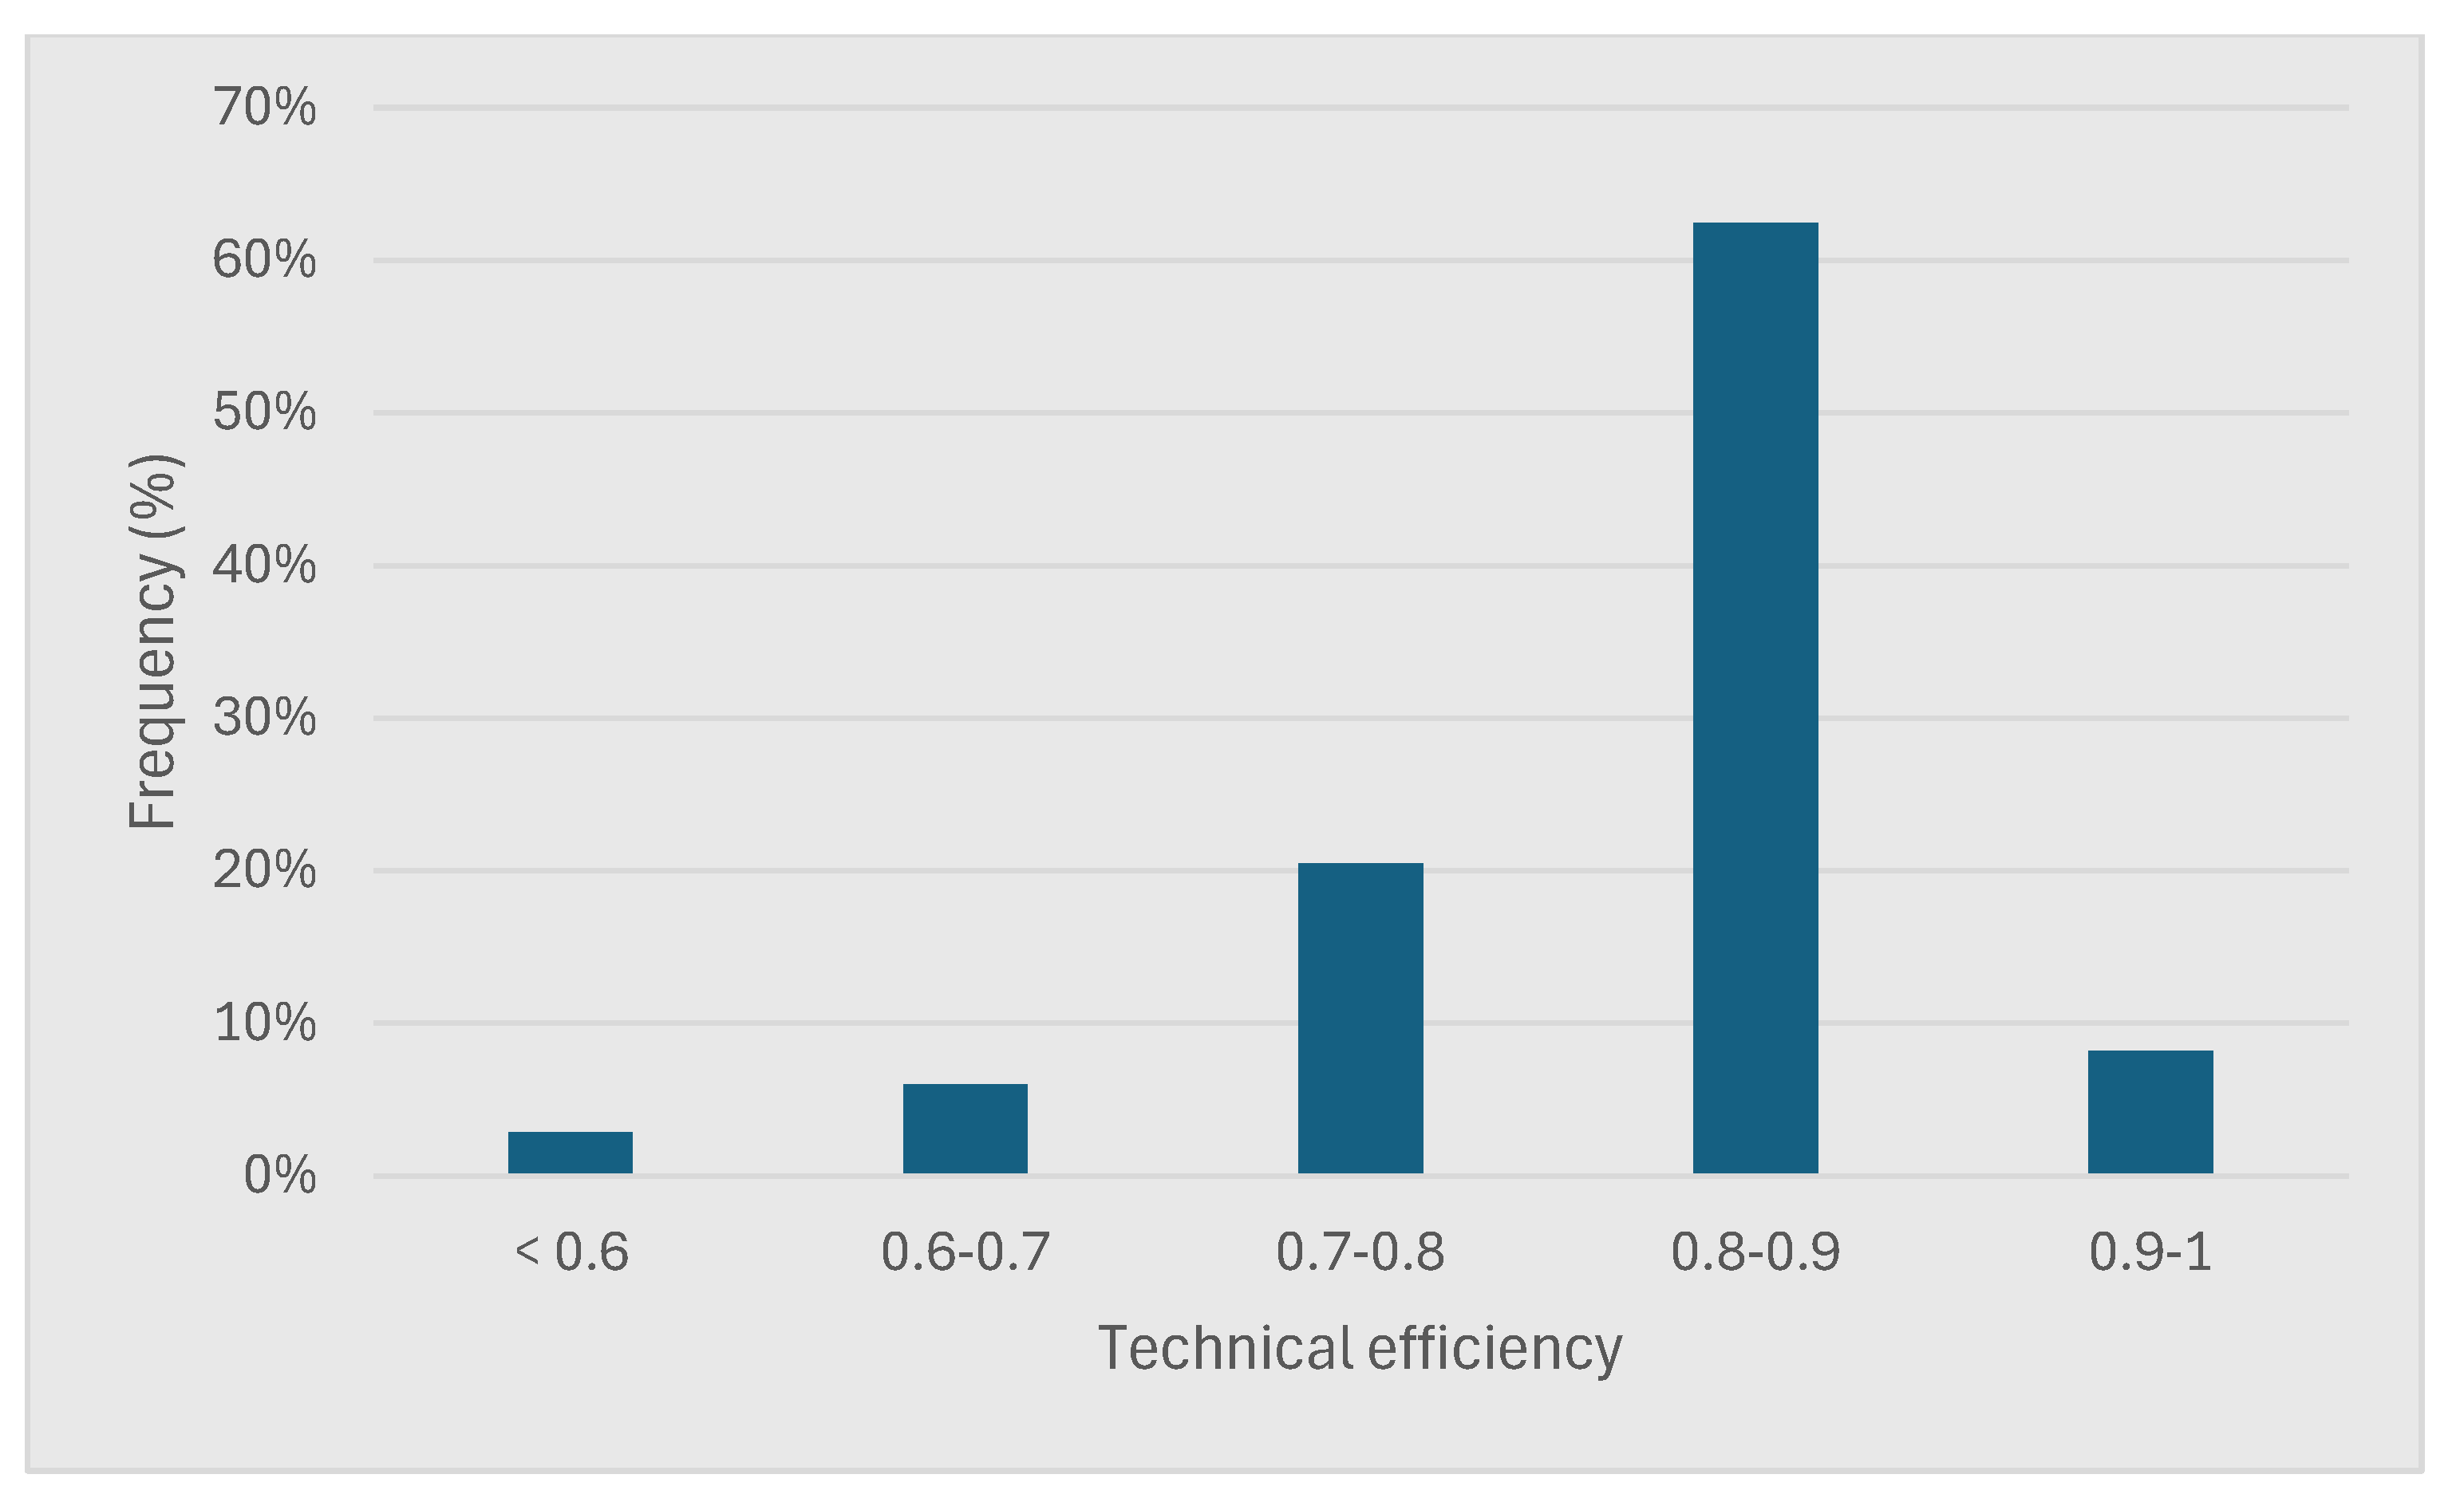
The frequency distribution of technical efficiency shows that the majority of farms (approximately 62%, 198 farms) have efficiency score between 0.80 and 0.90, while only 6% (19 farms) scored less than 0.60. On the other hand, only 8% (26 farms) operate very close to the frontier.
3.3. Inefficiency Effects Model
The estimated coefficients of the inefficiency effects model are presented in . A negative (positive) sign of a coefficient indicates that the corresponding farm-specific variable increases (decreases) the efficiency of aquaculture farms.
Results indicated that farm age and number of cultured species negatively impact efficiency with significance levels of 10% and 5%, respectively. On the other hand, although not statistically significant, the age of the farmer might have a positive effect on efficiency, whereas the farmer’s level of education could have a negative impact.
Table 5.
Technical inefficiency model estimates.
| Efficiency drivers | Coefficient | SE |
|---|---|---|
| Farmer’s age (z1) | -0.02 | 0.02 |
| Number of species cultured (z2) | 0.55** | 0.26 |
| Education level (z3) | 0.17 | 0.13 |
| Farm age (z4) | 0.04* | 0.02 |
**, * Significant at 5% and 10% levels, respectively; SE: Standard error
4. Discussion
4.1. Efficiency Estimation
Production elasticities were all positive and statistically significant, as expected, except the elasticity of land was statistically insignificant. Feed elasticity had the highest elasticity among all inputs at 0.85. This result is very close to what [36] found in salmon farms. Moreover, the value of returns to scale, 1.10 is in accordance with previous studies such as [17,23] indicating that increasing all inputs by 1% causes an increase in production value by approximately 1.10%. However, this result does not match some other studies such as [37,38] with estimates of0.90 and 1.42 respectively.
The estimated ATE of 0.80 indicates that the production can be improved by 20%. This improvement might be achieved by enhancing farm-specific factors such as the quality of feed and seeds, as suggested by [20] and [39]. Low-quality feed and seeds might lead some farmers to overuse them contributing to inefficiency. Additionally, facilitating access to credits may enhance the efficiency as it would allow farmers to invest in more efficient production technologies [40]. This is particularly relevant, given that the number of farmers with access to credit in the study area is significantly low [10].
The estimated ATE is consistent with findings from tilapia farms in other countries with well-established aquaculture sectors, such as Malaysia [12], Bangladesh [13,14,15], China [16] and the Philippines [17]. The ATE in the abovementioned studies ranged from 0.73 to 0.85. However, the ATE in this study is lower than that of some tilapia farms in China [18,19] where values of 0.91 and 0.97 were reported, respectively, but higher than those in Malawi [18,20] where ATE values were 0.66 and 0.47, respectively.
4.2. Inefficiency Effects Model
The non-significant positive relationship between farmer age and technical efficiency may be explained by considering age as a proxy for experience; older farmers tend to have more experience than younger ones, which could lead to higher efficiency. This result aligns with [17] but contrasts with [23] and [12]. These studies argue that younger farmers are more technologically inclined, willing to invest in new technologies and better positioned to benefit from available extension services, resulting in greater efficiency through reduced input use [14].
Regarding the negative influence of the number of species cultured on efficiency, we initially anticipated a positive relationship, as suggested by several previous studies [12,19,21]. This expectation was based on the potential for economies of scale [12,41] or the notion that polyculture systems could share similar benefits with integrated multi-trophic aquaculture (IMTA) systems. In several African countries, including Egypt, polyculture farms have been found to be more economically efficient than monoculture ones [42,43]. Moreover, polyculture has been reported to improve growth performance [44]. Polyculture systems typically involve farming fish with diverse feeding habits. For example, a farm might culture bottom feeders alongside surface feeders, with some species consuming organic matter produced by others. This leads to more efficient use of resources such as feed, fertilizer, and land [21,45,46,47]. However, the identified negative effect in this study might be due to the varying requirements of fish, the lack of specialization or even improper stocking densities for each species. The competition between the fish may overshadow the complementary effect of efficient feed utilization, thereby contributing to the observed negative impact on efficiency. Although this result is not expected, it is in line with [10], who found that monoculture systems had higher production and profits compared to polyculture systems.
Our finding of an inverse relationship between education and efficiency was unexpected. Typically, one would expect it to have a positive effect, as has been observed in many studies on aquaculture farms [12], while similar results were reported specifically for tilapia farms by [48] in Ghana, [14] in Bangladesh, and [49] in Philippines. The positive impact of education on efficiency can be attributed to the enhanced knowledge and managerial skills that education provides, exposing the farmers to more efficient technologies, and a broader range of relevant information which gives the educated farmers the advantage of being more efficient. On the other hand, the negative impact of education on technical efficiency, although uncommon, is documented in the literature. [23] reported similar findings in fish farms in Ghana while [22] found it in tilapia farms in the Philippines. The explanation for this negative correlation often centers on the idea that more educated farmers may have alternative sources of income, which could lead them to dedicate less time and attention to their farms compared to less educated farmers, thereby reducing efficiency. This argument could also apply to tilapia farms in Egypt, where competing interests among more educated farmers may result in lower efficiency.
The negative effect of farm age on efficiency suggests that older farms tend to be less efficient which might be due to the depreciation of capital and outdated infrastructure. This result aligns with the findings of [50], who found that newer farms tend to surpass the efficiency of older ones after 3-5 years, a phenomenon attributed to the leapfrogging effect, where new entrants adopt more advanced technologies and practices, giving them a competitive advantage.
5. Conclusions
This paper aimed to estimate the technical efficiency of tilapia pond production in Egypt, which has not been visited in the literature yet, by using cross sectional data from 317 farms. Using SFA, technical efficiency was estimated utilizing trans-log approximations. Results indicated that tilapia production in the sample farms can be increased by 20% using the same levels of inputs.
The efficiency effects model indicates a positive relationship between technical efficiency and the age of the farmers which serves as a proxy for experience. This finding suggests that policymakers should focus on enhancing technical efficiency, thereby improving production levels, by investing in human capital within the aquaculture sector. Achieving this goal may involve implementing intensive training and extension programs aimed at elevating the knowledge levels of farm owners and managers. Conversely, the observed negative correlation between technical efficiency scores and the age of the farm can be addressed by facilitating access to new technology to counteract the aging of older farms. This might involve easing access to credit or providing support for transitioning to farms with more modern technology.
Author Contributions
Conceptualization, methodology, software, validation, formal analysis, investigation, resources, data curation, writing—original draft preparation, and funding acquisition MS; writing—review and editing, visualization, supervision, project administration MM. All authors have read and agreed to the published version of the manuscript.
Funding
This research was supported financially by the Egyptian Ministry of Higher Education.
Institutional Review Board Statement
Not applicable.
Data Availability Statement
Not applicable.
Acknowledgments
We are sincerely grateful to Richard Perrin and Lilyan Fulginiti, professors in the Department of Agricultural Economics, University of Nebraska-Lincoln. Their invaluable insights have greatly assisted this research. We also thank the Egyptian Ministry of Higher Education for the financial support.
Conflicts of Interest
The authors declare no conflicts of interest.
References
- El-Sayed, A. The Success Story of Aquaculture in Egypt: The Real Motivation for Hosting the First Aquaculture Africa Conference (AFRAQ21) Available online:. Available online: https://www.was.org/articles/The-Success-Story-of-Aquaculture-in-Egypt-The-Real-Motivation-for-Hosting-the-First-Aquaculture-Africa-Conference.aspx (accessed on 16 July 2024).
- GAFRD Fish Statistics Yearbooks. Retrieved from Ministry of Agriculture and Land Reclamation, Cairo, Egypt. 2020.
- GAFRD Fish Statistics Yearbooks. Retrieved from Ministry of Agriculture and Land Reclamation, Cairo, Egypt. 2019.
- Mehrim, A.I.; Refaey, M.M. An Overview of the Implication of Climate Change on Fish Farming in Egypt. Sustain. 2023, 15, 1–29. [Google Scholar] [CrossRef]
- FAO The State of World Fisheries and Aquaculture (SOFIA), FAO: Rome, 2022; 2022; ISBN 9789251363645.
- Wally, A. The State and Development of Aquaculture in Egypt. 2016. [Google Scholar]
- Shaalan, M.; El-Mahdy, M.; Saleh, M.; El-Matbouli, M. Aquaculture in Egypt: Insights on the Current Trends and Future Perspectives for Sustainable Development. Rev. Fish. Sci. Aquac. 2018, 26, 99–110. [Google Scholar] [CrossRef]
- El-Sayed, A.F.M.; Nasr-Allah, A.M.; Dickson, M.; Gilmour, C. Analysis of Aquafeed Sector Competitiveness in Egypt. Aquaculture 2022, 547, 737486. [Google Scholar] [CrossRef]
- Kaleem, O.; Bio Singou Sabi, A.F. Overview of Aquaculture Systems in Egypt and Nigeria, Prospects, Potentials, and Constraints. Aquac. Fish. 2021, 6, 535–547. [Google Scholar] [CrossRef]
- Rossignoli, C.M.; Manyise, T.; Shikuku, K.M.; Nasr-Allah, A.M.; Dompreh, E.B.; Henriksson, P.J.G.; Lam, R.D.; Lozano Lazo, D.; Tran, N.; Roem, A.; et al. Tilapia Aquaculture Systems in Egypt: Characteristics, Sustainability Outcomes and Entry Points for Sustainable Aquatic Food Systems. Aquaculture 2023, 577, 739952. [Google Scholar] [CrossRef]
- FAO. 2024 Global Aquaculture Production. In: Fisheries and Aquaculture Available online: https://www.fao.org/fishery/en/collection/aquaculture?lang=en.
- Iliyasu, A.; Mohamed, Z.A.; Terano, R. Comparative Analysis of Technical Efficiency for Different Production Culture Systems and Species of Freshwater Aquaculture in Peninsular Malaysia. Aquac. Reports 2016, 3, 51–57. [Google Scholar] [CrossRef]
- Alam, F.; Khan, A.; Huq, A.S.M.A. Technical Efficiency in Tilapia Farming of Bangladesh : A Stochastic Frontier Production Approach. 2012; 619–634. [Google Scholar] [CrossRef]
- Islam, S.; Mitra, S.; Khan, M.A. Technical and Cost Efficiency of Pond Fish Farms: Do Young Educated Farmers Bring Changes? J. Agric. Food Res. 2023, 12, 100581. [Google Scholar] [CrossRef]
- Mitra, S.; Khan, M.A.; Nielsen, R.; Islam, N. Total Factor Productivity and Technical Efficiency Differences of Aquaculture Farmers in Bangladesh: Do Environmental Characteristics Matter? J. World Aquac. Soc. 2020, 51, 918–930. [Google Scholar] [CrossRef]
- Yuan, Y.; Yuan, Y.; Dai, Y.; Zhang, Z.; Gong, Y.; Yuan, Y. Technical Efficiency of Different Farm Sizes for Tilapia Farming in China. Aquac. Res. 2020, 51, 307–315. [Google Scholar] [CrossRef]
- 1Dey, M.M.; Paraguas, F.J.; Bimbao, G.B.; Regaspi, P.B. Technical Efficiency of Tilapia Growout Pond Operations in the Philippines. Aquac. Econ. Manag. 2000, 4, 33–47. [Google Scholar] [CrossRef]
- Phiri, F.; Yuan, X. Technical Efficiency of Tilapia Production in Malawi And China: Application of Stochastic Frontier Production Approach. J. Aquac. Res. Dev. 2018, 09. [Google Scholar] [CrossRef]
- Zongli, Z.; Yanan, Z.; Feifan, L.; Hui, Y.; Yongming, Y.; Xinhua, Y. Economic Efficiency of Small-Scale Tilapia Farms in Guangxi, China. Aquac. Econ. Manag. 2017, 21, 283–294. [Google Scholar] [CrossRef]
- Mussa, H.; Kaunda, E.; Jere, W.W.L.; Ng’ong’ola, D.H. Resource Use Efficiency in Tilapia Production in Central and Southern Malawi. Aquac. Econ. Manag. 2020, 24, 213–231. [Google Scholar] [CrossRef]
- Aung, Y.M.; Khor, L.Y.; Tran, N.; Shikuku, K.M.; Zeller, M. Technical Efficiency of Small-Scale Aquaculture in Myanmar: Does Women’s Participation in Decision-Making Matter? Aquac. Reports 2021, 21, 100841. [Google Scholar] [CrossRef]
- Tan, R.L.; Garcia, Y.T.; Dator, M.-A.L.; Tan, I.M.A.; Pemsl, D.E. Technical Efficiency of Genetically Improved Farmed Tilapia (Gift) Cage Culture Operations in the Lakes of Laguna and Batangas, Philippines. J. Issaas 2011, 17, 194–207. [Google Scholar]
- Onumah, E.E.; Brümmer, B.; Hörstgen-Schwark, G. Elements Which Delimitate Technical Efficiency of Fish Farms in Ghana. J. World Aquac. Soc. 2010, 41, 506–518. [Google Scholar] [CrossRef]
- Farrell, M.J. The Measurement of Productive Efficiency. J. R. Stat. Soc. Ser. A 1957, 120, 253–290. [Google Scholar] [CrossRef]
- Charnes, A.; Cooper, W.W.; Rhodes, E. Measuring the Efficiency of Decision Making Units. Eur. J. Oper. Res. 1978, 2, 429–444. [Google Scholar] [CrossRef]
- Amin, G.R.; Oukil, A. Flexible Target Setting in Mergers Using Inverse Data Envelopment Analysis. Int. J. Oper. Res. 2019, 35, 301–317. [Google Scholar] [CrossRef]
- Aigner, D.; Lovell, C.A.K.; Schmidt, P. Formulation and Estimation of Stochastic Frontier Production Function Models. J. Econom. 1977, 6, 21–37. [Google Scholar] [CrossRef]
- Meeusen, W.; van Den Broeck, J. Efficiency Estimation from Cobb-Douglas Production Functions with Composed Error. Int. Econ. Rev. (Philadelphia). 1977, 18, 435–444. [Google Scholar] [CrossRef]
- Dey, M.M.; Paraguas, F.J.; Srichantuk, N.; Yuan, X.; Bhatta, R.; Dung, L.T.C. Technical Efficiency of Freshwater Pond Polyculture Production in Selected Asian Countries: Estimation and Implication. Aquac. Econ. Manag. 2005, 9, 39–63. [Google Scholar] [CrossRef]
- Coelli, T.J.; Rao, D.S.P.; O’donnell, C.J.; Battese, G.E. An Introduction to Efficiency and Productivity Analysis; springer science & business media, 2005; ISBN 0387258957.
- Battese, G.E.; Coelli, T.J. A Model for Technical Inefficiency Effects in a Stochastic Frontier Production Function for Panel Data. Empir. Econ. 1995, 20, 325–332. [Google Scholar] [CrossRef]
- Dakpo, K.H.; Desjeux, Y.; Henningsen, A.; Latruffe, L. SfaR: Stochastic Frontier Analysis Routines. 2023.
- R Core Team R: A Language and Environment for Statistical Computing 2021.
- Shikuku, K.M.; Van Tran, N.; Henriksson, P.; Nasr-Allah, A.; Roem, A.; Badr, A.; Cheong, K.C.; Sbaay, A.; Calmet, M.; Charo-Karisa, H.; et al. Dataset for Baseline Integrated Assessment of Aquaculture Systems Performance in Egypt 2021.
- Shikuku, K.M.; Tran, N.; Henriksson, P.; Nasr-, A.M.; Roem, A.; Badr, A.; Cheong, K.C.; Sbaay, A.S.; Angela, M.; Karisa, H.; et al. A Baseline Integrated Assessment of Aquaculture Systems Performance in Egypt. 2020. [Google Scholar]
- Asche, F.; Roll, K.H. Determinants of Inefficiency in Norwegian Salmon Aquaculture. Aquac. Econ. Manag. 2013, 17, 300–321. [Google Scholar] [CrossRef]
- Esmaeili, A. Technical Efficiency Analysis for the Iranian Fishery in the Persian Gulf. ICES J. Mar. Sci. 2006, 63, 1759–1764. [Google Scholar] [CrossRef]
- Chiang, F.-S.; Sun, C.-H.; Yu, J.-M. Technical Efficiency Analysis of Milkfish (Chanos Chanos) Production in Taiwan—an Application of the Stochastic Frontier Production Function. Aquaculture 2004, 230, 99–116. [Google Scholar] [CrossRef]
- Singh, K.; Dey, M.M.; Rabbani, A.G.; Sudhakaran, P.O.; Thapa, G. Technical Efficiency of Freshwater Aquaculture and Its Determinants in Tripura, India. 2009.
- Mitra, S.; Khan, M.A.; Nielsen, R. Credit Constraints and Aquaculture Productivity. Aquac. Econ. Manag. 2019, 23, 410–427. [Google Scholar] [CrossRef]
- Hossain, M.E.; Khan, M.A.; Dey, M.M.; Alam, M.S. Insights of Freshwater Carp Polyculture in Bangladesh: Inefficiency, Yield Gap, and Yield Loss Perspectives. Aquaculture 2022, 557, 738341. [Google Scholar] [CrossRef]
- Onyeagocha, S.U.O..; Henri-Ukoha, A..; Chikezie, C..; G.S.; , A.; Oladejo, E.E..; Uhuegbulam, I.J. and; Oshaji, I.O. Economics of Catfish ( Clarias Gariepinus ) and Tilapia ( Tilapia Zilli ) under Monoculture and Polyculture Production in Aguata Local Government Area of Anambra State, Nigeria : A Comparative Approach. 2015, 3, 101–105. [Google Scholar]
- Mehrim, A.; Refaey, M.; Khalil, F.; Shaban, Z. Impact of Mono- and Polyculture Systems on Growth Performance, Feed Utilization, and Economic Efficiency of Oreochromis Niloticus, Mugil Cephalus, and Mugil Capito. J. Anim. Poult. Prod. 2018, 9, 393–400. [Google Scholar] [CrossRef]
- El-Sagheer, F.; El-Ebiary, E.; Mabrouk, H. Comparison Between Monoculture and Polyculture of Tilapia and Mullet Reared in Floating Net Cages. J. Anim. Poult. Prod. 2008, 33, 4863–4872. [Google Scholar] [CrossRef]
- Chopin, T.; Buschmann, A.H.; Halling, C.; Troell, M.; Kautsky, N.; Neori, A.; Kraemer, G.P.; Zertuche-González, J.A.; Yarish, C.; Neefus, C. Integrating Seaweeds into Marine Aquaculture Systems: A Key toward Sustainability. J. Phycol. 2001, 37, 975–986. [Google Scholar] [CrossRef]
- de Morais, A.P.M.; Santos, I.L.; Carneiro, R.F.S.; Routledge, E.A.B.; Hayashi, L.; de Lorenzo, M.A.; do Nascimento Vieira, F. Integrated Multitrophic Aquaculture System Applied to Shrimp, Tilapia, and Seaweed (Ulva Ohnoi) Using Biofloc Technology. Aquaculture 2023, 572. [Google Scholar] [CrossRef]
- Shinde, S. V.; Sukhdhane, K.S.; Krishnani, K.K.; Rani, B.; Pathak, M.S.; Chanu, T.I.; Munilkumar, S. Inclusion of Organic and Inorganic Extractive Species Improves Growth, Survival and Physiological Responses of GIFT Fish Reared in Freshwater Integrated Multi-Trophic Aquaculture System. Aquaculture 2024, 580, 740346. [Google Scholar] [CrossRef]
- Antwi, D.E.; Kuwornu, J.K.M.; Onumah, E.E.; Bhujel, R.C. Productivity and Constraints Analysis of Commercial Tilapia Farms in Ghana. Kasetsart J. Soc. Sci. 2017, 38, 282–290. [Google Scholar] [CrossRef]
- Jandoc, A.M. Technical Efficiency and Social Capital in Tilapia Aquaculture Production in Nueva Vizcaya, Philippines. Asian J. Agric. Dev. 2019, 16. [Google Scholar] [CrossRef]
- Nilsen, O.B. Learning-by-Doing or Technological Leapfrogging: PRODUCTION Frontiers and Efficiency Measurement in Norwegian Salmon Aquaculture. Aquac. Econ. Manag. 2010, 14, 97–119. [Google Scholar] [CrossRef]
Figure 1.
Changes in Egyptian aquaculture production over time [11].
Figure 1.
Changes in Egyptian aquaculture production over time [11].
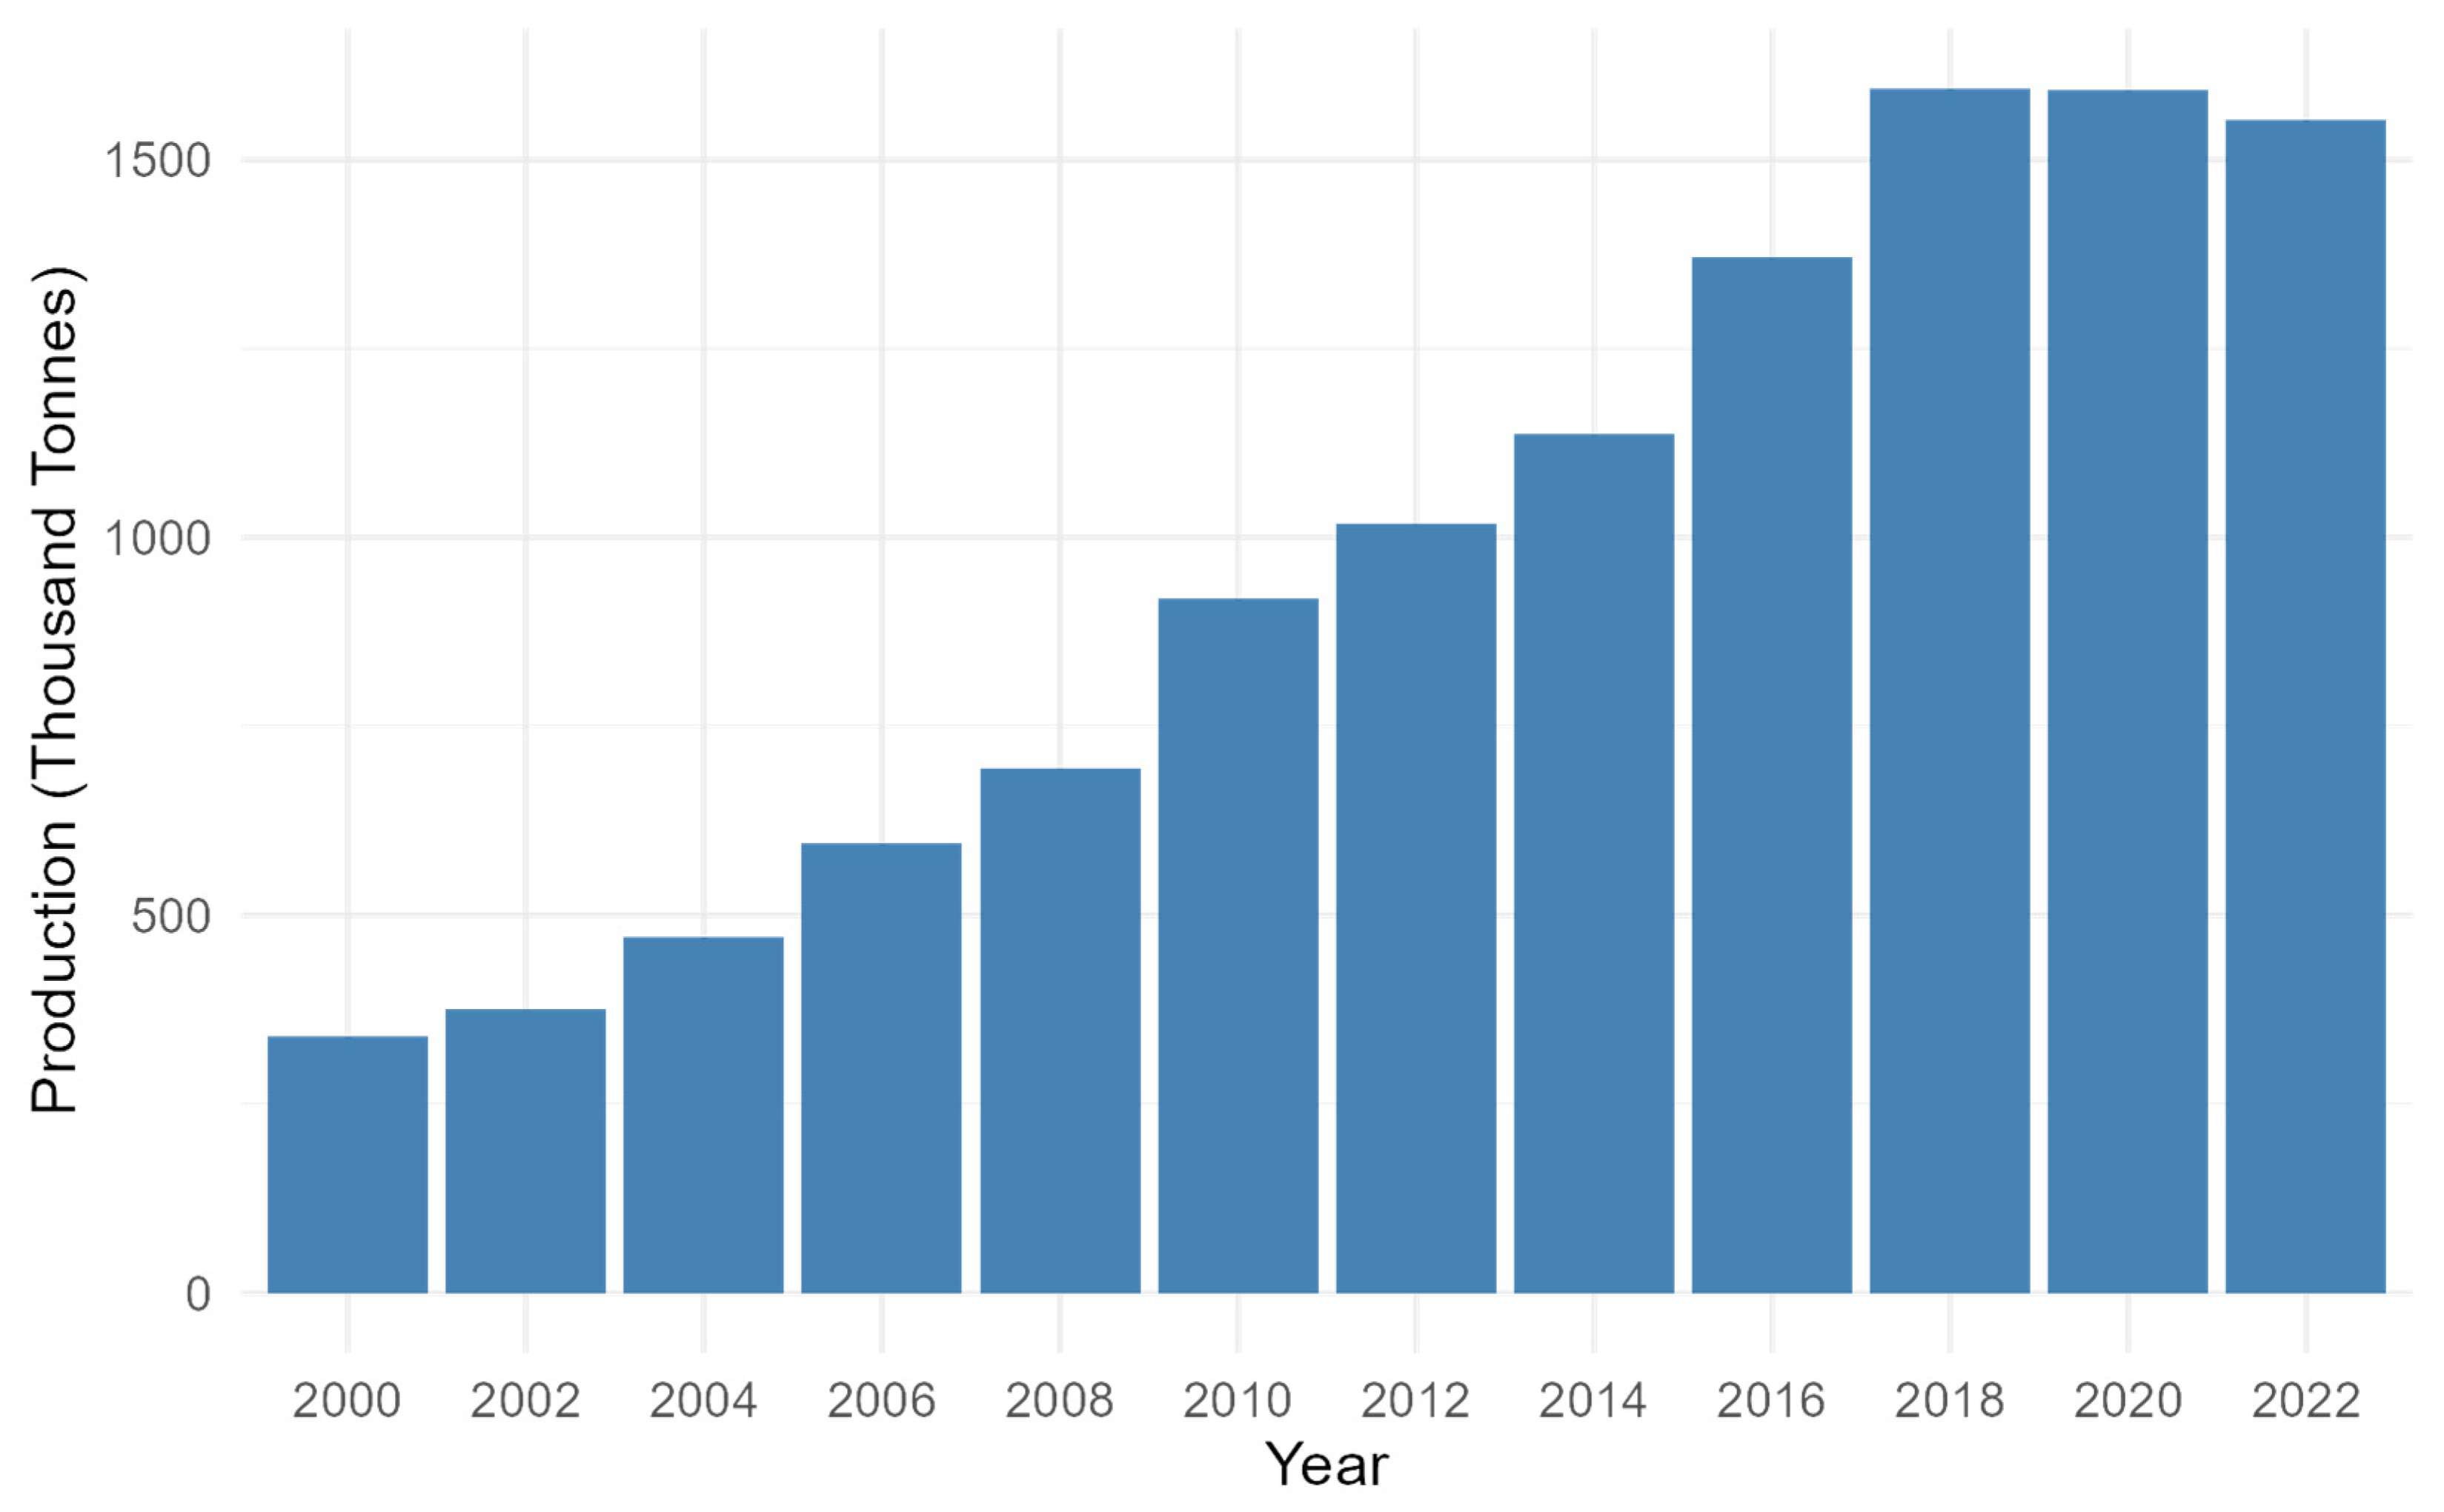
Figure 2.
Stochastic production frontier, modified from [30].
Figure 2.
Stochastic production frontier, modified from [30].
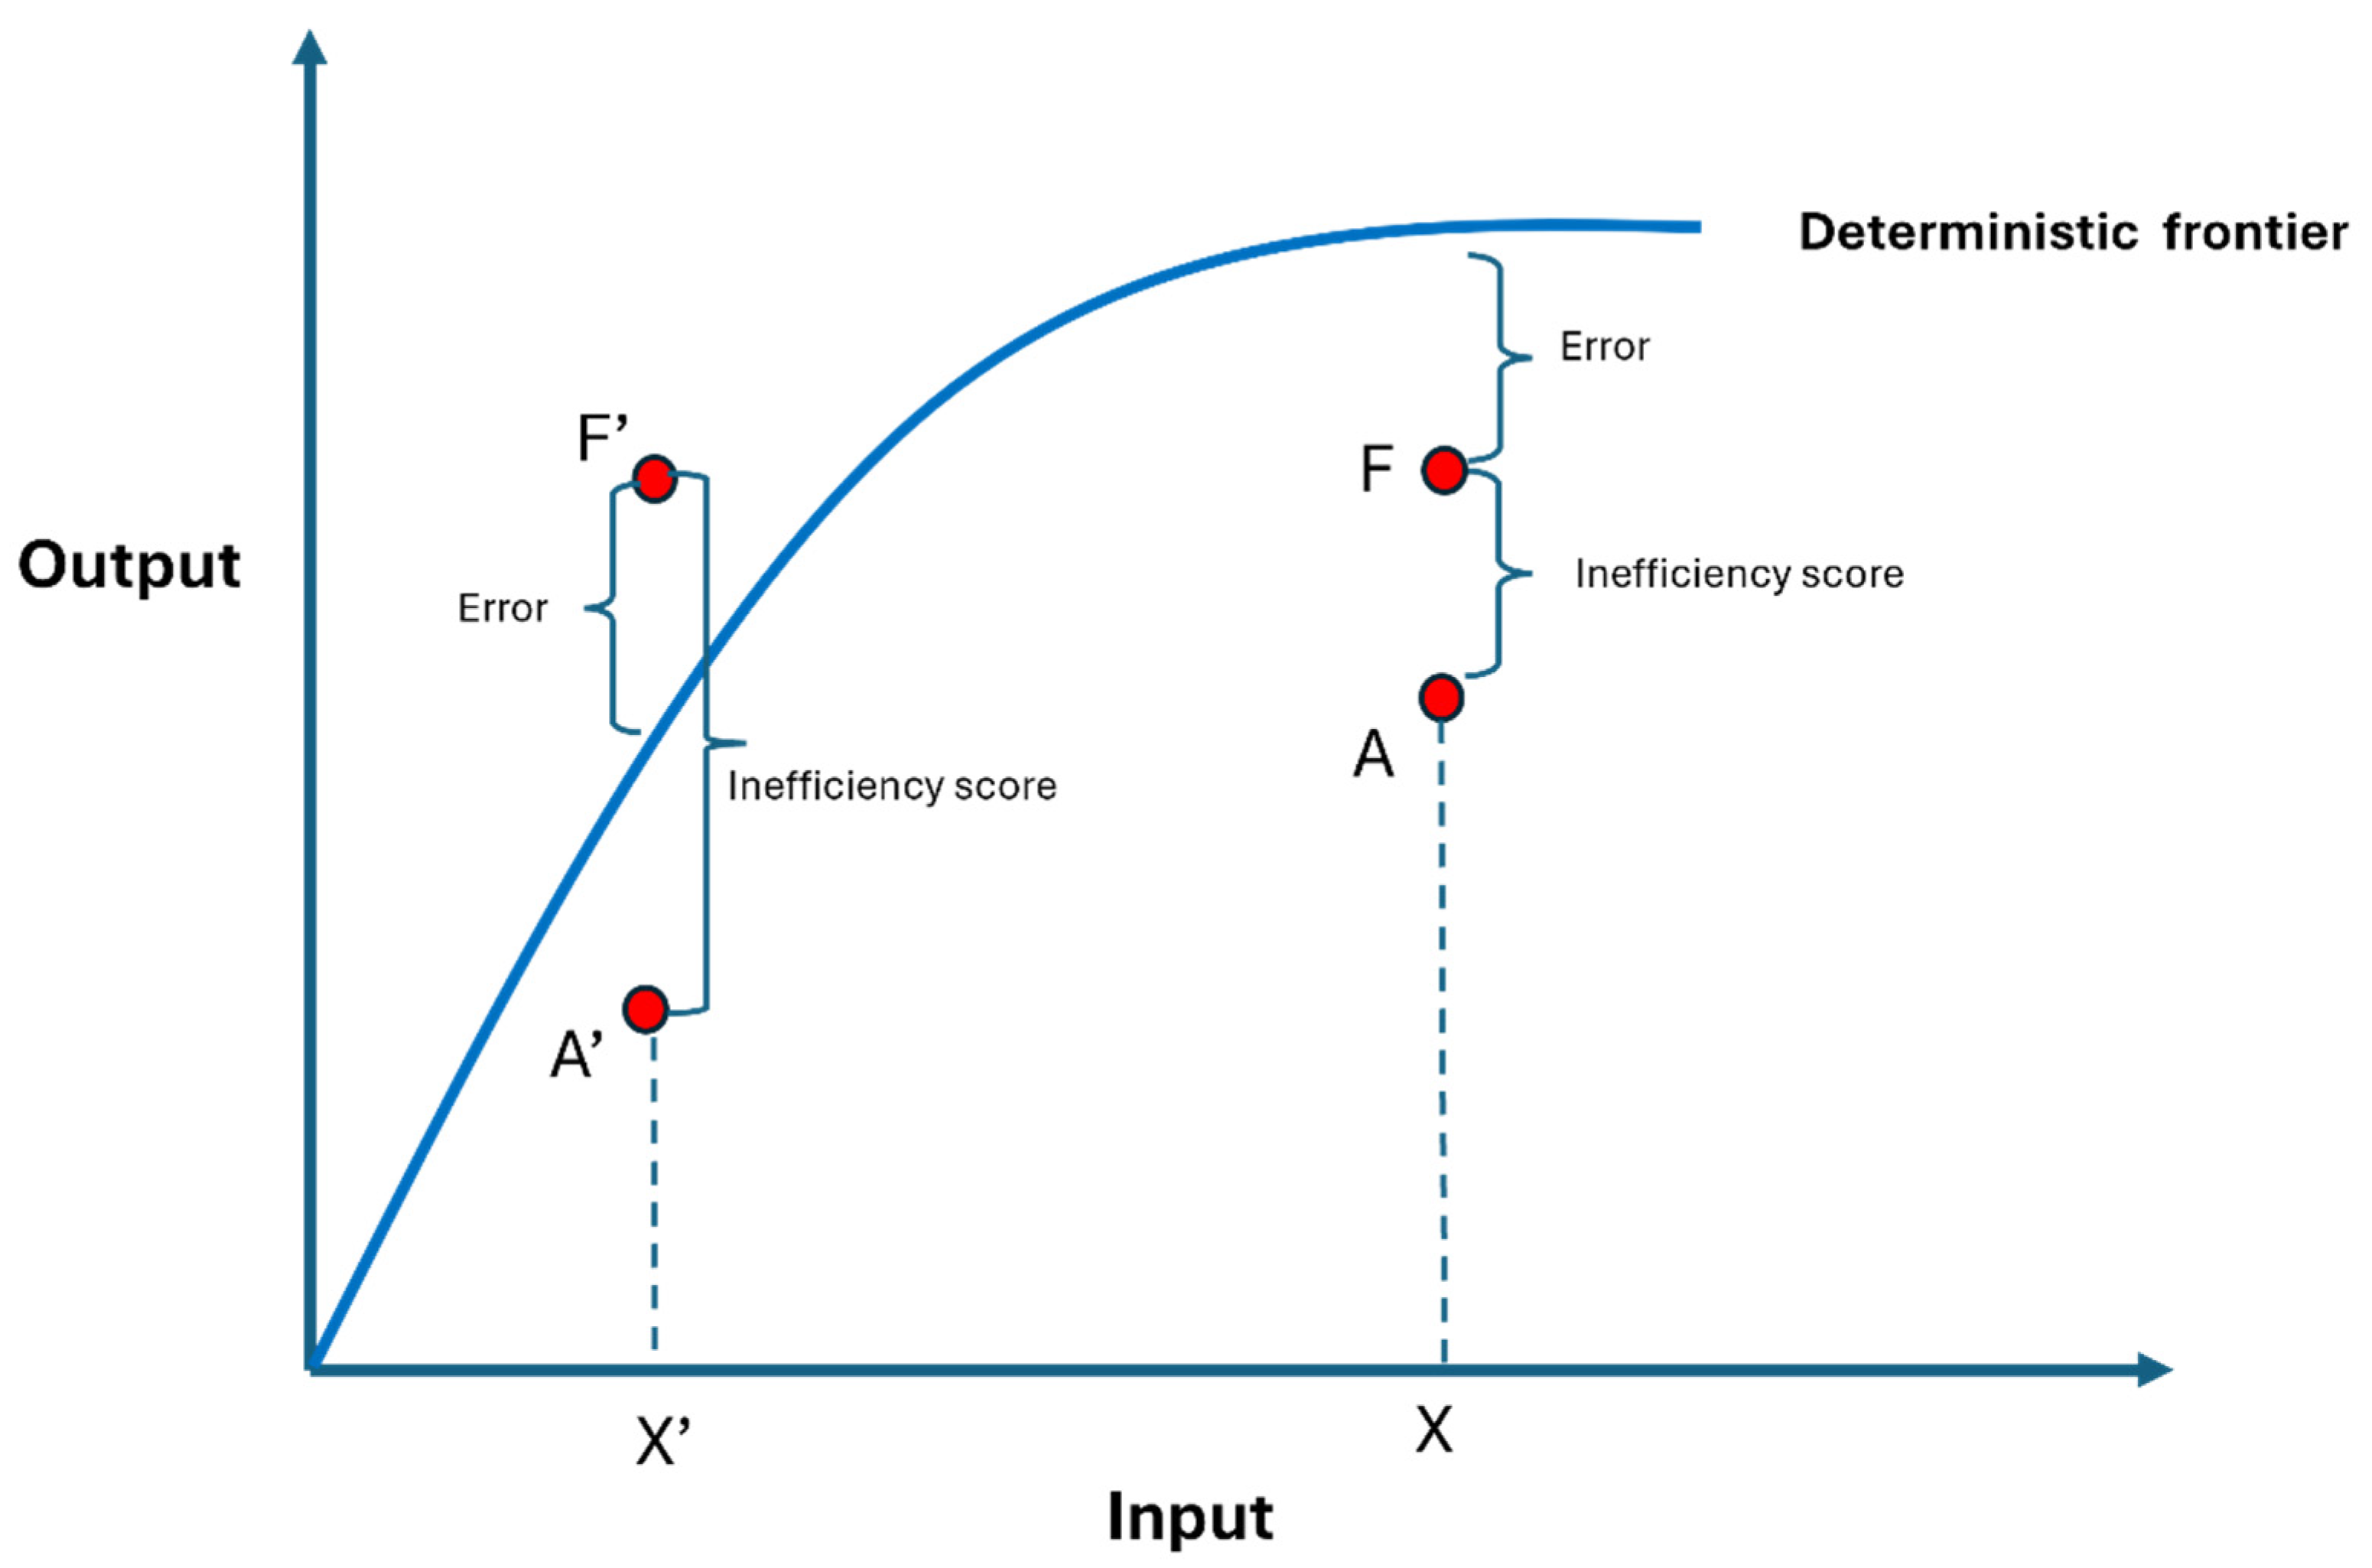
Figure 3.
Study area (in red) in Egypt.
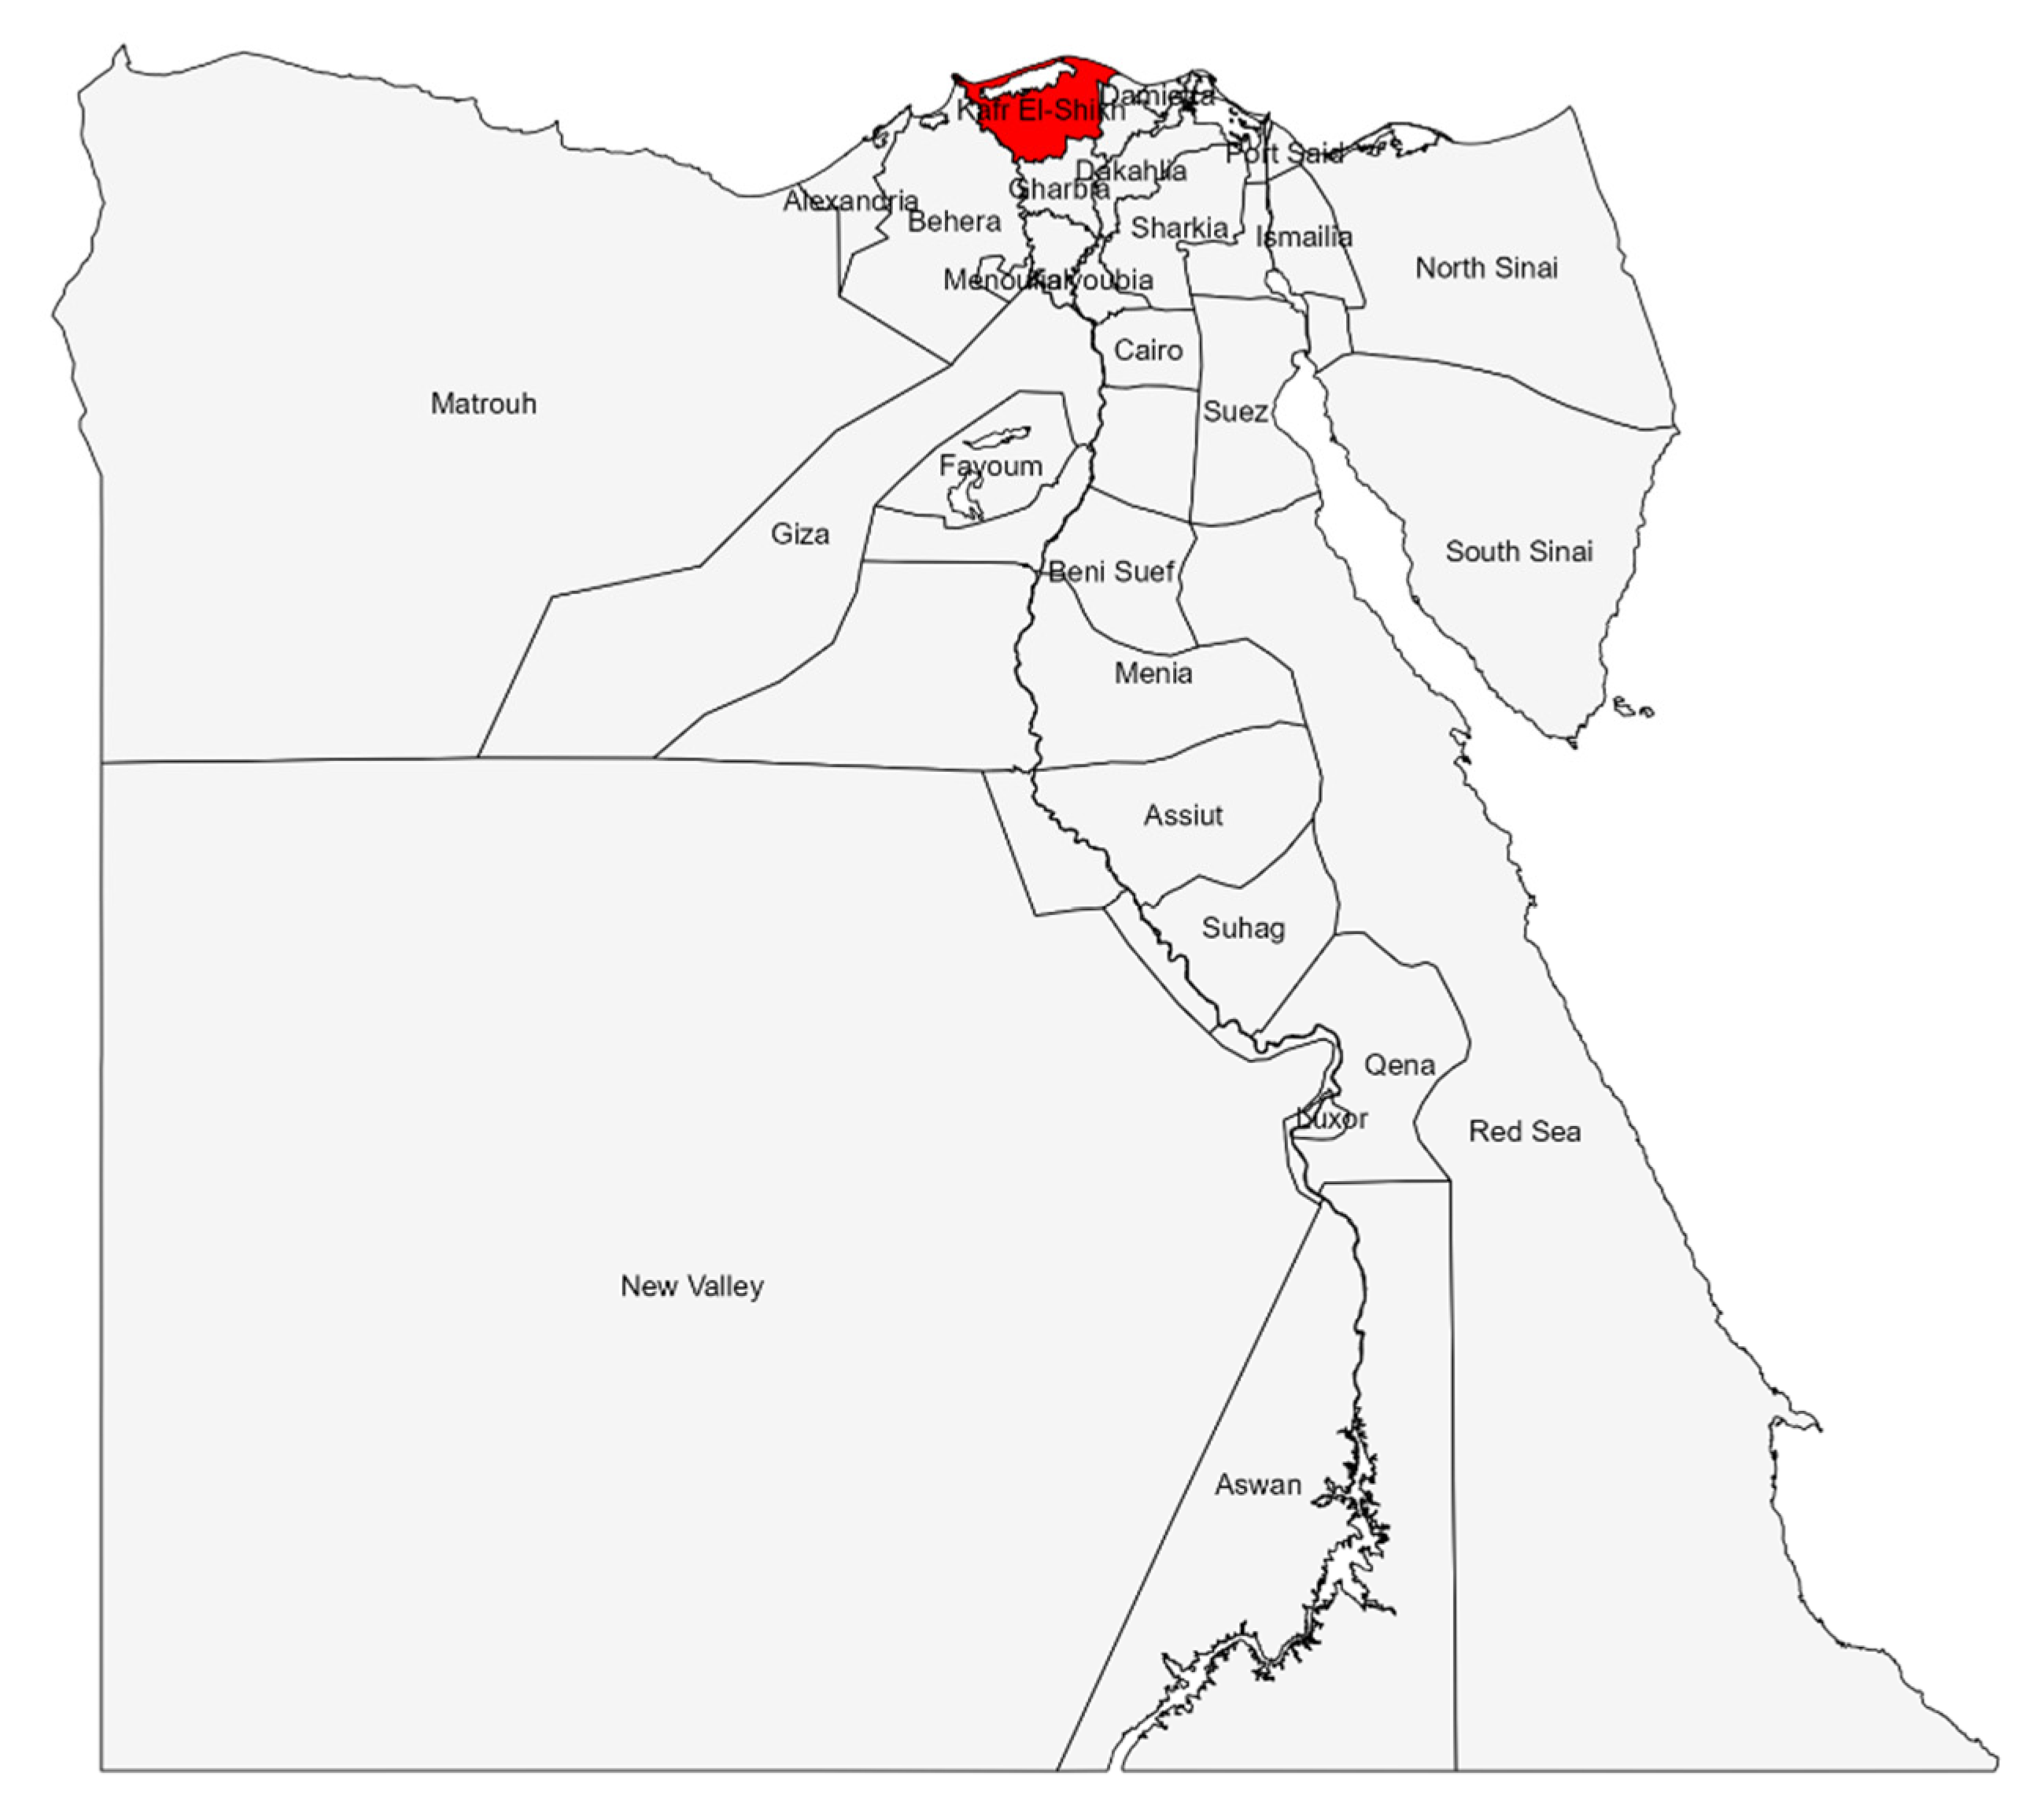
Table 1.
Summarized descriptive statistics of the variables used for the analysis.
| Variables | Unit | Mean | SD | Min | Max |
|---|---|---|---|---|---|
| Production model | |||||
| Output value (y) | EGP | 1,040,977 | 1,056,944 | 64,500 | 8,720,000 |
| Inputs (x) | |||||
| Seeds (x1) | EGP | 49,678 | 51,820 | 740 | 400,000 |
| Labor (x2) | EGP | 28,119 | 26,580 | 1,800 | 180,000 |
| Feed (x3) | Kg | 45,788 | 38,549 | 4,000 | 350,000 |
| Land (x4) | Hectare | 5.38 | 5.05 | 0.42 | 50.4 |
| Firm specific variables (z) | |||||
| Farmer’s age (z1) | Years | 43.33 | 10.90 | 18 | 75 |
| Number of species cultured (z2) | Levels | 2.18 | 0.75 | 1 | 4 |
| Education level (z3) | Levels | 2.31 | 1.28 | 0 | 6 |
| Farm age (z4) | Years | 11.88 | 8.07 | 1 | 50 |
Table 2.
Results of likelihood ratio test for trans-log and Cobb-Douglas specifications.
| Log likelihood value | ||
|---|---|---|
| Cobb Douglas | -57.779 | |
| Trans-log | -42.907 | |
| Test statistic | 29.742*** | |
| Decision | Reject the null hypothesis that trans log is not better than Cobb-Douglas | |
*** Significant at 1% level.
Table 3.
MLE of stochastic production frontier of trans-log approximation.
| Coefficient | SE | |
|---|---|---|
| (Intercept) | 11.78*** | 3.01 |
| ln (Feed) | -1.22** | 0.63 |
| ln (Labor) | 0.17 | 0.46 |
| ln (Seed) | 0.24 | 0.33 |
| ln (Land) | 0.93** | 0.43 |
| ln (Seed) x ln (Seed) | -0.03 | 0.04 |
| ln (Feed) x ln (Feed) | 0.18* | 0.1 |
| ln (Land) x ln (Land) | 0.07 | 0.05 |
| ln (Labor) x ln (Labor) | 0.03 | 0.06 |
| ln (Feed) x ln (Labor) | -0.005*** | 0.06 |
| ln (Feed) x ln (Seed) | 0.06** | 0.05 |
| ln (Feed) x ln (Land) | -0.26 | 0.06 |
| ln (Labor) x ln (Seed) | -0.05 | 0.03 |
| ln (Labor) x ln (Land) | 0.1** | 0.05 |
| ln (Seed) x ln (Land) | 0.07 | 0.03 |
| ) | 0.63*** | 0.09 |
| Sigma squared() | 0.13 *** | 0.02 |
| Average Technical efficiency (ATE) | 0.80 | |
***, **, * Significant at 1%, 5% and 10% levels, respectively; SE: Standard error.
Table 4.
Input elasticities of production.
| Input | Average elasticity | SE |
|---|---|---|
| Feed | 0.85*** | 0.04 |
| Labor | 0.07*** | 0.026 |
| Seed | 0.14*** | 0.024 |
| Land | 0.03 | 0.042 |
***, **, * Significant at 1%, 5% and 10% levels, respectively
Disclaimer/Publisher’s Note: The statements, opinions and data contained in all publications are solely those of the individual author(s) and contributor(s) and not of MDPI and/or the editor(s). MDPI and/or the editor(s) disclaim responsibility for any injury to people or property resulting from any ideas, methods, instructions or products referred to in the content. |
© 2025 by the authors. Licensee MDPI, Basel, Switzerland. This article is an open access article distributed under the terms and conditions of the Creative Commons Attribution (CC BY) license (http://creativecommons.org/licenses/by/4.0/).
Copyright: This open access article is published under a Creative Commons CC BY 4.0 license, which permit the free download, distribution, and reuse, provided that the author and preprint are cited in any reuse.


