Submitted:
06 January 2025
Posted:
08 January 2025
You are already at the latest version
Abstract
Object detection in low-visibility environments is a critical challenge, particularly for applications like autonomous vehicles and safety monitoring systems. In this work, we explore advanced detection techniques under adverse conditions, leveraging the YOLO11n.pt model for its high performance and real-time capabilities. A com- prehensive review of related works highlights significant progress in the field, such as the use of Visibility Context for robust 3D recognition and thermal imaging for im- proved accuracy during adverse weather. However, these methods often face limi- tations in terms of computational complexity, sensitivity to environmental factors, or reliance on specific hardware. By adopting YOLO11n.pt, we aim to overcome these challenges, providing a solution that maintains high precision and adaptability in dynamic and low-visibility settings. Preliminary results demonstrate the model’s potential in detecting objects accurately even under rain, fog, and poor lighting con- ditions, paving the way for safer and more efficient object recognition systems.
Keywords:
Introduction
Related Work

| Article | Méthode | Précision | Avantages | Inconvénients |
|---|---|---|---|---|
| 3D Object Recognition in Range Images Using Visibility Context | Visibility Context | Précision de 91% pour 10 objets | - Meilleure précision et temps d’exécution plus rapide que d’autres méthodes - Résistance à l’occlusion et à l’encombrement | - Complexité élevée pour des images denses - Rejet possible de bonnes correspondances |
| Evaluation of Detection Performance for Safety-Related Sensors in Low-Visibility Environments | Indicateur MOT | Sensibilité variable selon capteurs (presque 80 % moyenne) | - Évaluation précise de la détection, indépendante de la perception humaine - Compatibilité avec MOR | - Limité aux capteurs optiques - Dépendance au matériel et aux algorithmes |
| Object Detection Under Rainy Conditions for Autonomous Vehicles | Faster R-CNN | Véhicule: 67.84%, Piéton: 32.58% | - Efficacité computationnelle et précision améliorée - Robustesse dans des environnements complexes | - Temps d’inférence relativement lent - Sensibilité aux conditions environnementales difficiles |
| Thermal Object Detection in Difficult Weather Conditions Using YOLO | YOLOv3 | Météo claire: 97.85%, Pluie: 98.08% | - Détection en temps réel avec précision élevée - Adaptabilité aux conditions variées | - Sensibilité aux conditions d’éclairage - Difficulté avec les petites cibles |
Proposed Method
Algorithm Explanation
- Real-Time Performance : YOLOv11 is designed to operate at high speed, which is essential for applications requiring real-time decision-making, such as autonomous vehicles or surveillance systems. Its fast inference time allows for efficient processing of video streams or camera feeds.
- Accuracy in Complex Environments : YOLOv11 is particularly suited for object detection in challenging conditions like fog, rain, or cluttered environments. With its advanced training and optimization, it ensures high accuracy, making it ideal for applications where safety is paramount.
- Scalability and Flexibility : YOLOv11 can detect a wide range of objects in an image, making it versatile for various tasks. Its ability to handle objects of different sizes and orientations further enhances its effectiveness in real-world scenarios.
- Optimized for Hardware Efficiency : YOLOv11 is optimized to be lightweight and computationally efficient, ensuring good performance even on devices with limited resources. This is especially important when deploying it on edge devices or in environments where computing resources are constrained.
- represents the confidence loss, measuring the difference between the probability of an object in a grid cell and the ground truth.
- is the classification loss, which evaluates the model’s ability to correctly classify the detected objects.
- is the localization loss, which calculates the difference between the predicted and actual bounding boxes.
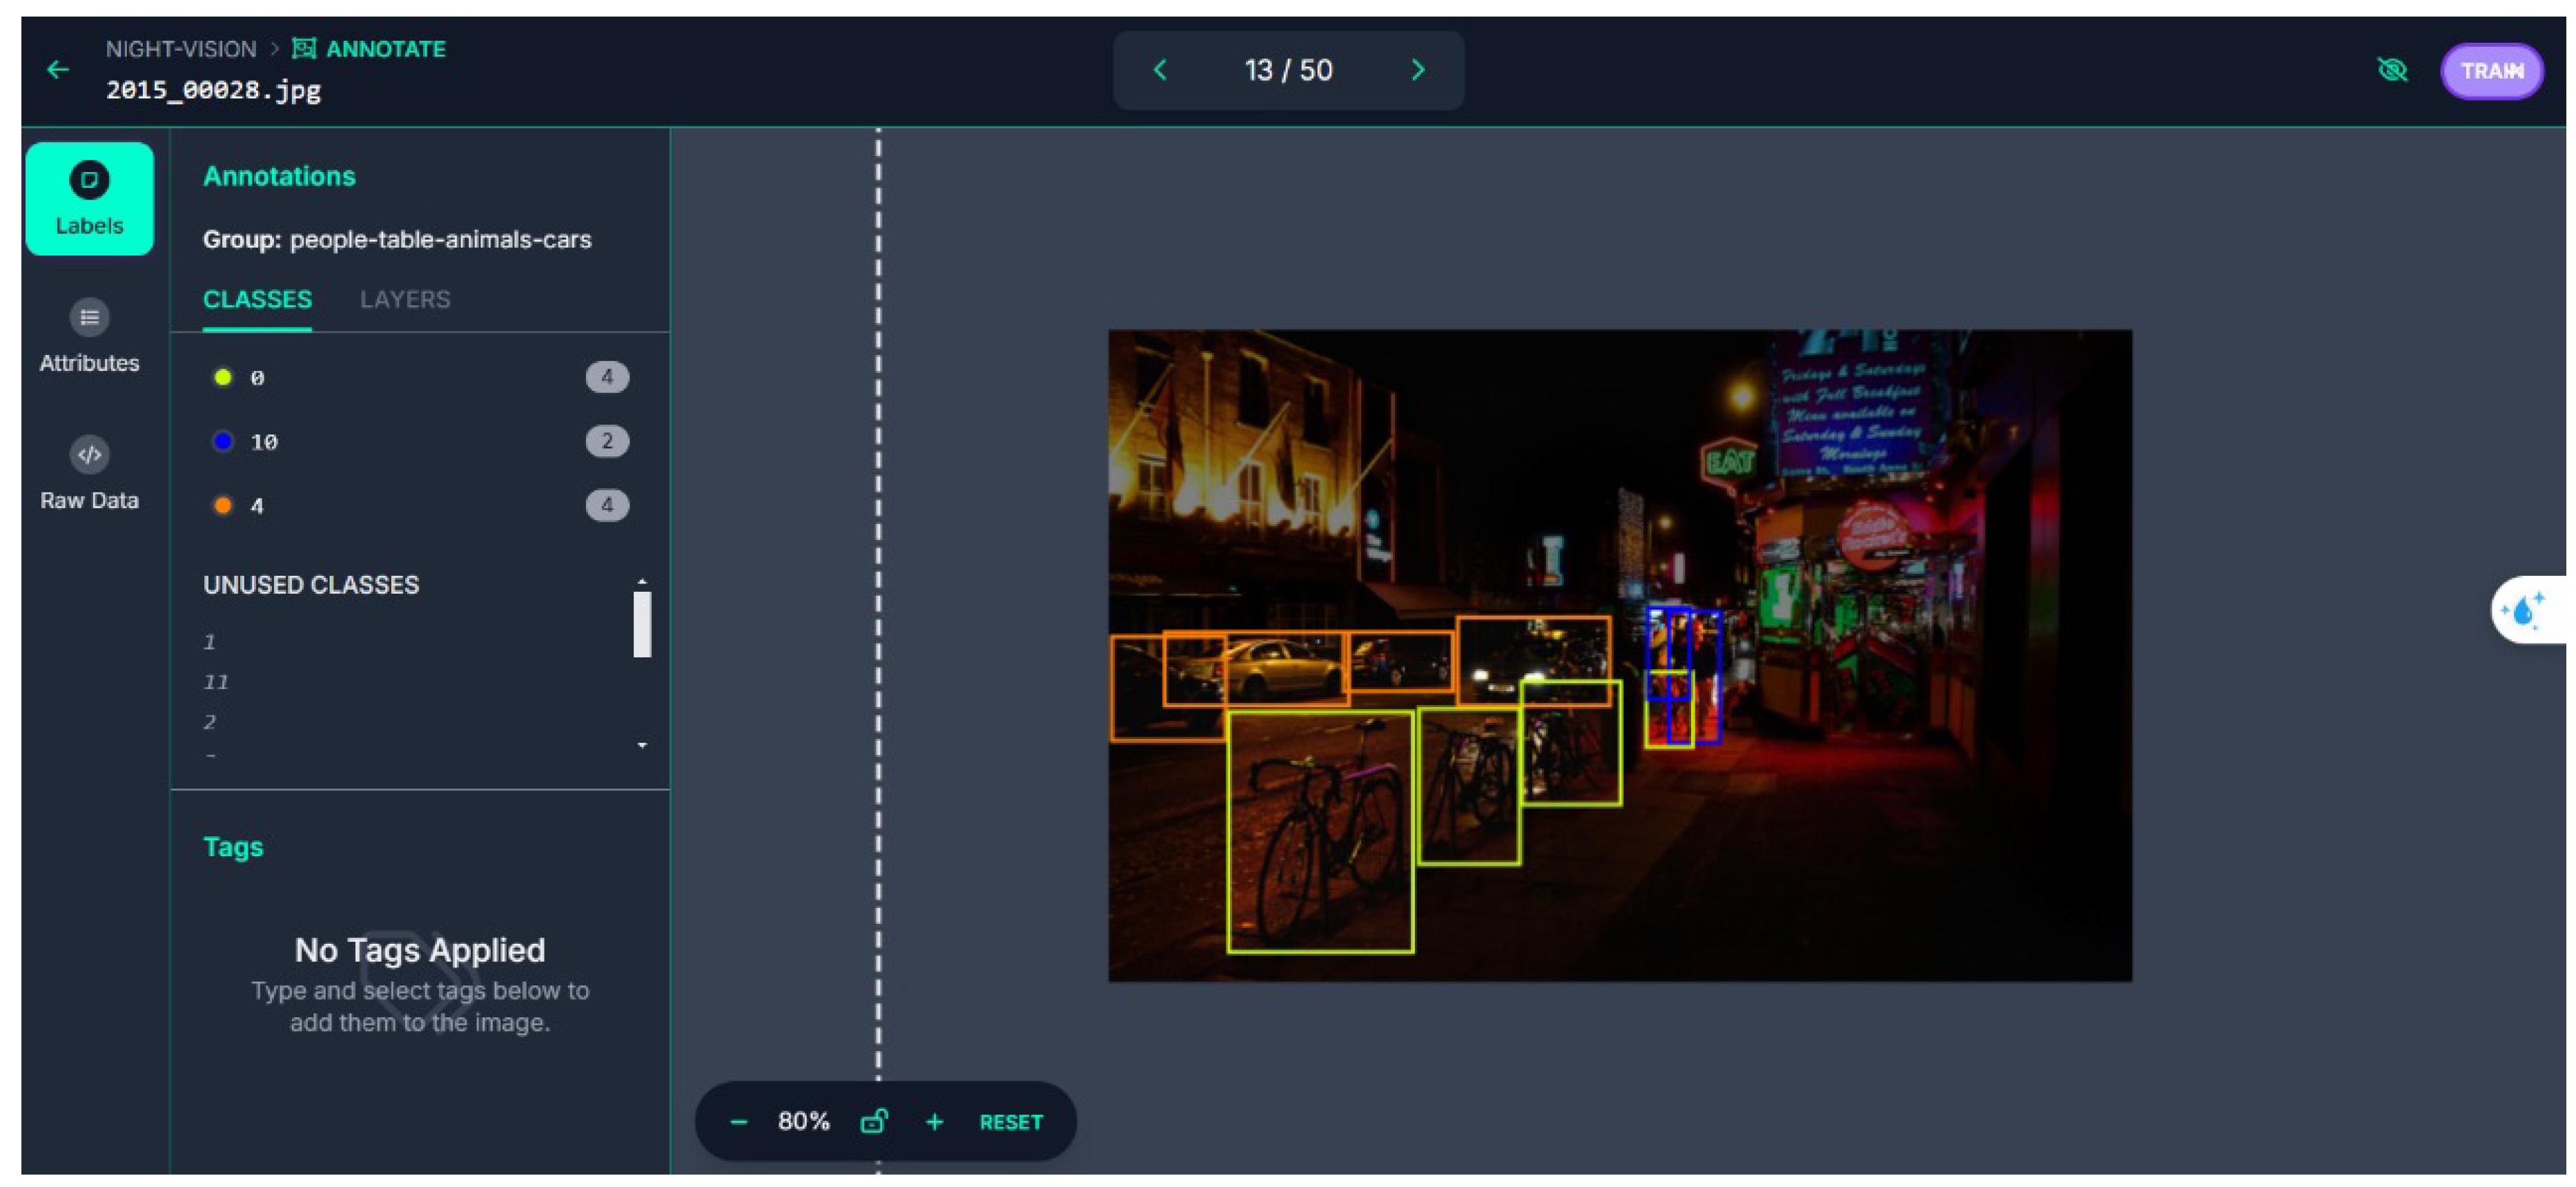
Dataset Description
- Person – This class includes images of people under various conditions, from fully illuminated to low-light scenarios.
- Car – Cars are included in several variations, captured from different angles and under varying lighting conditions.
- Truck – Trucks, which are larger and can be harder to detect in dim light, form a key part of the dataset.
- Bicycle – Bicycles are also included, focusing on smaller and more dynamic objects.
- Motorbike – Motorbikes, which require precise detection due to their smaller size, are part of the dataset.
- Bus – Larger vehicles such as buses, which can be partially occluded or in low-visibility conditions, are included as well.
- Traffic light – Traffic lights, critical for navigation in autonomous systems, are included to test the model’s ability to recognize traffic-related objects.

The Code Source
The Explanation of the Choice
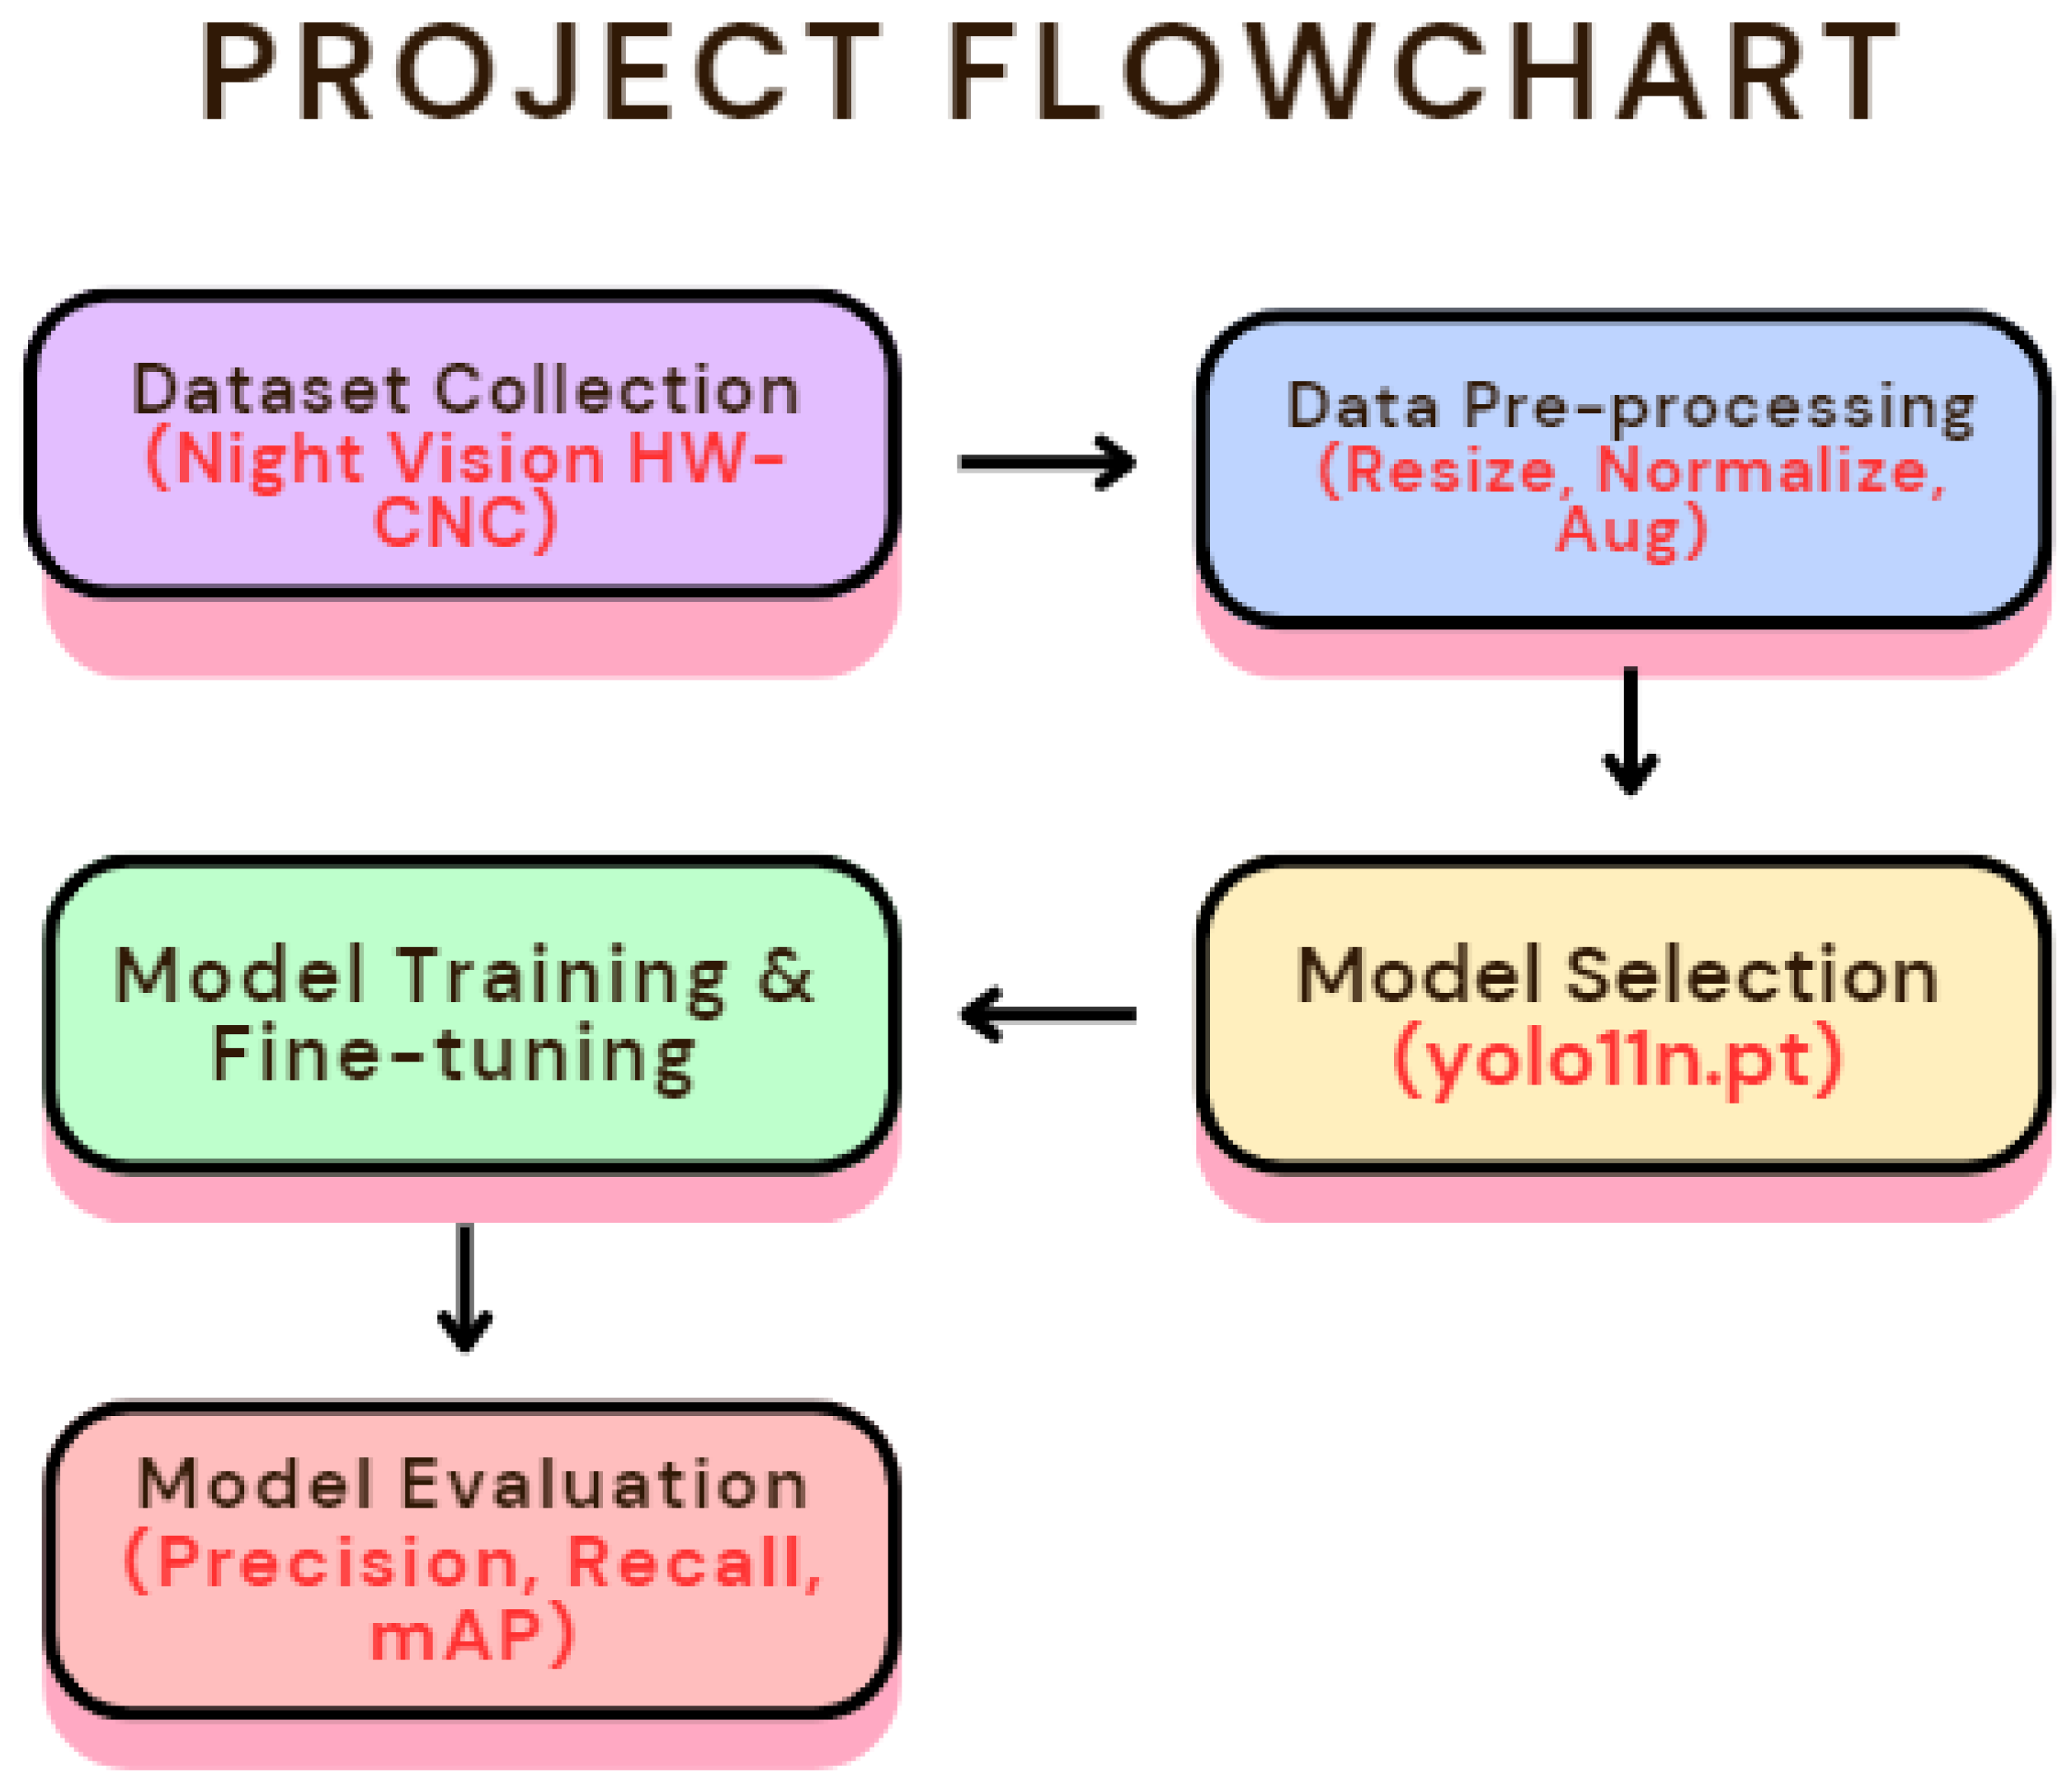
The Flowchart
Hardware Configuration
- Graphics Processing Unit (GPU): We utilized Kaggle’s high-performance GPU instances, specifically the NVIDIA Tesla P100 or similar, which significantly accelerated the training of the YOLOv11 model. GPUs are essential for deep learning tasks as they handle the parallel computation of complex operations like convolution and backpropagation, enabling faster model training.
- Central Processing Unit (CPU): Kaggle provided robust CPU instances for managing system tasks such as data pre-processing and model evaluation. The CPUs worked alongside the GPU to handle non-parallel tasks efficiently.
- Memory (RAM): Kaggle instances come with up to 16GB of RAM, which is sufficient for handling large datasets during model training and inference, ensuring smooth performance without bottlenecks.
- Storage: The storage provided by Kaggle is designed for fast access to datasets, essential for handling large-scale image data used for training the YOLOv11 model. Kaggle’s cloud infrastructure allowed us to easily store and access our dataset, speeding up the training process.
- Operating System and Software: The system ran on a Linux-based environment, optimized for running Python-based deep learning libraries such as PyTorch. Kaggle also provides a seamless integration with libraries such as OpenCV and Ultralytics, which were essential for our project.
Results
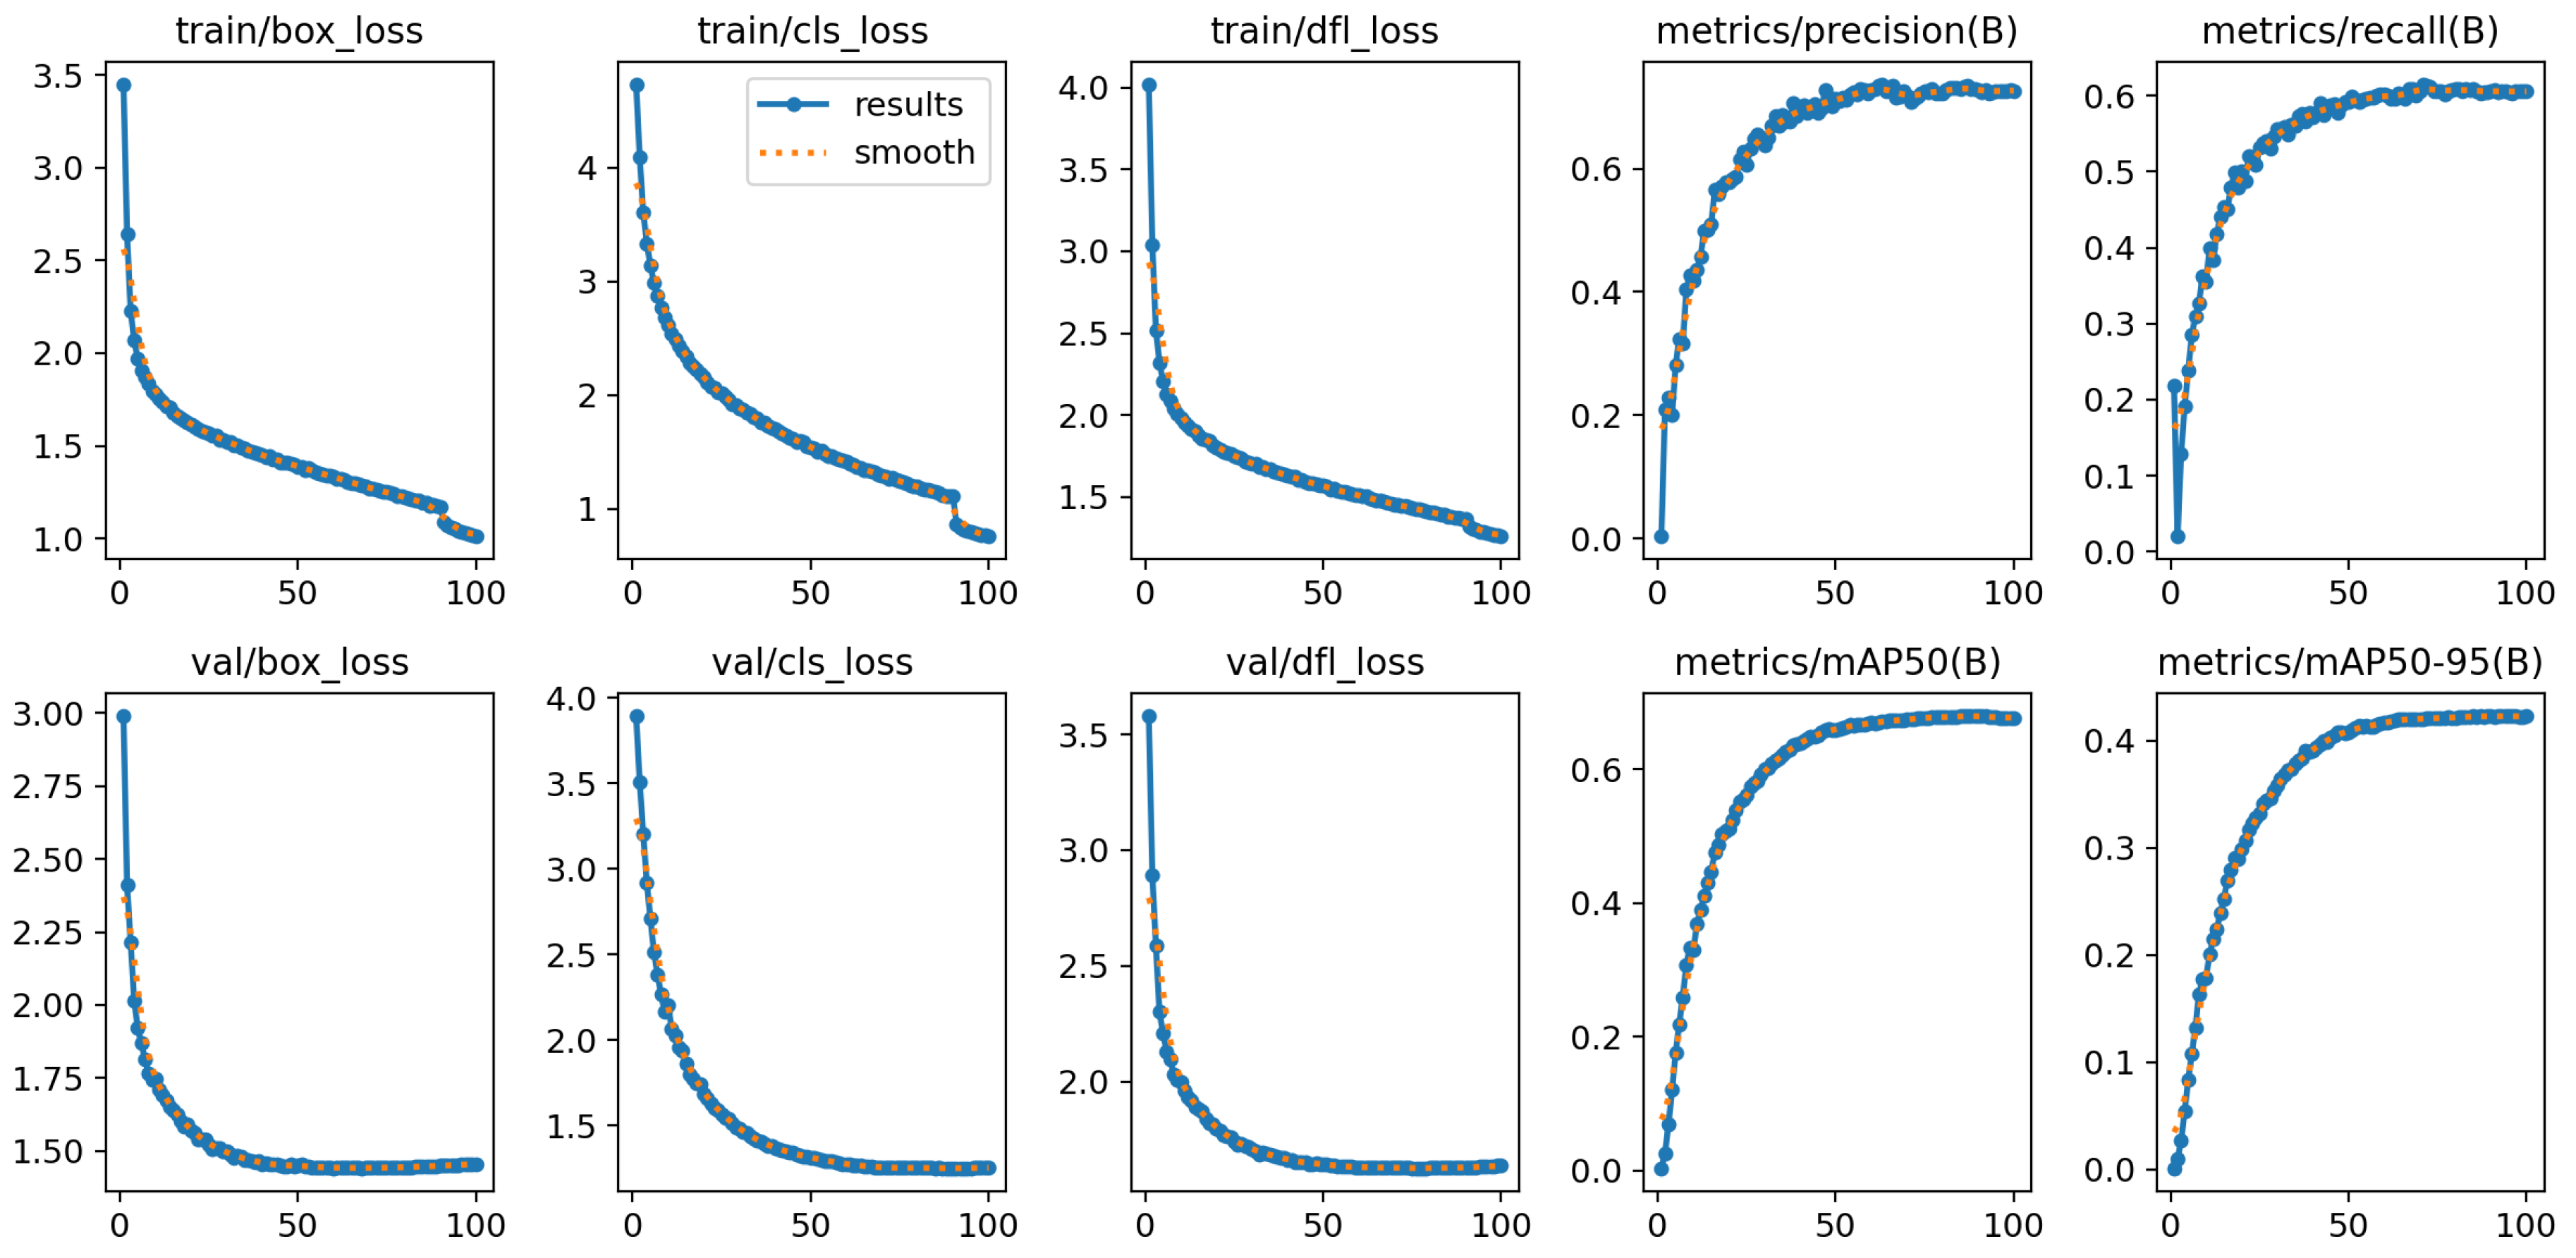
0.0.1. Model Performance Metrics
- Accuracy: The accuracy of the model was computed by comparing the predicted labels to the ground truth labels. The model showed an overall high accuracy, which is expected given the powerful YOLOv11 architecture.
- Precision and Recall: Precision measures the model’s ability to correctly identify positive instances, while recall indicates the model’s ability to detect all relevant instances. Both metrics were found to be strong, indicating that the model performs well in detecting objects in challenging conditions.
- F1 Score: The F1 score, a harmonic mean of precision and recall, was computed to balance the trade-off between the two. This metric showed an impressive result, suggesting that the model maintains a good balance between detecting true positives and minimizing false positives and negatives.
0.0.2. Visualizations Of Model Results
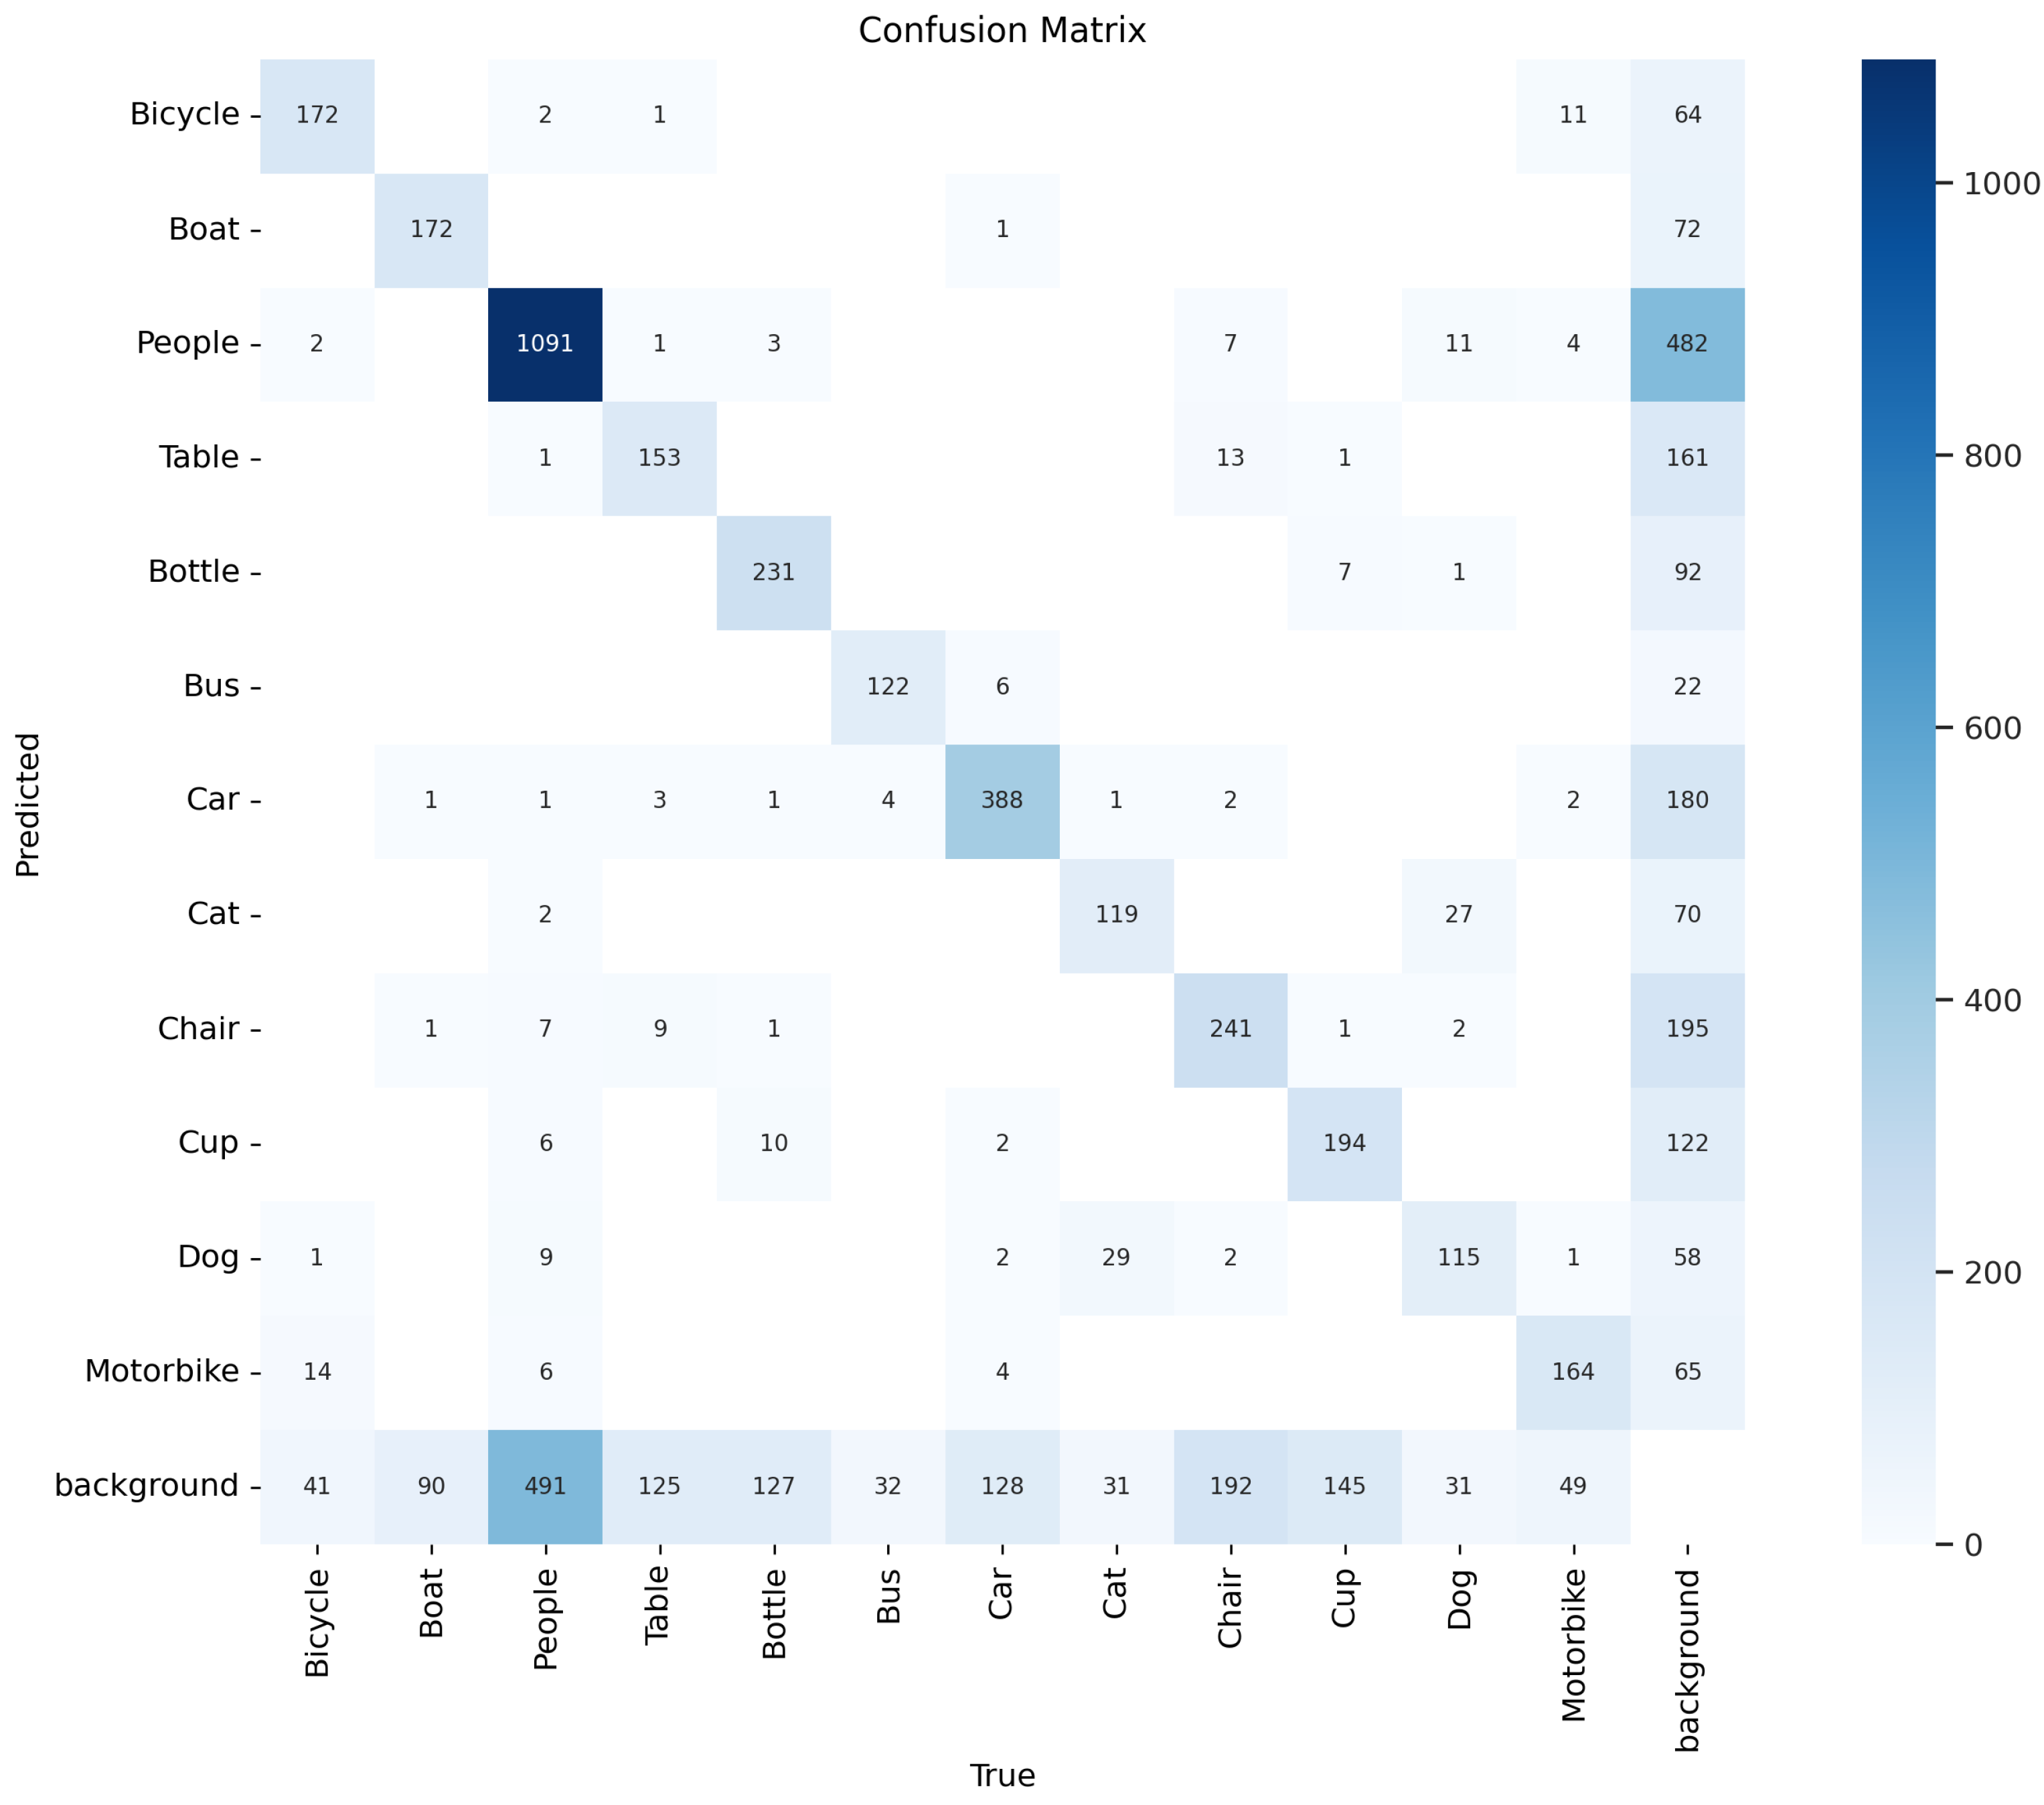
- Confusion Matrix: The confusion matrix illustrates the classification performance of the model, showing the number of true positives, false positives, true negatives, and false negatives. This matrix allows us to see which classes the model misclassifies and which are detected most accurately.
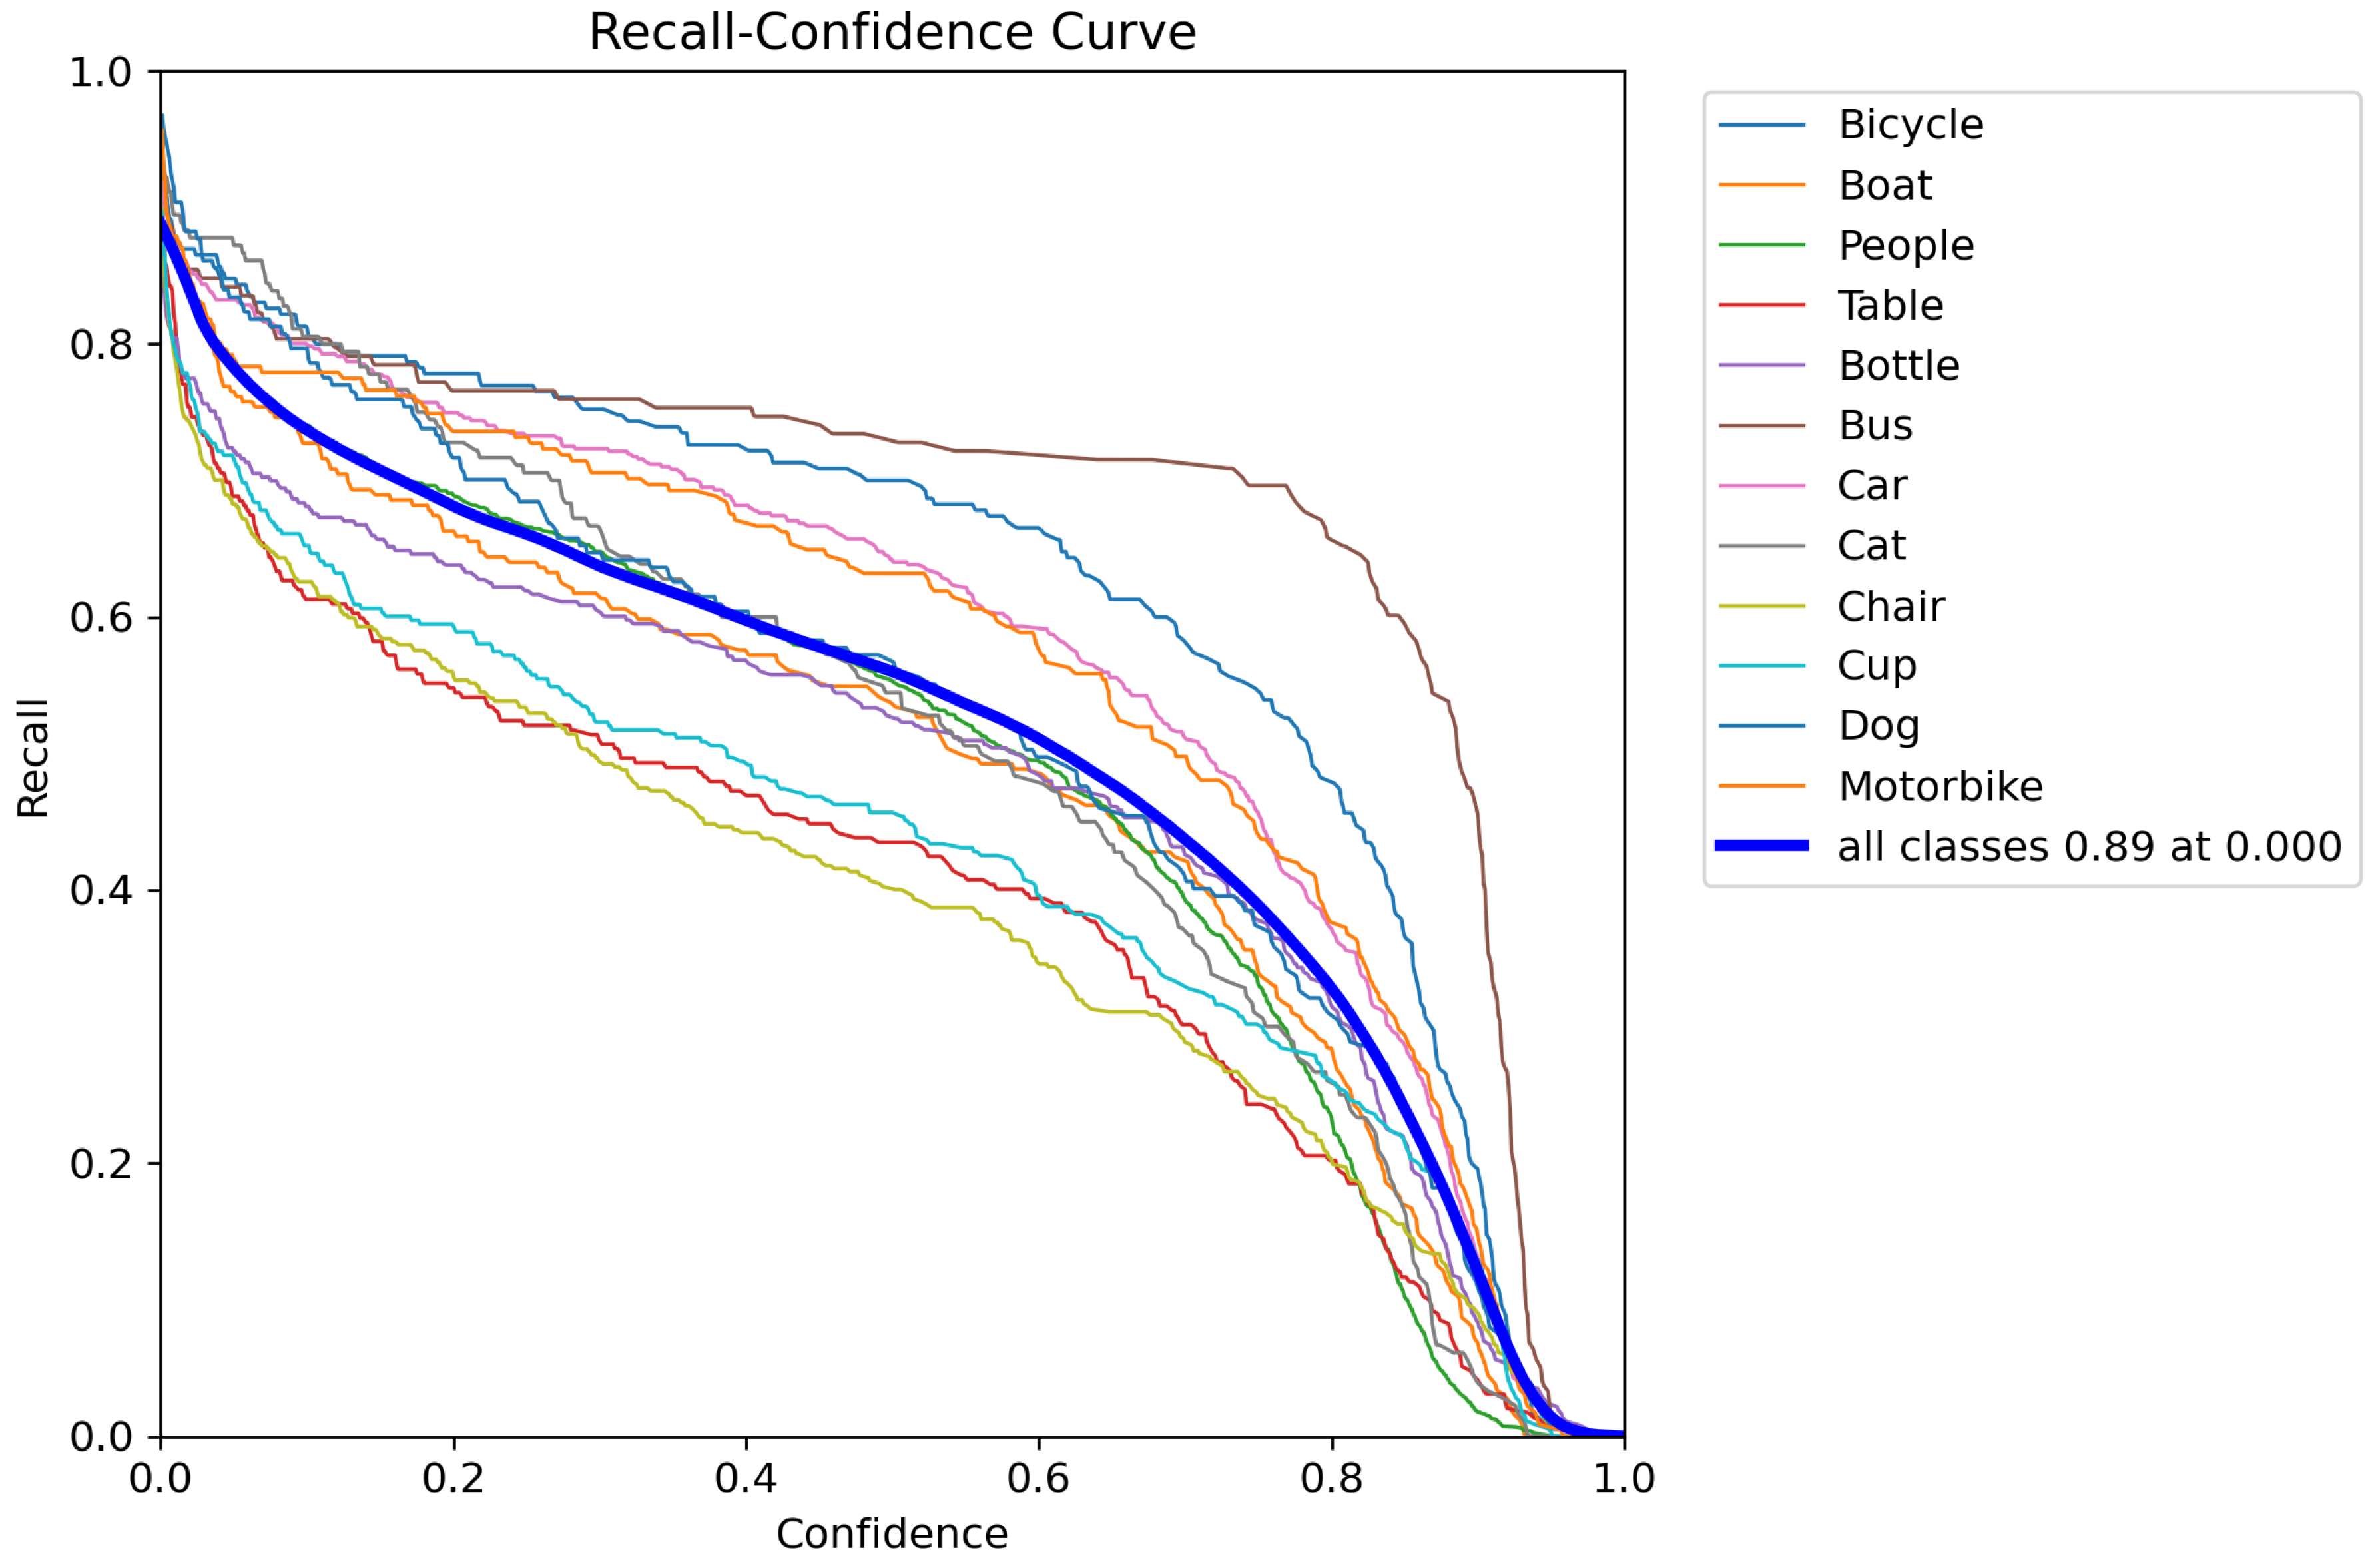
- Recall-Confidence Curve (R-curve): The Recall-Confidence Curve plots the recall (True Positive Rate) against the confidence score, which represents the model’s certainty in its predictions. As the threshold for classification is adjusted, the recall value changes, indicating how many true positives are identified at different confidence levels. This curve is useful for understanding the trade-off between recall and confidence in predictions, and helps in selecting an optimal threshold that maximizes recall while maintaining a reasonable confidence level. Our model’s R-curve indicates that it can maintain high recall values even at lower confidence thresholds, making it suitable for applications where identifying all positive instances is crucial.
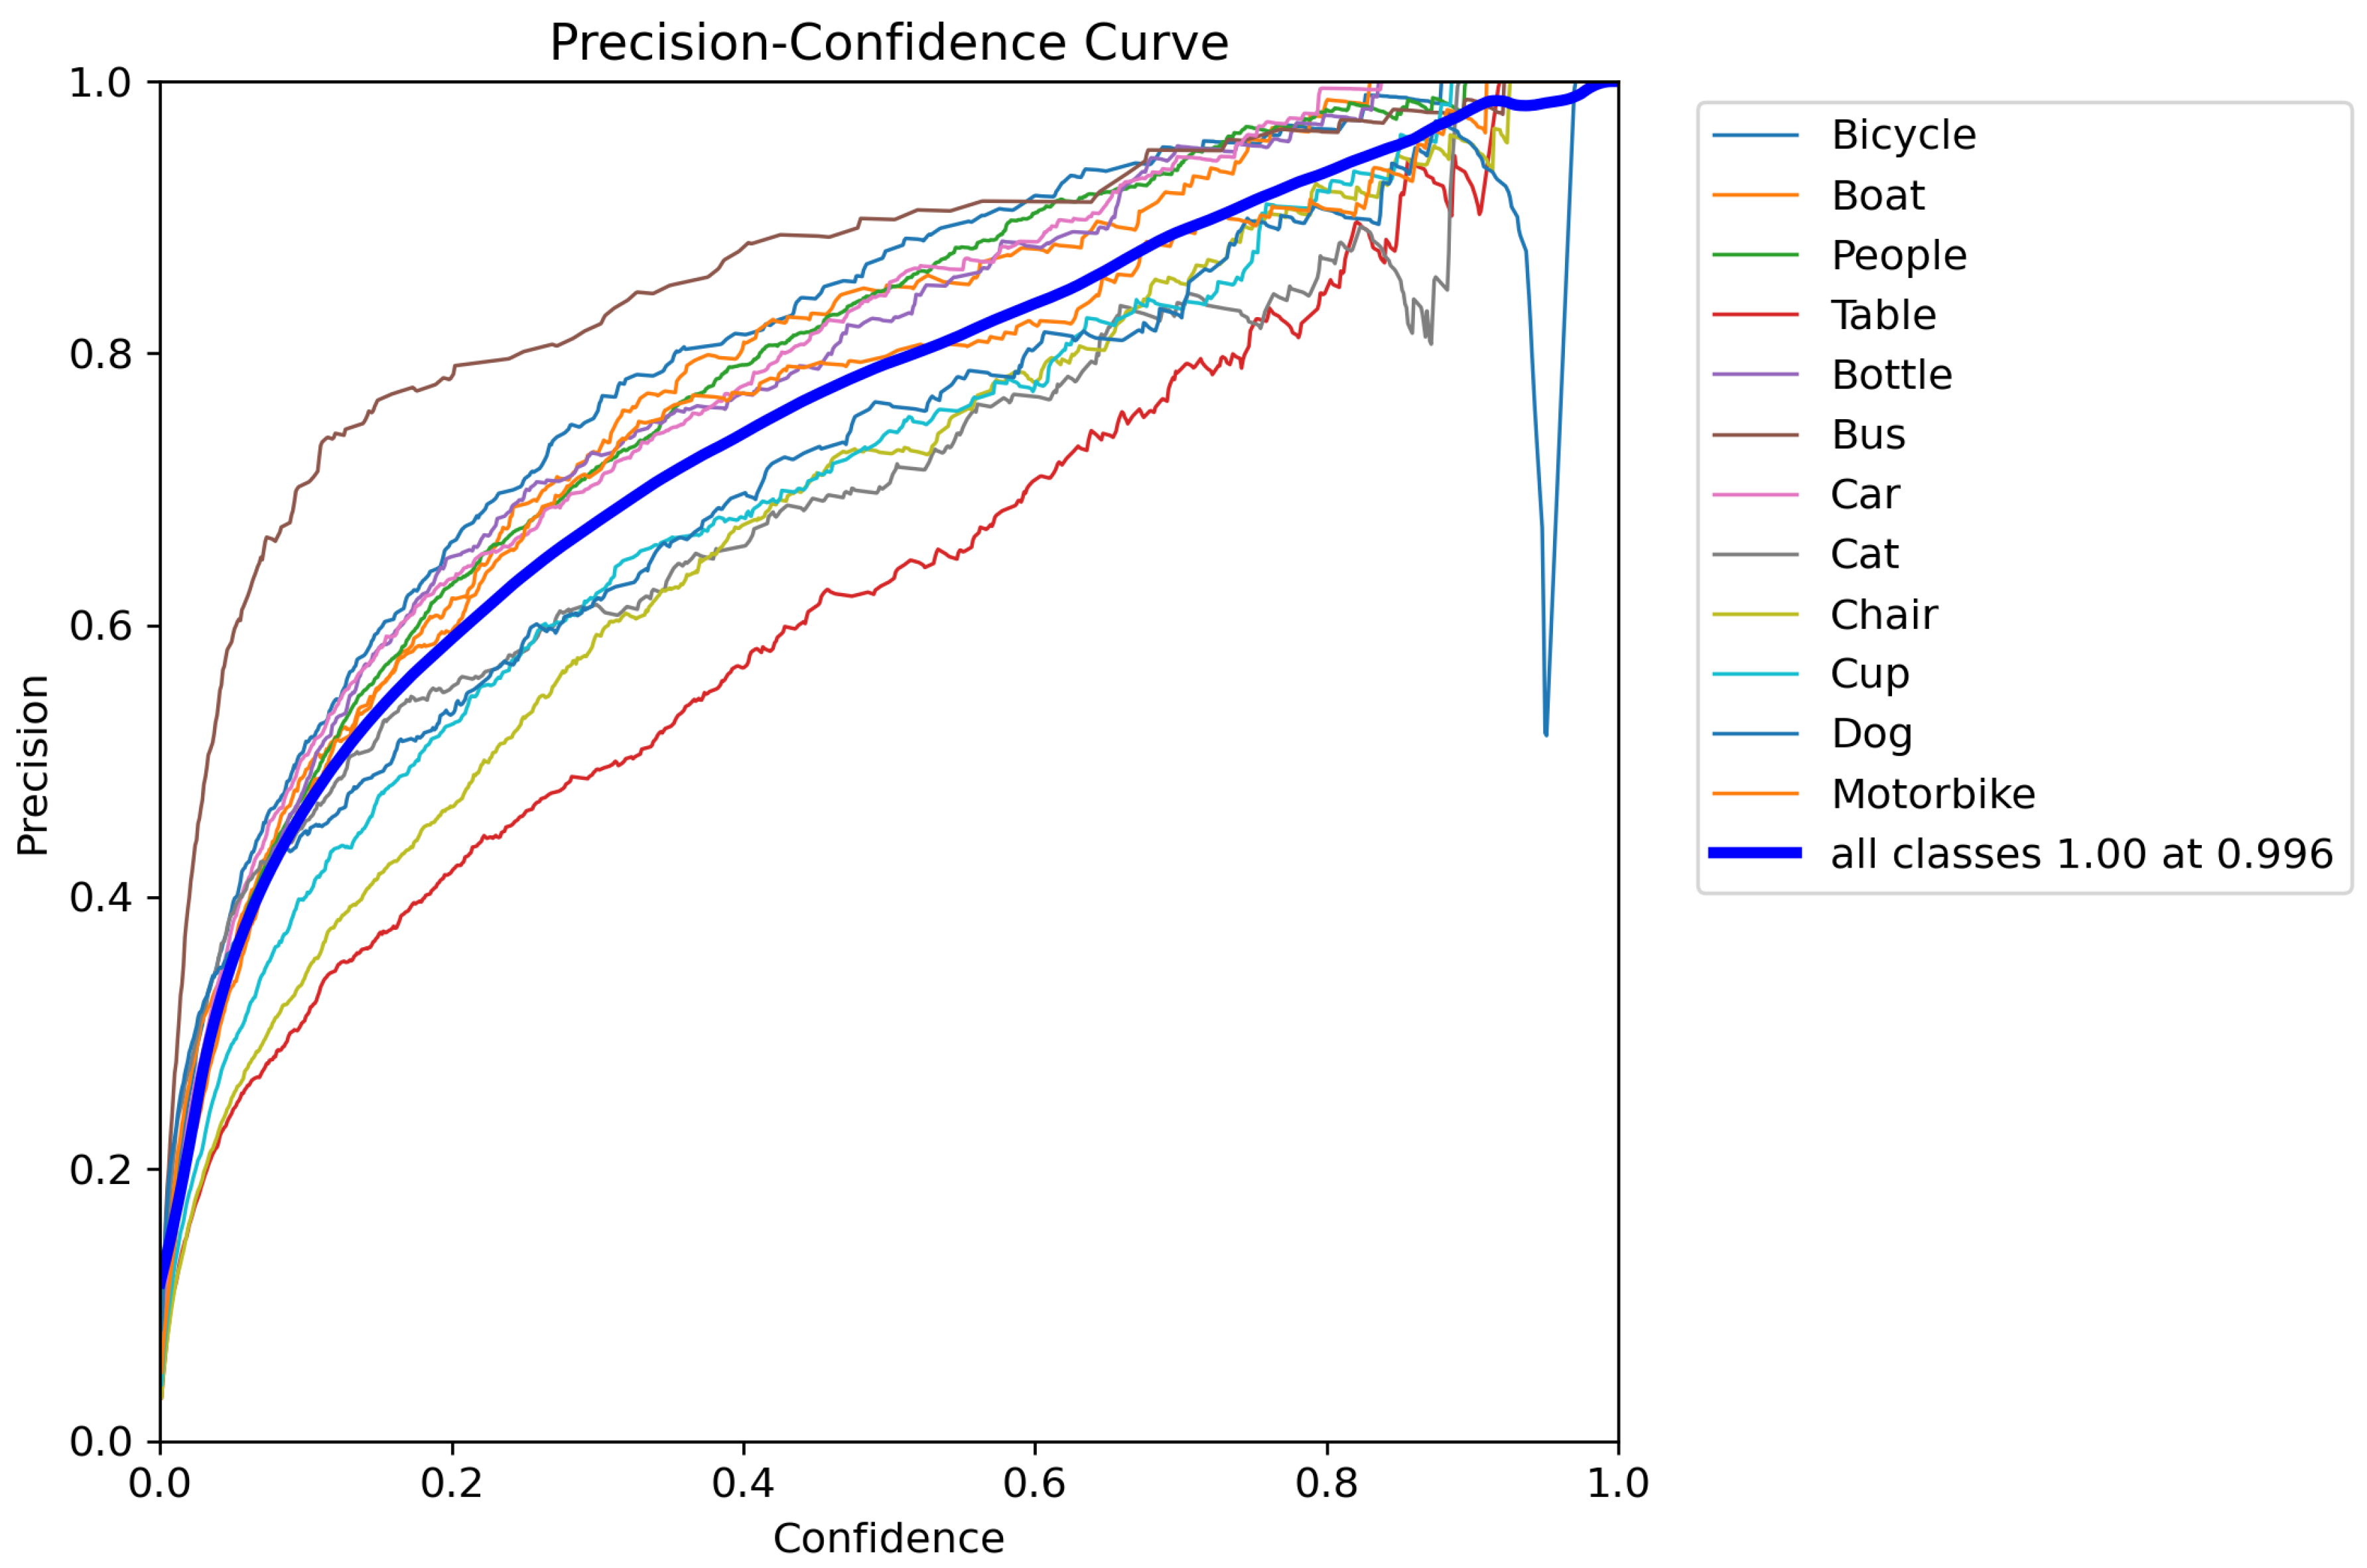
- Precision-Confidence Curve (P-curve): The Precision-Confidence Curve, or P-curve, plots precision against recall at various confidence thresholds. This curve provides insight into how well the model balances precision and recall as the confidence level changes. A higher precision indicates fewer false positives, while a higher recall signifies fewer false negatives. By analyzing the P-curve, we can assess how the model adjusts between these two metrics, helping us understand the trade-off between precision and recall across different thresholds. The P-curve for our model shows that it is able to maintain a good balance between precision and recall, which is important for applications where both metrics are crucial for accurate predictions.
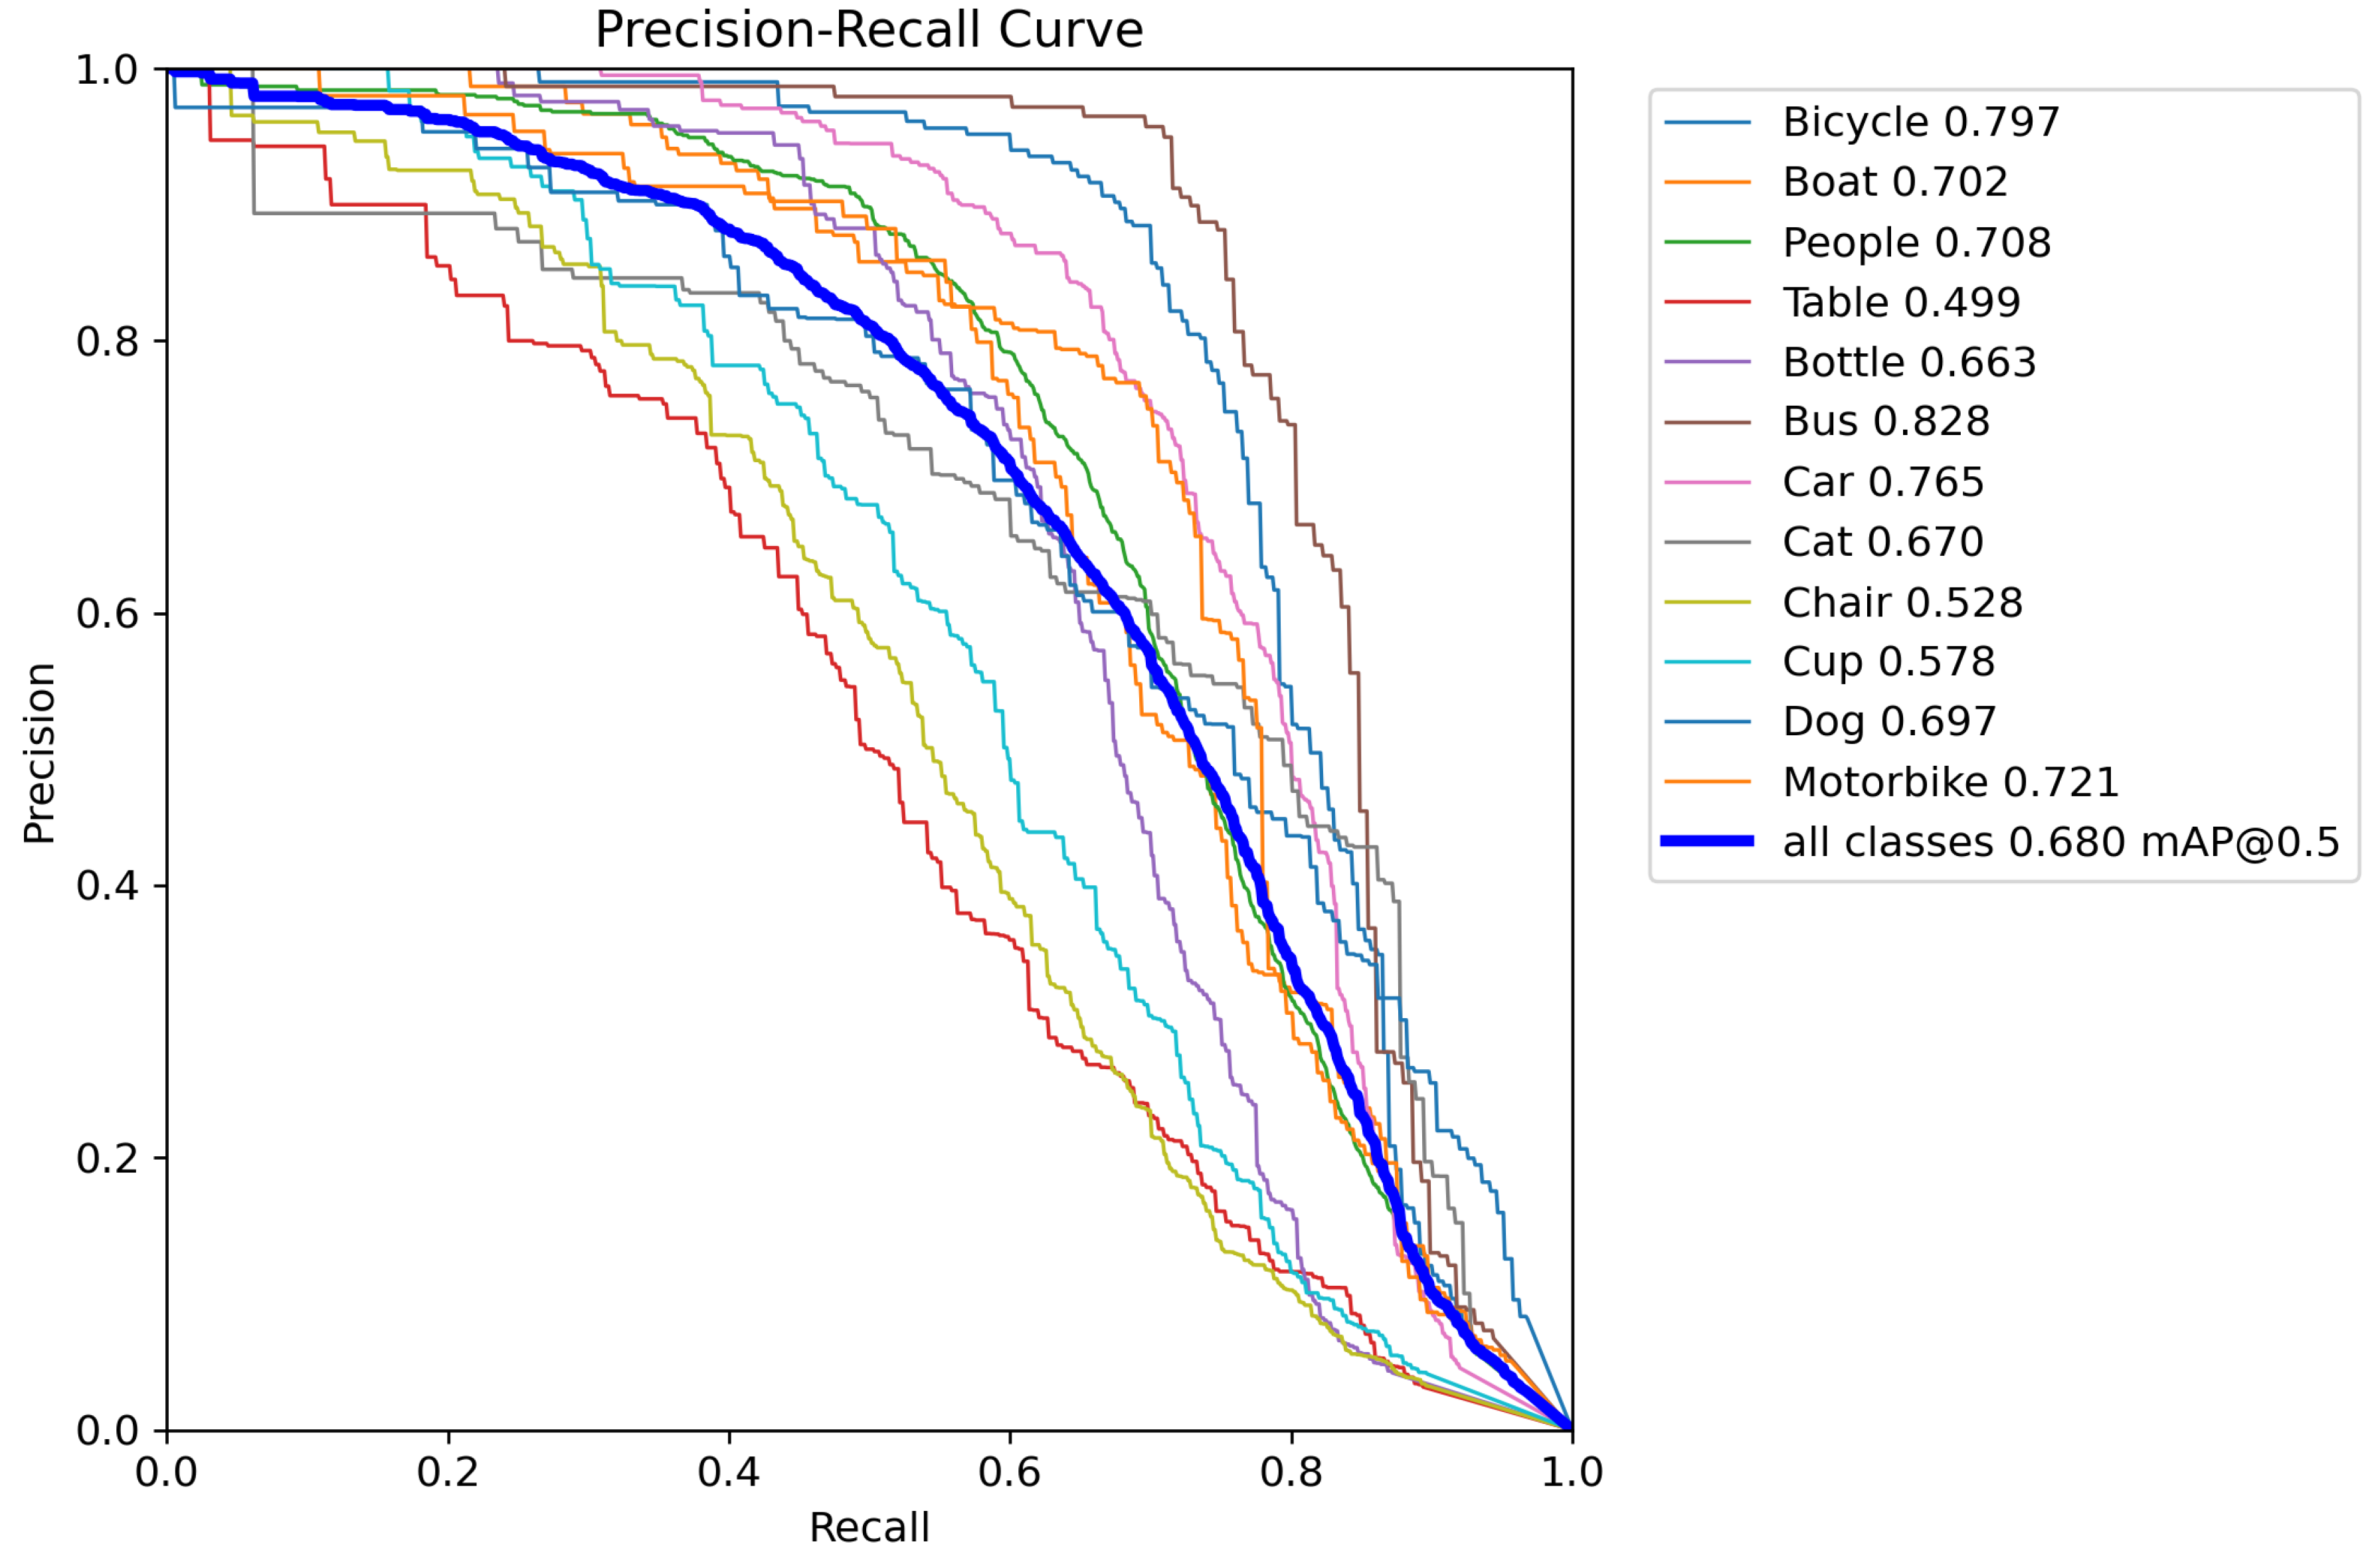
- Precision-Recall Curve (PR-curve): The Precision-Recall Curve is a graphical representation of the trade-off between precision and recall for different threshold values. Precision refers to the proportion of positive predictions that are actually correct, while recall indicates the proportion of actual positive cases that are correctly identified by the model. The PR-curve is particularly useful when dealing with imbalanced datasets, where the positive class is much less frequent than the negative class. A good model should achieve high precision and recall, which corresponds to a PR-curve that is close to the top-right corner. The area under the PR-curve (AUC-PR) is also a common metric for model performance, with higher values indicating better performance. In our experiment, the PR-curve demonstrated that our model could effectively identify positive cases while minimizing false positives, making it suitable for real-world applications with imbalanced classes.
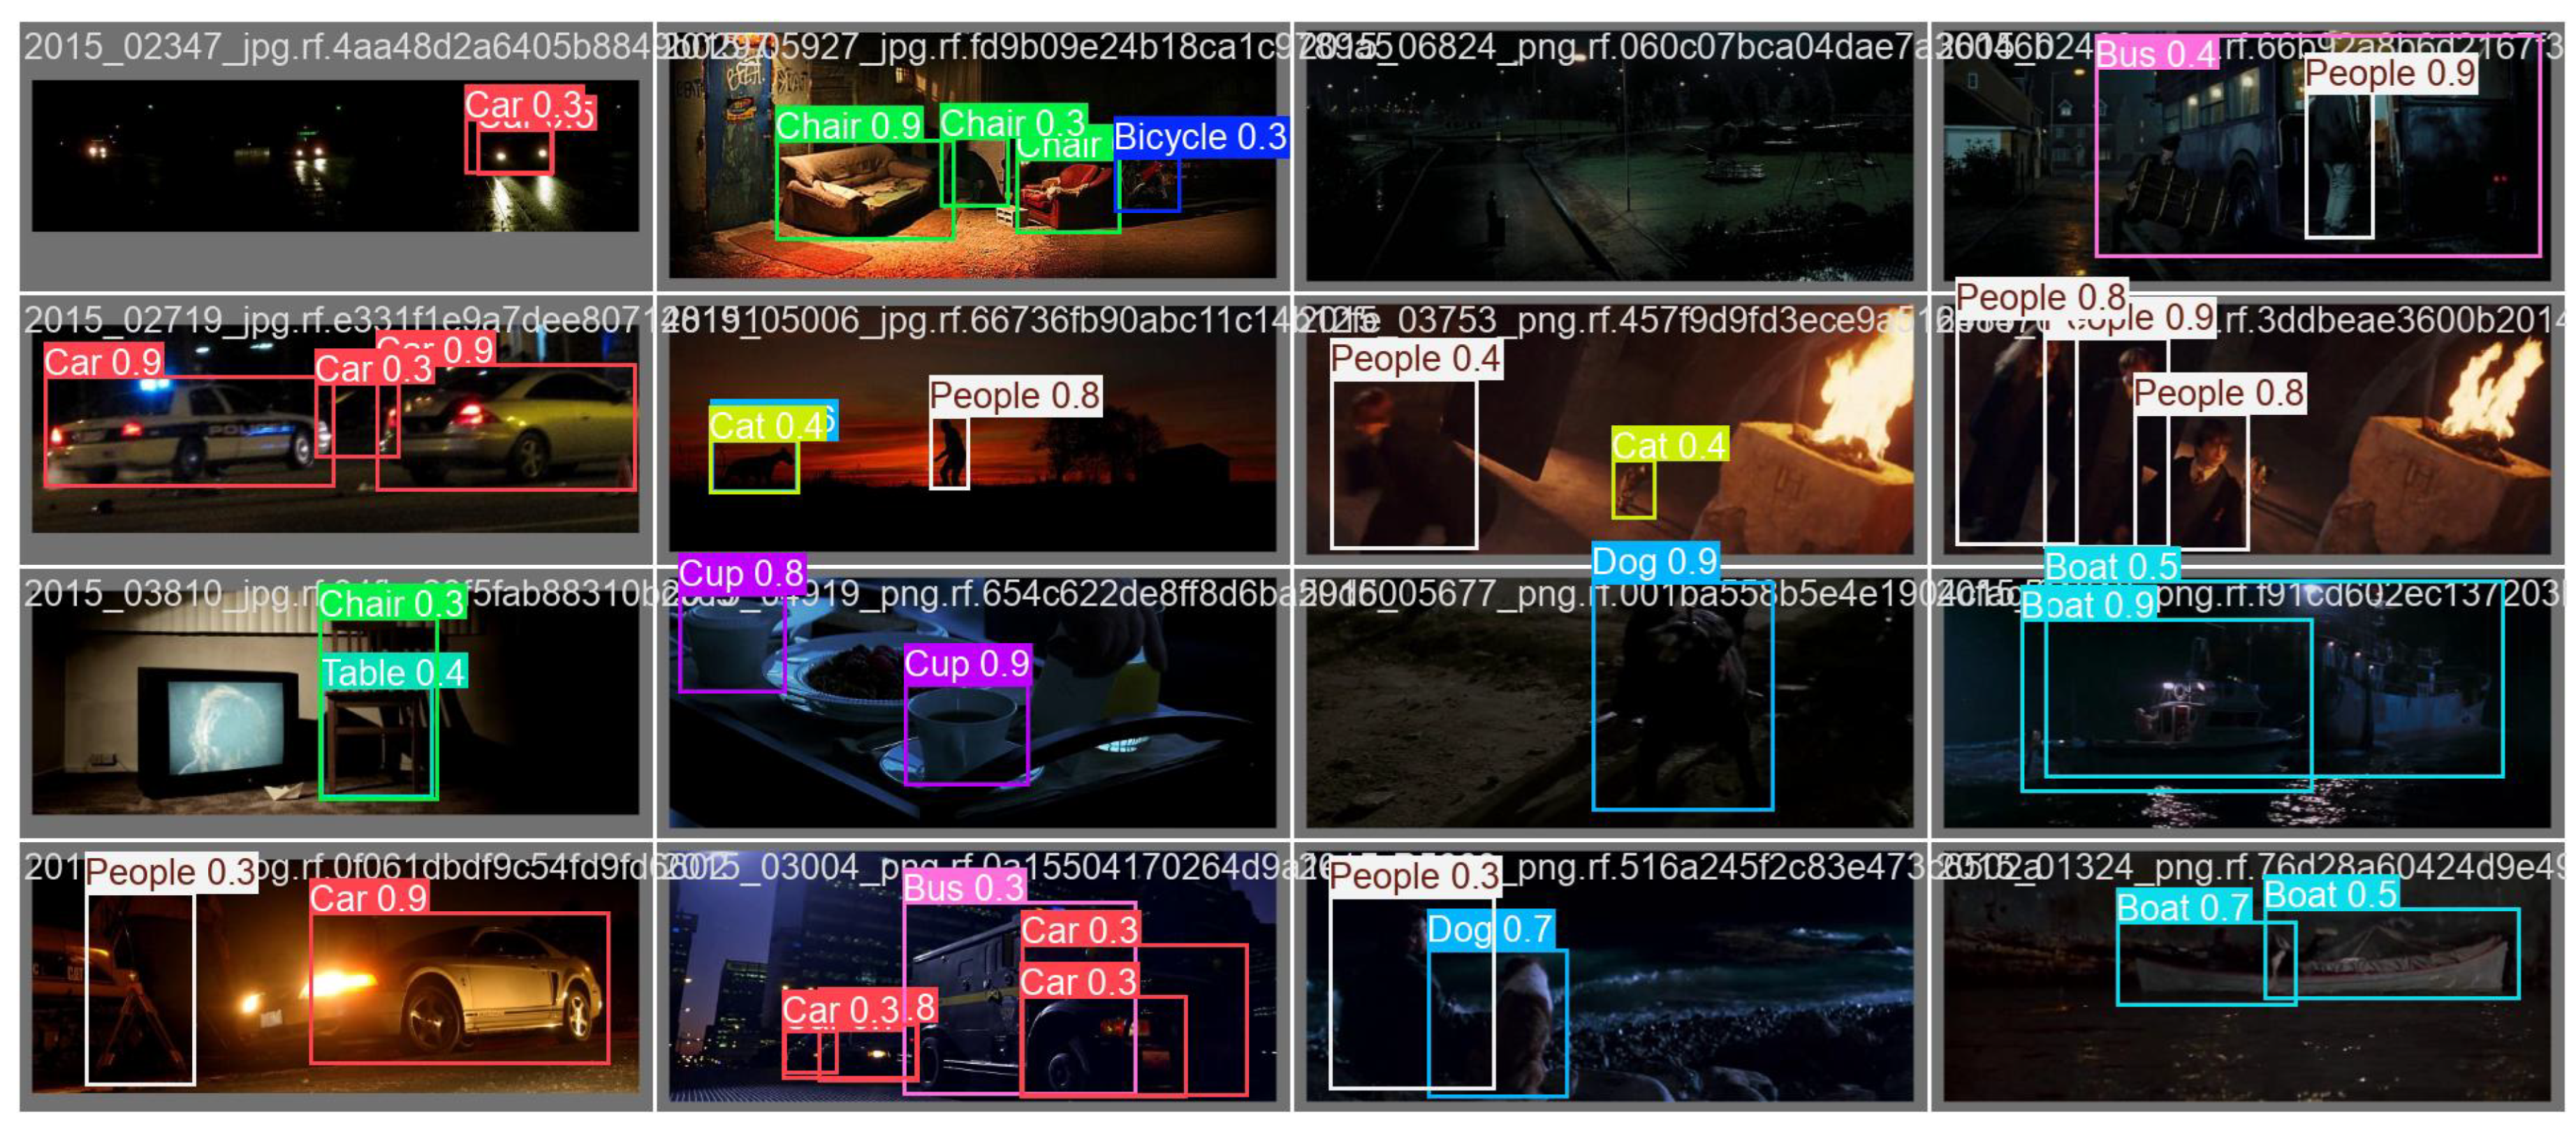
- Validation Batch Prediction (val_batch_pred): The val_batch_pred graph provides insight into how well the model’s predictions align with the ground truth for the validation batches. This helps us analyze the model’s performance during training and validate its generalization capabilities.
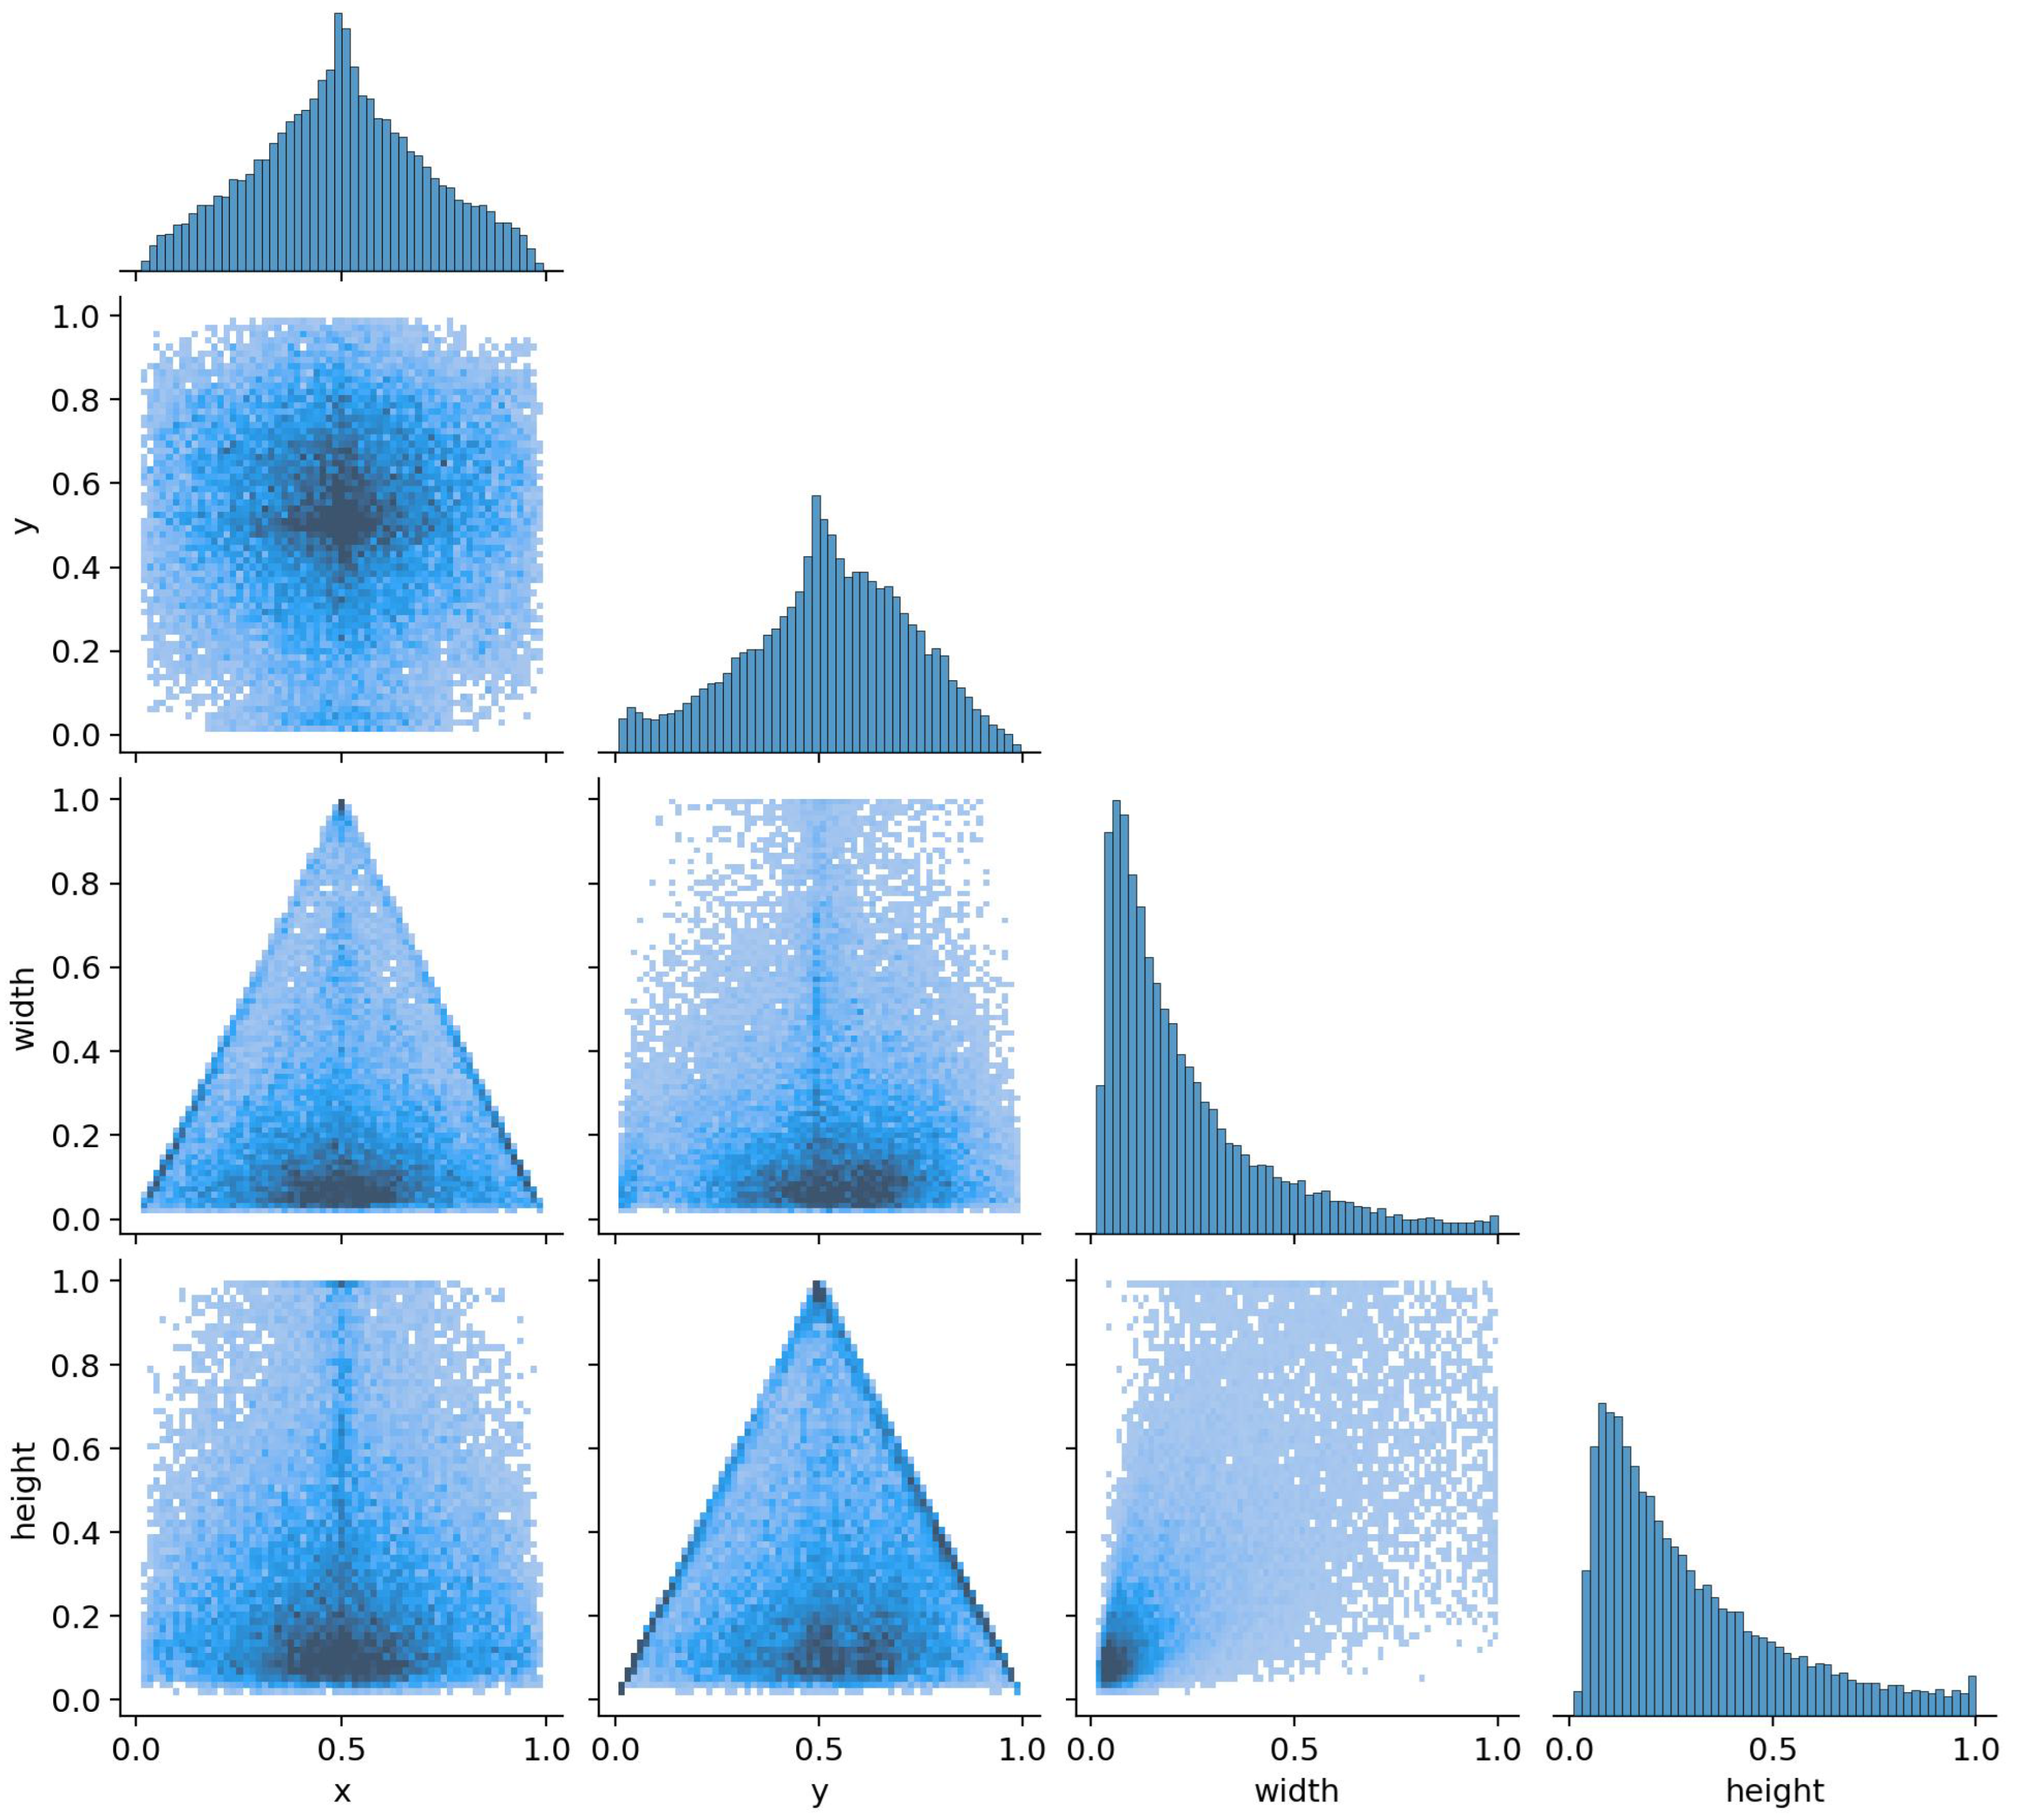
- Labels Correlation Matrix (labels_correlogram): The correlation matrix for the labels shows the relationships between the different classes in the dataset. This matrix helps in identifying whether the model is confusing certain classes or if there is significant overlap between class representations in the feature space.
0.0.3. Discussion of Results
Conclusions
References
- Eunyoung Kim and Gerard Medioni, “3D Object Recognition in Range Images Using Visibility Context,” Journal of Object Recognition, 2016. [CrossRef]
- Yasushi Sumi, Bong Keun Kim, and Masato Kodama, “Evaluation of Detection Performance for Safety-Related Sensors in Low-Visibility Environments,” International Journal of Safety Sensors, 2021. [CrossRef]
- Abhinav Jain and Sidharth Raj, “Object Detection Under Rainy Conditions for Autonomous Vehicles,” Journal of Autonomous Vehicles, 2024.
- Mate Kristo, Marina Ivasic-Kos, and Miran Pobar, “Thermal Object Detection in Difficult Weather Conditions Using YOLO,” Journal of Thermal Imaging, 2017. [CrossRef]
Disclaimer/Publisher’s Note: The statements, opinions and data contained in all publications are solely those of the individual author(s) and contributor(s) and not of MDPI and/or the editor(s). MDPI and/or the editor(s) disclaim responsibility for any injury to people or property resulting from any ideas, methods, instructions or products referred to in the content. |
© 2025 by the authors. Licensee MDPI, Basel, Switzerland. This article is an open access article distributed under the terms and conditions of the Creative Commons Attribution (CC BY) license (http://creativecommons.org/licenses/by/4.0/).


