
Submitted:
08 January 2025
Posted:
10 January 2025
You are already at the latest version
Abstract
The anchor cables of slopes are affected by long-term environmental corrosion, geotechnical creep, and adverse weather, resulting in gradual loss of tensile force, leading to structural failure and subsequent safety accidents. This paper conducts research based on the distribution characteristics of magnetic induction intensity of permanent magnets, including model derivation, theoretical simulation, and indoor experiments, aiming to propose a new anchor cable force monitoring technology with high sensitivity, strong applicability, and good stability. Based on the molecular circulation model and the Biot-Savart law, the analytical expression of the spatial magnetic field distribution of a rectangular permanent magnet is derived, and combined with the stress-strain relationship characteristics of anchor cables, a theoretical model for the relationship between anchor cable tensile force and magnetic induction intensity is established. MATLAB was used to simulate and analyze the spatial magnetic field distribution and force-magnetic relationship. The analysis shows that the magnetic induction intensity along the central axis of the permanent magnet approximately exhibits a symmetrical quadratic curve distribution; its value is significantly negatively correlated with the anchor cable force. Based on this, a new anchor cable force monitoring technology is proposed, and an indoor experimental platform is established. Indoor experimental studies further confirmed the negative correlation between force and magnetism. The fitting results of the force-magnetic curve show that a quadratic function can better describe the correspondence between magnetic induction intensity and anchor cable force. Reproducibility analysis of experimental data showed low dispersion in magnetic induction values under various design loads and good stability, validating the effectiveness and applicability of the proposed anchor cable force monitoring technology.
Keywords:
permanent magnet
; anchor cable force detection
; magnetic intensity distribution
; magnetic induction intensity
1. Introduction
With the advancement of modern railway, highway, and building structures, the demand for structural safety and load-bearing capacity is growing. Prestressed structures are engineered to enhance load-bearing capacity and prolong service life by pre-applying a specified load. In prestressed structures, anchor cables are critical components, and their stress state plays a vital role in the overall safety and stability of the system [1,2,3,4,5,6]. However, due to factors such as application quality, environmental conditions, creep deformation, and corrosion, anchor cables can lead to a loss of prestressing force in anchor cables or even damage, which can directly or indirectly lead to accidents and result in substantial safety and economic losses [7,8].
Currently, non-destructive monitoring technology [9,10] is employed to detect the tension in slope anchor cables. Among these methods, vibrating wire monitoring technology [11,12,13,14] operates on the principle that deformation induces changes in vibration frequency. Vibrating wire sensors are installed within the anchor cable to measure changes in resonant frequency, thereby indicating the stress level. This technology features a simple, low-cost sensor structure, but is more susceptible to environmental conditions. The Magnetic Measurement Method [15,16,17,18,19,20] utilizes the magnetostrictive effect of ferromagnetic materials, reflecting the internal stress magnitude by measuring changes in magnetic permeability at various points along the anchor cable under different stress states. This method is compact and easy to operate on-site, though it is susceptible to external magnetic field interference, which can reduce measurement accuracy. Fiber optic sensing technology [4,21,22,23,24,25] is based on the response of light phase shifts to changes in the physical field to indicate the properties of the measured object. When the external environment changes, the frequency, polarization direction, and initial phase of the incident light are affected. By detecting and demodulating the return light signal, the corresponding physical quantities can be obtained. However, the high cost of demodulation equipment hinders large-scale implementation, and the quality of the transmitted signal can be poor, making it prone to signal loss and other issues.
With the in-depth exploration of magnetic materials and advancements in material processing technology, permanent magnetic materials are being applied more widely. Permanent magnets offer advantages such as high magnetic field strength, favorable magnetic field distribution, and compact size, making them suitable as magnetic field sources across various fields [26,27,28,29]. Building on this, this paper aims to integrate the magnetic field distribution characteristics of permanent magnets with anchor cable tensile force monitoring to develop a novel anchor cable force monitoring technology. This technology is characterized by strong and stable magnetic properties, high measurement accuracy, and low cost, making it a promising and reliable approach for anchor cable force monitoring.
2. Theoretical Investigation of Monitoring Models
2.1. Monitoring Principles:
The sensing structure consists primarily of a Hall probe, a rectangular permanent magnet, and an epoxy resin mold, which are tightly bonded to the steel wire through an epoxy adhesive, as shown in Figure 1. The Hall probe is placed above the rectangular permanent magnet, aligning with its axis POB, thus enabling the measurement of the z-component of the magnetic induction intensity Bz of the magnet.
In the absence of external force on the steel strands, the probe’s measurement point coincides with the midpoint O of the central axis. The midpoint of the permanent magnet is positioned at a distance l from the midpoint O’ of the Hall probe's epoxy resin base. When tensile force is applied, the steel strands deform, resulting in displacement of both the permanent magnet and the probe, denoted asand , respectively. Due to variations in bonding positions and lengths, a relative displacement differentialarises between the permanent magnet and the probe. On the permanent magnet, consequently, the probe’s measurement point shifts from point O to point M, with a displacement of. Since the magnetic induction intensity varies across different points in the space of the rectangular permanent magnet, the magnetic induction intensity ΔBz measured by the probe also changes correspondingly, denoted as ΔBz =ΔBz1-ΔBz2 . Thus, within the sensor’s measurement range, different tensile forces correspond to varying Bz values. By analyzing the relationship between the tensile force and Bz and establishing a mathematical model between the two parameters, the tensile force in the steel strands can be monitored.
2.2. Analysis of the Spatial Magnetic Field Distribution of Permanent Magnets:
Consider a rectangular permanent magnet with dimensions a ×b ×c positioned in a three-dimensional Cartesian coordinate system, where the magnet is magnetized unidirectionally along the z-axis to a state of uniform saturation. At this point, the magnetization vector M within the magnet can be approximated as a constant vector. Based on Ampere's molecular circulation theory, the magnetic field at any point in the external space is generated by the collective contributions of all the loop molecular currents within the permanent magnet.
After uniform magnetization, the molecular current effects inside the magnet neutralize each other, and thus do not contribute to the magnetic field. From a macroscopic perspective, it can be approximated that only the surface molecular currents are responsible for generating the external magnetic field. Furthermore, as the magnetization along the z-direction reaches full saturation, the molecular current effects on the upper and lower surfaces of the rectangular permanent magnet also cancel each other. Consequently, the magnetic field at any point in the external space is primarily generated by the closed current loop ABCDA on the side surface of the magnet, as illustrated in Figure 2.
Assume the current intensity in the loop is I, and the current density is J. The magnetic field source point of the permanent magnet is located at (0, 0, 0), and the coordinates of any point in the external space of the magnet are P (x, y, z).
From Ampere's circuital law and Biot-Savart law, the magnitude of the magnetic field at a given point in space produced by the loop current A′B′C′D′A′ is:
Using segment A′B′ as an example, consider a micro-segment of the current element(,), the magnetic field it generates at any spatial point is:
In this formula, is the vacuum permeability, with a value of 4× 10⁻⁷(H/m);denotes the length vector of the current element;represents the unit vector in the direction of the radius vector ; denotes the distance from point P to the current element.
Based on the monitoring principle outlined in Section 2.1, the probe detects the magnetic induction intensity in the z-direction, denoted as Bz. Consequently, the analytical expression of the z-direction component is the focus of the analysis. For segment AB, we have:
In the formula:
Then:
Similarly, the magnetic field intensities excited by segments BC, CD, and DA can be calculated. For brevity of expression, after integrating Equation (6), we introduce a function notation as follows:
Therefore, the analytical expression for the z-direction magnetic induction intensity Bz at any point in space excited by the closed molecular current loop ABCDA is:
2.3. Force-Magnetic Coupling Monitoring Model
Assuming that the monitoring probe is located along the central axis at (x, b/2, z), with the center point of the permanent magnet as the origin, when the probe undergoes a displacement, the result can be obtained by substituting this into Equation (8):
It is known that the following relationship exists between stress and strain in strand material [30]:
Where:
Pp — Average tensile force of the prestressed tendon (N);
P — Tensile force at the tensioning end of the prestressed tendon (N);
x — Distance from the tensioning end to the calculated section (m);
— Sum of tangential angles of the curved duct portion from the tensioning end to the calculated section (rad);
k— Design position deviation coefficient;
— Friction coefficient between the prestressed tendon and the duct wall;
Ep — Elastic modulus of the steel strand.
The permanent magnet sensor is affixed to the linear prestressed tendon, with the midpoint of the permanent magnet situated l away from the midpoint of the Hall probe's epoxy resin base (as illustrated in Figure 1). When a prestress of Pp =P is applied, a relative displacement Δx occurs between the permanent magnet and the Hall probe fixed to the epoxy resin base, resulting in a strain given by ε=Δx/l. By integrating Equations (9) and (10), we can derive the relationship between the anchor cable tensile force P and the magnetic flux density Bz as follows:
Equation (11) represents the theoretical model for this monitoring technology. Once the parameters of the sensor structure are determined, the relationship between stress and the magnetic induction intensity Bz can be calibrated. Subsequently, the stress in the steel strands of the anchor cable can be derived from the monitored magnetic signal parameters, thereby achieving stress monitoring.
3. Simulation Analysis of the Monitoring Theoretical Model
3.1. Simulation and Comparison of the Magnetic Field of a Rectangular Permanent Magnet
MATLAB is used to perform a theoretical simulation of the analytical expression for the spatial magnetic field distribution of a rectangular permanent magnet, examining the magnetic field distribution characteristics on both qualitatively and quantitatively. A rectangular permanent magnet with dimensions of 40 mm (length), 10 mm (width), and 5 mm (height) is selected as the subject of this study.
If the magnetic field strength at a certain height z from the center of the rectangular permanent magnet is known, and its position coordinates (a/2, b/2, z) are substituted into Equation (9), the expression for the current density can be derived as follows:
For ease of description in this paper, the height z from the center of the surface of the permanent magnet is defined as the lift-off height.
A Gauss meter was used to measure the surface magnetic field strength of the rectangular permanent magnet, which was approximately 0.23 T. Using Equation (12), the current density was calculated as J=7.06×10⁵A/m2. MATLAB was then used to solve and determine the distribution pattern of the magnetic induction intensity Bz at different lift-off heights z, as shown in Figure 3.
As seen in Figure 3, the magnetic induction intensity Bz exhibits a symmetric distribution at the center, consistent with the symmetry of the magnet's geometric shape. When the lift-off height z is relatively large, Bz along the centerline in the x-direction initially increases and then decreases, reaching its maximum at the midpoint. For instance, at heights of 10 mm, 20 mm, and 30 mm, Bz exhibits an 'upward convex' distribution, with Bz at the midpoint of the central axis being the maximum and gradually decreasing toward both ends, roughly following a quadratic curve distribution.
Conversely, at smaller lift-off heights z, the Bz near the midpoint along the central axis is lower than the values in the adjacent edge regions, gradually increasing from the midpoint outward. Near the edges, Bz values then decrease sharply, leading to a 'downward concave' distribution on the surface of the permanent magnet, with the minimum Bz at the central axis midpoint. This difference is primarily related to the distribution of magnetic field lines: within the permanent magnet, magnetic flux is concentrated, whereas in the surrounding air, the flux is more dispersed. At the same time, the influence of edge effects results in the different Bz distribution patterns described above.
To further verify the accuracy of the analytical expression for the magnetic field distribution characteristics, this paper uses a Tesla meter to measure the magnetic induction intensity Bz of the rectangular permanent magnet and compares the measurements with the theoretical simulation results. The Bz values at lift-off heights of 2 mm, 10 mm, 20 mm, and 30 mm are extracted for comparison, as shown in Figure 4.
From Figure 4, it can be observed that the variation patterns of the magnetic induction intensity Bz distribution curves from the theoretical simulation and experimental measurements are essentially consistent, confirming the accuracy of the analytical expression for the magnetic field distribution characteristics.
However, discrepancies remain between the two analysis results, primarily due to model error and measurement error. Model error arises from the theoretical model's idealized assumptions, including uniform magnetization and full saturation of the permanent magnet. In practice, the permanent magnet is subject to various environmental factors and material properties, which can lead to demagnetization. Additionally, measurement error is influenced by several factors during the measurement process, such as measurement methods, system readings, and environmental conditions.
3.2. Force-Magnetic Coupling Theoretical Simulation.
Using MATLAB and based on Equation (11), a simulation analysis of the force-magnetic relationship is conducted for lift-off heights of z=5mm, 10mm, 20mm, and 30mm. The corresponding force-magnetic relationship curves are drawn, as shown in Figure 5.
Figure 5 shows that at different lift heights z, the tension P is negatively correlated with the magnetic induction strength Bz. Specifically, as the tensile force increases, the Bz value gradually decreases. To further verify the reliability of this pattern, this study will carry out a more detailed investigation into the relationship between force and magnetic variations using indoor physical model tests.
4. Experimental Study
4.1. Subsection
In this experiment, an 1860-grade prestressing steel strand with a length of 80 cm was used as the test specimen. Tensile loading was applied to the steel strand using a WAW-1000 microcomputer-controlled electro-hydraulic servo universal testing machine. To ensure that the gripped length of the specimen met the requirements (no less than three-quarters of the grip length) [30], the grip length was measured to be approximately 23 cm. Consequently, 20 cm of length was reserved at both ends of the steel strand to install aluminum clamps and secure the upper and lower grips. The magnetic signal output by the permanent magnet sensor was collected using a TD-8620 Tesla meter. Figure 6 shows the experimental platform setup.
Based on the nominal cross-sectional area of the steel strand specimen, which is 140 mm², the theoretical failure load of the steel strand is estimated to be approximately 260 kN. According to specifications, the working load range for the steel strand is set to 0.75 times its ultimate load. Therefore, the load range for the tensile test of the steel strand specimen in this experiment is set to 0–160 kN. With the lift-off height z kept constant, the test design loads were set to 100 kN, 120 kN, 140 kN, and 160 kN, with a loading step of 20 kN, which was also used for unloading. One cycle was defined as a complete loading and unloading process. Each test design load was repeated for four loading and unloading cycles to study the correlation between the magnetic signal parameters and the stress in the anchor cable steel strand at a constant lift-off height z under different test design loads.
To ensure the effectiveness and reliability of the experiment, the following measures were taken: the loading rate of the universal testing machine was set to 5 mm/min, with an initial preload of 20 kN. When the load reached the predetermined value, it was held for 30 seconds. During the first 5 seconds of the holding period, no readings were taken to eliminate error caused by lag in collecting magnetic signal parameters due to steel strand deformation. Subsequently, five readings were taken each time and averaged to reduce measurement error.
4.2. Experimental Results and Analysis
4.2.1. Relationship Between Magnetic Induction Intensity and Load
For clarity, this paper numbers the test conditions as shown in Table 1. Figure 7 presents an analysis of the force-magnetic relationship under condition A# during 10 loading and unloading cycles, which reveals zero-point drift during the first six cycles. Analysis suggests that this phenomenon is likely attributed to residual stress in the steel strand specimen used for testing. The residual stress within the steel strand can be minimized by subjecting it to multiple loading and unloading cycles under static load, thereby preventing zero-point drift. Figure 8 shows the force-magnetic relationship curves for conditions A#, B#, C#, and D# during four loading and unloading cycles after the elimination of zero-point drift.
From Figures 8(a), (b), (c), and (d), it can be observed that during the loading and unloading cycles under different test loads, the variation pattern of the magnetic induction intensity Bz remains consistent, with showing a negative correlation with the tensile force. This observed pattern aligns with the previous simulation results, further validating the accuracy of the theoretical monitoring model established through sensor measurements and indicating a clear functional relationship between Bz and the applied load.
The average Bz values for each tensile cycle under different design loads were extracted, as shown in Table 2:
Using the data from Table 2, the force-magnetic data for various operating conditions were analyzed through linear and quadratic function fitting. The results of these fittings are illustrated in Figure 9.
Analyzing the data in the figure, it is evident that the quadratic function fitting demonstrates superior performance compared to linear fitting, with a goodness of fit exceeding 99% and approaching 1. The relative measurement error remains within 1%, confirming that the force-magnetic relationship follows a quadratic function.
4.2.2. Analysis of the Repeatability of Test Data
Repeatability reflects the degree of inconsistency in the characteristic curves obtained during multiple full-range tests by the sensor in the same direction. The closer the characteristic curves overlap under the same input conditions, the better the repeatability and the smaller the data error. As shown in Figure 10, the magnetic induction intensity Bz corresponding to each force value during four loading and unloading cycles under different design loads was recorded, with the average and standard deviation calculated.
From the Figure 10, it can be observed that the standard deviation of the magnetic induction intensity Bz collected under each design load is less than 1.5%, indicating a low degree of data dispersion and good stability of the monitoring technique. However, the larger standard deviation in certain working conditions may be attributed to improper instrument operation during the experiment. Comparison reveals that in the loading range of 0–20 kN, the variation range of the magnetic induction intensity Bz is larger than in other loading ranges. This may be due to the nonlinear strain occurring in the steel strand during the tensile process. At the beginning of tensioning, the steel strand experiences linear strain, which then tends toward nonlinearity as the tensile force increases. Additionally, the probe and the permanent magnet may not have been perfectly aligned during sensor fabrication, contributing to the larger variation in the magnetic induction intensity Bz observed during the initial stage of tensioning.
5. Conclusions
This paper investigates the distribution pattern of the magnetic induction intensity Bz of the permanent magnet and the relationship between anchor cable tensile force and magnetic induction intensity through theoretical model derivation, simulations, and laboratory experiments. A new anchor cable force monitoring technique based on the magnetic intensity distribution of permanent magnets is proposed. The conclusions are as follows:
- By combining the molecular circulation model and the Biot-Savart law, an analytical expression for the spatial magnetic field distribution of a rectangular permanent magnet was derived. This expression was then coupled with the stress-strain characteristics of the steel strand to establish a theoretical monitoring model that relates the anchor cable tensile force to the magnetic induction intensity of the permanent magnet. By monitoring the magnetic signal, the magnitude of the anchor cable force can be determined, thereby enabling effective anchor cable force monitoring.
- Using MATLAB, the distribution pattern of the magnetic induction intensity Bz and the force-magnetic relationship in the anchor cable force monitoring model were studied. The results showed that the z-component of the magnetic induction intensity Bz is symmetrically distributed about the central point. On the surface of the permanent magnet, the variation in Bz forms a 'downward concave' curve, and as the lift-off height z increases, Bz transforms into an 'upward convex' curve, approximately following a quadratic distribution. Notably, the value of Bz decreases as the tensile force increases.
- The indoor experimental results indicate that the magnetic induction intensity Bz decreases as the tensile force increases, demonstrating a negative correlation consistent with the simulation results. The quadratic function effectively describes the relationship between force and magnetic field. Repeatability analysis of the test data shows that the standard deviation of the magnetic induction intensity Bz collected under the design loads is less than 1.5%, indicating low data dispersion and good stability of the monitoring technique. These results verify the effectiveness and applicability of the proposed monitoring technique.
- Given the constraints of the current study, this paper investigates the magnetic signal distribution characteristics along the z-axis of the rectangular permanent magnet sensing structure and its correlation with the applied load. Further research could address the three-dimensional magnetic signal distribution and its associated relationship with the load.
Author Contributions
Conceptualization, H.J., and Y.Z.; Methodology, H.J. and Y.Z.; Software, Y.Z. and A.H.; Validation, H.J., A.H. and Y.Z.; Investigation, Y.Z.; Data curation, Y.Z. and A.H.; Writing—original draft, H.J. and Y.Z.; Writing—review and editing, H.J. and A.H.; Supervision, H.J.; Funding acquisition, H.J. All authors have read and agreed to the published version of the manuscript.
Funding
This research was supported by the Natural Science Foundation of Chongqing City of China (cstc2021jcyj-msxmX1011); the National Natural Science Foundation of China (52178272); and the National Natural Science Foundation of China (52478300).
Institutional Review Board Statement
Not applicable.
Informed Consent Statement
Not applicable.
Data Availability Statement
The original contributions presented in this study are included in the article. Further inquiries can be directed to the corresponding authors.
Conflicts of Interest
The authors declare no conflicts of interest.
References
- Sun, Y.; Ling, Y.; Lin, X.; Zhao, Y.; An, X.; Yi, T. Experimental Study on Internal Monitoring Structure of A New Prestressed Anchor Cable. Chinese Journal of Geotechnical Engineering, 2020, 42, 226–230. [Google Scholar]
- Zhang, G.; Hou, Q.; Ji, Z.; Zhang, D.; Xia, C.; Liu, C.; Zhao, H. Analysis of retaining system of secant pile- rotary anchor cable for foundation pit excavation. Journal of Railway Engineering Society, 2022, 284, 14–19. [Google Scholar]
- Zhang, Z.; Xu, G.; Dai, L.; Cheng, T.; Xi, B.; Chen, M.; Yang, J. A modified bearing capacity model for inclined shallow anchor cable with experimental verification. Appl. Sci. 2024, 14, 11457. [Google Scholar] [CrossRef]
- Li, J.; Wang, C.; Zhao, Y. A long-term monitoring method of corrosion damage of prestressed anchor cable. Micromachines. 2023, 14, 799. [Google Scholar] [CrossRef] [PubMed]
- Xing, T.; Liu, H.; Zheng, J.; Yu, X.; Li, Y.; Peng, H. Study on the effect of anchor cable prestress loss on foundation stability. Appl. Sci. 2024, 14, 4908. [Google Scholar] [CrossRef]
- Zhou, C.; Huang, C.; Chen, Y.; Dong, Q.; Sui, W. Development of a novel resilient anchor cable and its large shear deformation performance. International Journal of Rock Mechanics and Mining Sciences, 2023, 163, 105293. [Google Scholar] [CrossRef]
- Shi, K.; Wu, X.; Tian, Y.; Xie, X. Analysis of re-tensioning time of anchor cable based on new prestress loss model. Mathematics. 2021, 9, 1094–1094. [Google Scholar] [CrossRef]
- Gao, X.; Jia, J.; Bao, X.; Mei, G.; Zhang, L.; Tu, B. Investigation of dynamic responses of slopes in various anchor cable failure modes. Soil Dynamics and Earthquake Engineering. 2025, 188(PartB), 109077. [Google Scholar] [CrossRef]
- Xu, H.H.; Li, J.H.; Qin, H.Y. Application of FBG self-sensing prestressed anchor cable in slope engineering. Journal of China Foreign Highway, 2021, 41, 11–14. [Google Scholar]
- Xia, J.; Yao, Y.; Wu, X.; Chen, Y. Cable force measurement technology and engineering application. Journal of the International Association for Shell and Spatial Structures. 2021, 62, 185–194. [Google Scholar] [CrossRef]
- Tian, Y.; Qu, L.; Wang, Y.; Lin, X.; Xie, L.; Du, S. Design and application of bridge monitoring system based on vibrating wire sensors. Journal of North University of China (natural science editon), 2021, 42, 468–474. [Google Scholar]
- Branko, G. Concise historic overview of strain sensors used in the monitoring of civil structures: the first one hundred years. Sensors. 2022, 22, 2397–2397. [Google Scholar]
- Cui, X.; Li, D.; Liu, J.; Ou, J. An NCFA-based notch frequency feature extraction method for guided waves and its application in steel strand tension detection. J. Bridge Eng. 2023, 28, 04023099. [Google Scholar] [CrossRef]
- Mu, C. Application of intelligent monitoring and collection instrument in monitoring of urban rail foundation pit. Railway Investigation & Surveying. 2023, 49, 36–41. [Google Scholar]
- Li, X.; Tu, C.; Wu, H.; Zhu, H.; Wu, J.; Fang, W. Testing method for internal stress of materials. Physical Testing and Chemical Analysis(Part A(Physical Testing)). 2020, 56, 15–20. [Google Scholar]
- Zhou, C.; Wei, C.; Wang, W. A new detection method based on magnetic leakage theory and bp neural network for broken steel strands in ACSR conductor. IEEE Sensors Journal. 22, 19620-19634.
- Zhang, D.; Zhang, E.; Pan, S. A new signal processing method for the nondestructive testing of a steel wire rope using a small device. NDT&E International. 2020, 102299.
- Liu, S.; Cheng, C.; Zhao, R.; Zhou, J.; Tong, K. A stress measurement method for steel strands based on spatially self-magnetic flux leakage field. Buildings. 2023, 13, 2312. [Google Scholar] [CrossRef]
- Xia, R.; Zhang, H.; Zhou, J.; Liao, L.; Yang, W.; Li, Y. Corrosion non-destructive testing of loaded steel strand based on self-magnetic flux leakage effect. Nondestructive Testing and Evaluation. 2022, 37, 56–70. [Google Scholar] [CrossRef]
- Zhang, H.; Ding, Y.; Yuan, Y.; Xia, R.; Zhou, J. Experimental analysis of the magnetic leakage detection of a corroded steel strand due to vibration. Sensors. 2023, 23, 7130. [Google Scholar] [CrossRef]
- Branko, G. Concise historic overview of strain sensors used in the monitoring of civil structures: the first one hundred years. Sensors. 2022, 22, 2397–2397. [Google Scholar]
- Wu, T.; Liu, W.; Fu, S. Recent progress of fiber-optic sensors for the structural health monitoring of civil infrastructure. Sensors. 2020, 20, 4517. [Google Scholar] [CrossRef] [PubMed]
- Chen, W.; Hong, C.; Chen, X.; Luo, G.; Dong, S. Comparative analysis of anchor cables in pullout tests using distributed fiber optic sensors. Canadian Geotechnical Journal. 2023, 60, 1–37. [Google Scholar] [CrossRef]
- Brezzi, L.; Fabbian, N.; Schenato, L.; Scala, A.; Cola, S. Distributed optical fiber-based monitoring of smart passive anchors for soil stabilization. Procedia Structural Integrity. 2024, 1589–1596. [Google Scholar] [CrossRef]
- Qin, H.; Li, C.; Luo, B.; Tang, P. Force monitoring in steel-strand anchor cables using quasi-distributed embedded FBG sensors. Construction and Building Materials. 2024, 438, 137192. [Google Scholar] [CrossRef]
- Gao, H.; Feng, Y. Latest application progress and prospect analysis of permanent magnet materials. China Energy and Environmental Protection. 2019, 41, 89–92. [Google Scholar]
- Coey, J. Perspective and prospects for rare earth permanent magnets. Engineering. 2020, 6, 119–31. [Google Scholar] [CrossRef]
- Nishanth, F.; Verdeghem, J.; Severson, E. A review of axial flux permanent magnet machine technology. IEEE Transactions on Industry Applications. 2023, 59, 3920–3900. [Google Scholar] [CrossRef]
- Hu, Y.; Wang, S.; Duan, Z.; Gao, Y.; Xiao, Y.; Feng, B.; Li, C.; Kang, Y. A flexible permanent magnetic field perturbation testing probe based on through-slot flexible magnetic sheet. Sensors and Actuators A: Physical. 2024, 366, 114899. [Google Scholar] [CrossRef]
- Ministry of Transport of the People's Republic of China. Technical specifications for construction of highway bridges and culverts(JTG/T3650-2020), China communication press, Beijing,China,2020;70-80.
Figure 1.
Sensor structure and monitoring schematic.
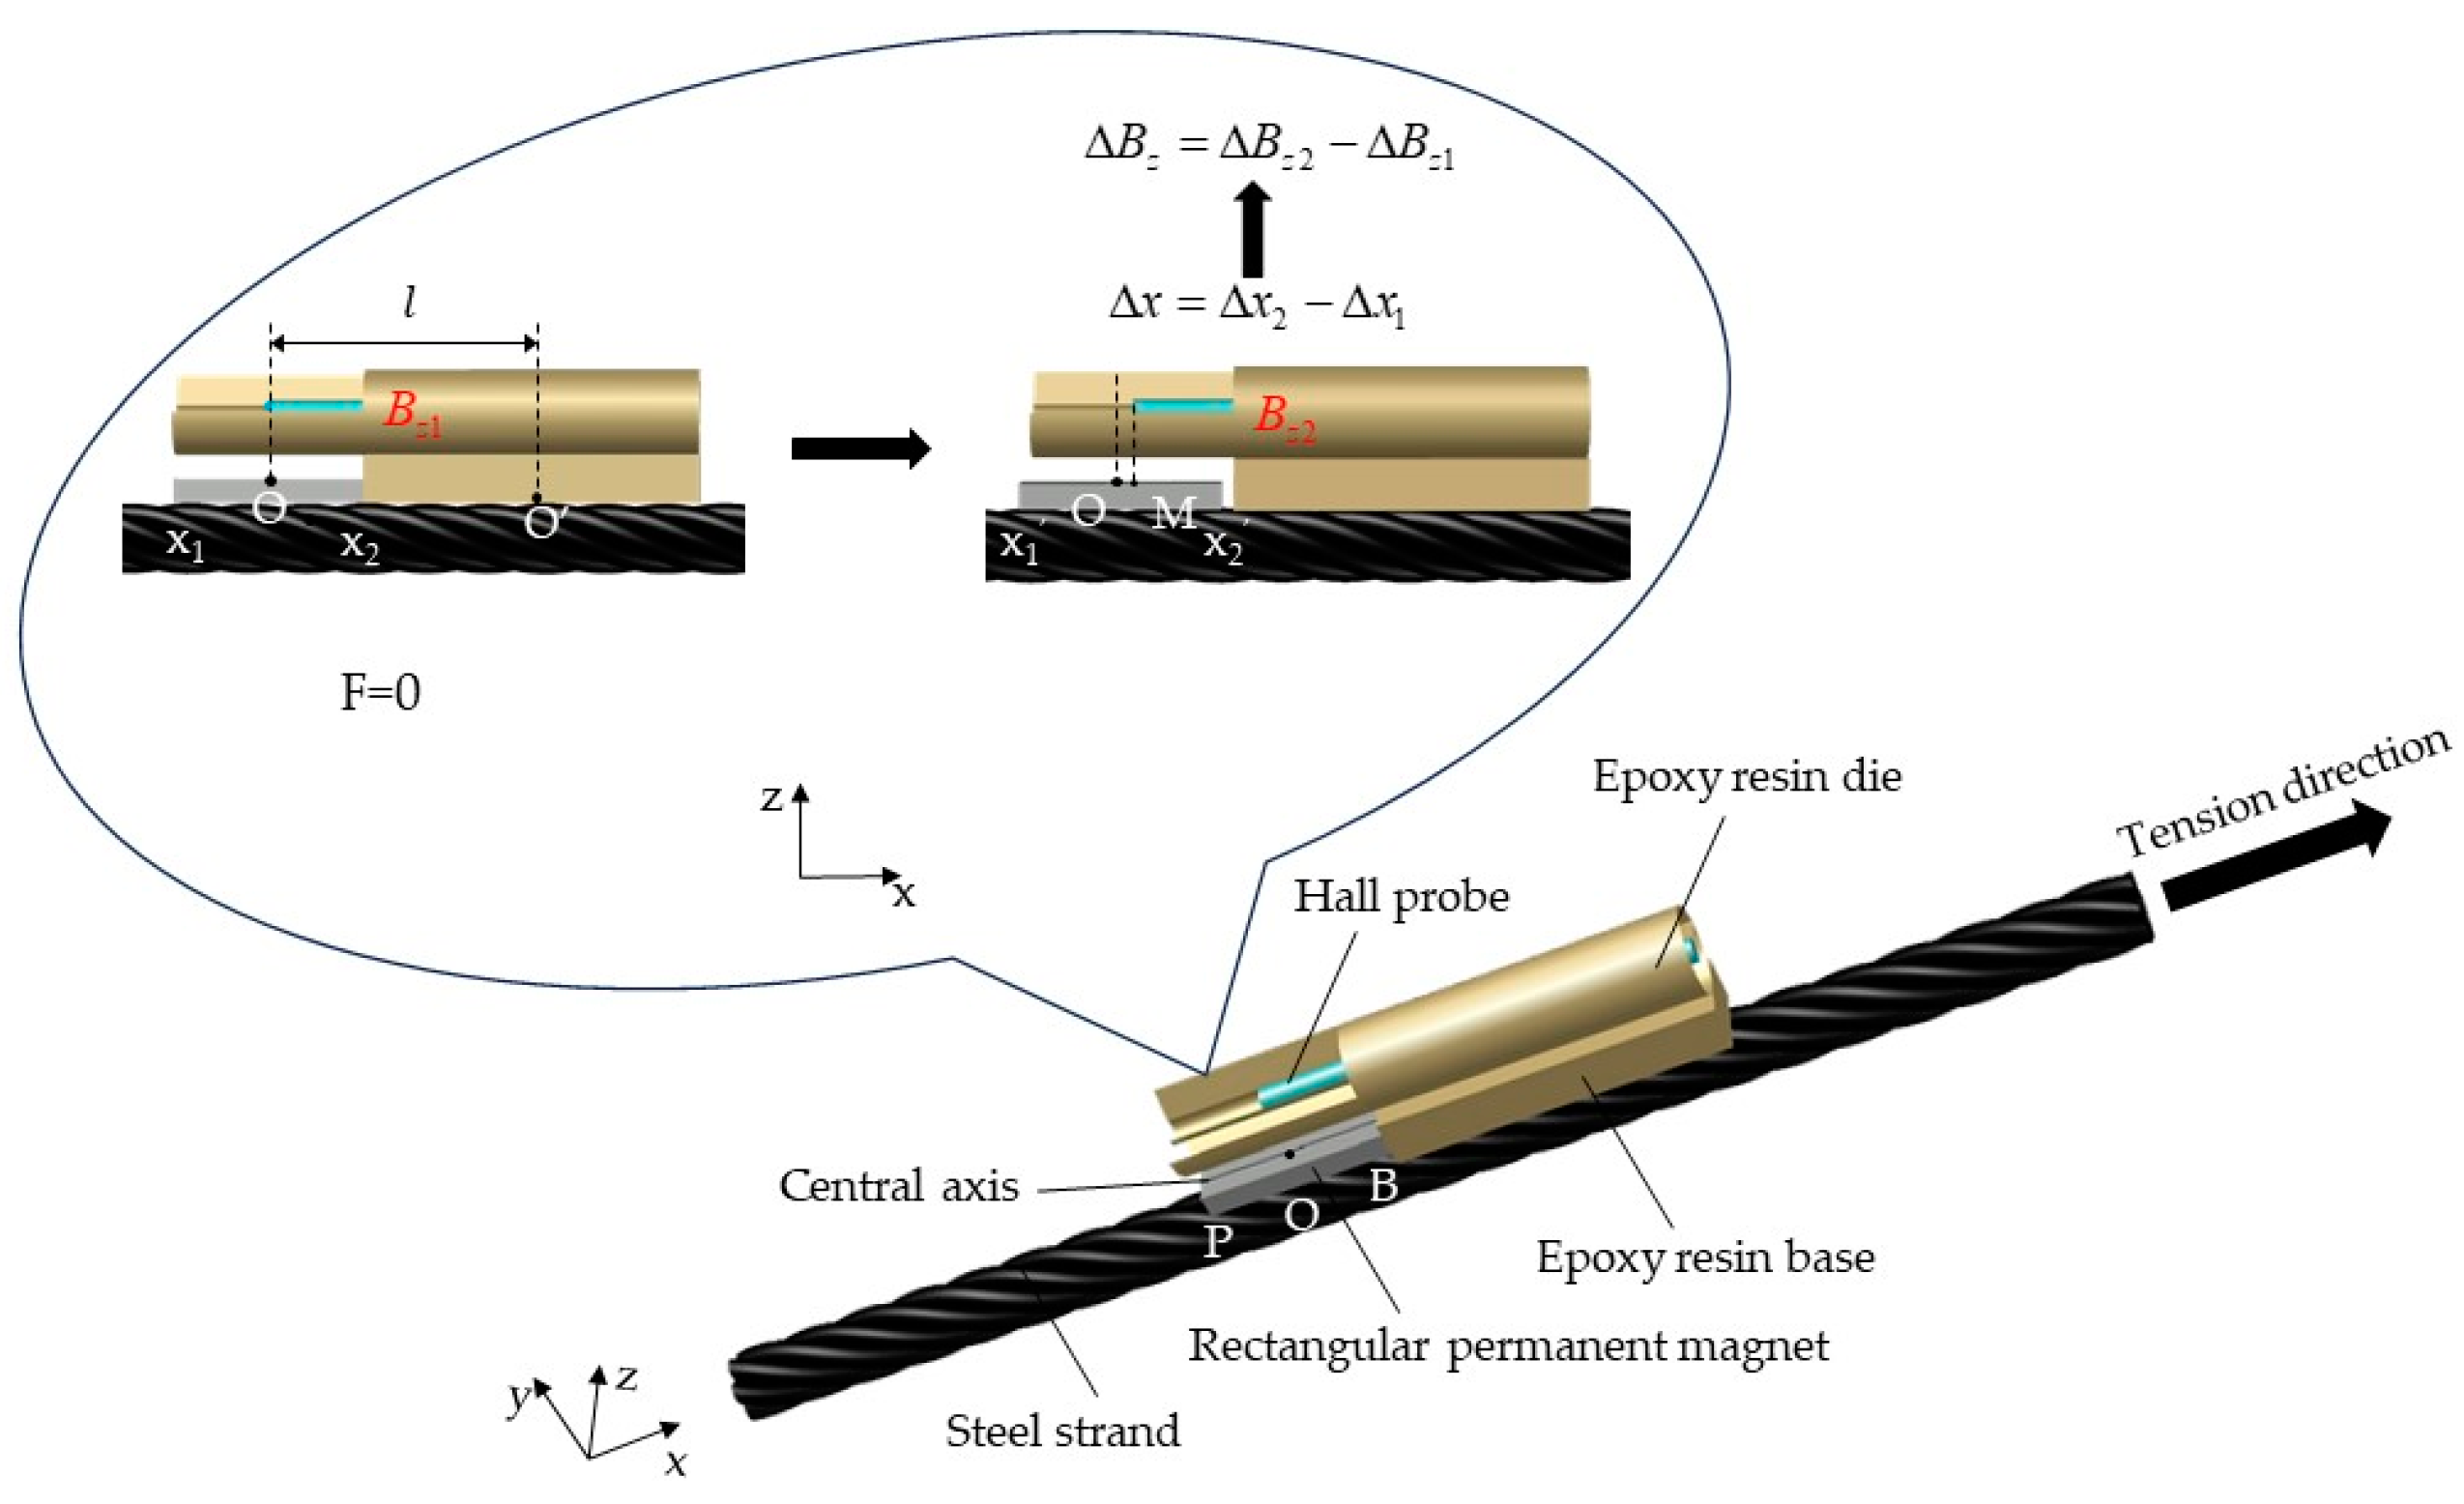
Figure 2.
Molecular circulation model of the rectangular permanent magnet
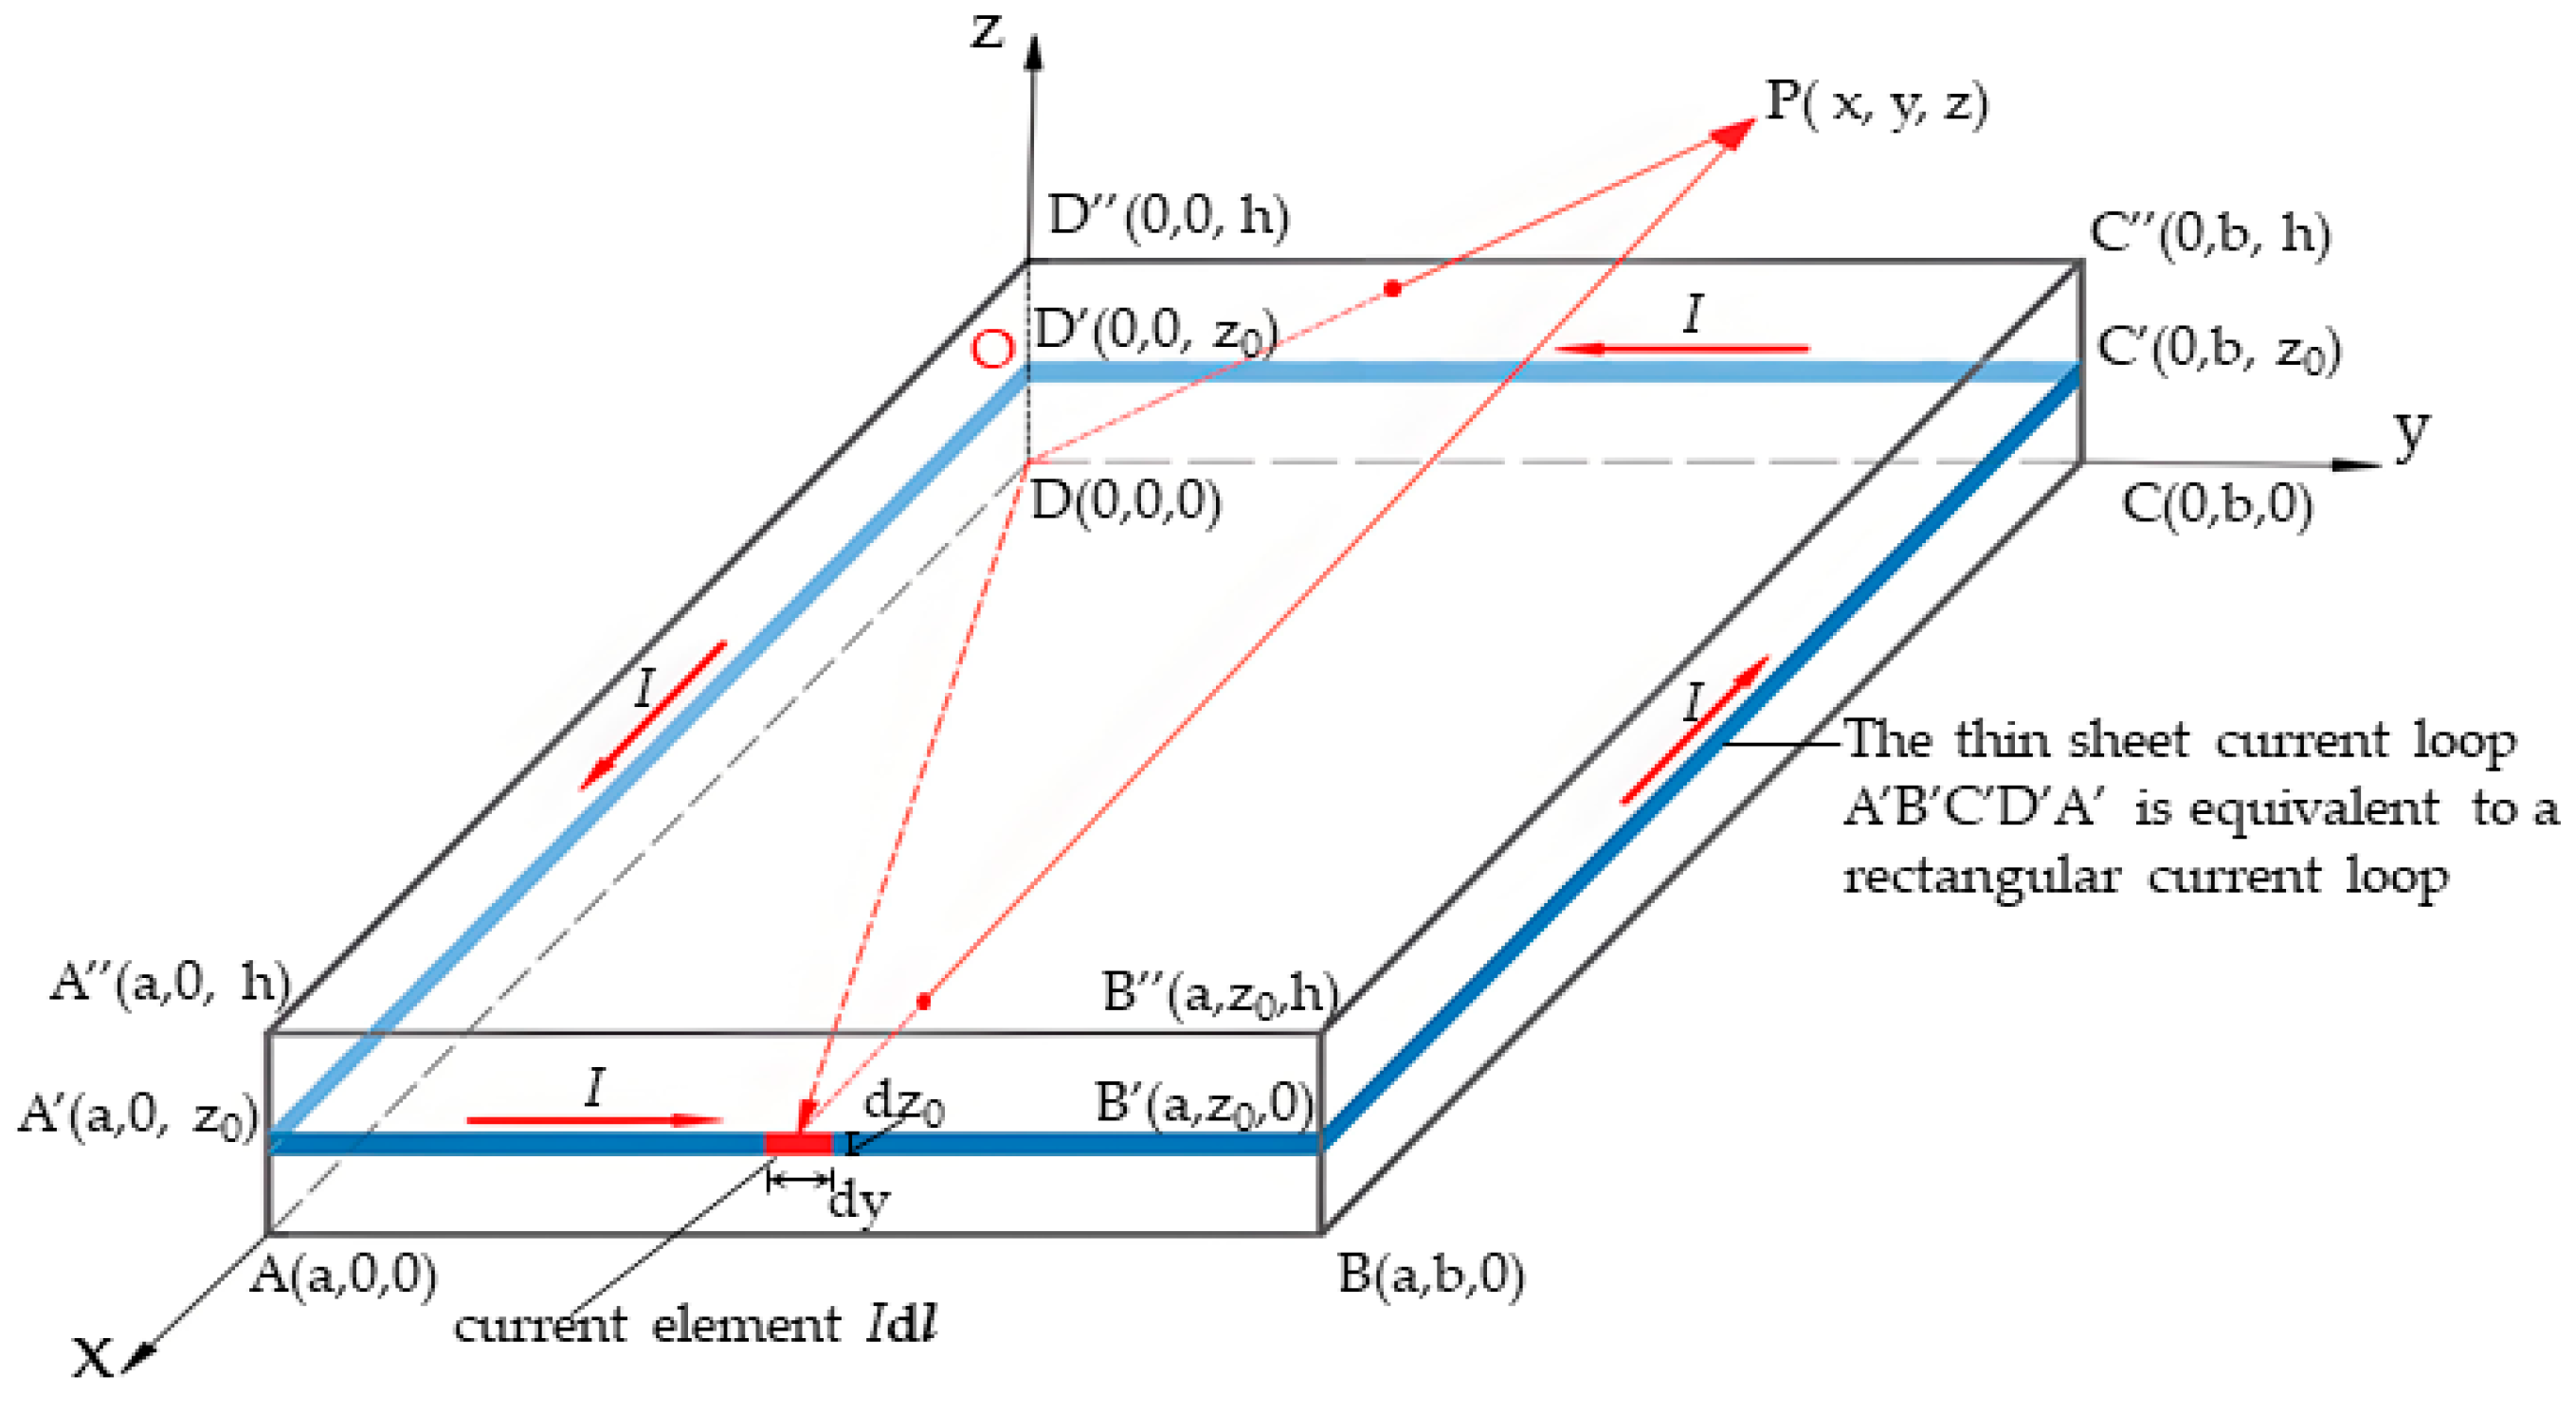
Figure 3.
Distribution curve of magnetic induction intensity Bz along the central axis of the rectangular permanent magnet.
Figure 3.
Distribution curve of magnetic induction intensity Bz along the central axis of the rectangular permanent magnet.
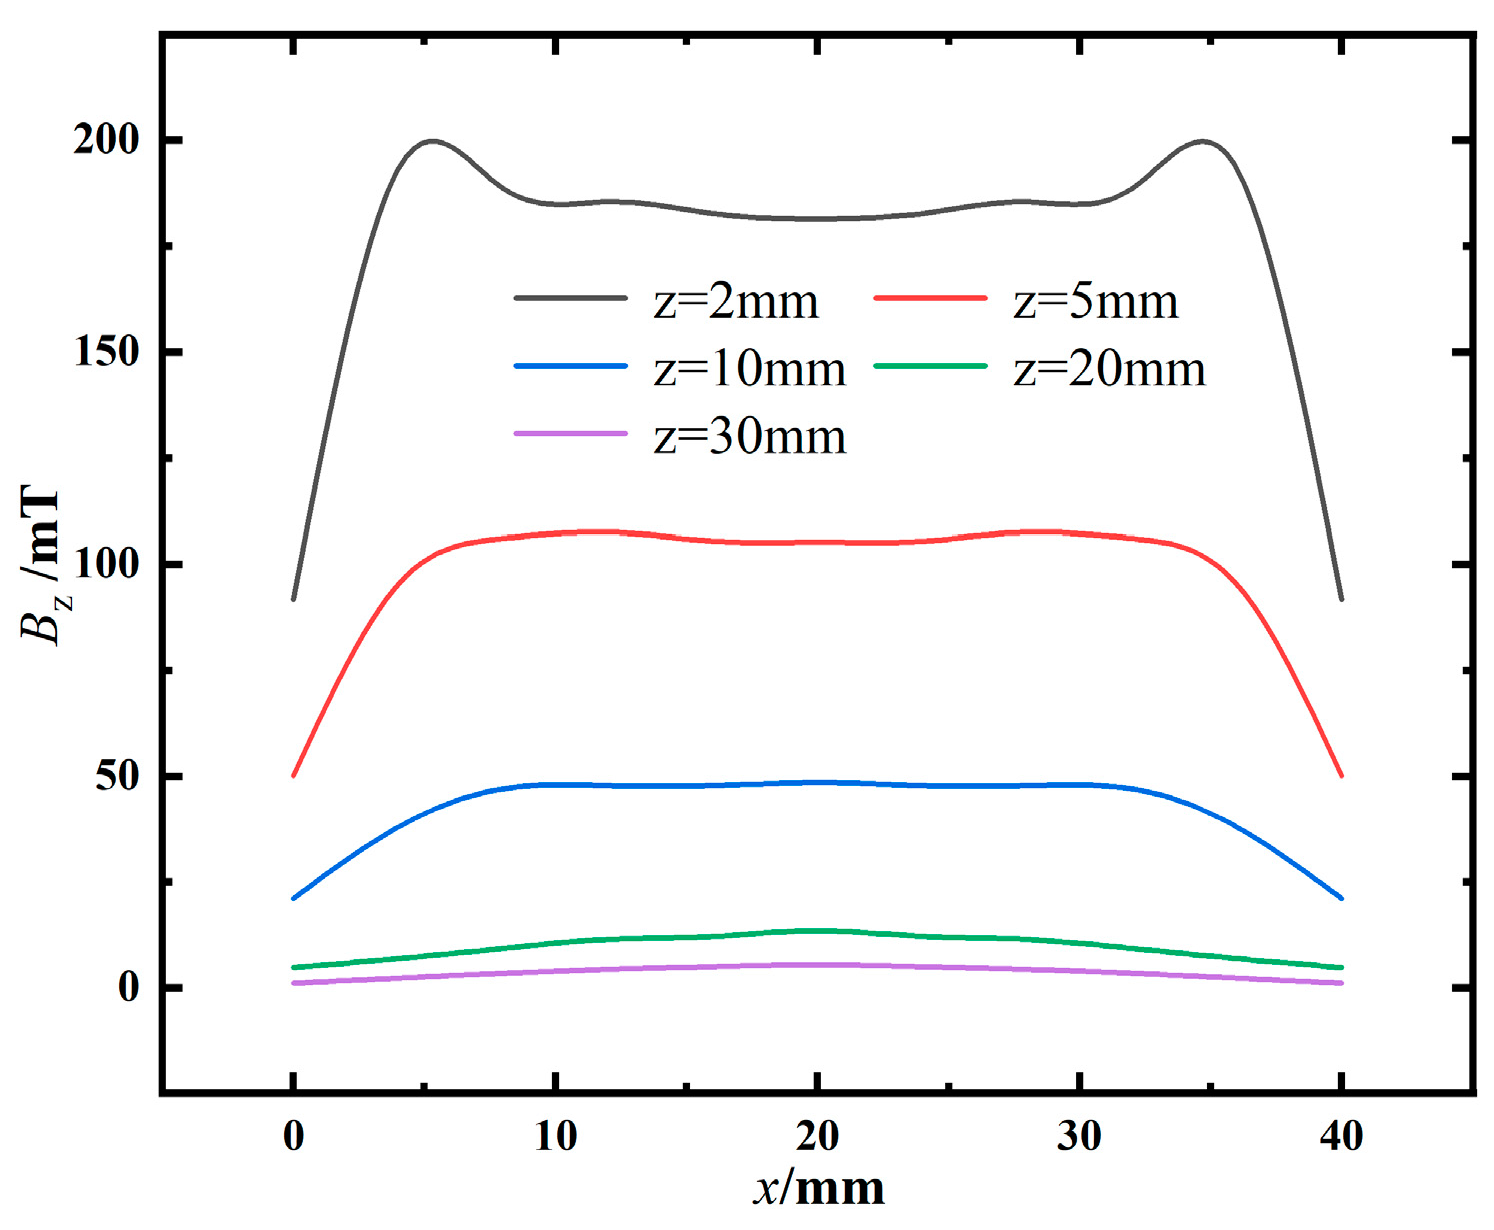
Figure 4.
Comparison of magnetic induction intensity Bz distribution curves.
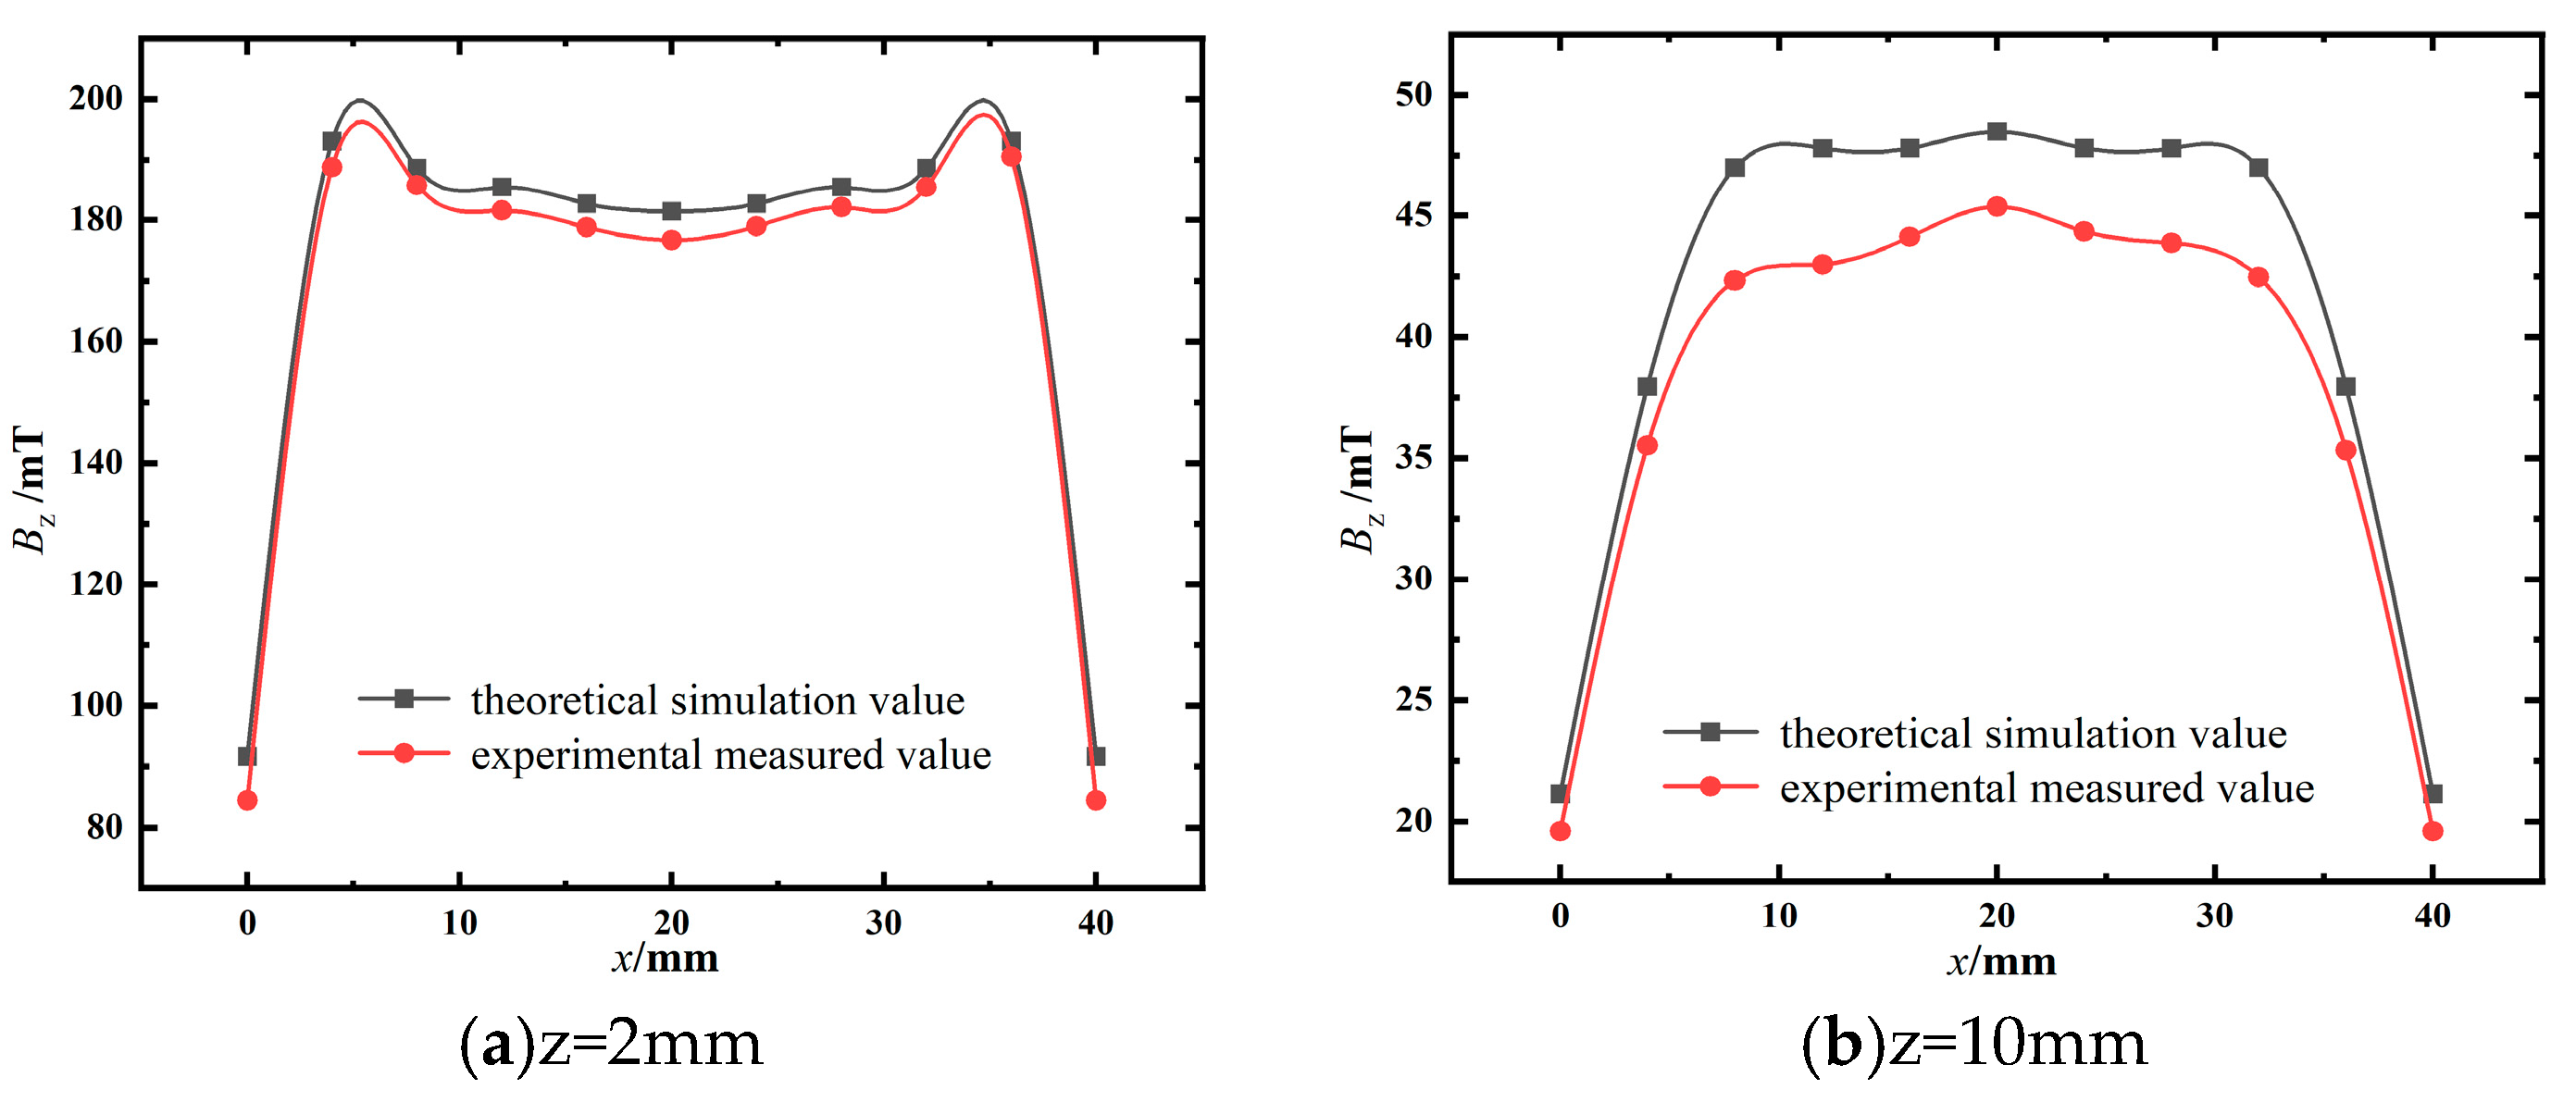
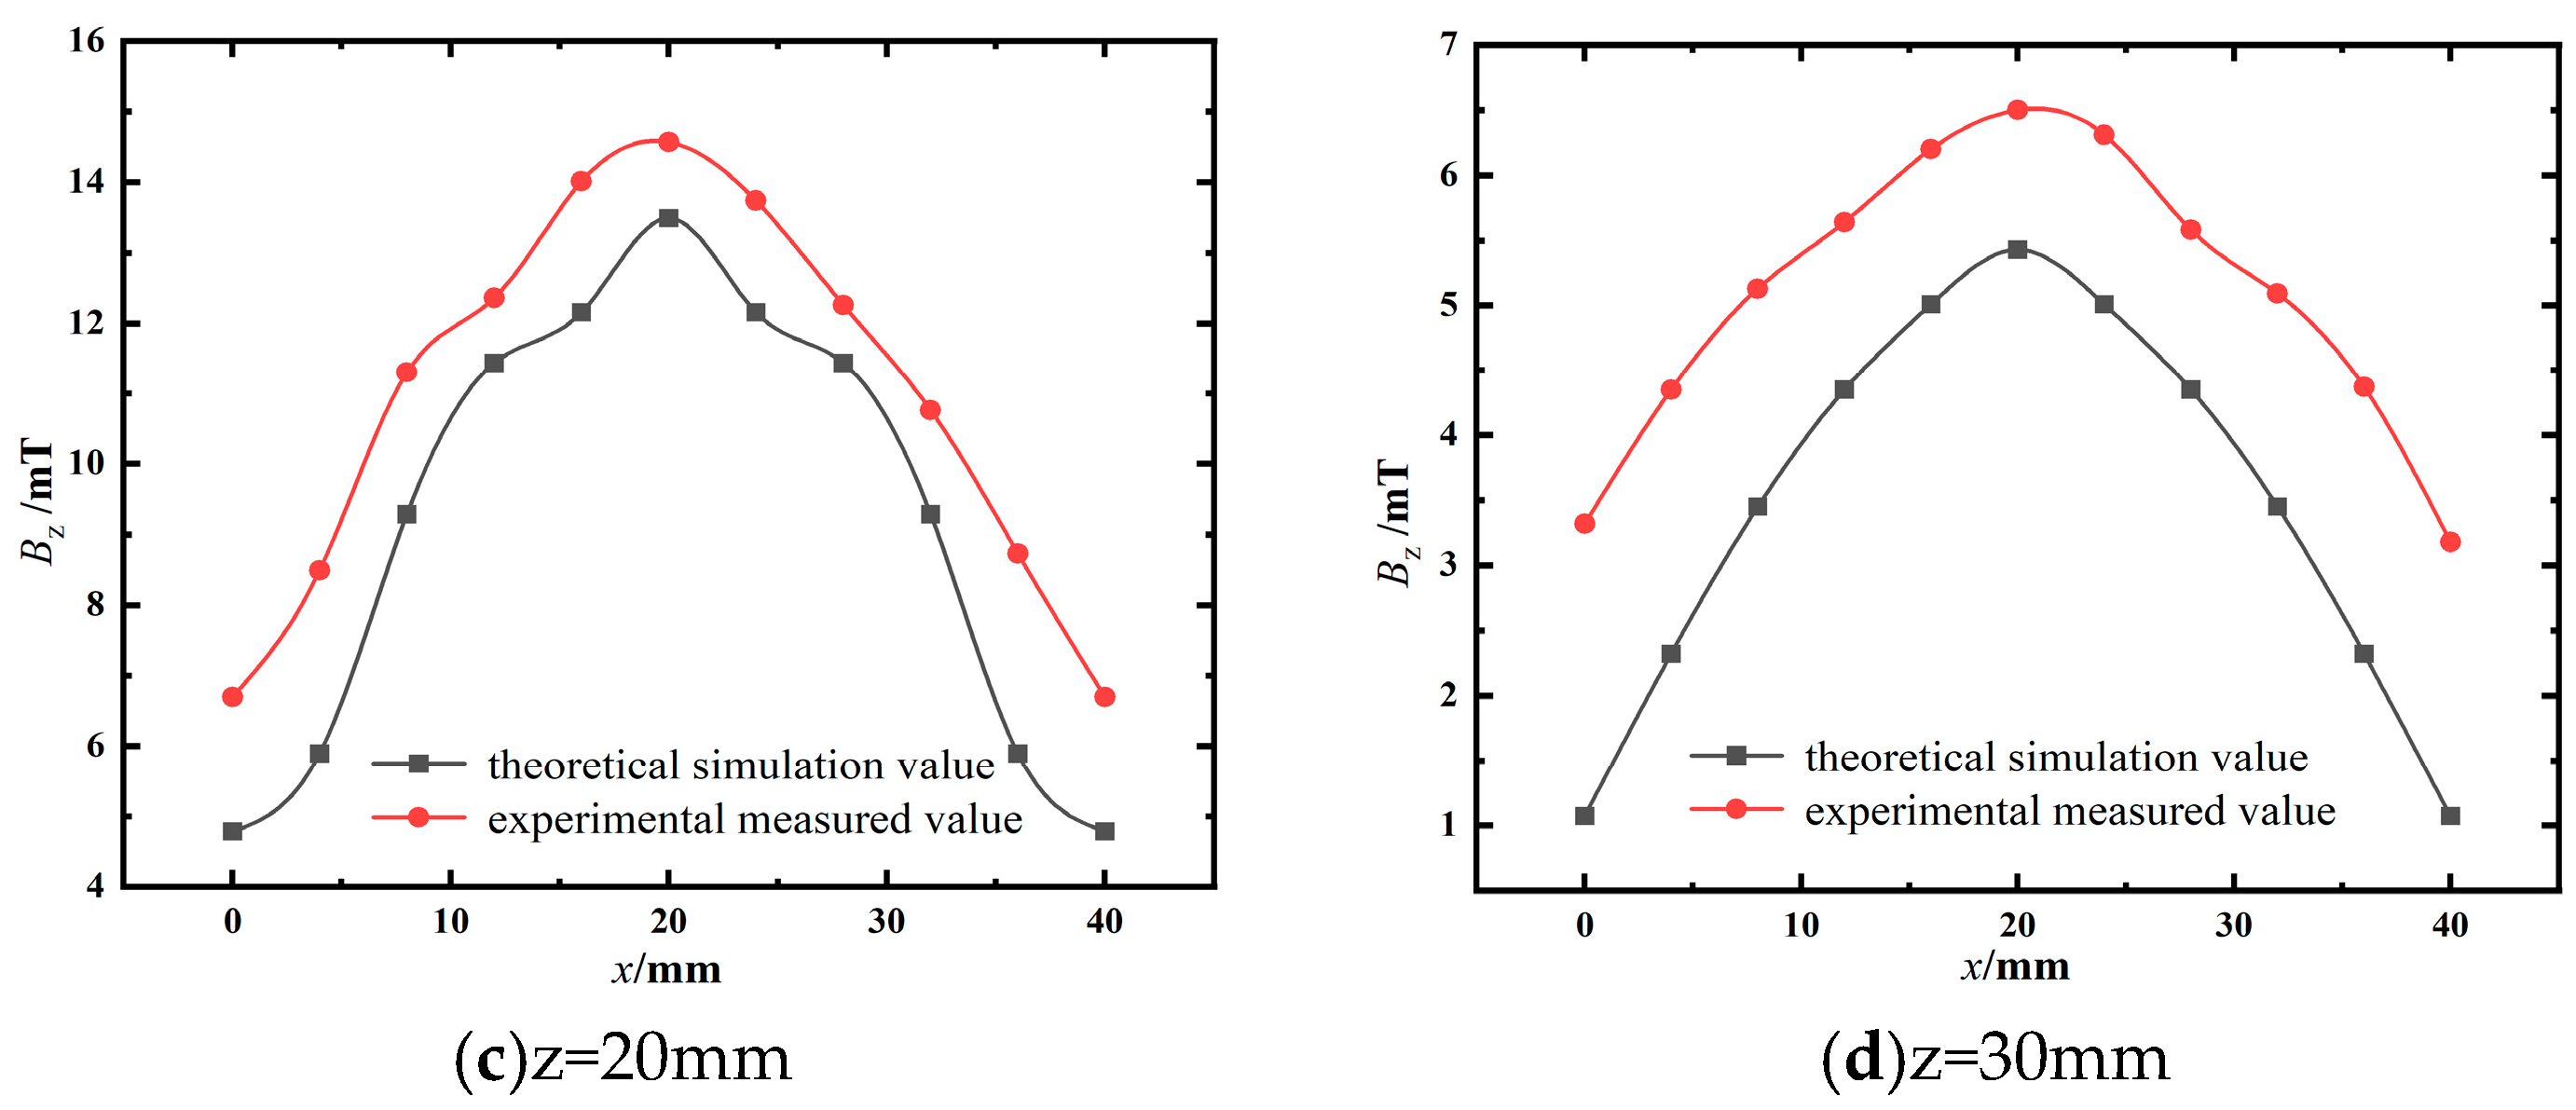
Figure 5.
Force-magnetism relationship at different lift-off heights z.
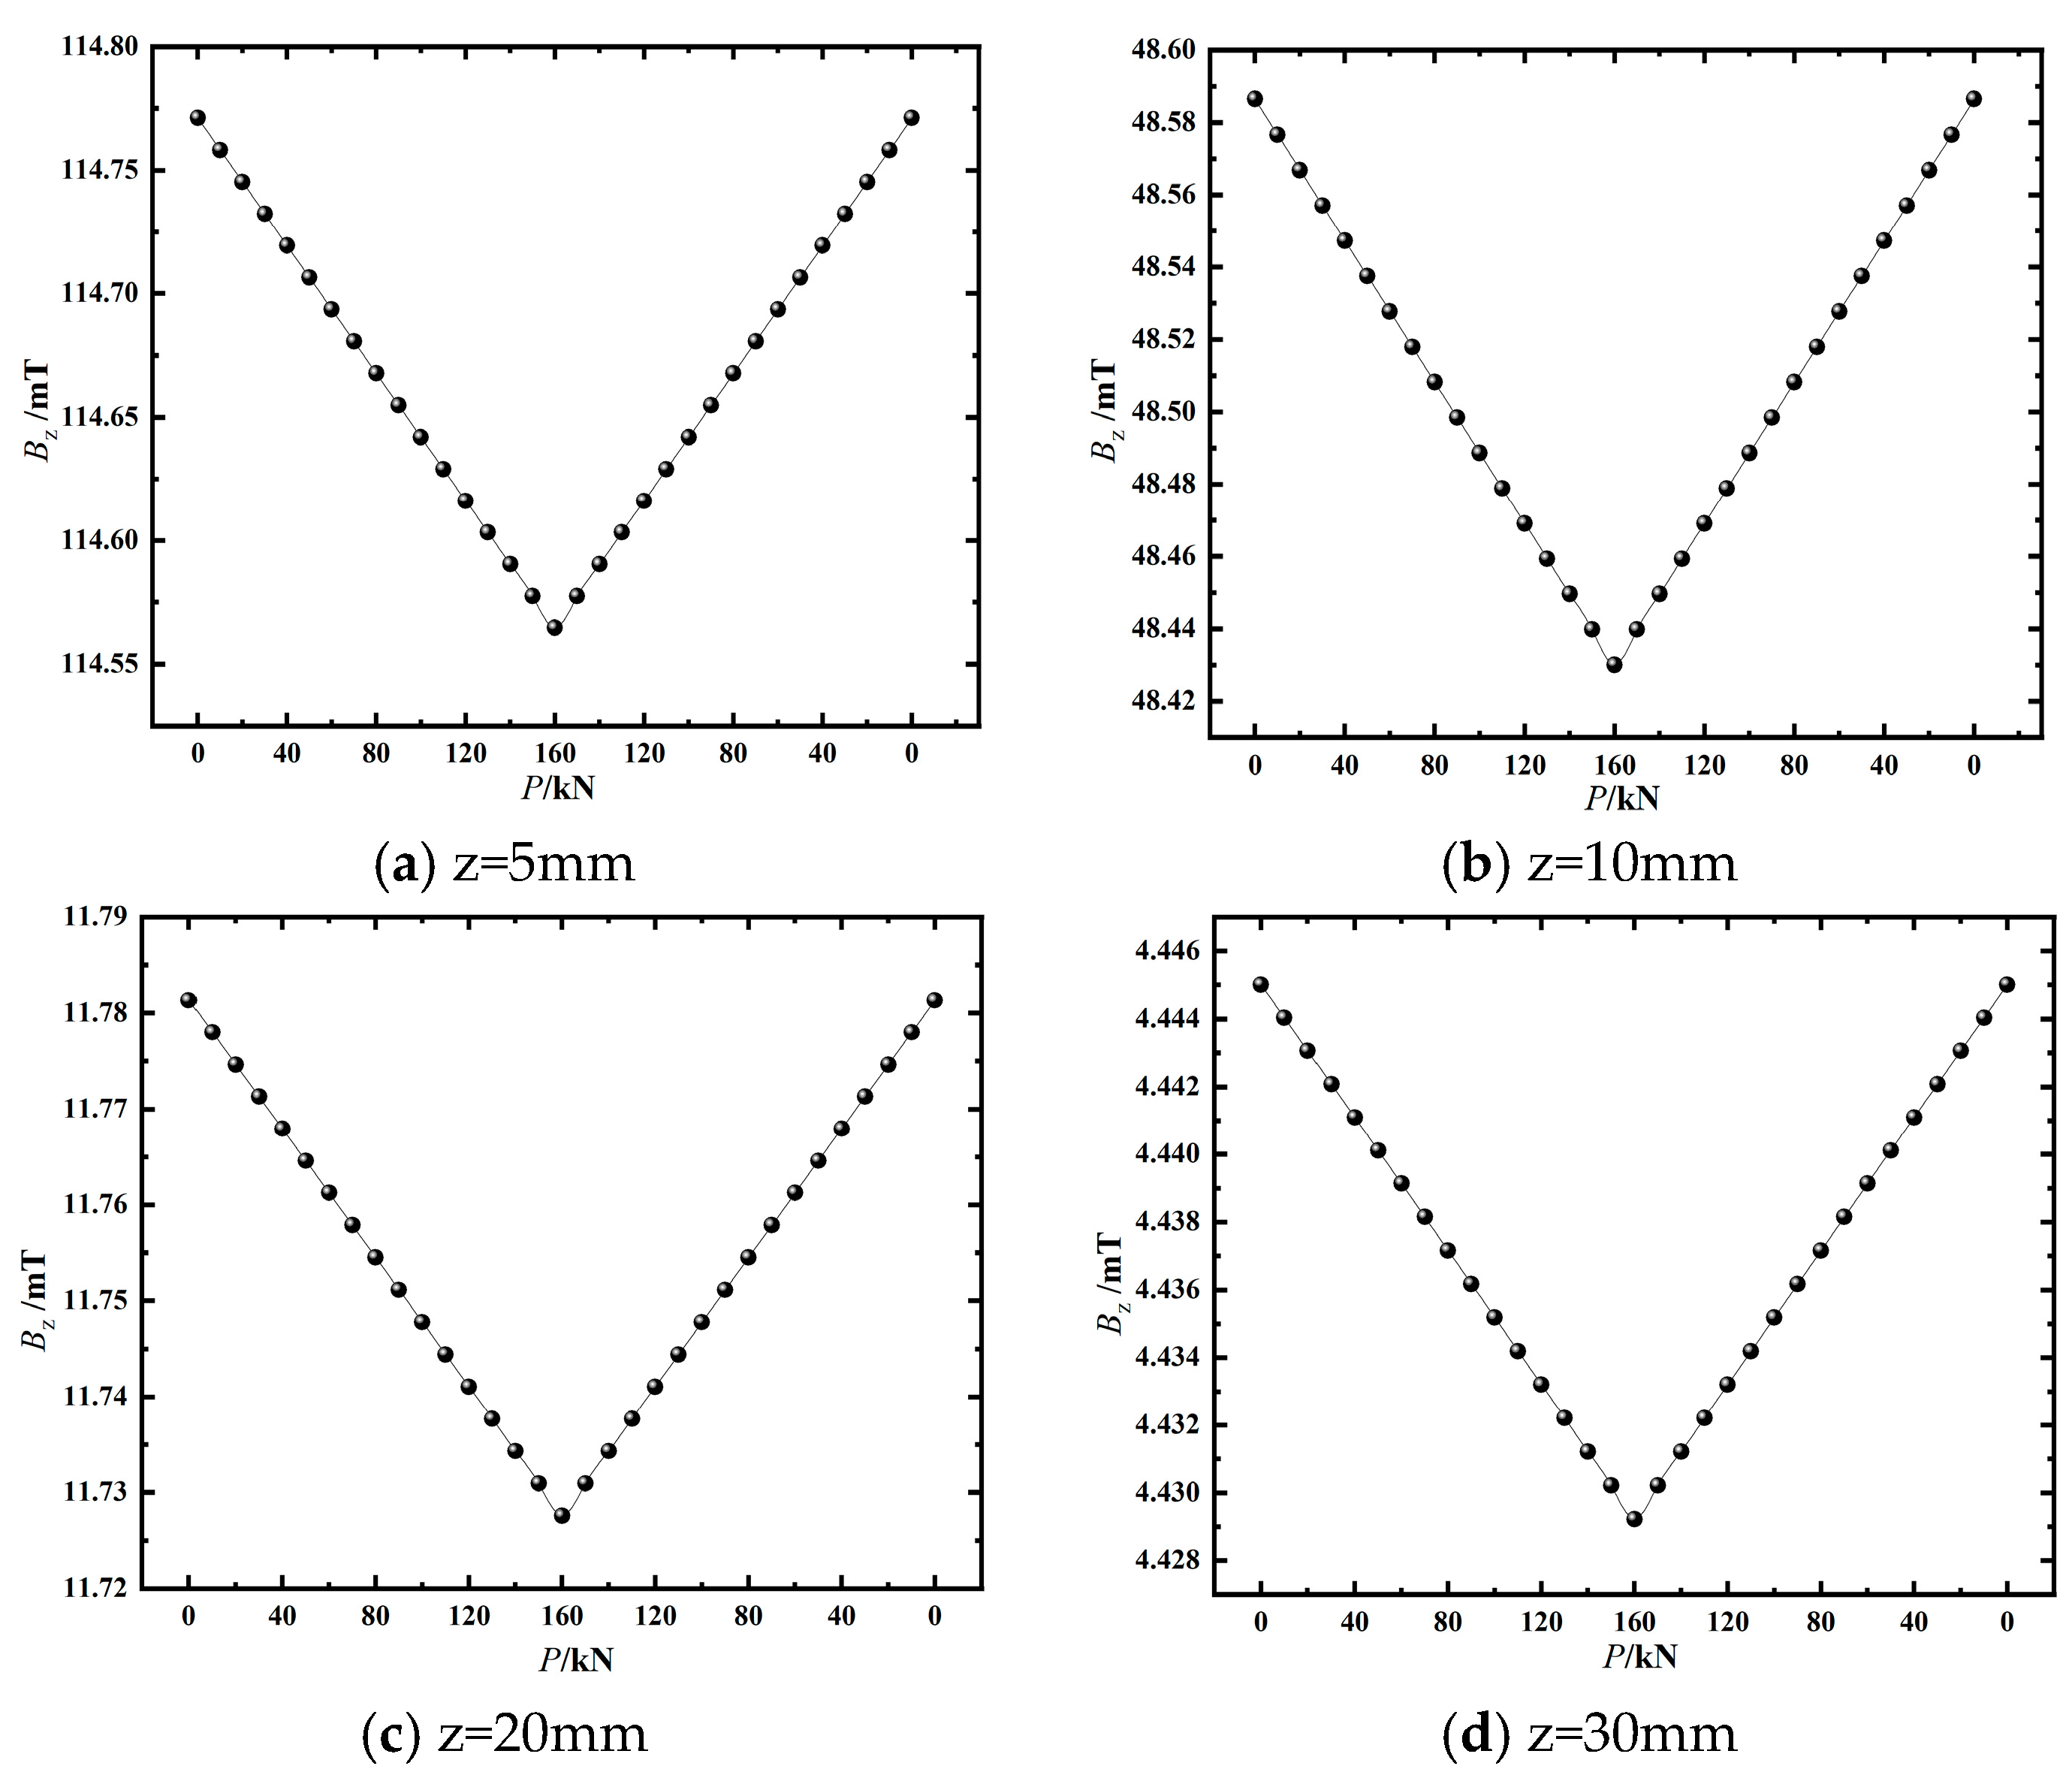
Figure 6.
Experimental platform.
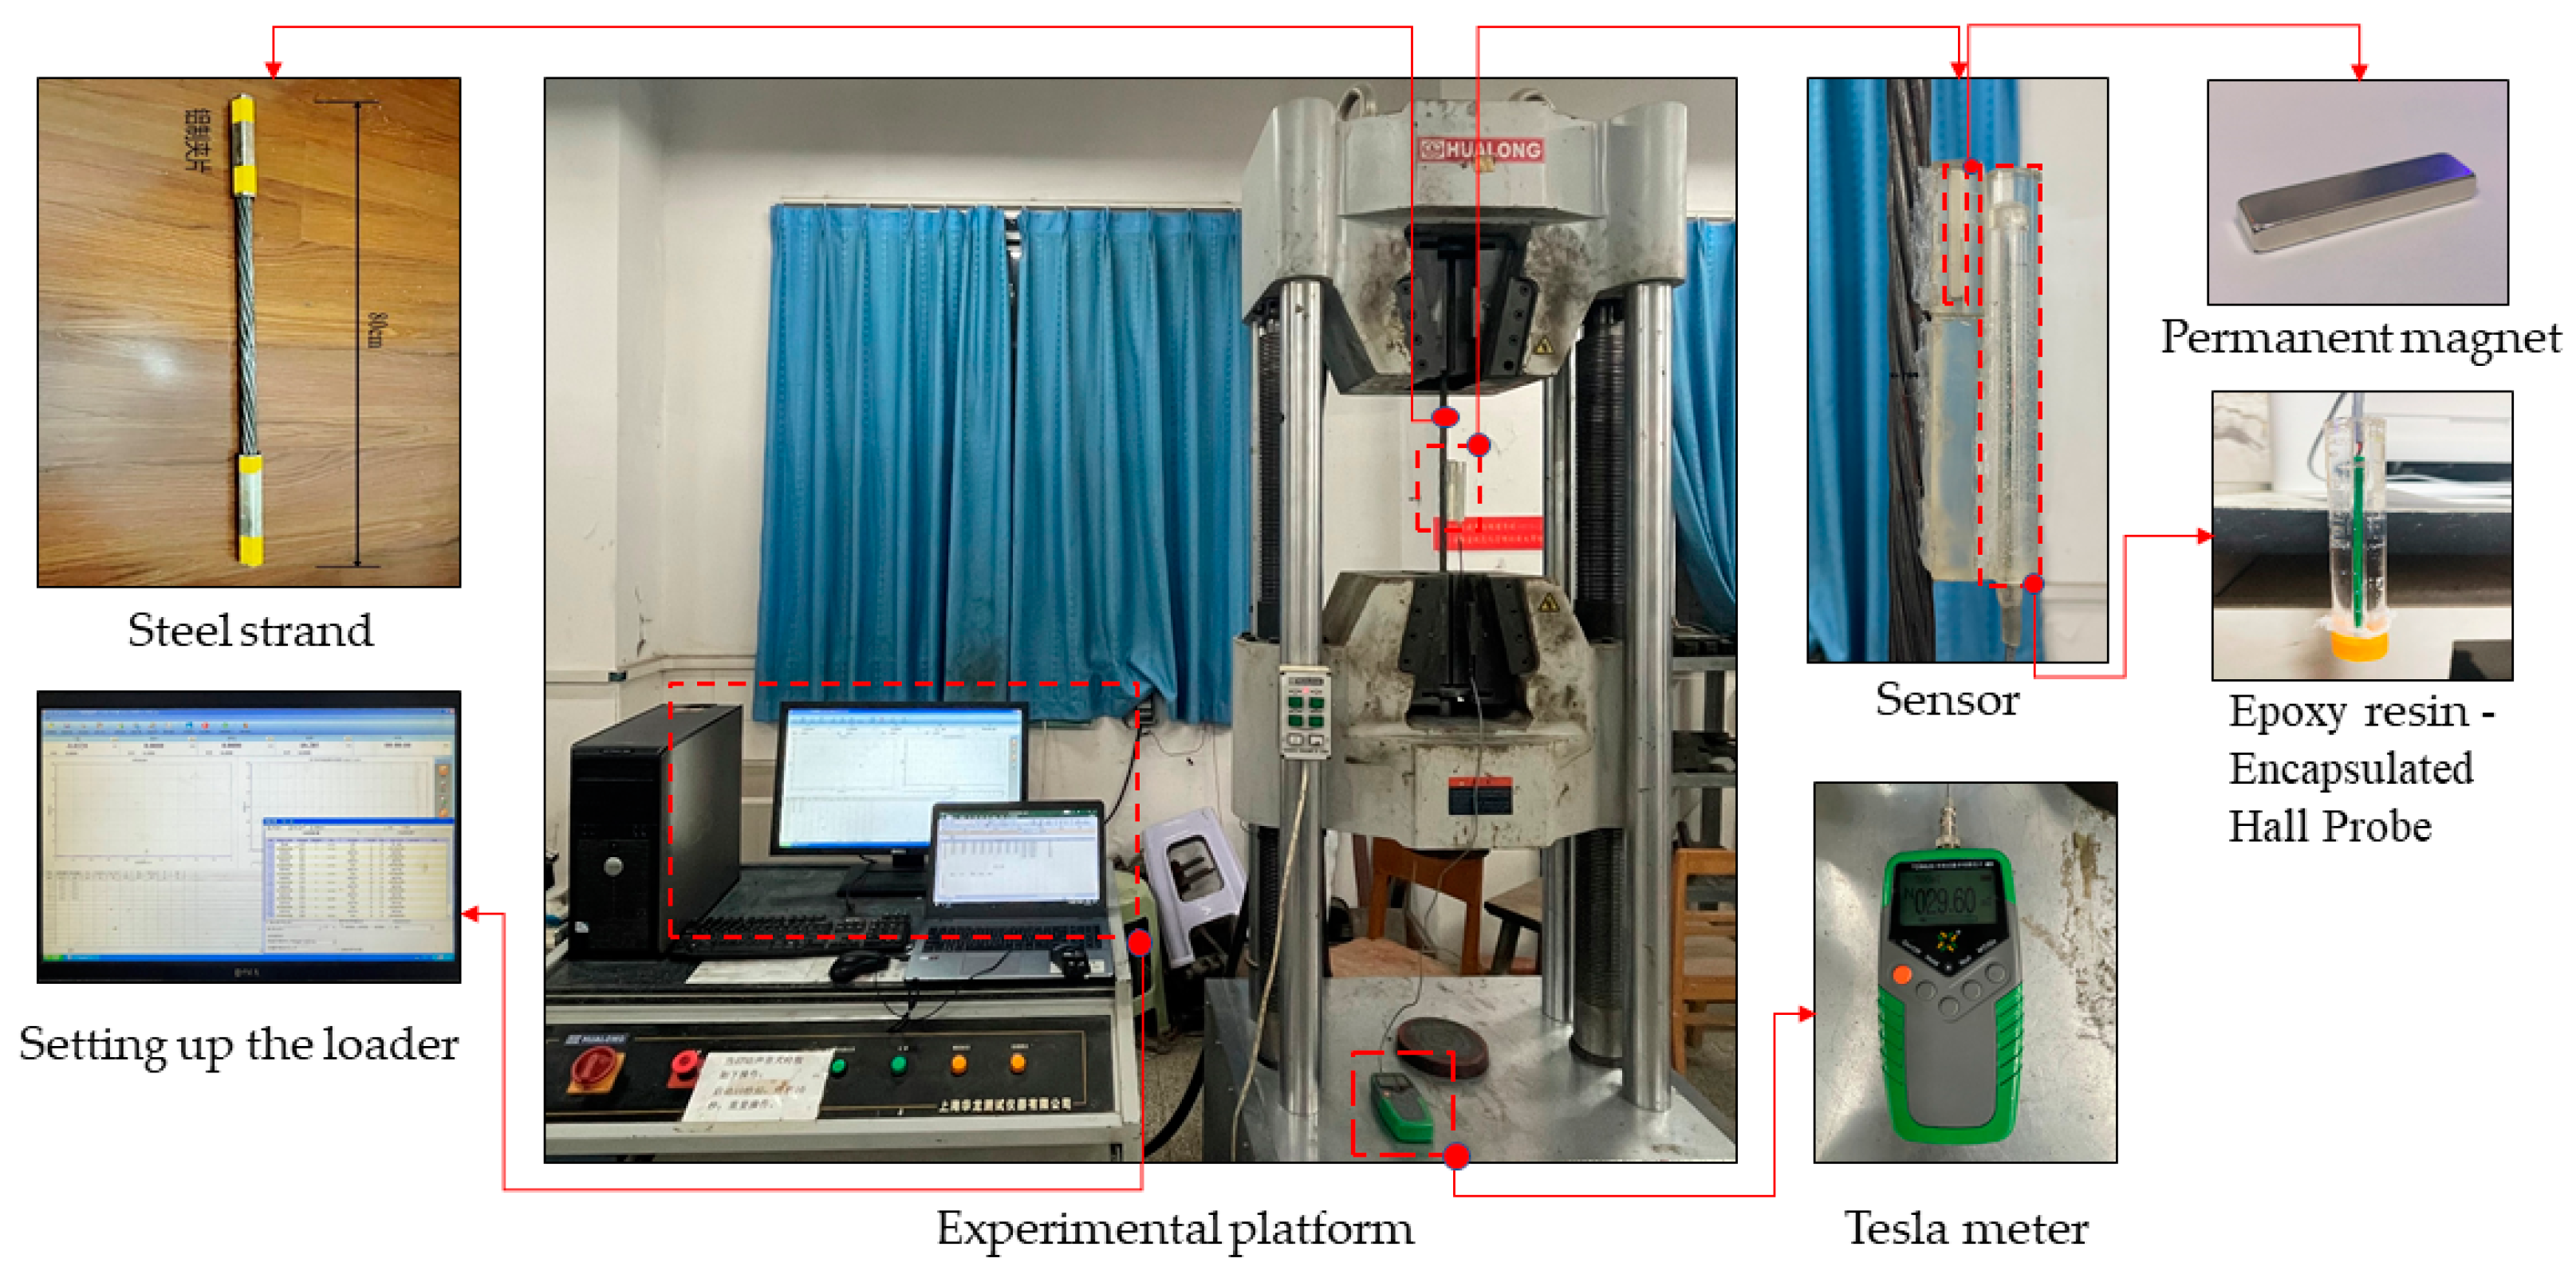
Figure 7.
Variation curve of magnetic induction intensity Bz during 10 cycles under condition A#.
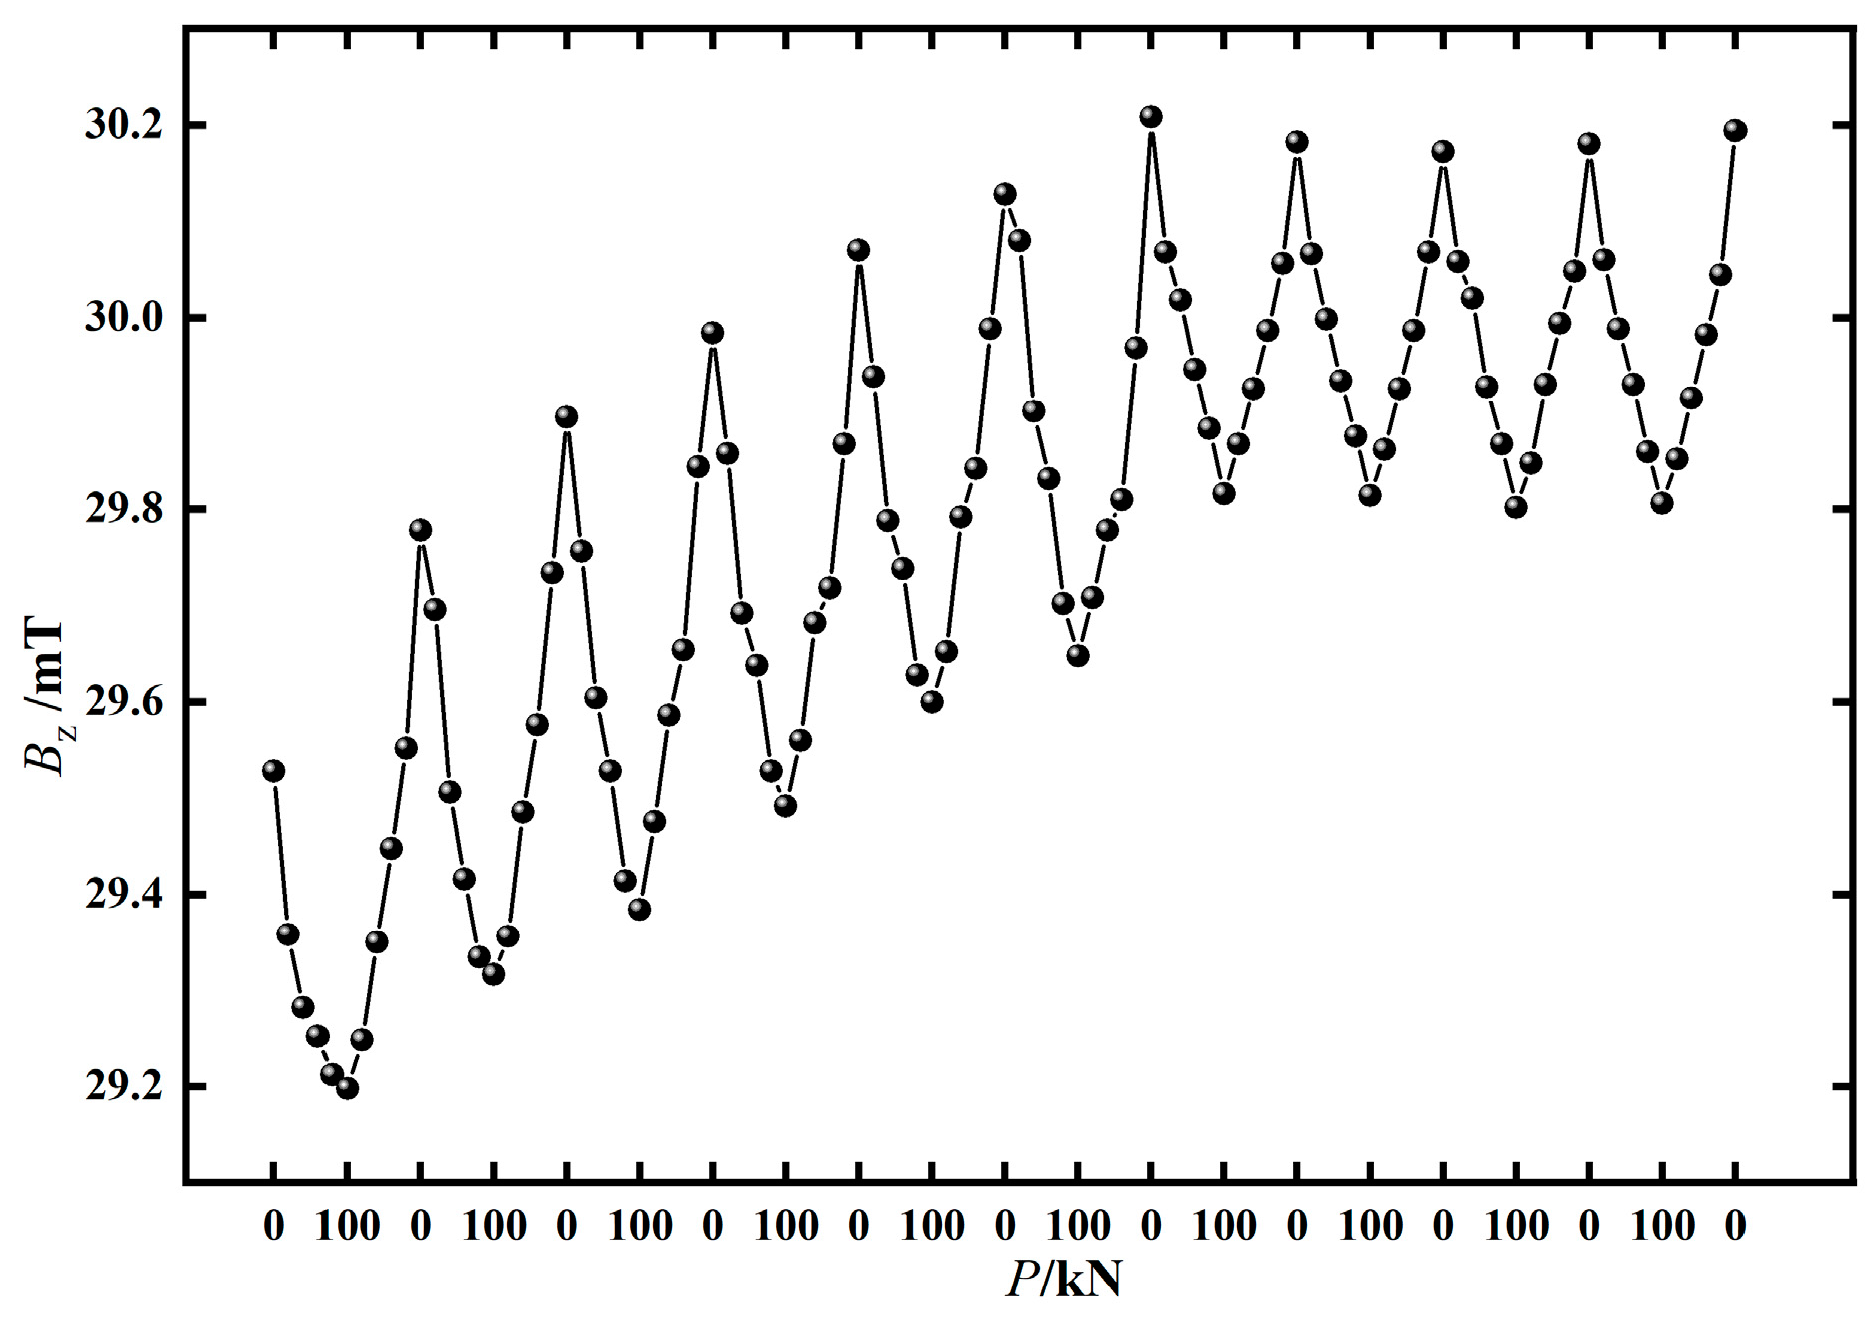
Figure 8.
Variation curve of Bz under different test design loads.
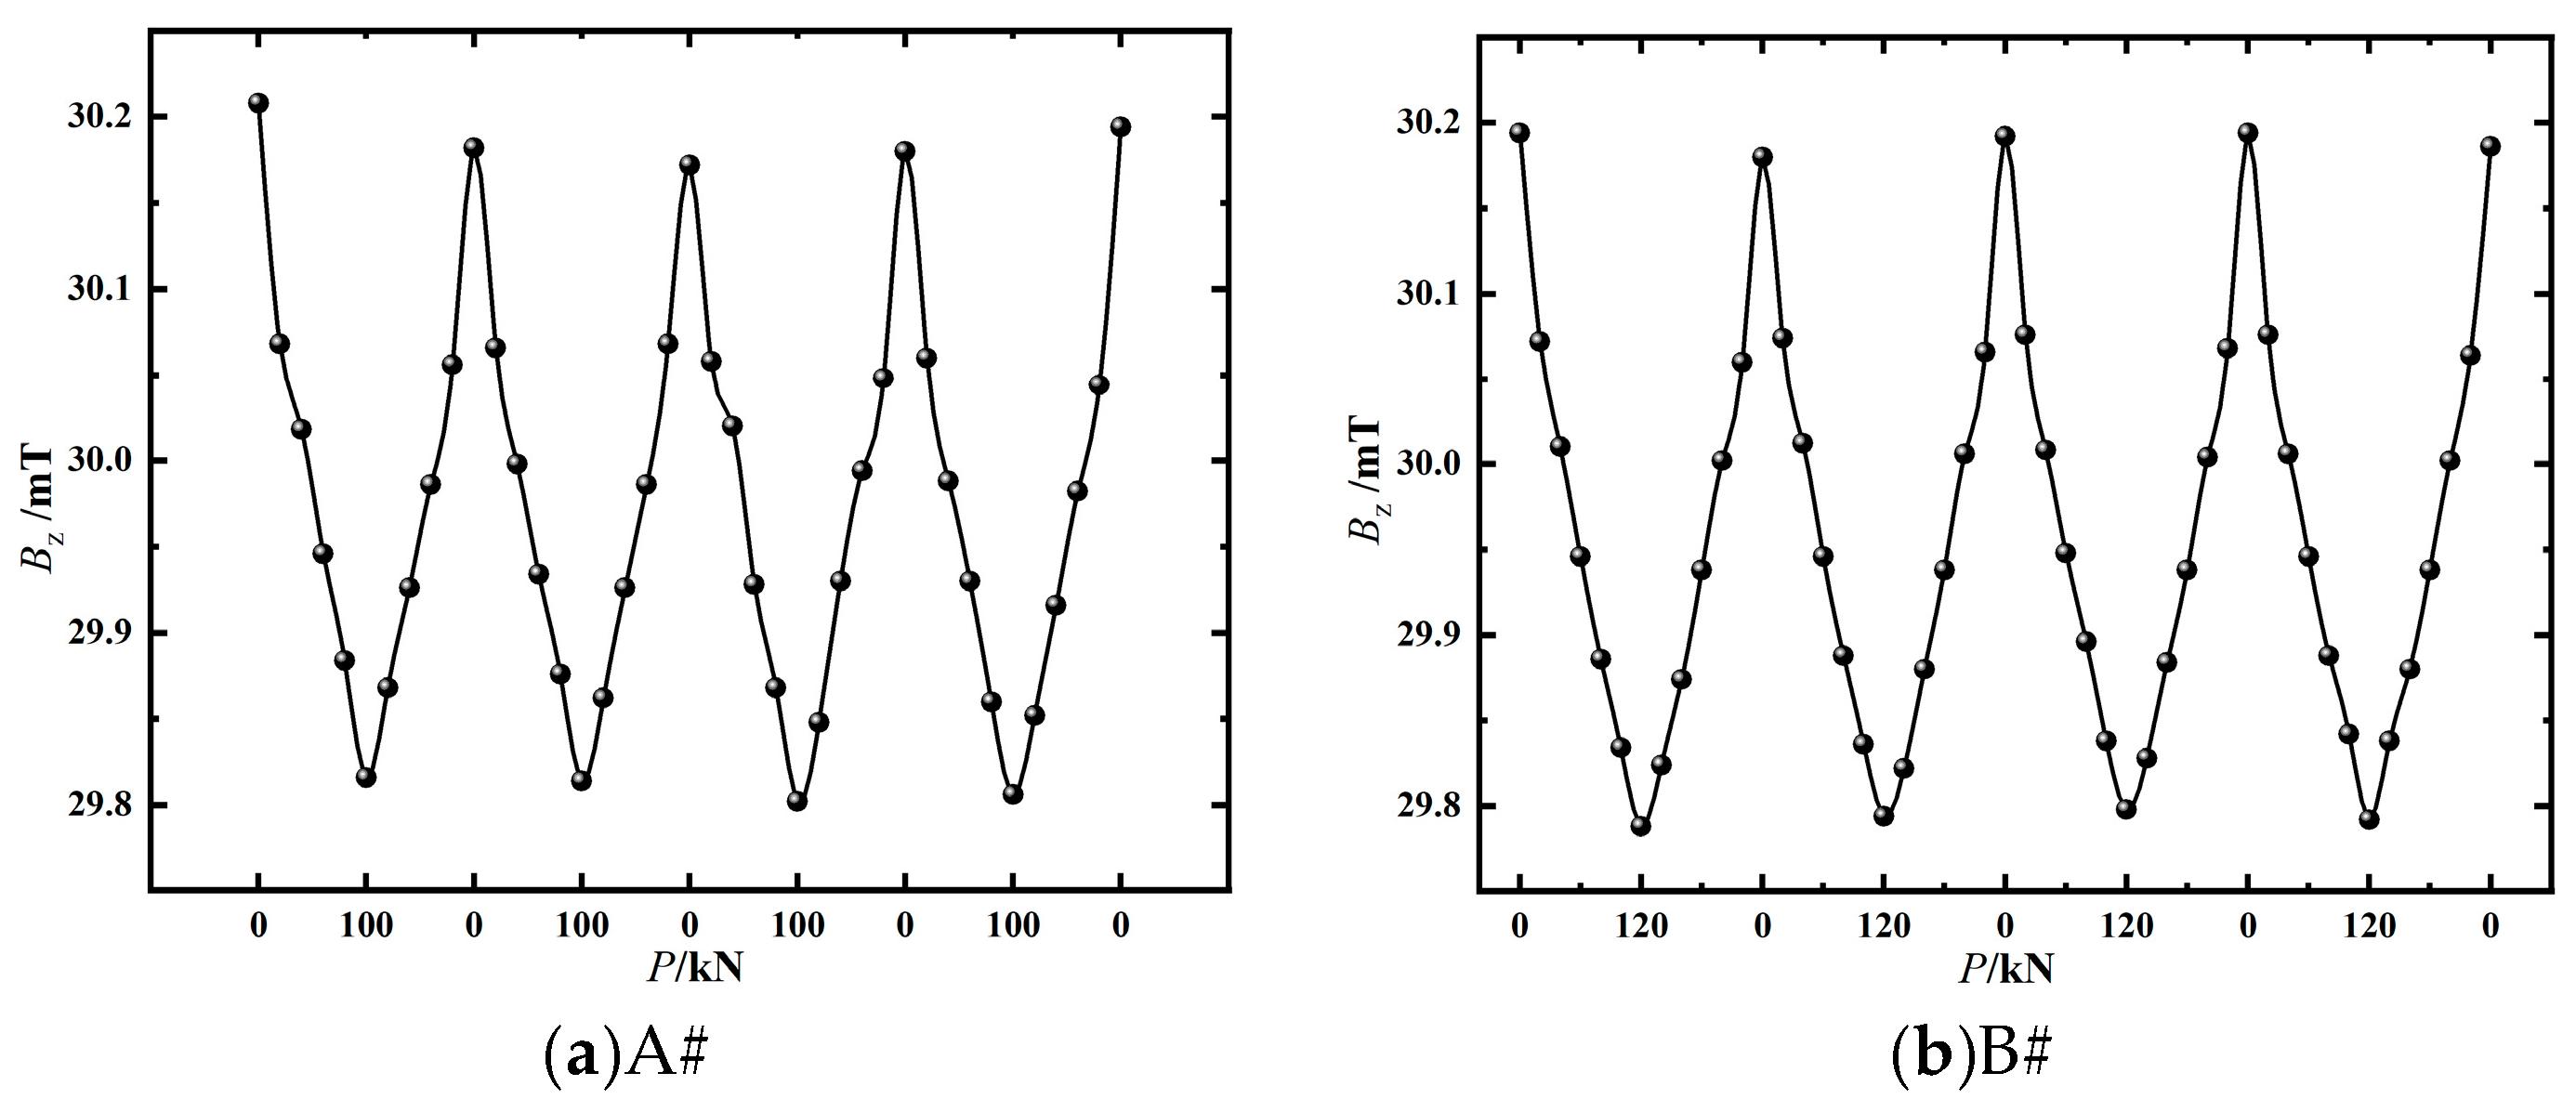
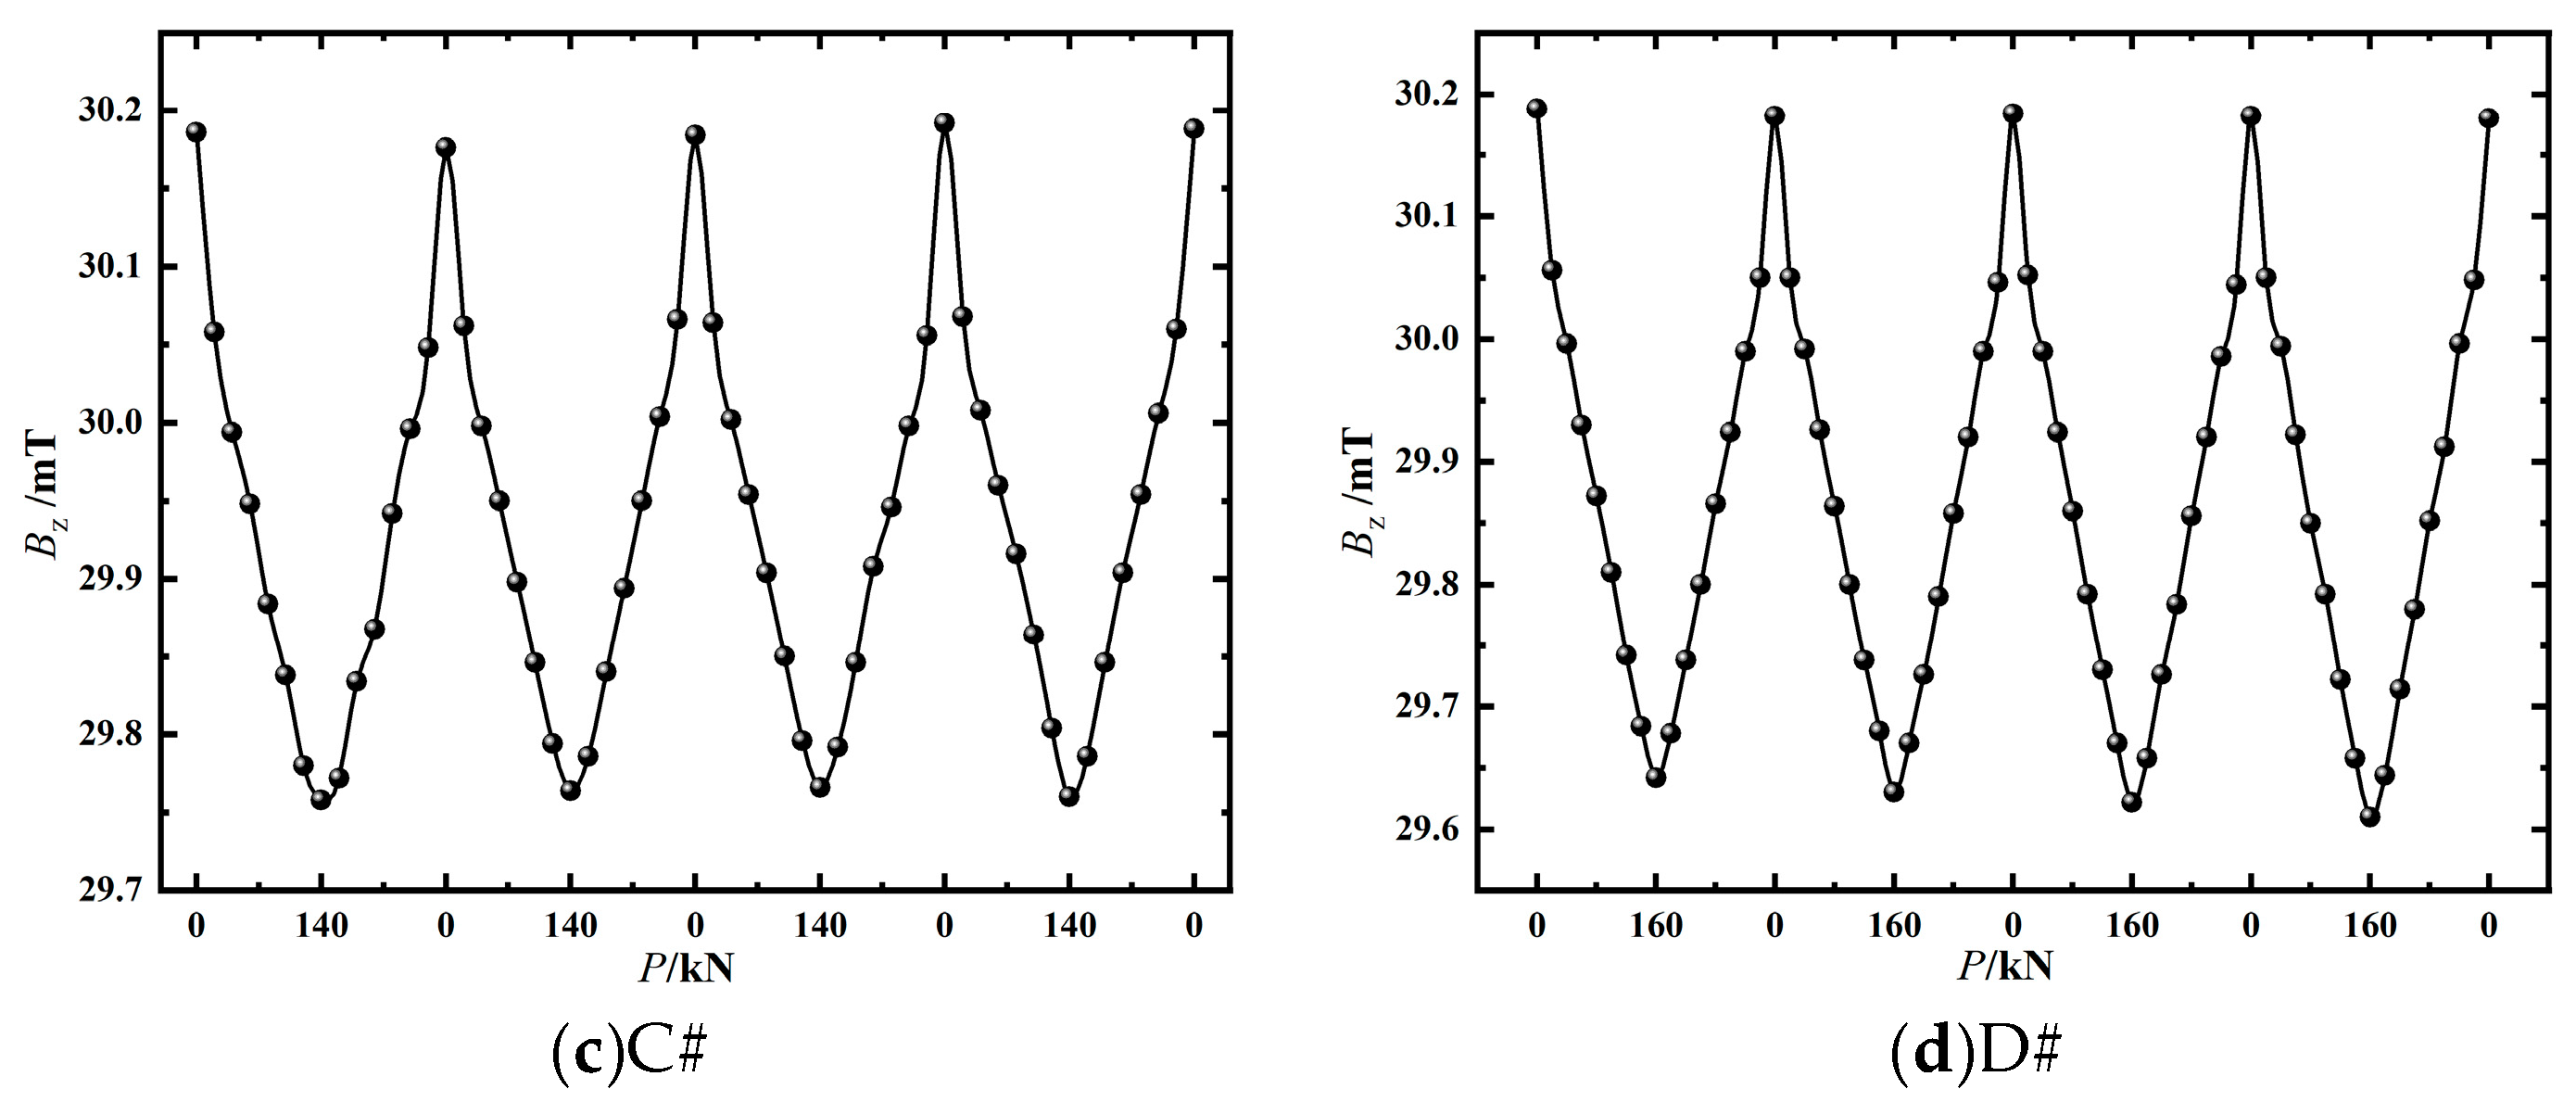
Figure 9.
Variation curve of Bz under different test design loads.
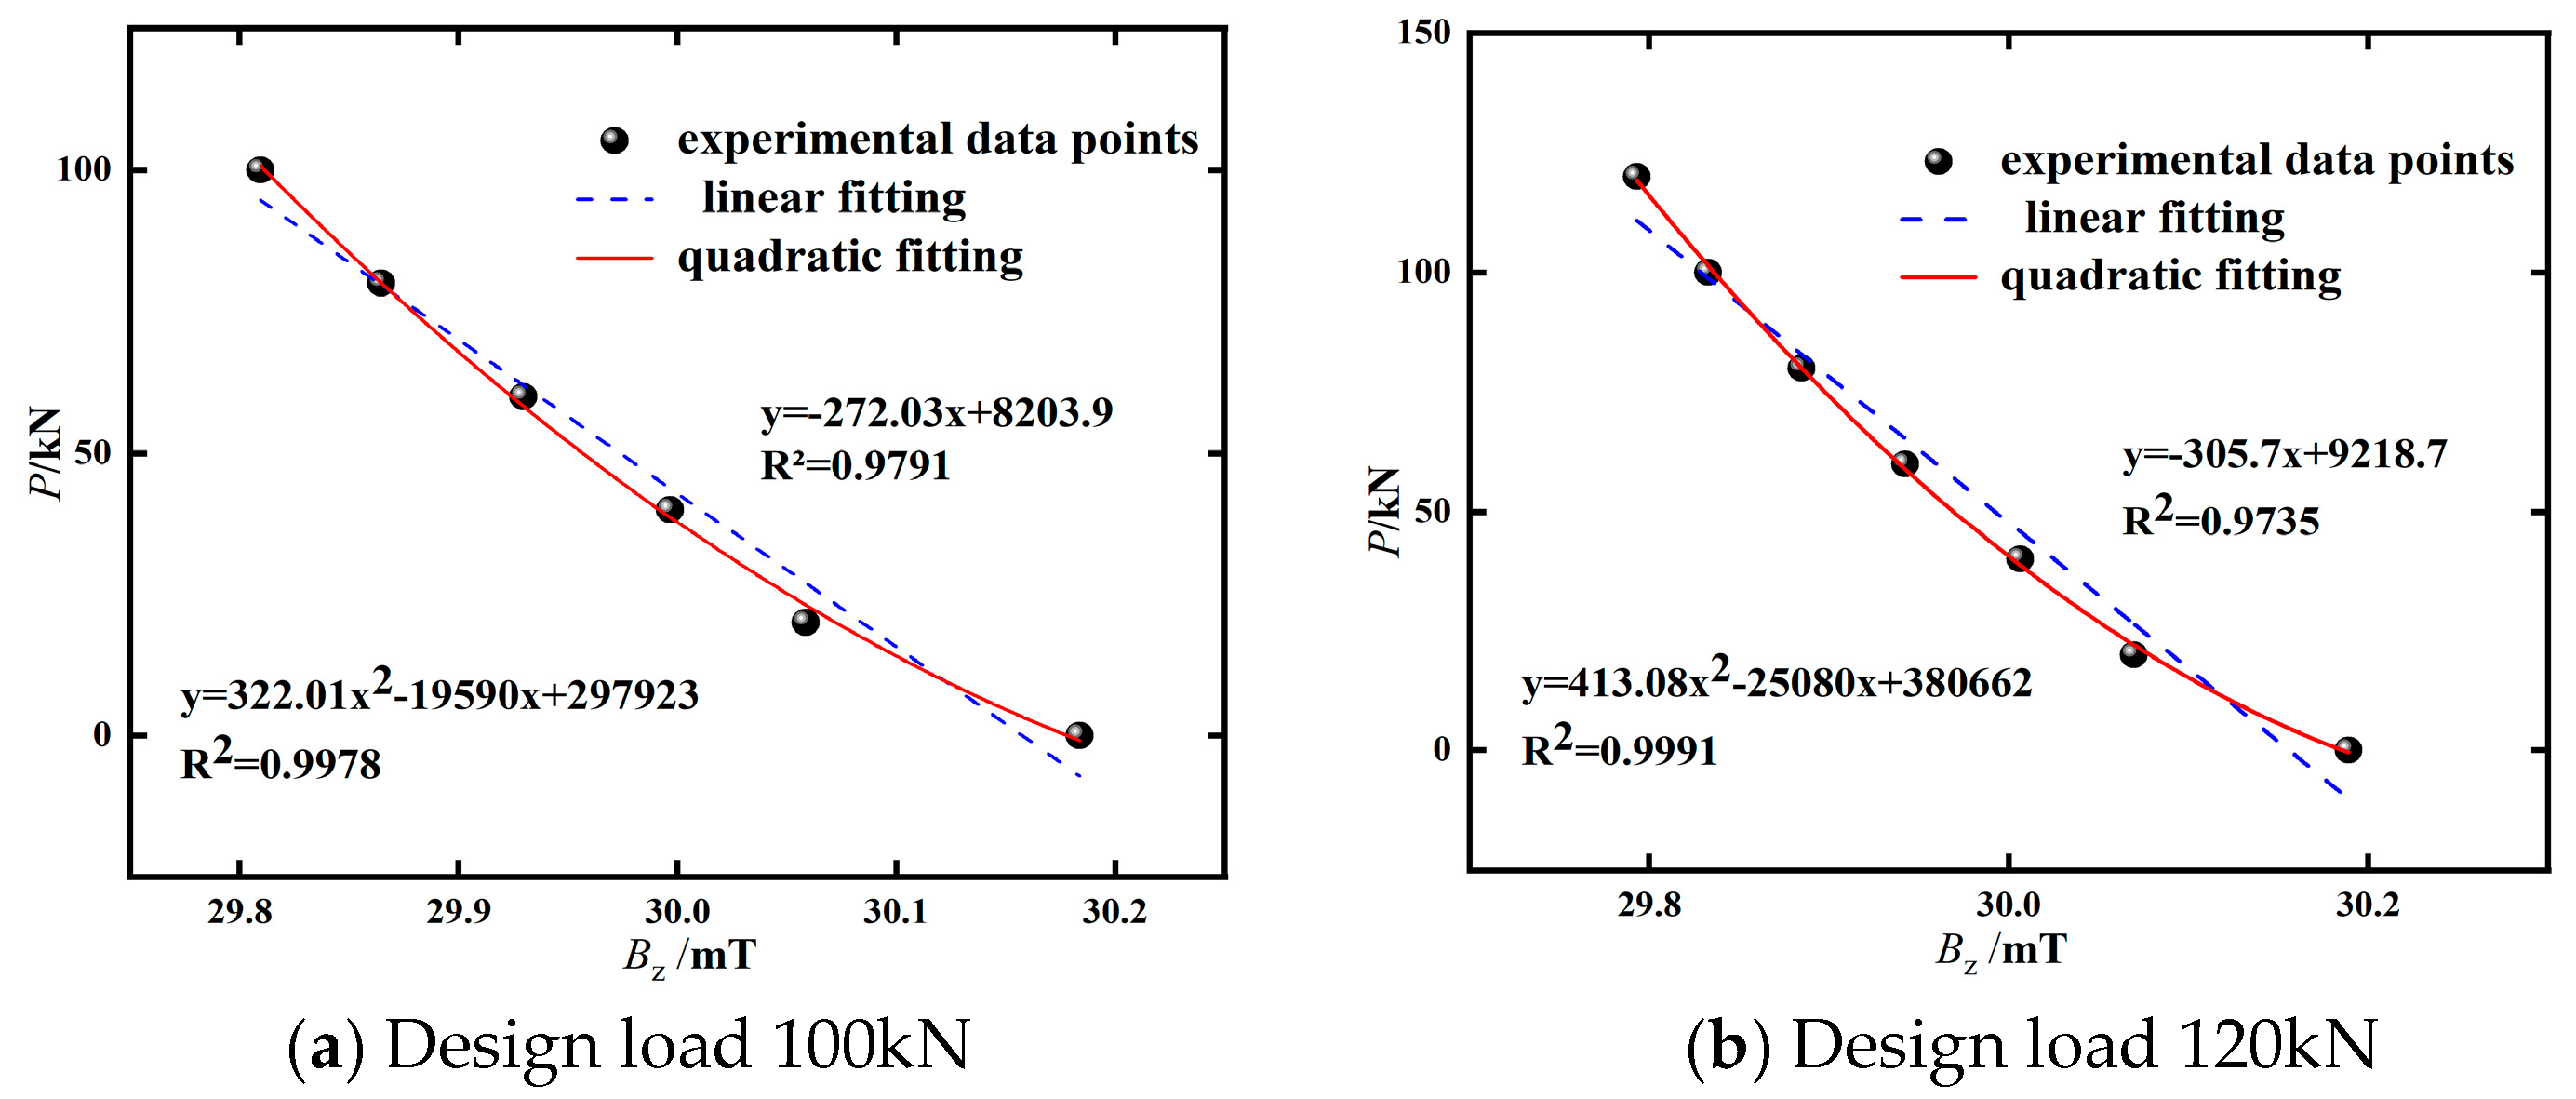
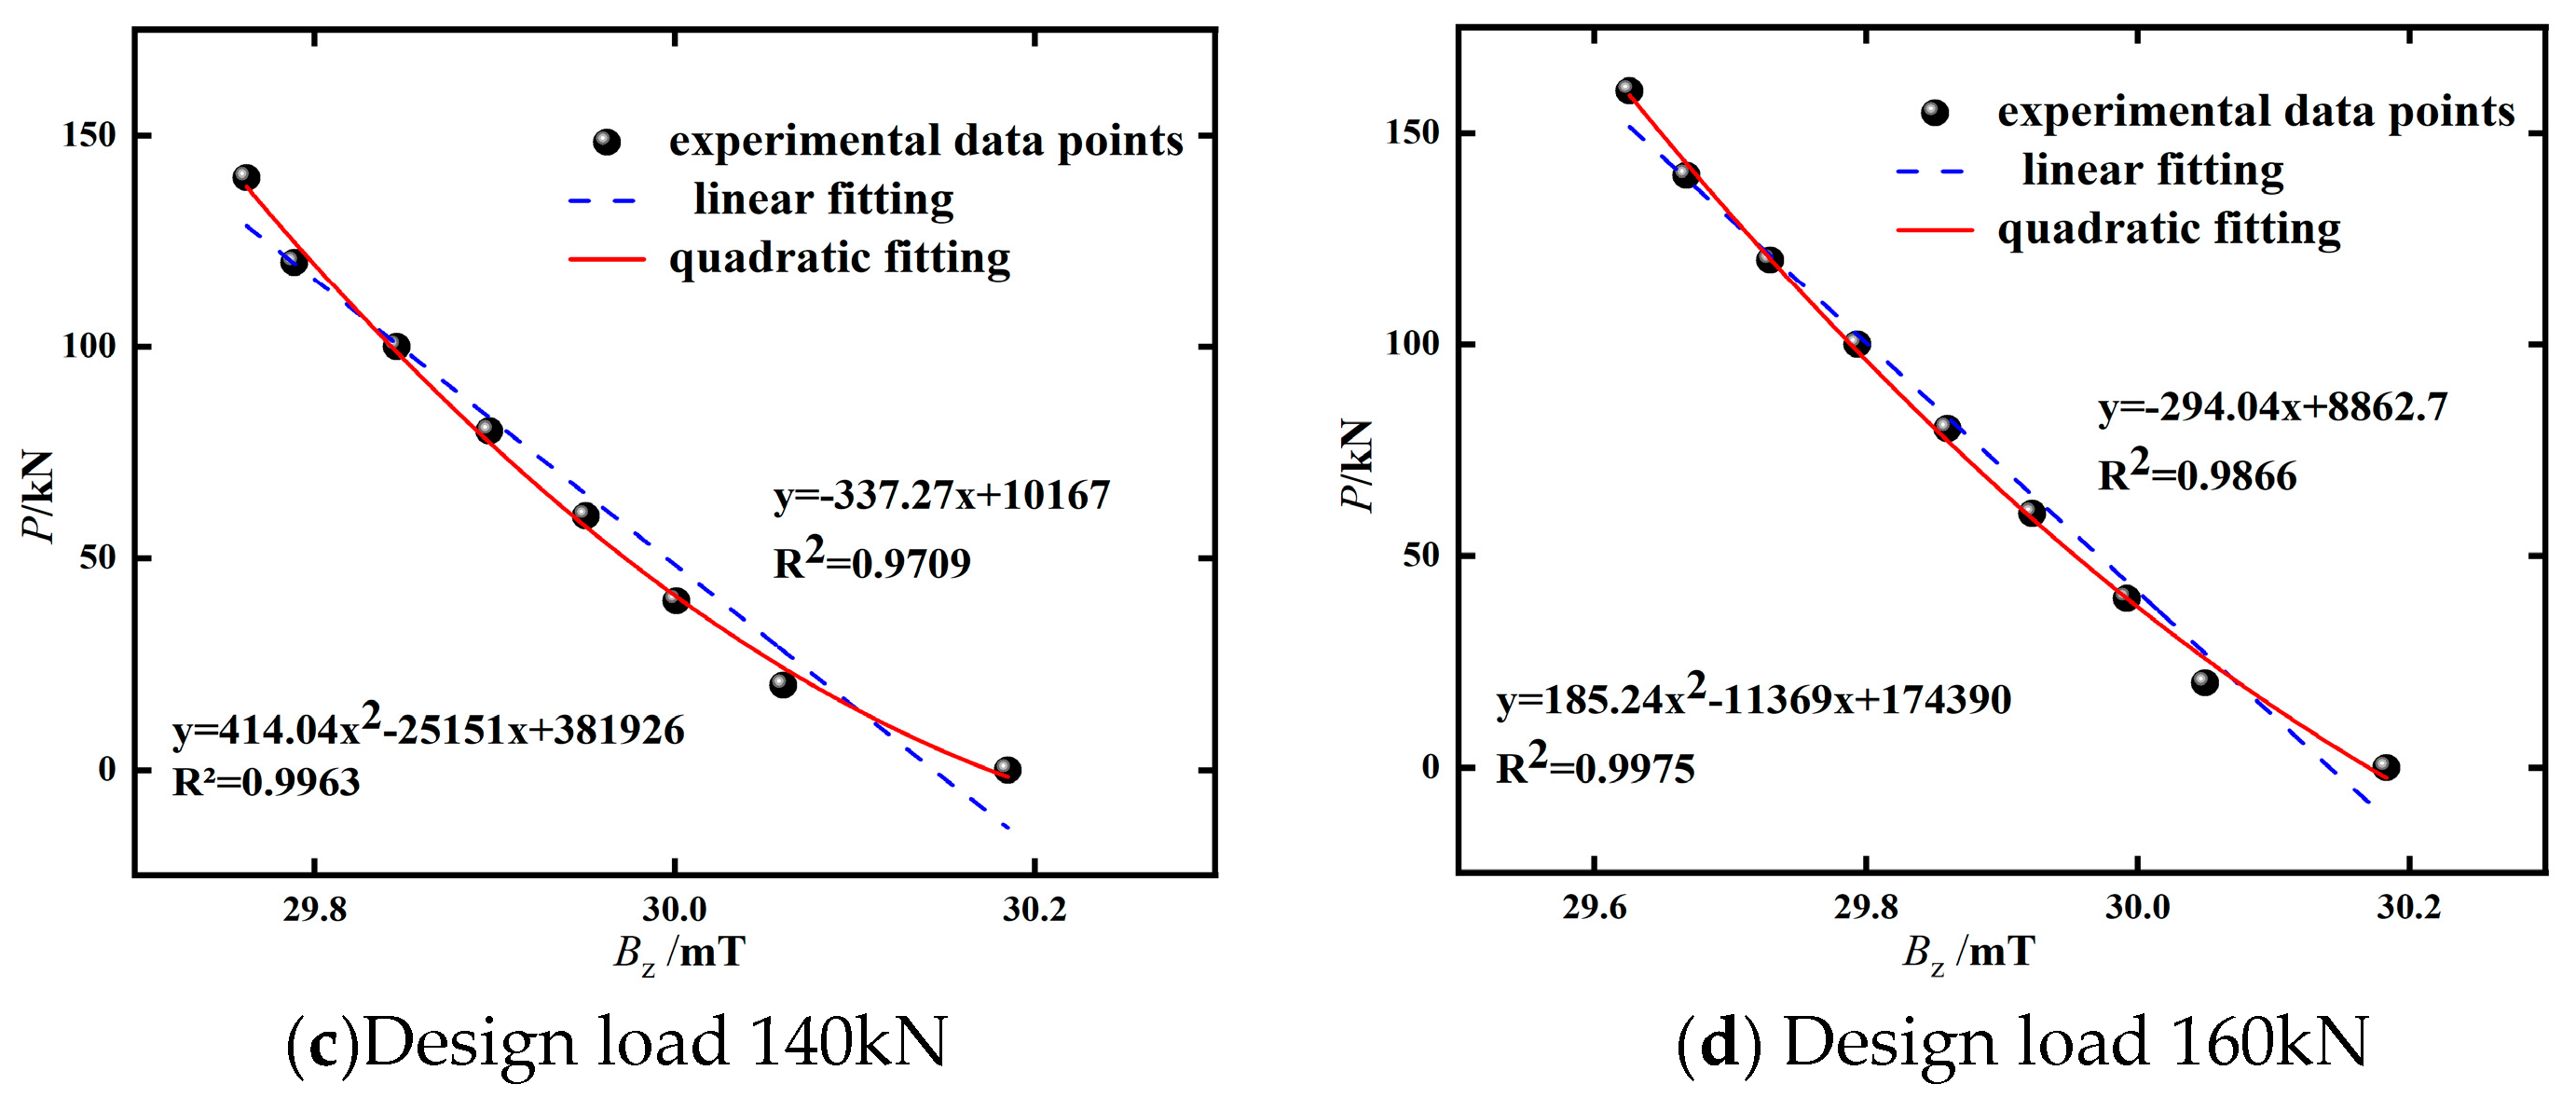
Figure 10.
Distribution of magnetic induction intensity Bz under different design loads.
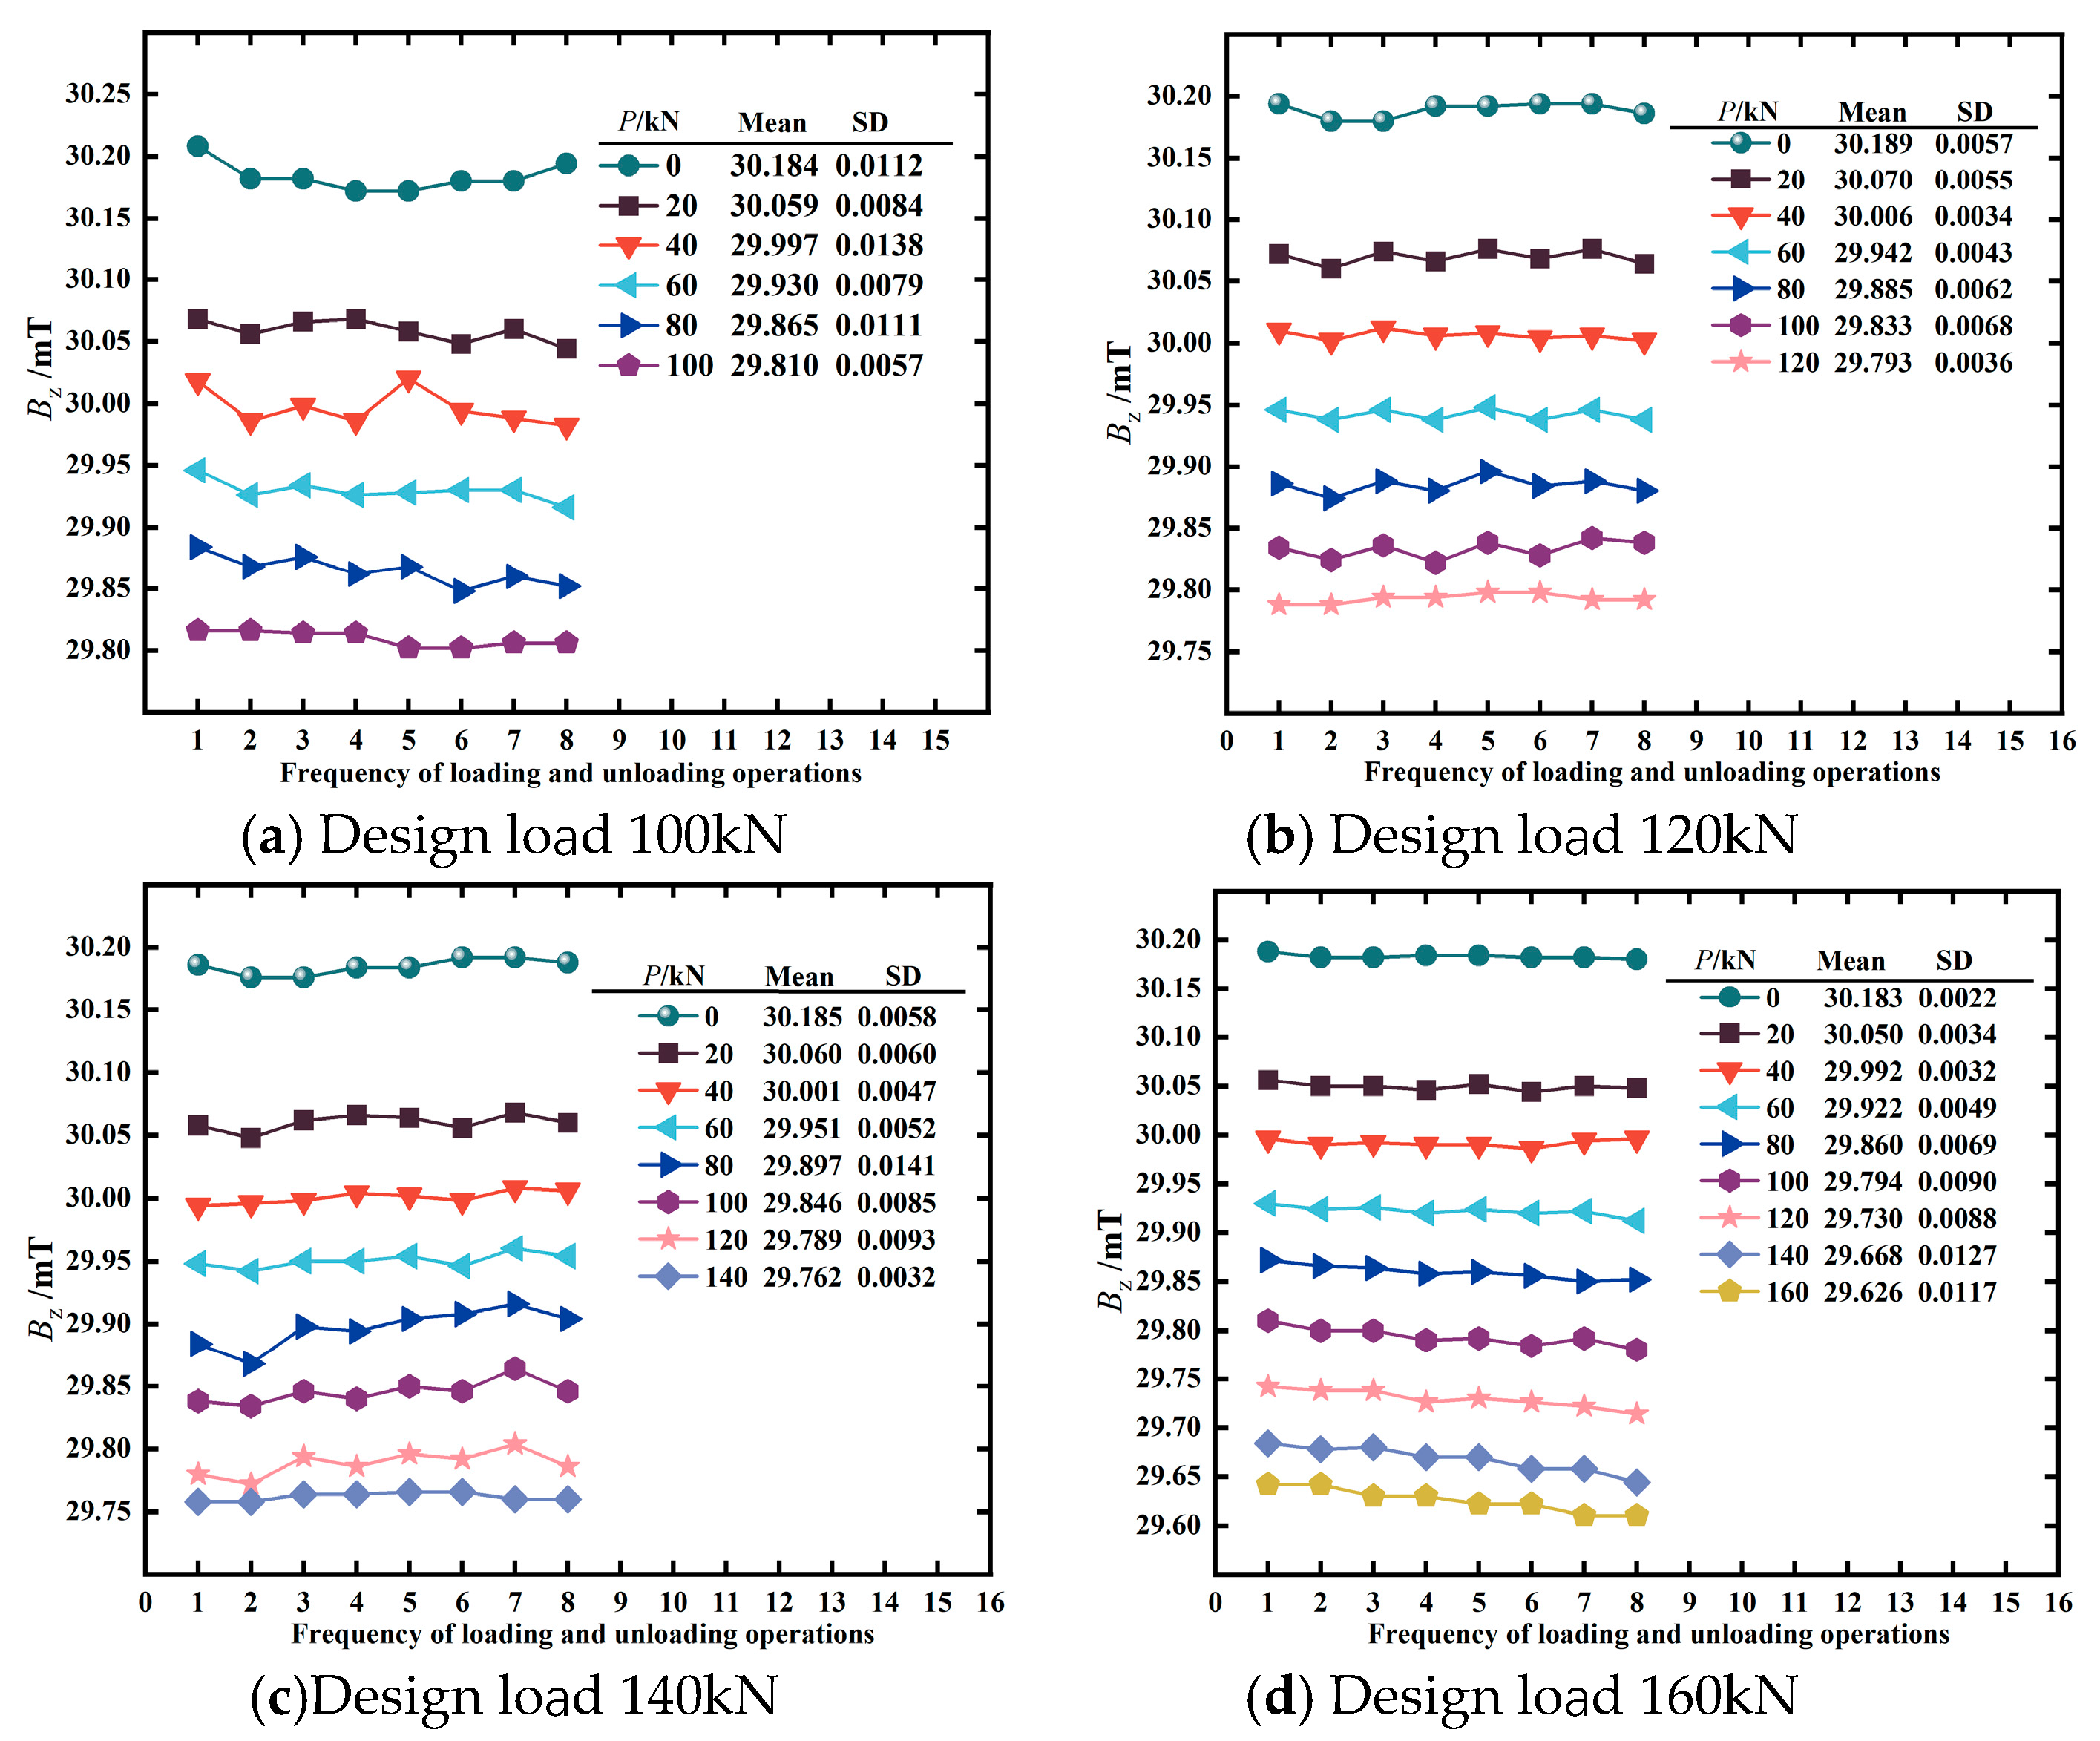

Table 1.
Experimental Condition Number
| Design load /kN | Cycle1 | Cycle2 | Cycle3 | Cycle4 | ||||
|---|---|---|---|---|---|---|---|---|
| Loading | Unloading | Loading | Unloading | Loading | Unloading | Loading | Unloading | |
| 100 | A-1-1 | A-1-2 | A-2-1 | A-2-2 | A-3-1 | A-3-2 | A-4-1 | A-4-2 |
| 120 | B-1-1 | B-1-2 | B-2-1 | B-2-2 | B-3-1 | B-3-2 | B-4-1 | B-4-2 |
| 140 | C-1-1 | C-1-2 | A-2-2 | A-2-3 | C-3-1 | C-3-2 | C-4-1 | C-4-2 |
| 160 | D-1-1 | D-1-2 | B-2-2 | B-2-3 | D-3-1 | D-3-2 | D-4-1 | D-4-2 |
Table 2.
Average magnetic induction intensity Bz under cyclic tensile loading for each condition.
| Working condition |
Bz/mT | |||||
|---|---|---|---|---|---|---|
| 0kN | 20 kN | 40 kN | 60 kN | 80 kN | 100 kN | |
| A# | 30.184 | 30.059 | 29.997 | 29.930 | 29.865 | 29.810 |
| B# | 30.186 | 30.064 | 30.002 | 29.938 | 29.880 | 29.838 |
| C# | 30.185 | 30.060 | 30.001 | 29.951 | 29.897 | 29.846 |
| D# | 30.183 | 30.050 | 29.992 | 29.922 | 29.860 | 29.794 |
Disclaimer/Publisher’s Note: The statements, opinions and data contained in all publications are solely those of the individual author(s) and contributor(s) and not of MDPI and/or the editor(s). MDPI and/or the editor(s) disclaim responsibility for any injury to people or property resulting from any ideas, methods, instructions or products referred to in the content. |
© 2025 by the authors. Licensee MDPI, Basel, Switzerland. This article is an open access article distributed under the terms and conditions of the Creative Commons Attribution (CC BY) license (http://creativecommons.org/licenses/by/4.0/).
Copyright: This open access article is published under a Creative Commons CC BY 4.0 license, which permit the free download, distribution, and reuse, provided that the author and preprint are cited in any reuse.


