
Submitted:
10 January 2025
Posted:
11 January 2025
You are already at the latest version
Abstract
Calculating the angle of refraction when X-rays pass through an object is a fundamental concern in X-ray phase-contrast imaging. When using wave optics to calculate the angle of refraction, several challenges arise. First, when the phase of the object changes significantly, the angle of refraction is divergent. Second, the method is unable to address the case of point-source illumination, specifically regarding the influence of the X-ray source's focal spot size on the angle of refraction. Here, a geometric optics based method is established to simulate the propagation-based X-ray phase-contrast imaging (pbXPCI) and calculate the angle of refraction. The results indicate that the angle of refraction can be effectively determined by geometric optics even when the phase of the object changes significantly, and reducing the focal spot size of the X-ray source and the pixel size of the detector will result in a larger angle of refraction. The results also indicate that the angle of refraction would vary with the object’s position and the system’s length, rather than remaining constant regardless of its location.
Keywords:
X-ray phase-contrast imaging
; angle of refraction
; focal spot size
1. Introduction
X-ray phase-contrast imaging is a technique for detecting small angle of refraction after X-ray passing through an object [1,2,3,4,5]. For weakly absorbing objects, X-ray phase-contrast images can provide much higher contrast than absorption images [6,7]. Therefore, X-ray phase-contrast imaging has played an important role in cartilage detection [8,9,10], material inspection [11,12,13] and many other fields [14,15,16]. There are five main methods that enable X-ray phase-contrast imaging, namely: crystal interferometry [17], propagation-based X-ray phase-contrast imaging (pbXPCI) [18,19,20,21], diffraction enhanced imaging (DEI) [22], grating-based X-ray interferometry (gbXI) [23,24,25] and edge illumination (EI) [26,27]. Two main methods that have received much attention are gbXI and pbXPCI. The former method can quantitatively retrieve the absorption, phase-contrast and scattering information of an object, but the imaging energy is limited by the absorption grating and the field of view is limited by the size of the analyzer grating [28,29]. The latter method provides high-resolution images, but it is difficult to completely separate phase information from absorption information [30].
In X-ray phase-contrast imaging, utilizing wave optics to calculate the angle of refraction when X-rays pass through an object is a widely used method, and often the only one available. For the case of plane-wave illumination and the phase of the object changes gradually, the calculated angle of refraction and experimental results have very good consistency. However, as Wilkins pointed out in the literature [18], in some special cases, such as the position where the phase of the object changes significantly, the angle of refraction calculated by wave optics is divergent. Moreover, this method assumes that the incident X-rays are plane waves, for the case of point-source illumination, calculating the angle of refraction will be challenging. Furthermore, the impact of focal spot size of X-ray source on the angle of refraction is frequently disregarded. As is well known, when the angle of incidence changes, the angle of refraction also changes. Therefore, when using an extended X-ray source for illumination, the X-rays emitted from different source’s positions result in different angles of refraction. When calculating the angle of refraction, the weighted average of the detected angles of refraction within a pixel should be considered, with the weighting factor depending on the number of photons corresponding to each angle. It is evident that both the focal spot size of the X-ray source and the pixel size of the detector will impact the angle of refraction. Another interesting aspect is that in different X-ray phase-contrast imaging systems, the interactions between objects and X-rays are described by different theories. Namely, when X-rays passing through an object, it will be diffracted in the propagation-based X-ray phase-contrast imaging system [15], whereas X-ray will be refracted in the grating-based X-ray interferometry [5]. In the above two different X-ray phase-contrast imaging systems, if a same theory can be used to describe the interaction between X-rays and objects, it would advance the development of X-ray phase-contrast imaging.
As is well known, the larger the atomic number of an object, the larger refractive index decrement[4]. When applying wave optics to calculate the angle of refraction, it is observed that a largercorresponds to a larger angle of refraction. Therefore, objects with higher atomic numbers (i.e., those exhibiting larger linear absorption coefficient) have larger, and should exhibit larger angles of refraction. However, for objects with stronger X-ray absorption, the effect of edge enhancement is less pronounced [31]. From the perspective of geometric optics, while an object with larger linear absorption coefficient results in a greater angle of refraction, it also leads to fewer photons being refracted at the object’s edge. This reduction in refracted photons ultimately diminishes the edge enhancement effect. Therefore, in this paper, we will verify that geometric optics, specifically Snell’s law, can address the aforementioned problems, thereby offering new insights into the principle of pbXPCI. Moreover, by applying Snell’s law to calculate the angle of refraction, we can identify key factors that limit the enhancement of the angle of refraction, providing theoretical guidance for improving X-ray phase-contrast signals in pbXPCI and gbXI.
2. Theory
In propagation-based X-ray phase-contrast imaging, when the object is illuminated by hard X-ray and the pixel size of the detector is over ten micrometers, the Fresnel number is usually approximately equal to or greater than 1, and the diffraction effect is extremely weak. Therefore, one can try using the geometric optics, that is Snell’s law, to describe the interaction between X-rays and objects [32].
As illustrated in Figure 1, an X-ray point source S(x0, 0), is located on the negative half of the X-axis, and X-rays illuminate a sphere with a radius of r and a center at the origin of the coordinates. A ray emitted by the X-ray point source is incident on a point A (x1, y1) of the sphere. The angle between the line connecting point S and point A and the X-axis is denoted as a0, and the angle between the tangent to the sphere at the point A and the X-axis is denoted as. The angle of incidencecan be calculated by the following formula:
Then the angle of refractionof X-ray inside the sphere can be calculated by using Snell’s law, that is:
whereandare the refractive index of the air and the sphere, respectively. In the hard X-ray regime, the refractive index of the airis approximately equal to 1, and the difference between the refractive index of the object and that of air is about 10-6 orders of magnitude. Therefore, the angle of refractionwill be slightly larger than the angle of incidence, the difference between the two angle is denoted as:
After the X-ray is transmitted inside the sphere, it reaches the exit point B. The slope of the line between A and B is given by:
The intercept of the line between point A and point B is:
At this time, the abscissa of the exit point B can be calculated by:
Then the tangent slopeat point B can be calculated by using the abscissaof the exit point B and the equation of the sphere:
The anglebetween the tangent and the X-axis can be calculated by using the tangent slope:
Then the angle of incidenceof X-ray at point B can be obtained:
Once again, the angle of refractioncan be calculated by using Snell’s law:
According to the geometric relationship between the angles in the Figure 1, the angle of refractionof the X-ray after passing through the sphere can be calculated by:
The anglebetween the X-ray emitted from point B and the x-axis is:
The slopeof the X-ray emitted from point B is:
The intercept of the X-ray emitted from point B is:
whereis the ordinate of the exit point B, and the ordinateof the intersection of the exit X-ray and the detector at (xz, 0) can be calculated by:
As a comparison, the formula for calculating the angle of refractionby wave optics is as follow [18]:
whereis the refractive index difference between the inside and outside of the sphere.
3. Results
3.1. Comparison of Intensity Distributions
Figure 2a and Figure 2b are the X-ray intensity distributions of the sphere simulated by Fresnel-Kirchhoff diffraction and the Snell’s law, respectively. The object used in the simulation was a PMMA (polymethyl methacrylate) sphere with a diameter of 3 mm. The distance between the X-ray source and the detector was 1.5 m, while the distance between the X-ray source and the object was 0.5 m. The X-ray tube voltage was 40 kVp, and the detector pixel size was 20 μm. The spectrum was simulated by Spektr [33], and the sampling interval for energy was 1keV. Figure 2c illustrates the intensity distribution denoted by the dark line in Figure 2a, and the Figure 2d is the zoomed figure at the ellipse indicated in Figure 2c. It can be seen that the intensity distribution of the sphere obtained by Snell’s law also exhibits the effect of edge enhancement [32]. The reason is that the angle of refraction near the edge of the sphere is very large, causing a lot of photons being deflected outside the sphere’s edge. It results in a decrease in intensity inside the edge of the sphere, making the intensity outside the edge is higher than the background intensity. Except the slight differences at the edges of the sphere, the two intensity distributions almost completely overlap.
3.2. Calculation of Angles of Refraction and the Contrast of an Object
For the case of plane-wave illumination, Figure 3 illustrates the angles of refraction when X-rays pass through different positions of the sphere, calculated by Snell’s law (Formula 11) and wave optics (Formula 16), respectively. The incident X-ray was monochromatic plane wave with an energy of 28 keV. The distance between the object and the detector was 1 m. The blue curve represents the angle of refraction calculated by Snell’s law, while the red curve represents the angle of refraction calculated by wave optics. When the calculated region is not very close to the edge of the sphere (submicron scale), the angles of refraction calculated by the two methods are almost the same, with an average error of only 1.3×10⁻¹¹ rad, so the two curves almost merge into one, as illustrated in Figure 3a. The angle of refraction can be successfully calculated by using Snell’s law. However, when the calculated region is very close to the edge of the sphere (nanoscale), the angles of refraction calculated by wave optics are divergent, but the angles of refraction calculated by Snell’s law are finite, as illustrated in Figure 3b.
From Figure 3, it can be seen that for the case of plane-wave illumination, the method for calculating the angle of refraction using formula 16 is straightforward and accurate in the regions with gradual phase changes. However, in areas with significant phase changes, only Snell’s law can be used to determine a reasonable angle of refraction. One may question whether nanometer-level accuracy is necessary, nor do they need to consider such special situations as drastic phase changes. We believe that a robust theoretical framework should be capable of addressing a variety of complex situations. When current theory fails to accommodate specific exceptional cases, it indicates the need for the development of a new, more universally applicable theory. Such a new theory is likely to have a profound impact on the advancement of X-ray phase-contrast imaging.
From the blue curve in Figure 3b, it can be seen that although the angle of refraction calculated by Snell’s law is finite at position A, the maximum value is about 1.5 mrad, which is three orders of magnitude higher than the actual measurement results. The main reason is that the number of photons near the position A are so small that they had no obvious effect on the overall intensity distribution, making it difficult to detect the maximum angle of refraction in the experiment. On the contrary, a large number of photons can be easily detected at the location with the highest intensity at the edge of the object, so the angle of refraction at this position is defined as the maximum detectable angle of refraction in this paper. Therefore, in the following discussion, when considering the effect of system parameters on the angle of refraction, the maximum detectable angle of refraction is taken into account rather than the maximum angle of refraction.
In pbXPCI, the angle of refraction cannot be measured directly; therefore, alternative methods should be considered, such as the edge enhancement effect. The contrast of the object is defined to quantitatively describe the edge enhancement effect of the pbXPCI. Here, the contrast of the object is defined by:
whereis the maximum intensity at the edge of the object, andis the background intensity without the object. For a given object and spectrum, a higher contrast of the object denotes a more pronounced edge enhancement effect. The larger the angle of refraction, the more photons are refracted outside the edge of the object, and the more obvious the effect of edge enhancement. Figure 4a illustrates the influence of detector pixel size on the contrast of the object. The X-ray tube voltage was 40 kVp, and the focal spot size was 7 μm. Figure 4b illustrates the influence of focal spot sizes of X-ray source on image contrast. The detector pixel size was 50 μm. Figure 4c illustrates the influence of the spectrum on the contrast of the object. The focal spot size of the X-ray source was 7 μm and the pixel size of the detector was 50 μm. The object used in the simulation was PMMA with a diameter of 3 mm and positioned at a distance of 0.75 m from the X-ray source.
The simulation results illustrate that the contrast of the object decreased with the increase of the X-ray source focal spot size and the detector pixel size. Under monochromatic X-ray illumination, the contrast of the object is also better than under polychromatic X-ray illumination, but the difference is not particularly significant.
3.3. Factors Affecting the Angles of Refraction
Figure 5 illustrates the influence of the system’s length and the distance between object and the X-ray source on the angle of refraction obtained by Snell’s law. The object and X-ray tube were same with those used in Figure 4. The X-ray tube voltage was 40 kVp, and the focal spot size was 7μm. Different from the assumption that the angles of refraction for X-rays are independent of the object’s position and the system’s length when wave optics is used, Figure 5a indicates that the angle of refraction increases with the increase of the system’s length. Figure 5b indicates that the angle of refraction increases with the decrease of the distance between the X-ray source and the object. Note that the angle of refraction varies as a function of wavelength. Consequently, the angle of refraction is a weighted average of the angles corresponding to each wavelength.
Figure 6a illustrates the influence of the focal spot size of the X-ray source on the angle of refraction. Figure 6a indicates that when the focal spot size of the X-ray source decreases from 400 μm to 7 μm, the angle of refraction increases from 3.4×10⁻⁶ radians to 5.9×10⁻⁶ radians, which increases by 1.74 times. This means that a smaller focal spot size of the X-ray source would produce a stronger signal, and the sensitivity of the system would also be improved. Figure 6b is the change of the angle of refraction with the distance between object and the X-ray source under different detector pixel sizes. The blue, red and yellow curves represent that the pixel sizes of the detector are 20, 50 and 100 microns, respectively, with corresponding average angle of refraction of 9.3×10⁻⁶, 7.3×10⁻⁶ and 5.8×10⁻⁶ radians. Since the angle of refraction is the average of all angles of refraction within a pixel size, the angle of refraction decreased as the pixel size of the detector increased. When the pixel size of the detector is reduces from 100 microns to 20 microns, the angle of refraction increases by 1.60 times. The simulation results indicate that the effect of the detector’s pixel size on the angle of refraction is significantly greater than that of the X-ray source’s focal spot size.
3.4. Experimental Results
Next, we will verify the effectiveness of the theory through experiments. The object was a PMMA rod with a diameter of 3 mm. The X-ray tube voltage was 40 kVp, the focal spot size was 7μm, and the detector pixel size was 50 μm. Figure 7a displays the experimental result of a PMMA rod in the propagation-based X-ray phase-contrast imaging. Figure 7b illustrates a comparison of the cross-sections from the experiment (blue curve), Fresnel-Kirchhoff diffraction simulation (red curve), and Snell’s law simulation (green curve). In Figure 7b, the maximum error between the simulation results obtained using Snell’s law and the experimental results is 1.6%, whereas the maximum error between the simulation results obtained using Fresnel-Kirchhoff diffraction and the experimental results is 1.0%. Due to the maximum thickness at the middle position of the PMMA rod, the beam hardening effect is more pronounced, resulting in the largest error at this location. Although the intensity distribution obtained using Snell’s law is not as accurate as that obtained using Fresnel-Kirchhoff diffraction, its error remains relatively low. It is important to note that the X-ray intensity distribution at the edge of the object in Figure 2c exhibits a peak and a valley. In contrast, the X-ray intensity distribution in Figure 7b only displays a peak. This discrepancy can be attributed to the smaller pixel size are used in Figure 2.
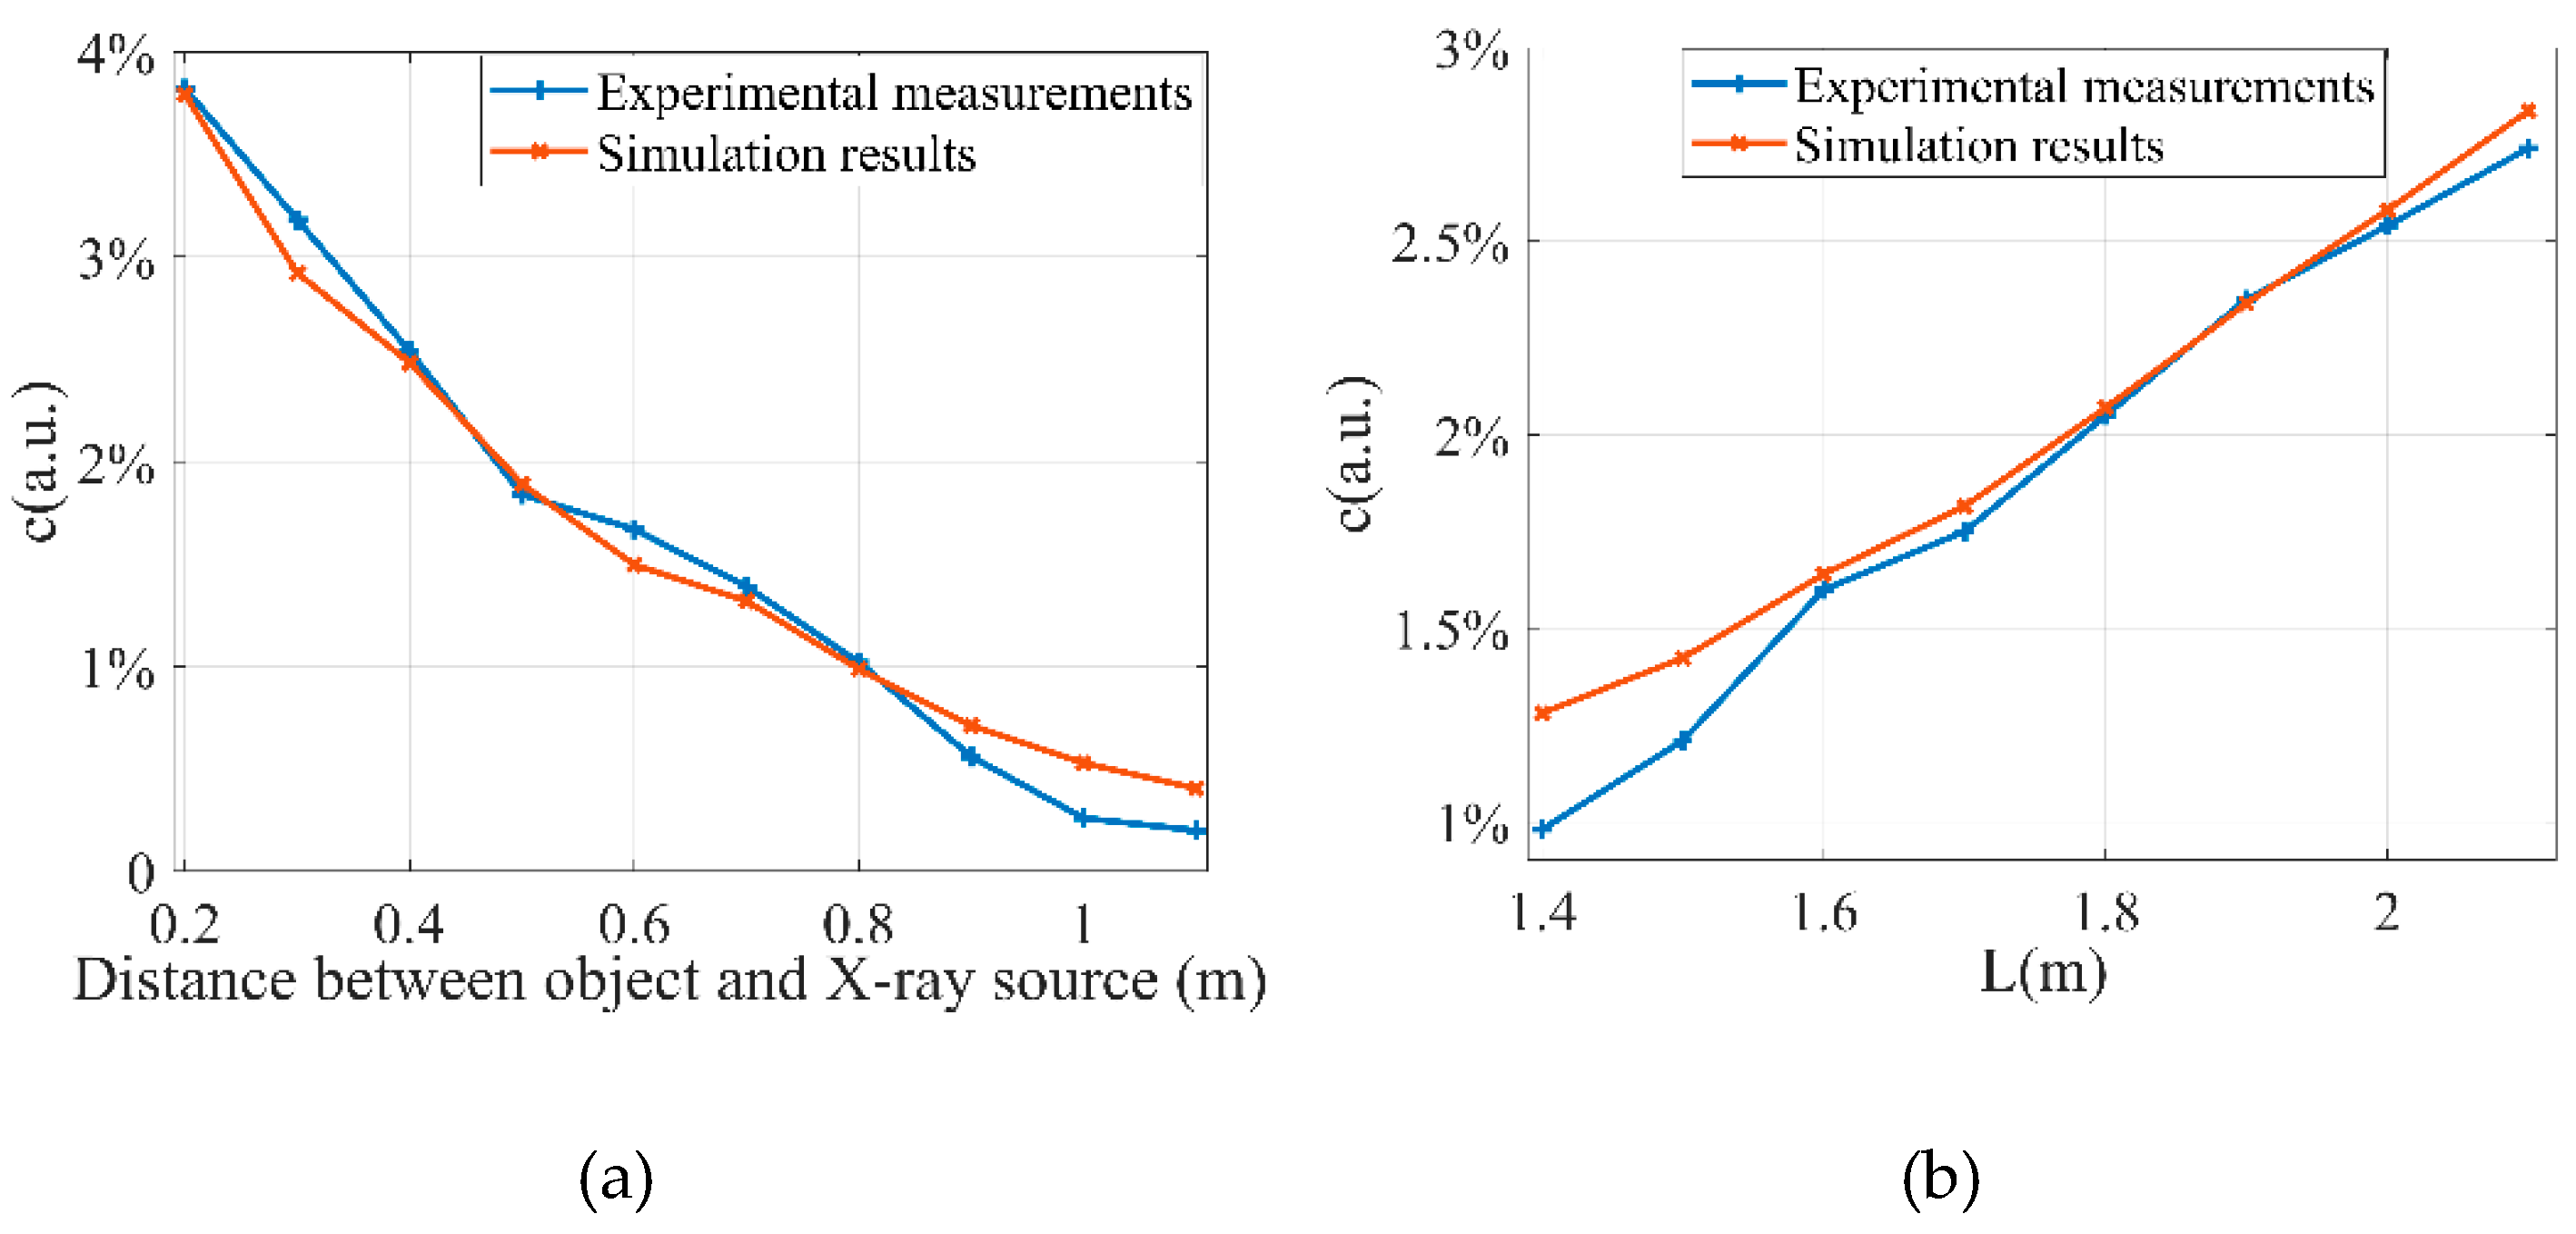
Figure 8 illustrates the results of the quantitative comparison of the simulations of Snell’s law and the experiment results. Figure 8a displays the change in the contrast of the object with the distance between object and the X-ray source, while Figure 8b displays the change in the contrast of the object with the system’s length. It is evident that the changes in the contrast of the object, as calculated by Snell’s law, is consistent with the experimental results, except the positions where the contrasts are very low. According to the above simulation and experimental results, in pbXPCI, one can see that the intensity distribution of the object and the angle of refraction can be calculated using Snell’s law successfully.
4. Discussion
In the propagation-based X-ray phase-contrast imaging and grating-based X-ray interferometry, how to calculate the angle of refraction is a fundamental but significant issue. The traditional method for calculating the angle of refraction is based on the wave optics proposed by Wilkins [18]. However, we demonstrate that Snell’s law can more effectively calculate the angle of refraction. The result also indicates that, similar to gbXI, in pbXPCI, X-rays will be refracted after passing through an object. The results of calculations using Snell’s law indicate that the angle of refraction is influenced by both the focal spot size of the X-ray source and the pixel size of detector. This presents a challenge to the angular sensitivity of gbXI, as it is widely accepted that the angular sensitivity is independent of the focal spot size of X-ray source [34,35]. The results presented in this paper indicate that the angle of refraction will increase as the object approaches the X-ray source in pbXPCI. But in gbXI, as the object moves from the phase grating to the source grating, the measured phase-contrast signal gradually decreases. This means that the phase grating will reduce the phase-contrast signal. At present, the mechanism by which the phase grating influences the phase-contrast signal or the angle of refraction remains unclear. We believe that addressing this issue will lead to new advancements in phase-contrast imaging.
5. Conclusions
In this paper, simulation of the propagation-based X-rays phase-contrast imaging and calculation of the angle of refraction using geometrical optics was proved feasible. For the case of plane-wave illumination, the angles of refraction calculated by geometric optics and by wave optics were almost the same at the position where the phase of the object did not change quickly. When at the position where the phase of the object changed quickly, only geometric optics could obtain reasonable results. The edge enhancement effect of an object is due to the strong refraction of X-rays at the edge of the object, resulting in redistribution of X-ray photons. Meanwhile, the simulation results using geometric optics demonstrated that a smaller focal spot size of the X-ray source and a smaller pixel size of the detector correspond to a larger angle of refraction, and the angle of refraction would also change with the object’s position and the system’s length.
Author Contributions
J.Y. and R. C. contributed to the study conception and design. Material preparation was performed by C.Z. and F.Z. Data collection, data processing and data analysis were performed by H.T. and Y.D. All authors have read and agreed to the published version of the manuscript.
Funding
This research was funded by the National Key Research and Development Program of China (No. 2022YFA1604002), the National Natural Science Foundation of China (62201522), GuangDong Basic and Applied Basic Research Foundation (No. 2024A1515011993), Shenzhen Science and Technology Program (JCYJ20220530140805013).
Institutional Review Board Statement
Not applicable.
Informed Consent Statement
Not applicable.
Data Availability Statement
The data underlying the results presented in this study are not currently publicly available but may be obtained from the authors upon request.
Conflicts of Interest
The authors declare no conflict of interest.
References
- Momose, A.; Kawamoto, S.; Koyama, I.; Hamaishi, Y.; Takai, K.; Suzuki, Y. ; Demonstration of X-Ray Talbot Interferometry. Jpn. J. Appl. Phys. 2003, 42, L866–L868. [Google Scholar] [CrossRef]
- David, C.; Nöhammer, B.; Solak, H.; Ziegler, E. ; Differential x-ray phase contrast imaging using a shearing interferometer. Appl. Phys. Lett. 2002, 81, 3287–3289. [Google Scholar] [CrossRef]
- Zhu, P.; Zhang, K.; Wang, Z.; Liu, Y.; Liu, X.; Wu, Z.; McDonald, S.; Marone, F.; Stampanoni, M. , Low-dose, simple, and fast grating-based X-ray phase-contrast imaging. Natl. Acad. Sci. USA. 2010, 107, 13576–13581. [Google Scholar] [CrossRef] [PubMed]
- Momose, A. ; Recent advances in X-ray Phase Imaging. Jpn. J. Appl. Phys. 2005, 44, 6355–6367. [Google Scholar] [CrossRef]
- Pfeiffer, F.; Weitkamp, T.; Bunk, O.; David, C. ; Phase retrieval and differential phase-contrast imaging with low-brilliance X-ray sources. Nat. Phys. 2006, 2, 258–261. [Google Scholar] [CrossRef]
- Wang, Z.; Gao, K.; Wang, D.; Wu, Z.; Chen, H.; Wang, S.; Wu, Z. ; Single-shot x-ray phase imaging with grating interferometry and photon-counting detectors. Opt. Lett. 2014, 39, 877–879. [Google Scholar] [CrossRef] [PubMed]
- Liu, X.; Liu, L.; Huang, J.; Lei, Y.; Li, J. Single-Shot PhaseContrast Imaging with a Single. Grating. Photonics 2023, 10, 968. [Google Scholar] [CrossRef]
- Yoshioka, H.; Kadono, Y.; Kim, Y.; Oda, H.; Maruyama, T.; Akiyama, Y.; Mimura, T.; Tanaka, J.; Niitsu, M.; Hoshino, Y.; Kiyohara, J.; Nishino, S.; Makifuchi, C.; Takahashi, A.; Shinden, Y.; Matsusaka, N.; Kido, K.; Momose, A. ; Imaging evaluation of the cartilage in rheumatoid arthritis patients with an x-ray phase imaging apparatus based on Talbot-Lau interferometry. Sci. Rep. 2020, 10, 6561. [Google Scholar] [CrossRef] [PubMed]
- Nagashima, M.; Tanaka, J.; Kiyohara, J.; Makifuchi, C.; Kido, K.; Momose, A. ; Application of X-ray grating interferometry try for the imaging of joint structures. Anat. Sci. Int. 2014, 89, 95–100. [Google Scholar] [CrossRef]
- Momose, A.; Yashiro, W.; Kido, K.; Kiyohara, J.; Makifuchi, C.; Ito, T.; Nagatsuka, S.; Honda, C.; Noda, D.; Hattori, T.; Endo, T.; Nagashima, M.; Tanaka, J. ; X-ray phase imaging: from synchrotron to hospital. Philos. Trans. A Math. Phys. Eng. Sci. 2017, 372, 20130023. [Google Scholar] [CrossRef] [PubMed]
- Massimi, L.; Clark, S.; Marussi, S.; Doherty, A.; Shah, S.; Schulz, J.; Marathe, S.; Rau, C.; Endrizzi, M.; Lee, P.; Olivo, A. ; Time resolved in-situ multi-contrast X-ray imaging of melting in metals. Sci. Rep. 2022, 12, 12136. [Google Scholar] [CrossRef]
- Braig, E.; Böhm, J.; Dierolf, M.; Jud, C.; Günther, B.; Mechlem, K.; Allner, S.; Sellerer, T.; Achterhold, K.; Gleich, B.; Noël, P.; Pfeiffer, D.; Rummeny, E.; Herzen, J.; Pfeiffer, F. ; Direct quantitative material decomposition employing grating-based X-ray phase-contrast CT. Sci. Rep. 2018, 8, 16394. [Google Scholar] [CrossRef]
- Mao, L.; Liu, H.; Zhu, Y.; Zhu, Z.; Guo, R.; Chiang, F. ; 3D Strain Mapping of Opaque Materials Using an Improved Digital Volumetric Speckle Photography Technique with X-Ray Microtomography. Appl. Sci. 2019, 9, 1418. [Google Scholar] [CrossRef]
- Riedel, M.; Taphorn, K.; Gustschin, A.; Busse, M.; Hammel, J.; Moosmann, J.; Beckmann, F.; Fischer, F.; Thibault, P.; Herzen, J. ; Comparing x-ray phase-contrast imaging using a Talbot array illuminator to propagation-based imaging for non-homogeneous biomedical samples. Sci. Rep. 2023, 13, 6996. [Google Scholar] [CrossRef] [PubMed]
- Preissner, M.; Murrie, R.; Pinar, I.; Werdiger, F.; Carnibella, R.; Zosky, G.; Fouras, A.; Dubsky, S. ; High resolution propagation-based imaging system for in vivo dynamic computed tomography of lungs in small animals. Phys. Med. Biol. 2018, 63, 08NT03. [Google Scholar] [CrossRef]
- Grandl, S.; Scherer, K.; Sztrokay, Gaul.; Birnbacher, L.; Willer, K.; Chabior, M.; Herzen, J.; Mayr, D.; Auweter, S.; Pfeiffer, F.; Bamberg, F.; Hellerhoff, K. Improved visualization of breast cancer features in multifocal carcinoma using phase-contrast and dark-field mammography: an ex vivo study. Eur. Radiol. 2015, 25, 3659–3668. [Google Scholar] [CrossRef]
- Bonse, U.; Hart, M. ; An X-ray Interferometer. Appl. Phys. Lett. 1965, 6, 155–156. [Google Scholar] [CrossRef]
- Wilkins, S.; Gureyev, T.; Gao, D.; Pogany, A.; Stevenson, A. ; Phase-contrast imaging using polychromatic hard X-rays. Nature 1996, 384, 335–338. [Google Scholar] [CrossRef]
- Gureyev, T.; Mayo, S.; Myers, D.; Nesterets, Y.; Paganin, D.; Pogany, A.; Stevenson, A.; Wilkins, S.; J. Refracting Röntgen’s rays: Propagation-based x-ray phase contrast for biomedical imaging. Appl. Phys. 2009, 105, 102005. [Google Scholar] [CrossRef]
- Zhao, Y.; Ji, D.; Li, Y.; Zhao, X.; Lv, W.; Xin, X.; Han, S.; Hu, C. ; Three-dimensional visual ization of microvasculature from few-projection data using a novel CT reconstruction algorithm for propagation-based X-ray phase-contrast imaging. Biomed. Opt. Express 2020, 11, 364–387. [Google Scholar] [CrossRef]
- Caro, L.; Cedola, A.; Ciannini, C.; Bukreeva, I.; Lagomarsino, S. ; In-line phase-contrast imaging for strong absorbing objects. Phys. Med. Biol. 2008, 53, 6619. [Google Scholar] [CrossRef]
- Chapman, D.; Thomlinson, W.; Johnston, R.; Washburn, D.; Pisano, E.; Gmur, N.; Zhong, Z.; Menk, R.; Arfelli, F.; Sayers, D. ; Diffraction enhanced x-ray imaging. Phys. Med. Biol. 1997, 42, 2015–2025. [Google Scholar] [CrossRef]
- Pfeiffer, F.; Bech, M.; Bunk, O.; Kraft, P.; Eikenberry, E.; Bronnimann, C.; Grunzweig, C.; David, C. ; Hard-X-ray dark-field imaging using a grating interferometer. Nat. Mater. 2008, 7, 134–137. [Google Scholar] [CrossRef] [PubMed]
- Miao, H.; Panna, A.; Gomella, A.; Bennett, E.; Znati, S.; Chen, L.; Han, W. ; A Universal Moire Effect and Application in X-Ray Phase-Contrast Imaging. Nat. Phys. 2016, 12, 830–834. [Google Scholar] [CrossRef] [PubMed]
- Lei, Y.; Liu, X.; Huang, J.; Du, Y.; Guo, J.; Zhao, Z.; Li, J. ; Cascade Talbot Lau interferometers for x-ray differential phase-contrast imaging. J. Phys. D: Appl. Phys. 2018, 51, 385302. [Google Scholar] [CrossRef]
- Zhang, C.; Pan, X.; Shang, H.; Li, G. ; Alternative edge illumination set-up for single-shot X-ray phase contrast imaging. J. Appl. Phys. 2018, 124, 164906. [Google Scholar] [CrossRef]
- Kallon, G.; Wesolowski, M.; Vittoria, F.; Endrizzi, M.; Basta, D.; Millard, T.; Diemoz, P.; Olivo, A. ; A laboratory based edge-illumination x-ray phase-contrast imaging setup with two-directional sensitivity. Appl. Phys. Lett. 2015, 107, 204105. [Google Scholar] [CrossRef]
- Comamala, J.; Romano, L.; Guzenko, V.; Kagias, M.; Stampanoni, M.; Jefimovs, K. ; Towards sub-micrometer high aspect ratio X-ray gratings by atomic layer deposition of iridium. Microelectronic Eng. 2018, 192, 19–24. [Google Scholar] [CrossRef]
- Kageyama, M.; Okajima, K.; Maesawa, M.; Nonoguchi, M.; Koike, T.; Noguchi, M.; Yamada, A.; Morita, E.; Kawase, S.; Kuribayashi, M.; Hara, Y.; Bachche, S.; Momose, A. ; X-ray phase-imaging scanner with tiled bent gratings for large-field of view nondestructive testing. NDT & E Int. 2019, 105, 19–24. [Google Scholar] [CrossRef]
- Alloo, S.; Paganin, D.; Morgan, K.; Gureyev, T.; Mayo, S.; Mohammadi, S.; Lockie, D.; Menk, R.; Arfelli, F.; Zanconati, F.; Tromba, G.; Pavlov, K. Tomographic phase and attenuation extraction for a sample composed of unknown materials using x-ray propagation-based phase-contrast imaging. Opt. Lett. 2022, 47, 1945–1948. [Google Scholar] [CrossRef]
- Monnin, P.; Bulling, S.; Hoszowska, J.; Valley, J.; Meuli, R.; Verdun, F. ; Quantitative characterization of edge enhancement in phase contrast x-ray imaging. Am. Assoc. Med. Phys. 2004, 31, 1372–1383. [Google Scholar] [CrossRef] [PubMed]
- Wang, Z. ; Research on methods and technologies for grating-based imaging with conventional X-ray source. Ph. D. Thesis, Tsinghua University, Beijing, China, 2010.
- Siewerdsen, J. ; Spektr: A computational tool for x-ray spectral analysis and imaging system optimization. Am. Assoc. Med. Phys. 2004, 31, 3057–3067. [Google Scholar] [CrossRef]
- Donath, T.; Chabior, M.; Pfeiffer, F.; Bunk, O.; Reznikova, E.; Mohr, J.; Hempel, E.; Popescu, S.; Hoheisel, M.; Schuster, M.; Baumann, J.; David, C. ; Inverse geometry for grating-based x-ray phase-contrast imaging. J. Appl. Phys. 2009, 106, 054703. [Google Scholar] [CrossRef]
- Ge, Y.; Chen, J.; Yang, J.; Zhu, P.; Zhang, H.; Zheng, H.; Liang, D. ; Angular sensitivity of an x-ray differential phase contrast imaging system with real and virtual source images. Opt. Lett. 2021, 46, 2791–2794. [Google Scholar] [CrossRef] [PubMed]
Figure 1.
The refraction process of X-rays after passing through an object in propagation-based X-ray phase-contrast imaging.
Figure 1.
The refraction process of X-rays after passing through an object in propagation-based X-ray phase-contrast imaging.
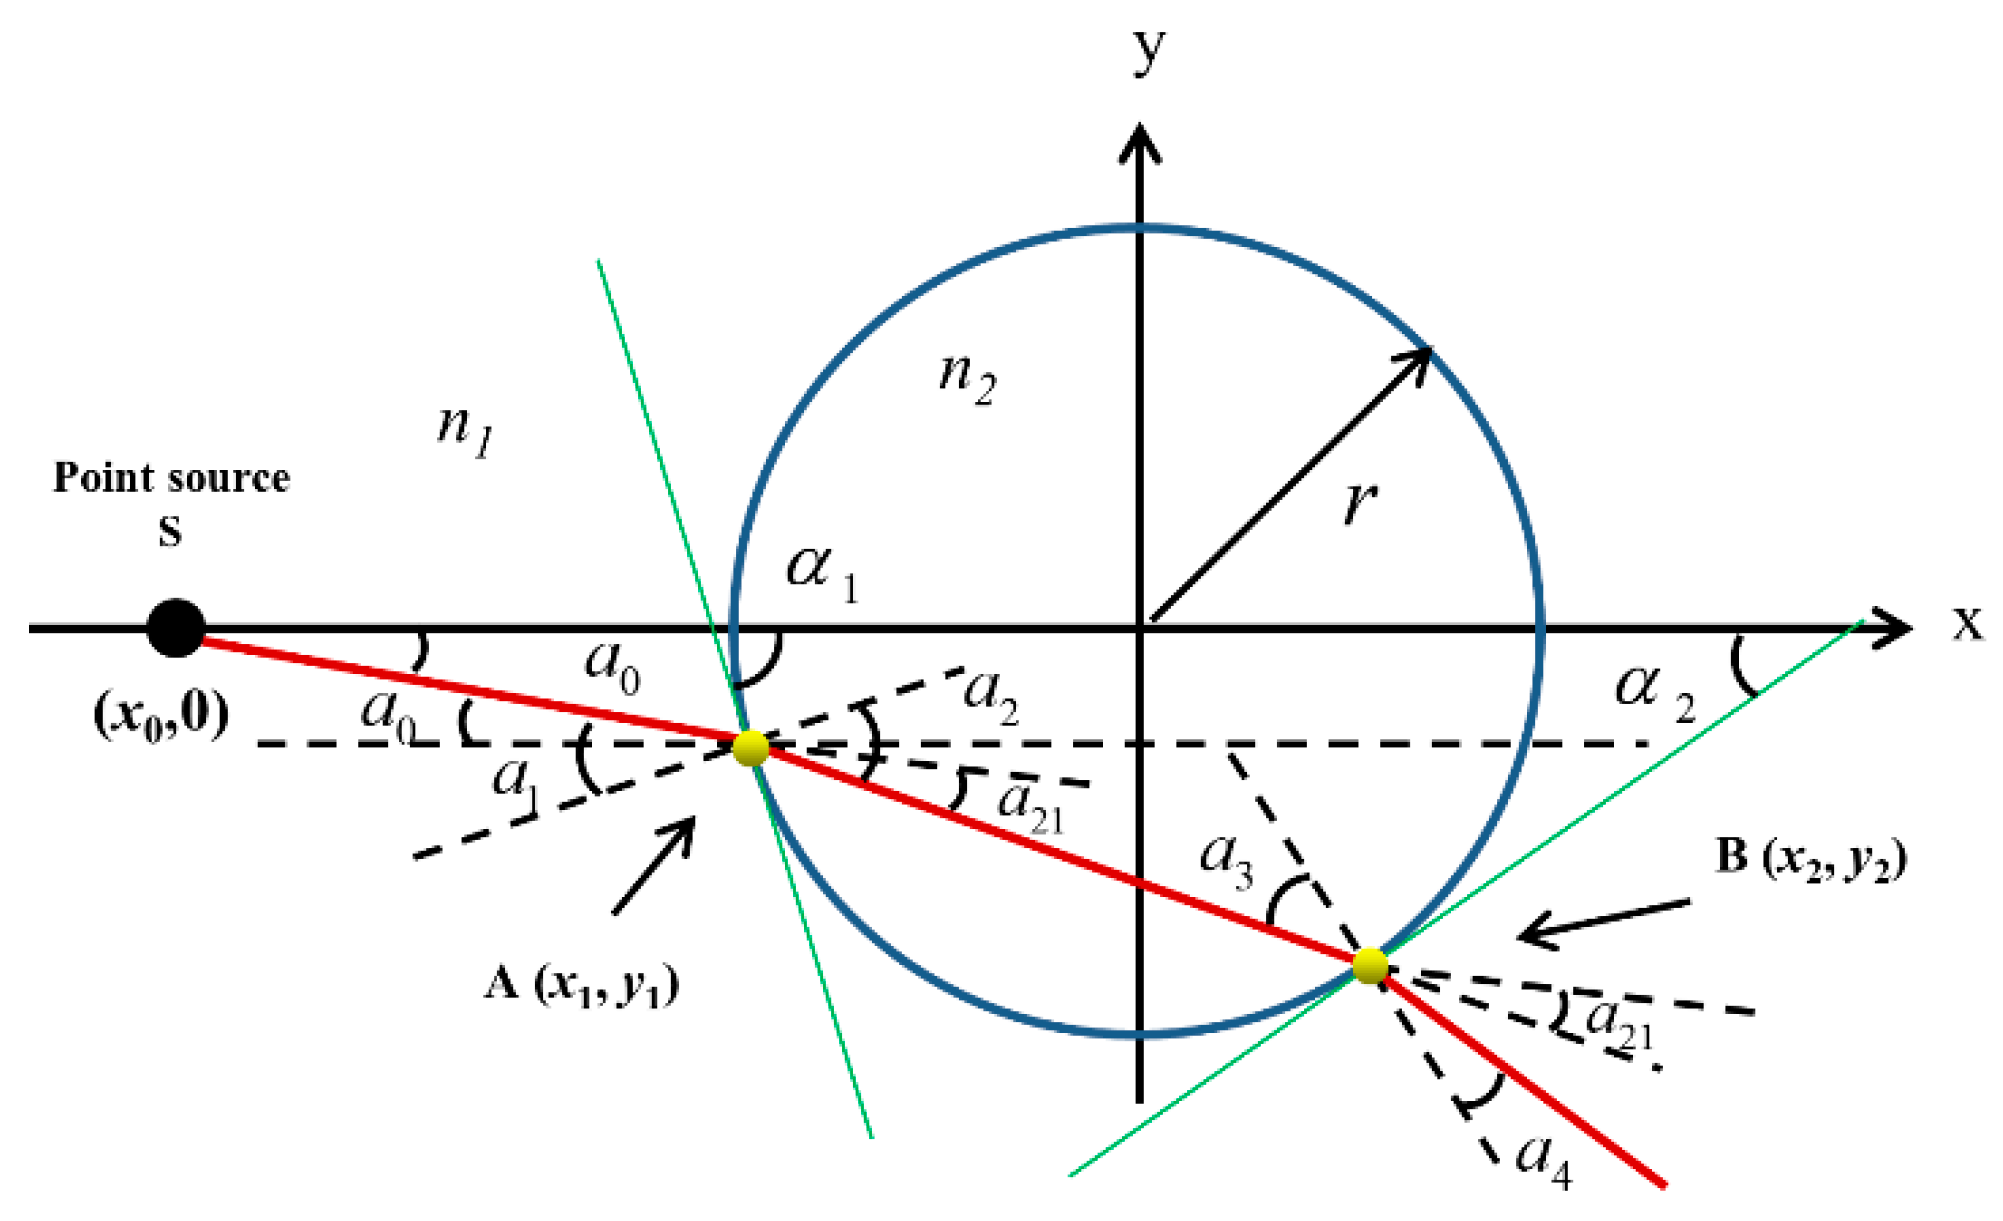
Figure 2.
The X-ray intensity distributions of a sphere obtained by Fresnel-Kirchhoff diffraction (a) and the Snell’s law (b). (c) represents the cross-section of the sphere. (d) Zoomed figure at the ellipse indicated in (c).
Figure 2.
The X-ray intensity distributions of a sphere obtained by Fresnel-Kirchhoff diffraction (a) and the Snell’s law (b). (c) represents the cross-section of the sphere. (d) Zoomed figure at the ellipse indicated in (c).
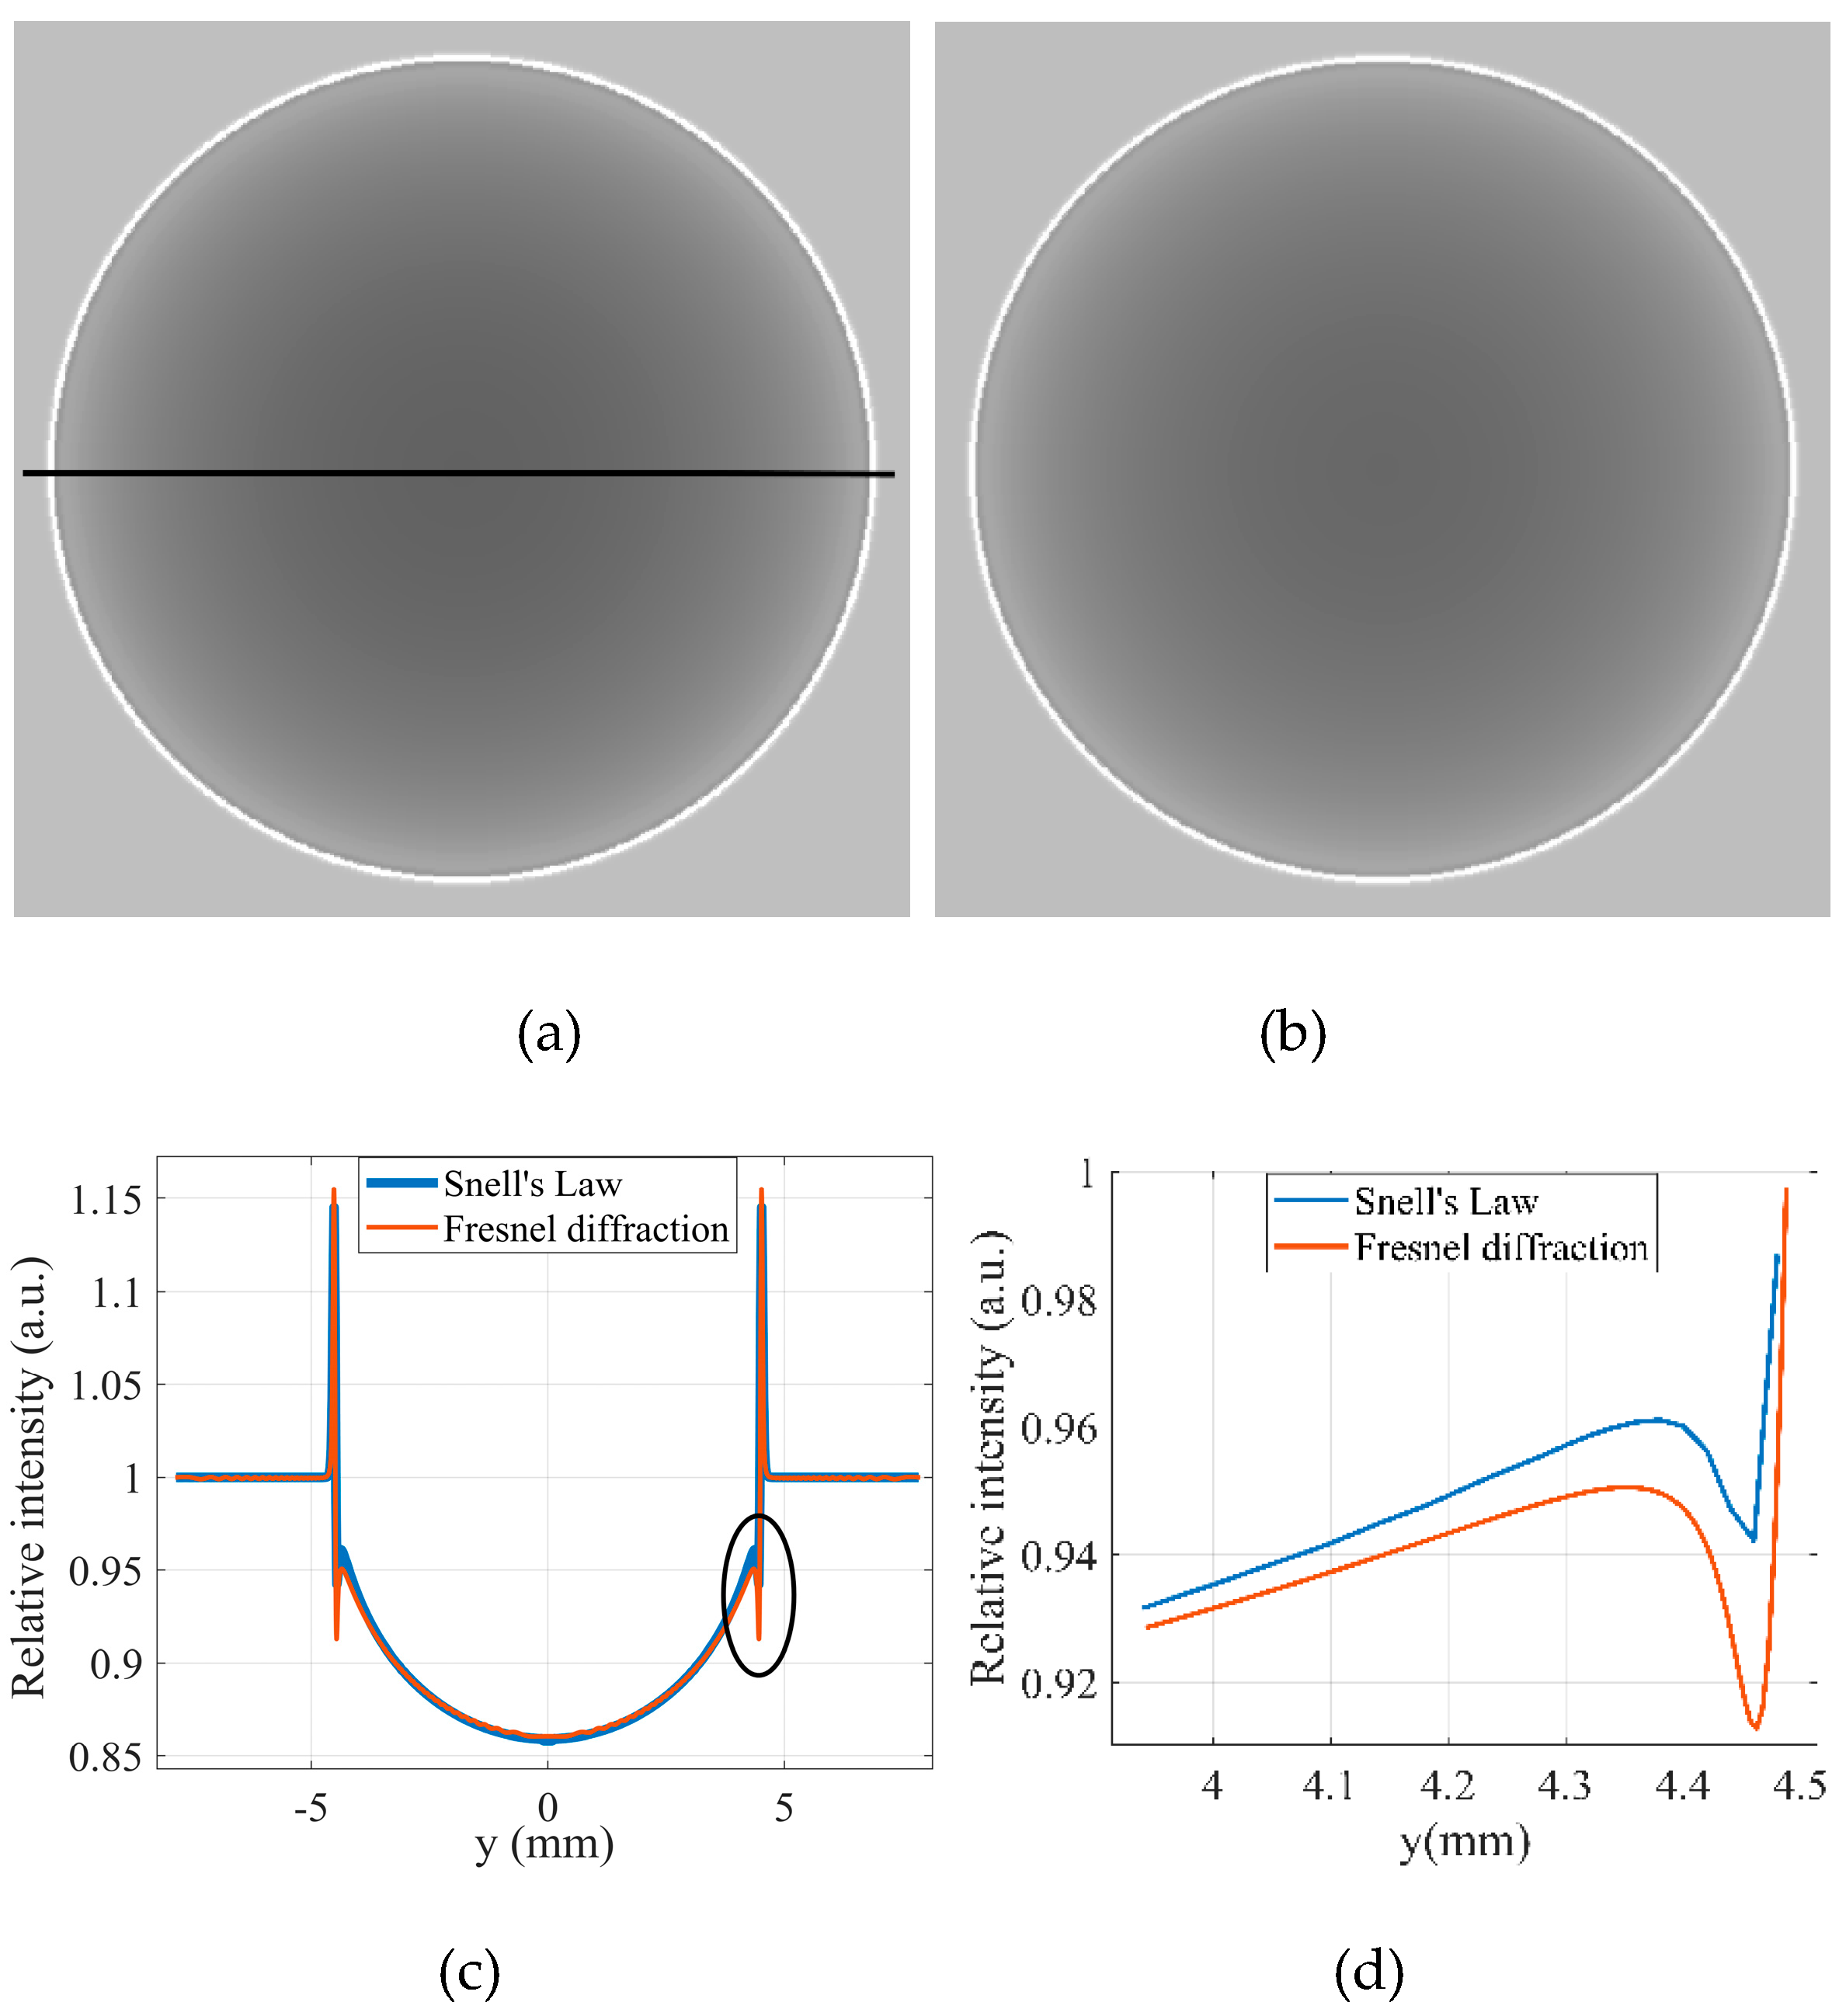
Figure 3.
Using Snell’s law and wave optics to calculate the angles of refraction when X-rays pass through different positions of the sphere. (a) Non-marginal position of the sphere; (b) The edge position of the sphere.
Figure 3.
Using Snell’s law and wave optics to calculate the angles of refraction when X-rays pass through different positions of the sphere. (a) Non-marginal position of the sphere; (b) The edge position of the sphere.
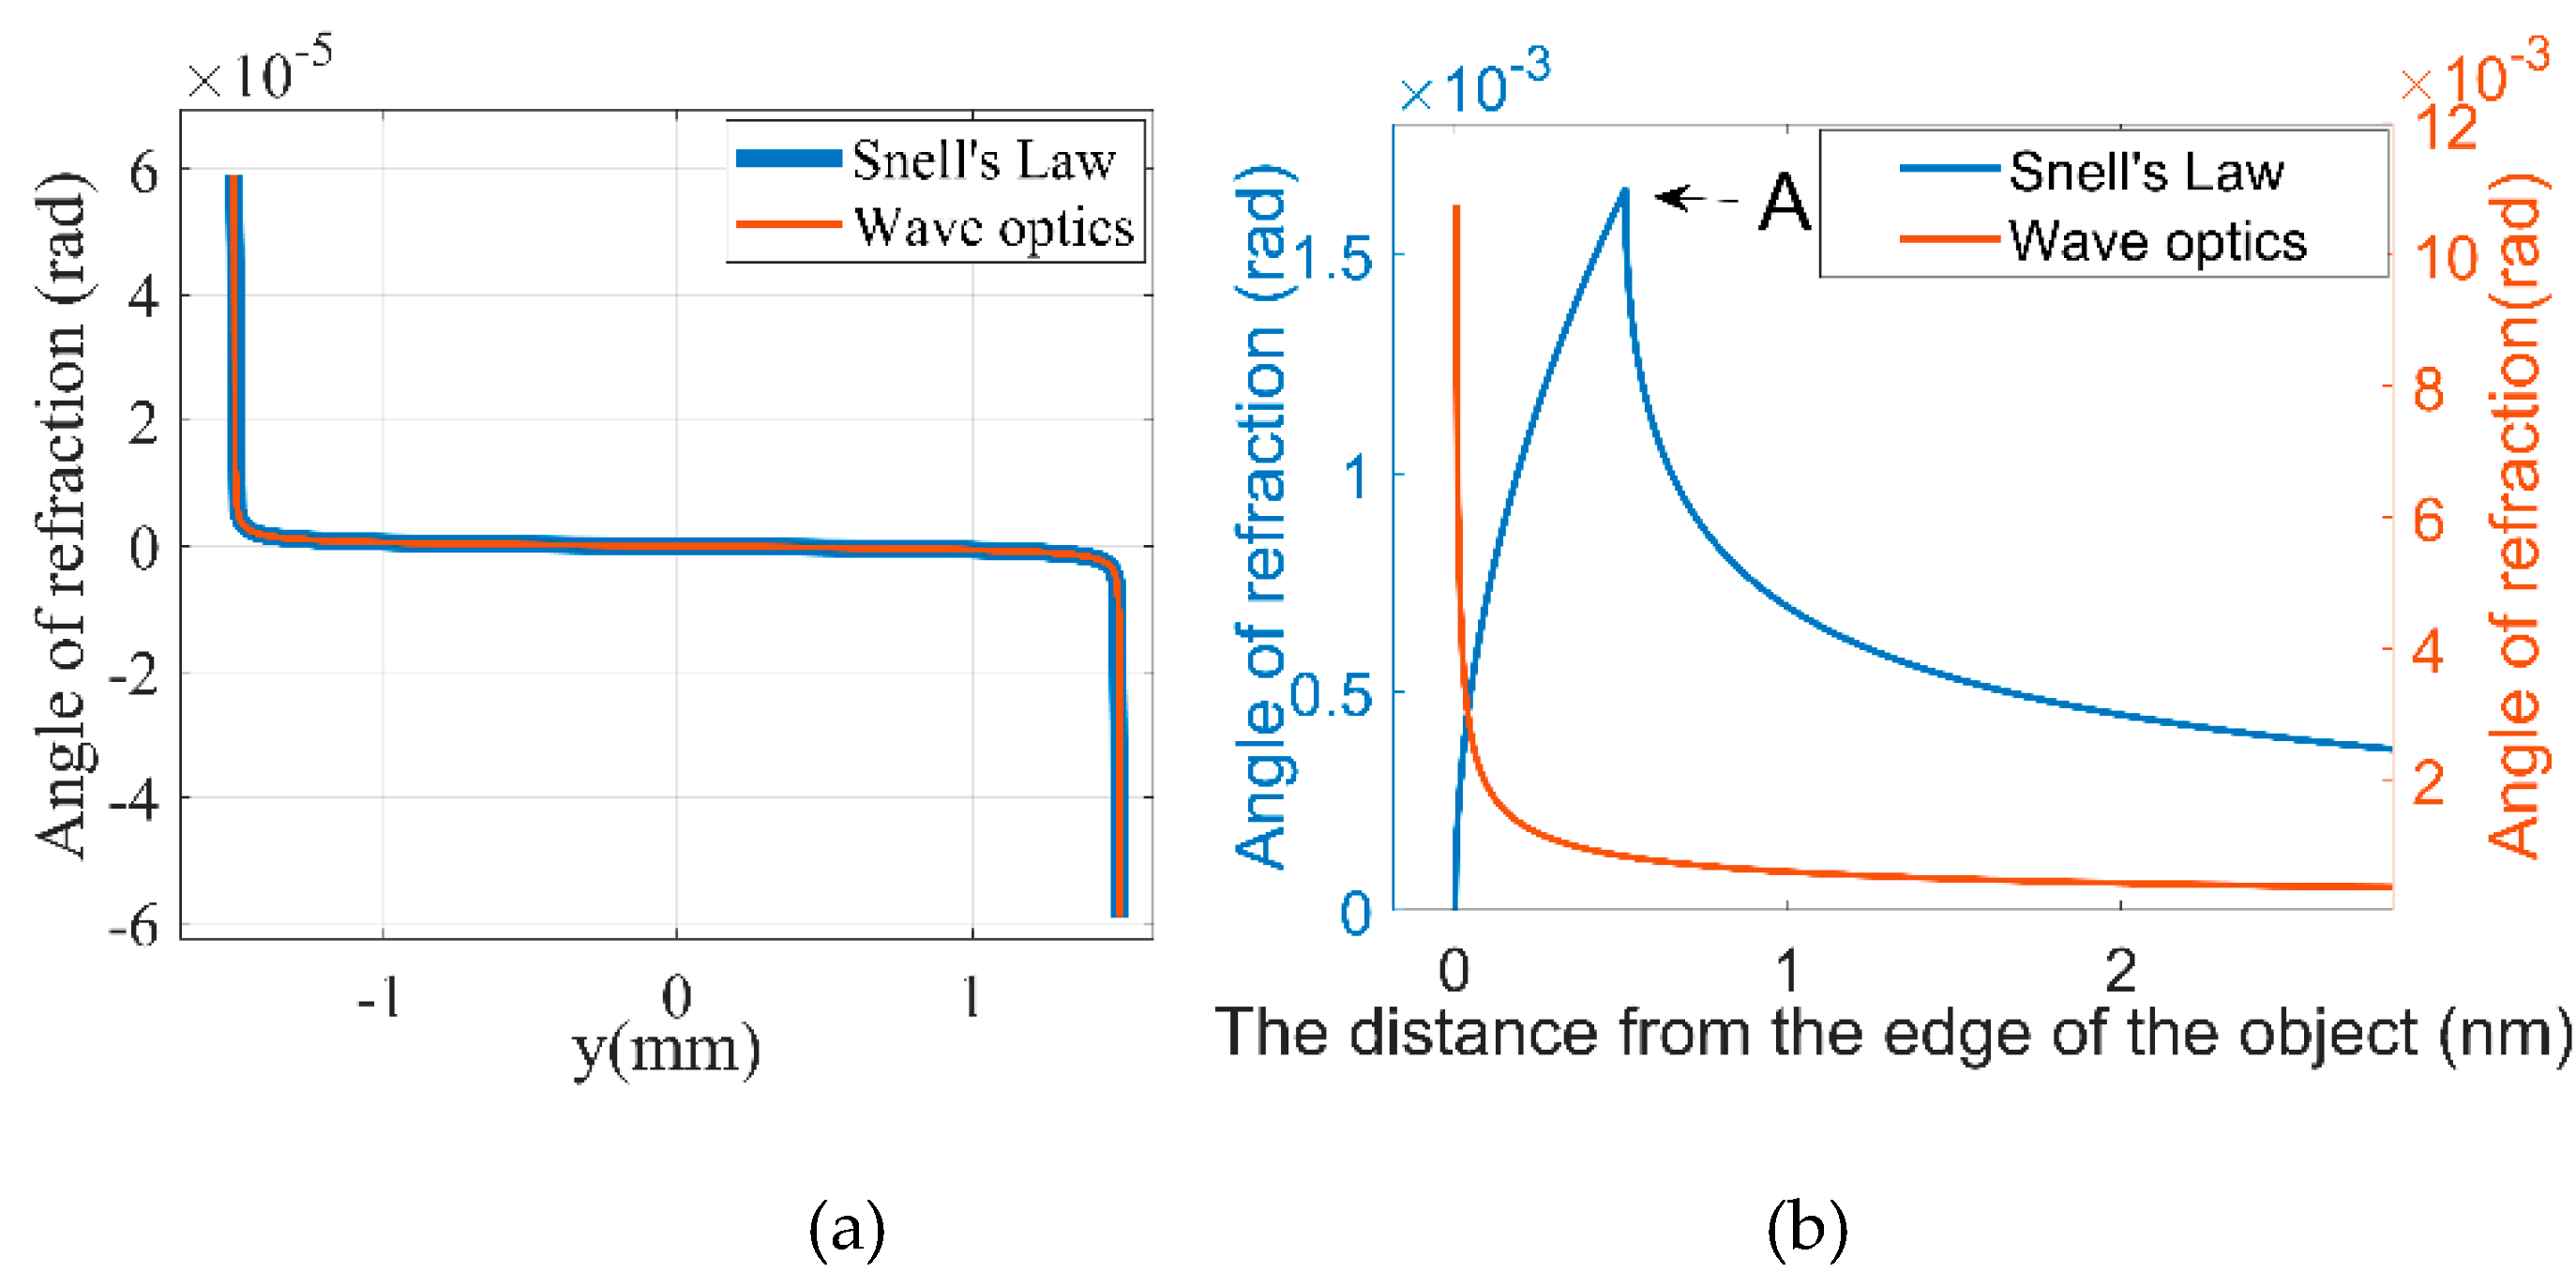
Figure 4.
(a) The influence of detector pixel size on the contrast of the object. (b) The influence of focal spot sizes of X-ray source on image contrast. (c) The influence of the spectrum on the contrast of the object.
Figure 4.
(a) The influence of detector pixel size on the contrast of the object. (b) The influence of focal spot sizes of X-ray source on image contrast. (c) The influence of the spectrum on the contrast of the object.
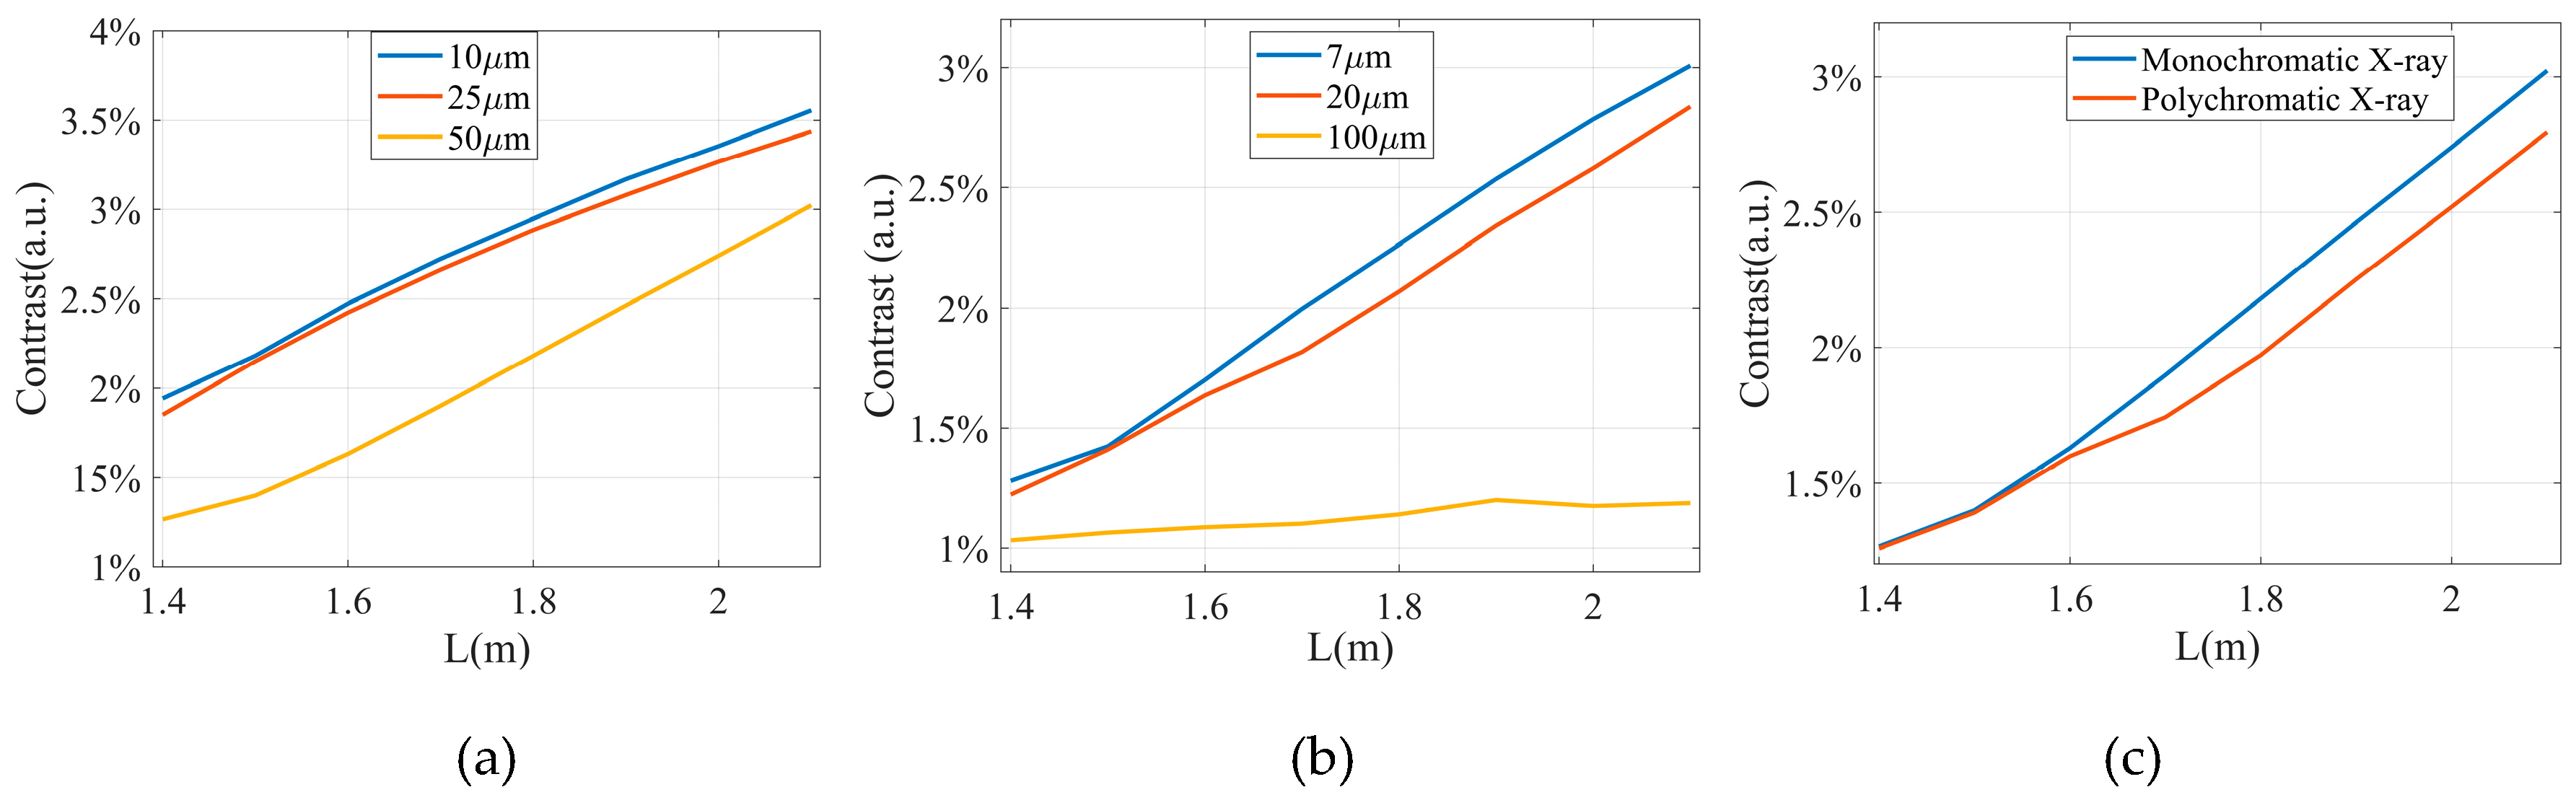
Figure 5.
(a) The influence of the system’s lengthon the angle of refraction, where the distance between the object and the X-ray source was 0.75 m; (b) The influence of the distance between object and the X-ray source on the angle of refraction, where the total where the total system length was 1.5 m.
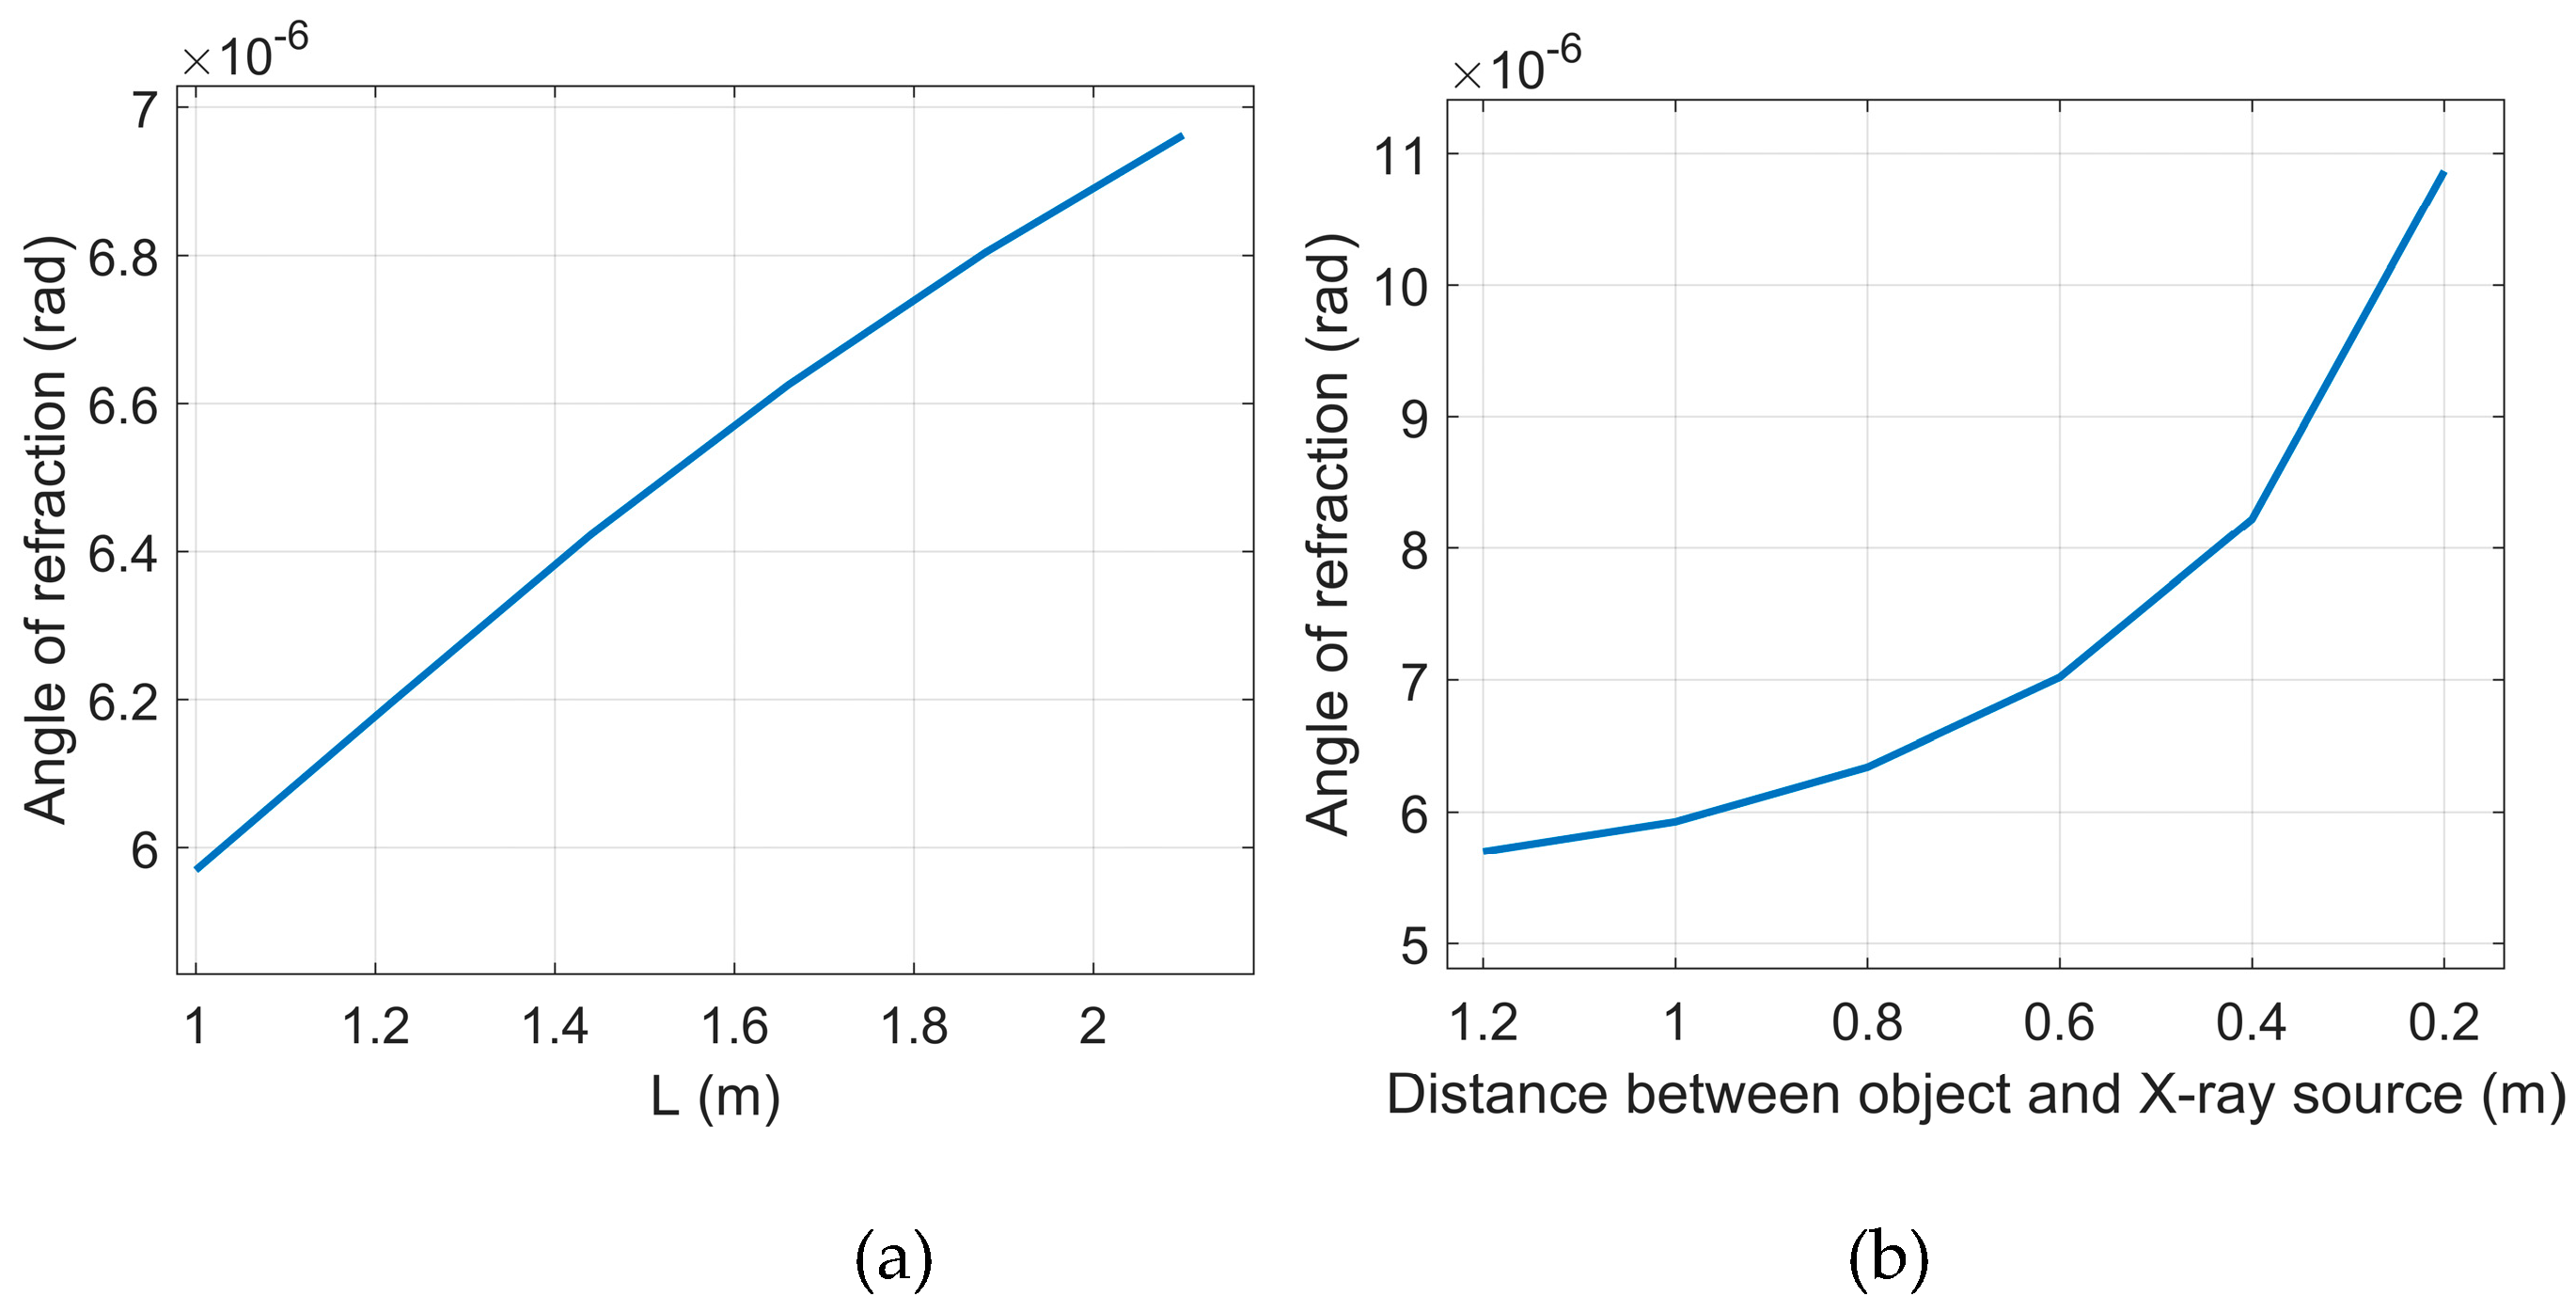
Figure 6.
(a) The influence of focal spot size of X-ray source on the refraction angle. The detector’s pixel size was 50 μm. The distance between the X-ray source and the object was 1 m. (b) The influence of the distance between object and the X-ray source on the angle of refraction under different pixel sizes. The distance between the X-ray source and the detector was 1.5 m. The X-ray tube voltage was 40 kVp, and the focal spot size was 7 μm. .
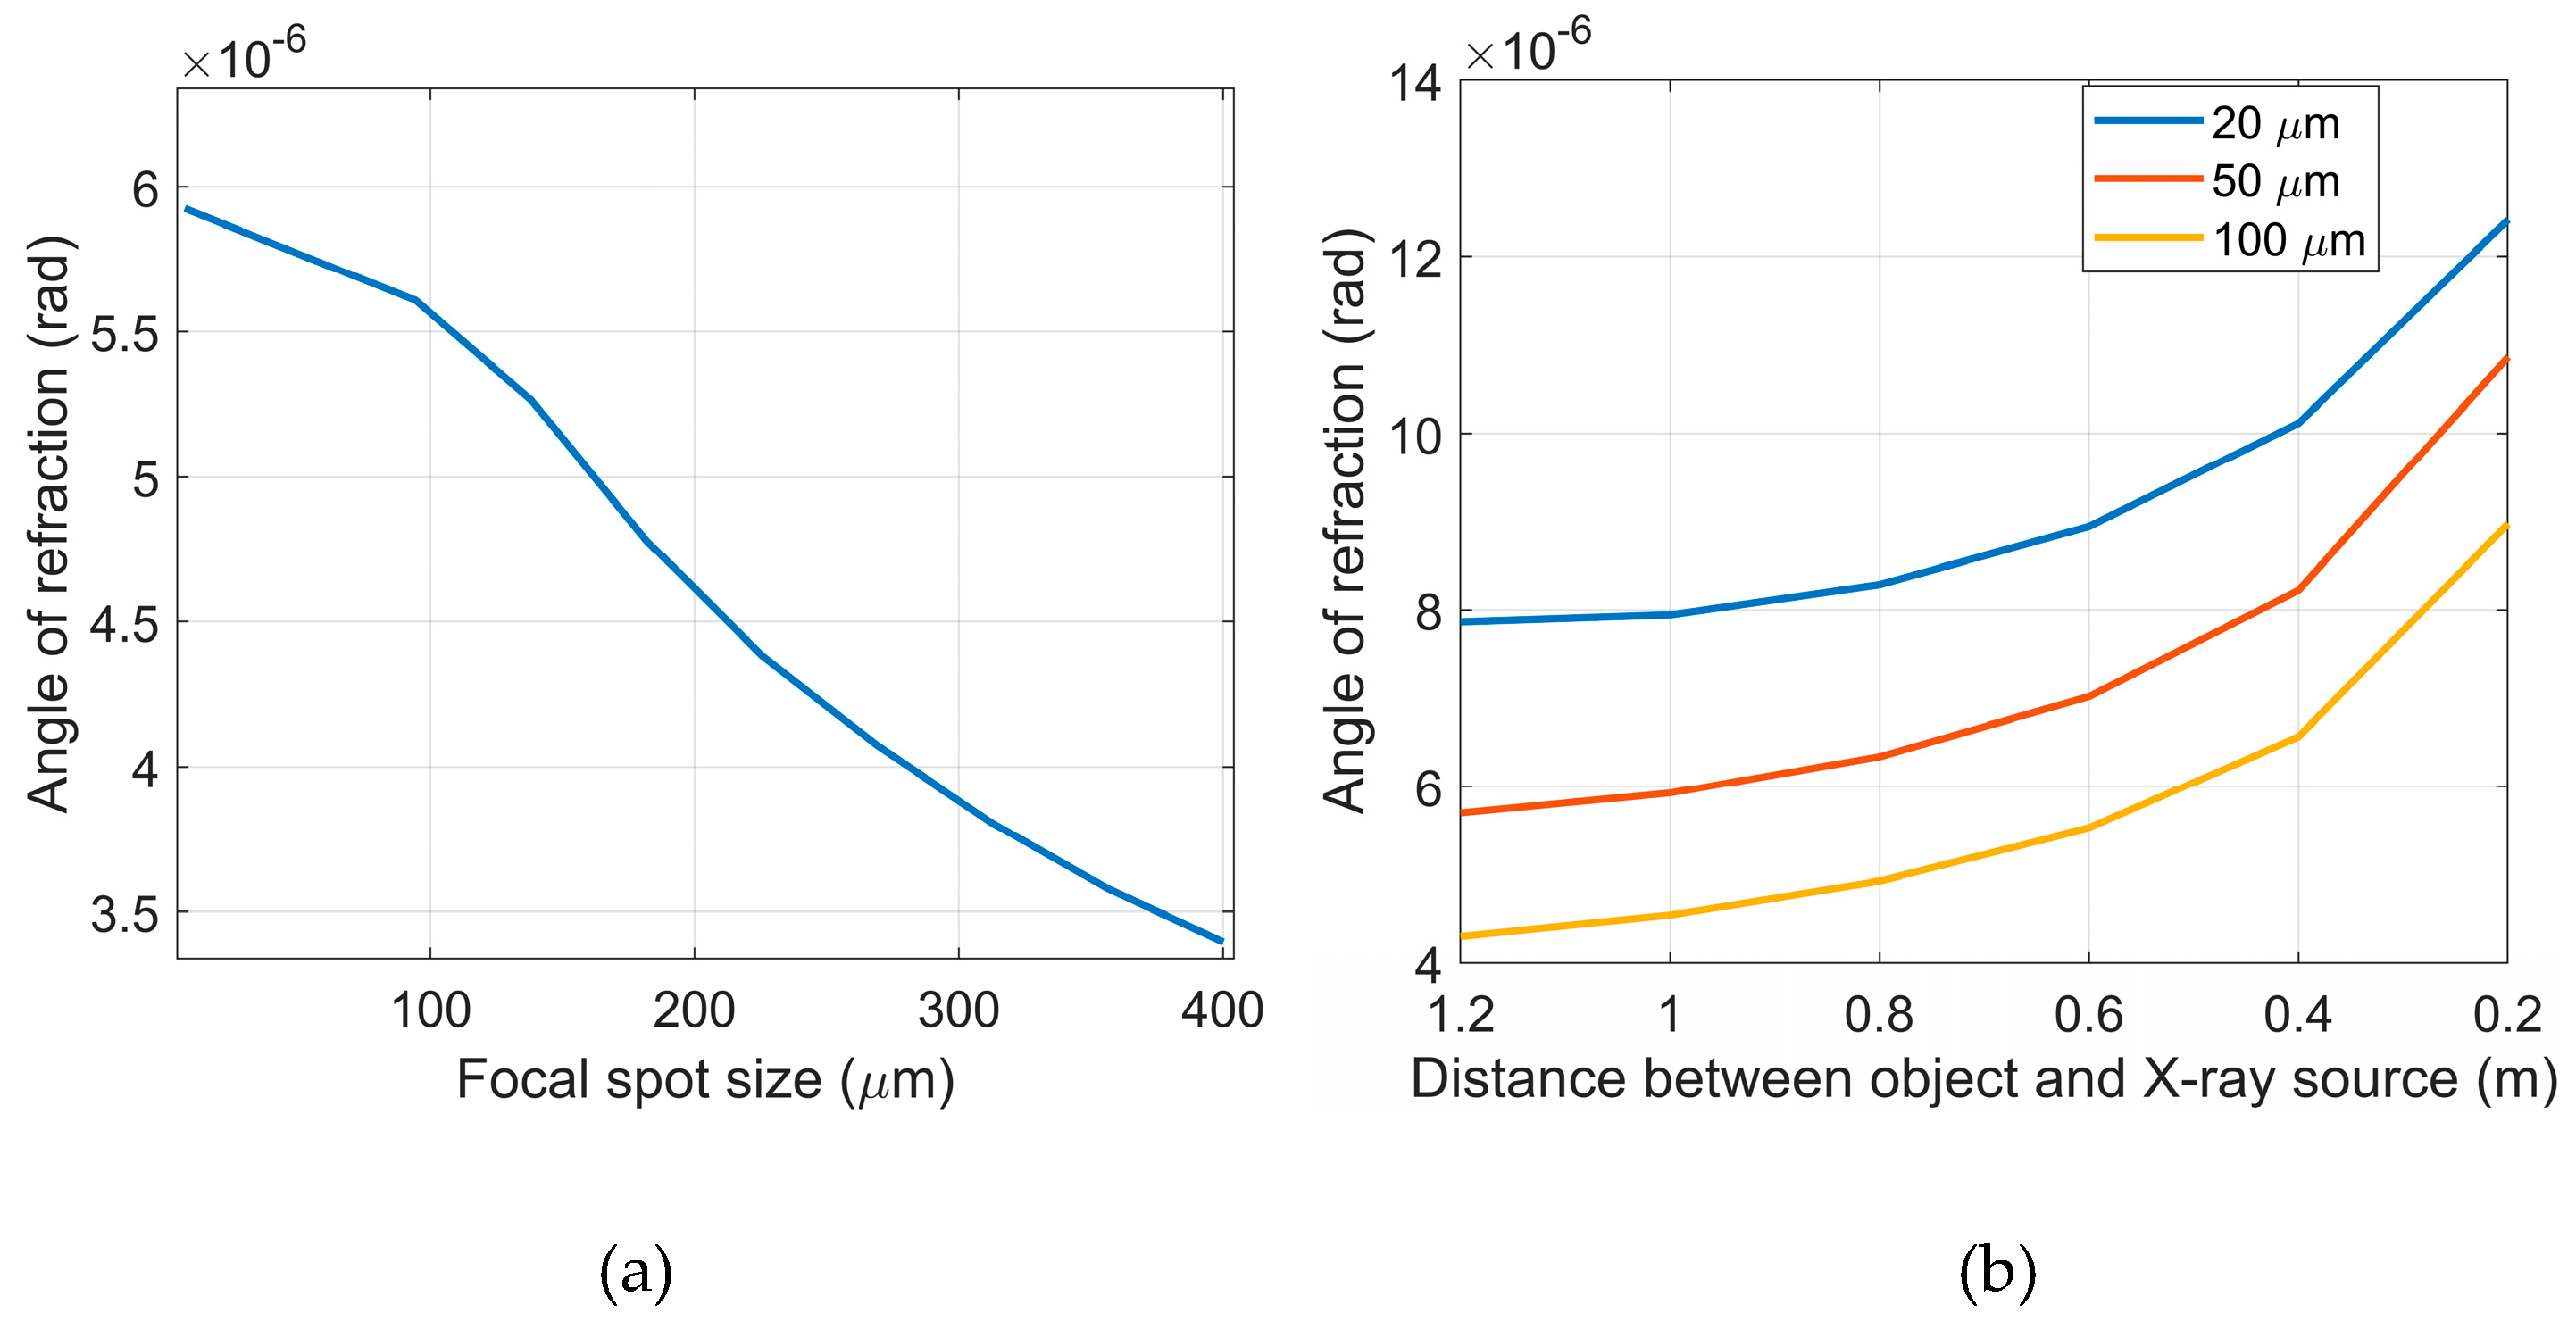
Figure 7.
(a) Experimental result in propagation-based X-ray phase-contrast imaging system, and the yellow rectangle indicates the position of the cross section; (b) Comparison of the experimental and simulation results of the object’s cross section. The distance between the X-ray source and the detector was 2.1 m, the distance between the X-ray source and the object was 0.75 m.
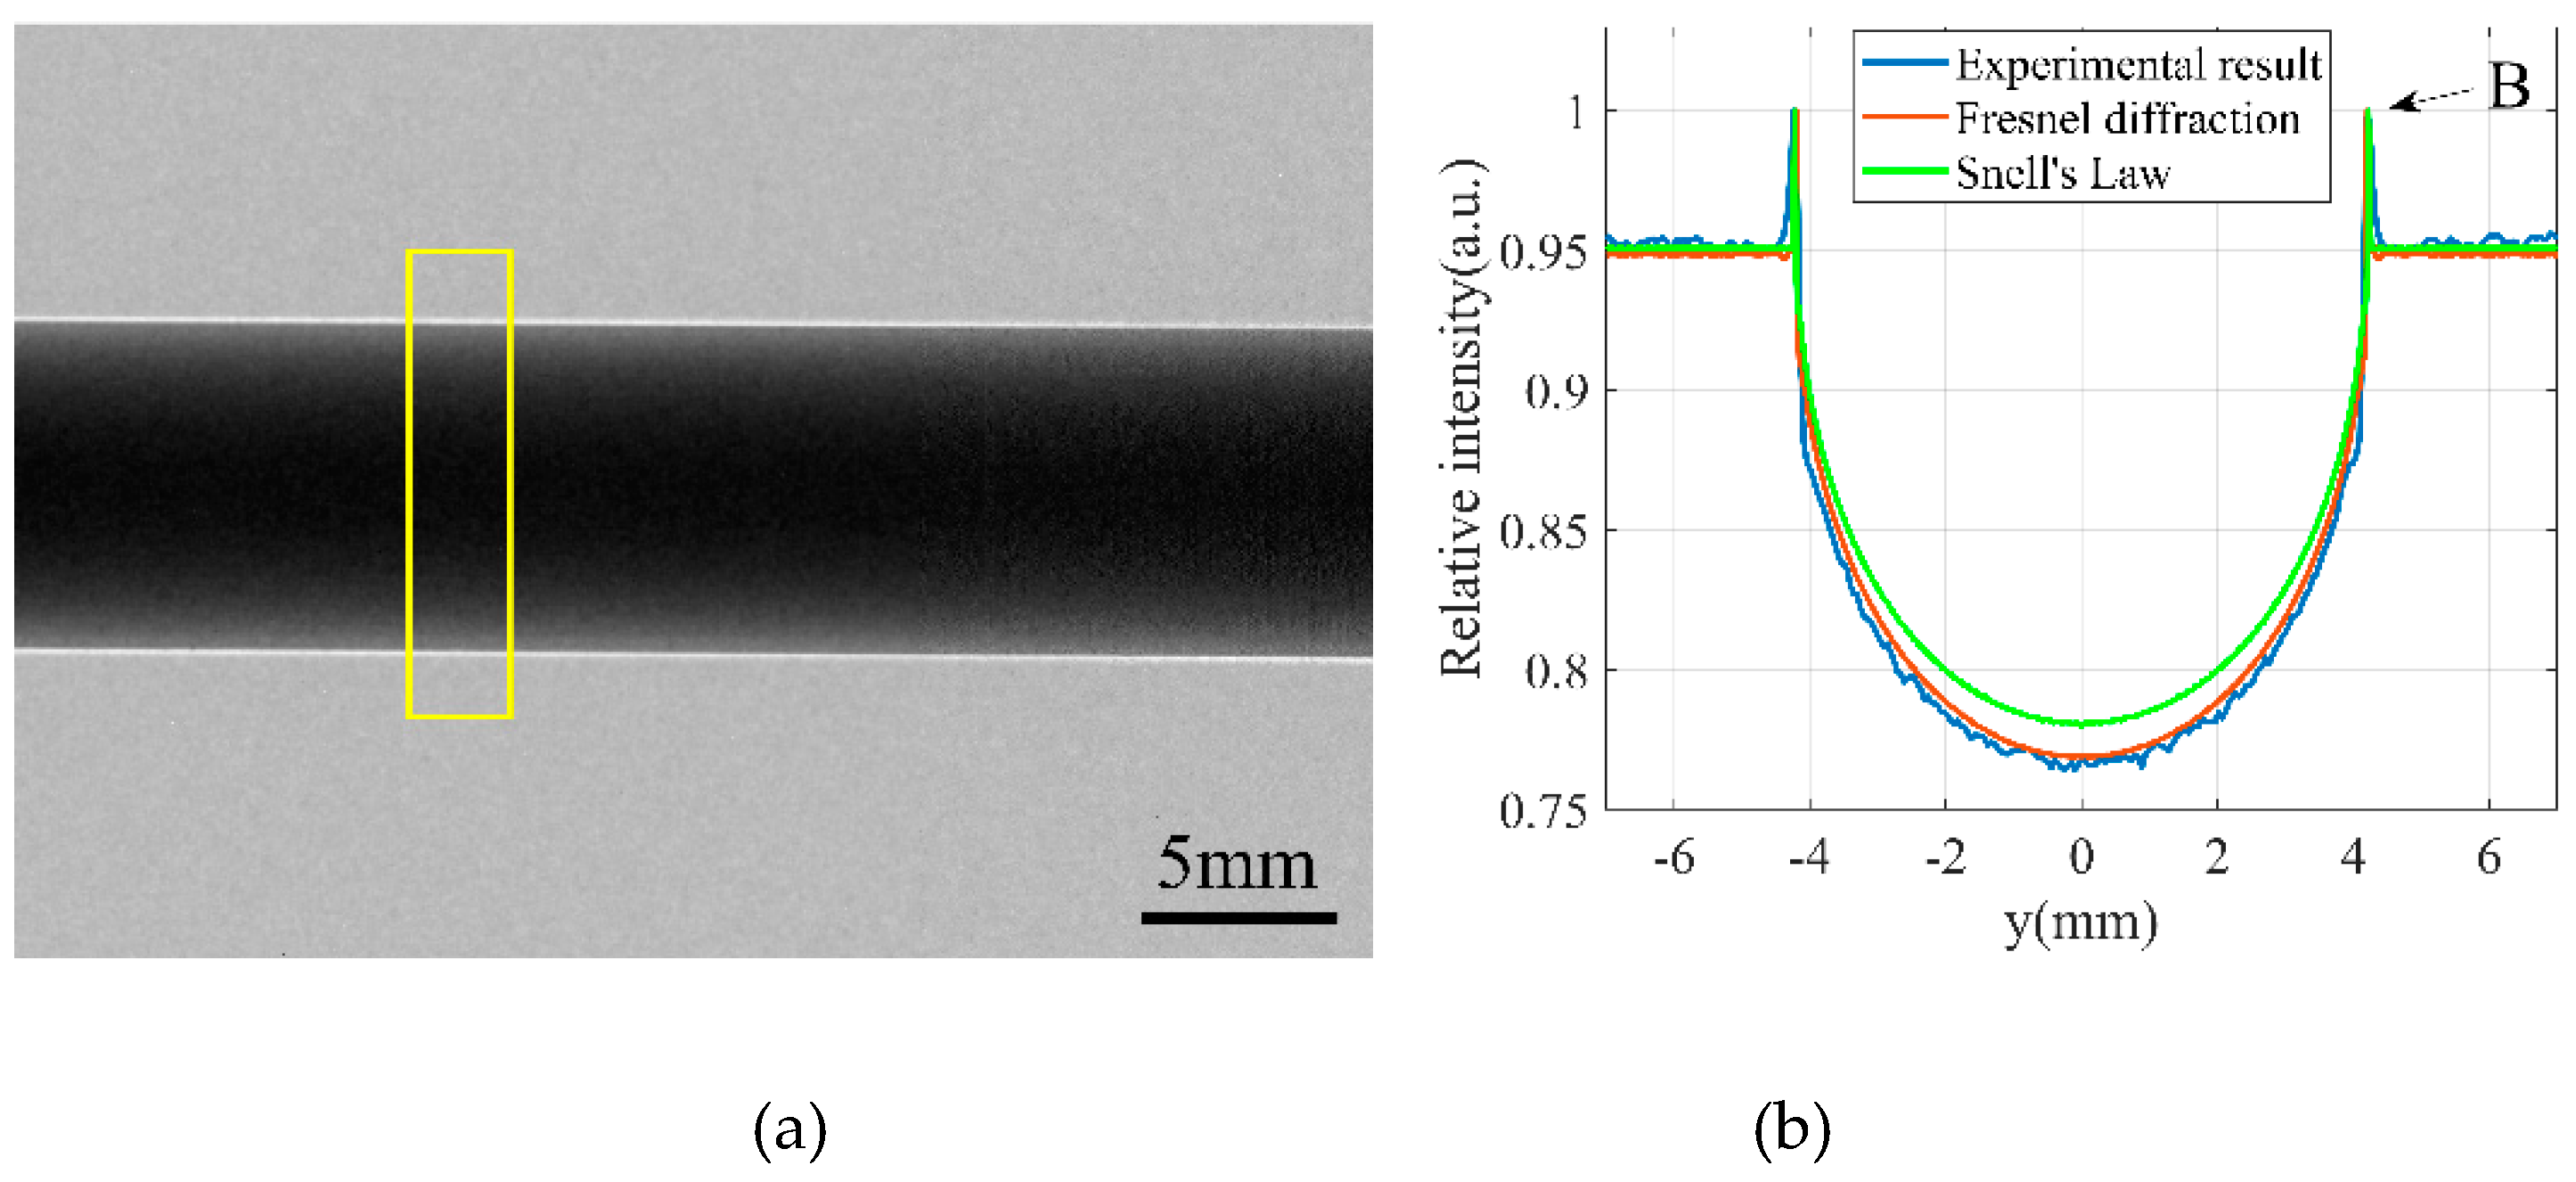
Figure 8.
(a) The contrast of the object varies with the distance between object and the X-ray source. The system’s length was 1.5 m. (b) The contrast of the object changes with the system’s length, and the object was 0.75 m away from the X-ray source.
Figure 8.
(a) The contrast of the object varies with the distance between object and the X-ray source. The system’s length was 1.5 m. (b) The contrast of the object changes with the system’s length, and the object was 0.75 m away from the X-ray source.
Disclaimer/Publisher’s Note: The statements, opinions and data contained in all publications are solely those of the individual author(s) and contributor(s) and not of MDPI and/or the editor(s). MDPI and/or the editor(s) disclaim responsibility for any injury to people or property resulting from any ideas, methods, instructions or products referred to in the content. |
© 2025 by the authors. Licensee MDPI, Basel, Switzerland. This article is an open access article distributed under the terms and conditions of the Creative Commons Attribution (CC BY) license (http://creativecommons.org/licenses/by/4.0/).
Copyright: This open access article is published under a Creative Commons CC BY 4.0 license, which permit the free download, distribution, and reuse, provided that the author and preprint are cited in any reuse.


