2. Materials and Methods
2.1. Compilation of Human Acrosomal Proteins and Visualization
On 19 September 2024, proteins related to the human acrosome were compiled from UniProt (
https://www.uniprot.org) using the search term “acrosome OR acrosomal” and filtering the results to only include SwissProt reviewed, human entries. UniProt IDs, protein names, gene names, sequences in FASTA format and functional information were extracted for each protein and used to build the dataset.
If available, experimentally derived protein structures were obtained from the Protein Data Bank (
https://www.rcsb.org/). If they were not available, predicted protein structures were obtained from the AlphaFold Protein Structure Database (
https://alphafold.ebi.ac.uk/).
2.2. Computational Prediction of Intrinsic Disorder in Human Acrosomal Proteins
The prediction of intrinsic disorder in the dataset of proteins was conducted using six widely recognized computational models, accessed via the Rapid Intrinsic Disorder Analysis Online RIDAO platform (
https://ridao.app) [
91]. These models include PONDR
® VLXT, which integrates three neural networks designed to predict disorder across the full length of a protein sequence, combining results from terminal and internal region predictors [
92]. PONDR
® VL3, which focuses on long disordered regions and uses multiple neural networks to generate predictions [
93]. PONDR
® VSL2B uses support vector machines (SVMs) and is optimized for both short and long disordered regions [
94]. The IUPred model, which is different from the previous machine learning models, estimates disorder by evaluating inter-residue interaction energies, relying on energy-based potentials to predict regions unlikely to form stable structures, and which is run in two modes, to predict short and long IDRs [
95,
96]. Finally, PONDR-FIT is an artificial neural network (ANN) meta-predictor that combines outputs from multiple disorder prediction models [
97]. These models were aggregated by RIDAO [
91] to provide a comprehensive disorder prediction profile for each acrosomal protein.
Protein disorder was evaluated using two metrics obtained from each of the six models: the average disorder score (ADS) and the percentage of predicted intrinsically disordered residues (PPIDR). For each protein, the ADS was calculated by taking the arithmetic mean of all residue-specific disorder scores. The PPIDR was determined by counting the number of residues with a disorder score greater than 0.5, dividing this by the total number of residues, and expressing the result as a percentage. Using these metrics, we classified proteins into distinct categories. Based on ADS, proteins were considered highly ordered if their score was below 0.25, moderately disordered if between 0.25 and 0.5, and highly disordered if 0.5 or higher. Similarly, using PPIDR, proteins were classified as highly ordered (PPIDR < 10%), moderately disordered (10% ≤ PPIDR < 30%), or highly disordered (PPIDR ≥ 30%). These categories were based on established baselines of disorder found in the literature.
Then, RIDAO was further used to obtain the outputs from two binary predictors, the charge-hydropathy (CH) plot [
5] and the cumulative distribution function (CDF) plot [
60], which were combined to generate a CH-CDF phase diagram [
98,
99,
100]. This allowed for the classification of proteins based on their location within the CH-CDF phase space. Proteins in Quadrant I can be categorized as ordered (predicted to be ordered by both models), Quadrant III can be categorized as native coils or pre-molten globules (disordered by both methods), Quadrant II can be categorized as hybrid proteins or putative native molten globules (ordered by CH but disordered by CDF), and Quadrant IV can be categorized as proteins that are disordered according to the CH plot but ordered by the CDF plot [
98].
2.3. Impact of Intrinsic Disorder on Function in Human Acrosomal Proteins
Disorder predictions and related functional annotations for the dataset of proteins were retrieved from the D
2P
2 database, which provides predictions for certain indexed proteins from fully sequenced genomes [
101]. D
2P
2 aggregates results from several well-established computational per-residue disorder prediction models, including PONDR
® VLXT [
92], PONDR
® VSL2B [
94], IUPred (both short and long forms) [
95,
96], PrDOS [
102], PV2, and three variants of ESpritz (NMR, DisProt, and X-ray) [
103]. The predicted locations of disordered regions are displayed as nine colored bars in the D
2P
2 visual interface, each representing a different model. In addition to individual predictions, D
2P
2 also presents a consensus view of disorder across all predictors using a blue-green-white bar, where blue indicates regions are where the disorder predictions intersect the SCOP domain prediction and green indicates regions represent disorder that is not found within a predicted SCOP domain [
101]. Above this consensus bar, two lines with numbered, colored bars show the predicted locations of SCOP (Structural Classifications of Proteins) domains [
104,
105], identified by the SUPERFAMILY predictor [
106]. Empirically confirmed post-translational modifications (PTMs), identified by the PhosphoSitePlus platform [
107], are shown as differently colored circles at the bottom of the plot. Functional annotations of disordered regions are also provided, such as the predicted disorder-based binding sites (MoRF regions) identified by the ANCHOR algorithm [
108,
109], which are displayed as yellow patterned bars.
Acrosomal proteins in the dataset were classified based on the presence of at least one residue with 75% consensus for predicted disorder and at least one strong SCOP domain hit via D2P2. Proteins meeting these criteria were further analyzed to identify instances of overlap between consensus disordered regions and SCOP domains, which may suggest potential functional implications of the intrinsic disorder. The superfamilies of the SCOP domains affected by disordered regions were further analyzed based on the number of residues impacted and to determine whether certain SCOP superfamilies were more frequently affected by disorder within proteins associated with the acrosome.
2.4. Gene Ontology Enrichment Analysis of Acrosomal Proteins
Gene Ontology (GO) enrichment analysis was conducted using the g:GOSt tool, part of the g:Profiler (
https://biit.cs.ut.ee/gprofiler/gost), to understand the biological processes, molecular functions, and cellular components associated with proteins that exhibited overlap between SCOP domains and regions of predicted intrinsic disorder. The analysis was performed specifically on proteins with at least one SCOP functional domain and 75% consensus for disordered residues, as identified through the D
2P
2 platform.
The tool g:GOSt looks at functional enrichment analysis by mapping input proteins to known GO terms and testing for overrepresentation of specific GO categories in the proteins of interest. The tool uses a hypergeometric test to assess enrichment, and statistical significance is controlled using the Benjamini-Hochberg false discovery rate (FDR) correction to minimize type I errors. For this study, g:GOSt was used to categorize proteins into three main GO functional domains: Biological Processes (e.g., cellular activities, reproductive functions), Molecular Functions (e.g., binding activity, enzymatic activity), and Cellular Components (e.g., membrane regions, subcellular structures). Only significantly enriched terms with an adjusted FDR < 0.05 were considered in the final analysis. In addition to GO terms, g:GOSt also yielded information on KEGG pathways, Reactome pathways, and other functional categories, including protein complexes and human phenotype ontology. This approach identified important biological roles and functional characteristics associated with disorder in SCOP domains. This will allow for insight into potential functional implications of disordered regions in acrosomal proteins.
2.5. Intractability Analysis of Human Acrosomal Proteins
The interactions of the 250 acrosomal proteins were retrieved and visualized using Search Tool for the Retrieval of Interacting Genes (STRING)
https://string-db.org/. STRING utilizes experimentally validated information and predictions to generate models of protein-protein interactions (PPI) [
110]. Proteins in the network maps are represented as nodes and the interactions are represented as edges. The model's interactions are broken up into seven categories, each represented by different color edges. For known interactions are represented by light blue for evidence from a database and purple for experimentally determined interactions. For predicted interactions green represents proteins in the same gene neighborhood, red represents gene fusion, and blue represents gene co-occurrence, black represents co-expression, light purple represents protein homology, and green represents text mining evidence [
110].
String was utilized to generate three types of models: a PPI network between the 250 human acrosomal proteins, a PPI network centered on the 250 human acrosomal proteins, and individual networks centered on individual human acrosomal proteins. Models were generated at 4 different confidence intervals 0.15 (low confidence) 0.4 (medium confidence), 0.7 (high confidence), and 0.9 (highest confidence) and were run with a maximum of 500 interactions in the first shell for the centered and the individual PPI [
73,
111]. With each model STRING embedded processes generate network statistics of the number of nodes, the average node degree which represents the average number of interactions per protein, the average clustering coefficient which is a number between 0 and 1 (0 represents each neighboring protein are only connected to one protein, while 1 represents each neighboring protein are interacting with each other), and a PPI enrichment p-value which is the probability of having more interactions than predicted for a random set of proteins [
73,
110,
111].
2.6. Liquid-Liquid Phase Separation Propensity in Human Acrosomal Proteins
To evaluate the potential of the acrosomal proteins for liquid-liquid phase separation (LLPS), we employed FuzDrop, a computational tool that predicts LLPS propensity based on protein sequence features [
112,
113]. FuzDrop uses sequence complexity and specific interaction motifs, such as cation-π or hydrophobic contacts, to determine the likelihood of droplet state formation in proteins. The LLPS analysis provided insights into sequence regions that support non-specific interactions crucial for droplet formation.
For each protein, we calculated the probability of forming a droplet state (p
LLPS) through FuzDrop [
112,
113]. Proteins with a p
LLPS of ≥0.60 were classified as droplet-drivers, meaning they can independently undergo LLPS. On the other hand, proteins with p
LLPS < 0.60 were classified as droplet-clients, which need additional interactions to partition into condensates. These droplet-clients may still participate in LLPS through specific droplet-promoting regions, defined by consecutive residues with high probability values (p
DP ≥ 0.60). This analysis allowed us to distinguish between proteins that can spontaneously phase-separate and those dependent on cellular or environmental contexts.
Next, droplet-promoting regions were identified based on residue-level droplet-promoting probabilities (pDP), with regions classified by at least five consecutive residues scoring pDP ≥ 0.60. These regions are considered main contributors to phase separation propensity and were used to assess LLPS potential, including within proteins classified as droplet-clients. We then assessed the presence of aggregation hot-spots, which are residues with high droplet-promoting probabilities (pDP ≥ 0.60) and high interaction mode divergence (SBIND ≥ 2.2). These hot-spots indicate a predisposition to aggregation within condensates, especially under conditions that promote a shift from liquid-like to solid-like states. The analysis also included cellular context-dependence, with SBIND values calculated to show the potential for residues to switch between binding modes based on cellular environment. Residues with SBIND ≥ 2.25 were classified as context-dependent interaction zones, which means that the binding mode diversity might influence LLPS behavior and potential of aggregation.
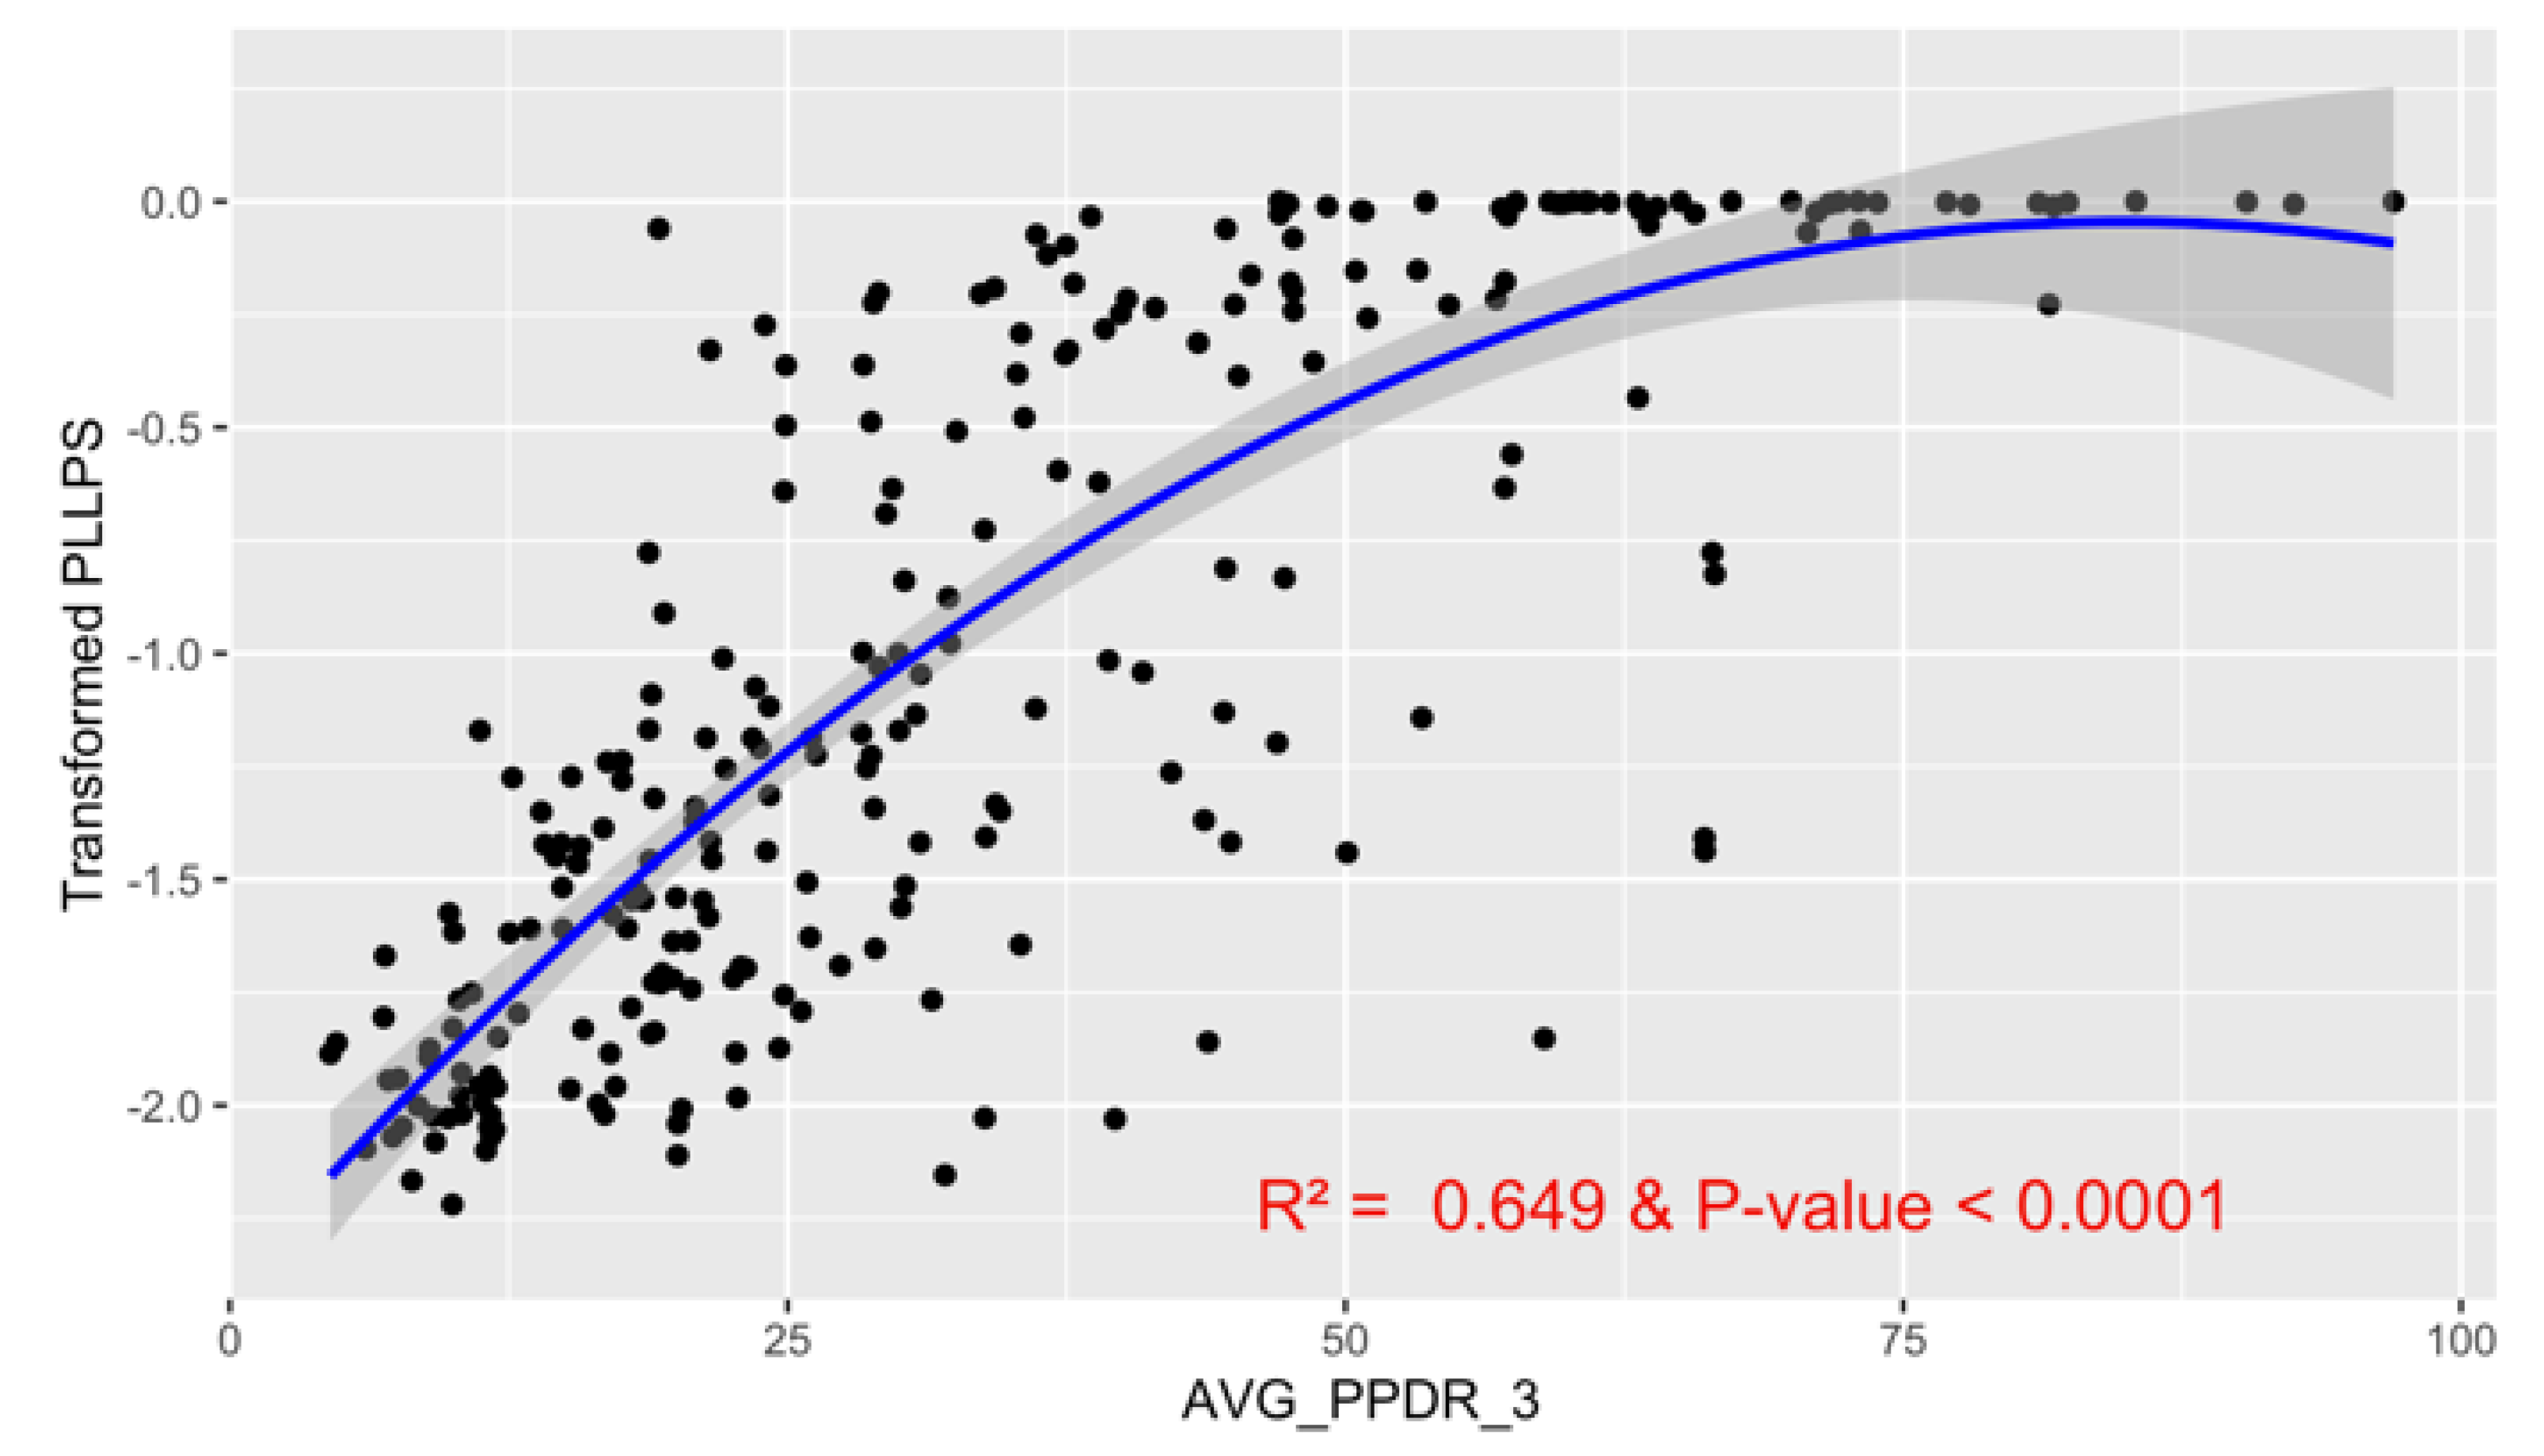
To analyze the relationship between the probability of liquid-liquid phase separation (pLLPS) and the percentage of predicted intrinsically disordered residues (PPIDR) from three models (PONDR® VXLT, PONDR® VL3, and PONDR® VSL2B), we employed a regression model. Due to the presence of boundary values in pLLPS (0 and 1), we adjusted these values to avoid computational issues by applying small corrections (0 replaced with 10-6, and 1 replaced with 1 - 10-6). Then, a Box-Cox transformation was then used on the adjusted pLLPS values to normalize the distribution, with an optimal lambda of 0.0606 determined empirically. This transformation resulted in the creation of a new variable, transformed pLLPS, which we used as the response variable in the model.
We then fitted a second-degree polynomial regression model to assess the relationship between transformed pLLPS and PPDR, capturing any potential non-linear patterns in the data. We then conducted diagnostic analyses to evaluate the assumptions underlying our regression model. A Residuals vs. Fitted plot was generated to assess linearity, allowing us to verify that residuals displayed no systematic pattern across fitted values. To evaluate the normality of residuals, we used a Q-Q plot, comparing the distribution of residuals against a theoretical normal distribution. Then, we used a Scale-Location plot to assess homoscedasticity, to ensure that the residuals maintained a constant level of variance across the fitted values. Lastly, we accessed the Residuals vs Leverage plot to identify any potential influential data points with high leverage or large residuals that might disproportionally affect the model.
2.7. Data Analysis via R
All data analysis was done in R (version 4.4.2) with RStudio (version 2024.04.2+764) by employing a wide range of packages to process, visualize, and analyze the acrosomal protein dataset. Data manipulation was performed using the packages dplyr and tidyr, which allowed for the merging of datasets, reshaping data from wide to long formats, and calculating summary statistics. Importation and management of CSV and Excel data files was done using the packages readr and readxl, respectively. For correlation analysis and model fitting, R’s built-in stats package functions were used. The ggplot2 package was used to create various visualizations, including scatter plots, boxplots, histograms, and pie charts. The package gridExtra was applied for arranging multiple plots into a single figure. Additional enhancements to these plots, such as label placement in scatter plots, were achieved using the package ggrepel. To create formatted tables of results, the kableExtra package was utilized.
3. Results
3.1. Compilation of Human Acrosomal Proteins and Visualization
The UniProt database search yielded a total of 250 proteins associated with the human acrosome, which were used for the present study. Representative examples of these 250 proteins were selected and shown in
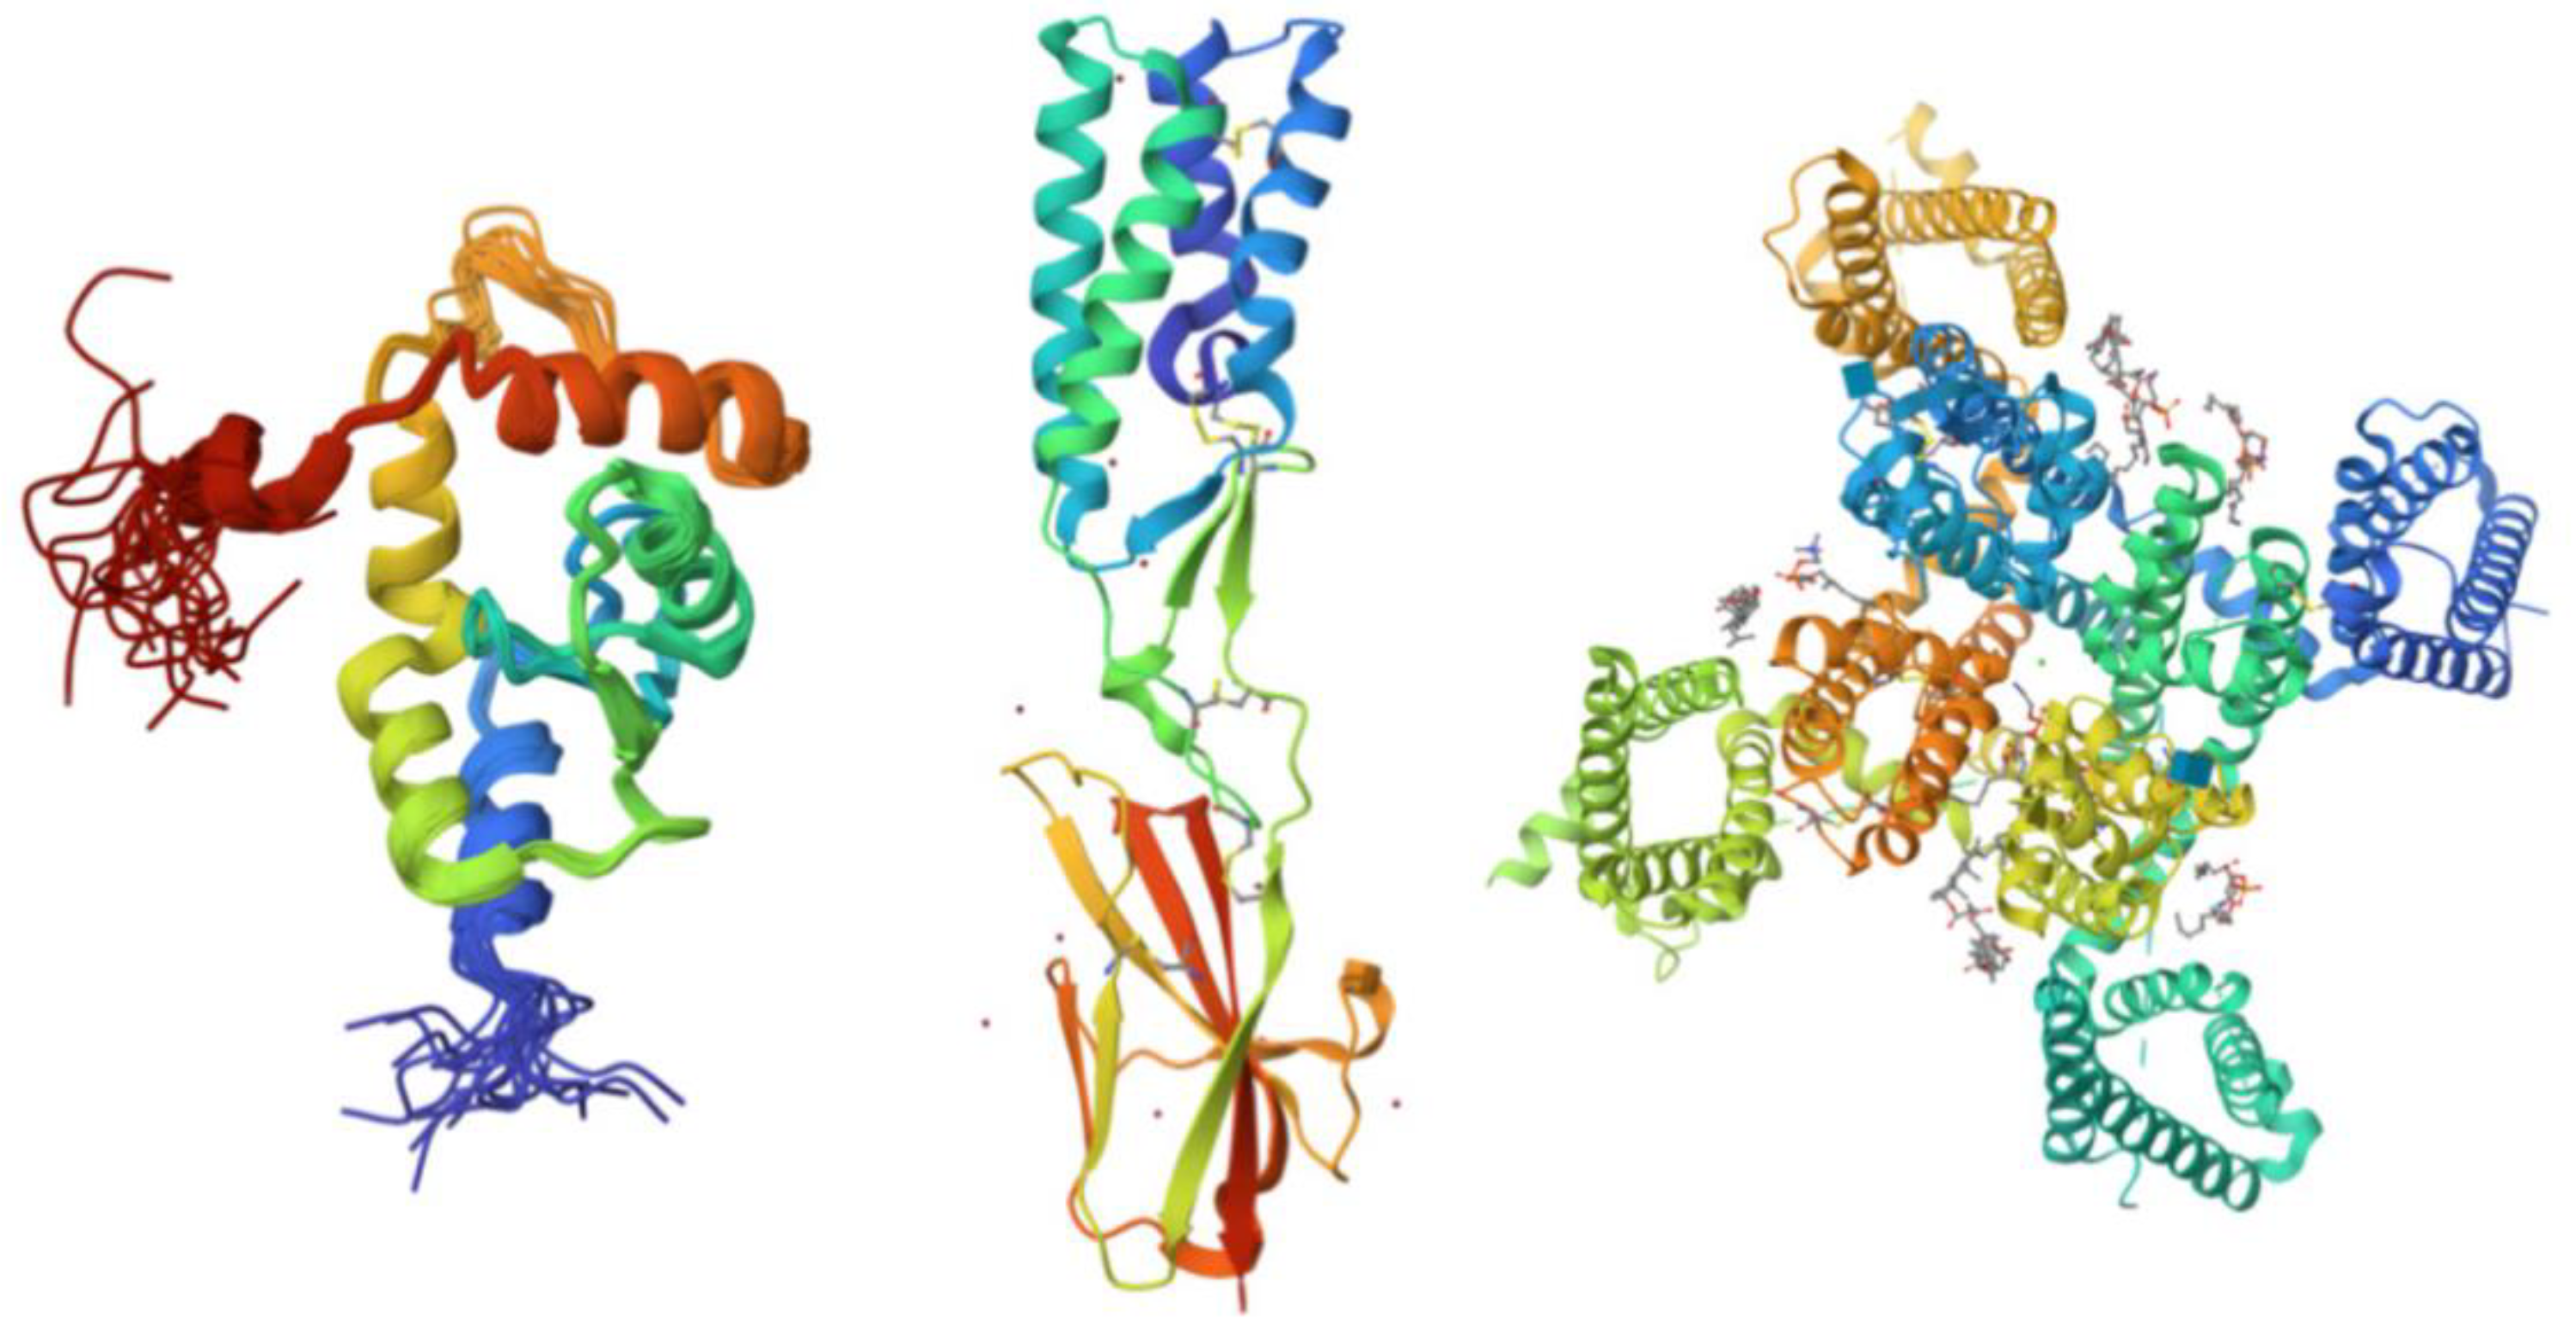
Figure 1, which shows illustrative examples of experimentally derived protein structures obtained from the Protein Data Bank, and
Figure 2, representing predicted structures of 10 most disordered proteins obtained from the AlphaFold Protein Structure Database.
3.2. Computational Prediction of Intrinsic Disorder in Human Acrosomal Proteins
Using RIDAO, we generated disorder predictions for our 250 acrosomal proteins, analyzing each protein across the models. Key descriptive statistics for 3 of the models (PONDR
® VXLT, PONDR
® VSL2B, and PONDR
® VL3) disorder scores (minimum, mean, median, and maximum) are summarized in
Table 1. For example, as per PONDR
® VL3, the mean PPIDR score across all proteins was 33.37, with values ranging from 0 to 100, indicating a wide variation in intrinsic disorder across our dataset. Similarly, based on corresponding ADS values, the PONDR
® VXLT model exhibited the lowest minimum score (0.0602), while PONDR
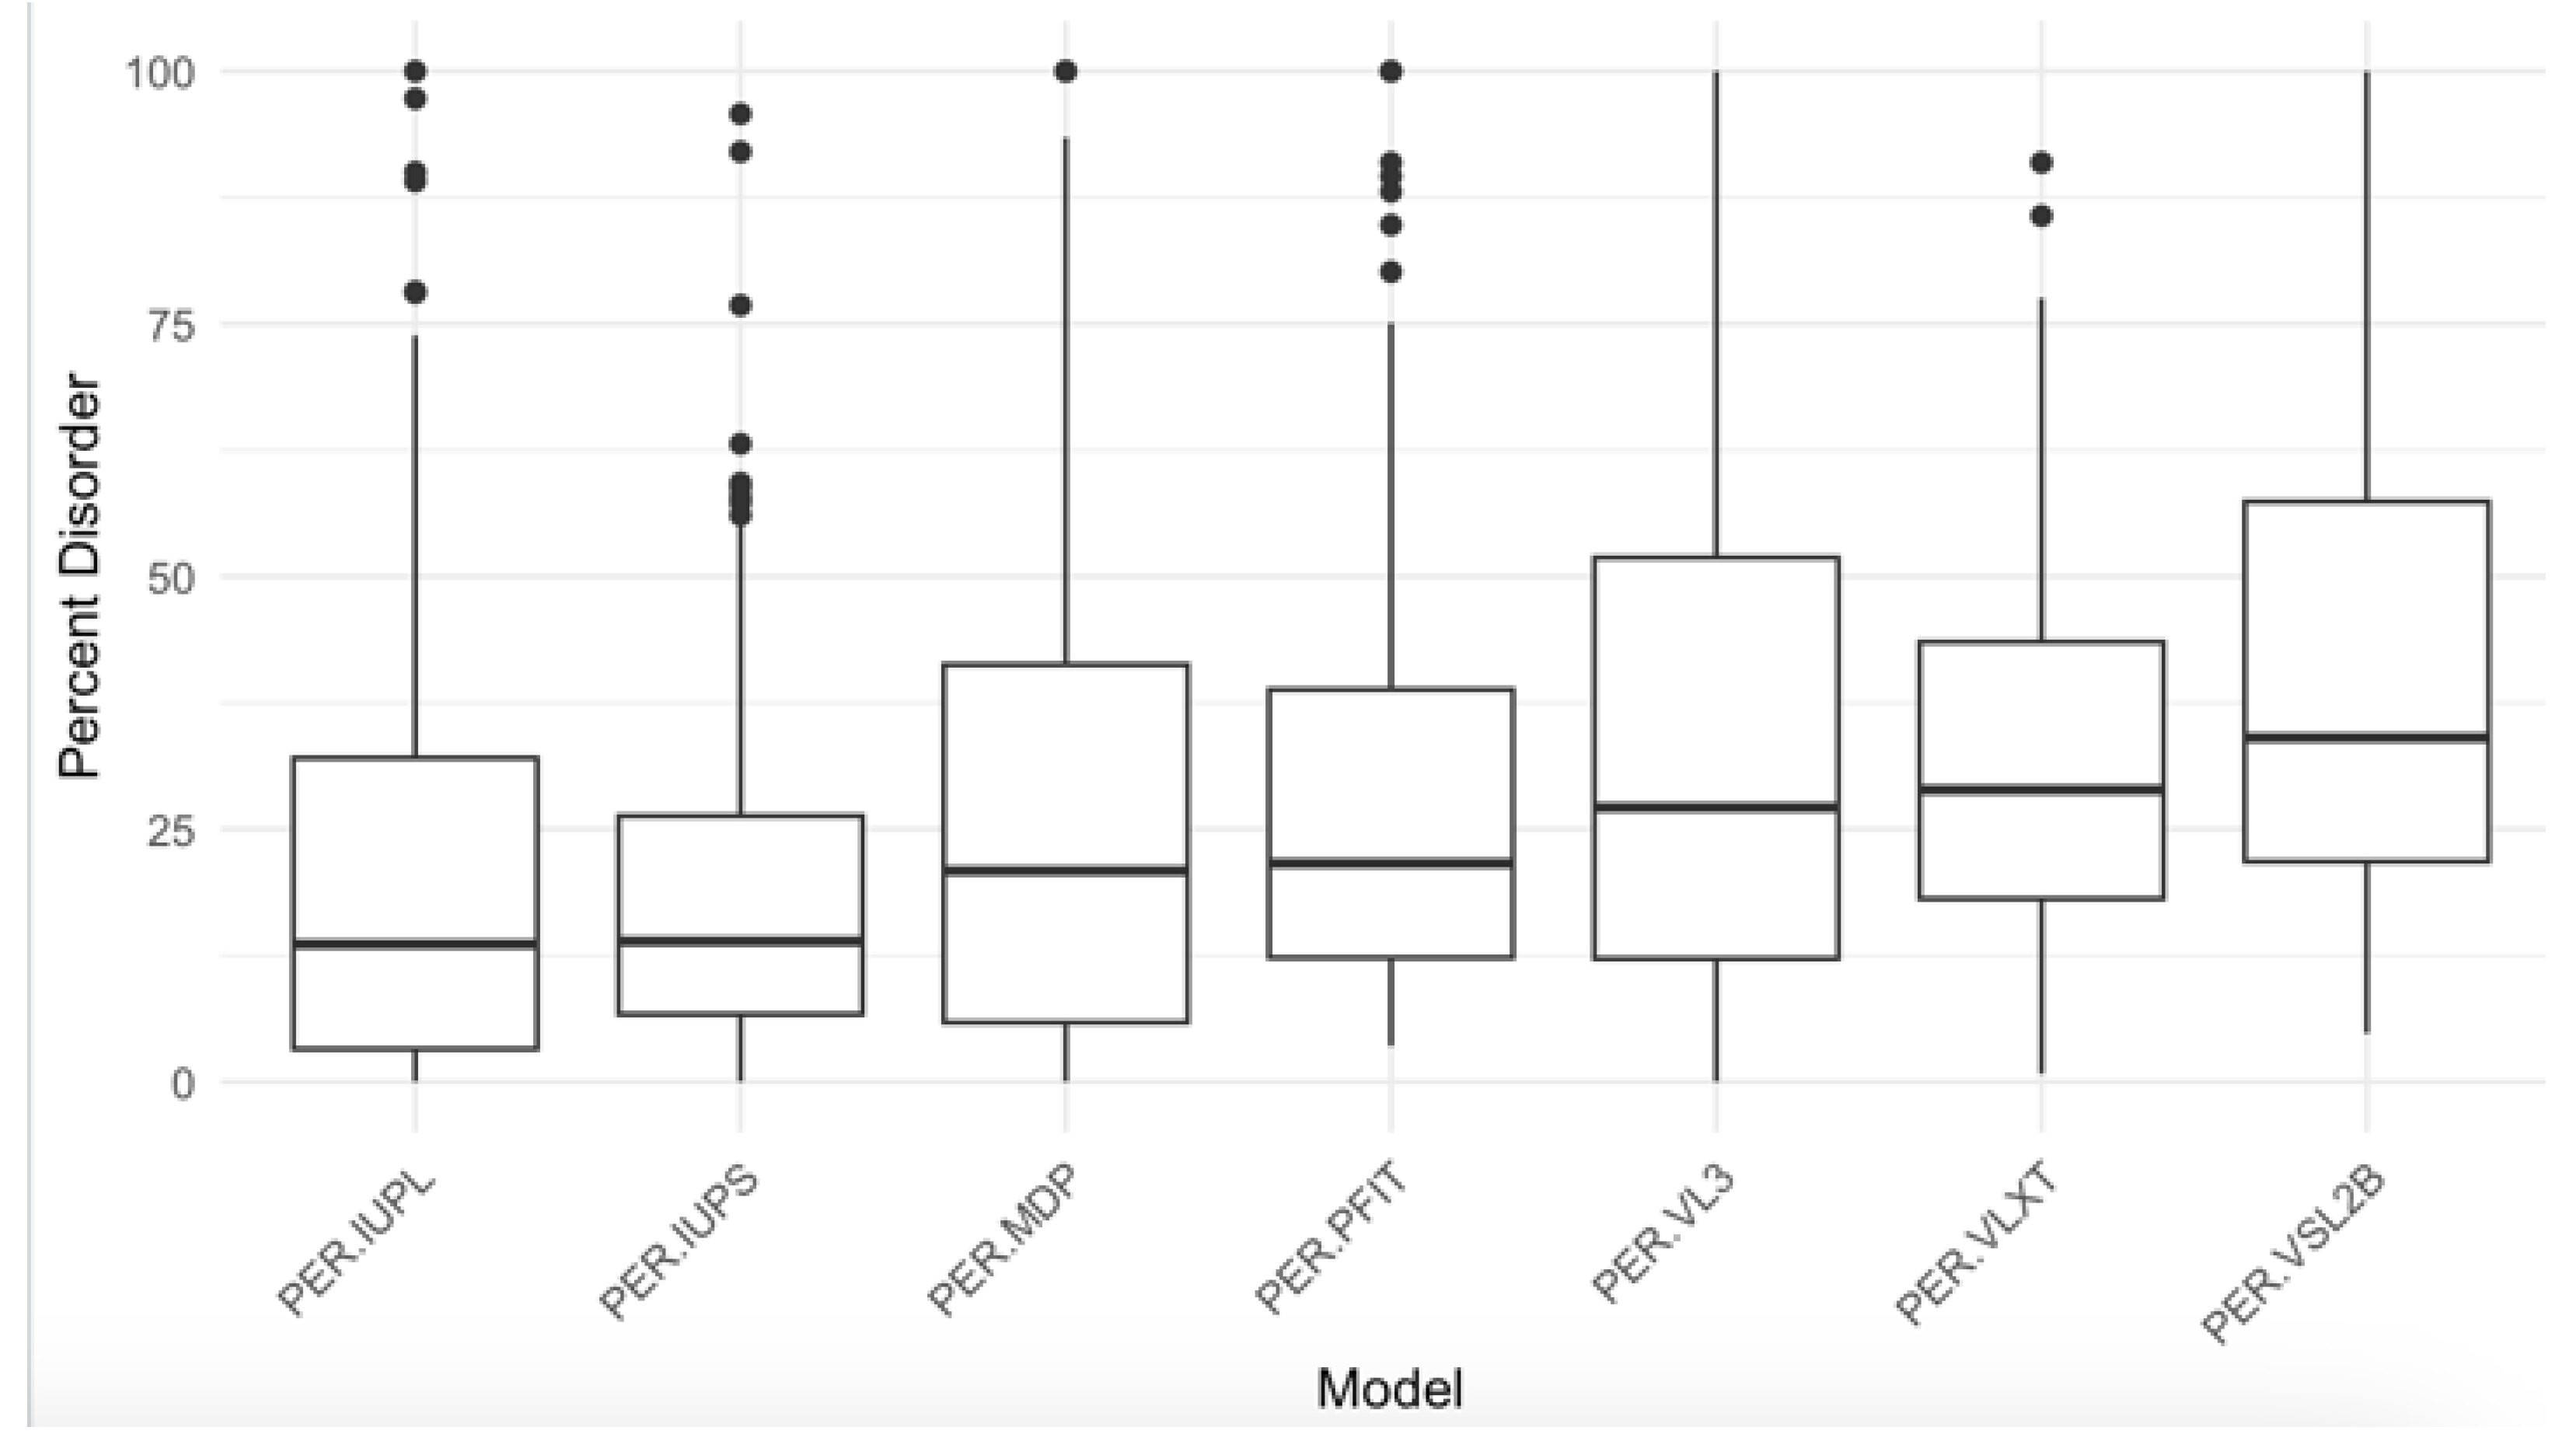
® VSL2B had the highest maximum score (0.9907). A series of boxplots to show percent disorder values across our dataset between different models was also created (
Figure 3).
These findings indicate that the degree of intrinsic disorder in acrosomal proteins spans a broad spectrum, potentially reflecting diversity of their disorder-based functionalities. Proteins with low disorder scores are likely to be involved in roles requiring structural stability, such as enzymatic catalysis, transport, scaffolding or maintaining the architecture of the acrosome, whereas those with high disorder scores may contribute to dynamic processes, such as vesicle trafficking or molecular recognition. The observed range suggests a selective advantage for both ordered and disordered structures within the acrosomal proteome, enabling the acrosome to fulfill its complex roles in fertilization.
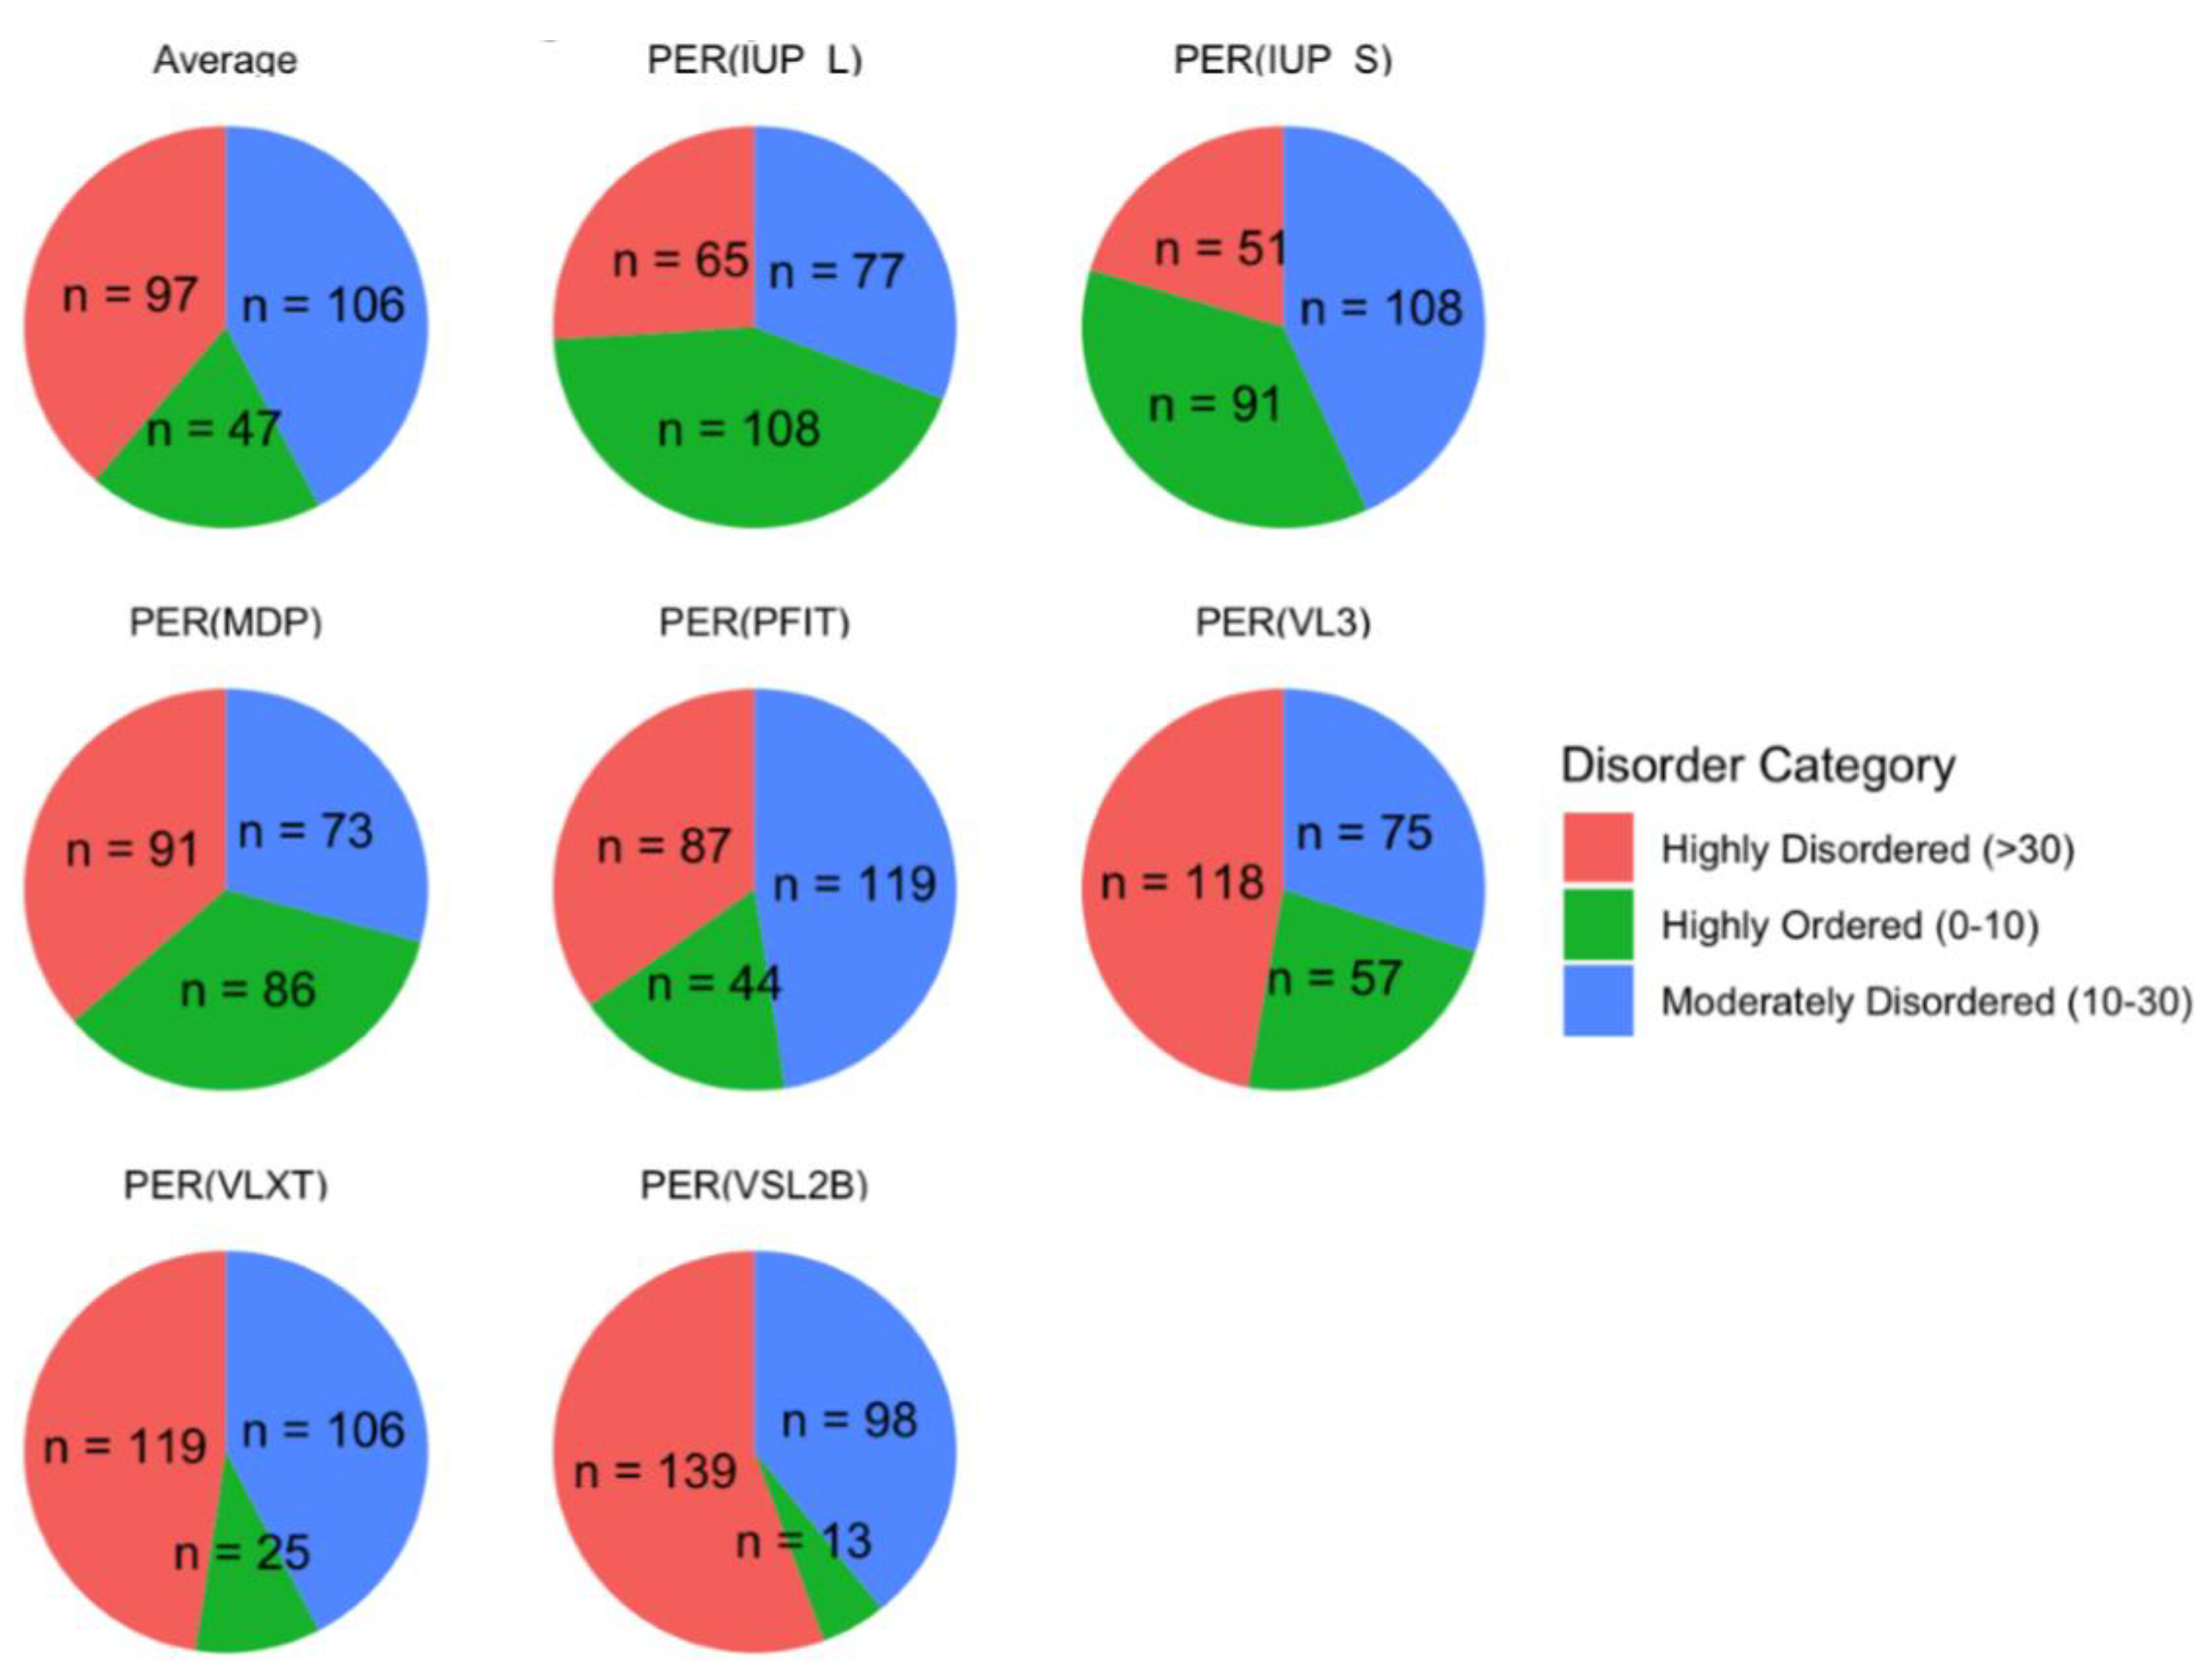
We classified proteins by their Percent Predicted Disordered Residues (PPDR) scores into three categories: highly ordered (0−10%), moderately disordered (10−30%), and highly disordered (>30%). As illustrated in
Figure 4, this classification showed that 97 proteins were highly disordered, 106 were moderately disordered, and 47 were highly ordered on average across all models. These proportions emphasize a skew toward moderate and high levels of disorder in the acrosomal protein dataset. This distribution aligns with previous findings in other specialized cellular structures, such as the nucleolus and synaptic vesicles [
116,
117], where intrinsic disorder is prevalent and facilitates rapid assembly and disassembly of macromolecular complexes. The high proportion of moderately and highly disordered proteins in the acrosomal dataset may similarly reflect an adaptation for flexible interactions required during the fertilization process.
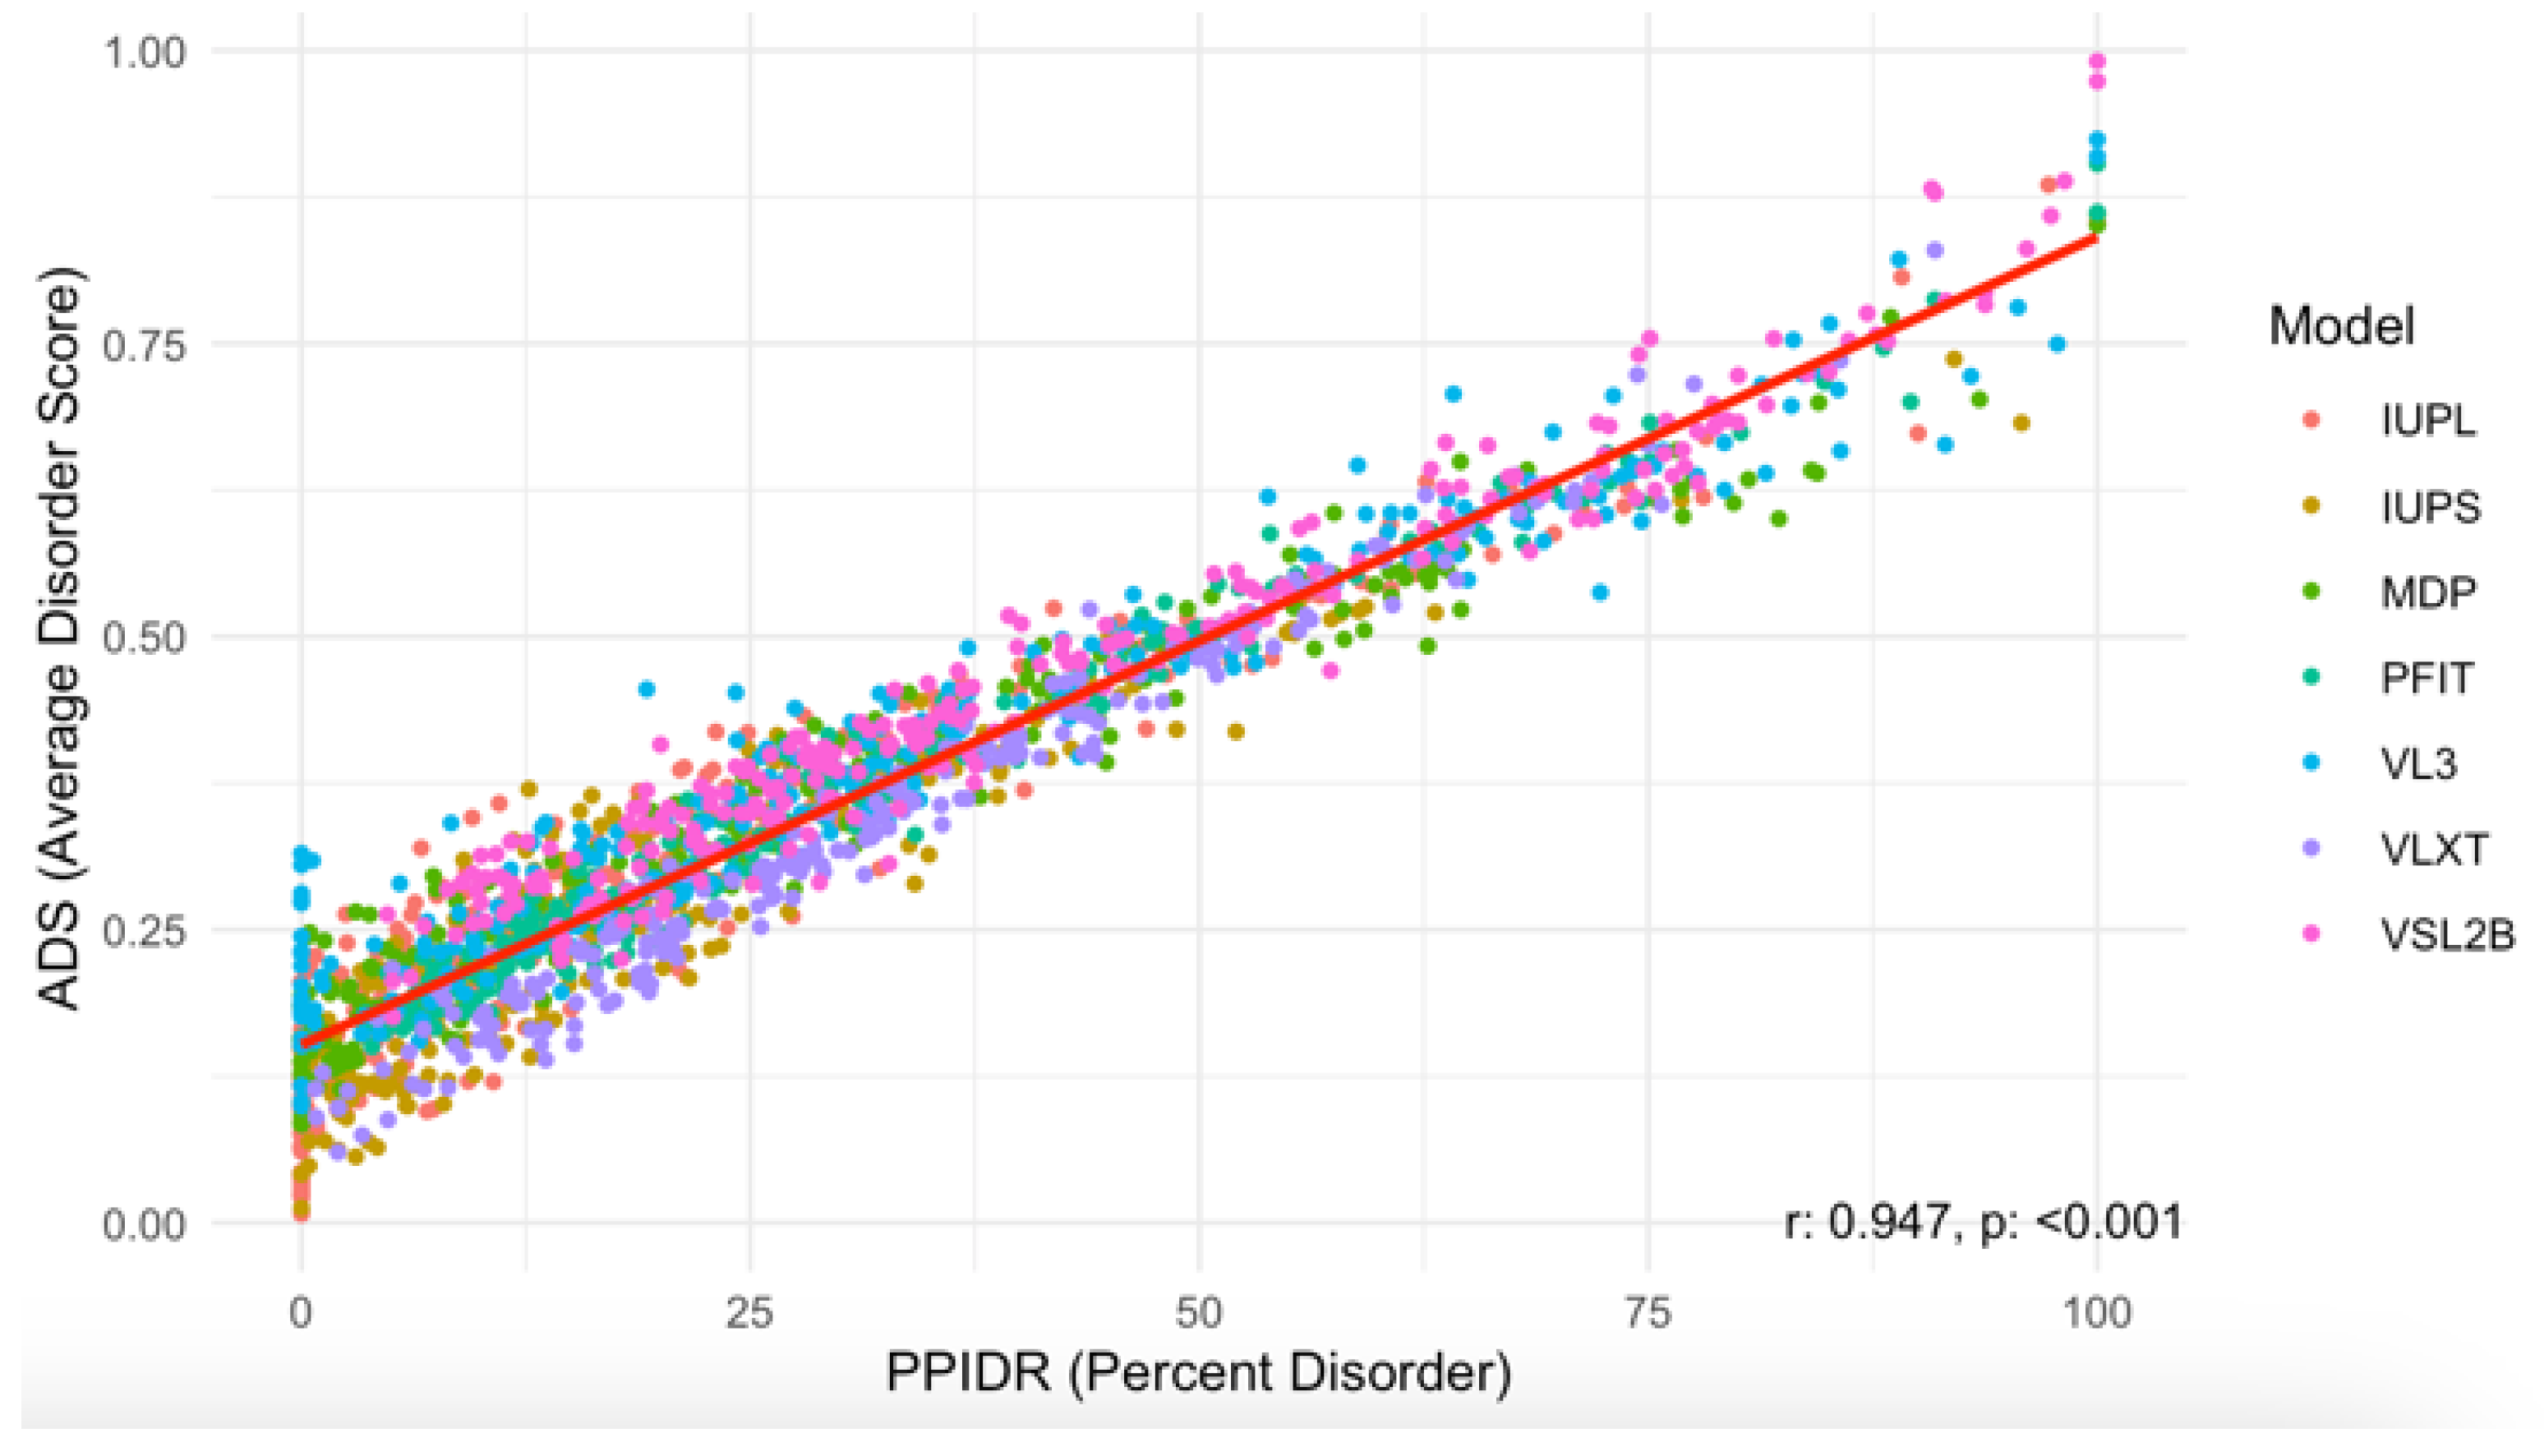
Next, we examined the relationship between the PPIDR and ADS scores to better understand correlations between these two disorder metrics. As shown in
Figure 5, the scatter plot of PPIDR vs. ADS reveals a consistent trend (p < 0.001) with higher ADS values generally associated with increased PPIDR, suggesting a relationship between these metrics across the majority of proteins. This trend further supports the idea that disorder-related properties, such as extended conformations or binding promiscuity, are integral to the function of many acrosomal proteins. Notably, proteins with high ADS values may exhibit increased potential for transient interactions, such as binding to sperm or oocyte receptors, or participating in acrosomal vesicle fusion.
We further categorized our proteins based on Charge-Hydropathy (CH) and Cumulative Distribution Function (CDF) scores.
Figure 6A shows a scatter CH vs. CDF graph, whereas
Figure 6B presents a bar chart showing quadrant distributions, where each quadrant represents a different prediction alignment between CH and CDF: Q1 (lower-right quadrant) includes proteins predicted as ordered by both CH and CDF; Q2 (lower-left quadrant) includes those ordered by CH but disordered by CDF; Q3 (upper-left quadrant) includes proteins disordered by both predictors; and Q4 (upper-right quadrant) represents those disordered by CH but ordered by CDF. This quadrant analysis provides a structured view of how each protein's disorder may vary based on predictor alignment.
The quadrant distribution offers additional insight into the complexity of disorder prediction and its functional implications. Q3 proteins, predicted as disordered by both CH and CDF, align well with the high levels of intrinsic disorder observed in the acrosomal proteome and likely represent proteins with a high degree of flexibility essential for dynamic processes like vesicle fusion or enzymatic activation. In contrast, Q1 proteins, which are ordered by both predictors, may play more static structural roles, supporting the acrosomal matrix or organizing its architecture.
Q2 and Q4 proteins, where predictor alignments diverge, present a middle ground. Proteins in Q2 (ordered by CH but disordered by CDF) may exhibit conditional disorder, becoming functional only under specific physiological conditions such as changes in pH, ion concentration, or binding partner availability. Similarly, Q4 proteins (disordered by CH but ordered by CDF) may represent cases where localized order is embedded within a largely disordered protein, enabling dual functionalities. These nuances highlight how prediction alignments offer additional perspectives on the roles of intrinsic disorder in the acrosomal proteome.
These findings suggest the critical role of intrinsic disorder in acrosomal function. The acrosome, as a specialized organelle, must balance structural stability with dynamic adaptability during sperm capacitation, the acrosome reaction, and fertilization. Our analysis highlights how intrinsic disorder in acrosomal proteins contributes to this balance, enabling complex processes such as enzymatic activation, membrane remodeling, and molecular recognition. These results provide a foundation for future studies investigating how intrinsic disorder in acrosomal proteins contributes to reproductive biology and potential implications for fertility disorders.
3.3. Impact of Disorder on Function in Human Acrosomal Proteins
To further examine intrinsic disorder in acrosomal proteins, we utilized D
2P
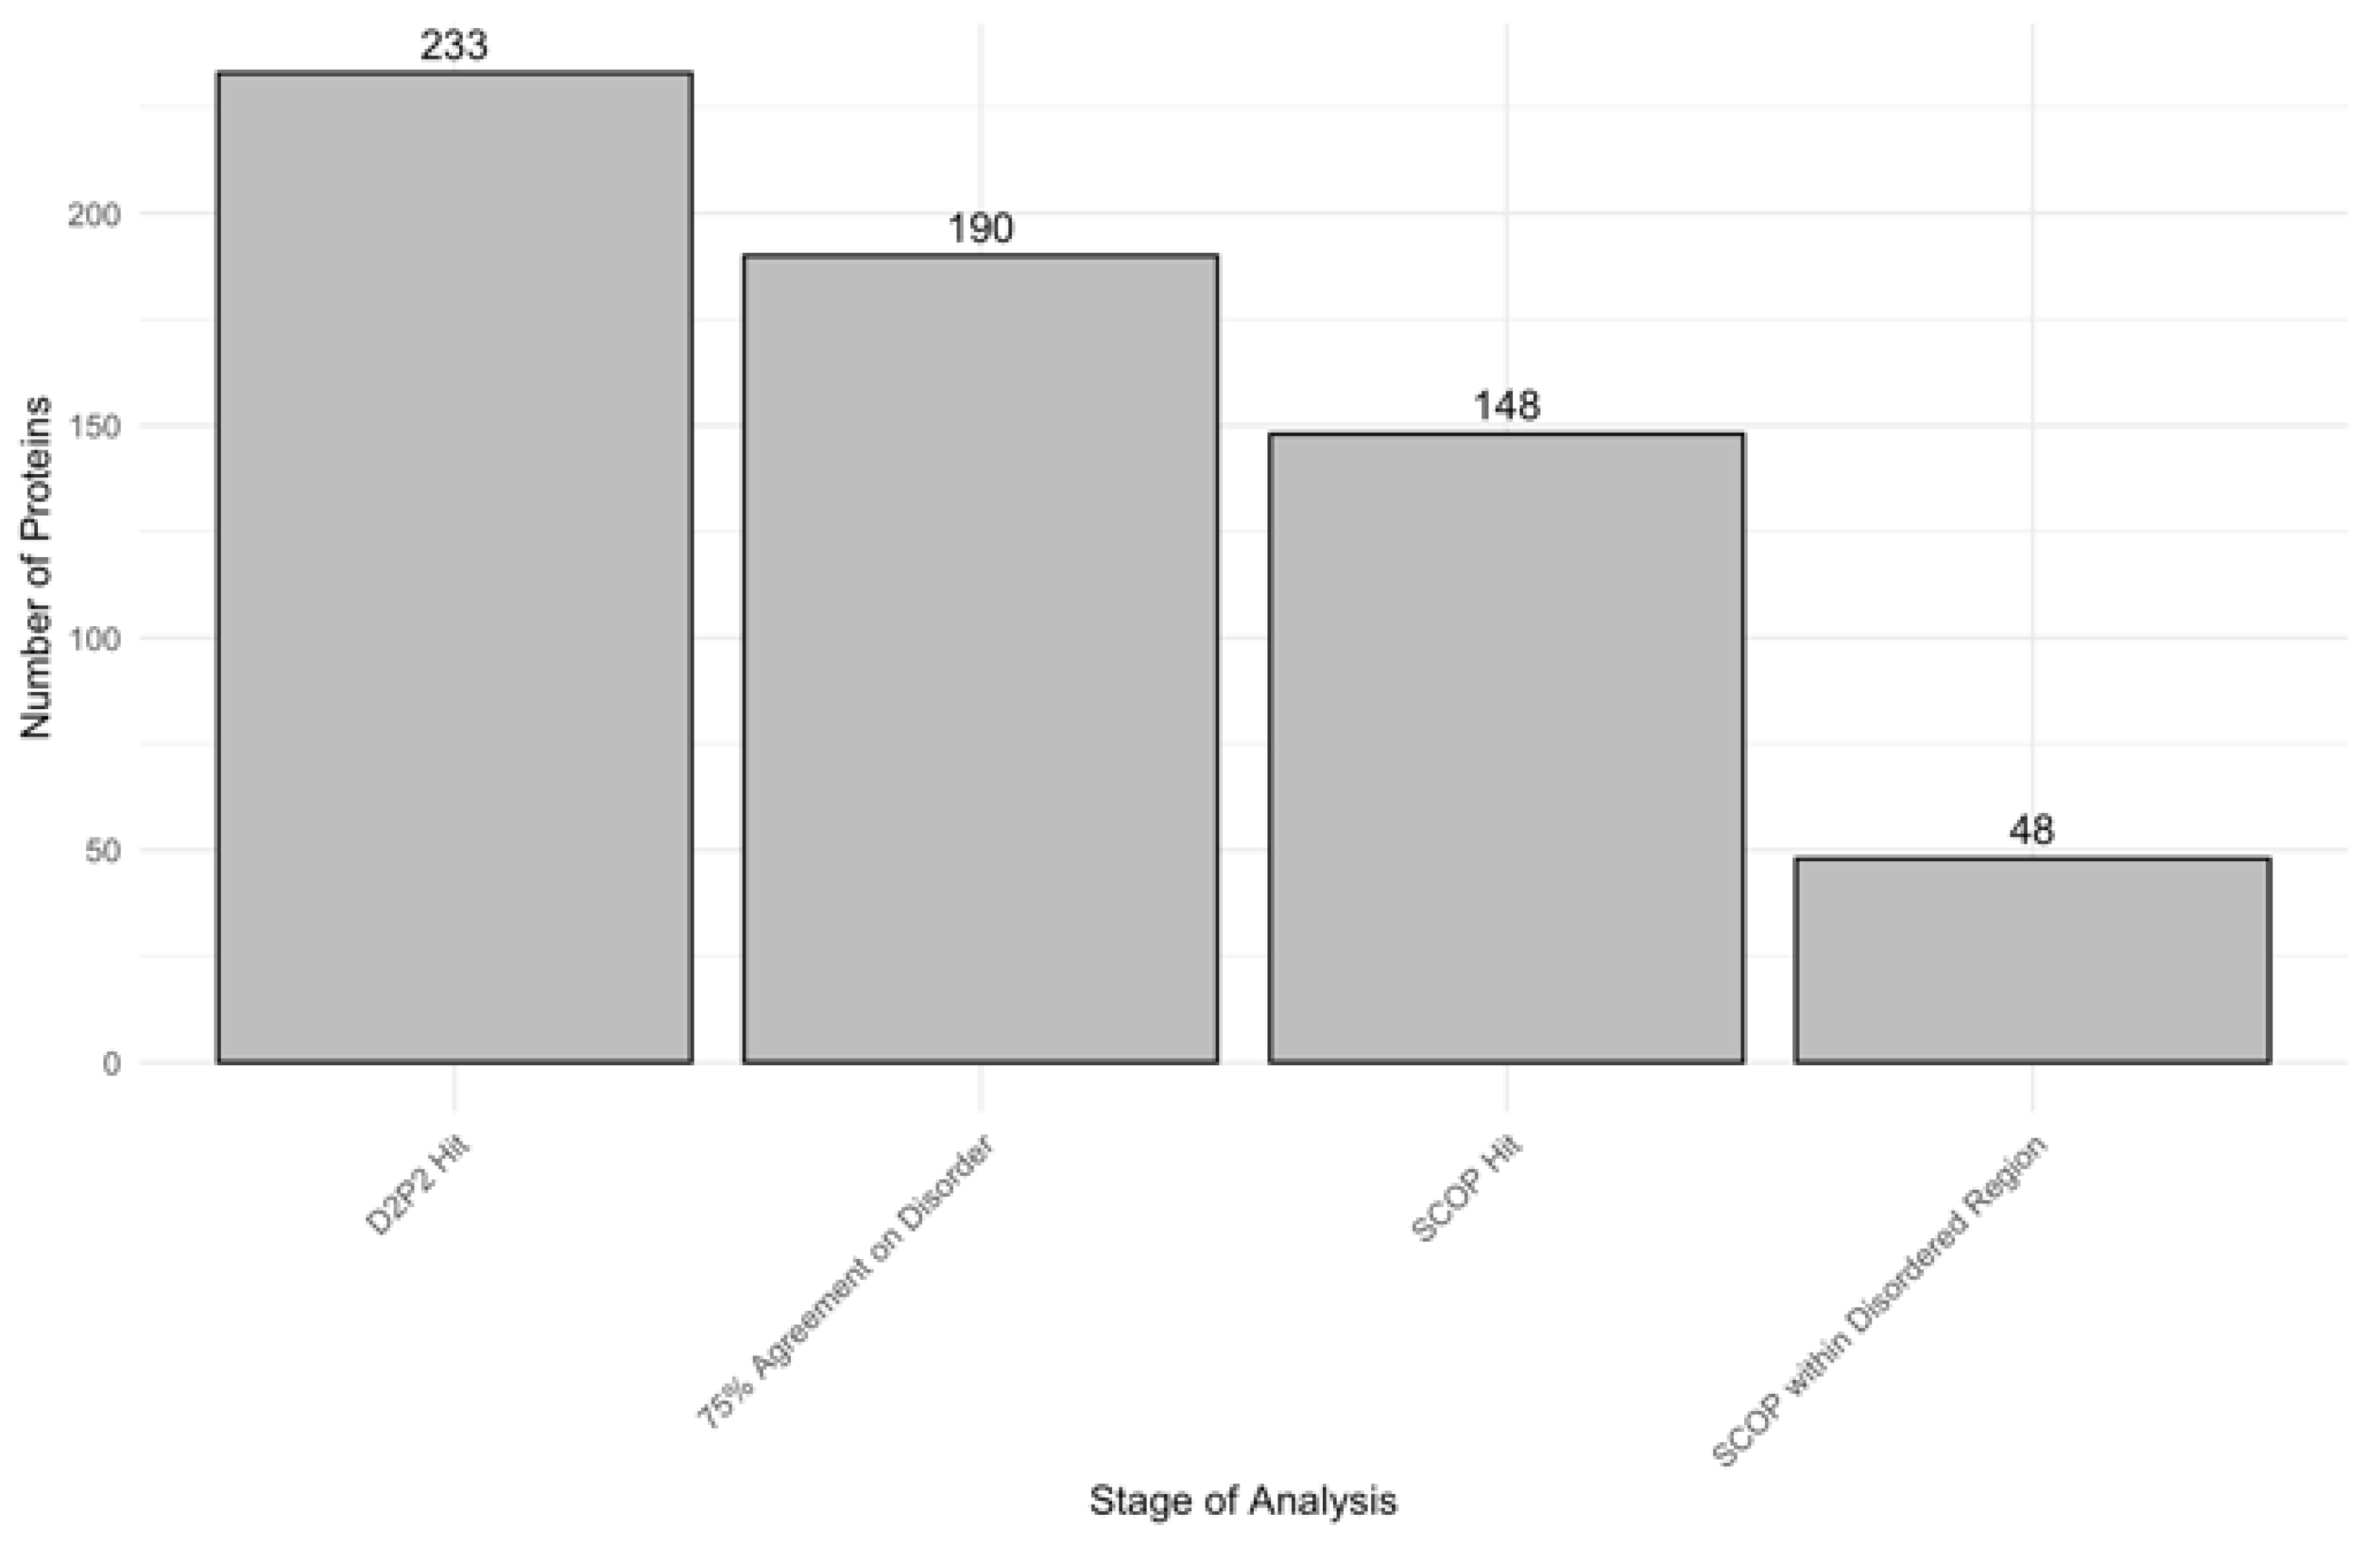
2 to identify proteins with disordered residues in SCOP functional domains, using a 75% agreement threshold. Out of 233 proteins initially analyzed, 190 met the high-confidence disorder threshold, and 148 were found to contain identifiable SCOP domains. Among these, 48 proteins showed overlap between disordered regions and SCOP domains.
Figure 7 displays the number of proteins progressing through each analysis stage, ultimately identifying the 48 proteins with SCOP-associated disordered regions. Furthermore,
Table 2 provides a comprehensive list of SCOP superfamilies affected by disorder, highlighting those that are commonly disordered and frequently observed across different proteins. The identification of these SCOP-associated disordered regions underscores the selective pressure for disorder in specific functional domains, which may play a crucial role in the specialized functions of acrosomal proteins.
The most common SCOP superfamilies affected by disorder included domains associated with structural flexibility and protein-protein interactions. This prevalence supports the hypothesis that intrinsic disorder is a key driver of functional adaptability, particularly in dynamic environments like the acrosome. Several superfamilies appeared multiple times across different proteins, indicating a widespread occurrence of intrinsic disorder within certain functional domains. Notably, the PLC-like phosphodiesterase superfamily showed the highest incidence of disorder, with 111 disordered residues across multiple proteins (1-phosphatidylinositol 4,5-bisphosphate phosphodiesterase delta-4 (UniProt ID: Q9BRC7) and 1-phosphatidylinositol 4,5-bisphosphate phosphodiesterase beta-1 (Uniprot ID: Q9NQ66)). This observation suggests that intrinsic disorder within the PLC-like domains may facilitate enzymatic flexibility and regulation during membrane-related signaling processes, which are vital in the context of sperm-egg recognition and fertilization.
The t-SNARE proteins superfamily also exhibited significant disorder, with 73 residues disordered across proteins such as Syntaxin-2 (UniProt ID: P32856), Syntaxin-1B (UniProt ID: P61266), and Syntaxin-1A (UniProt ID: Q16623). The disordered regions in these proteins are likely critical for vesicle docking and membrane fusion, processes essential for acrosomal exocytosis. Additionally, the Concanavalin A-like lectins/glucanases superfamily exhibited 40 disordered residues in both Calreticulin (UniProt ID: P27797) and E3 ubiquitin-protein ligase TRIM36 (UniProt ID: Q9NQ86), suggesting a role in mediating dynamic interactions during immune-related functions or protein ubiquitination pathways in acrosomal environments.
In our dataset, several acrosomal proteins exhibited multiple SCOP domains within disordered regions, indicating complex structural architectures. For example, Calreticulin (UniProt ID: P27797) contained both a C-type lectin domain and a collagen-like domain within disordered regions, facilitating its role in pathogen recognition and immune response. This structural configuration likely enhances the ability of Calreticulin to engage in multiple interactions simultaneously, reflecting the importance of intrinsic disorder in multifunctional proteins. Similarly, E3 ubiquitin-protein ligase TRIM36 (UniProt ID: Q9NQ86) comprised a serine protease domain and a C-type lectin domain within disordered regions, contributing to its function in the lectin pathway of the complement system. These multi-domain configurations suggest that proteins with multiple SCOP domains may exhibit complex functional roles, potentially influenced by the presence of intrinsic disorder within these domains. Such findings reinforce the idea that intrinsic disorder enhances versatility and adaptability in proteins that interact with diverse molecular partners.
Several superfamilies showed substantial disorder within individual proteins, highlighting the occurrence of intrinsic disorder within specific functional domains. For instance, the P-domain of calnexin/calreticulin superfamily had a high magnitude of disorder, with 70 disordered residues identified in the protein Calreticulin (UniProt ID: P27797). This domain's disorder is likely crucial for its role in calcium binding and molecular chaperoning. Additionally, the Fibronectin type III domain, commonly involved in cell adhesion and interaction, exhibited 23 disordered residues and was present in protein Fibronectin type-III domain-containing protein 3A (UniProt ID: Q9Y2H6). This finding suggests that disorder in this domain may enhance flexibility and promote interactions with a range of cellular partners, further emphasizing the link between intrinsic disorder and functional plasticity.
The Ankyrin repeat superfamily also showed disorder, with 23 disordered residues found in the protein Neurogenic locus notch homolog protein 1 (UniProt ID: P46531), known for its role in protein-protein interactions. Other frequently disordered superfamilies included the ARM repeat (17 residues in Maestro heat-like repeat-containing protein family member 2B (UniProt ID: Q7Z745)) and the Sec1/munc18-like (SM) proteins (17 residues in Syntaxin-binding protein 1 (UniProt ID P61764)), both of which contribute to functional versatility in protein complexes. Collectively, these findings highlight how intrinsic disorder in SCOP domains supports functional diversity, particularly in proteins central to acrosomal processes.
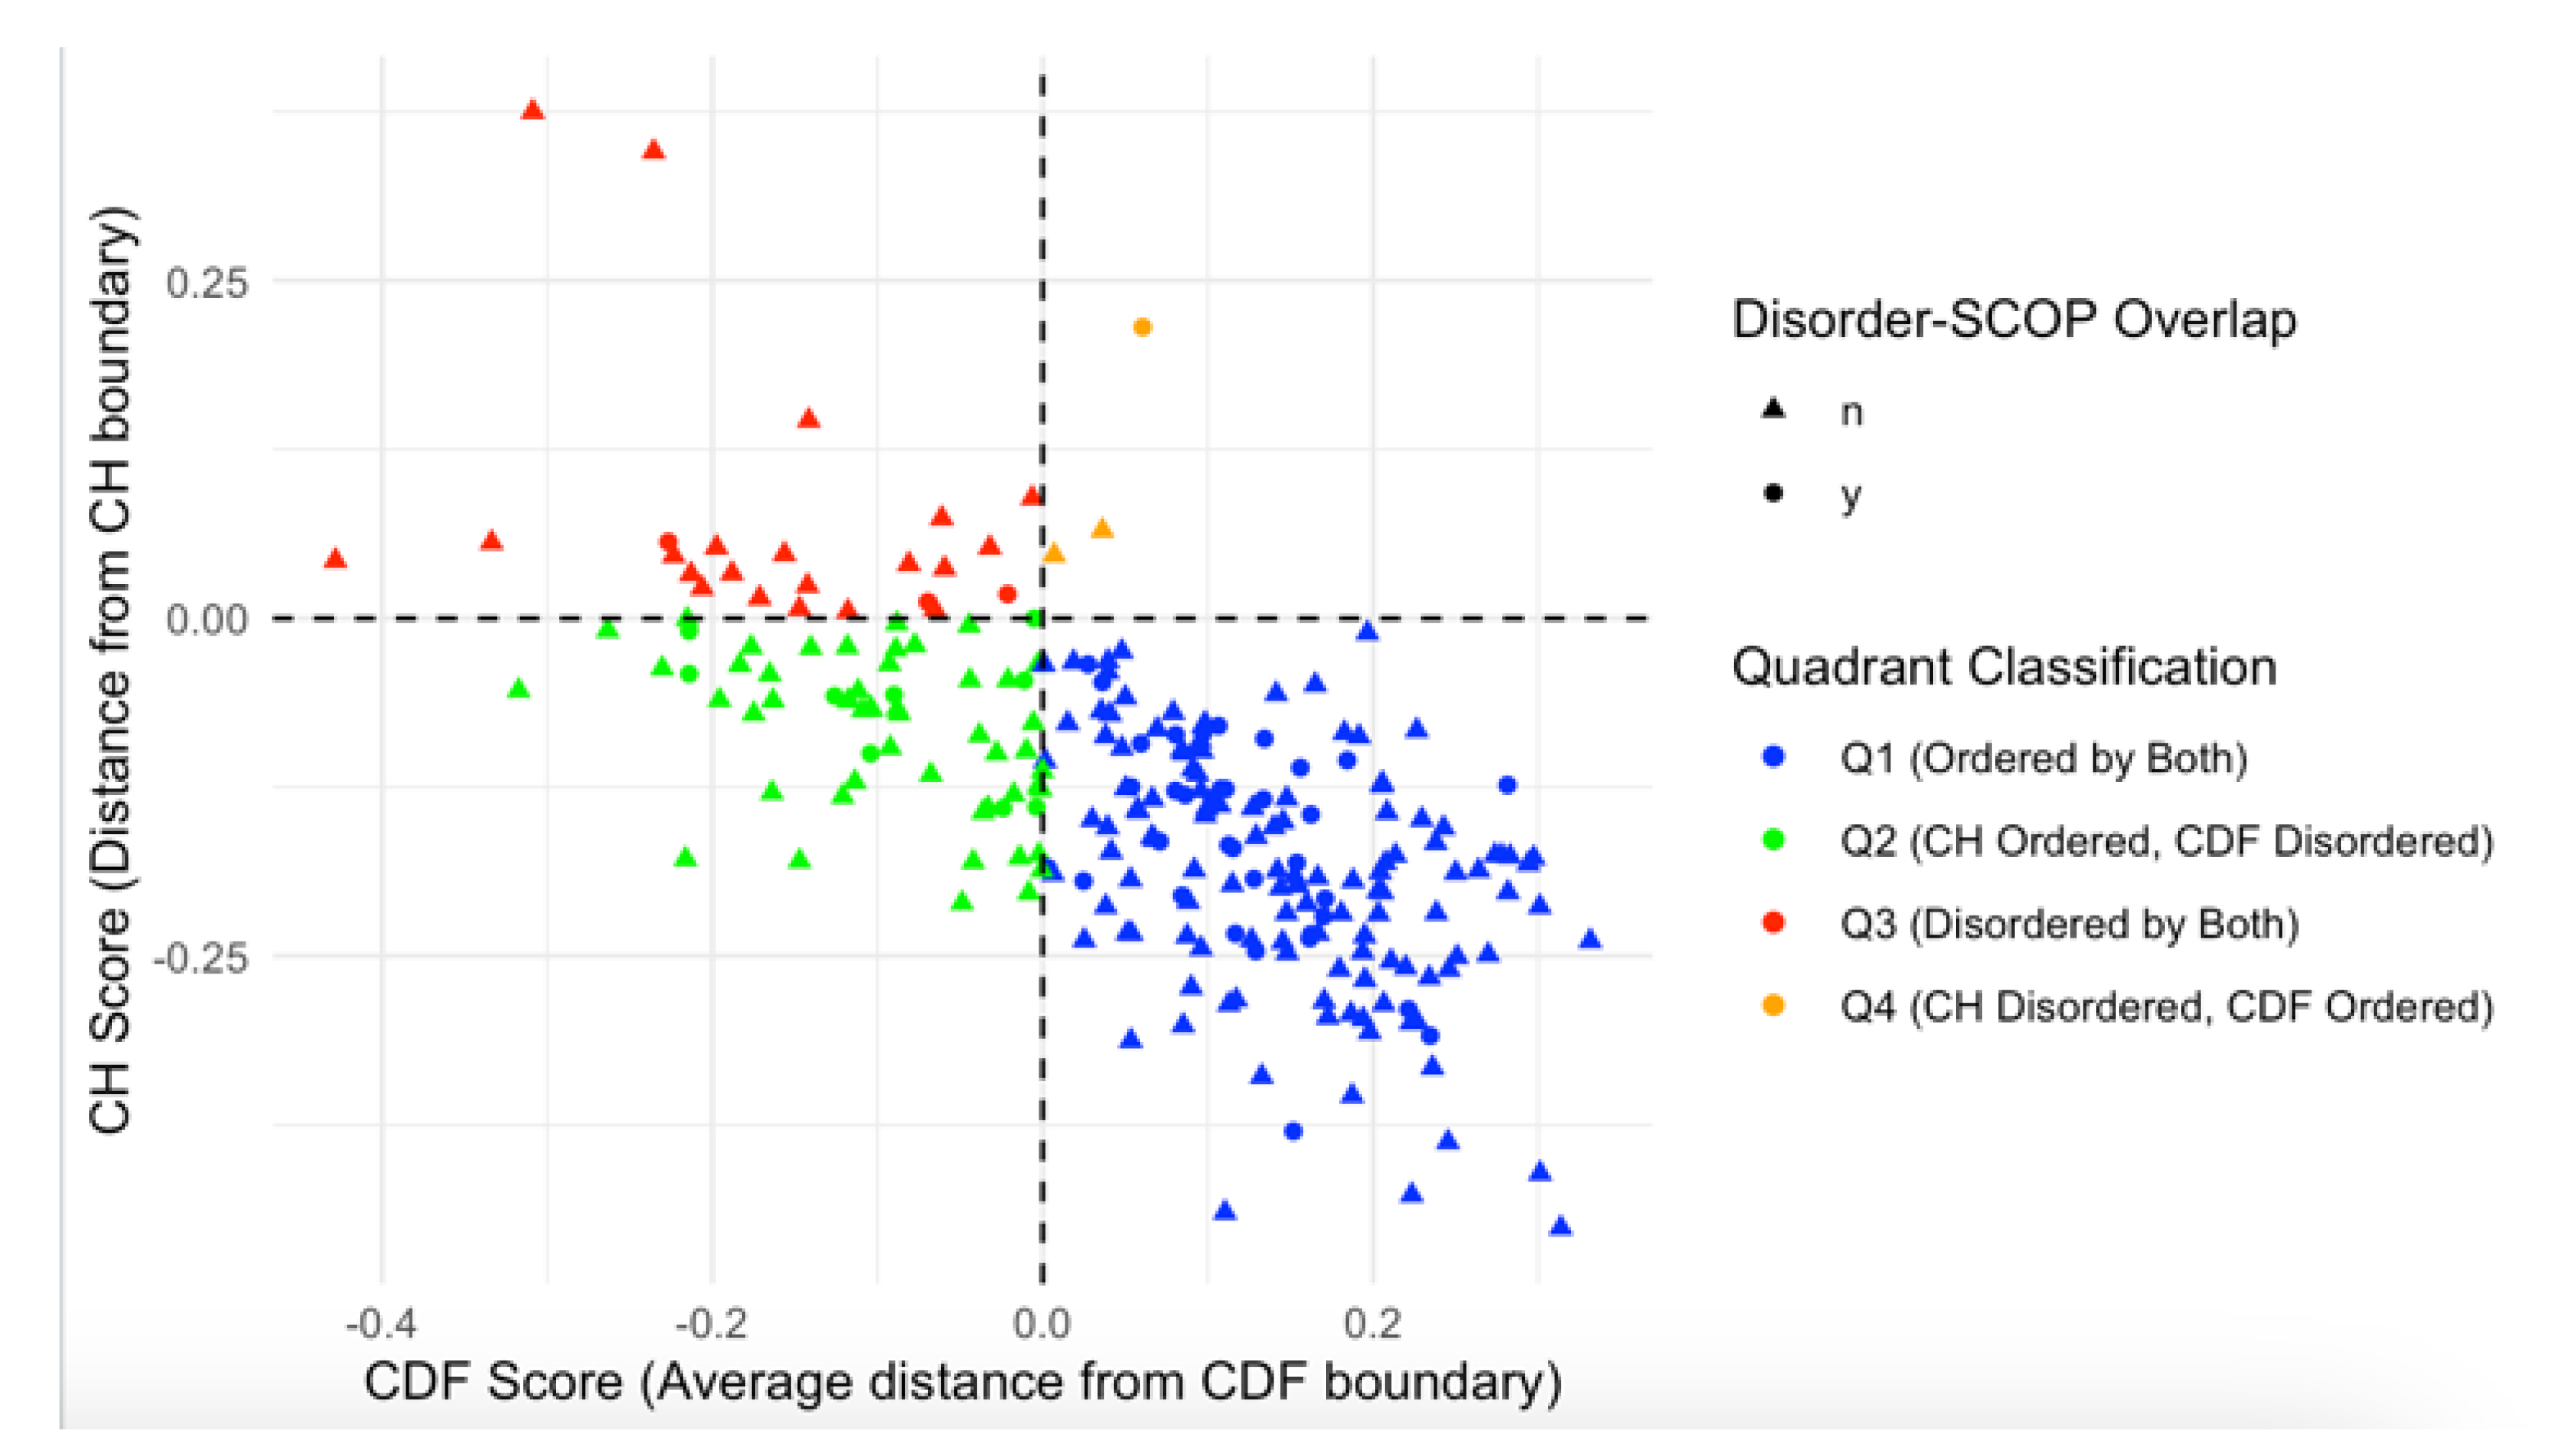
We further analyzed this subset of 48 proteins with SCOP domains within disordered regions by overlaying the data on the CH/CDF plot, as shown in Figure 8. This overlay provides a visual representation of the relationship between disorder predictions by Charge-Hydropathy and Cumulative Distribution Function metrics and the presence of disordered residues within SCOP domains. Of the 48 proteins with SCOP domains within the disordered region, 35 were in Q1 (ordered by both), 9 were in Q2 (CH ordered but CDF disordered), 3 were in Q3 (disordered by both), and 1 was in Q4 (CH disordered but CDF ordered).
3.4. Gene Ontology Enrichment Analysis of Acrosomal Proteins
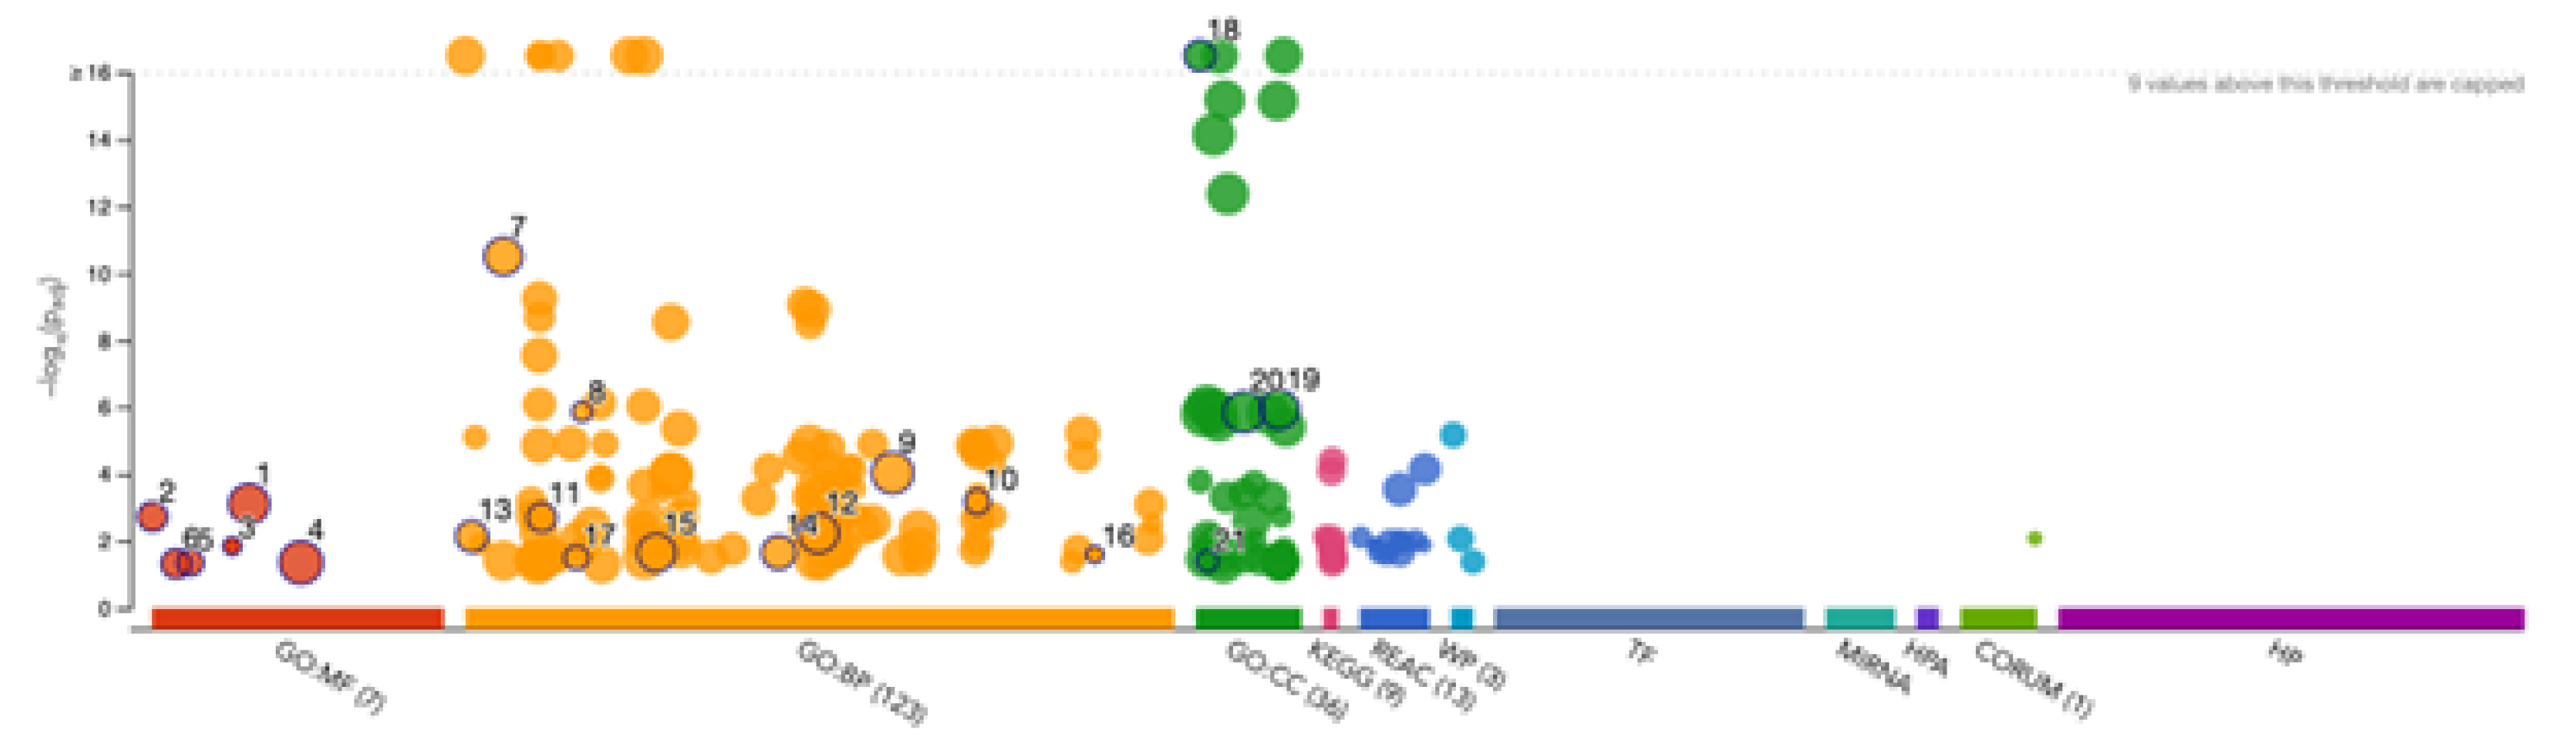
Gene Ontology (GO) enrichment analysis was performed using g:GOSt to understand the functional roles of disordered regions overlapping SCOP domains in acrosomal proteins (
Table 3). The analysis provided insights into molecular functions, biological processes, and cellular components enriched among these proteins (
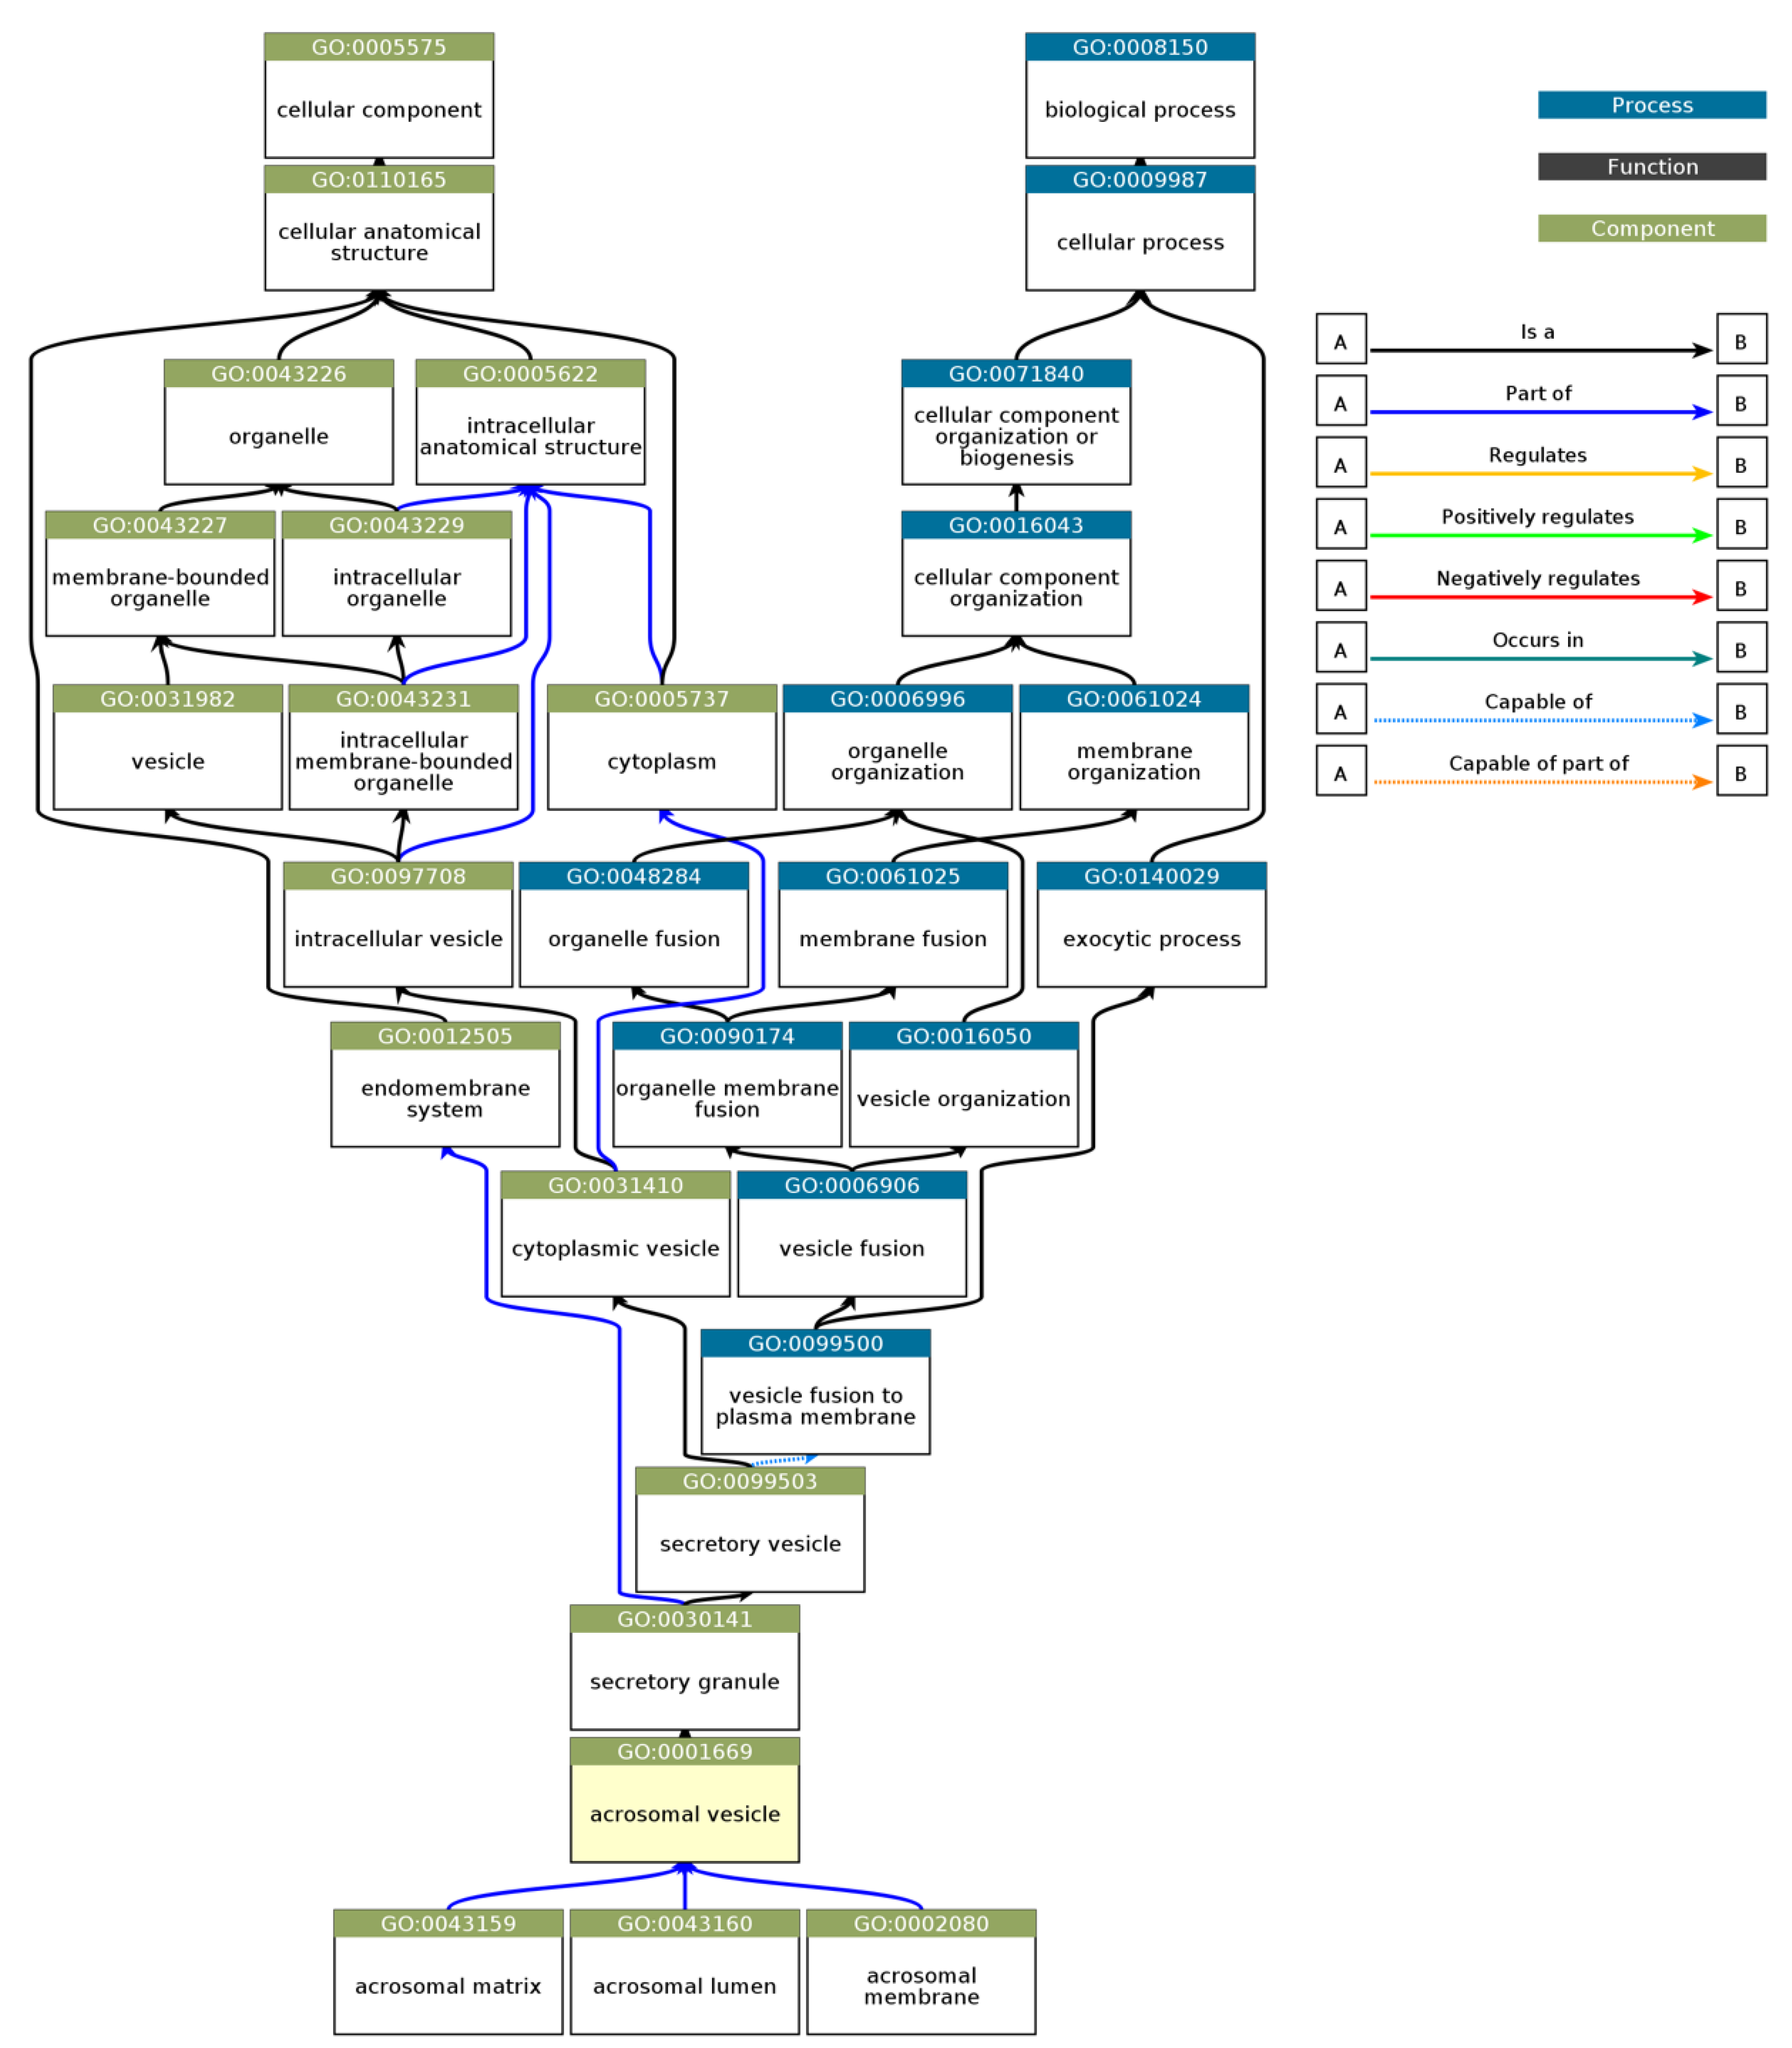
Figure 9). Notably, the term "acrosomal vesicle" (GO:0001669, p_adj = 5.395×10⁻³⁸) was the most significant, highlighting the functional relevance of intrinsic disorder in reproductive and cellular processes. The ancestor chart for “acrosomal vesicle” (GO:0001669) is shown in
Figure 10, as obtained from the European Bioinformatics Institute (
https://www.ebi.ac.uk/QuickGO/).
For molecular function, significant enrichment was observed for enzyme binding (GO:0019899), indicating that intrinsic disorder in these proteins may facilitate dynamic interactions with enzymatic partners, potentially critical for acrosomal activity. SNARE binding (GO:0000149) was also highly enriched, suggesting that these proteins play an integral role in membrane fusion events essential for the acrosomal reaction during fertilization. Additional enriched functions included cation binding and phospholipase activity, reflecting the importance of these proteins in calcium-mediated signaling and membrane remodeling within the acrosome.
Within the domain of biological processes, the most significant enrichment was observed for developmental processes involved in reproduction (GO:0003006), consistent with the essential role of these proteins in fertilization. Proteins with disordered regions were also enriched for acrosomal vesicle (GO:0098589), further emphasizing their association with the acrosome. Terms such as regulation of synaptic vesicle priming and cell projection organization were also enriched, highlighting their involvement in vesicle trafficking and cytoskeletal dynamics, both of which are processes critical for sperm functionality.
For cellular components, proteins were primarily localized to the acrosomal vesicle and the plasma membrane region, consistent with their roles in acrosomal membrane dynamics. Enrichment for the zonula adherens component suggested potential roles in adhesion, showing the interaction between the acrosome and the oocyte during fertilization.
These findings underscore the importance of intrinsic disorder in mediating the functional versatility of acrosomal proteins. The enrichment of terms associated with dynamic molecular interactions, membrane remodeling, and vesicular trafficking aligns with the known physiological roles of the acrosome in fertilization. The association of disordered regions with these processes suggests that intrinsic disorder contributes to the structural flexibility required for the complex interactions and functions of acrosomal proteins.
3.5. Interactivity Analysis of Human Acrosomal Proteins
A key feature of intrinsically disordered proteins is their high level of binding promiscuity and ability to interact with many partners through different binding modes [
12]. The intractability of the human acrosomal proteins was investigated by using Search Tool for the Retrieval of Interacting Genes (STRING).
Figure 11 shows the PPI network for 245 of the human acrosomal proteins that were in the STRING database. No data was available in STRING for five of the proteins in our dataset: putative spermatogenesis-associated protein 31C1 (UniProt ID: P0DKV0), putative spermatogenesis-associated protein 31C2 (UniProt ID: B4DYI2), IQ domain-containing protein N (UniProt ID: Q9H0B3), spermatogenesis-associated protein 31D4 (UniProt ID: Q6ZUB0), and putative protein SPATA31F2P (UniProt ID: Q63HN1). To capture the most interactions a low confidence interval (0.15) was first utilized. The resulting PPI network showed that all 245 acrosomal proteins were interacting with each other, with the exception of one protein: protein SPATA31F3 (UniProt ID: A6NFA0). This PPI network was comprised of 245 nodes (human acrosomal proteins) connected by 2821 edges (PPIs). The average node degree (number of edges per node) was 23 and its average local clustering coefficient (which is a number between 0 and1that represents how complete the neighborhoods of interactions are, 0 meaning proteins in the neighborhood only connect to same protein, and 1 meaning every protein in the neighborhood is interacting with each other) of 0.356. For a random group of proteins, the same size the expected number of edges would be 942 at this confidence interval, which is significantly lower than our PPIs 2821, indicating at the low confidence level this PPI network has roughly 3 times as many interactions as expected (PPI enrichment p-value of < 10
−16) this indicates that most of the human acrosomal proteins are interacting with each other.
When increasing the STRING confidence to a moderate level (0.4) results in a drop in the number of nodes interacting with each other from 244 to 209 (
Figure 12A). The 209 nodes are connected by 581 edges, with an average node degree of 4.74, an average local clustering coefficient 0.423, expected number of edges of 113, and a PPI enrichment p-value of < 10
−16. Increasing the confidence interval to high level (0.7) caused the PPI network to break down into small clusters of interacting proteins and many non-interacting proteins (
Figure 12B).
Looking into the global interactivity of the human acrosomal proteins the first shell of interactors which are proteins that directly interact with our proteins of interest were added and can be seen in
Figure 13. The PPI network was set to the highest confidence interval (0.9) and 500 interactants (the max value STRING allows) resulted in 745 nodes connected by 2523 edges, that is characterized by an average node degree of 6.77, and an average local clustering coefficient of 0.602. The expected number of edges for a PPI network of this size 872 which indicates that the human acrosomal proteins PPI network has significantly more interactions then expected with a PPI enrichment p-value of < 10
−16.
Decreasing the settings to low confidence interval (0.15) to ensure maximum inclusion of human acrosomal proteins in the global interactions PPI network results in a very dense network of 745 proteins and 40937 edges. The average node degree was 110 with an average local clustering coefficient of 0.454. The expected number of edges was 16518 with a PPI enrichment p-value of < 10
−16 (
Figure 14).
3.6. Liquid-Liquid Phase Separation Propensity in Human Acrosomal Proteins
We used computational models to predict the liquid-liquid phase separation (LLPS) propensity for the 250 proteins in our acrosomal dataset. To quantify and understand LLPS trends, descriptive statistics for the LLPS propensity scores (P
LLPS) are summarized in
Table 4. The mean P
LLPS across all proteins was 0.4511, with a median of 0.2864 and a standard deviation of 0.3334. The scores ranged from 0.0922 to 1, with the lower quartile (Q1) at 0.167 and the upper quartile (Q3) at 0.7946. These findings indicate substantial variability in LLPS propensity among the acrosomal proteins.
To explore the relationship between intrinsic disorder and LLPS propensity, we conducted a regression analysis using the average Percent Predicted Disordered Residues (PPDR) score from three disorder models (PONDR
® VXLT, PONDR
® VL3, and PONDR
® VSL2B) as the independent variable and P
LLPS as the dependent variable. A Box-Cox transformation of the P
LLPS scores (λ ≈ 0.0606) was applied to stabilize variance and improve linearity, as shown with
Figure 15.
The subsequent second-degree polynomial regression model revealed a significant positive relationship between intrinsic disorder and LLPS propensity, with a p-value < 0.0001 and an R-squared value of 0.649 (
Figure 16). Diagnostic plots indicated that model assumptions were satisfied, supporting the robustness of this relationship.
The observed link between intrinsic disorder and LLPS propensity aligns with the known role of intrinsically disordered regions (IDRs) in facilitating phase separation. IDRs, characterized by their lack of a fixed tertiary structure, enable dynamic interactions essential for condensate formation, a key feature of phase-separated systems. In the context of the acrosome, proteins with high LLPS propensity likely contribute to the dynamic remodeling of the acrosomal vesicle and the assembly of molecular condensates critical for fertilization. For instance, proteins with high PLLPS scores may facilitate rapid assembly and disassembly of protein complexes during the acrosome reaction, enabling precise spatiotemporal control over enzymatic and structural functions.
The wide range of PLLPS scores suggests functional diversity within the acrosomal proteome. Proteins with low PLLPS may perform structural roles, providing stability to the acrosomal matrix, while those with high PLLPS likely play dynamic roles in processes such as vesicle fusion, membrane remodeling, and molecular recognition. This variability underscores the dual requirements for structural integrity and functional adaptability within the acrosome.
The polynomial nature of the relationship between PPDR and PLLPS highlights a nuanced interplay between intrinsic disorder and LLPS propensity. While higher levels of disorder generally enhance phase separation propensity, the saturation observed in the quadratic relationship suggests a threshold effect, where excessively disordered proteins may lack sufficient interaction interfaces for effective condensate formation. This balance may reflect evolutionary pressures to optimize disorder for LLPS functionality while maintaining the ability to form specific, transient interactions.
These findings provide a foundation for further investigation into the role of LLPS in acrosomal biology. Future studies could focus on experimentally validating the LLPS behavior of high-PLLPS proteins using in vitro or in vivo approaches, such as fluorescence recovery after photobleaching (FRAP) or phase separation assays. Additionally, exploring the involvement of post-translational modifications (PTMs) in modulating LLPS propensity could provide insights into the regulation of acrosomal protein dynamics during fertilization.
3.7. Impact of Disorder and Liquid-Liquid Phase Separation in the Five Most Disordered Acrosomal Proteins
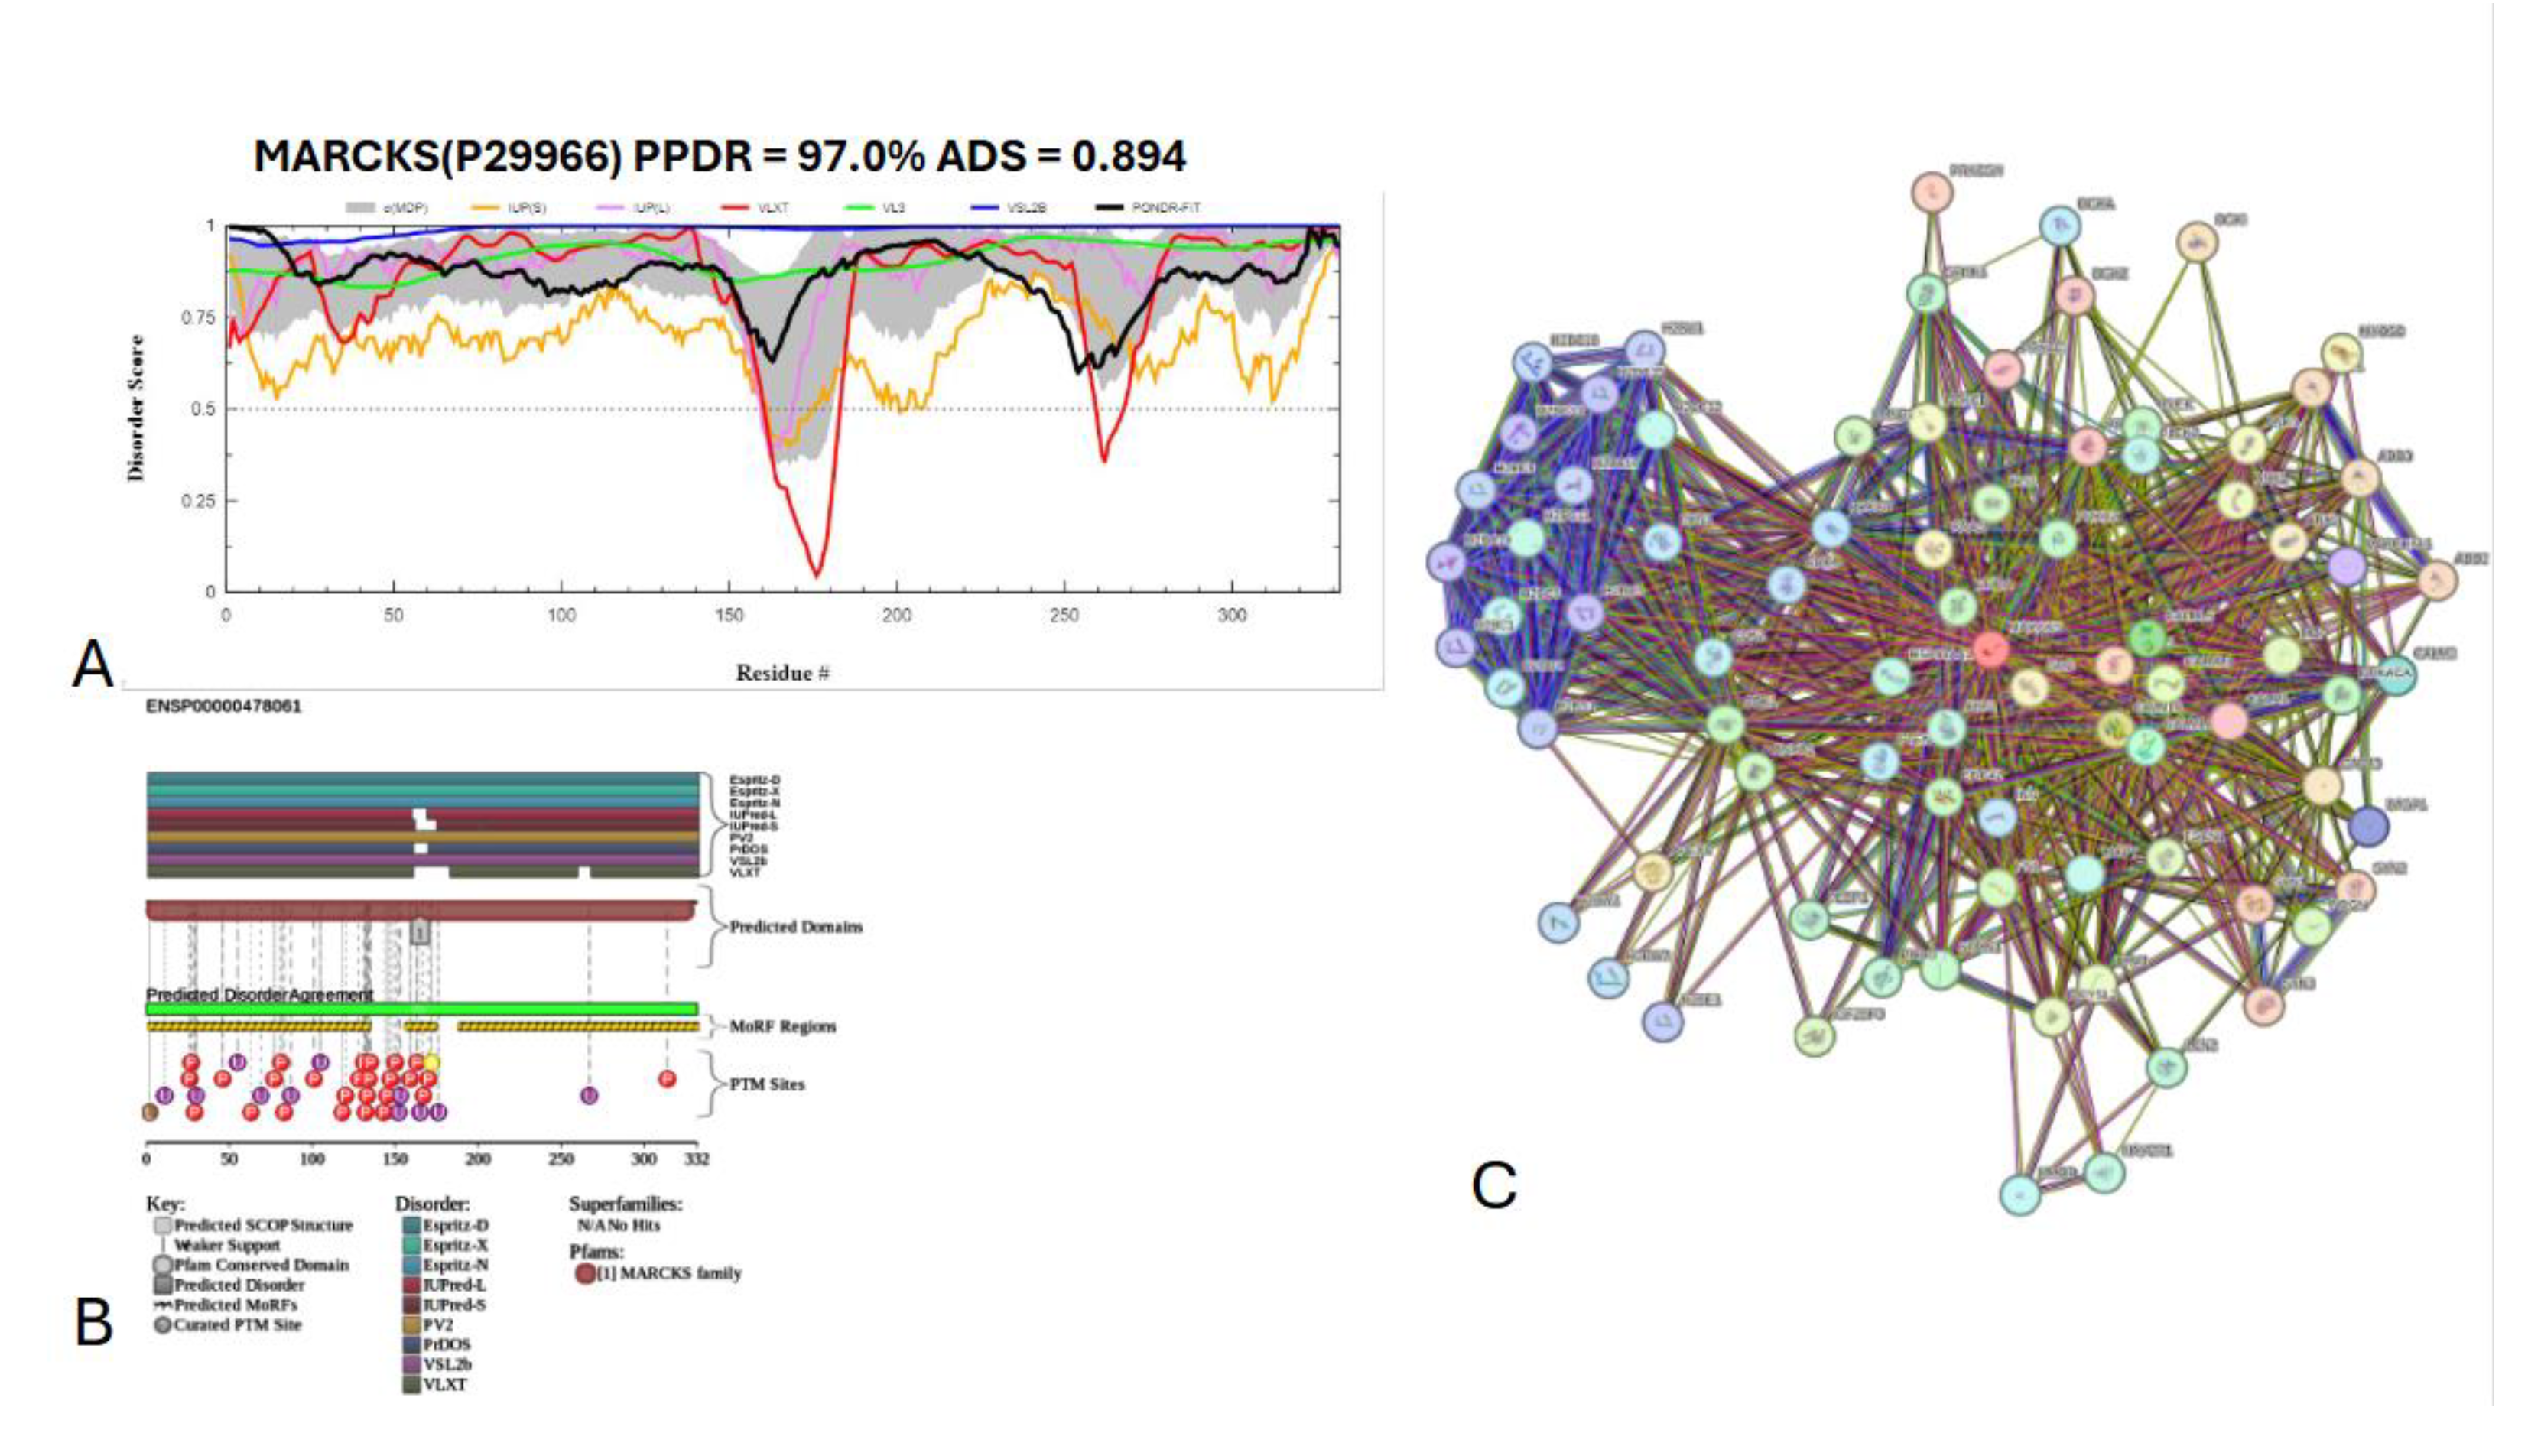
3.7.1. Myristoylated alanine-rich C-kinase substrate protein (UniProt ID: P29966)
The myristoylated alanine-rich C-kinase substrate (MARCKS) protein was identified as the most disordered among acrosomal proteins, with a percentage of predicted disordered residues of 97.0% ± 1.30% and an average disorder score of 0.890 ± 0.035. Figure X presents the complete computational analysis of the MARCKS protein. This protein is 332 amino acids long, and most of the residues show signs of disorder (
Figure 17A). MARCKS has 1 Pfam conserved domain spanning from residue 2 to 329 corresponding to the MARCKS family. This protein also has multiple posttranslational modification sites spanning across the protein with most of them being in the first 176 residues and as well as three molecular recognition features associated with ANCHOR binding regions (
Figure 17B). The PPI network (
Figure 17C) generated by STRING for MARCKS at the medium confidence interval of 0.4 shows that the network is comprised of 81 nodes and 859 edges. The network has an average node degree of 21.2 interactions per node and, the local clustering coefficient of 0.703. The expected number of edges was 393 and has a PPI enrichment p-value was highly significant (p < 10
-16).
MARCKS has an important regulatory role in acrosomal exocytosis, mainly by modulating calcium mobilization and interacting with phosphatidylinositol 4,5-bisphosphate (PIP2) (Rodriguez Pena et al. 2013). With a liquid-liquid phase separation (LLPS) propensity of 0.9995 (as per the FuzDrop analysis results), MARCKS likely contributes to the formation of dynamic, membrane-less compartments, which allow for spatial and temporal coordination of signaling molecules, which are essential for exocytosis. This high LLPS propensity and intrinsic disorder likelihood enables it to act as a molecular scaffold, holding PIP2 in concentrated, reversible phases that can be quickly disbanded upon phosphorylation by protein kinase C (PKC). The flexibility that the intrinsic disorder provides the MARCKS’ protein likely enhances its ability to form and dissolve these LLPS-driven condensates as needed, enabling the fast release of PIP2 for downstream signaling during acrosomal exocytosis [
118,
119].
MARCKS’ disorder can be particularly important in its effector domain (ED), which interacts with PKC and calmodulin. When phosphorylated by PKC, MARCKS dissociates from the membrane, releasing PIP2 for phospholipase C (PLC) activity, which converts it to inositol trisphosphate (IP3) and diacylglycerol (DAG). This reaction is needed for initiating the release of calcium, a primary driver of membrane fusion in the acrosome reaction [
120]. The high LLPS propensity of MARCKS supports a transient, phase-separated environment in which calcium-sensitive signaling molecules can be temporarily contained and released in a coordinated fashion. This shows its role as a highly dynamic regulatory scaffold within the sperm head. The ability of MARCKS to undergo phase separation could potentially streamline the availability of PIP2 and calcium within these condensates, which would emphasize the importance of structural reorganization to the functional requirements of the acrosomal exocytosis process [
119].
Moreover, MARCKS' ability to form LLPS-driven condensates can potentially be important for its interaction with actin, by cross-linking and stabilizing the cytoskeleton to prevent premature exocytosis under resting conditions. Upon PKC activation, MARCKS can change from a stabilizing role to a facilitative one, freeing calcium and reorganizing the actin filaments for exocytotic membrane fusion. This interaction between intrinsic disorder and LLPS likely enhances MARCKS' function as a reversible regulator, with phosphorylation dictating its role and allowing specific control over acrosomal readiness and exocytotic response in fertilization [
119].
3.7.2. Nuclear transition protein 2 (UniProt ID: Q05952)
Figure 18 presents the computational results of nuclear transition protein 2 or TNP2, which has a percentage of predicted disorder residues of 92.5% ± 3.22% and an average disorder score of 0.864 ± 0.036. This protein is 138 amino acids long all of which show signs of disorder (
Figure 18A). TNP2 has 1 Pfam conserved domain spanning all 138 amino acids corresponding to the PF01254.13 family. This protein also has 1 posttranslational modification site at locus 17 and has 4 molecular recognition features associated with ANCHOR binding regions (
Figure 18B). The PPI network (
Figure 18C) generated by STRING for CEP131 at the medium confidence interval of 0.4 shows that the network is comprised of 46 nodes and 211 edges. The network has an average node degree of 9.17 interactions per node and, the local clustering coefficient of 0.753. The expected number of edges was 51 and has a PPI enrichment p-value of less than 1.0*10
-16.
TNP2 is an important protein involved in spermiogenesis. Its key function is facilitating chromatin remodeling through aiding in the removal of histones and taking their place within the chromatin before being replaced by protamines [
121,
122]. Studies have also shown that they are involved with DNA repair by preventing DNA breaks in late spermiogenesis [
122]. Its ability to interact with diverse types of biologic molecules is likely facilitated by its high intrinsic disorder. The high probability of spontaneous liquid-liquid phase separation of 0.994 may be related to TNP2 role of replacing histones as histones have been found some of their formation process linked to their LLPS [
123].
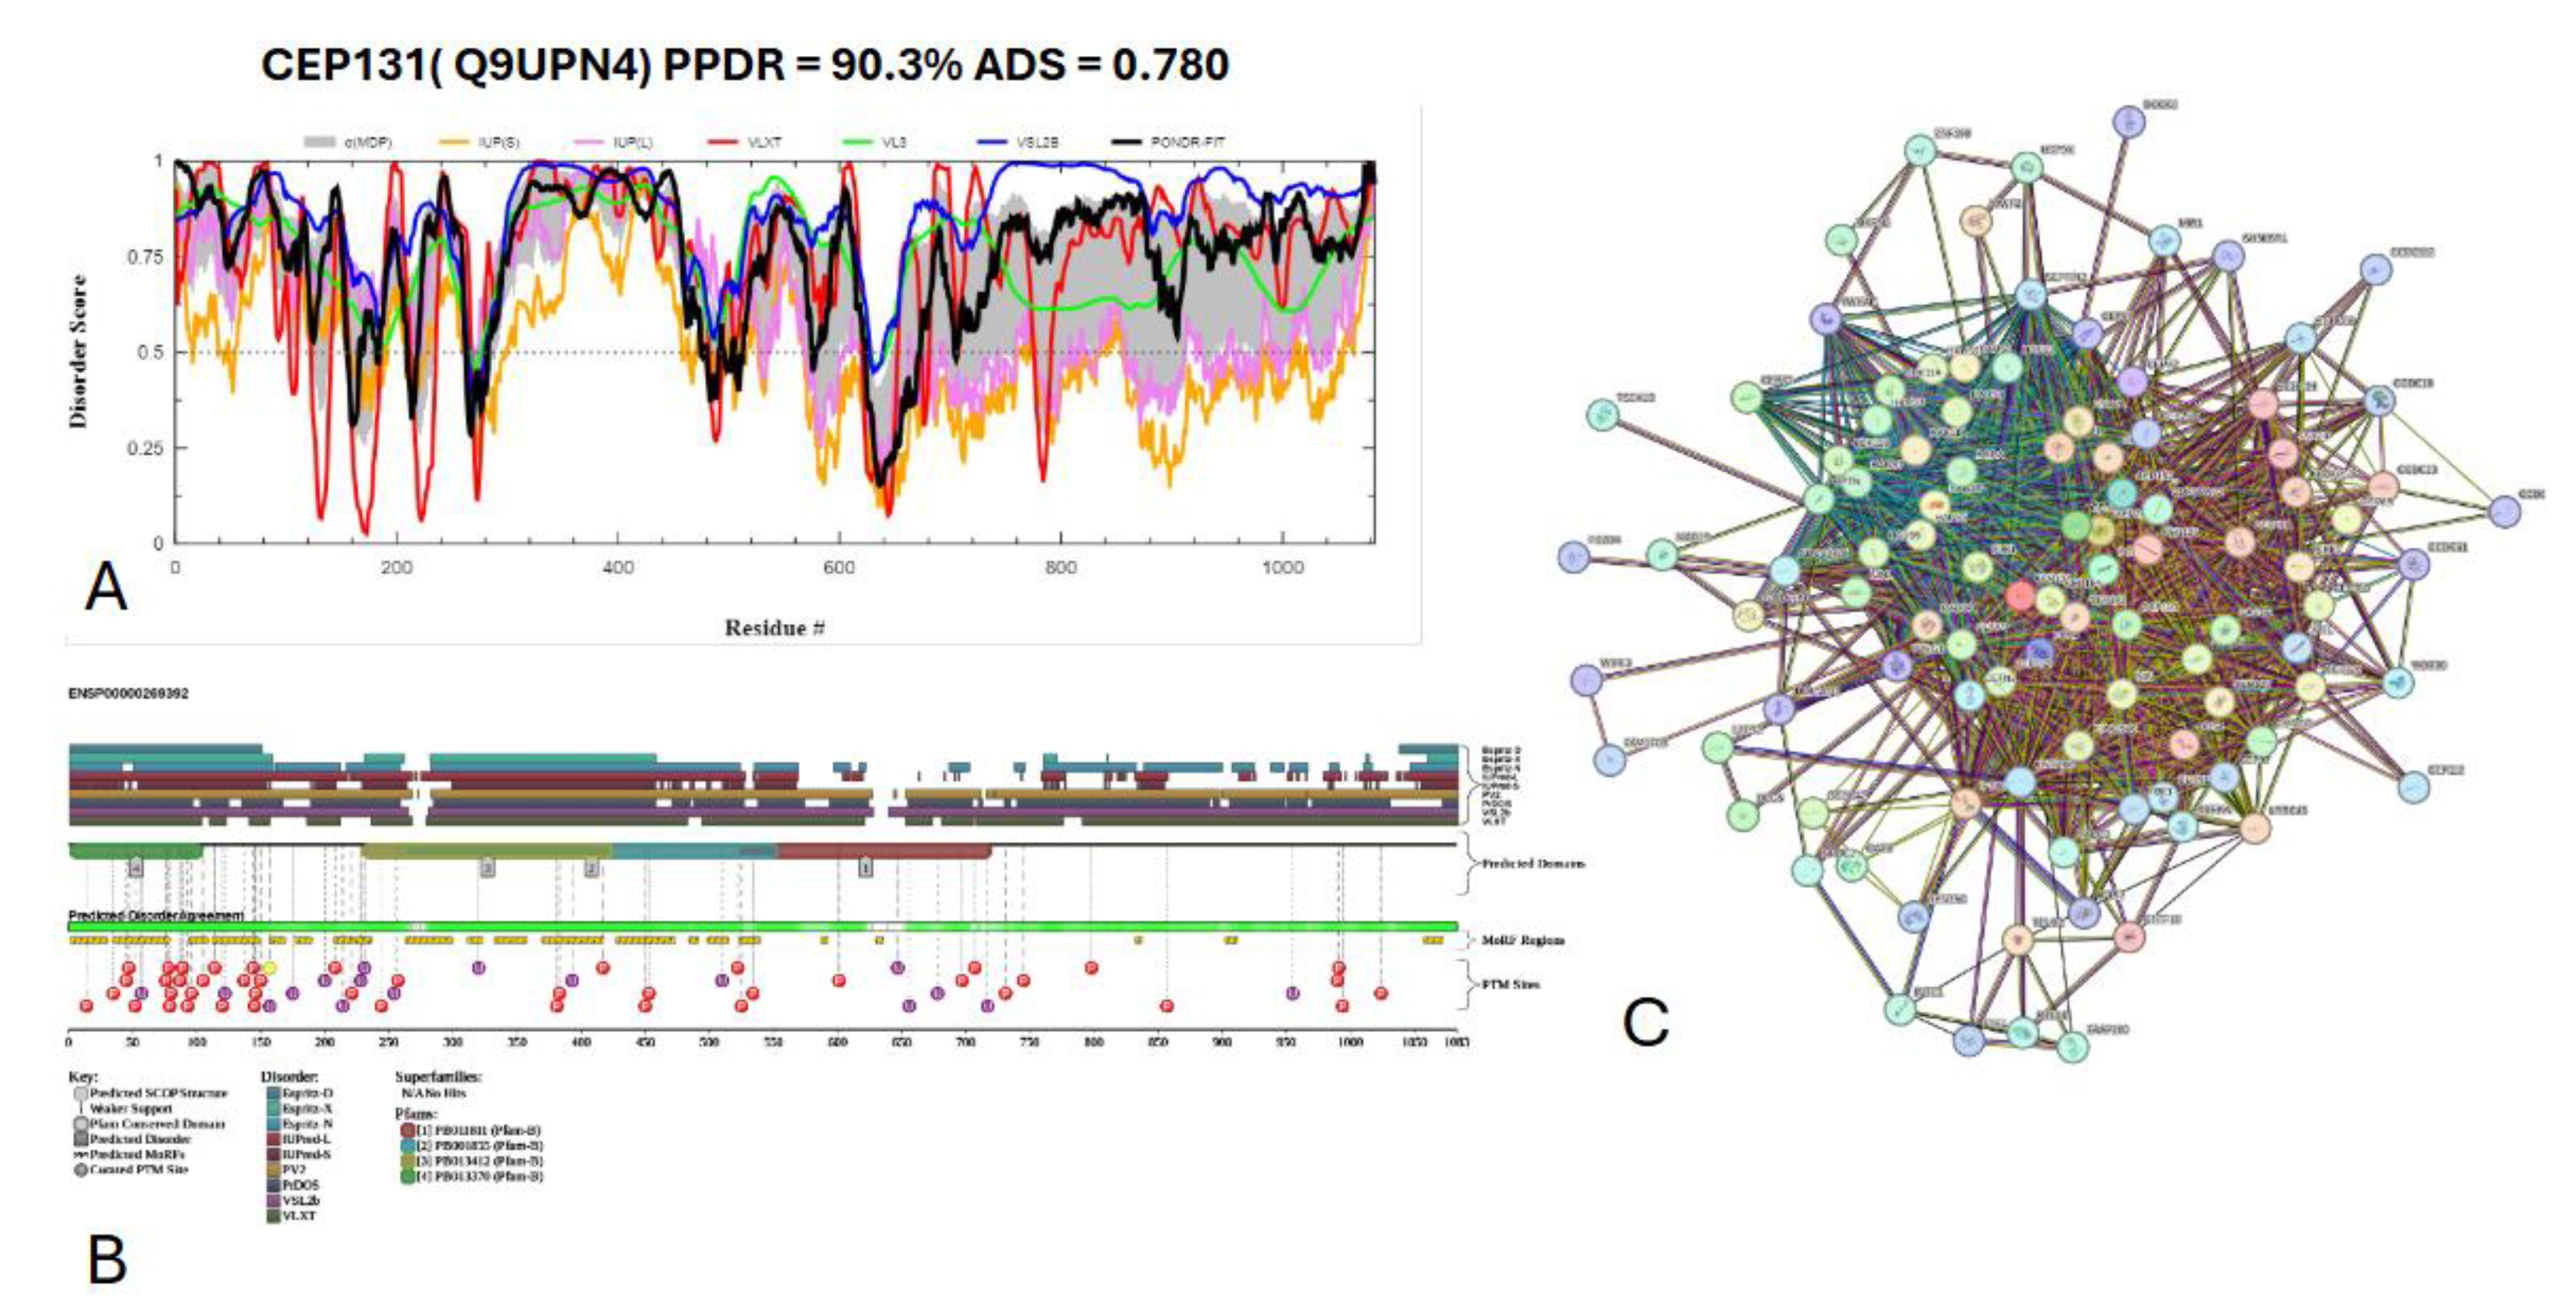
3.7.3. Centrosomal protein of 131 kDa (UniProt ID: Q9UPN4)
Figure 19 presents the results of centrosomal protein of 131 kDA (CEP 131) which has a percentage of predicted disorder residues of 82.0% ± 7.35% and an average disorder score of 0.702 ± 0.043. This protein 1083 amino acids long and has large areas of disorder spanning from N terminus to the C terminus (
Figure 19A). CEP 131 has 4 Pfam conserved domains spanning from Amino 3 to 104, 231 to 424, 264 to 553, and 526 to 719, respectively. This protein also has multiple posttranslational modification sites spanning across the protein with most of them being in the first 250 residues and has 20 molecular recognition features associated with ANCHOR binding regions (
Figure 19B). The PPI network (
Figure 19C) generated by STRING for CEP131 at the medium confidence interval of 0.4 shows that the network is comprised of 101 nodes and 1392 edges. The network has an average node degree of 27.6 interactions per node and, the local clustering coefficient of 0.735. The expected number of edges was 144 and has a PPI enrichment p-value of less than 10
-16.
Centrosomal protein of 131 kDA (CEP 131) is a protein that has a wide range of functions which may be involved with its high intrinsic disorder. CEP 131 plays a key role in flagella and cilia formation as sperm cells lacking the proteins have malformed flagella [
124,
125]. Its ability to form flagella may be linked to interactions or a shared pathway CEP70 [
125]. It has also been shown to interact with microtubule- based transport proteins such as dynein and could play a role in transport of material transport [
126]. Its interactions with these microtubule proteins may also play a role in the formation of the acrosome as studies have shown mice lacking CEP 131 have malformed sperm heads and fragmented acrosomes [
124,
127].
CEP131 has a high propensity for liquid-liquid phase separation (LLPS) with a probability of spontaneous liquid-liquid phase separation of 0.9989, suggesting that its significant intrinsic disorder and ability to form dynamic biomolecular condensates may facilitate its roles in flagella and acrosome formation, microtubule-based transport, and centrosome duplication.
Outside of its structural role in sperm, CEP 131 plays a role in centrosome duplication and is up regulated in many cancers [
128,
129], CEP 131 is phosphorylated PIK4 with many of its phosphorylation sites located in its disordered regions. Once phosphorylated CEP 131 can recruit STIL which is a key protein for centrosome duplication [
128]. CEP 131 has also been found to interact with other regulatory genes such as ARID3A and NPM [
129,
130].
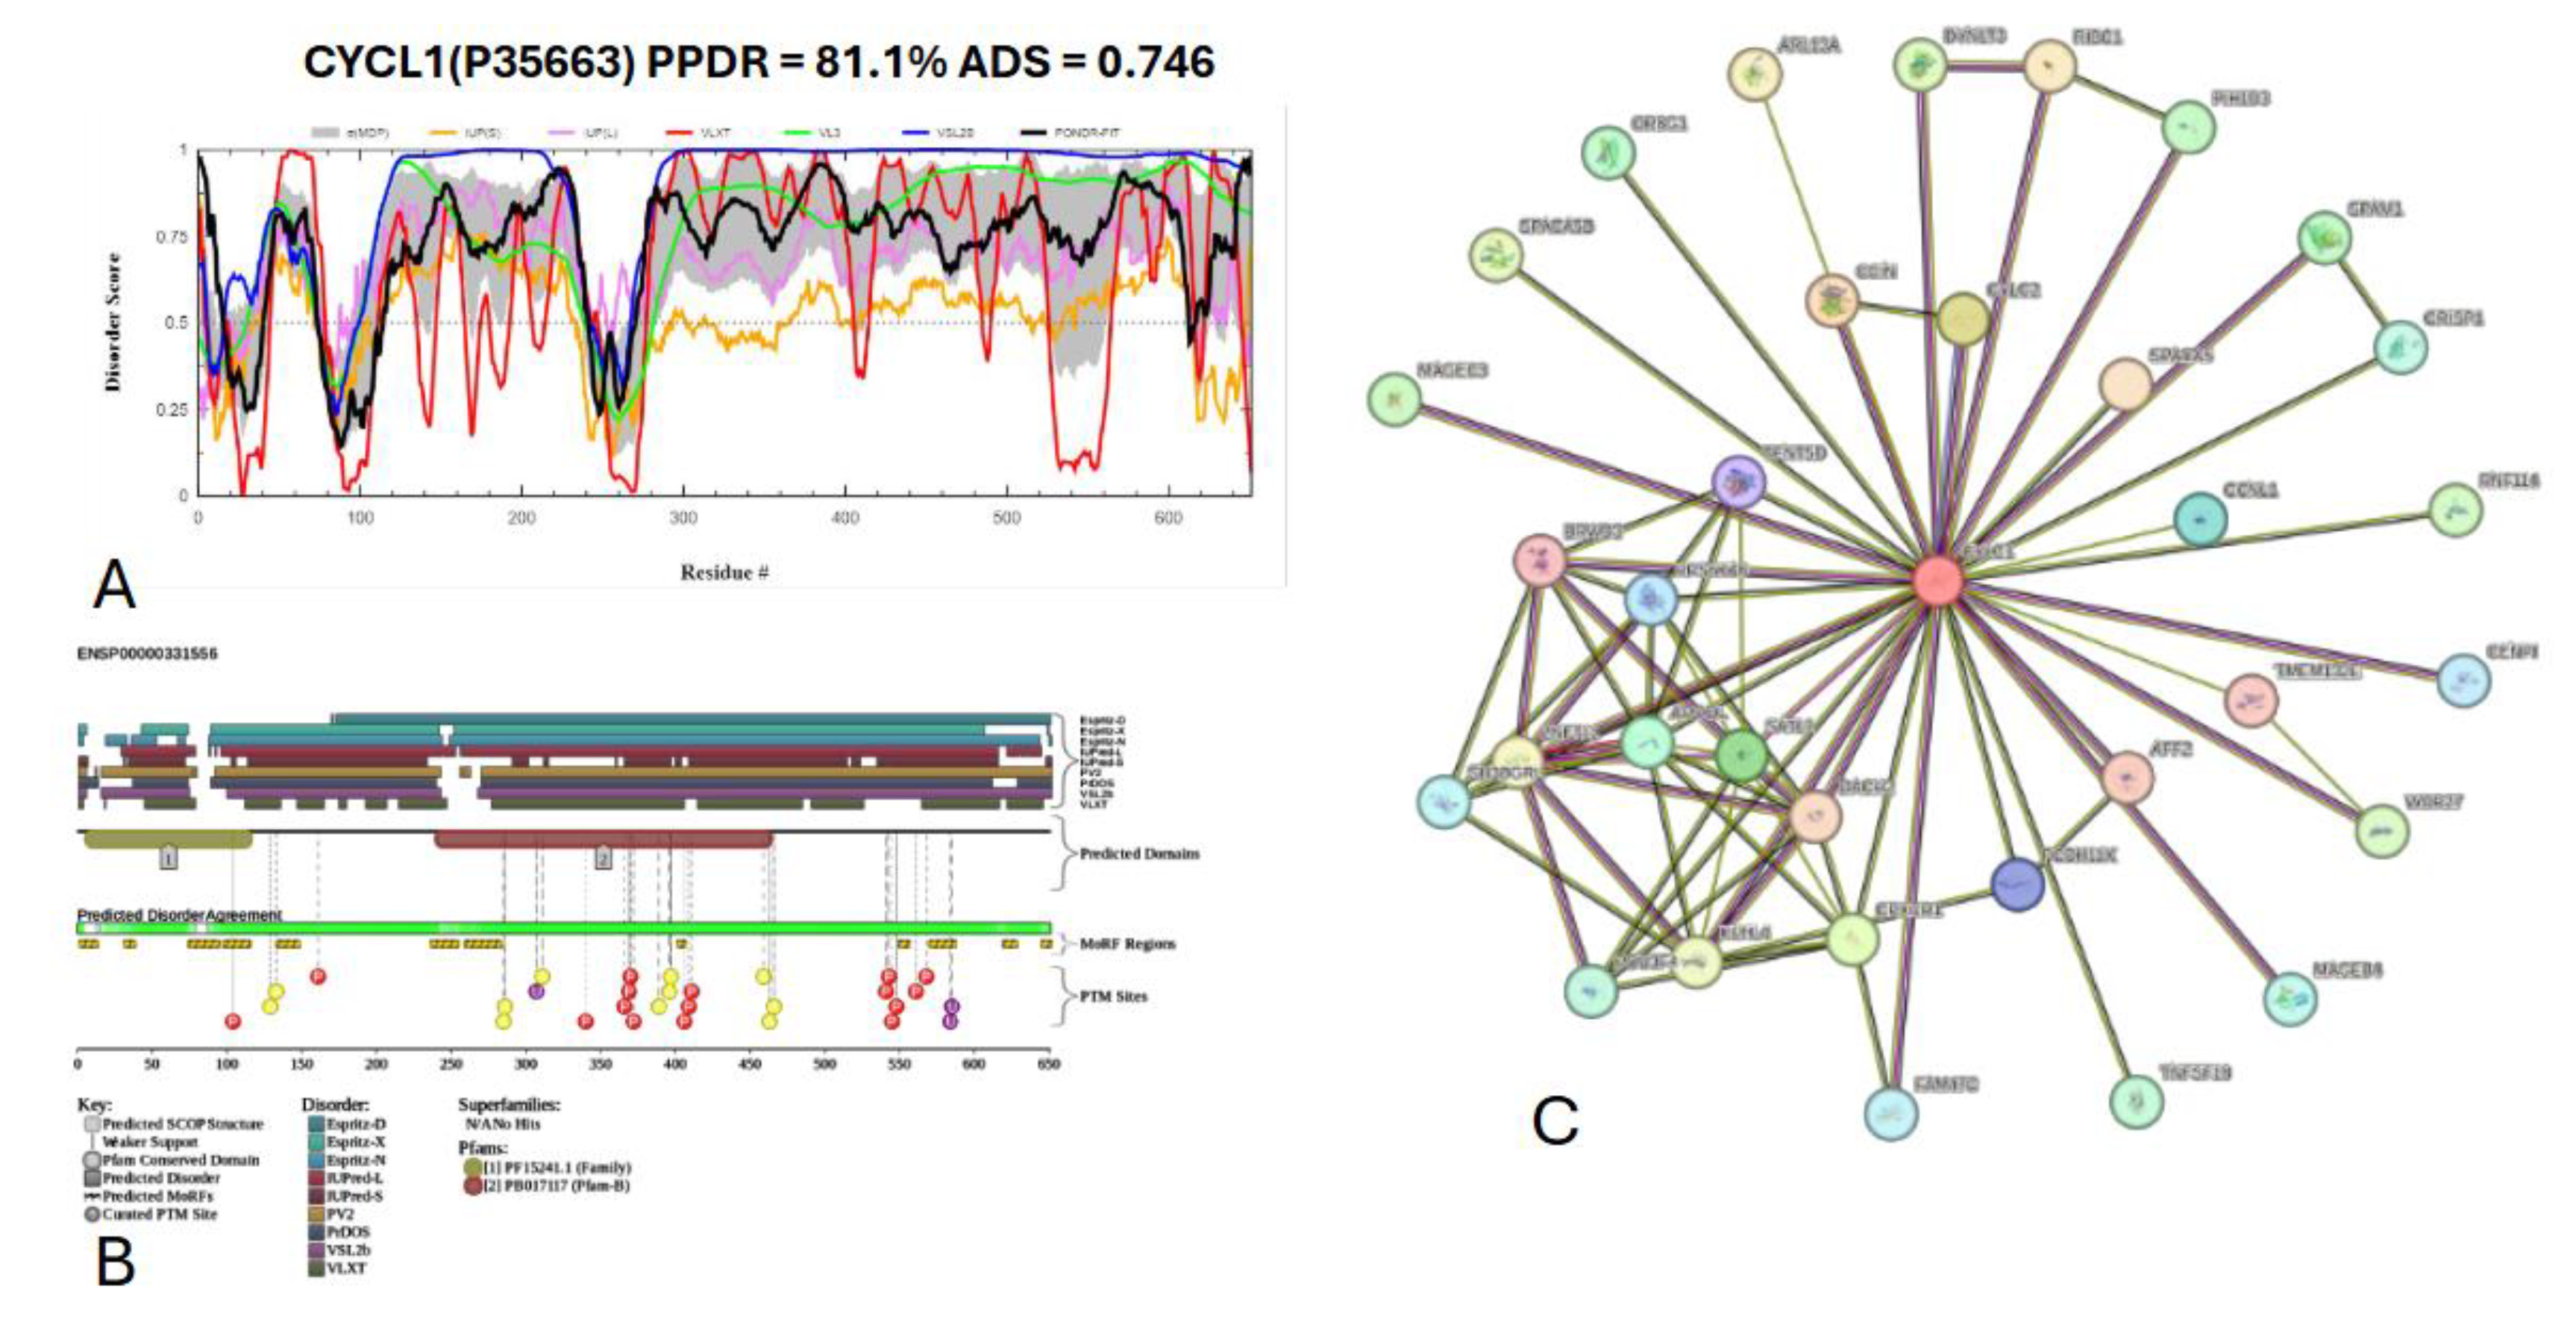
3.7.4. Cylicin-1 (Uniprot ID: P35663)
Figure 20 presents the computational analysis of Cylicin-1, or CYLC1, showing a predicted percentage of disordered residues at 81.1% ± 4.14% and an average disorder score of 0.745 ± 0.042. CYLC1 is a 651-amino-acid-long protein with most disorder localized toward the C-terminus starting at residue 268, while the N-terminal region shows smaller disordered segments (
Figure 20A). This protein contains two Pfam conserved domains spanning amino acids 7–116 and 241–464, respectively. Multiple post-translational modification sites are clustered between residues 250 and 600, alongside 12 molecular recognition features (MoRFs) associated with ANCHOR-predicted binding regions (
Figure 20B). The protein-protein interaction (PPI) network generated by STRING at a medium confidence interval (0.4) reveals 34 nodes and 75 edges, with an average node degree of 4.41 interactions per node, a local clustering coefficient of 0.877, and a statistically significant PPI enrichment (p-value = 4.84 × 10⁻¹⁰) (
Figure 20C).
The high intrinsic disorder observed in CYLC1 likely facilitates its functional versatility, particularly in its role within the perinuclear theca (PT), a cytoskeletal element important for maintaining the acrosome's attachment to the nucleus during spermiogenesis. CYLC1 has been shown to interact with itself and other PT proteins, such as ACTRT1, ACTL7A, and SPACA1, forming a structural "sandwich" that anchors the acrosome to the nuclear envelope [
131]. The disordered regions in CYLC1, particularly in the C-terminal domain, may enhance its capacity for multivalent interactions, allowing dynamic assembly and disassembly of protein complexes. This flexibility likely contributes to the stability of the acrosome-nucleus connection, as evidenced by the severe acrosome detachment and male subfertility observed in CYLC1 knockout mice [
131].
Moreover, the clustering of MoRFs and post-translational modification (PTM) sites within the disordered regions of CYLC1 suggests a regulatory role in binding and interaction dynamics. These features may allow CYLC1 to act as a molecular scaffold, mediating the assembly of protein complexes that stabilize the acrosome's structural integrity. PTMs such as phosphorylation could modulate the disorder-to-order transitions in these regions, dynamically regulating the protein's interaction with binding partners during acrosomal maturation and exocytosis [
84,
131].
CYLC1's intrinsic disorder might also influence its role in phase separation. The probability of spontaneous liquid-liquid phase separation of CYLC1 was 0.9965, which is incredibly high. The enrichment of disordered and low-complexity regions makes CYLC1 a candidate for contributing to membraneless compartmentalization within the PT. Such phase-separated domains could act as reservoirs for critical proteins and molecular factors required for acrosomal function and fertilization, facilitating spatial and temporal coordination of these processes [
85,
131].
The STRING analysis further supports CYLC1's role as a hub in the acrosomal interactome, with significant PPI enrichment and high clustering coefficient indicating a tightly interconnected network of interactions. The observed disorder and network centrality together show CYLC1's importance in ensuring the structural and functional integrity of the acrosome, with potential implications for male fertility in humans and animal models [
131].
3.7.5. Coiled-coil domain-containing protein 136 (CCDC136) (UniProt ID: Q96JN2)
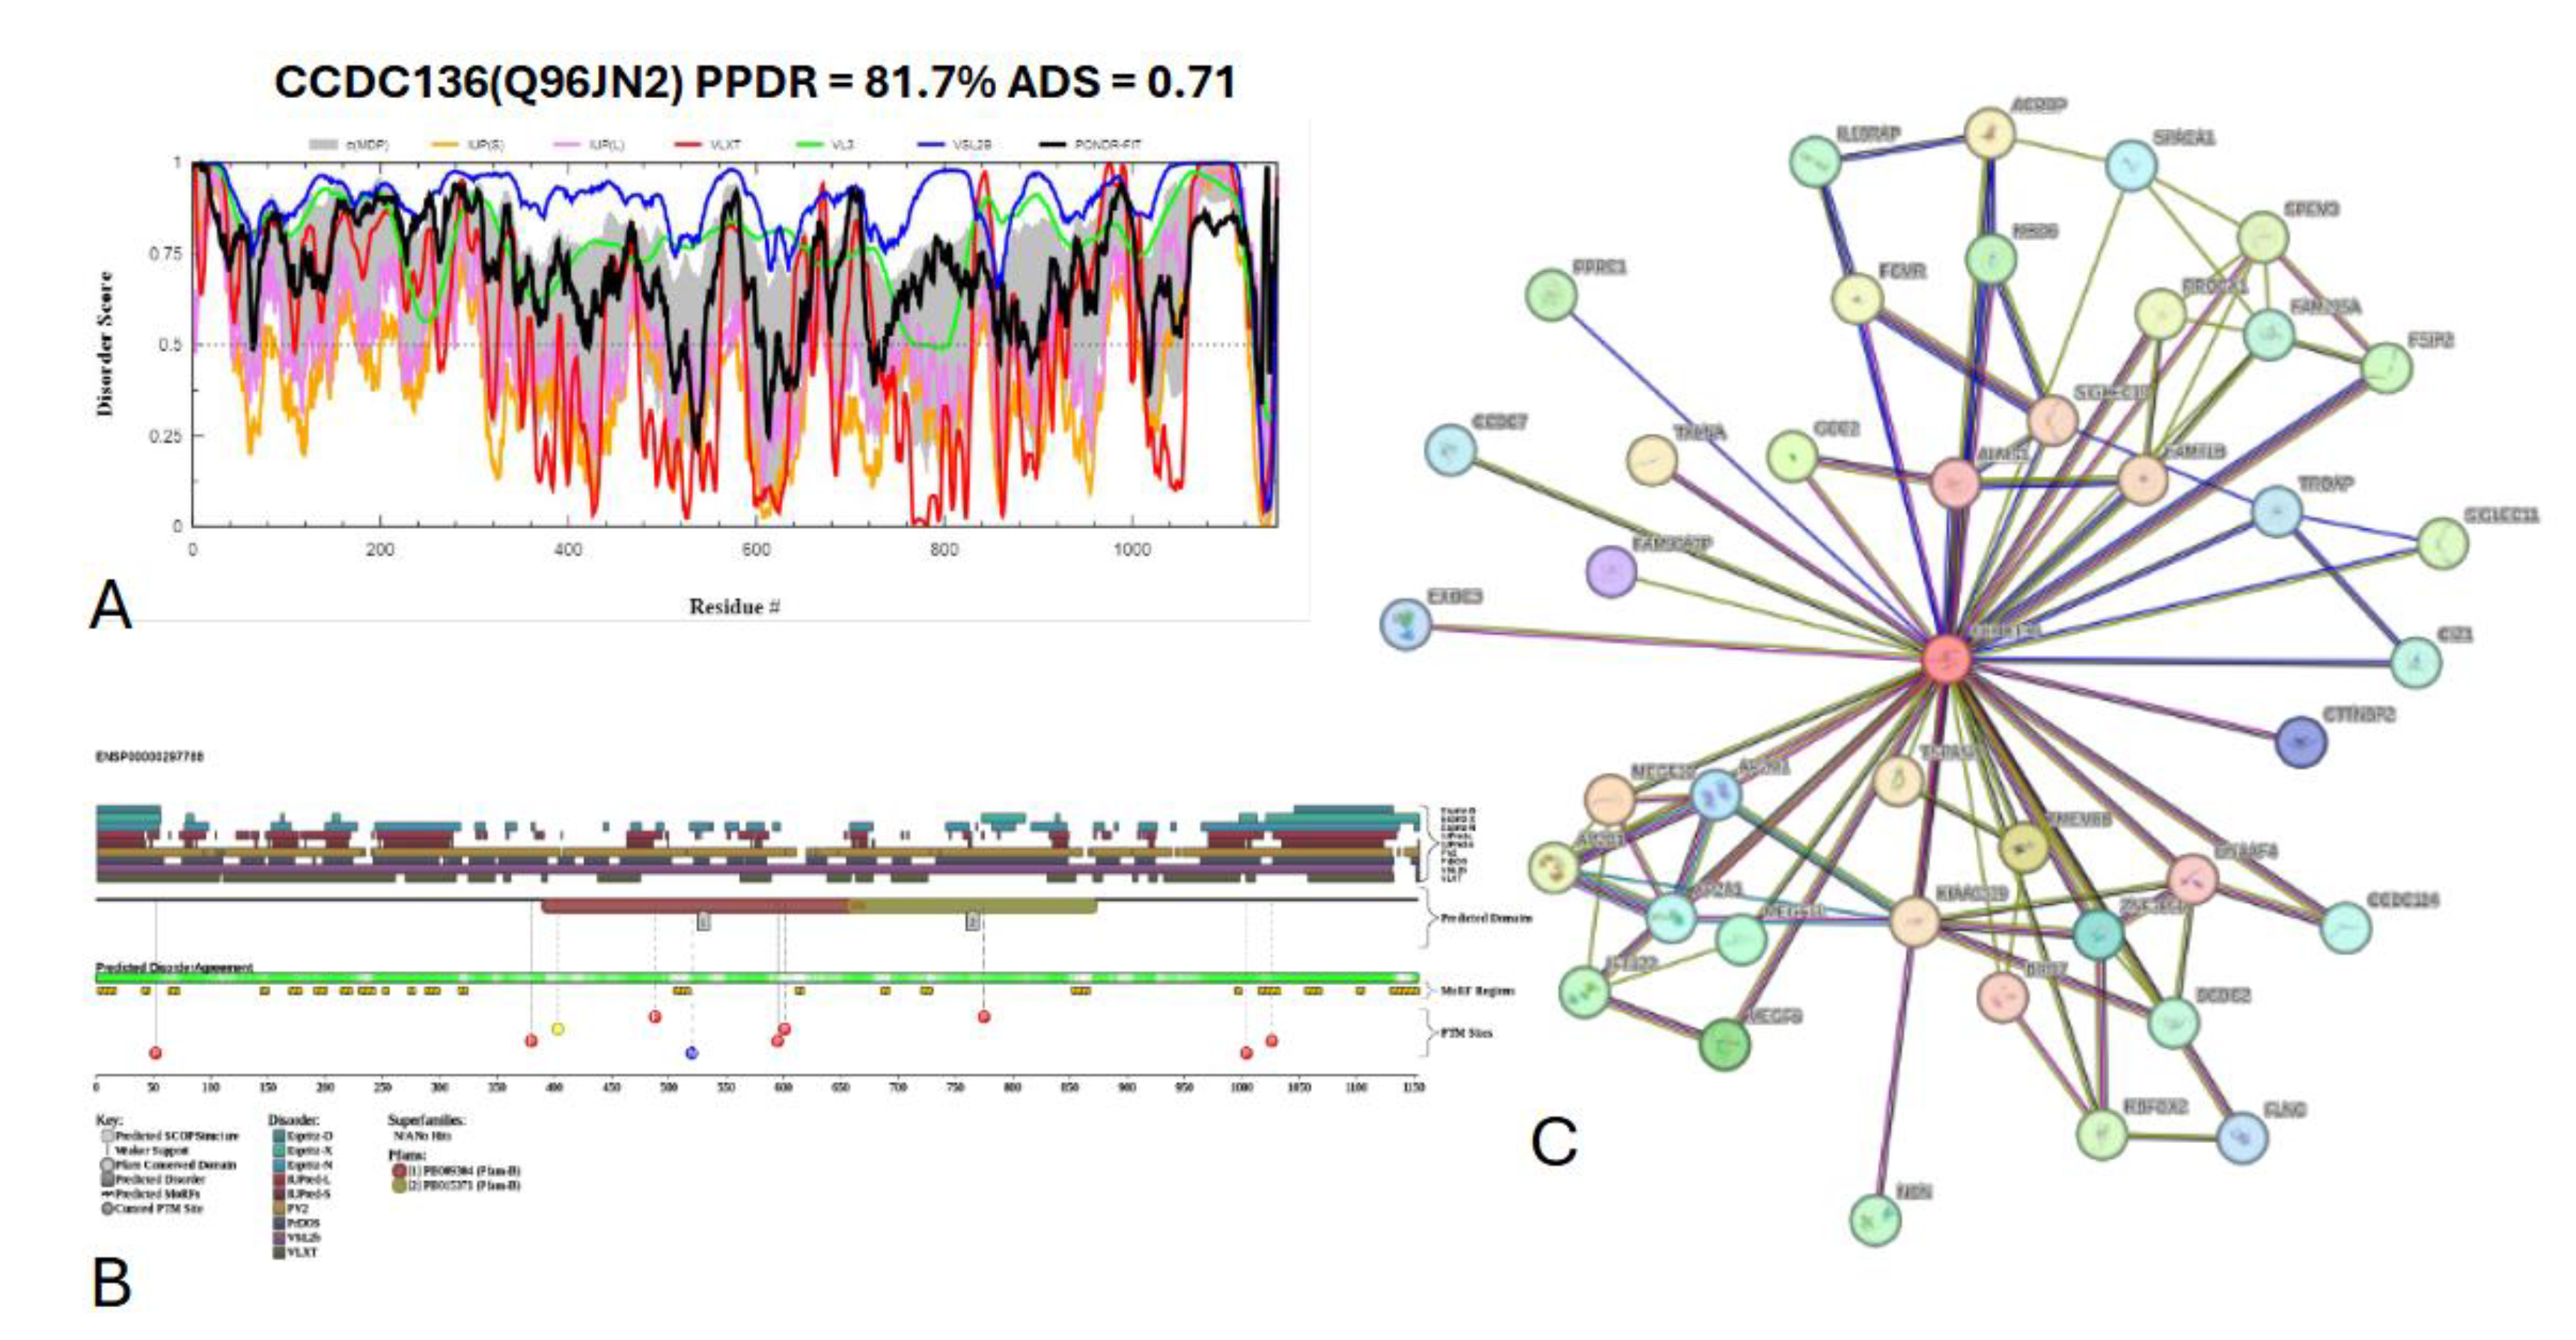
Figure 21 presents the computational analysis of CCDC136, showing a predicted percentage of disordered residues at 72.9% ± 10.02% and an average disorder score of 0.639 ± 0.062. CCDC136 is a 1154-amino-acid-long protein with disordered regions distributed throughout its sequence (
Figure 21A). The protein contains two Pfam conserved domains spanning residues 391–670 and 658–873, respectively, and features 22 molecular recognition features (MoRFs) predicted by ANCHOR. In addition, CCDC136 has multiple post-translational modification (PTM) sites scattered across its sequence, further highlighting its potential regulatory complexity (
Figure 21B). The protein-protein interaction (PPI) network generated by STRING at a medium confidence interval of 0.4 (
Figure 21 C) shows that CCDC136 interacts with 41 nodes via 86 edges, with an average node degree of 4.2 interactions per node, a local clustering coefficient of 0.735, and a statistically significant PPI enrichment (p-value < 1.0 × 10⁻¹⁶). Its predicted liquid-liquid phase separation propensity (P
LLPS) is high, at 0.9894, suggesting a strong potential for forming biomolecular condensates.
The intrinsic disorder of CCDC136 likely plays a key role in mediating its function during acrosome biogenesis and fertilization. Studies indicate that CCDC136 localizes to the acrosome during spermatogenesis, where it is critical for the correct assembly of this specialized organelle [
132]. The protein's disordered regions may provide the flexibility required for dynamic interactions with other acrosome-related proteins, such as SPACA1 and PICK1, which are involved in the early stages of acrosome formation and are significantly downregulated in CCDC136 knockout mice [
132]. The distribution of MoRFs across CCDC136 supports its role as a scaffold that mediates transient, multivalent interactions essential for acrosomal maturation.
CCDC136’s high PLLPS score further suggests its involvement in forming liquid-like condensates within the acrosome. These condensates may act as compartments for concentrating acrosome-specific proteins, ensuring their correct localization and function during spermiogenesis. The ability to undergo phase separation could also help stabilize the structural integrity of the acrosome and facilitate its rapid reorganization during the acrosome reaction, a process critical for successful fertilization [
85]. In CCDC136 knockout mice, the disruption of acrosome morphology and the associated male infertility underscore the importance of this protein's role in both structural and functional aspects of spermatogenesis [
132].
Moreover, the presence of PTMs within disordered regions of CCDC136 provides an additional regulatory layer, potentially controlling the protein's interactions and phase-separation behavior. PTMs such as phosphorylation may modulate CCDC136's role in acrosome formation by dynamically altering its binding affinity to partner proteins or its ability to assemble into condensates. This aligns with the broader understanding of disordered proteins as dynamic regulators in cellular processes, where disorder and phase separation allow for reversible, context-dependent assembly of protein complexes [
84].
The STRING network further illustrates CCDC136’s centrality in the acrosomal protein interaction network, with its significant enrichment of interactions indicating a pivotal role in coordinating processes necessary for spermatogenesis and fertilization. The interplay between CCDC136’s intrinsic disorder, conserved domains, and its ability to form condensates highlights its dual role as both a structural and regulatory component of the acrosome.
Figure 1.
Structural Representations of Selected Proteins. From left to right, the structures shown are: Arf-GAP domain and FG repeat-containing protein 1 (obtained via Solution NMR; PDB ID: 2D9L; PDB DOI:
https://doi.org/10.2210/pdb2D9L/pdb), Sperm acrosome membrane-associated protein 6 (obtained via X-ray Diffraction; PDB ID: 7TA2; [
114]), and Voltage-dependent T-type calcium channel subunit alpha-1H (obtained via Cryo-EM; PDB ID: 7WLJ; [
115]). Each structure is colored in a rainbow gradient from the N-terminus (blue) to the C-terminus (red), highlighting the secondary structural features, including α-helices, β-strands, and loops.
Figure 2.
Predicted Structures of the Top 10 Most Disordered Proteins. AlphaFold was used to model the predicted structures of the 10 most disordered proteins in our dataset, creating a structural portrait gallery. Proteins are displayed by UniProt ID from left to right, starting with the top row: Calcium-binding and spermatid-specific protein 1 (UniProt ID: Q96KC9), regulating synaptic membrane exocytosis protein 1 (UniProt ID: Q86UR5), acrosomal protein SP-10 (UniProt ID: P26436), TATA element modulatory factor (UniProt ID: P82094), Golgin subfamily A member 1 (UniProt ID: Q92805), nuclear transition protein 2 (UniProt ID: Q05952), coiled-coil domain-containing protein 136 (UniProt ID: Q96JN2), myristoylated alanine-rich C-kinase substrate (UniProt ID: P29966), Cylicin-1 (UniProt ID: P35663), and centrosomal protein of 131 kDa (UniProt ID: Q9UPN4). Colors represent the predicted local distance difference test (pLDDT) scores: very high confidence (pLDDT > 90, dark blue), high confidence (90 > pLDDT > 70, light blue), low confidence (70 > pLDDT > 50, yellow), and very low confidence (pLDDT < 50, orange).
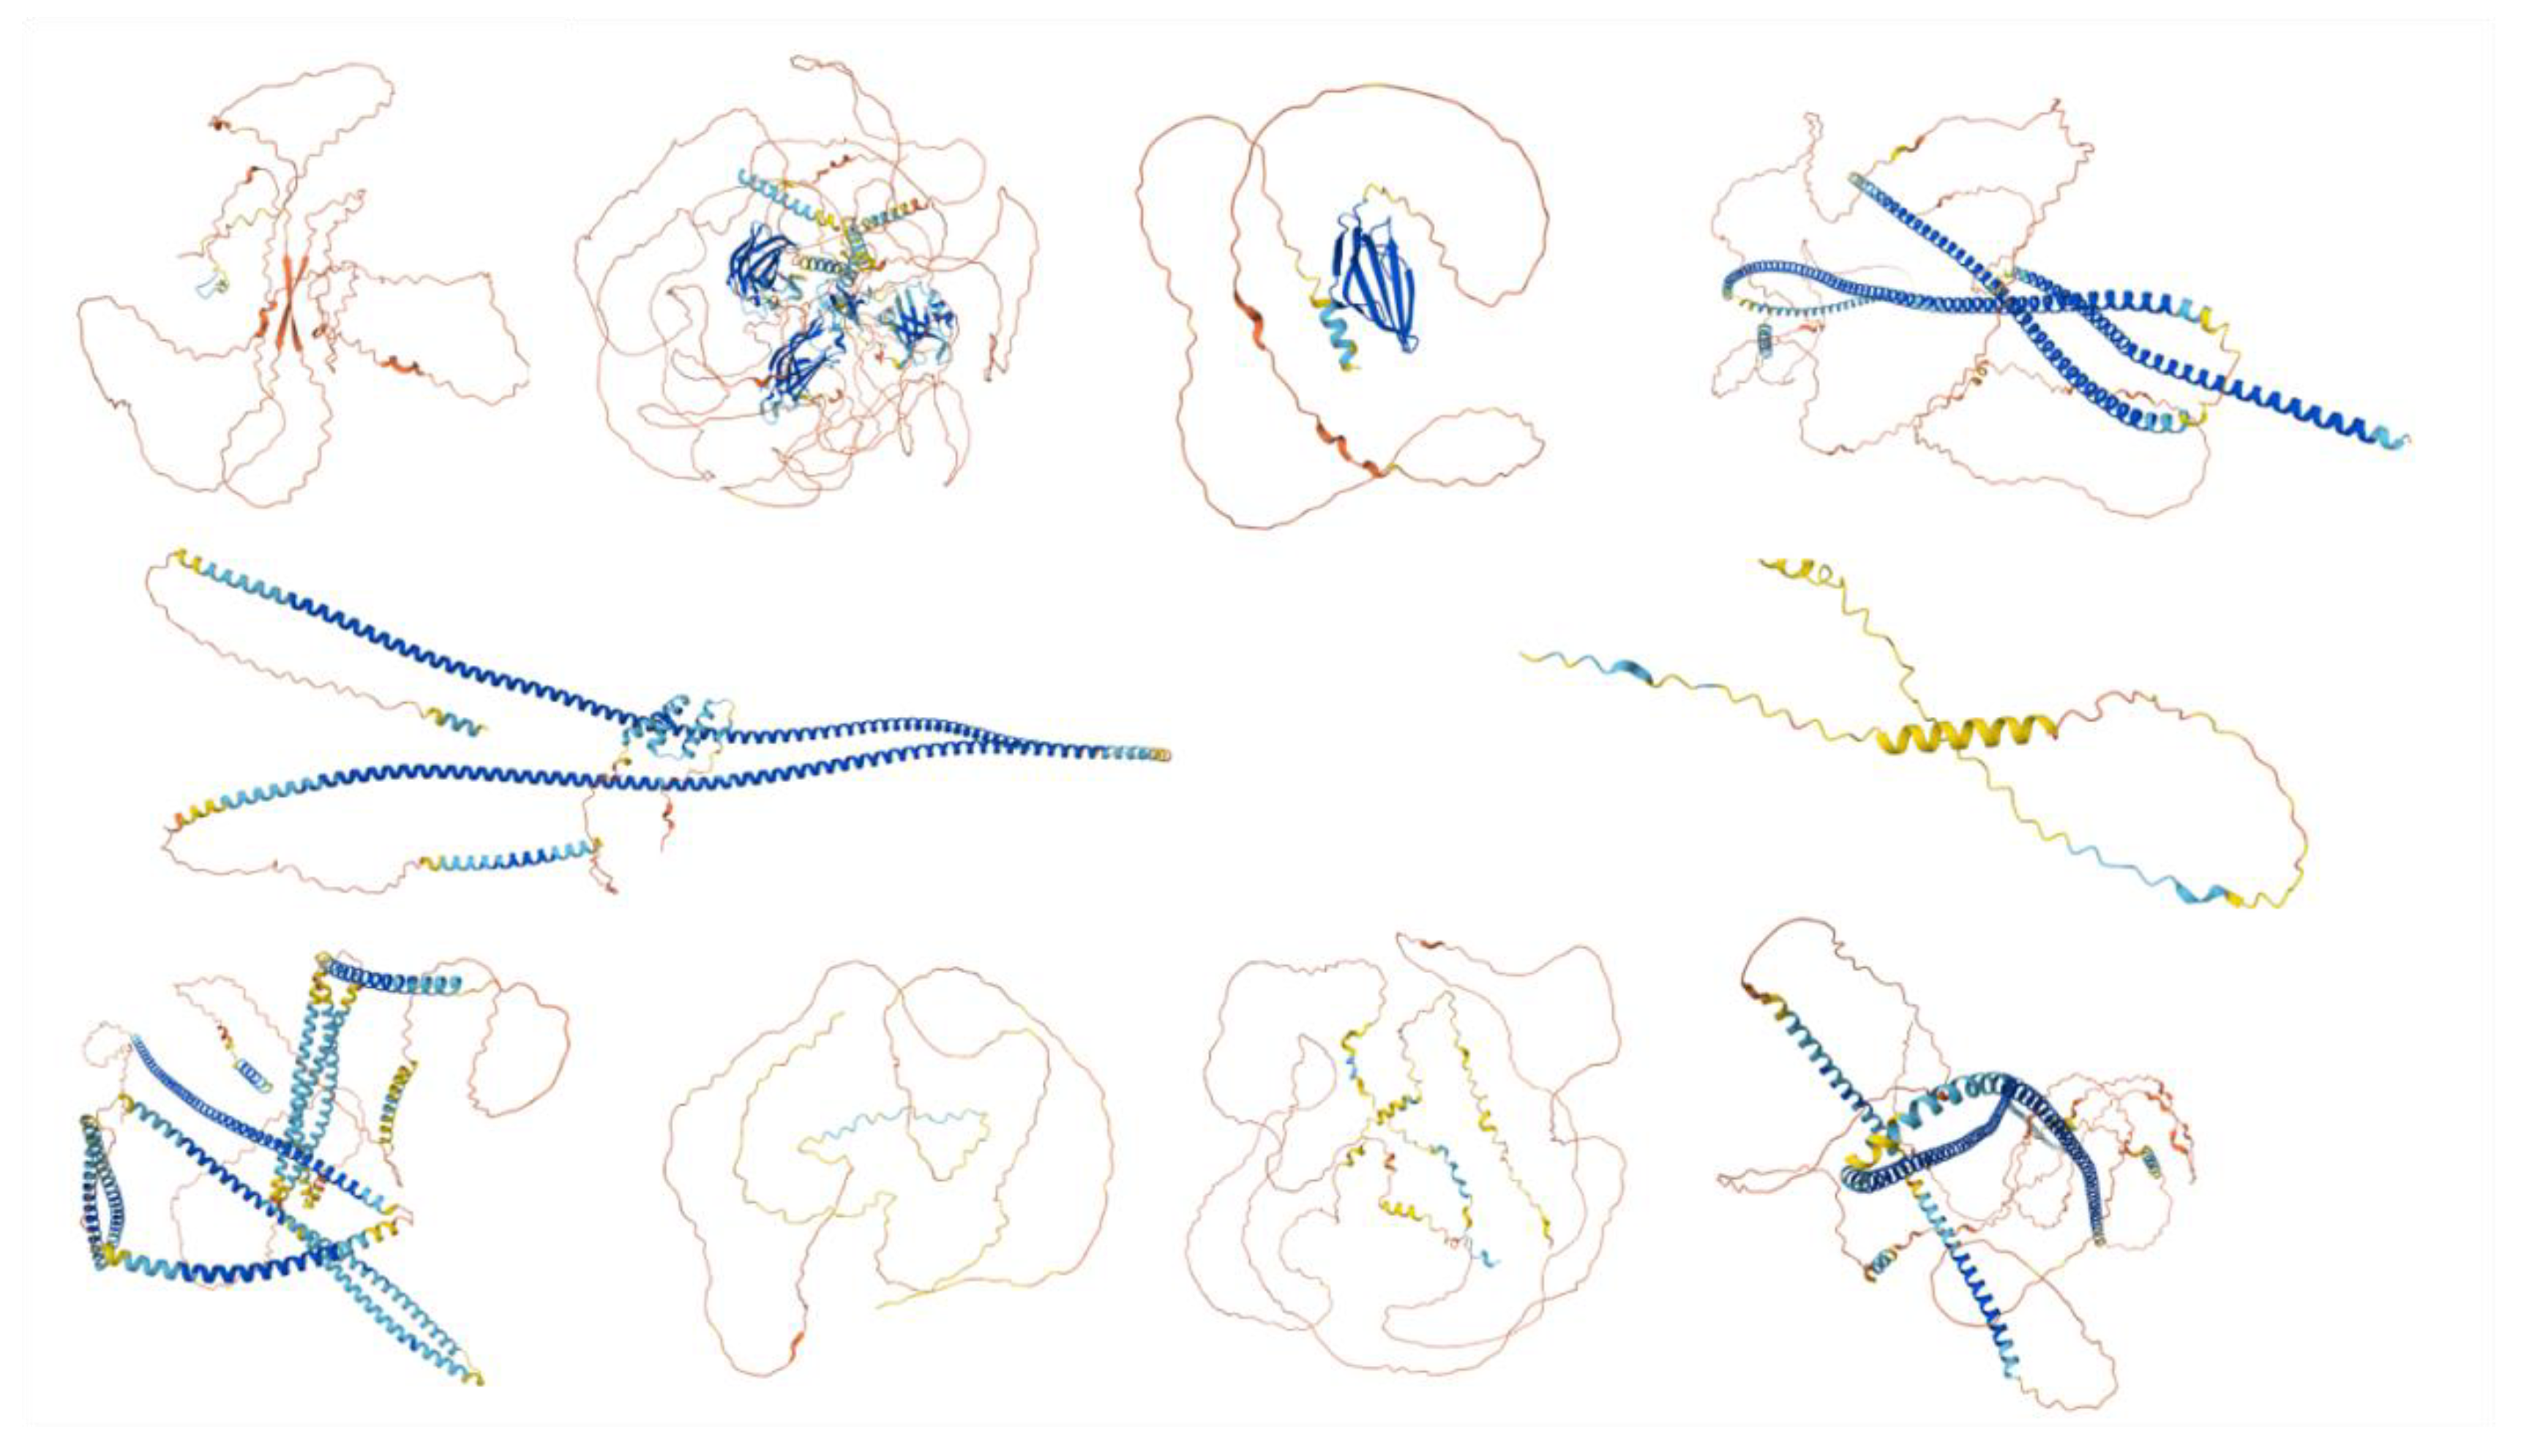
Figure 3.
Percent Disorder Across Prediction Models. The boxplot compares the distribution of percent disorder (PER) predicted by seven different models: IUPred long, IUPred short, mean disorder propensity (MDP), PONDR-FIT, PONDR® VL3, PONDR® VLXT, and PONDR® VSL2B (PER-IUPL, PER-IUPS, PER-MDP, PER-PFIT, PER-VL3, PER-VLXT, and PER-VSL2B, respectively). Each box represents the interquartile range (IQR), with the median marked by a horizontal line and outliers shown as individual points. The PER-VSL2B model predicts the highest percent disorder overall, while models such as PER-IUPL and PER-IUPS show lower median values, indicating variability in disorder prediction across different tools.
Figure 4.
Protein Disorder Categories by Model. The figure shows the distribution of proteins categorized into three disorder classes across multiple prediction models. Proteins are classified as highly disordered (>30% disordered residues, red), moderately disordered (10–30% disordered residues, blue), and highly ordered (0–10% disordered residues, green). Each pie chart corresponds to a specific model, including Average, PER-IUPL, PER-IUPS, PER-MDP, PER-PFIT, PER-VL3, PER-VLXT, and PER-VSL2B. The numbers (n) represent the count of proteins within each disorder category for the respective model.
Figure 5.
Scatter Plot of PPIDR vs. ADS Across All Models Analyzed in This Study. The scatter plot shows the relationship between PPIDR (Percent Disorder) and ADS (Average Disorder Score) across multiple prediction models. Each dot represents a protein, colored by the respective disorder prediction model IUPred long, IUPred short, MDP, PONDR-FIT, PONDR® VL3, PONDR® VLXT, and PONDR® VSL2B (IUPL, IUPS, MDP, PFIT, VL3, VLXT, and VSL2B). A strong positive correlation is observed, with a correlation coefficient of r = 0.947 and a statistically significant p-value (p < 0.001), indicating a strong linear relationship between percent disorder and average disorder score.
Figure 6.
A. CH-CDF Plot of Intrinsic Disorder Status. The scatter plot displays the relationship between CH scores (distance from CH boundary) and CDF scores (average distance from CDF boundary), classifying proteins into four quadrants based on their intrinsic disorder status. Quadrants are defined as Q1 (Ordered by both CH and CDF boundaries, blue), Q2 (CH Ordered, CDF Disordered, green), Q3 (Disordered by both CH and CDF boundaries, red), and Q4 (CH Disordered, CDF Ordered, orange). This classification highlights the agreement or disagreement between CH and CDF disorder predictions. B. Number and Ratio of Proteins in Each Quadrant. The bar chart shows the distribution of proteins across four quadrants based on CH-CDF disorder classification. Quadrant Q1 (Ordered by Both) contains 64.8% of the proteins, Q2 (CH Ordered, CDF Disordered) contains 24.4%, Q3 (Disordered by Both) accounts for 9.6%, and Q4 (CH Disordered, CDF Ordered) contains 1.2%. This visualization highlights the proportion of proteins within each classification category.

Figure 7.
Number of Proteins at Each Analysis Stage. The bar chart displays the number of proteins retained through successive stages of analysis. The stages include D2P2 hits (233 proteins), proteins with 75% agreement on disorder prediction (190 proteins), SCOP hits (148 proteins), and SCOP domains located within disordered regions (48 proteins). This stepwise filtering highlights the progressive narrowing of the dataset to identify proteins with structural disorder within SCOP domains overlap.
Figure 8.
CH-CDF Plot with Disorder-SCOP Overlap. This plot illustrates the relationship between CH scores (distance from CH boundary) and CDF scores (average distance from CDF boundary) for proteins with and without disorder-SCOP overlaps. Data points are classified into four quadrants: Q1 (Ordered by both CH and CDF boundaries, blue), Q2 (CH Ordered, CDF Disordered, green), Q3 (Disordered by both CH and CDF boundaries, red), and Q4 (CH Disordered, CDF Ordered, orange). Circles (●) indicate proteins with disordered regions (classified by 75% agreement in disorder) that overlap with SCOP domains, while triangles (▲) indicate no overlap. This visualization highlights the distribution of structural classification across the disorder-CDF boundary space.
Figure 9.
Gene Ontology Analysis of Disorder-Affected Proteins. The bubble plot displays enriched Gene Ontology (GO) terms for disorder-affected proteins across three GO categories: Molecular Function (GO:MF), Biological Process (GO:BP), and Cellular Component (GO:CC). The size of each bubble corresponds to the number of proteins associated with the term, while the y-axis represents the statistical significance (-log10 p-value). KEGG, Reactome (REAC), and other pathways are also included, illustrating the functional and structural roles of intrinsically disordered proteins within biological systems.
Figure 10.
Gene Ontology (GO) Hierarchical Annotation for “Acrosomal Vesicle“ (GO:0001669). This hierarchical chart depicts the Gene Ontology relationships for GO:0001669 (acrosomal vesicle), a cellular component critical for acrosome structure and function during fertilization. The chart traces the acrosomal vesicle as part of higher-level biological processes, such as vesicle fusion (GO:0099500), organelle membrane fusion (GO:0090174), and membrane fusion (GO:0061025). These components are further nested under broad categories like organelle organization (GO:0006996) and cellular anatomical structure (GO:0110165). The acrosomal vesicle is functionally linked to structures like the acrosomal matrix (GO:0043159), acrosomal lumen (GO:0043160), and acrosomal membrane (GO:0002080), highlighting its role in vesicle organization and exocytosis. This chart was created using EMBL's European Bioinformatics Institute’s QuickGO tool.
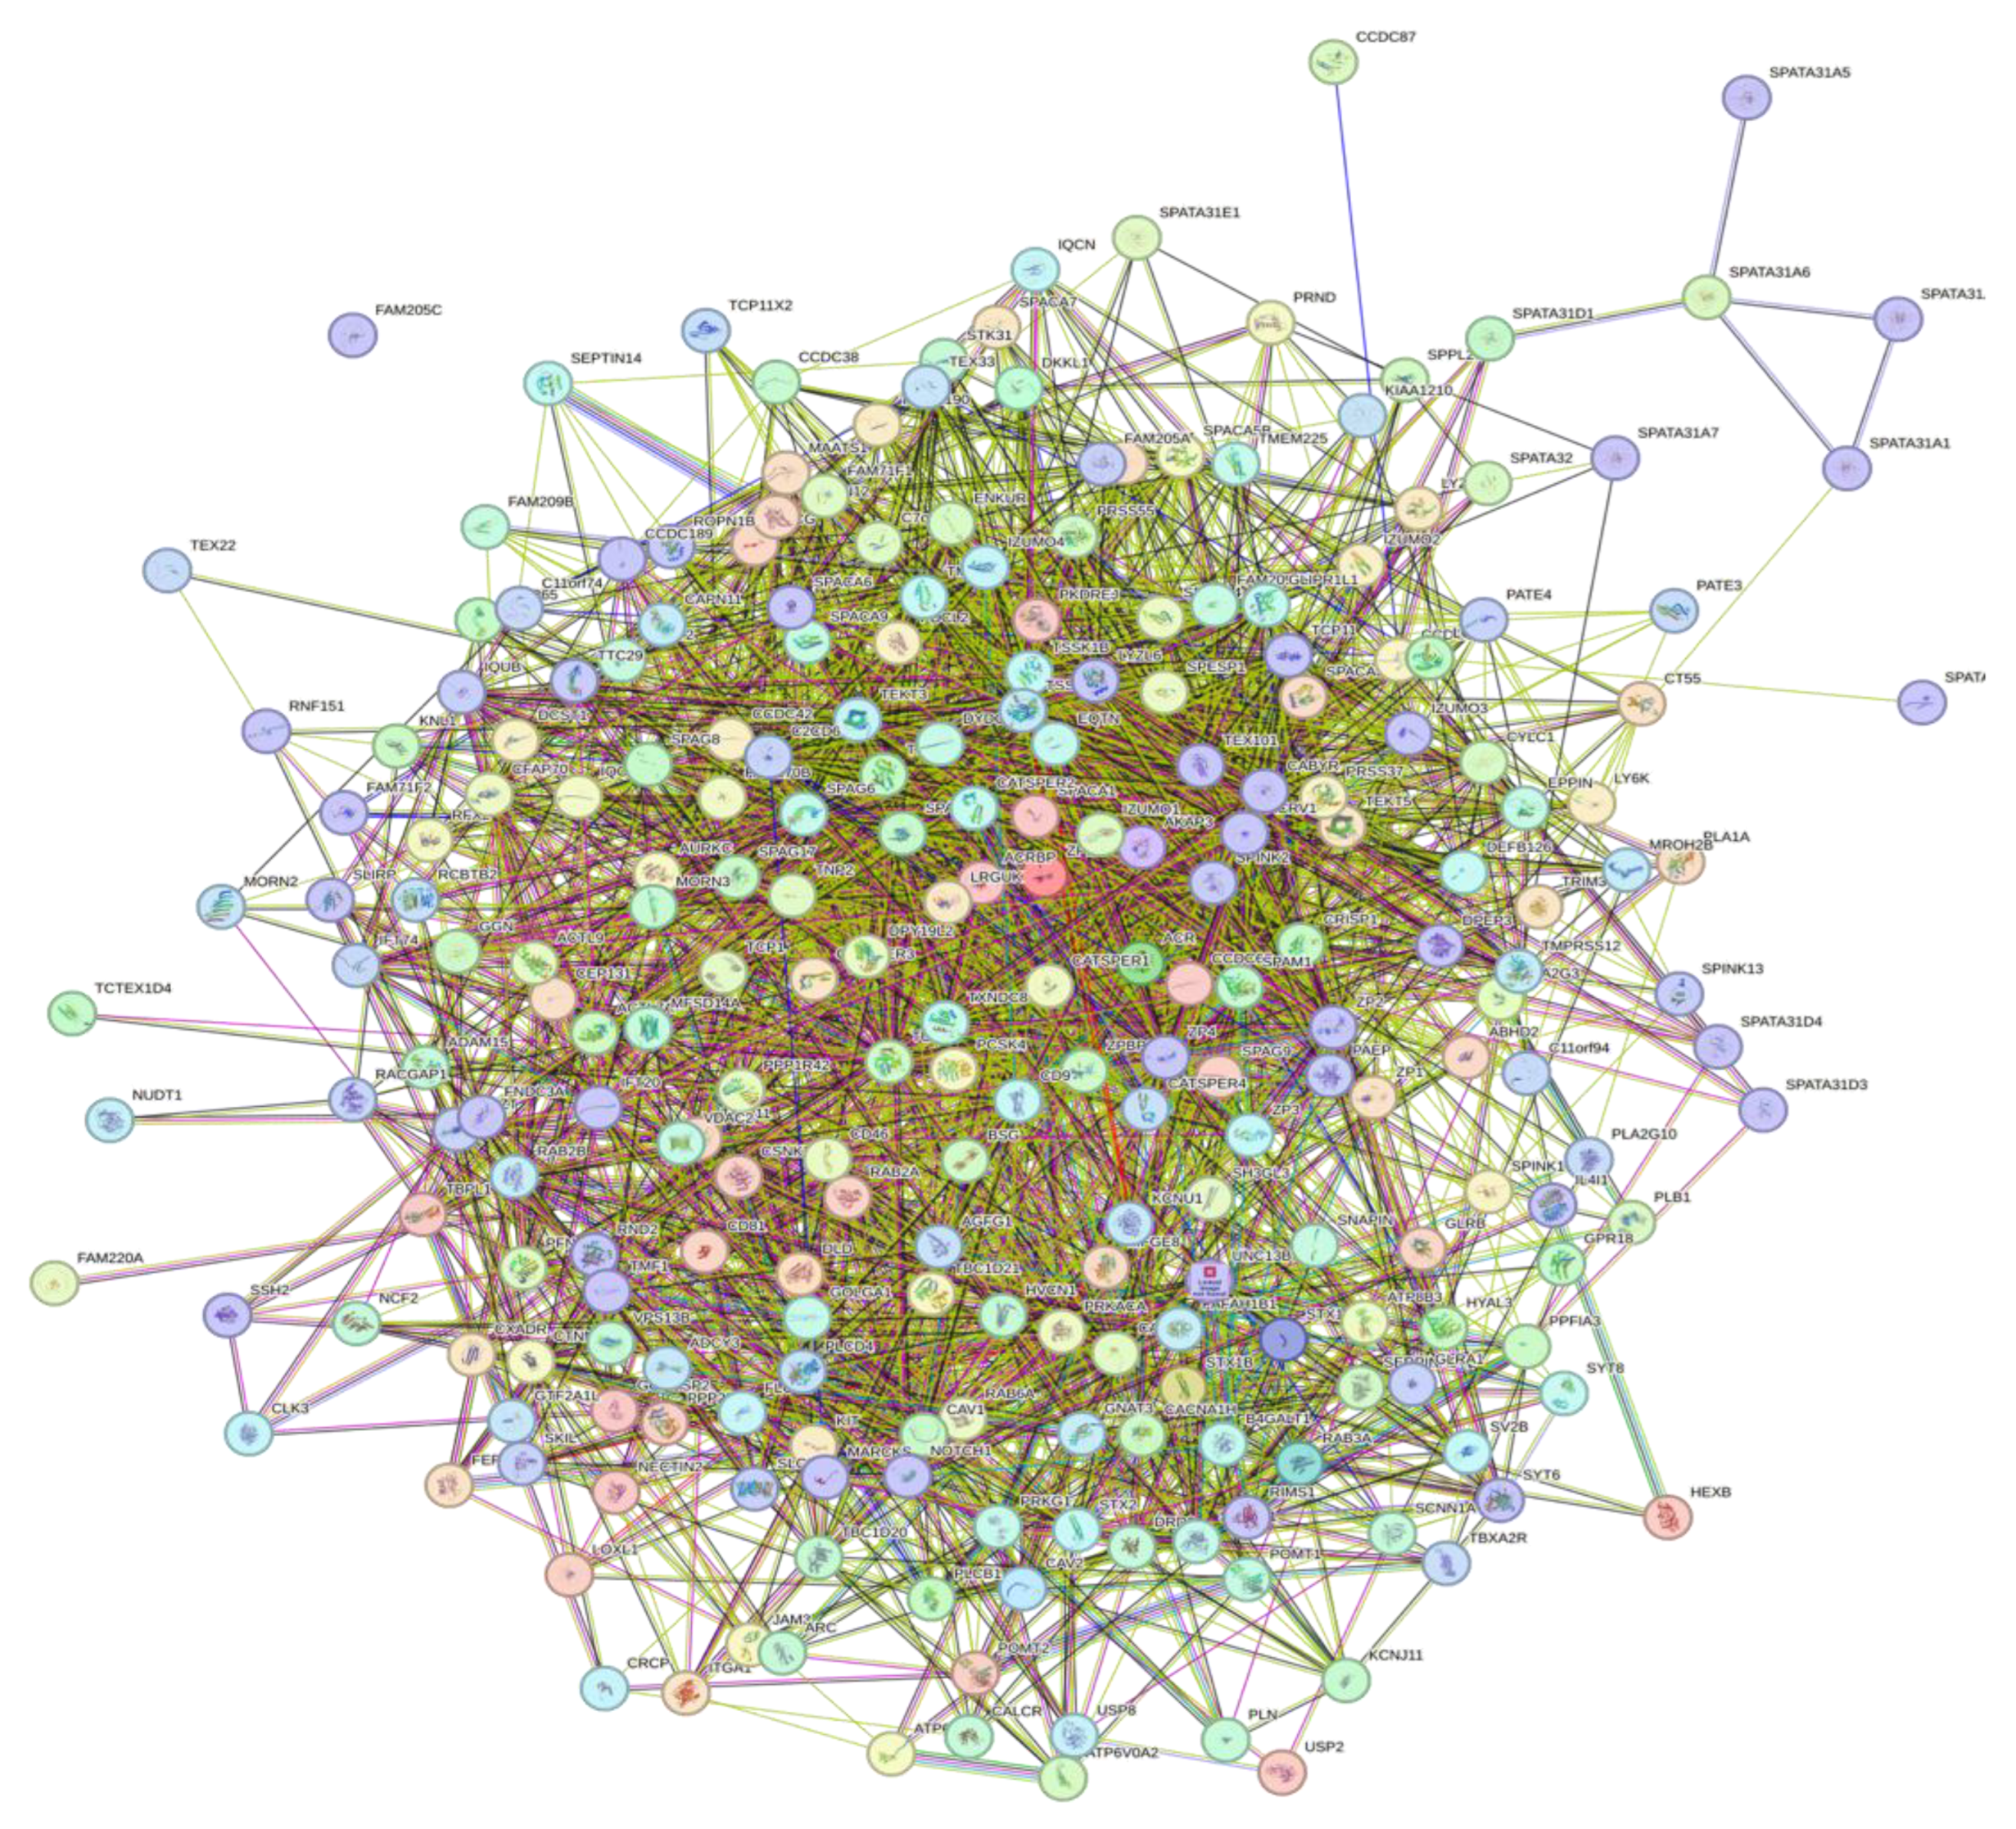
Figure 11.
Inter PPI Network of human Acrosomal Proteins 0.15 confidence. STRING-based analysis of the inter-set interactivity of 245 human acrosomal proteins at the low confidence interval (0.15) to ensure maximum inclusion. Interactions are based on experimental and predicted information. All proteins except for one (UniProt ID: A6NFA0) have determined interactions.
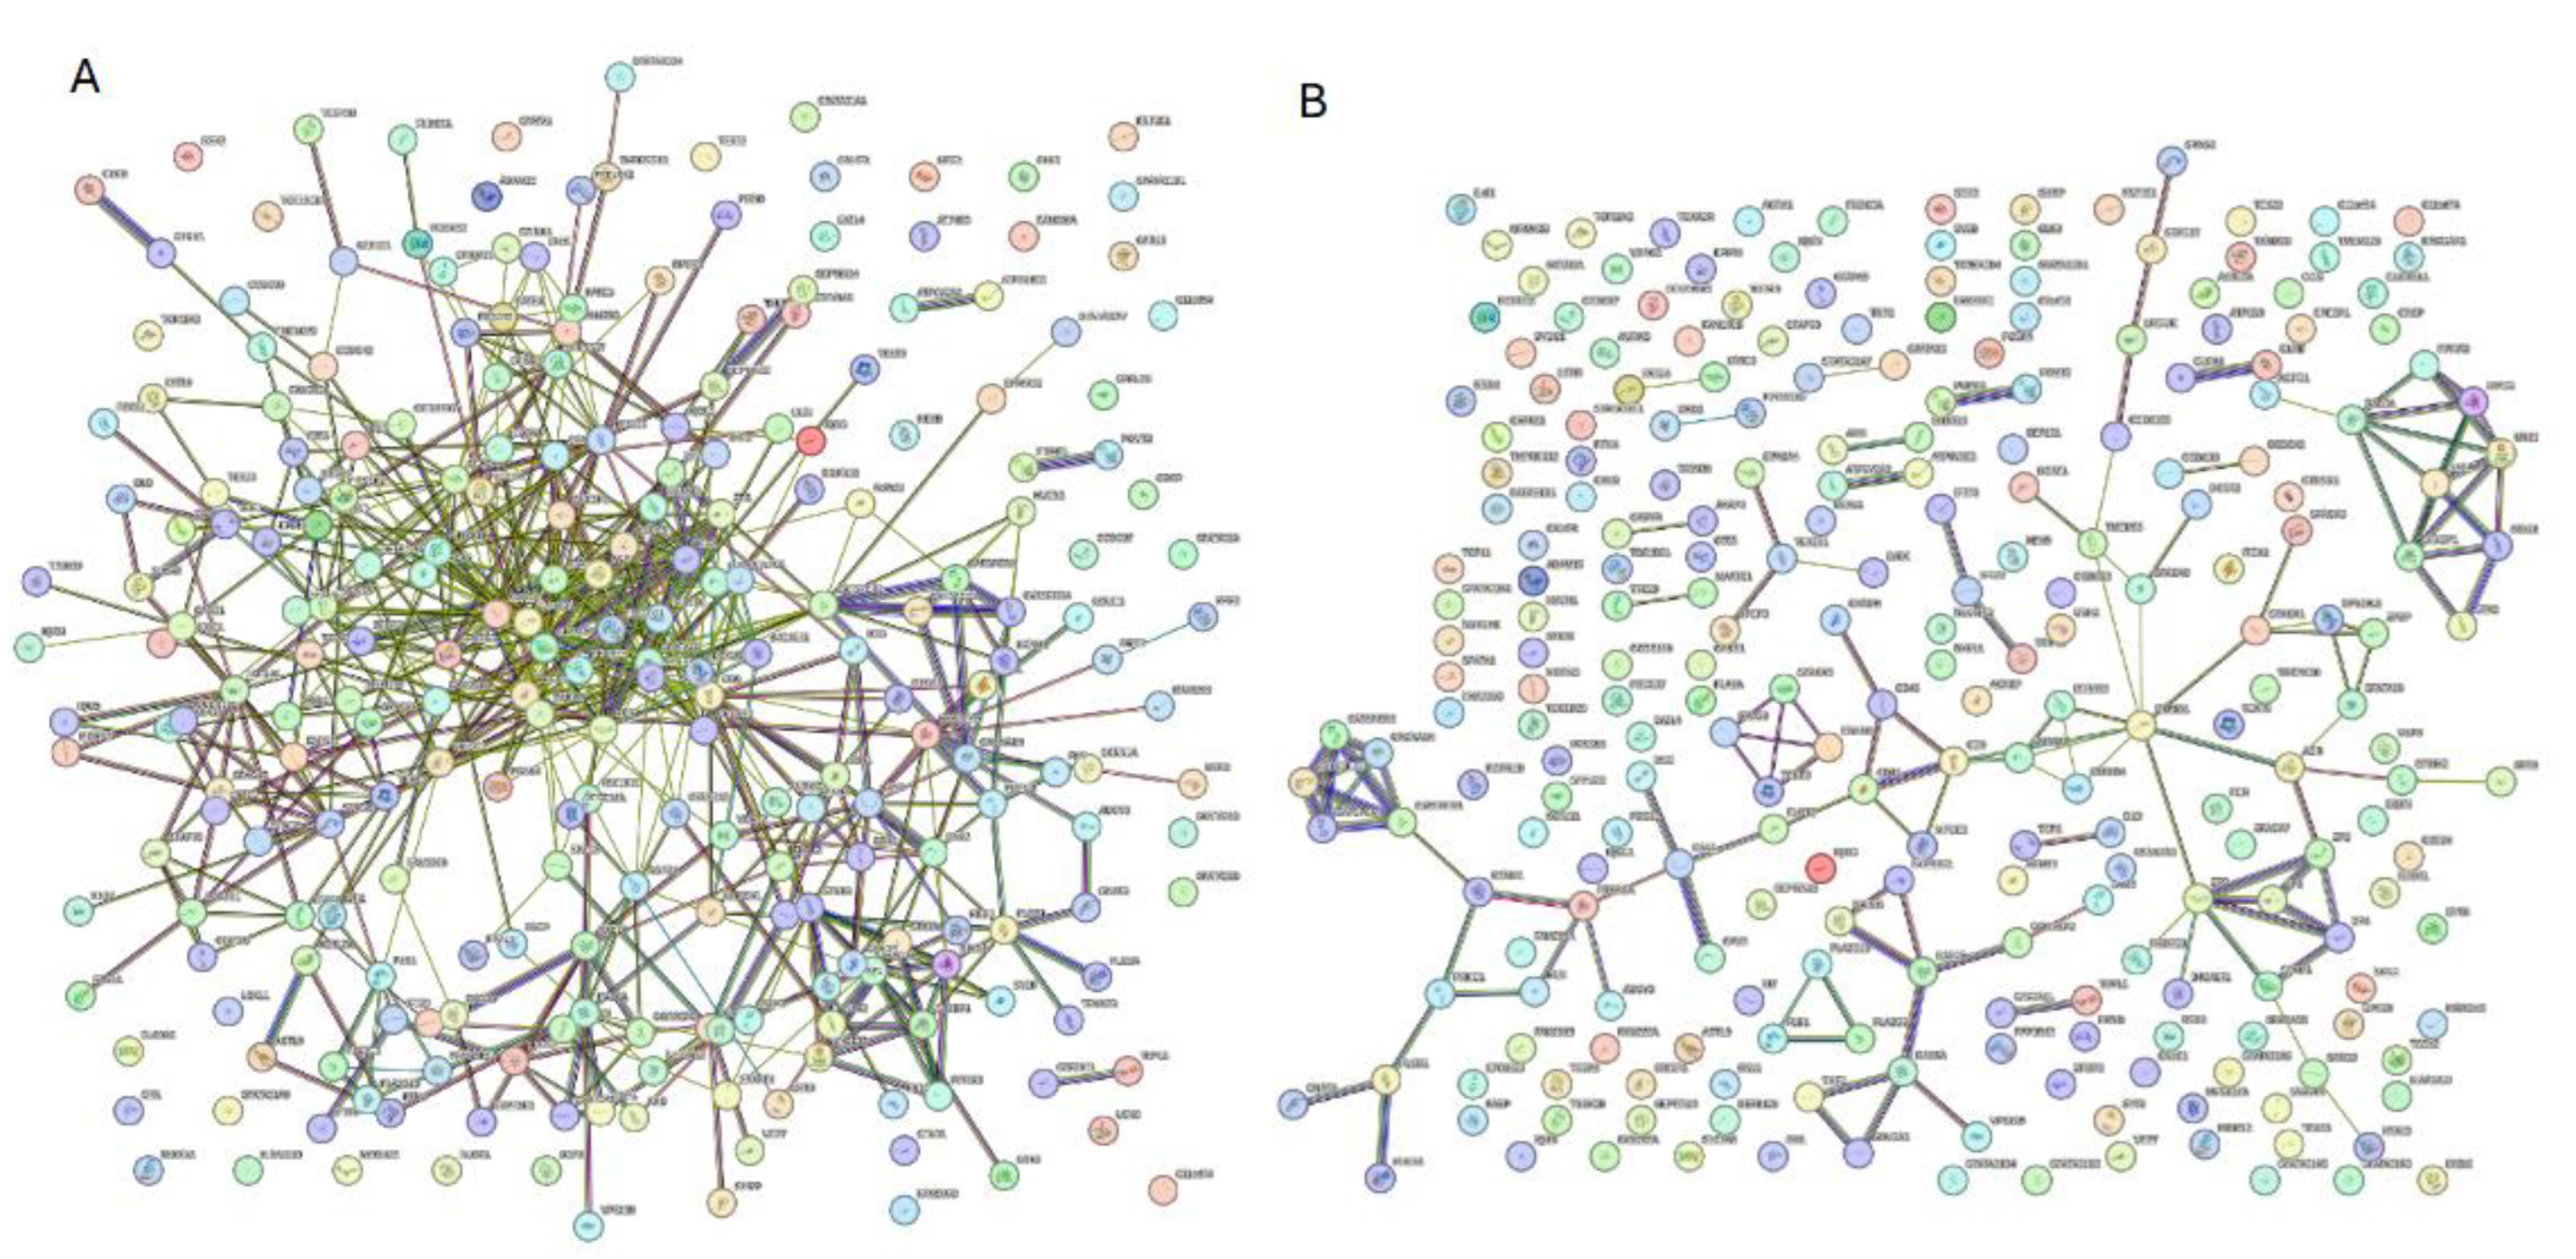
Figure 12.
Inter PPI networks of human acrosomal proteins at 0.4 and 0.7 confidence. STRING-based analysis of the inter-set interactivity of 245 human acrosomal proteins at the A) medium confidence interval (0.4) and B) high confidence interval (0.7).
Figure 12.
Inter PPI networks of human acrosomal proteins at 0.4 and 0.7 confidence. STRING-based analysis of the inter-set interactivity of 245 human acrosomal proteins at the A) medium confidence interval (0.4) and B) high confidence interval (0.7).
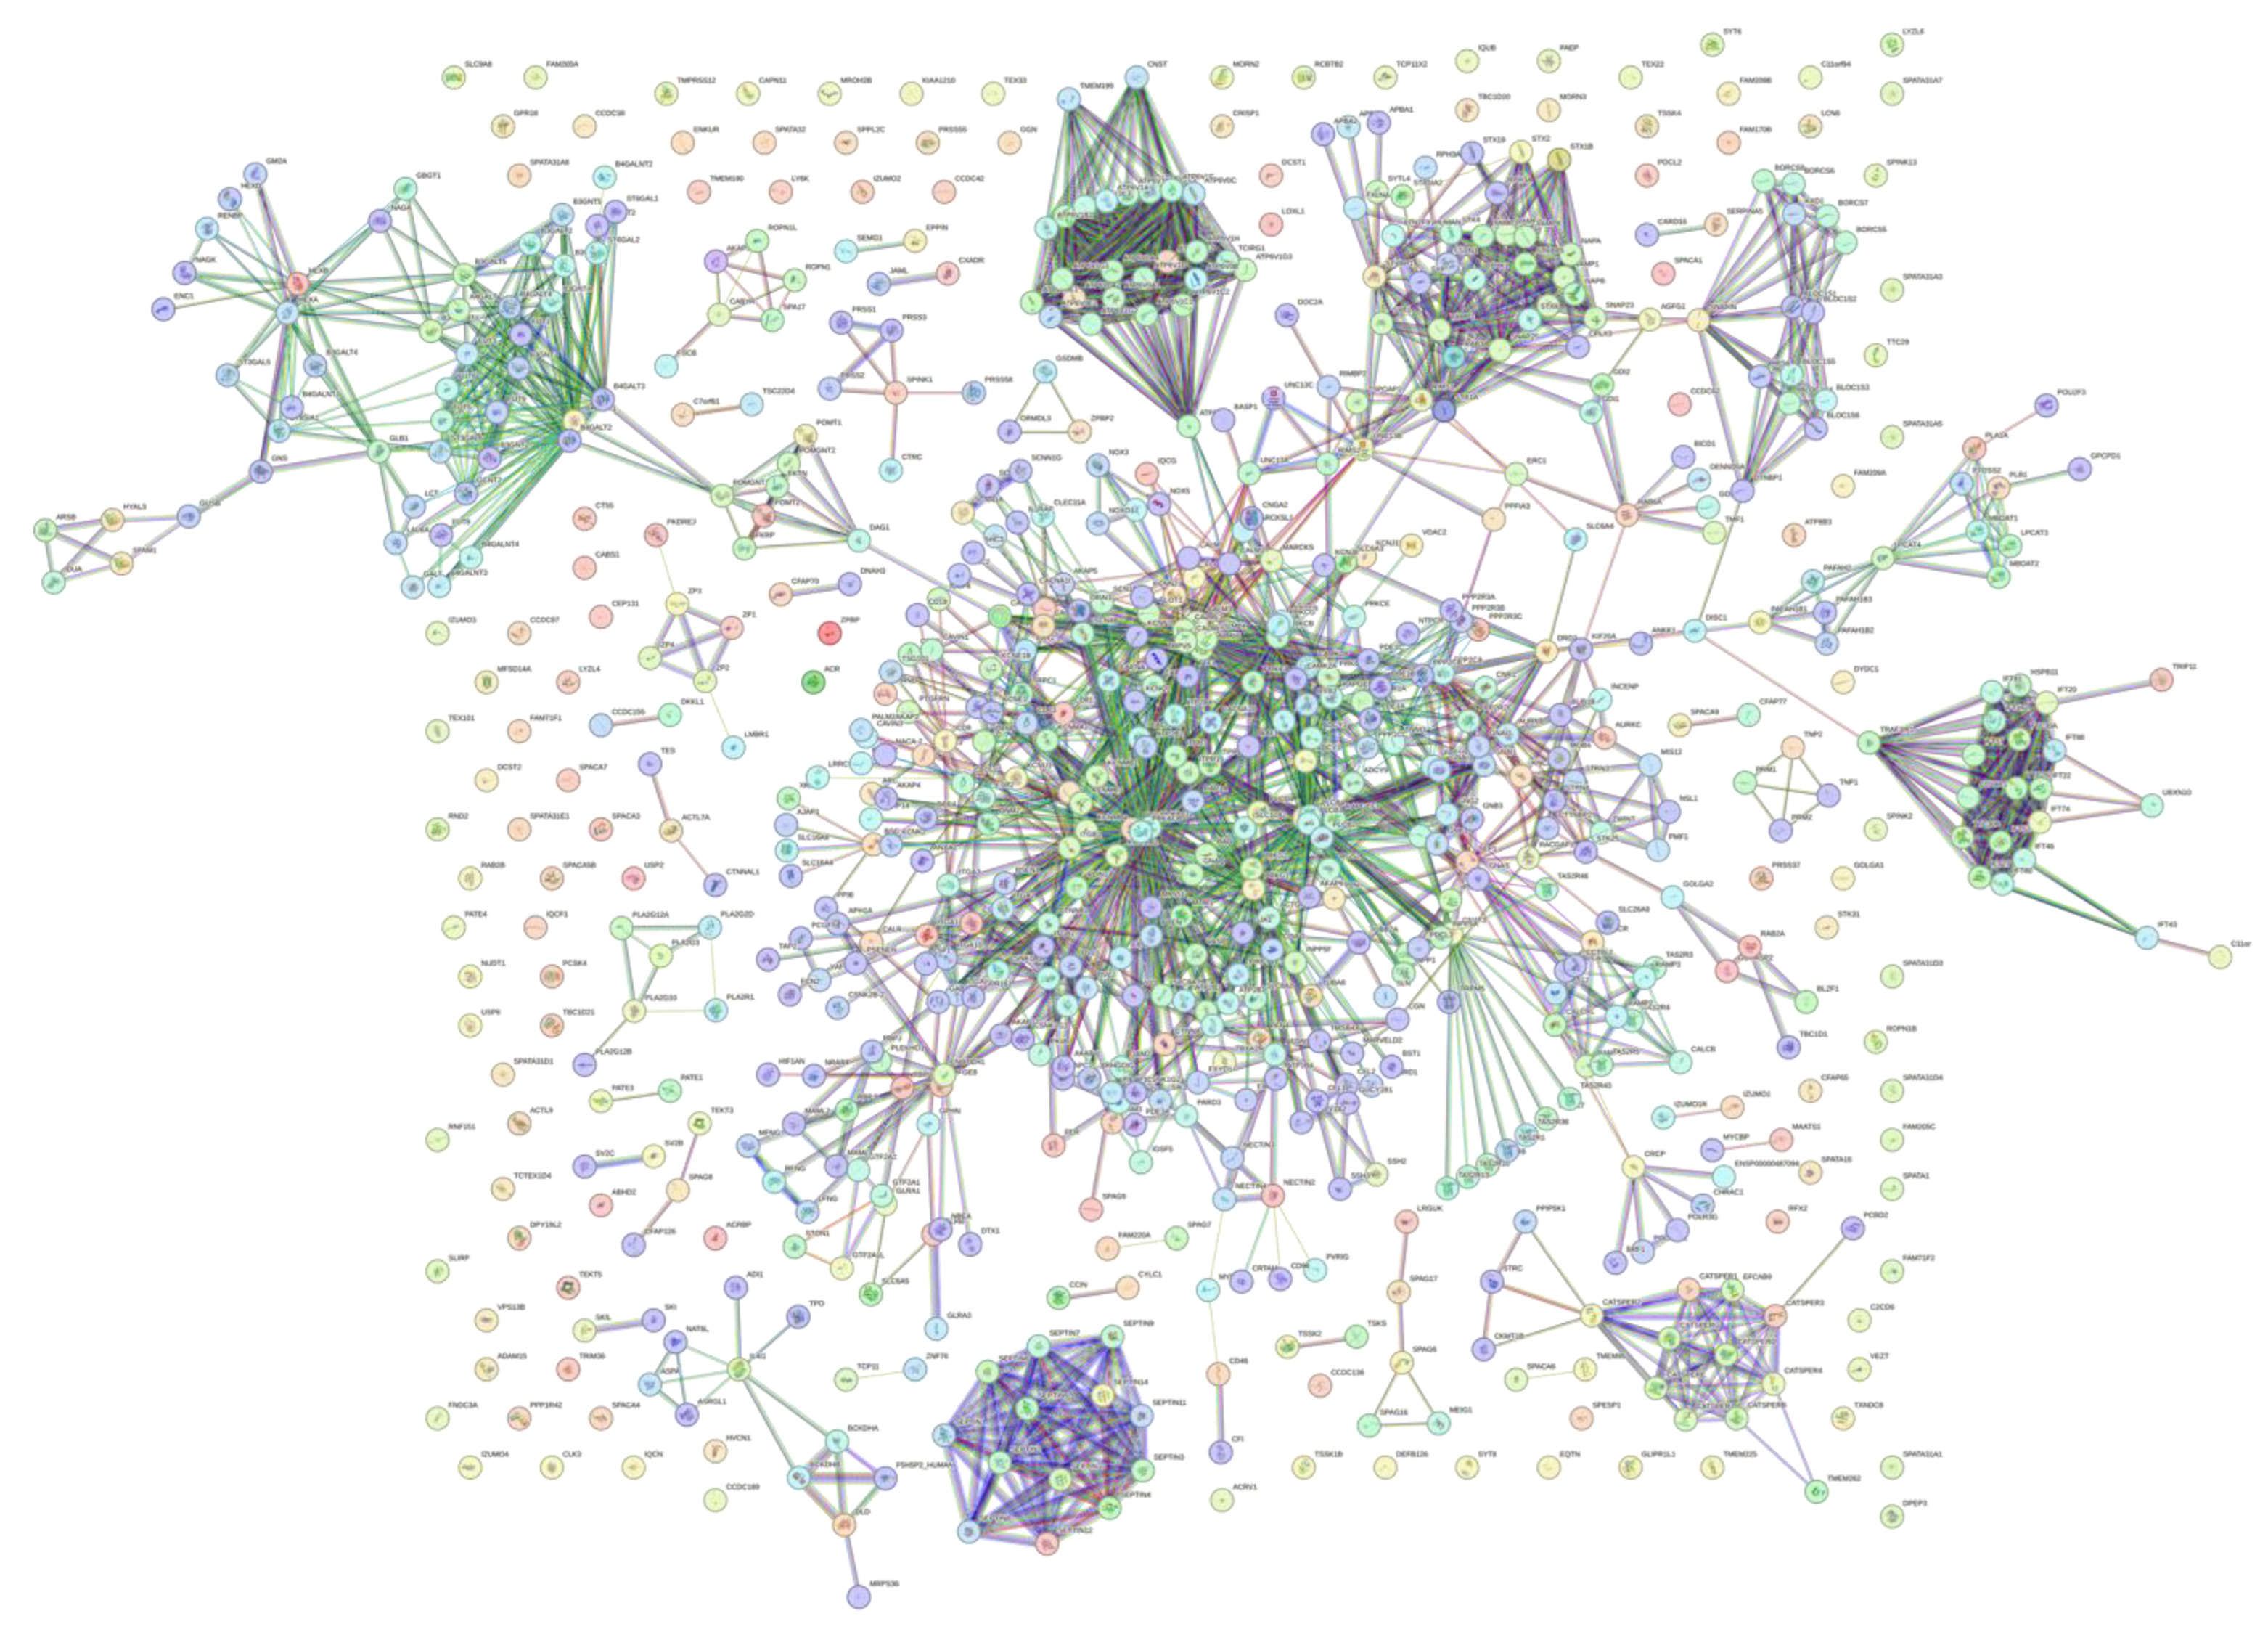
Figure 13.
Global PPI network at a 0.9 confidence interval. STRING-based analysis 245 human acrosomal proteins with the 500 highest interacting proteins. The highest confidence was selected to see the most accurate interactions.
Figure 13.
Global PPI network at a 0.9 confidence interval. STRING-based analysis 245 human acrosomal proteins with the 500 highest interacting proteins. The highest confidence was selected to see the most accurate interactions.
Figure 14.
Global PPI network at a 0.15 confidence interval. STRING-based analysis 245 human acrosomal proteins with the 500 highest interacting proteins. The highest confidence was selected to see the most inclusive interactions.
Figure 14.
Global PPI network at a 0.15 confidence interval. STRING-based analysis 245 human acrosomal proteins with the 500 highest interacting proteins. The highest confidence was selected to see the most inclusive interactions.
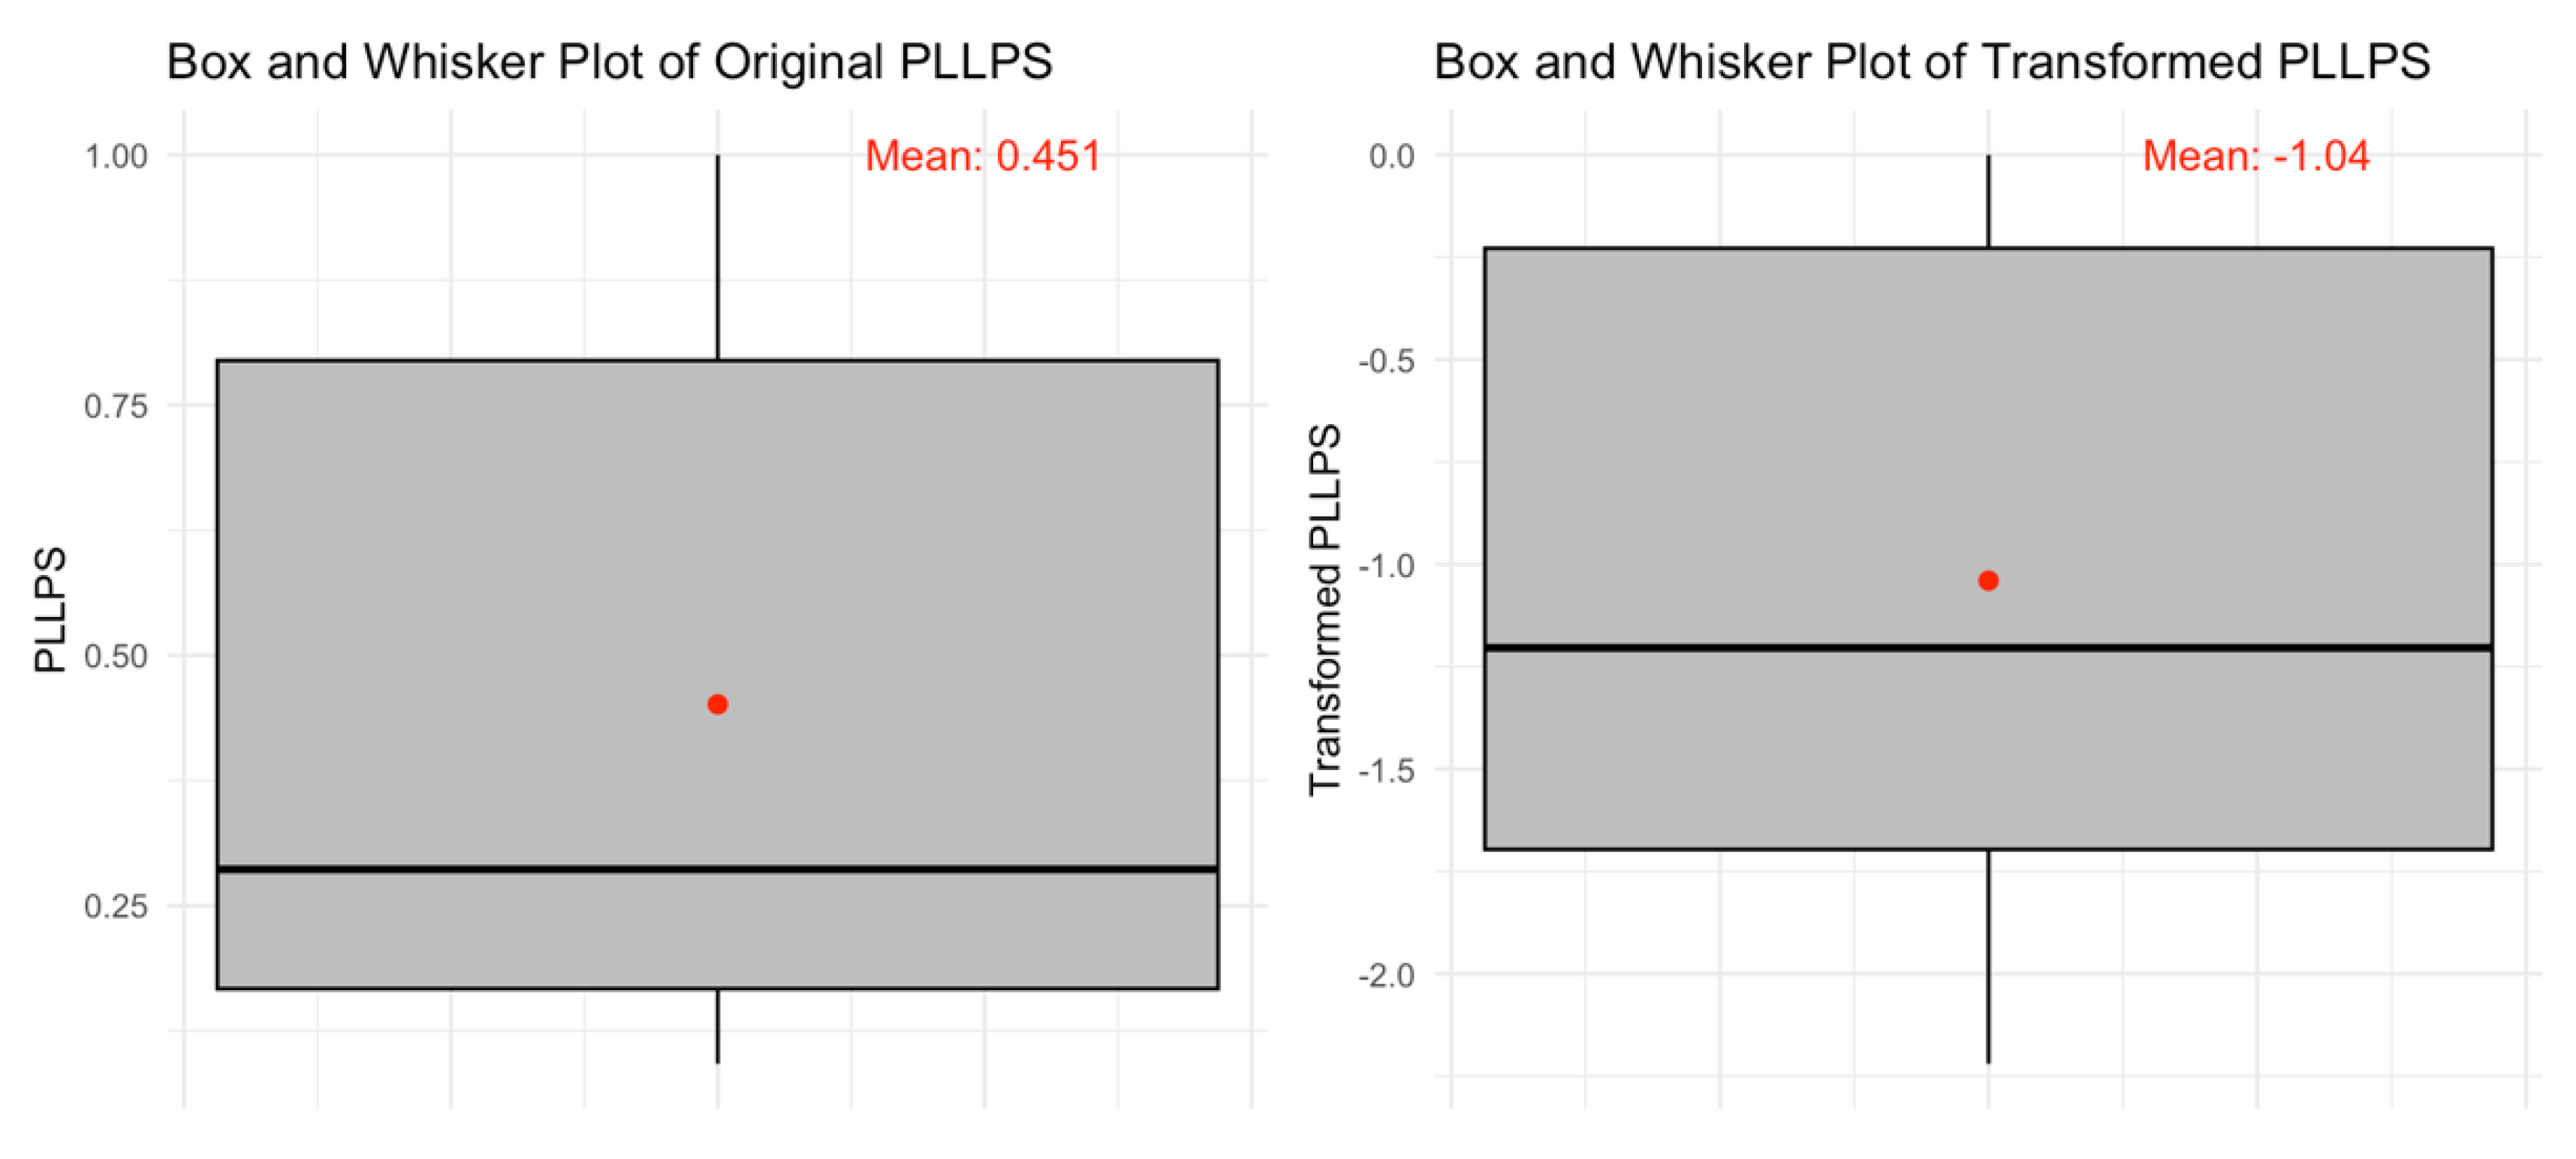
Figure 15.
Box and Whisker Plots of Original and Transformed PLLPS. The left panel shows the distribution of original PLLPS values, with a mean of 0.451 (red point). The right panel presents the transformed PLLPS values, with a mean of -1.04 (red point). The transformation adjusts the scale and distribution while preserving the overall trend. Black lines indicate the medians, and whiskers represent the range of data within 1.5 times the interquartile range.
Figure 16.
Relationship between AVG_PPDR_3 and Transformed PLLPS. The scatter plot illustrates the relationship between the average PPDR of three models (x-axis) and transformed PLLPS (y-axis). A fitted regression line with a 95% confidence interval (shaded region) shows a significant relationship. The model explains 64.9% of the variance (R² = 0.649) and is highly significant (p-value < 0.0001).
Figure 17.
Functional disorder analysis of myristoylated alanine-rich C-kinase substrate (MARCKS) UniProt ID: P29966. (A) Intrinsic disorder profile generated by RIDAO. (B) functional disorder profile generated by D2P2. (C) PPI network of MARCKS at 0.4 confidence interval.
Figure 17.
Functional disorder analysis of myristoylated alanine-rich C-kinase substrate (MARCKS) UniProt ID: P29966. (A) Intrinsic disorder profile generated by RIDAO. (B) functional disorder profile generated by D2P2. (C) PPI network of MARCKS at 0.4 confidence interval.
Figure 18.
Functional disorder analysis of nuclear transition protein 2 (TNP2) UniProt ID: Q05952. (A) Intrinsic disorder profile generated by RIDAO. (B) functional disorder profile generated by D2P2. (C) PPI network of TNP2 at a 0.4 confidence interval.
Figure 18.
Functional disorder analysis of nuclear transition protein 2 (TNP2) UniProt ID: Q05952. (A) Intrinsic disorder profile generated by RIDAO. (B) functional disorder profile generated by D2P2. (C) PPI network of TNP2 at a 0.4 confidence interval.
Figure 19.
Functional disorder analysis of Centrosomal protein of 131 kDA (CEP 131). UniProt ID: (Q9UPN4) (A) Intrinsic disorder profile generated by RIDAO. (B) functional disorder profile generated by D2P2. (C) PPI network of CEP 131 at a 0.4 confidence interval.
Figure 19.
Functional disorder analysis of Centrosomal protein of 131 kDA (CEP 131). UniProt ID: (Q9UPN4) (A) Intrinsic disorder profile generated by RIDAO. (B) functional disorder profile generated by D2P2. (C) PPI network of CEP 131 at a 0.4 confidence interval.
Figure 20.
Functional disorder analysis of Cylicin-1(CYLC1); Uniprot ID: P35663. (A) Intrinsic disorder profile generated by RIDAO. (B) functional disorder profile generated by D2P2. (C) PPI network of CYLC1 at a 0.4 confidence interval.
Figure 20.
Functional disorder analysis of Cylicin-1(CYLC1); Uniprot ID: P35663. (A) Intrinsic disorder profile generated by RIDAO. (B) functional disorder profile generated by D2P2. (C) PPI network of CYLC1 at a 0.4 confidence interval.
Figure 21.
Functional disorder analysis of Coiled-coil domain-containing protein 136 (CCDC136); UniProt ID: Q96JN2. (A) Intrinsic disorder profile generated by RIDAO. (B) functional disorder profile generated by D2P2. (C) PPI network of CCDC136 at a 0.4 confidence interval.
Figure 21.
Functional disorder analysis of Coiled-coil domain-containing protein 136 (CCDC136); UniProt ID: Q96JN2. (A) Intrinsic disorder profile generated by RIDAO. (B) functional disorder profile generated by D2P2. (C) PPI network of CCDC136 at a 0.4 confidence interval.
Table 1.
Summary Statistics for ADS and PPIDR Across PONDR® VXLT, PONDR® VSL2B, and PONDR® VL3 Models. The table presents the minimum, mean, median, and maximum values for ADS (Average Disorder Score) and PPIDR (Percent Predicted Intrinsically Disordered Residues) for three disorder prediction models: PONDR® VXLT, PONDR® VSL2B, and PONDR® VL3.
| |
PONDR® VXLT |
PONDR® VSL2B |
PONDR® VL3 |
| |
ADS |
PPIDR |
ADS |
PPIDR |
ADS |
PPIDR |
| Minimum |
0.0602 |
0.79 |
0.1755 |
4.79 |
0.0995 |
0 |
| Mean |
0.3435 |
32.09 |
0.4582 |
40.83 |
0.3999 |
33.37 |
| Median |
0.3177 |
28.88 |
0.4141 |
34.04 |
0.3693 |
27.14 |
| Maximum |
0.8295 |
90.96 |
0.9907 |
100 |
0.9240 |
100 |
Table 2.
SCOP Superfamilies Affected by Disorder and Associated Proteins. The table lists SCOP superfamilies impacted by intrinsic disorder, including the total number of residues affected and the corresponding associated proteins. This highlights the overlap between structural disorder and SCOP domain regions.
| Superfamily |
Disordered Residues (n) |
Proteins Affected (UniProt IDs) |
| ARM repeat |
17 |
Q7Z745 |
| Actin-like ATPase domain |
2 |
Q9Y615 |
| Ankyrin repeat |
23 |
P46531 |
| C-terminal domain of PLC-beta |
40 |
Q9NQ66 |
| C2 domain (Calcium/lipid-binding domain, CaLB) |
14 |
O14795 |
| CAD & PB1 domains |
15 |
P19878 |
| CATH |
1 |
P17612 |
| Calpain large subunit, middle domain (domain III) |
3 |
Q9UMQ6 |
| Concanavalin A-like lectins/glucanases |
40 |
P27797, Q9NQ86 |
| Cysteine proteinases |
13 |
O75604 |
| Cysteine-rich domain |
4 |
Q9H0H5 |
| Dimerization-anchoring domain of cAMP-dependent PK regulatory subunit |
4 |
Q9BZX4 |
| EF-hand |
1 |
Q9NQ66 |
| FAD-linked reductases, C-terminal domain |
1 |
Q96RQ9 |
| FAD/NAD(P)-binding domain |
3 |
Q96RQ9 |
| FYVE/PHD zinc finger |
36 |
Q86UR5 |
| Family A G protein-coupled receptor-like |
5 |
P14416, P21731 |
| Fibronectin type III |
23 |
Q9Y2H6 |
| Growth factor receptor domain |
6 |
Q6UW60 |
| HRDC-like |
17 |
O75575 |
| Immunoglobulin |
3 |
P35613, Q92692 |
| Integrin domains |
4 |
P56199 |
| MIR domain |
5 |
Q9UKY4, Q9Y6A1 |
| Neurotransmitter-gated ion-channel transmembrane pore |
40 |
P23415, P48167 |
| Nucleotide cyclase |
10 |
O60266 |
| Nucleotide-diphospho-sugar transferases |
12 |
P15291 |
| P-domain of calnexin/calreticulin |
70 |
P27797 |
| P-loop containing nucleoside triphosphate hydrolases |
9 |
P20340 |
| PDZ domain-like |
10 |
Q86UR5 |
| PLC-like phosphodiesterases |
111 |
Q9BRC7, Q9NQ66 |
| Phospholipase A2, PLA2 |
15 |
Q9NZ20 |
| Protein kinase-like (PK-like) |
31 |
Q13976, Q9UQB9 |
| Rhodanese/Cell cycle control phosphatase |
7 |
P40818 |
| SGNH hydrolase |
6 |
Q6P1J6 |
| SH3-domain |
24 |
P19878 |
| Sec1/munc18-like (SM) proteins |
17 |
P61764 |
| Serpins |
5 |
P05154 |
| Subtilisin-like |
11 |
Q6UW60 |
| Thioredoxin-like |
4 |
Q8N4E4 |
| Transcription factor IIA (TFIIA), beta-barrel domain |
6 |
Q9UNN4 |
| Trypsin-like serine proteases |
11 |
Q6UWB4 |
| Tubulin C-terminal domain-like |
5 |
Q9NY65 |
| USP8 N-terminal domain-like |
20 |
P40818 |
| WD40 repeat-like |
10 |
P43034 |
| Ypt/Rab-GAP domain of gyp1p |
8 |
Q96BZ9 |
| alpha-catenin/vinculin-like |
10 |
P35221 |
| t-snare proteins |
73 |
P32856, P61266, Q16623 |
Table 3.
Enriched Gene Ontology (GO) Terms for Disorder-Affected Proteins. The table lists enriched GO terms across Molecular Function (GO:MF), Biological Process (GO:BP), and Cellular Component (GO:CC) categories. Each row includes the GO Term ID, name, and the adjusted p-value (p_adj), indicating the statistical significance of enrichment. Notably, terms such as "acrosomal vesicle" (GO:0001669, p_adj = 5.395×10⁻³⁸) highlight the functional relevance of intrinsic disorder in reproductive and cellular processes.
| Source |
Term ID |
Term Name |
p_adj (query) |
| GO:MF |
GO:0019899 |
enzyme binding |
7.900×10⁻⁴
|
| |
GO:0000149 |
SNARE binding |
1.876×10⁻³
|
| |
GO:0016934 |
extracellularly glycine-gated chloride channel ... |
1.430×10⁻²
|
| |
GO:0043169 |
cation binding |
4.442×10⁻²
|
| |
GO:0005484 |
SNAP receptor activity |
4.490×10⁻²
|
| |
GO:0004620 |
phospholipase activity |
4.815×10⁻²
|
| GO:BP |
GO:0003006 |
developmental process involved in reproduction |
3.127×10⁻¹¹
|
| |
GO:0010807 |
regulation of synaptic vesicle priming |
1.386×10⁻⁶
|
| |
GO:0065008 |
regulation of biological quality |
9.343×10⁻⁶
|
| |
GO:0099170 |
postsynaptic modulation of chemical synaptic t... |
6.720×10⁻⁴
|
| |
GO:0007405 |
neuroblast proliferation |
1.993×10⁻³
|
| |
GO:0048870 |
cell motility |
5.806×10⁻³
|
| |
GO:0000910 |
cytokinesis |
7.271×10⁻³
|
| |
GO:0045787 |
positive regulation of cell cycle |
2.231×10⁻²
|
| |
GO:0031175 |
neuron projection development |
2.257×10⁻²
|
| |
GO:1904100 |
positive regulation of protein O-linked glycosyl... |
2.547×10⁻²
|
| |
GO:0010560 |
positive regulation of glycoprotein biosynthet... |
3.189×10⁻²
|
| GO:CC |
GO:0001669 |
acrosomal vesicle |
5.395×10-38
|
| |
GO:0098590 |
plasma membrane region |
1.175×10⁻⁶
|
| |
GO:0042995 |
cell projection |
1.406×10⁻⁶
|
| |
GO:0005915 |
zonula adherens |
3.998×10⁻²
|
Table 4.
LLPS Propensity Summary. Summary of descriptive statistics for the LLPS propensity of proteins, including measures of central tendency (mean and median), variability (standard deviation), and distribution (minimum, maximum, and quartiles).
Table 4.
LLPS Propensity Summary. Summary of descriptive statistics for the LLPS propensity of proteins, including measures of central tendency (mean and median), variability (standard deviation), and distribution (minimum, maximum, and quartiles).
| Statistic |
LLPS Propensity Statistics |
| Count (N) |
250 |
| Mean (x̄) |
0.451146 |
| Std. Deviation (σ) |
0.33337186 |
| Minimum (xmin) |
0.0922 |
| First Quartile (Q1)) |
0.166975 |
| Median (Q2) |
0.28645 |
| Third Quartile (Q3) |
0.7946 |
| Maximum (xmax) |
1 |