Preprint
Article

Effects of a Ketogenic Diet Combined with Aerobic Exercise on Muscle Fiber Types and Exercise Capacity in Tail-Suspended Mice

This version is not peer-reviewed.

Submitted:

14 January 2025

Posted:

15 January 2025

You are already at the latest version

Abstract

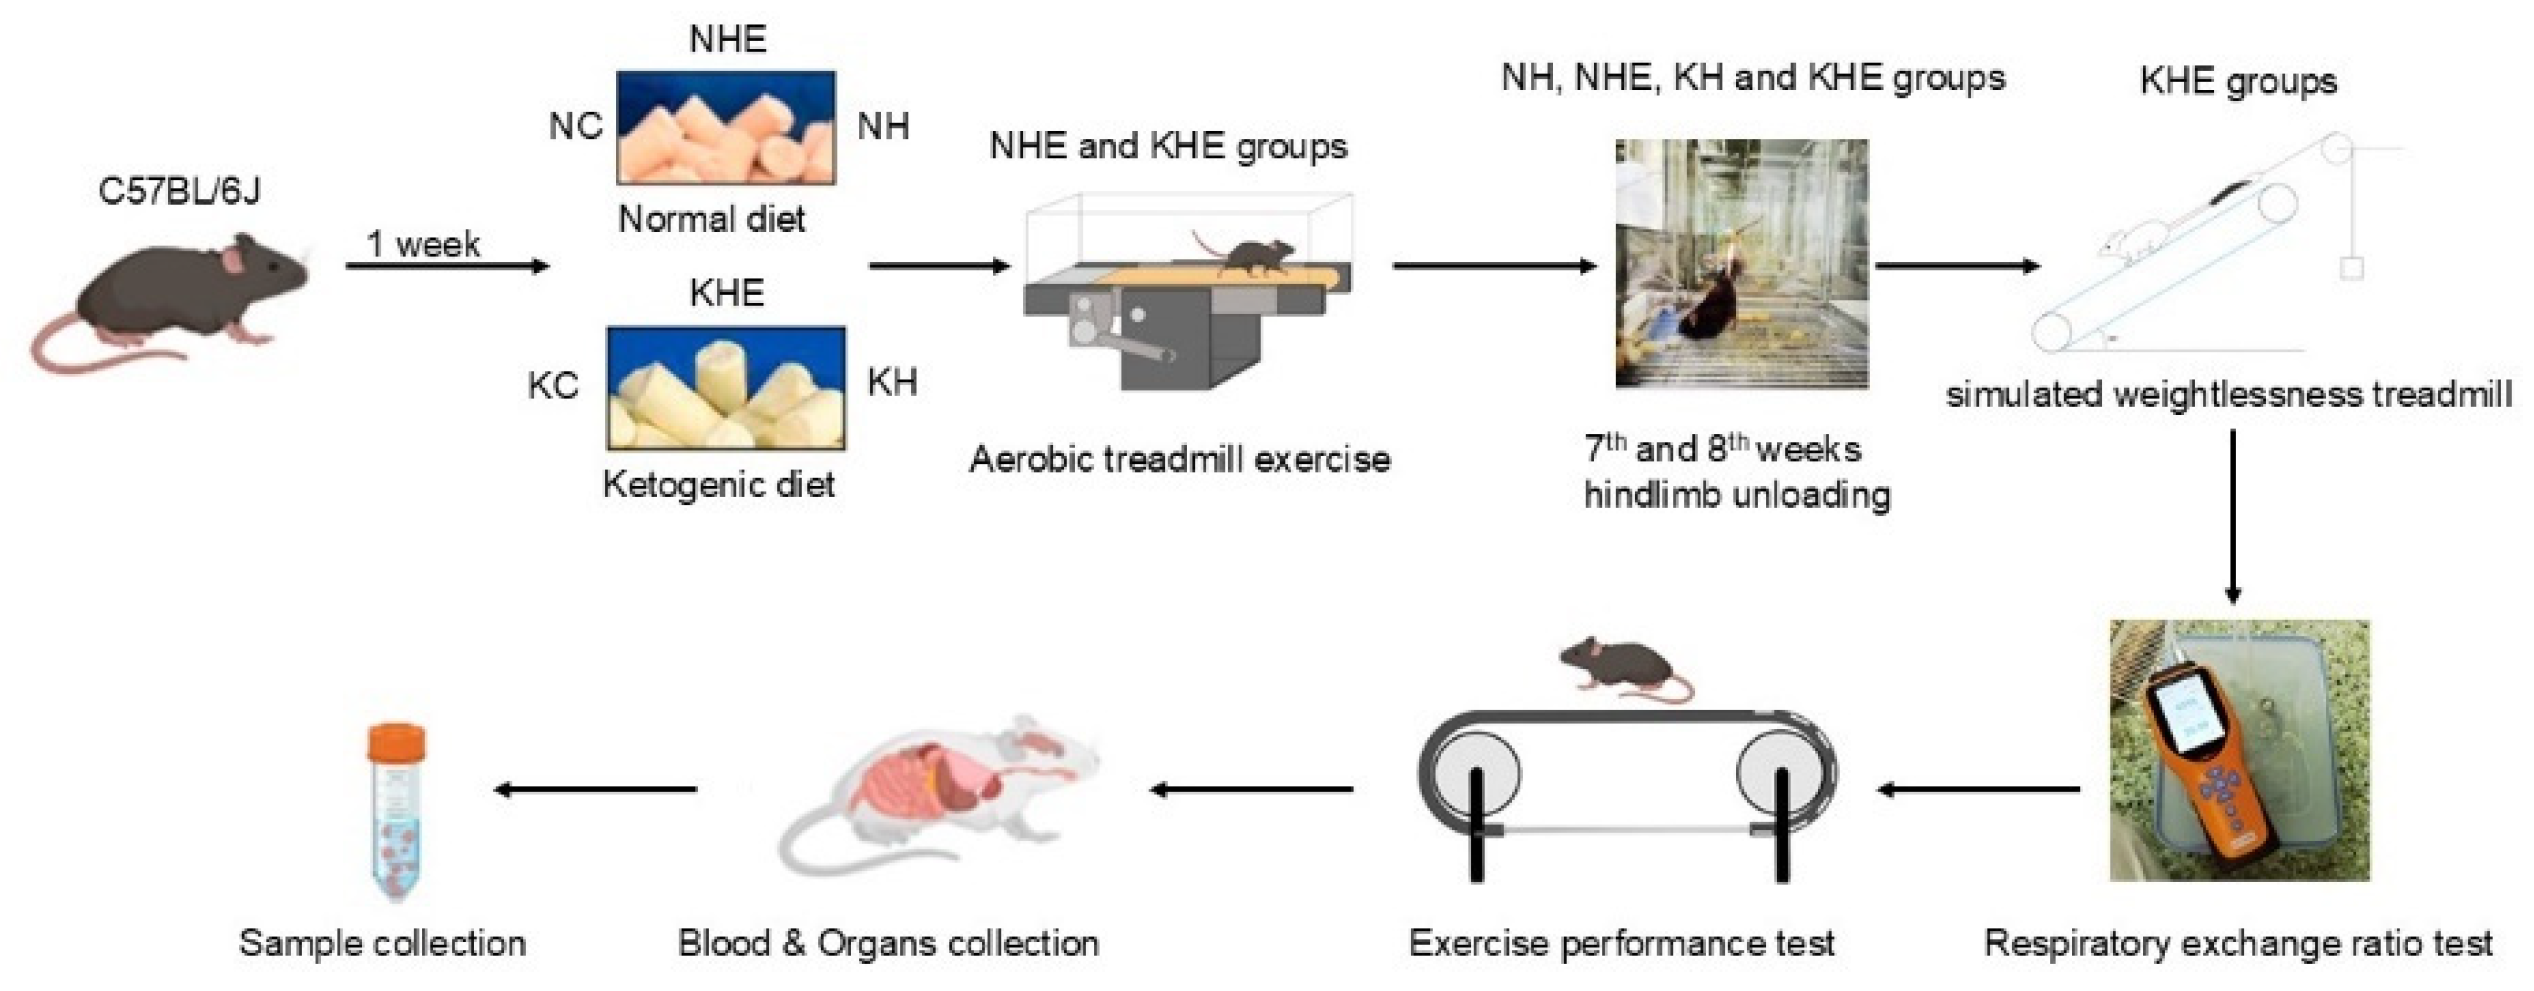
Objective: To investigate the effects of an 8-week ketogenic diet combined with aero-bic exercise on muscle fiber composition and exercise capacity in mice subjected to simulated microgravity. Methods: Seven-week-old male C57BL/6J mice were randomly assigned to six groups: normal diet (NC), ketogenic diet (KC), normal diet + tail sus-pension (NH), ketogenic diet + tail suspension (KH), normal diet + tail suspension + exercise (NHE), and ketogenic diet + tail suspension + exercise (KHE). During the final two weeks of the intervention, a tail suspension model was employed to simulate mi-crogravity in the tail suspension groups, while the exercise groups performed moder-ate-intensity aerobic exercise. The exercise protocol involved running at 12 m/min for 60 minutes per day, 6 days per week, over the course of 8 weeks. Weekly measure-ments included body weight, blood ketones, and blood glucose concentrations. Respir-atory metabolic rates were assessed before and after tail suspension. Following the in-tervention, all mice underwent a forced exercise test. Blood was collected via the or-bital sinus immediately after the test, and the bilateral soleus muscles were quickly ex-cised. Biochemical analysis was performed to assess blood markers, and Western blot-ting and RT-PCR were used to examine changes in protein and gene expression in skeletal muscle. Additionally, Oil Red O and PAS staining were utilized to evaluate li-pid deposition and glycogen content in the muscles. Immunofluorescence staining was employed to analyze the distribution of MHC muscle fibers in skeletal muscle. Results: Mice in the tail suspension model exhibited weight loss, muscle atrophy, shifts in muscle fiber type, and decreased endurance. However, the combined intervention of a ketogenic diet and aerobic exercise significantly reduced markers of muscle atrophy, enhanced the expression of proteins and genes related to fat metabolism, increased the proportion of MHC-I muscle fibers in the soleus muscle, and decreased the proportion of MHC-IIb fibers. This combined intervention, which primarily utilizes ketone body metabolism, significantly enhanced fat metabolism, thereby improving exercise capac-ity in the mice. Conclusion: The combined intervention of a ketogenic diet and aerobic exercise effectively mitigated muscle atrophy in mice subjected to simulated micro-gravity, enhanced the expression of fat metabolism-related genes in skeletal muscles, and inhibited the transition from slow-twitch to fast-twitch muscle fibers, ultimately improving the exercise capacity of the mice.

Keywords: 
;  ;  ;  

1. Introduction

In recent years, with the advancement of space exploration and long-term microgravity research, sports scientists have increasingly focused on the effects of weightlessness on muscles and bones. Studies have shown that weightlessness can lead to alterations in the structure and function of skeletal muscles, particularly anti-gravity muscles, including muscle atrophy, changes in muscle fiber types, and reduced motor function [1], which can further impair overall health. Consequently, the development of effective interventions to mitigate or reverse the adverse effects of weightlessness on muscles has become a key area of focus in sports science research.
The ketogenic diet (KD) is characterized by high fat, moderate protein, and very low carbohydrate intake [2,3]. Ketone bodies, such as β-hydroxybutyrate (β-HB) and acetoacetate [4], serve as alternative energy sources for muscles, thereby enhancing muscle endurance and strength, which ultimately improves exercise performance [5,6]. Studies have indicated that a ketogenic diet may positively influence muscle adaptations, promoting muscle remodeling in response to metabolic stress. These changes may involve a shift in muscle fiber type, a process critical for enhancing muscle endurance and function [7]. For instance, Wallace et al. [8] demonstrated that a ketogenic diet significantly improved the muscle mass and function of 26-month-old aged mice. The reduction in the area of IIb muscle fibers and the concomitant increase in the area of IIa muscle fibers suggest that long-term ketogenic diet intervention can effectively alleviate muscular dystrophy, a muscle disorder linked to decreased muscle strength and aging. Similarly, Ogura et al. [9] confirmed this finding, showing that the ketogenic diet maintained muscle mass in sedentary mice and induced a transition in muscle heavy chain myosin (MyHC) from type IIb to type IIx fibers.
Studies have demonstrated that regular aerobic exercise can effectively mitigate muscle atrophy and induce metabolic changes in muscle cells, thereby enhancing exercise capacity [10]. Furthermore, multiple animal studies have shown that ketogenic diets administered for 5 weeks [11], 8 weeks [12], and 12 weeks [13] can improve endurance performance. However, there are currently no studies addressing the potential of combining exercise with nutritional support to combat muscle atrophy in a weightless environment, nor have such interventions been proposed as non-pharmacological strategies to restore muscle homeostasis. Notably, PGC-1α [14,15,16,17] is a key molecule in skeletal muscle that regulates oxidative metabolism, fatty acid oxidation, and the transition between fast and slow muscle fiber types. PGC-1α plays a critical role in systemic ketone body homeostasis, particularly during fasting, cold exposure, and intense exercise [18]. Additionally, PGC-1α promotes the adaptation of ketolytic capacity during long-term exercise training [18]. Research has shown that the FGF21-SIRT1-AMPK-PGC-1α signaling pathway facilitates muscle cell differentiation and the conversion of anaerobic muscle fibers to oxidative phenotypes [19], thereby improving muscle aerobic capacity. Studies have also indicated that both aerobic exercise and ketogenic diets can enhance PGC-1α expression in skeletal muscle. Based on these findings, it can be speculated that the combination of a ketogenic diet and aerobic exercise in a weightless environment may produce a synergistic effect on skeletal muscle adaptation. However, to date, no studies have examined the combined effects of a ketogenic diet and aerobic exercise in a weightless environment.
Based on the aforementioned background, we hypothesize that under simulated weightlessness conditions, the combination of a ketogenic diet and aerobic exercise will effectively enhance skeletal muscle mass and exercise capacity in mice. This effect may be mediated by the regulation of muscle fiber type and metabolic pathways. Through this study, we aim to elucidate the combined effects of a ketogenic diet and aerobic exercise on skeletal muscle adaptability and provide a novel theoretical foundation and practical guidance for future research in the fields of aerospace medicine, sports medicine, and nutrition. Therefore, this study intends to use 7-week-old C57BL/6J mice to investigate the effects of an 8-week ketogenic diet combined with aerobic exercise on skeletal muscle fiber type and exercise capacity in mice subjected to simulated weightlessness. The ultimate goal is to provide scientific evidence for the development of intervention strategies targeting weightlessness-induced muscle atrophy.

2. Materials and Methods

2.1. Animals and Diets

Seven-week-old C57BL/6J mice, weighing 20–25 g, were obtained from Beijing Vital River Laboratory Animal Technology Co., Ltd., and housed in the animal facility. The mice were grouped into cages with 4–5 animals per cage, with environmental conditions maintained at a temperature of 20–24°C, relative humidity of 45%–55%, and a 12-hour light/dark cycle. All experimental protocols were approved by the Ethics Committee of the Aerospace Medicine National Key Laboratory (approval number: ACC-IACUC-2021-010).
After a 1-week acclimatization period, the mice were randomly assigned to the following experimental groups: Normal Diet Control (NC, n = 8), Normal Diet + Hindlimb Unloading (NH, n = 12), Normal Diet + Hindlimb Unloading + Exercise (NHE, n = 14), Ketogenic Diet Control (KC, n = 8), Ketogenic Diet + Hindlimb Unloading (KH, n = 12), and Ketogenic Diet + Hindlimb Unloading + Exercise (KHE, n = 14). The normal diet group was fed a standard diet (AIN93G, Shanghai Puloteng Biotechnology Co., Ltd.), consisting of 7% fat, 17.8% protein, and 64.3% carbohydrate, providing 3.601 kcal/g. The ketogenic diet group received a ketogenic feed (TP-201450, Beijing BioPeak Biotechnology Co., Ltd.), consisting of 76.1% fat, 8.9% protein, and 3.5% carbohydrate, providing 4.056 kcal/g. All mice had ad libitum access to food and water. Mice were weighed every Sunday morning between 9:00 and 10:00 AM, followed by tail vein blood collection. Blood glucose and blood ketone concentrations were measured using Yuejia-type glucose/ketone test strips. A schematic overview of the experimental design is presented in Figure 1.

2.2. Simulated Weightlessness Model

For the final 2 weeks, mice in the NH, NHE, KH, and KHE groups underwent hindlimb unloading (HU) to establish a simulated microgravity model. The tail suspension method was employed, where a piece of medical adhesive tape was applied 2–3 cm from the tip of the mouse's tail to attach it to an iron chain, which was then suspended in a smooth-walled cage. This setup caused the hindlimbs to hang freely while the forelimbs remained on the ground, positioning the body at a 30° angle relative to the horizontal plane. Mice were housed individually in cages, allowing for free movement. The tail and blood flow were monitored regularly, and the suspension height was adjusted as necessary to maintain the optimal angle.

2.3. Training Protocols

The aerobic treadmill exercise intervention protocol was designed based on the experimental setup by Ma et al. [12]. Mice in the NHE and KHE groups underwent a 3-day adaptation period, during which they exercised on the treadmill at 5 m/min for 10 minutes per day, with a treadmill incline of 0°. During the formal training phase, the mice performed a 10-minute warm-up at 2 m/min, followed by 60 minutes of continuous exercise at 12 m/min. The exercise regimen involved 6 days of training per week over a duration of 8 weeks. In the final 2 weeks, the NHE and KHE groups underwent exercise intervention using a rat model of simulated microgravity on the treadmill, as developed by Wang et al. [20].

2.4. Respiratory Exchange Eatio Test

Before and after hindlimb unloading, respiratory metabolism was assessed in all mice using a GT-1000 pump-driven composite gas analyzer (Shenzhen Kerano Electronics Technology Co., Ltd., China). Mice were placed in activity chambers, where they were allowed to move freely. Measurements commenced once the mice reached a stable resting state and continued until the CO2 concentration approached 5000 ppm. During this period, changes in O2 and CO2 levels, as well as the test duration, were recorded. The resting respiratory exchange ratio (RER) was calculated using the following formula: RER = VCO2/VO2.

2.5. Assessment of Endurance Exercise Performance

Prior to the exercise capacity test, all mice underwent 1 week of acclimatization to treadmill exercise at 15 m/min for 10 minutes per day. The exercise capacity test was adapted from the study by Dougherty et al. [21] with minor modifications. The protocol was as follows: the initial speed was set to 14 m/min for 2 minutes, followed by 16 m/min for 3 minutes, 18 m/min for 25 minutes, 20 m/min for 15 minutes, 22 m/min for 15 minutes, 24 m/min for 15 minutes, and 26 m/min for 30 minutes. The test continued until exhaustion, which was defined by the following criteria: (1) the mouse could not maintain the current running speed; and (2) mechanical or electrical stimulation for more than 10 seconds could not induce further exercise [22].

2.6. Tissue Sampling

Immediately after the exercise endurance test, the mice were weighed and anesthetized with sodium pentobarbital. Blood was collected via the retro-orbital sinus, centrifuged to obtain serum, and stored at -20°C for future analysis. The left soleus muscle was excised, weighed to determine its wet muscle mass, and placed in a cryovial. It was then preserved in liquid nitrogen before being transferred to an ultralow freezer at -80°C for storage. The right soleus muscle was embedded in optimal cutting temperature (OCT) compound, rapidly frozen in liquid nitrogen, and stored for subsequent sectioning and staining.

2.7. Plasma Biochemical Assessment

Serum levels of triglycerides (TG), total cholesterol (TC), high-density lipoprotein cholesterol (HDL-C), low-density lipoprotein cholesterol (LDL-C), insulin, creatine kinase (CK), lactate dehydrogenase (LDH), blood urea nitrogen (UREA), and blood lactate (BLA) were measured using an automated biochemical analyzer (Huake Bio, China). All procedures were conducted in strict accordance with the manufacturer's instructions provided by the reagent kits (Nanjing Jiancheng Bioengineering Institute, China).

2.8. Oil Red O Staining

The OCT-embedded tissue samples were retrieved from liquid nitrogen and sectioned to a thickness of 8 µm using a cryostat (Leica, Wetzlar, Germany). The sections were mounted onto slides, with six sections per tissue sample, and placed in a slide box. The slides were stored at -20°C until further use. Lipid staining was performed following the instructions provided by the Oil Red O Staining Kit (Beijing Solarbio Science & Technology Co., Ltd.). Tissue sections were initially washed in 60% isopropanol for 2 minutes, followed by staining with the Oil Red O working solution for 2-5 minutes. After staining, the sections were rapidly differentiated in 60% isopropanol and washed with distilled water. Subsequently, the sections were counterstained with hematoxylin for 30 seconds, differentiated with acid alcohol for 1-5 seconds, and rinsed under running water until a blue color was achieved. Finally, the sections were mounted with glycerol gelatin and observed under a light microscope, with images captured.

2.9. Periodic Acid-Schiff (PAS) Staining

The prepared frozen sections were retrieved and sequentially stained with periodic acid, Schiff's reagent, and hematoxylin, in accordance with the instructions provided in the Periodic Acid-Schiff (PAS) Staining Kit (Beijing Solarbio Science & Technology Co., Ltd.). Following washing and dehydration, the sections were mounted with neutral gum. The tissue sections were observed under an optical microscope, and images were captured and saved.

2.10. Western Blotting

Total protein was extracted from soleus muscle tissue using RIPA lysis buffer, and the protein concentration was determined using the BCA assay. Equal amounts of protein were loaded onto the gel, followed by conventional gel preparation, loading, electrophoresis, and membrane transfer. The membrane was blocked with 5% BSA at room temperature and then incubated overnight with primary antibodies against MURF-1 (1:8000, Proteintech, 55456-1-AP), PGC-1α (1:1000, Abcam, ab54481), SIRT1 (1:2000, Abcam, ab110304), FGF21 (1:1000, Abcam, ab171941), OXCT (1:2000, Abcam, ab105320), HADH (1:1000, Huabio, R1411-4), CPT-1b (1:2000, Abcam, ab134988), and GAPDH (1:8000, Gene-protein Link, P01L01, ) at 4°C with gentle shaking. The following day, the membrane was washed three times with 1×TBST for 10-minute intervals, incubated with a secondary antibody (1:2000, ZSGB-BIO) at room temperature for 2 hours, washed again with 1×TBST, and exposed to ECL luminescent solution for detection. The protein gray values were analyzed using ImageJ software, with GAPDH serving as the internal reference. The relative expression level of the target protein was calculated as the ratio of the gray value of the target protein to that of GAPDH.

2.11. Quantitative Real-Time Polymerase Chain Reaction

Weigh 10 mg of soleus muscle tissue and add 1 mL of TRIzol reagent (Invitrogen, USA) to homogenize the sample. After separating the supernatant, add 200 µL of chloroform and mix thoroughly. Allow the mixture to stand at room temperature for 5 minutes, then centrifuge at 12,000 rpm at 4°C for 10 minutes to collect the aqueous phase. Add 500 µL of isopropanol and mix gently, then let the mixture stand at room temperature for 10 minutes. Centrifuge again at 12,000 rpm at 4°C for 10 minutes, discard the supernatant, and wash the RNA pellet with 1 mL of pre-cooled 75% ethanol. Centrifuge at 7,500 rpm at 4°C for 5 minutes, remove the supernatant, and allow the pellet to air-dry for 15 minutes to remove residual ethanol. Add an appropriate volume of DEPC-treated water to fully dissolve the RNA pellet and measure the RNA concentration. Genomic DNA was removed using the Master Mix Kit (Takara, RR047A), and RNA was reverse transcribed using the same kit. Quantitative RT-PCR was performed using TB-Green Premix Ex Tag (Takara, RR420A). The 18S rRNA gene was used as the internal reference, and relative mRNA expression was calculated using the 2−ΔΔCt method. The RT-PCR primers used in this study are listed in Table 1.

2.12. Histological Staining

For staining, the cryosections were blocked with 3% bovine serum albumin (BSA) in DPBS for 1 hour at room temperature, followed by incubation overnight at 4°C with a cocktail of primary antibodies, including MyHC I (BA-D5, DSHB, Iowa City, IA, USA), MyHC IIa (SC-71, DSHB), MyHC IIb (BF-F3, DSHB), and Laminin (ab11575, Abcam, Cambridge, UK). After washing, the cryosections were incubated with a cocktail of secondary antibodies, including Alexa Fluor 647-conjugated goat anti-mouse IgG2b (A21242), Alexa Fluor 568-conjugated goat anti-mouse IgG1 (A21124), Alexa Fluor 488-conjugated goat anti-mouse IgM (A21042), and Alexa Fluor 405-conjugated goat anti-rabbit IgG (A31556) (Thermo Fisher Scientific, Waltham, MA, USA), for 1 hour at room temperature. Images of the cryosections were acquired using a Leica Thunder Imager 3D Assay (Leica Application Suite X (LAS X) 3.6.0; Leica) and analyzed with ImageJ software.

2.13. Statistical Analysis

Statistical analysis was performed via GraphPad Prism 10.0 and SPSS 22.0 software. The experimental results are presented as the means ± standard deviations (means ± SD). After confirming a normal distribution, one-way analysis of variance (ANOVA) was employed for statistical analysis, with pairwise comparisons conducted via the least significant difference (LSD) method, and post hoc tests were performed via Duncan's multiple range test. A value of P < 0.05 was considered statistically significant.

3. Results

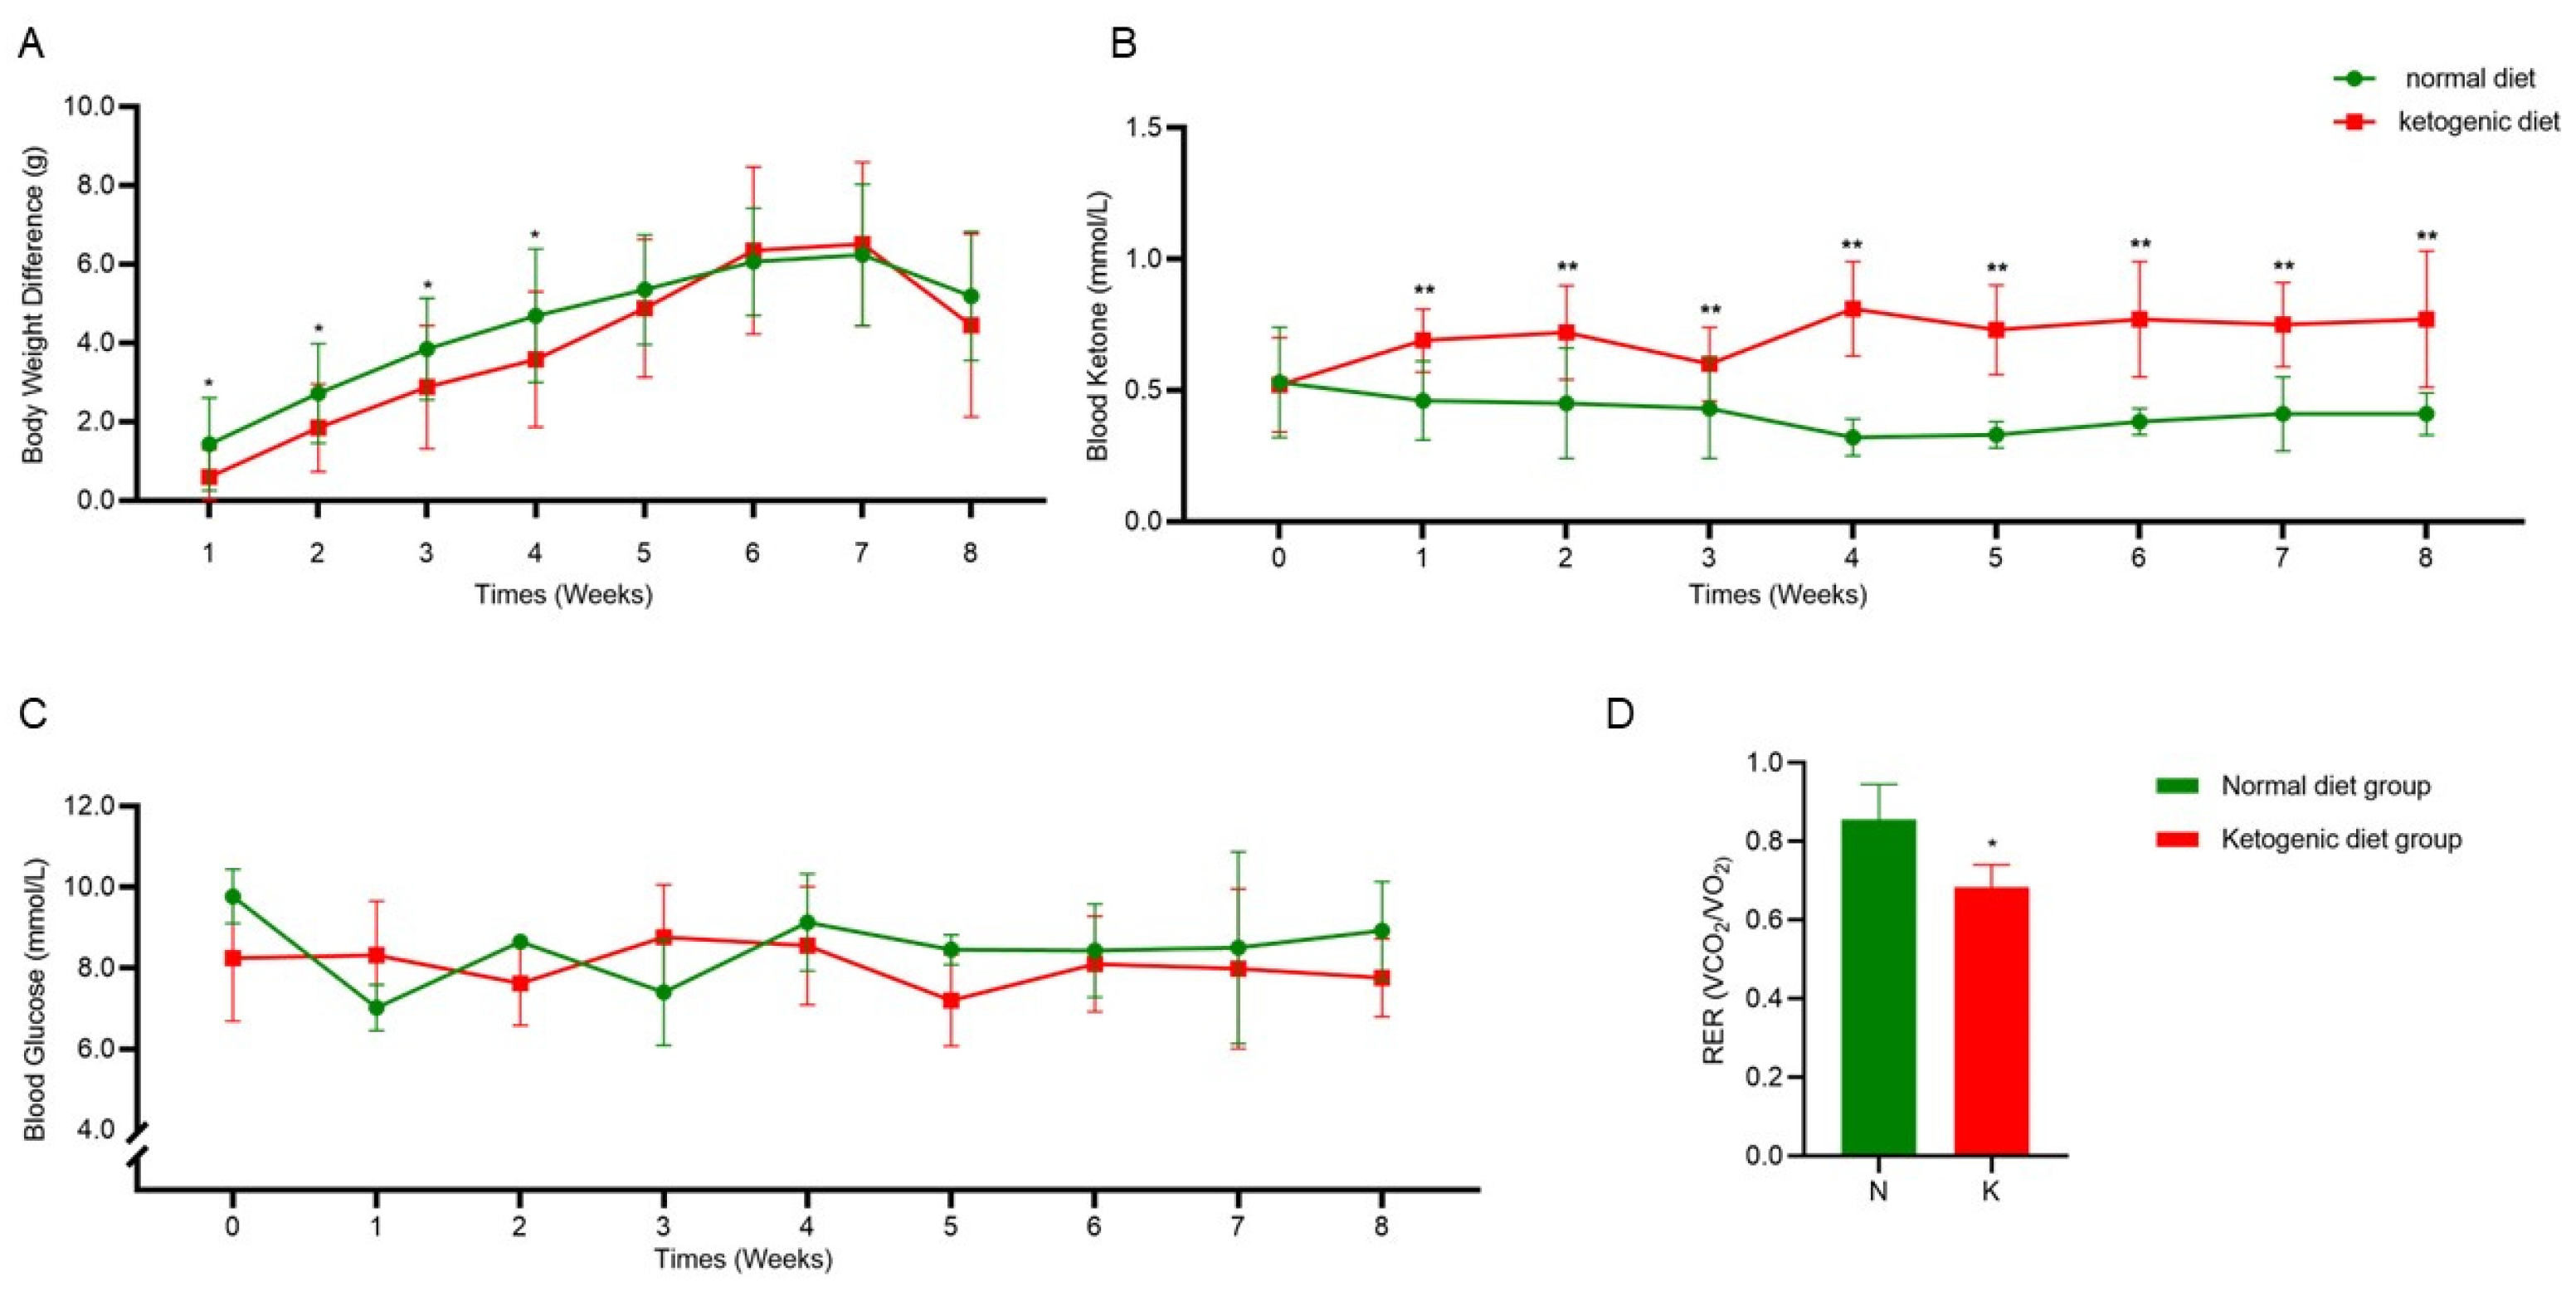
3.1. Establishment of the Ketogenic Diet Model

As shown in Figure 2A, the weight difference among the mice from all groups gradually increased with age. During the first 4 weeks, the weight gain in the KD group was significantly lower than that in the normal control (NC) group (p < 0.05). However, after week 5, no significant changes in the weight difference were observed between the dietary groups. Figure 2B demonstrates that, compared to the NC group, the ketone levels in the KD group were significantly higher from week 1 to week 8 (0.73 ± 0.06 mmol/L, p < 0.01), while blood glucose levels remained unchanged (Figure 2C). Research indicates that when ketone levels reach 0.5 - 3.0 mmol/L, the body is considered to be in a state of nutritional ketosis [23]. The RER, which represents the ratio of carbon dioxide produced to oxygen consumed during metabolism, reflects the balance between fat and carbohydrate metabolism. As seen in Figure 2D, the RER in the KD group was significantly lower than that in the NC group (p < 0.05), maintaining a value around 0.7. Studies suggest that an RER value between 0.7 and 1.0 indicates a mixed utilization of fat and carbohydrates for energy [24]. These results suggest that short-term ketogenic diet intervention in mice significantly reduces weight gain, increases ketone production, enhances the process of ketone body generation from fat breakdown, and lowers the RER, indicating successful establishment of the ketogenic diet mouse model.

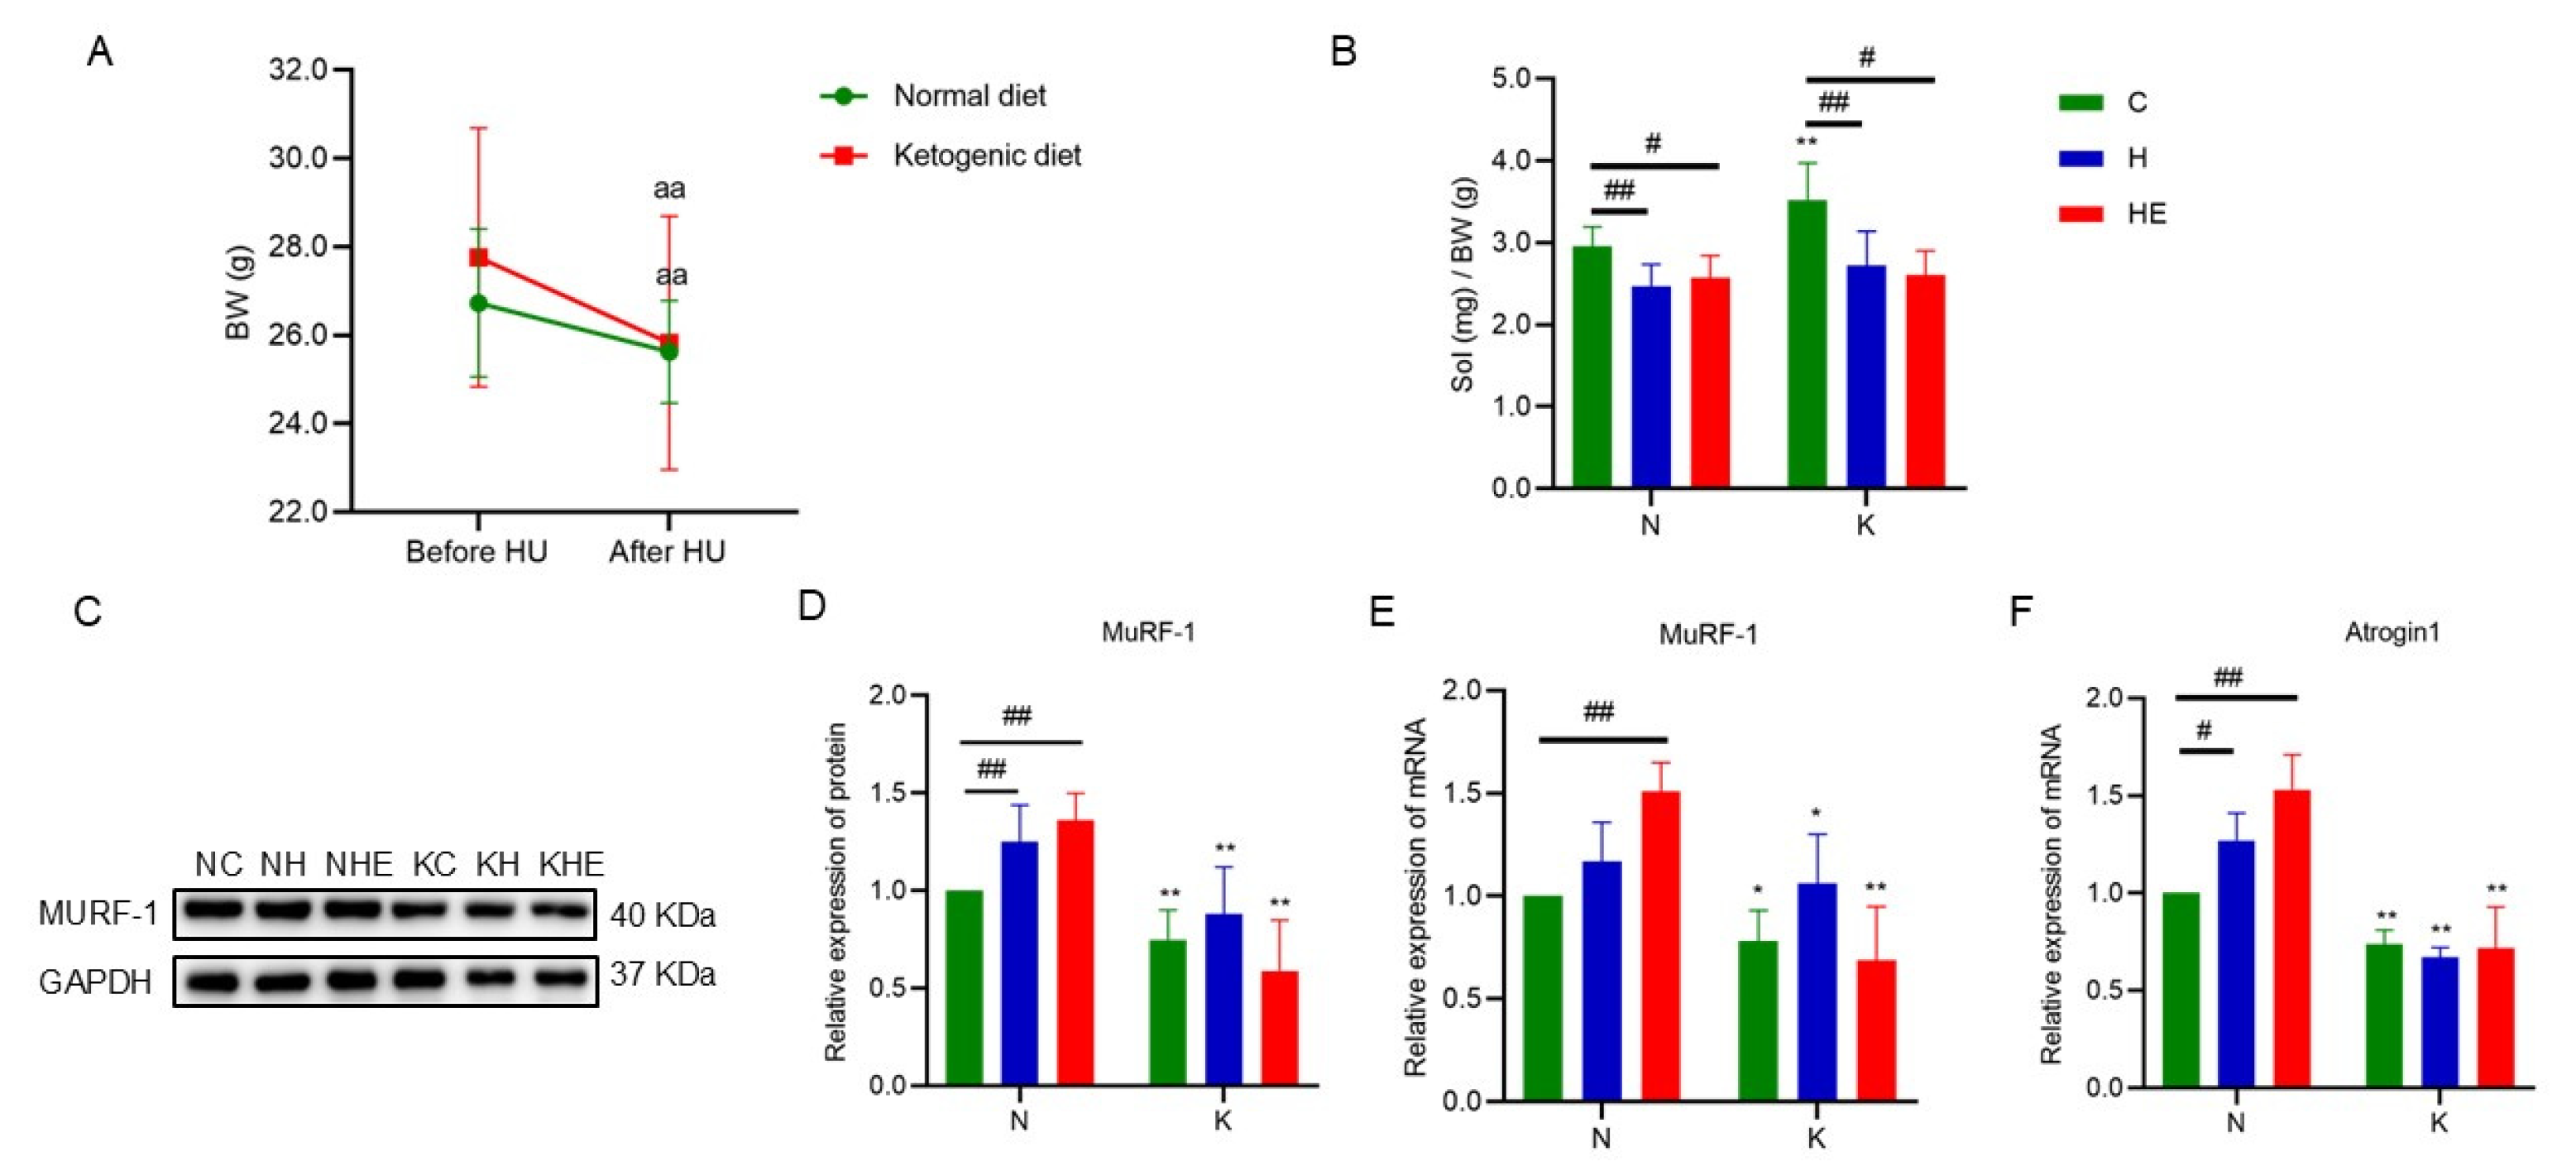
3.2. The Effects on Body Weight and Skeletal Muscle Mass in Simulated Weightlessness Mice

As shown in Figure 3A, after 2 weeks of tail suspension intervention, the body weight of mice in both the KC and NC groups significantly decreased (p < 0.05). Additionally, compared to the NC group, the wet weight-to-body weight ratio of the soleus muscle in the NH and NHE groups was significantly reduced (p < 0.05) (Figure 3B), and the expression of MuRF-1 protein and Atrogin1 mRNA in the soleus muscle was significantly increased (p < 0.05) (Figure 3C-F). Studies have shown that a decrease in the muscle wet weight-to-body weight ratio, coupled with an increase in the expression of skeletal muscle atrophy markers MuRF-1 and Atrogin1, is considered indicative of muscle atrophy [25]. Therefore, these results confirm the successful establishment of a model of weightlessness-induced skeletal muscle atrophy. Furthermore, compared to the KC group, the wet weight-to-body weight ratio of the soleus muscle in the KH and KHE groups significantly decreased (p < 0.05), but no significant changes were observed in the expression of MuRF-1 protein and Atrogin1 mRNA. Additionally, inter-group comparisons revealed that, compared to the NC group, both the KC and NH groups, as well as the KH and NHE groups, exhibited significantly lower levels of MuRF-1 protein, MuRF-1 mRNA, and Atrogin1 mRNA in the soleus muscle (p < 0.05). In conclusion, both regular and ketogenic diets lead to muscle atrophy under weightless conditions, whereas a ketogenic diet or a ketogenic diet combined with exercise can reverse the occurrence of atrophy.

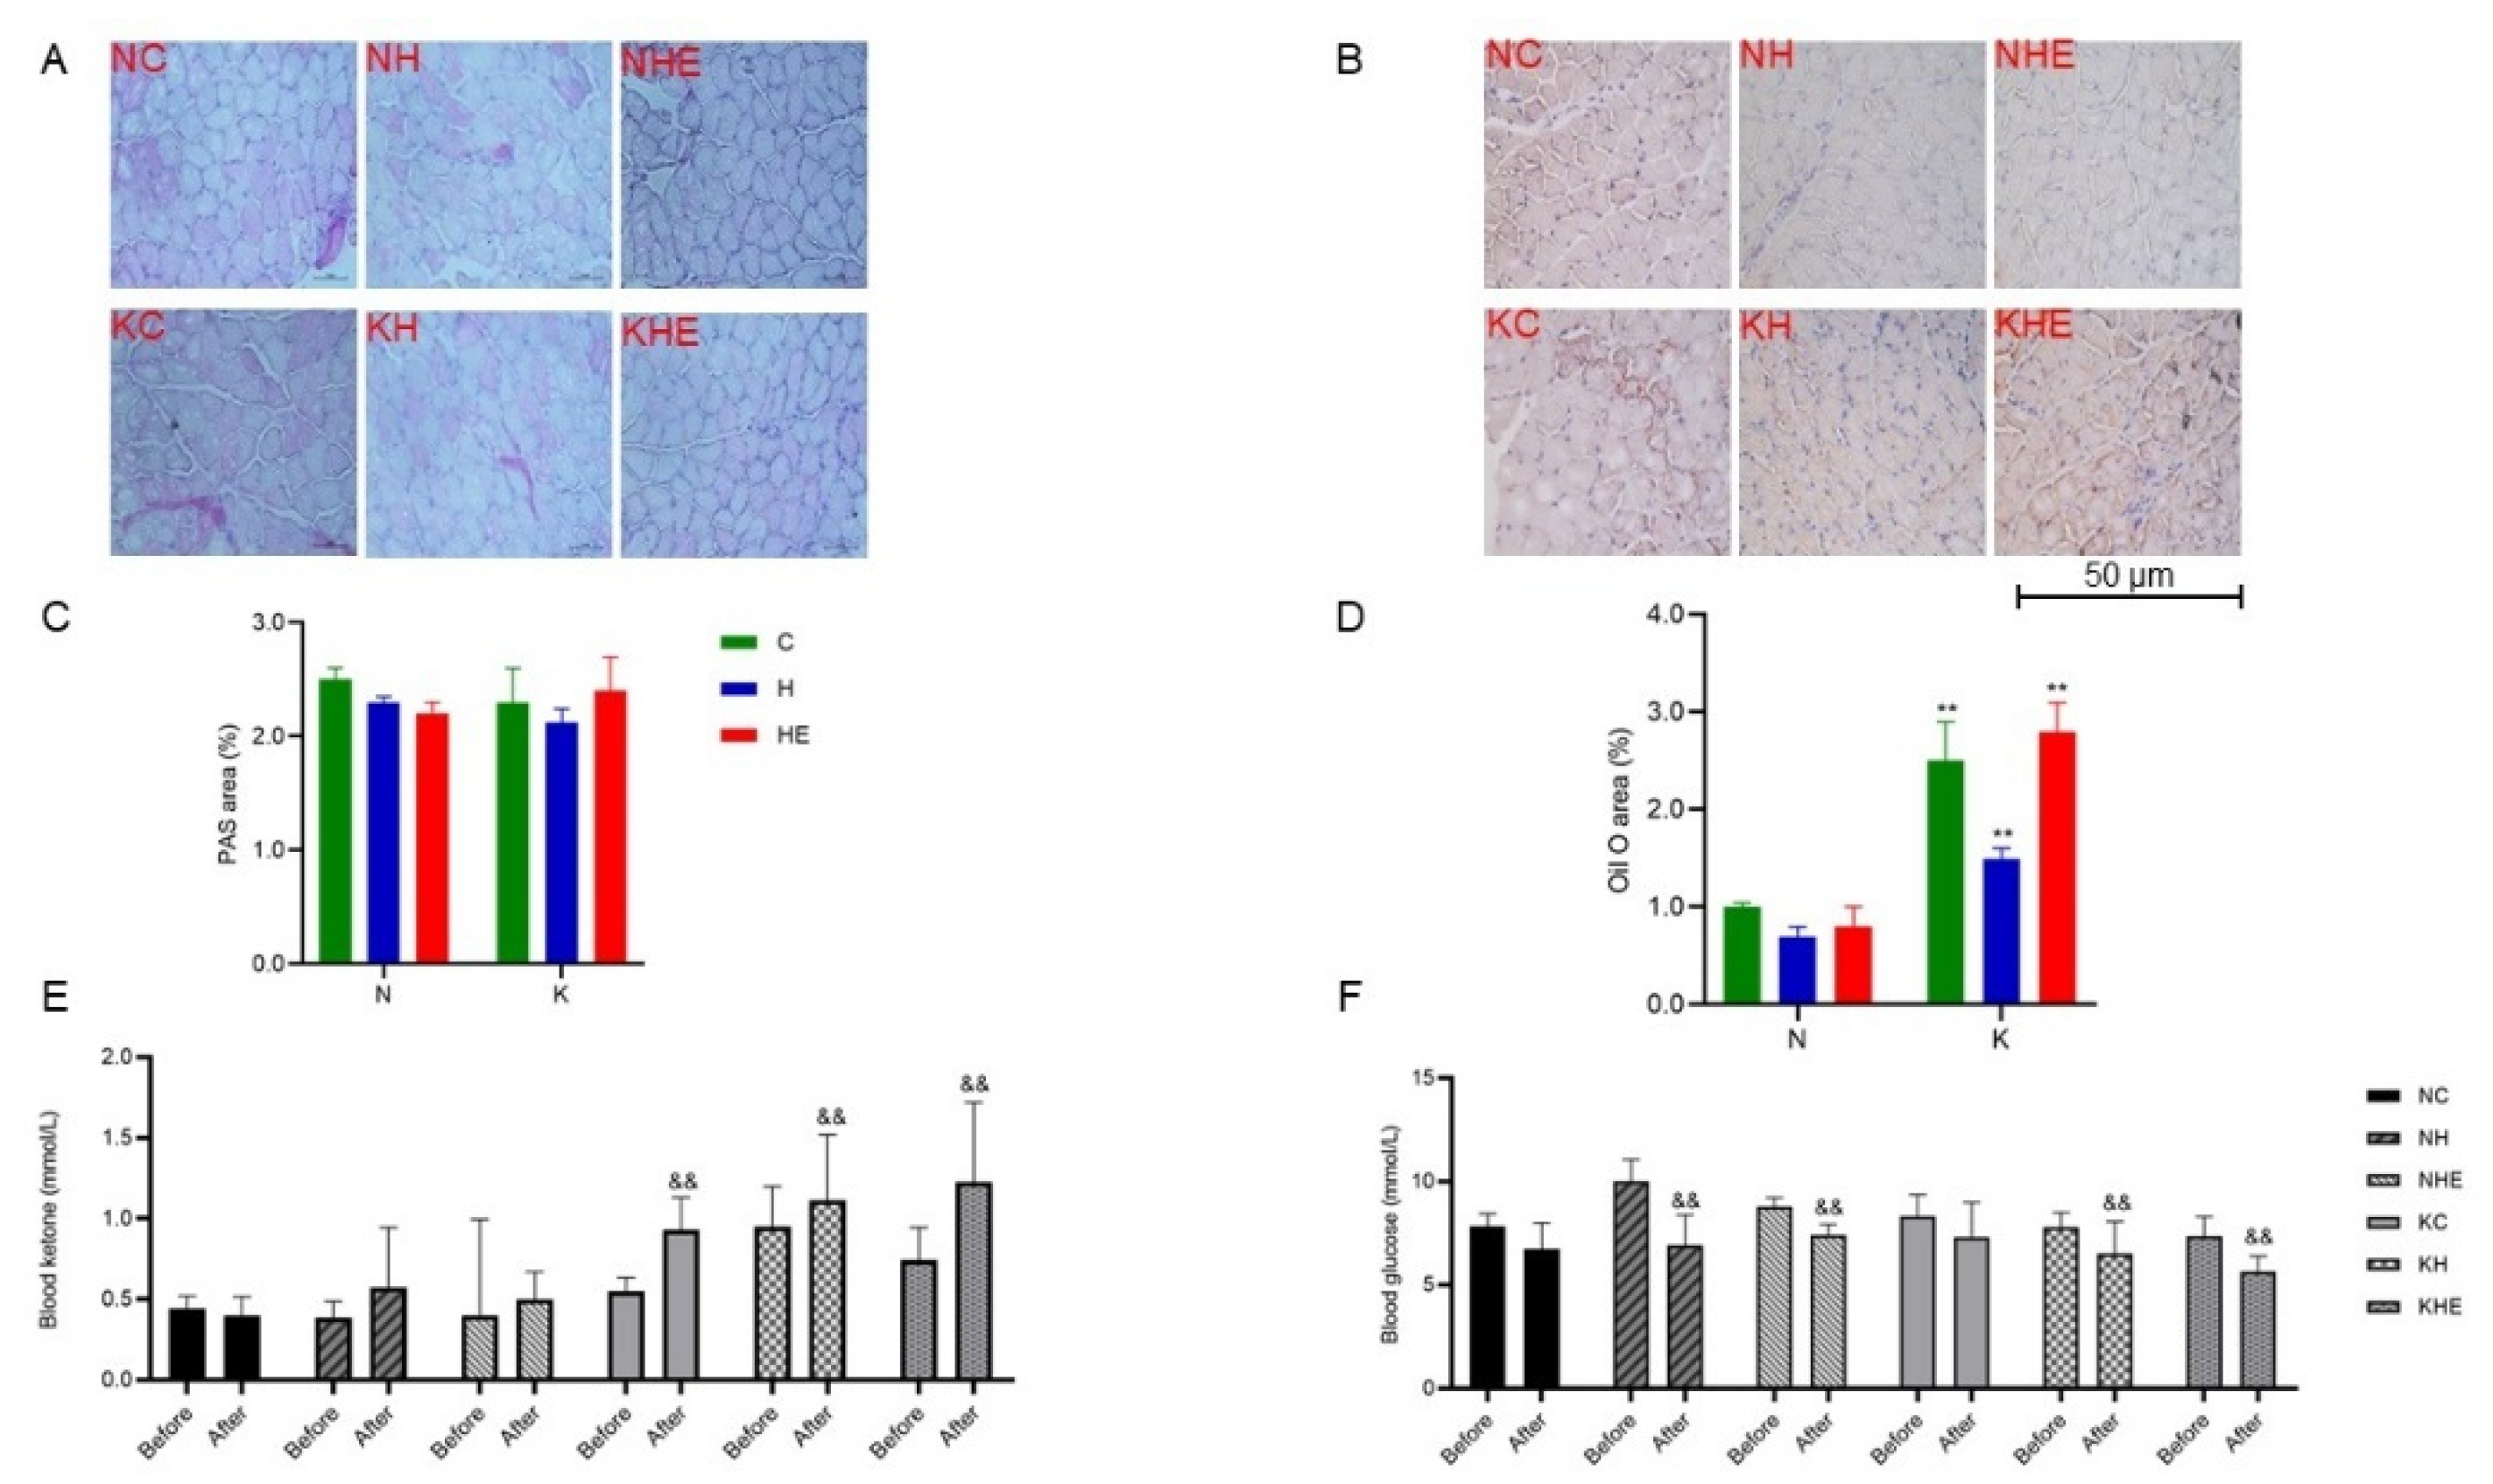
3.3. The Effects on Glucose and Lipid Metabolism in Mice

To examine changes in glycogen and lipid droplet content in skeletal muscle after a single bout of exhaustive exercise, PAS and Oil Red O staining were performed on skeletal muscle sections from the mice. PAS staining results (Figure 4A, C) showed no significant changes in glycogen content across all groups. Additionally, Oil Red O staining results (Figure 4B, D) indicated that there were no significant differences in lipid droplet content within each dietary group. However, inter-group comparisons revealed that the lipid droplet content in skeletal muscle was significantly higher in the NC group compared to the KC group, the NH group compared to the KH group, and the NKE group compared to the KHE group (p < 0.05). To assess changes in blood ketone and glucose levels before and after exhaustive exercise, test strips were used. The results in Figure 4E and 4F show that, after exhaustive exercise, the ketogenic diet significantly increased circulating ketone levels (p < 0.05), while blood glucose levels were reduced in all exercise groups (p < 0.05). These results suggest that neither a regular nor a ketogenic diet, in combination with a weightless environment or aerobic exercise alone, significantly alters lipid droplet content in skeletal muscle. However, the ketogenic diet significantly increased lipid droplet content in skeletal muscle. Moreover, the increase in circulating ketone levels at rest indicates that the ketogenic diet enhances fat metabolism, elevating blood ketone concentrations to support prolonged exercise by promoting the utilization of ketones as an energy source.
To further examine changes in the metabolic levels of mice, biochemical analyses were conducted to measure blood metabolic parameters. As shown in Table 2, compared to the NC group, serum levels of TC, TG, LDL-C, and HDL-C in the NH and NHE groups showed no significant changes, but insulin levels were significantly increased (p < 0.05). Compared to the KC group, serum TC and HDL levels in the KH and KHE groups were significantly reduced (p < 0.05), and serum LDL levels in the KHE group were also significantly decreased (p < 0.05). Interestingly, the serum TC level in the KH group was significantly increased (p < 0.05). Notably, there were no significant changes in urea and insulin levels between the groups. Furthermore, inter-group comparisons revealed that, compared to the NC group, both the KC and NH groups had significantly lower levels of serum TC, TG, LDL-C, HDL-C, urea, and insulin (p < 0.05). Additionally, compared to the NHE group, the KHE group had significantly lower insulin levels (p < 0.05), along with significantly higher levels of TC and HDL (p < 0.05), while the remaining parameters showed no significant differences. Therefore, simulated weightlessness did not affect serum lipid levels in mice on a regular diet. However, a ketogenic diet alone led to increased serum lipid levels, whereas a ketogenic diet combined with exercise partially mitigated the lipid increase induced by the ketogenic diet. These results suggest that simulated weightlessness impairs the blood glucose regulation ability in mice after exhaustive exercise. Furthermore, a ketogenic diet intervention alone did not significantly influence the reduction in blood glucose after exhaustive exercise in weightless mice, and the combination of exercise with a ketogenic diet did not show any improvement in this regard.

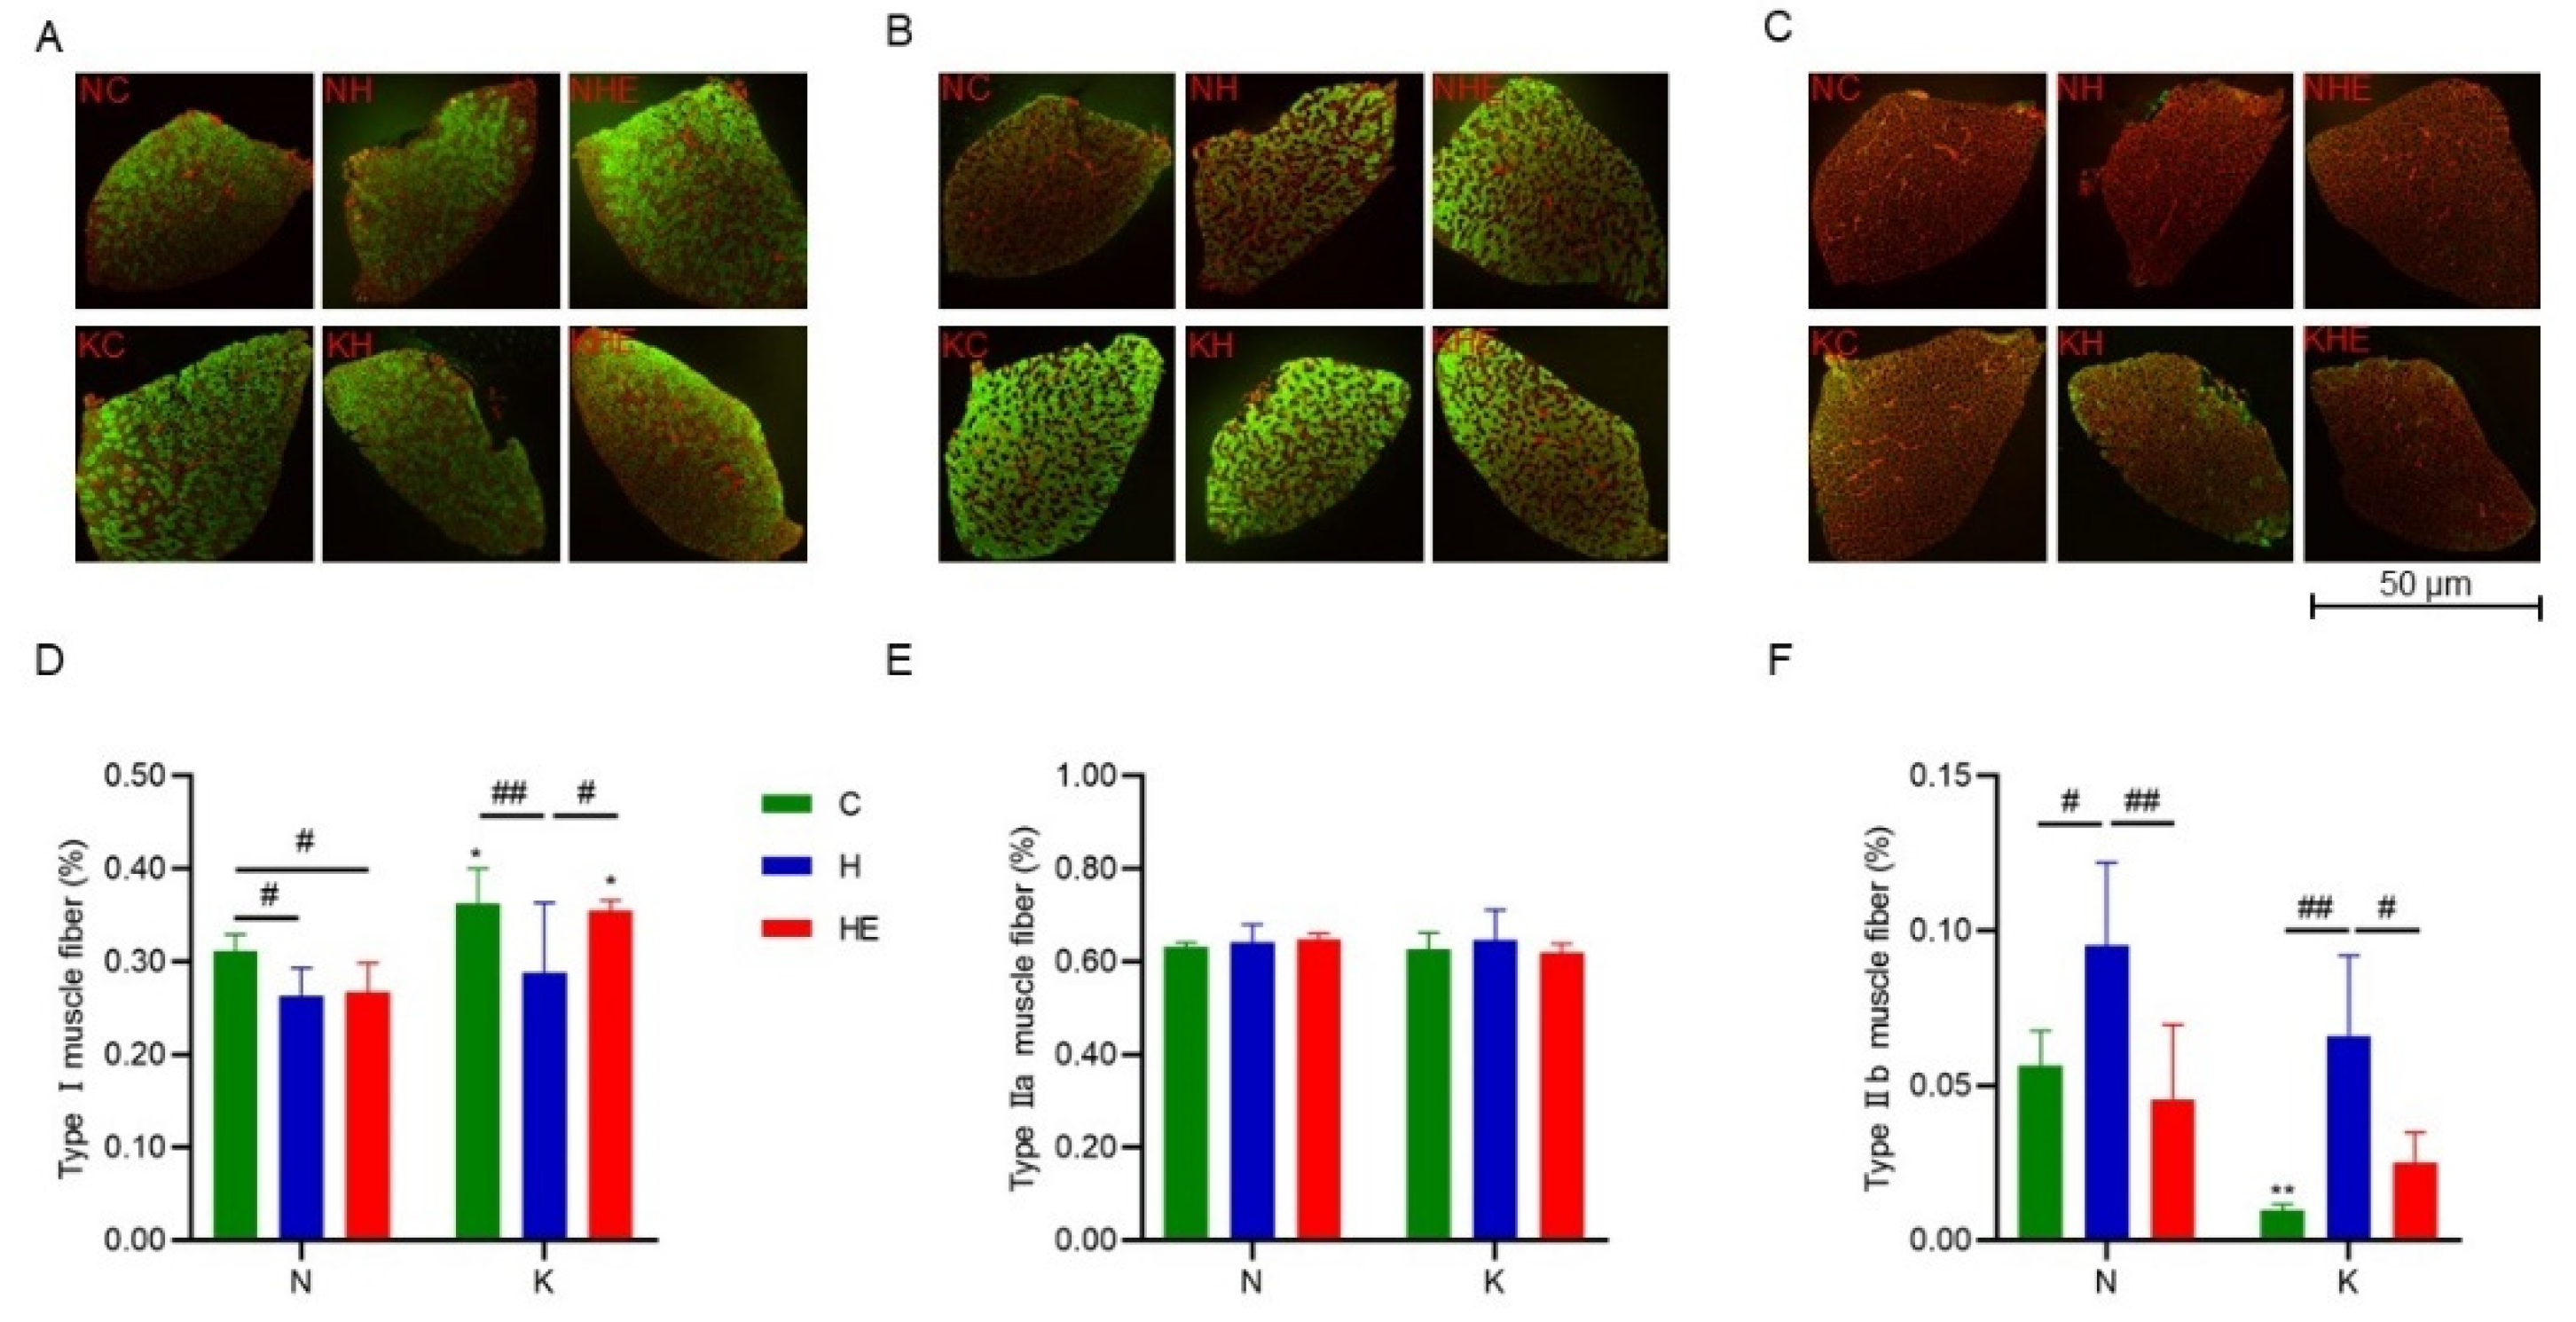
3.4. The Effects on Muscle Fiber Types in Mouse Skeletal Muscle

To investigate changes in muscle fiber types, immunofluorescent staining was performed on skeletal muscle to analyze the percentage of each muscle fiber type relative to the total fiber count. As shown in Figure 5, compared to the NC group, the proportion of MHC-I muscle fibers in the NH group was significantly reduced (p < 0.05), while the proportion of MHC-IIb muscle fibers was significantly increased (p < 0.05). In the NHE group, the proportion of MHC-I fibers was significantly decreased (p < 0.05), while no significant change was observed in the proportion of MHC-IIb fibers. Compared to the KC group, the KH group showed a significant decrease in the proportion of MHC-I fibers (p < 0.05) and a significant increase in the proportion of MHC-IIb fibers (p < 0.05). However, no significant changes were observed in the fiber proportions in the KHE group. Additionally, inter-group comparisons revealed that, compared to the NC group, the KC group had a significantly higher proportion of MHC-I fibers (p < 0.05) and a significantly lower proportion of MHC-IIb fibers (p < 0.05). The proportion of MHC-I fibers in the KHE group was significantly higher than that in the KH group (p < 0.05), while the decrease in MHC-IIb fibers showed a trend but did not reach statistical significance. Notably, no significant changes in the proportion of MHC-IIa fibers were observed across all groups. In conclusion, both regular and ketogenic diet interventions in mice under simulated weightlessness lead to a shift from slow-twitch to fast-twitch fibers in the soleus muscle. While aerobic exercise can partially suppress the increase in MHC-IIb fibers in the soleus muscle of mice on a regular diet, it does not effectively prevent the reduction in slow-twitch fibers. However, the combination of a ketogenic diet and exercise has a significantly greater effect than exercise alone, substantially improving the muscle fiber type transition induced by simulated weightlessness. Furthermore, under normal conditions, the ketogenic diet promotes the conversion of fast-twitch fibers to slow-twitch fibers in the soleus muscle.

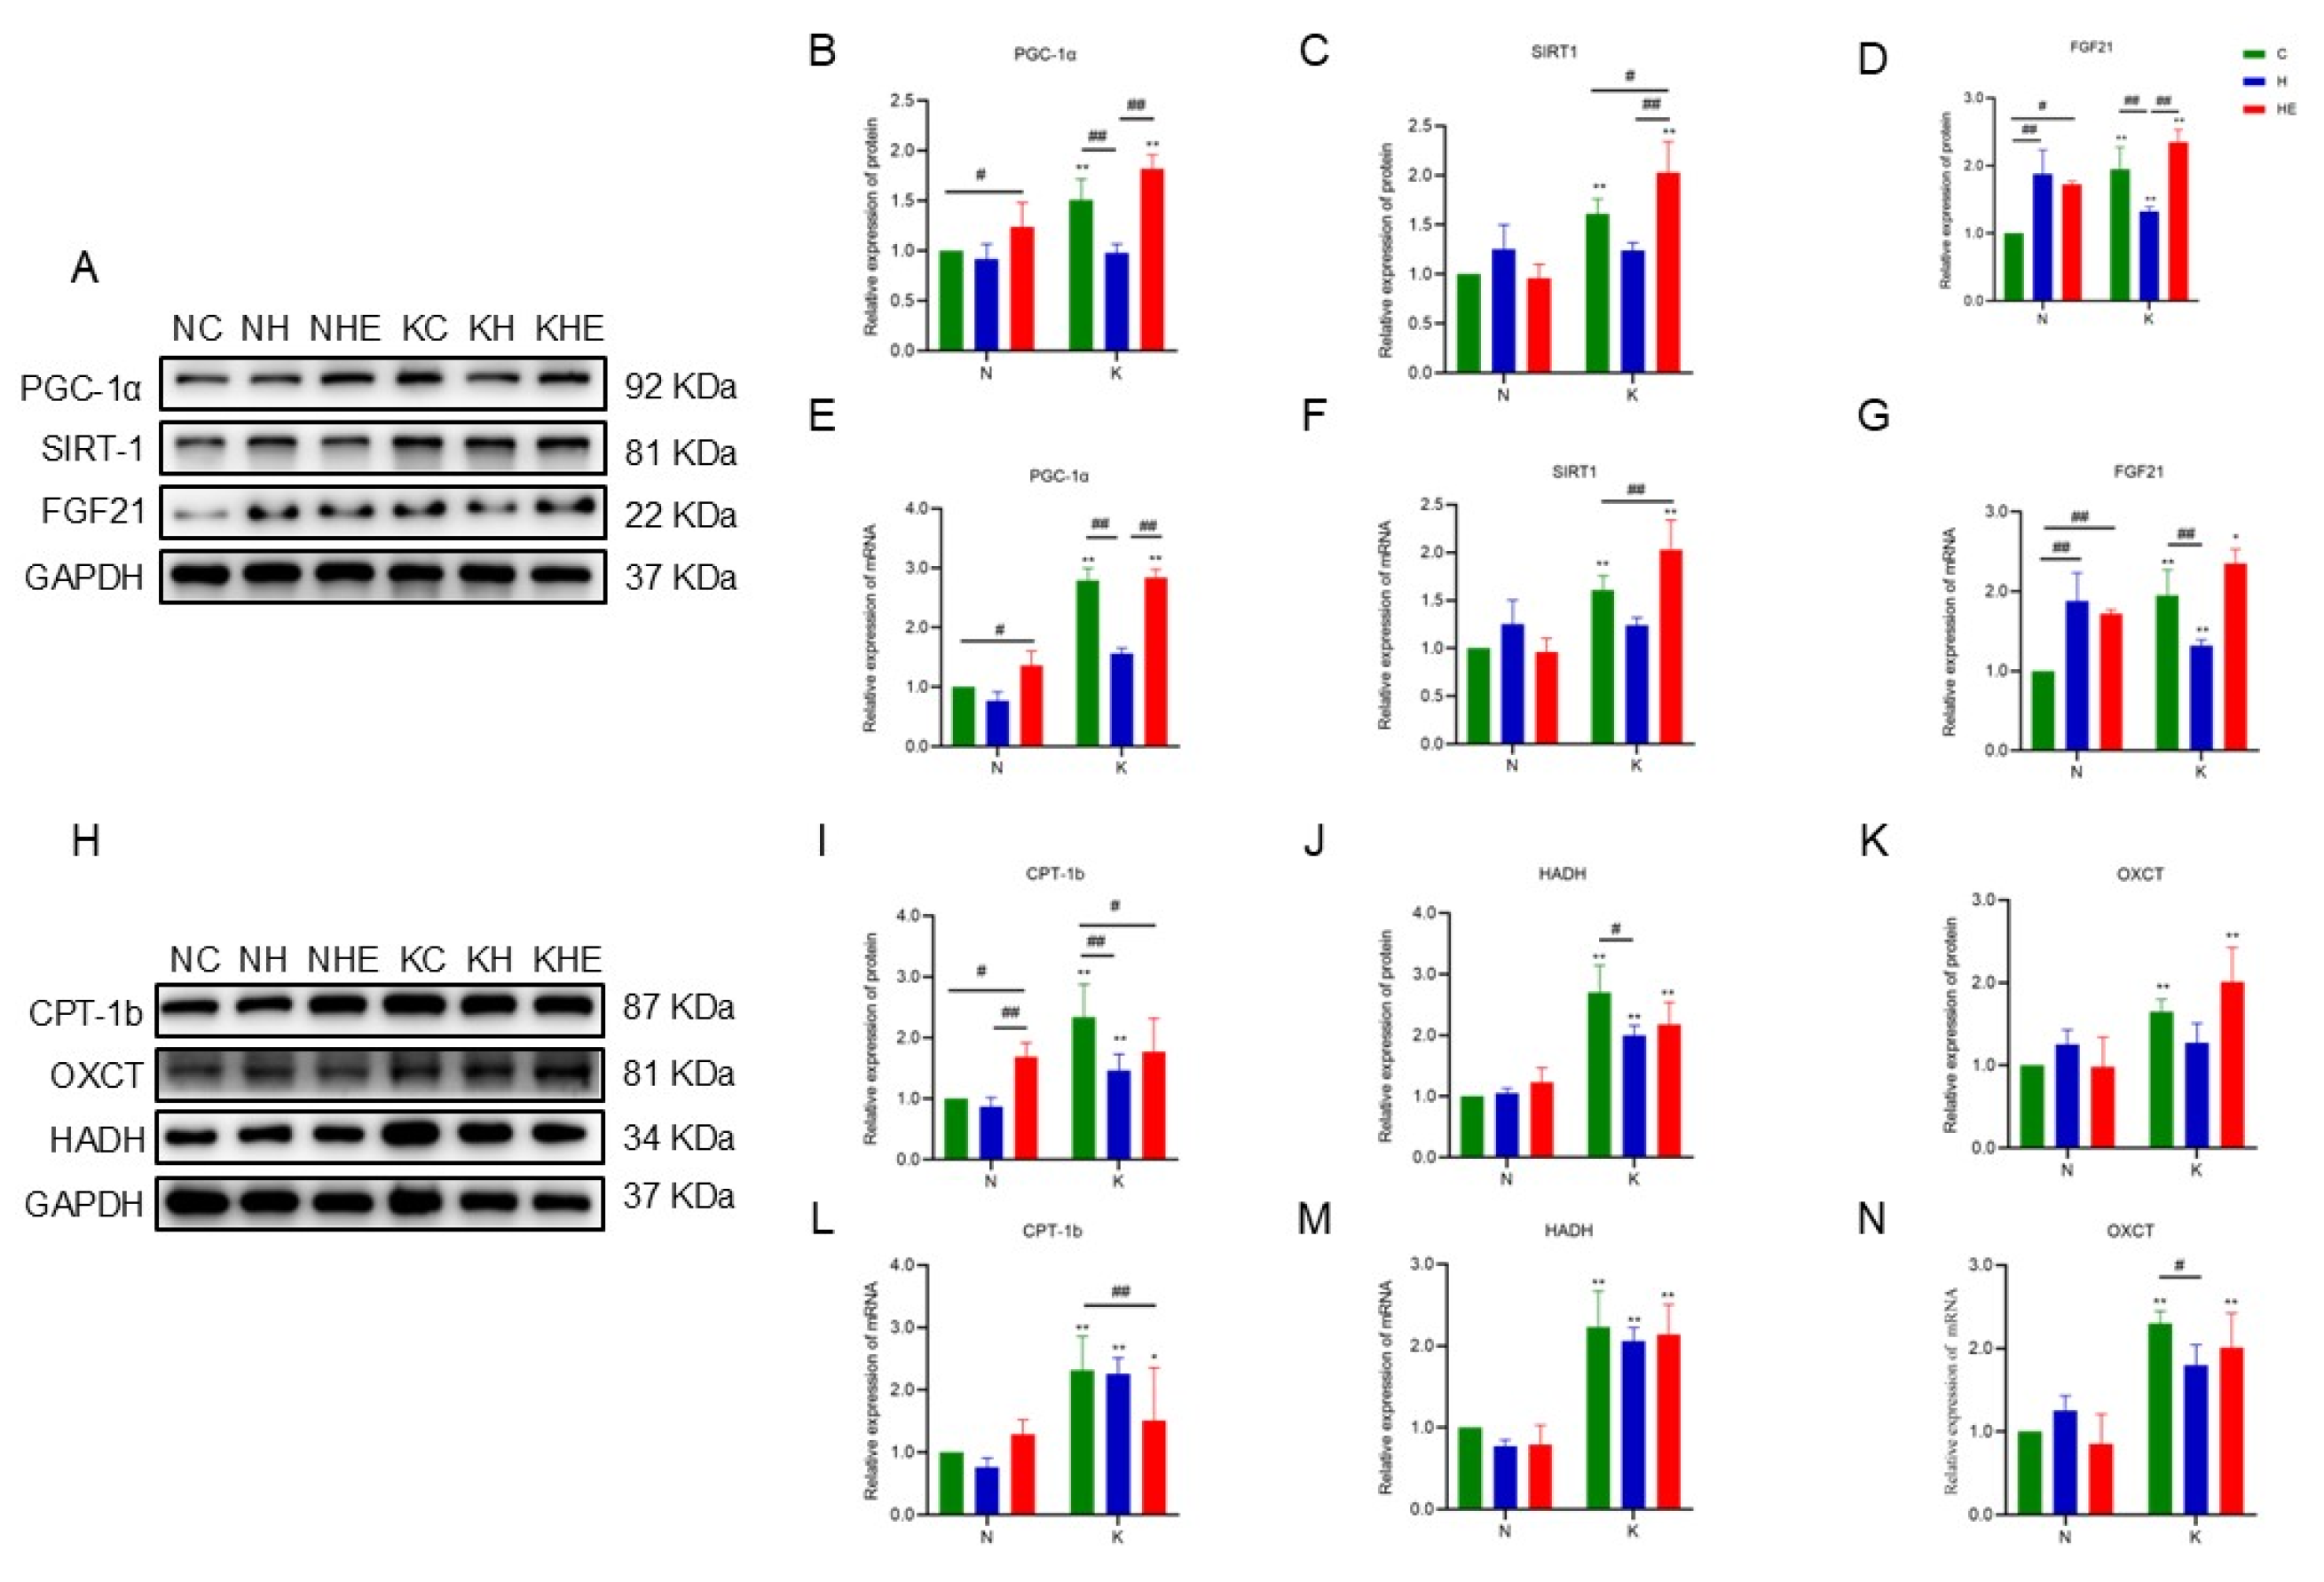
3.5. The Effects on the Expression of Skeletal Muscle-Related Proteins and Genes in Mice

Studies have shown that FGF21, SIRT1, and PGC-1α are key regulators of aerobic metabolism in skeletal muscle, playing important roles in the regulation of aerobic metabolism, promoting ketone body catabolism, and facilitating fatty acid oxidation [19,26]. As shown in Figure 6A-G, compared to the NC group, the NH group exhibited significantly increased expression of both FGF21 protein and FGF21 mRNA in skeletal muscle (p < 0.05). In the NHE group, there was a significant increase in the expression of PGC-1α protein, PGC-1α mRNA, FGF21 protein, and FGF21 mRNA (p < 0.05). Compared to the KC group, the KH group showed a significant decrease in the expression of PGC-1α protein, PGC-1α mRNA, FGF21 protein, FGF21 mRNA, and SIRT1 protein in skeletal muscle (p < 0.05). However, the KHE group showed a significant increase in the expression of SIRT1 protein and SIRT1 mRNA (p < 0.05). Additionally, inter-group comparisons revealed that both the KC and KHE groups had significantly higher levels of PGC-1α protein, PGC-1α mRNA, SIRT1 protein, SIRT1 mRNA, FGF21 protein, and FGF21 mRNA in skeletal muscle compared to both the NC group and the KH group (p < 0.05).
Furthermore, OXCT is a critical ketogenic enzyme in skeletal muscle that reflects the process of ketone body catabolism [27], while CPT-1b is a key fatty acid transporter involved in β-oxidation in skeletal muscle [28,29]. HADH is a rate-limiting enzyme in the β-oxidation process of fatty acids in skeletal muscle [30], and alterations in the expression of these enzymes reflect the extent of fatty acid metabolism in skeletal muscle. As shown in Figures H-N, compared to the NC group, the NH group exhibited a significant increase in CPT-1b protein expression in skeletal muscle (p < 0.05). Compared to the KC group, the KH group showed a significant decrease in the expression of CPT-1b protein, HADH protein, and OXCT mRNA in skeletal muscle (p < 0.05). Additionally, inter-group comparisons indicated that the KC, KH, and KHE groups had significantly higher levels of CPT-1b mRNA, HADH protein, HADH mRNA, OXCT protein, and OXCT mRNA in skeletal muscle compared to the NC, NH, and NHE groups (p < 0.05).

3.6. The Effects of Exercise Capacity in Mice

To investigate the fatigue recovery capacity of mice following a single bout of exhaustive exercise, a biochemical analyzer was used to measure blood markers associated with fatigue. As shown in Table 3, compared to the NC group, the serum LD levels in the NH and NHE groups were significantly elevated (p < 0.05), with no significant difference observed between the NH and NHE groups. Additionally, the serum LD levels in the KHE group were significantly lower than those in the KC group (p < 0.05), while no significant differences were observed for other markers. Inter-group comparisons revealed that the serum LD levels in the KC group were significantly higher than those in the NC group, suggesting that the ketogenic diet leads to increased lactate accumulation post-exercise, which may be associated with the metabolic shifts induced by the ketogenic diet.
The single exhaustive exercise test serves as a measure of exercise endurance. As shown in Table 3, compared to the NC group, the exercise exhaustion time was significantly reduced in the NH and NHE groups (p < 0.05). When compared to the KC group, the exercise exhaustion time was also significantly reduced in the KH and KHE groups (p < 0.05), although the KHE group exhibited a significantly longer exhaustion time than the KH group (p < 0.05). Furthermore, inter-group comparisons revealed no significant differences in exercise exhaustion times between the NC and KC groups, or between the NH and KH groups. However, the exercise exhaustion time in the KHE group was significantly longer than that in the NHE group (p < 0.05). In conclusion, both standard and ketogenic diets led to a reduction in exercise endurance under simulated weightlessness. Neither aerobic exercise nor ketogenic diet interventions alone were able to counteract the decline in exercise endurance induced by simulated weightlessness, whereas the combination of a ketogenic diet and aerobic exercise significantly mitigated the decrease in exercise endurance in mice.

4. Discussion

Research has demonstrated that ketogenic diets play a significant role in controlling body weight and preserving muscle mass. A study by Ogura et al. [9] indicated that a 4-week ketogenic diet could prevent weight gain associated with aging, consistent with previous findings [31,32,33,34,35,36,37,38]. In the present study, using C57BL/6J mice as subjects, the results showed that from the second week onward, body weight gain in the KD group was lower than in the control diet group, aligning with findings from other studies [39,40,41]. However, as the intervention period progressed, the body weight difference between the KD and control diet groups narrowed, suggesting that the mice developed keto-adaptation, leading to a phase-specific change in body weight. This trend contrasts with findings from Shimizu et al. [42], Wallace et al. [43], and Zhou et al. [44], whose studies reported differing results. These discrepancies may be attributed to variations in intervention duration, muscle tissue types examined, and the protein content of the ketogenic diet.
There is currently a limited number of studies investigating the effects of ketogenic diets on mice under simulated weightlessness. It is well established that body weight, skeletal muscle wet weight, and the wet weight-to-body weight ratio are commonly used indicators to assess skeletal muscle atrophy in rodents. Additionally, MuRF-1 and Atrogin1 are widely recognized as markers of muscle atrophy [45]. In the present study, a 2-week tail suspension intervention reduced body weight in the control diet group and led to a decrease in the wet weight-to-body weight ratio of the soleus muscle, accompanied by increased expression of MuRF-1 protein and Atrogin1 mRNA, indicating muscle atrophy in the soleus muscle. Following dietary and exercise interventions, we found that the ketogenic diet or the combination of ketogenic diet and exercise significantly downregulated MuRF-1 protein and Atrogin1 mRNA expression, thereby inhibiting muscle atrophy in the soleus muscle. Interestingly, in the absence of simulated weightlessness, the ketogenic diet provided better protection for the soleus muscle, helping to maintain muscle mass. However, due to the limited number of related studies, there is a lack of robust experimental data to support these findings, and further research is necessary to confirm these results.
Reduced skeletal muscle usage triggers an adaptive metabolic remodeling, characterized by a decrease in fat oxidation capacity and a shift towards glycolysis as the primary fuel source, accompanied by a transition in myosin heavy chain (MHC) fiber types from slow-twitch to fast-twitch fibers[46,47]. As a result, fast-twitch glycolytic fibers are more susceptible to atrophy than slow-twitch oxidative fibers [48]. In this study, we observed that after the tail suspension intervention, the NH group mice exhibited a significant decrease in the proportion of MHC-I fibers and a marked increase in the proportion of MHC-IIb fibers, leading to a decline in their exercise capacity. The KD induced a transition of skeletal muscle fibers from MHC-IIb to MHC-I[9,43,49,50,51]. These findings suggest that, in the KD group, skeletal muscles may undergo a shift towards a slow-twitch fiber phenotype, potentially protecting the muscles from fiber loss associated with frailty (muscle degeneration). Furthermore, the reduction in MHC-IIb isoform levels due to exercise training is associated with enhanced muscle aerobic capacity [52,53,54]. Our study confirmed that the combined intervention of KD and exercise was significantly more effective than aerobic exercise alone. This combined approach significantly alleviated the muscle fiber type transformation induced by simulated weightlessness, thereby improving the exercise performance of the KD + Exercise (KHE) group mice. This result was further corroborated by the exhaustive one-time exercise test. Notably, PGC-1α [14,15,16,17] is a key regulatory molecule in skeletal muscle, involved in regulating oxidative metabolism, fatty acid oxidation, and the transition between fast and slow muscle fiber types. Additionally, PGC-1α regulates the expression of ketolytic enzymes and ketone body transporters in skeletal muscle, significantly influencing systemic ketosis [18]. Further investigation revealed that the FGF21-SIRT1-AMPK-PGC-1α signaling pathway promotes myocyte differentiation and the conversion of anaerobic muscle fibers to an oxidative phenotype [19]. The immunofluorescence staining results of this study confirmed the impact of changes in protein expression associated with fiber type transitions. KD increased the expression of PGC-1α, SIRT1, and FGF21 in the soleus muscle, which led to a significant increase in the proportion of MHC-I fibers compared to the control group. Conversely, the proportion of MHC-IIb fibers, representing fast-twitch fibers, was significantly reduced. However, a pure KD alone did not counteract the tail suspension-induced changes in soleus muscle fiber types. The KH group showed a shift from slow to fast fibers, a result that negatively impacted the aerobic endurance of the mice, as reflected in the exhaustive exercise test outcomes.
In contrast to the early-phase weight gain suppression observed with ketogenic diet (KD), KD intake did not cause significant changes in blood glucose levels. Despite an extremely low carbohydrate intake, blood glucose remained stable, likely due to compensatory mechanisms such as enhanced gluconeogenesis, glycogenolysis, and inhibited glucose uptake, which help maintain glucose homeostasis [55]. In this study, no significant changes in blood glucose concentrations were observed across the experimental groups, further supporting this hypothesis. Additionally, muscle glycogen serves as a key energy source for fast-twitch muscles (e.g., EDL). After four weeks of KD feeding, glycogen content remained unchanged [56]. Conversely, K et al. [55] reported a reduction in muscle glycogen content in mice after four weeks on a ketogenic diet. In our study, no significant changes in glycogen content were observed in the soleus muscle of the KD or KD combined intervention groups, although lipid droplet content significantly increased. This may be attributed to daily exercise training, which could have offset the reduction in muscle glycogen storage [55]. Following a pure ketogenic diet (KD), increased levels of free fatty acids in the blood and lipid droplets in skeletal muscle led to a significant upregulation of enzymes such as CPT-1b and HADH, which facilitate fatty acid oxidation in skeletal muscle [57]. As the β-oxidation process intensified, the NAD+ content produced during oxidation also significantly increased, thereby activating the expression of SIRT1. SIRT1, in turn, activates the expression of PGC-1α through acetylation [58]. The activation of factors such as PGC-1α and SIRT1 not only positively regulates the expression of lipid metabolism enzymes like CPT-1b and HADH [59,60], but also promotes the conversion of muscle fibers from fast-twitch to slow-twitch through the FGF21-SIRT1-AMPK-PGC-1α signaling pathway [19]. This may counteract the shift from slow to fast muscle fibers induced by tail suspension, potentially increasing the proportion of slow-twitch fibers in skeletal muscle. With the increase in slow-twitch fibers and the continued KD regimen, lipid droplet content in the muscle was further elevated, which is essential for improving aerobic capacity al., 2020). These lipid droplets, as a critical energy source for muscle metabolism, can effectively enhance aerobic endurance [61].
Moreover, the expression of CPT-1b and HADH in the soleus muscle was significantly increased, reflecting the cumulative effects of fiber type changes and the activation of PGC-1α and other proteins. This combination of changes led to a substantial increase in fat metabolism in the ketogenic diet (KD) group mice. Simultaneously, aerobic capacity was enhanced along with ketone body production [62,63]. In the liver, ketone bodies were produced in large quantities and circulated into the bloodstream, reaching skeletal muscle. During this period, the expression of the key rate-limiting enzyme in ketolysis, OXCT, was upregulated in skeletal muscle under the influence of PGC-1α, further promoting ketone body breakdown and their participation in energy metabolism via the tricarboxylic acid cycle [64]. It is also important to note that, for mice subjected to combined KD and aerobic exercise interventions, despite significant alterations in fat and ketone body metabolism, muscle glycogen levels and blood glucose concentrations remained relatively stable (with a slight reduction). This stability likely supports prolonged exercise capacity. Overall, this adaptive metabolic model in skeletal muscle—primarily reliant on ketone body metabolism, with significant increases in fat metabolism and stable glucose metabolism—effectively enhanced aerobic endurance.

5. Conclusions

The combined intervention of a ketogenic diet and aerobic exercise effectively improves aerobic endurance in mice subjected to simulated weightlessness. This approach enhances energy metabolism in these mice by reducing insulin levels, preventing the increase in glycolytic metabolism following tail suspension, significantly elevating the ratio of fat metabolism, and promoting a metabolic state primarily dependent on ketone bodies as the main energy substrate. Additionally, this intervention increases the expression of regulatory genes related to aerobic capacity in skeletal muscle and inhibits the transition of muscle fibers from slow-twitch to fast-twitch phenotypes.

Author Contributions

J.C., X.D., and L.Y. conceived the study and designed the experiments. J.C. and W.L. carried out the experiments. J.C., B.Z., W.L., Z.L., P.Z., B.D., and X.D. contributed to the sample collection. J.C. and W.L. analyzed the data. J.C. wrote the manuscript. X.D., Q.W., and L.Y. reviewed and edited the manuscript. All the authors have read and agreed to the published version of the manuscript.

Funding

This research was funded by the Special Fund for Basic Scientific Research for Central Universities (2022YB019), the National Natural Science Foundation of China (32071168), the Open Project of the State Key Laboratory of Basic and Application of Aerospace Medicine (SMFA20K04), and the National Key Laboratory of Space Medicine, China Astronaut Research and Training Center (SMFA18B04).

Institutional Review Board Statement

The animal study protocols were approved by the Ethics Committee of the National Key Laboratory of Space Medicine (Approval No: ACC-IACUC-2021-010).

Informed Consent Statement

Not applicable.

Data Availability Statement

The authors confirm that the data supporting the findings of this study are available within the article.

Acknowledgments

The authors gratefully acknowledge the excellent assistance of YaXuan Liu, Xiangsheng Pang, and Shiming Li.

Conflicts of Interest

The authors declare no conflict of interest.

References

  1. Trappe, T.A.; Minchev, K.; Perkins, R.K.; Lavin, K.M.; Jemiolo, B.; Ratchford, S.M.; Claiborne, A.; Lee, G.A.; Finch, W.H.; Ryder, J.W.; et al. NASA SPRINT Exercise Program Efficacy for Vastus Lateralis and Soleus Skeletal Muscle Health during 70 Days of Simulated Microgravity. J. Appl. Physiol. Bethesda Md 1985 2024, 136, 1015–1039. [Google Scholar] [CrossRef]
  2. Li, R.-J.; Liu, Y.; Liu, H.-Q.; Li, J. Ketogenic Diets and Protective Mechanisms in Epilepsy, Metabolic Disorders, Cancer, Neuronal Loss, and Muscle and Nerve Degeneration. J. Food Biochem. 2020, 44, e13140. [Google Scholar] [CrossRef] [PubMed]
  3. Zhou, Z.; Hagopian, K.; López-Domínguez, J.A.; Kim, K.; Jasoliya, M.; Roberts, M.N.; Cortopassi, G.A.; Showalter, M.R.; Roberts, B.S.; González-Reyes, J.A.; et al. A Ketogenic Diet Impacts Markers of Mitochondrial Mass in a Tissue Specific Manner in Aged Mice. Aging 2021, 13, 7914–7930. [Google Scholar] [CrossRef] [PubMed]
  4. Fukao, T.; Lopaschuk, G.D.; Mitchell, G.A. Pathways and Control of Ketone Body Metabolism: On the Fringe of Lipid Biochemistry. Prostaglandins Leukot. Essent. Fatty Acids 2004, 70, 243–251. [Google Scholar] [CrossRef] [PubMed]
  5. McSwiney, F.T.; Wardrop, B.; Hyde, P.N.; Lafountain, R.A.; Volek, J.S.; Doyle, L. Keto-Adaptation Enhances Exercise Performance and Body Composition Responses to Training in Endurance Athletes. Metabolism. 2018, 83, e1–e2. [Google Scholar] [CrossRef] [PubMed]
  6. Kephart, W.C.; Pledge, C.D.; Roberson, P.A.; Mumford, P.W.; Romero, M.A.; Mobley, C.B.; Martin, J.S.; Young, K.C.; Lowery, R.P.; Wilson, J.M.; et al. The Three-Month Effects of a Ketogenic Diet on Body Composition, Blood Parameters, and Performance Metrics in CrossFit Trainees: A Pilot Study. Sports Basel Switz. 2018, 6, 1. [Google Scholar] [CrossRef] [PubMed]
  7. Bloemberg, D.; Quadrilatero, J. Rapid Determination of Myosin Heavy Chain Expression in Rat, Mouse, and Human Skeletal Muscle Using Multicolor Immunofluorescence Analysis. PLoS ONE 2012, 7, e35273. [Google Scholar] [CrossRef] [PubMed]
  8. Wallace, M.A.; Aguirre, N.W.; Marcotte, G.R.; Marshall, A.G.; Baehr, L.M.; Hughes, D.C.; Hamilton, K.L.; Roberts, M.N.; Lopez-Dominguez, J.A.; Miller, B.F.; et al. The Ketogenic Diet Preserves Skeletal Muscle with Aging in Mice. Aging Cell 2021, 20, e13322. [Google Scholar] [CrossRef] [PubMed]
  9. Ogura, Y.; Kakehashi, C.; Yoshihara, T.; Kurosaka, M.; Kakigi, R.; Higashida, K.; Fujiwara, S.-E.; Akema, T.; Funabashi, T. Ketogenic Diet Feeding Improves Aerobic Metabolism Property in Extensor Digitorum Longus Muscle of Sedentary Male Rats. PloS One 2020, 15, e0241382. [Google Scholar] [CrossRef] [PubMed]
  10. Smith, J.A.B.; Murach, K.A.; Dyar, K.A.; Zierath, J.R. Exercise Metabolism and Adaptation in Skeletal Muscle. Nat. Rev. Mol. Cell Biol. 2023, 24, 607–632. [Google Scholar] [CrossRef]
  11. Miller, W.C.; Bryce, G.R.; Conlee, R.K. Adaptations to a High-Fat Diet That Increase Exercise Endurance in Male Rats. J. Appl. Physiol. 1984, 56, 78–83. [Google Scholar] [CrossRef] [PubMed]
  12. Ma, S.; Huang, Q.; Yada, K.; Liu, C.; Suzuki, K. An 8-Week Ketogenic Low Carbohydrate, High Fat Diet Enhanced Exhaustive Exercise Capacity in Mice. Nutrients 2018, 10, 673. [Google Scholar] [CrossRef] [PubMed]
  13. Simi, B.; Sempore, B.; Mayet, M.H.; Favier, R.J. Additive Effects of Training and High-Fat Diet on Energy Metabolism during Exercise. J. Appl. Physiol. Bethesda Md 1985 1991, 71, 197–203. [Google Scholar] [CrossRef] [PubMed]
  14. Krämer, D.K.; Ahlsén, M.; Norrbom, J.; Jansson, E.; Hjeltnes, N.; Gustafsson, T.; Krook, A. Human Skeletal Muscle Fibre Type Variations Correlate with PPAR Alpha, PPAR Delta and PGC-1 Alpha mRNA. Acta Physiol. Oxf. Engl. 2006, 188, 207–216. [Google Scholar] [CrossRef] [PubMed]
  15. Lin, J.; Wu, H.; Tarr, P.T.; Zhang, C.-Y.; Wu, Z.; Boss, O.; Michael, L.F.; Puigserver, P.; Isotani, E.; Olson, E.N.; et al. Transcriptional Co-Activator PGC-1 Alpha Drives the Formation of Slow-Twitch Muscle Fibres. Nature 2002, 418, 797–801. [Google Scholar] [CrossRef] [PubMed]
  16. Mortensen, O.H.; Frandsen, L.; Schjerling, P.; Nishimura, E.; Grunnet, N. PGC-1alpha and PGC-1beta Have Both Similar and Distinct Effects on Myofiber Switching toward an Oxidative Phenotype. Am. J. Physiol. Endocrinol. Metab. 2006, 291, E807–816. [Google Scholar] [CrossRef] [PubMed]
  17. Schnyder, S.; Svensson, K.; Cardel, B.; Handschin, C. Muscle PGC-1α Is Required for Long-Term Systemic and Local Adaptations to a Ketogenic Diet in Mice. Am. J. Physiol. Endocrinol. Metab. 2017, 312, E437–E446. [Google Scholar] [CrossRef]
  18. Svensson, K.; Albert, V.; Cardel, B.; Salatino, S.; Handschin, C. Skeletal Muscle PGC-1α Modulates Systemic Ketone Body Homeostasis and Ameliorates Diabetic Hyperketonemia in Mice. FASEB J. Off. Publ. Fed. Am. Soc. Exp. Biol. 2016, 30, 1976–1986. [Google Scholar] [CrossRef] [PubMed]
  19. Liu, X.; Wang, Y.; Hou, L.; Xiong, Y.; Zhao, S. Fibroblast Growth Factor 21 (FGF21) Promotes Formation of Aerobic Myofibers via the FGF21-SIRT1-AMPK-PGC1α Pathway. J. Cell. Physiol. 2017, 232, 1893–1906. [Google Scholar] [CrossRef] [PubMed]
  20. Wang, D.S.; Li, Z.L.; Zhang, J.F.; Liu, S.J.; Chen, W.J.; Wang, H.J.; Wang, L.J.; Li, Y.H. A Method for Treadmill Exercise Simulating Weightlessness in Rats and A Rat Weightlessness Simulation Treadmill 2016.
  21. Dougherty, J.P.; Springer, D.A.; Gershengorn, M.C. The Treadmill Fatigue Test: A Simple, High-Throughput Assay of Fatigue-like Behavior for the Mouse. J. Vis. Exp. JoVE 2016, 54052. [Google Scholar] [CrossRef]
  22. Burch, N.; Arnold, A.-S.; Item, F.; Summermatter, S.; Santos, G.B.S.; Christe, M.; Boutellier, U.; Toigo, M.; Handschin, C. Electric Pulse Stimulation of Cultured Murine Muscle Cells Reproduces Gene Expression Changes of Trained Mouse Muscle. PloS One 2010, 5, e10970. [Google Scholar] [CrossRef]
  23. Venturini, C.; Mancinelli, L.; Matacchione, G.; Olivieri, F.; Antonicelli, R. The Cardioprotective Effects of Nutritional Ketosis: Mechanisms and Clinical Implications. Nutrients 2024, 16, 4204. [Google Scholar] [CrossRef] [PubMed]
  24. Jeukendrup, A.E.; Wallis, G.A. Measurement of Substrate Oxidation during Exercise by Means of Gas Exchange Measurements. Int. J. Sports Med. 2005, 26 Suppl 1, S28–37. [Google Scholar] [CrossRef]
  25. Fernando, R.; Drescher, C.; Nowotny, K.; Grune, T.; Castro, J.P. Impaired Proteostasis during Skeletal Muscle Aging. Free Radic. Biol. Med. 2019, 132, 58–66. [Google Scholar] [CrossRef]
  26. Fisher, F.M.; Maratos-Flier, E. Understanding the Physiology of FGF21. Annu. Rev. Physiol. 2016, 78, 223–241. [Google Scholar] [CrossRef]
  27. Abdurrachim, D.; Woo, C.C.; Teo, X.Q.; Chan, W.X.; Radda, G.K.; Lee, P.T.H. A New Hyperpolarized 13C Ketone Body Probe Reveals an Increase in Acetoacetate Utilization in the Diabetic Rat Heart. Sci. Rep. 2019, 9, 5532. [Google Scholar] [CrossRef]
  28. Angelini, A.; Saha, P.K.; Jain, A.; Jung, S.Y.; Mynatt, R.L.; Pi, X.; Xie, L. PHDs/CPT1B/VDAC1 Axis Regulates Long-Chain Fatty Acid Oxidation in Cardiomyocytes. Cell Rep. 2021, 37, 109767. [Google Scholar] [CrossRef] [PubMed]
  29. Dang, Y.; Xu, J.; Zhu, M.; Zhou, W.; Zhang, L.; Ji, G. Gan-Jiang-Ling-Zhu Decoction Alleviates Hepatic Steatosis in Rats by the miR-138-5p/CPT1B Axis. Biomed. Pharmacother. Biomedecine Pharmacother. 2020, 127, 110127. [Google Scholar] [CrossRef] [PubMed]
  30. Maltais, F.; Simard, A.A.; Simard, C.; Jobin, J.; Desgagnés, P.; LeBlanc, P. Oxidative Capacity of the Skeletal Muscle and Lactic Acid Kinetics during Exercise in Normal Subjects and in Patients with COPD. Am. J. Respir. Crit. Care Med. 1996, 153, 288–293. [Google Scholar] [CrossRef] [PubMed]
  31. Beckett, T.L.; Studzinski, C.M.; Keller, J.N.; Paul Murphy, M.; Niedowicz, D.M. A Ketogenic Diet Improves Motor Performance but Does Not Affect β-Amyloid Levels in a Mouse Model of Alzheimer’s Disease. Brain Res. 2013, 1505, 61–67. [Google Scholar] [CrossRef] [PubMed]
  32. Bielohuby, M.; Menhofer, D.; Kirchner, H.; Stoehr, B.J.M.; Müller, T.D.; Stock, P.; Hempel, M.; Stemmer, K.; Pfluger, P.T.; Kienzle, E.; et al. Induction of Ketosis in Rats Fed Low-Carbohydrate, High-Fat Diets Depends on the Relative Abundance of Dietary Fat and Protein. Am. J. Physiol. Endocrinol. Metab. 2011, 300, E65–76. [Google Scholar] [CrossRef]
  33. Bielohuby, M.; Sawitzky, M.; Stoehr, B.J.M.; Stock, P.; Menhofer, D.; Ebensing, S.; Bjerre, M.; Frystyk, J.; Binder, G.; Strasburger, C.; et al. Lack of Dietary Carbohydrates Induces Hepatic Growth Hormone (GH) Resistance in Rats. Endocrinology 2011, 152, 1948–1960. [Google Scholar] [CrossRef] [PubMed]
  34. Ellenbroek, J.H.; van Dijck, L.; Töns, H.A.; Rabelink, T.J.; Carlotti, F.; Ballieux, B.E.P.B.; de Koning, E.J.P. Long-Term Ketogenic Diet Causes Glucose Intolerance and Reduced β- and α-Cell Mass but No Weight Loss in Mice. Am. J. Physiol. Endocrinol. Metab. 2014, 306, E552–558. [Google Scholar] [CrossRef] [PubMed]
  35. Fukushima, A.; Ogura, Y.; Furuta, M.; Kakehashi, C.; Funabashi, T.; Akema, T. Ketogenic Diet Does Not Impair Spatial Ability Controlled by the Hippocampus in Male Rats. Brain Res. 2015, 1622, 36–42. [Google Scholar] [CrossRef]
  36. Parker, B.A.; Walton, C.M.; Carr, S.T.; Andrus, J.L.; Cheung, E.C.K.; Duplisea, M.J.; Wilson, E.K.; Draney, C.; Lathen, D.R.; Kenner, K.B.; et al. β-Hydroxybutyrate Elicits Favorable Mitochondrial Changes in Skeletal Muscle. Int. J. Mol. Sci. 2018, 19, 2247. [Google Scholar] [CrossRef]
  37. Parry, H.A.; Kephart, W.C.; Mumford, P.W.; Romero, M.A.; Mobley, C.B.; Zhang, Y.; Roberts, M.D.; Kavazis, A.N. Ketogenic Diet Increases Mitochondria Volume in the Liver and Skeletal Muscle without Altering Oxidative Stress Markers in Rats. Heliyon 2018, 4, e00975. [Google Scholar] [CrossRef] [PubMed]
  38. Roberts, M.N.; Wallace, M.A.; Tomilov, A.A.; Zhou, Z.; Marcotte, G.R.; Tran, D.; Perez, G.; Gutierrez-Casado, E.; Koike, S.; Knotts, T.A.; et al. A Ketogenic Diet Extends Longevity and Healthspan in Adult Mice. Cell Metab. 2018, 27, 1156. [Google Scholar] [CrossRef]
  39. Martín-Moraleda, E.; Delisle, C.; Collado Mateo, D.; Aznar-Lain, S. [Weight loss and body composition changes through ketogenic diet and physical activity: a methodological and systematic review]. Nutr. Hosp. 2019, 36, 1196–1204. [Google Scholar] [PubMed]
  40. Sahagun, E.; Ward, L.M.; Kinzig, K.P. Attenuation of Stress-Induced Weight Loss with a Ketogenic Diet. Physiol. Behav. 2019, 212, 112654. [Google Scholar] [CrossRef] [PubMed]
  41. Zhang, J.; Chen, B.; Zou, K. Effect of Ketogenic Diet on Exercise Tolerance and Transcriptome of Gastrocnemius in Mice. Open Life Sci. 2023, 18, 20220570. [Google Scholar] [CrossRef] [PubMed]
  42. Shimizu, K.; Saito, H.; Sumi, K.; Sakamoto, Y.; Tachi, Y.; Iida, K. Short-Term and Long-Term Ketogenic Diet Therapy and the Addition of Exercise Have Differential Impacts on Metabolic Gene Expression in the Mouse Energy-Consuming Organs Heart and Skeletal Muscle. Nutr. Res. N. Y. N 2018, 60, 77–86. [Google Scholar] [CrossRef]
  43. Wallace, M.A.; Aguirre, N.W.; Marcotte, G.R.; Marshall, A.G.; Baehr, L.M.; Hughes, D.C.; Hamilton, K.L.; Roberts, M.N.; Lopez-Dominguez, J.A.; Miller, B.F.; et al. The Ketogenic Diet Preserves Skeletal Muscle with Aging in Mice. Aging Cell 2021, 20, e13322. [Google Scholar] [CrossRef] [PubMed]
  44. Zhou, Z.; Vidales, J.; González-Reyes, J.A.; Shibata, B.; Baar, K.; Rutkowsky, J.M.; Ramsey, J.J. A 1-Month Ketogenic Diet Increased Mitochondrial Mass in Red Gastrocnemius Muscle, but Not in the Brain or Liver of Middle-Aged Mice. Nutrients 2021, 13, 2533. [Google Scholar] [CrossRef] [PubMed]
  45. Bilodeau, P.A.; Coyne, E.S.; Wing, S.S. The Ubiquitin Proteasome System in Atrophying Skeletal Muscle: Roles and Regulation. Am. J. Physiol. Cell Physiol. 2016, 311, C392–403. [Google Scholar] [CrossRef] [PubMed]
  46. Stein, T.P.; Wade, C.E. Metabolic Consequences of Muscle Disuse Atrophy. J. Nutr. 2005, 135, 1824S–1828S. [Google Scholar] [CrossRef]
  47. Ciciliot, S.; Rossi, A.C.; Dyar, K.A.; Blaauw, B.; Schiaffino, S. Muscle Type and Fiber Type Specificity in Muscle Wasting. Int. J. Biochem. Cell Biol. 2013, 45, 2191–2199. [Google Scholar] [CrossRef] [PubMed]
  48. Wang, Y.; Pessin, J.E. Mechanisms for Fiber-Type Specificity of Skeletal Muscle Atrophy. Curr. Opin. Clin. Nutr. Metab. Care 2013, 16, 243–250. [Google Scholar] [CrossRef] [PubMed]
  49. Rowan, S.L.; Rygiel, K.; Purves-Smith, F.M.; Solbak, N.M.; Turnbull, D.M.; Hepple, R.T. Denervation Causes Fiber Atrophy and Myosin Heavy Chain Co-Expression in Senescent Skeletal Muscle. PloS One 2012, 7, e29082. [Google Scholar] [CrossRef] [PubMed]
  50. Aare, S.; Spendiff, S.; Vuda, M.; Elkrief, D.; Perez, A.; Wu, Q.; Mayaki, D.; Hussain, S.N.A.; Hettwer, S.; Hepple, R.T. Failed Reinnervation in Aging Skeletal Muscle. Skelet. Muscle 2016, 6, 29. [Google Scholar] [CrossRef] [PubMed]
  51. Roberts, B.M.; Deemer, S.E.; Smith, D.L.; Mobley, J.A.; Musi, N.; Plaisance, E.P. Effects of an Exogenous Ketone Ester Using Multi-Omics in Skeletal Muscle of Aging C57BL/6J Male Mice. Front. Nutr. 2022, 9. [Google Scholar] [CrossRef]
  52. Demirel, H.A.; Powers, S.K.; Naito, H.; Hughes, M.; Coombes, J.S. Exercise-Induced Alterations in Skeletal Muscle Myosin Heavy Chain Phenotype: Dose-Response Relationship. J. Appl. Physiol. Bethesda Md 1985 1999, 86, 1002–1008. [Google Scholar] [CrossRef] [PubMed]
  53. Ogura, Y.; Naito, H.; Kakigi, R.; Akema, T.; Sugiura, T.; Katamoto, S.; Aoki, J. Different Adaptations of Alpha-Actinin Isoforms to Exercise Training in Rat Skeletal Muscles. Acta Physiol. Oxf. Engl. 2009, 196, 341–349. [Google Scholar] [CrossRef] [PubMed]
  54. Ogura, Y.; Naito, H.; Kakigi, R.; Ichinoseki-Sekine, N.; Kurosaka, M.; Katamoto, S. Alpha-Actinin-3 Levels Increase Concomitantly with Fast Fibers in Rat Soleus Muscle. Biochem. Biophys. Res. Commun. 2008, 372, 584–588. [Google Scholar] [CrossRef]
  55. K, S.; H, S.; K, S.; Y, S.; Y, T.; K, I. Short-Term and Long-Term Ketogenic Diet Therapy and the Addition of Exercise Have Differential Impacts on Metabolic Gene Expression in the Mouse Energy-Consuming Organs Heart and Skeletal Muscle. Nutr. Res. N. Y. N 2018, 60. [Google Scholar]
  56. Ogura, Y.; Kakehashi, C.; Yoshihara, T.; Kurosaka, M.; Kakigi, R.; Higashida, K.; Fujiwara, S.-E.; Akema, T.; Funabashi, T. Ketogenic Diet Feeding Improves Aerobic Metabolism Property in Extensor Digitorum Longus Muscle of Sedentary Male Rats. PloS One 2020, 15, e0241382. [Google Scholar] [CrossRef] [PubMed]
  57. Ma, S.; Huang, Q.; Tominaga, T.; Liu, C.; Suzuki, K. An 8-Week Ketogenic Diet Alternated Interleukin-6, Ketolytic and Lipolytic Gene Expression, and Enhanced Exercise Capacity in Mice. Nutrients 2018, 10, 1696. [Google Scholar] [CrossRef] [PubMed]
  58. Fritzen, A.M.; Lundsgaard, A.-M.; Kiens, B. Tuning Fatty Acid Oxidation in Skeletal Muscle with Dietary Fat and Exercise. Nat. Rev. Endocrinol. 2020, 16, 683–696. [Google Scholar] [CrossRef] [PubMed]
  59. Espinoza, D.O.; Boros, L.G.; Crunkhorn, S.; Gami, H.; Patti, M.-E. Dual Modulation of Both Lipid Oxidation and Synthesis by Peroxisome Proliferator-Activated Receptor-Gamma Coactivator-1alpha and -1beta in Cultured Myotubes. FASEB J. Off. Publ. Fed. Am. Soc. Exp. Biol. 2010, 24, 1003–1014. [Google Scholar]
  60. Wong, K.E.; Mikus, C.R.; Slentz, D.H.; Seiler, S.E.; DeBalsi, K.L.; Ilkayeva, O.R.; Crain, K.I.; Kinter, M.T.; Kien, C.L.; Stevens, R.D.; et al. Muscle-Specific Overexpression of PGC-1α Does Not Augment Metabolic Improvements in Response to Exercise and Caloric Restriction. Diabetes 2015, 64, 1532–1543. [Google Scholar] [CrossRef] [PubMed]
  61. Li, X.; Li, Z.; Zhao, M.; Nie, Y.; Liu, P.; Zhu, Y.; Zhang, X. Skeletal Muscle Lipid Droplets and the Athlete’s Paradox. Cells 2019, 8, 249. [Google Scholar] [CrossRef]
  62. Cox, P.J.; Clarke, K. Acute Nutritional Ketosis: Implications for Exercise Performance and Metabolism. Extreme Physiol. Med. 2014, 3, 17. [Google Scholar] [CrossRef]
  63. Sasai, H.; Aoyama, Y.; Otsuka, H.; Abdelkreem, E.; Naiki, Y.; Kubota, M.; Sekine, Y.; Itoh, M.; Nakama, M.; Ohnishi, H.; et al. Heterozygous Carriers of Succinyl-CoA:3-Oxoacid CoA Transferase Deficiency Can Develop Severe Ketoacidosis. J. Inherit. Metab. Dis. 2017, 40, 845–852. [Google Scholar] [CrossRef]
  64. Puchalska, P.; Crawford, P.A. Multi-Dimensional Roles of Ketone Bodies in Fuel Metabolism, Signaling, and Therapeutics. Cell Metab. 2017, 25, 262–284. [Google Scholar] [CrossRef] [PubMed]
Figure 1. Schematic overview of experimental design.
Preprints 146106 g001
Figure 2. Successful establishment of the ketogenic diet mouse model. (A) Weekly changes in mouse body weight. (B) Weekly variations in blood ketone levels. (C) Weekly fluctuations in blood glucose levels. (D) Changes in the respiratory exchange ratio. The data are presented as the means ± SD. *P < 0.05, **P < 0.01, compared with the normal diet control group. NC: normal diet control group; KC: ketogenic diet control group; RER: respiratory exchange ratio.
Preprints 146106 g002
Figure 3. Effect of the ketogenic diet on weightlessness model mice. (A) Body weight fluctuations in the mice before and after the hindlimb unloading. (B) Ratio of soleus muscle wet weight to body weight across groups. (C) Representative western blot images of MuRF-1. (D) Protein expression of MuRF-1 in the soleus muscle. mRNA expression of MuRF-1 (E), Atrogin1 (F) in the soleus muscle. The data are presented as the means ± SD. aP < 0.05, aaP < 0.01 compared with before HU; *P < 0.05, **P < 0.01 compared with the control group; #P < 0.05, ##P < 0.01 compared with the diet groups. BW: body weight; NC: normal diet control group; NH: normal diet + hindlimb unloading group; NHE: normal diet + hindlimb unloading + exercise group; KC: ketogenic diet control group; KH: ketogenic diet + hindlimb unloading group; KHE: ketogenic diet + hindlimb unloading + exercise group.
Preprints 146106 g003
Figure 4. Effects of the KD and KD combined with exercise on skeletal muscle tissue in mice. PAS (A) and Oil Red O (B) staining of the soleus muscle. Percentage of PAS (C) and Oil Red O (D) -stained area in the soleus muscle. Changes in blood ketone (E) and blood glucose (F) levels before and after a single exhaustive exercise in each group of mice. The data are presented as the means ± SD. *P < 0.05, **P < 0.01 compared between diet groups; #P < 0.05, ##P < 0.01 compared within diet groups.
Preprints 146106 g004
Figure 5. Effects of a KD or KD combined with exercise on muscle fiber composition in the soleus muscles of mice. Representative immunofluorescence images of MHC-I (blue, A), MHC-IIa (red, B), MHC-IIb (green, C) muscle fibers in the soleus muscle. The proportion of MHC-I (D), MHC-IIa (E), MHC-IIb (F) muscle fibers in the soleus muscle. The data are presented as the means ± SD. *P < 0.05, **P < 0.01 indicate comparisons between diet groups; #P < 0.05, ##P < 0.01 indicate comparisons within each diet group.
Preprints 146106 g005
Figure 6. Effects of a ketogenic diet or ketogenic diet combined with exercise on skeletal muscle protein and mRNA expression. Representative western blot images of PGC-1α, SIRT1, FGF21 (A) and CPT-1b, OXCT, HADH (H). Protein expression of PGC-1α (B), SIRT1 (C), FGF21 (D) and CPT-1b (I), OXCT (J), HADH (K) in the soleus muscle. mRNA expression of PGC-1α (E), SIRT1 (F), FGF21 (G) and CPT-1b (L), OXCT (M), HADH (N) in the soleus muscle. The data are presented as the means ± SD. *P < 0.05, **P < 0.01, denoting comparisons between diet groups; #P < 0.05, ##P < 0.01, reflecting comparisons within diet groups.
Preprints 146106 g006
Table 1. Description of primers used for quantitative real-time PCR.
Gene Name Forward Primer Reverse Primer
Atrogin1 5′-TCAGCAGCCTGAACTACGAC -3′ 5′-GCGCTCCTTCGTACTTCCTT -3′
MURF-1 5’-GTGTGAGGTGCCTACTTGCT-3’ 5’-GACTTTTCCAGCTGCTCCCT-3’
PGC-1α 5′- AGCCGTGACCACTGACAACGAG-3′ 5′- GCTGCATGGTTCTGAGTGCTAAG-3′
SIRT1 5′- TACCTTGGAGCAGGTTGCAG-3′ 5′- GCACCGAGGAACTACCTGAT-3′
FGF21 5′- GCATACCCCATCCCTGACTC-3′ 5′- GGATCAAAGTGAGGCGATCC-3′
CPT-1b 5′-TTCAACACTACACGCATCCC-3′ 5′-GCCCTCATAGAGCCAGACC-3′
HADH 5′-ACACCTTCATTCGCCATATTGC-3′ 5′-TCGGTGAATTTTCTGTAGACCAC-3′
OXCT 5′-CCCATACCCACTGAAAGACGAA-3′ 5′- CTGGAGAAGAAAGAGGCTCCTG-3′
18s 5′-GGGAGCCTGAGAAACGGC-3′ 5′-GGGTCGGGAGTGGGTAATTT-3′
Table 2. Plasma metabolic parameters.
TC
(mmol/L)
TG
(mmol/L)
HDL-C
(mmol/L)
LDL-C
(mmol/L)
UREA
(mmol/L)
Insulin
(ng/mL)
NC 1.35 ± 0.15 0.38 ± 0.07 1.18 ± 0.09 0.17 ± 0.03 9.57 ± 0.37 0.97 ± 0.21
NH 1.29 ± 0.23 0.58 ± 0.18 1.12 ± 0.13 0.18 ± 0.06 9.28 ± 0.34 1.72 ± 0.58##
NHE 1.24 ± 0.21 0.59 ± 0.29 1.09 ± 0.21 0.20 ± 0.06 8.33 ± 0.30 1.44 ± 0.56##
KC 2.16 ± 0.20** 0.63 ± 0.20** 1.90 ± 0.12** 0.27 ± 0.04** 9.31 ± 0.80** 1.51 ± 0.59*
KH 1.96 ± 0.23#** 0.99 ± 0.16##** 1.64 ± 0.27##** 0.25 ± 0.03** 9.53 ± 0.85** 1.38 ± 0.51**
KHE 1.79± 0.36##** 0.74 ± 0.29# 1.55 ± 0.38##** 0.23 ± 0.03## 9.25 ± 0.42** 1.65 ± 0.71**
Note: The data are presented as the means ± SD. *P < 0.05, **P < 0.01, compared between diet groups; #P < 0.05, ##P < 0.01, compared within diet groups. TC: total cholesterol; TG: triglycerides; HDL-C: high-density lipoprotein cholesterol; LDL-C: low-density lipoprotein cholesterol; VLDL-C: very low-density lipoprotein cholesterol.
Table 3. The effects of exercise capacity in mice.
LD (mmol/L) UREA (mmol/L) CK
(U/L)
LDH
(U/L)
Time
(min)
NC 1.81±0.26 9.57±0.37 850±310 513±166 136 ± 15
NH 2.41±0.53## 9.27±0.34 866±260 655±97 83 ± 24##
NHE 2.32±0.34## 8.33±0.30 749±275 547±113 84 ± 30##
KC 2.43±0.39** 9.20±0.71 981±233 521±180 152 ± 18
KH 2.23±0.46 9.26±0.61 863±315 615±272 81 ± 36##
KHE 2.03±0.34## 9.26±0.49 955±288 486±286 136 ± 26##*
Note: Values are expressed as the means ± SD. *P < 0.05, **P < 0.01, denoting comparisons between diet groups; #P < 0.05, ##P < 0.01, reflecting comparisons within diet groups. LD: Lactate; UREA: urea nitrogen; CK: Creatine kinase; LDH: Lactate dehydrogenase.
Disclaimer/Publisher’s Note: The statements, opinions and data contained in all publications are solely those of the individual author(s) and contributor(s) and not of MDPI and/or the editor(s). MDPI and/or the editor(s) disclaim responsibility for any injury to people or property resulting from any ideas, methods, instructions or products referred to in the content.
Copyright: This open access article is published under a Creative Commons CC BY 4.0 license, which permit the free download, distribution, and reuse, provided that the author and preprint are cited in any reuse.

Downloads

63

Views

45

Comments

0

Subscription

Notify me about updates to this article or when a peer-reviewed version is published.

Email

Prerpints.org logo

Preprints.org is a free preprint server supported by MDPI in Basel, Switzerland.

Subscribe

© 2025 MDPI (Basel, Switzerland) unless otherwise stated