Submitted:
20 January 2025
Posted:
20 January 2025
You are already at the latest version
Abstract
The numerical calculations are performed to estimate PM deposition-oxidation process within the DPF. The results are obtained using the newly constructed numerical model and the calculation technique will enable the qualitative examination after changing the catalys-implified filter.
Keywords:
PM Trapping
; PM deposition-oxidation process
Introduction
The diesel engine has a high heat efficiency, high torque, and good fuel consumption. However, the exhaust gas from diesel engines has several problems. The exhaust gas from diesel engines includes nitrogen oxide (Nox) and particulate matter (PM) more than that from gasoline engines.
In particular, PM in the air induces environmental pollution and health problems. Therefore, the governments of various countries strengthen the environmental regulation of automobile exhaust gas. Therefore, fundamental/drastic progress is desired to improve the performance of the reduction technology of the PM emission from diesel vehicles [1,2,3,4,5]. For the reduction of the PM emission, the diesel particulate filter (DPF) is used.[6] Generally, the body of the DPF is made of a porous ceramic (SiC, cordierite) and has a porous honeycomb structure in the direction parallel to the exhaust flow. This particular structure traps the PM and filters it out from the exhaust gas.
Figure 1 illustrates the trapping process of the PM in the DPF. The entrances and exits of numerous channel holes of the DPF are alternately sealed. The PM and exhaust gas flow from the flow channel of the unsealed pore. While the exhaust gas passes through the wall surface of the DPF, the PM is trapped at the wall. Then finally, only the exhaust gas can escape to the adjacent plugged hole. The thickness of the wall surface of the DPF is generally about 300 - 400 μm. The pressure drop, the difference between the pressure measured at the front of the filter and the rear of the filter, increases when the PM deposits in the filter.
Since the increase of the pressure drop burdens the engine, regular removal of the PM by oxidation (referred to as the regeneration) is required (Figure 2). PM burns at a temperature of about 650 ℃, and the regeneration is performed by increasing the temperature of the exhaust gas by an extra-oxidation of the fuel, in addition to the oxidation necessary for driving. Thus, frequent regeneration directly leads to an increase in fuel consumption for regeneration. The consumption of fuel is improved if the timing of regeneration is optimized. Oxidation of PM at low temperatures reduces fuel consumption. Generally, a catalyst is used to realize low-temperature oxidation of the PM. The PM oxidation temperature can be lowered by placing the PM oxidation catalyst at an appropriate position in the DPF. In order to an optimal design of the DPF, we must understand the phenomena in the DPF of PM deposition and PM oxidation temperature.
Various catalysts for PM oxidation have been investigated up to the present[reference]. However, in the design guideline of the catalyst built-in DPF, the research which connected the micro viewpoint by the catalyst in the PM combustion with the macroscopic phenomenon has not been done until now. Because it is difficult to incorporate past results into experiments to confirm the overall behavior of the DPF. In addition, the precise experimental of the PM deposition and oxidation processes is difficult by the complex structure of the DPF. Thus, the experiment is difficult on the full-size DPF. The aim of our research is to understand the trapping and oxidation process of PM on the DPF with catalyst. In this study, we used that the past our model to the DPF. In addition, this paper presents a model that divides the soot oxidation process into more details. We assume that this model is divided into the following two parts (Figure 3).
1) Reaction to soot in contact with the catalyst (called solid-state reaction: SSR)
2) Reaction to soot that is not in contact with the catalyst (referred to as a gas-phase reaction: GPR)
In this study, we aim to build a model that the oxidation state of soot is divided into two, and the model which incorporated each phenomenon in one is constructed. In addition, the model assumes that there is tight contact between soot and catalyst on the surface of DPF. In addition, the results of the particulate catalyst and PM and TG by controlling the frequency factor using a converter model is using for the calculation [22]. Under such a situation, we are tried to clarify the behavior of PM regeneration in side DPF with catalyst by numerical calculation. We show these results in a three-dimensional graph. The result of the study is useful for a better design of a DPF with catalyst.
Method
Calculation Model for PM Trapping Process
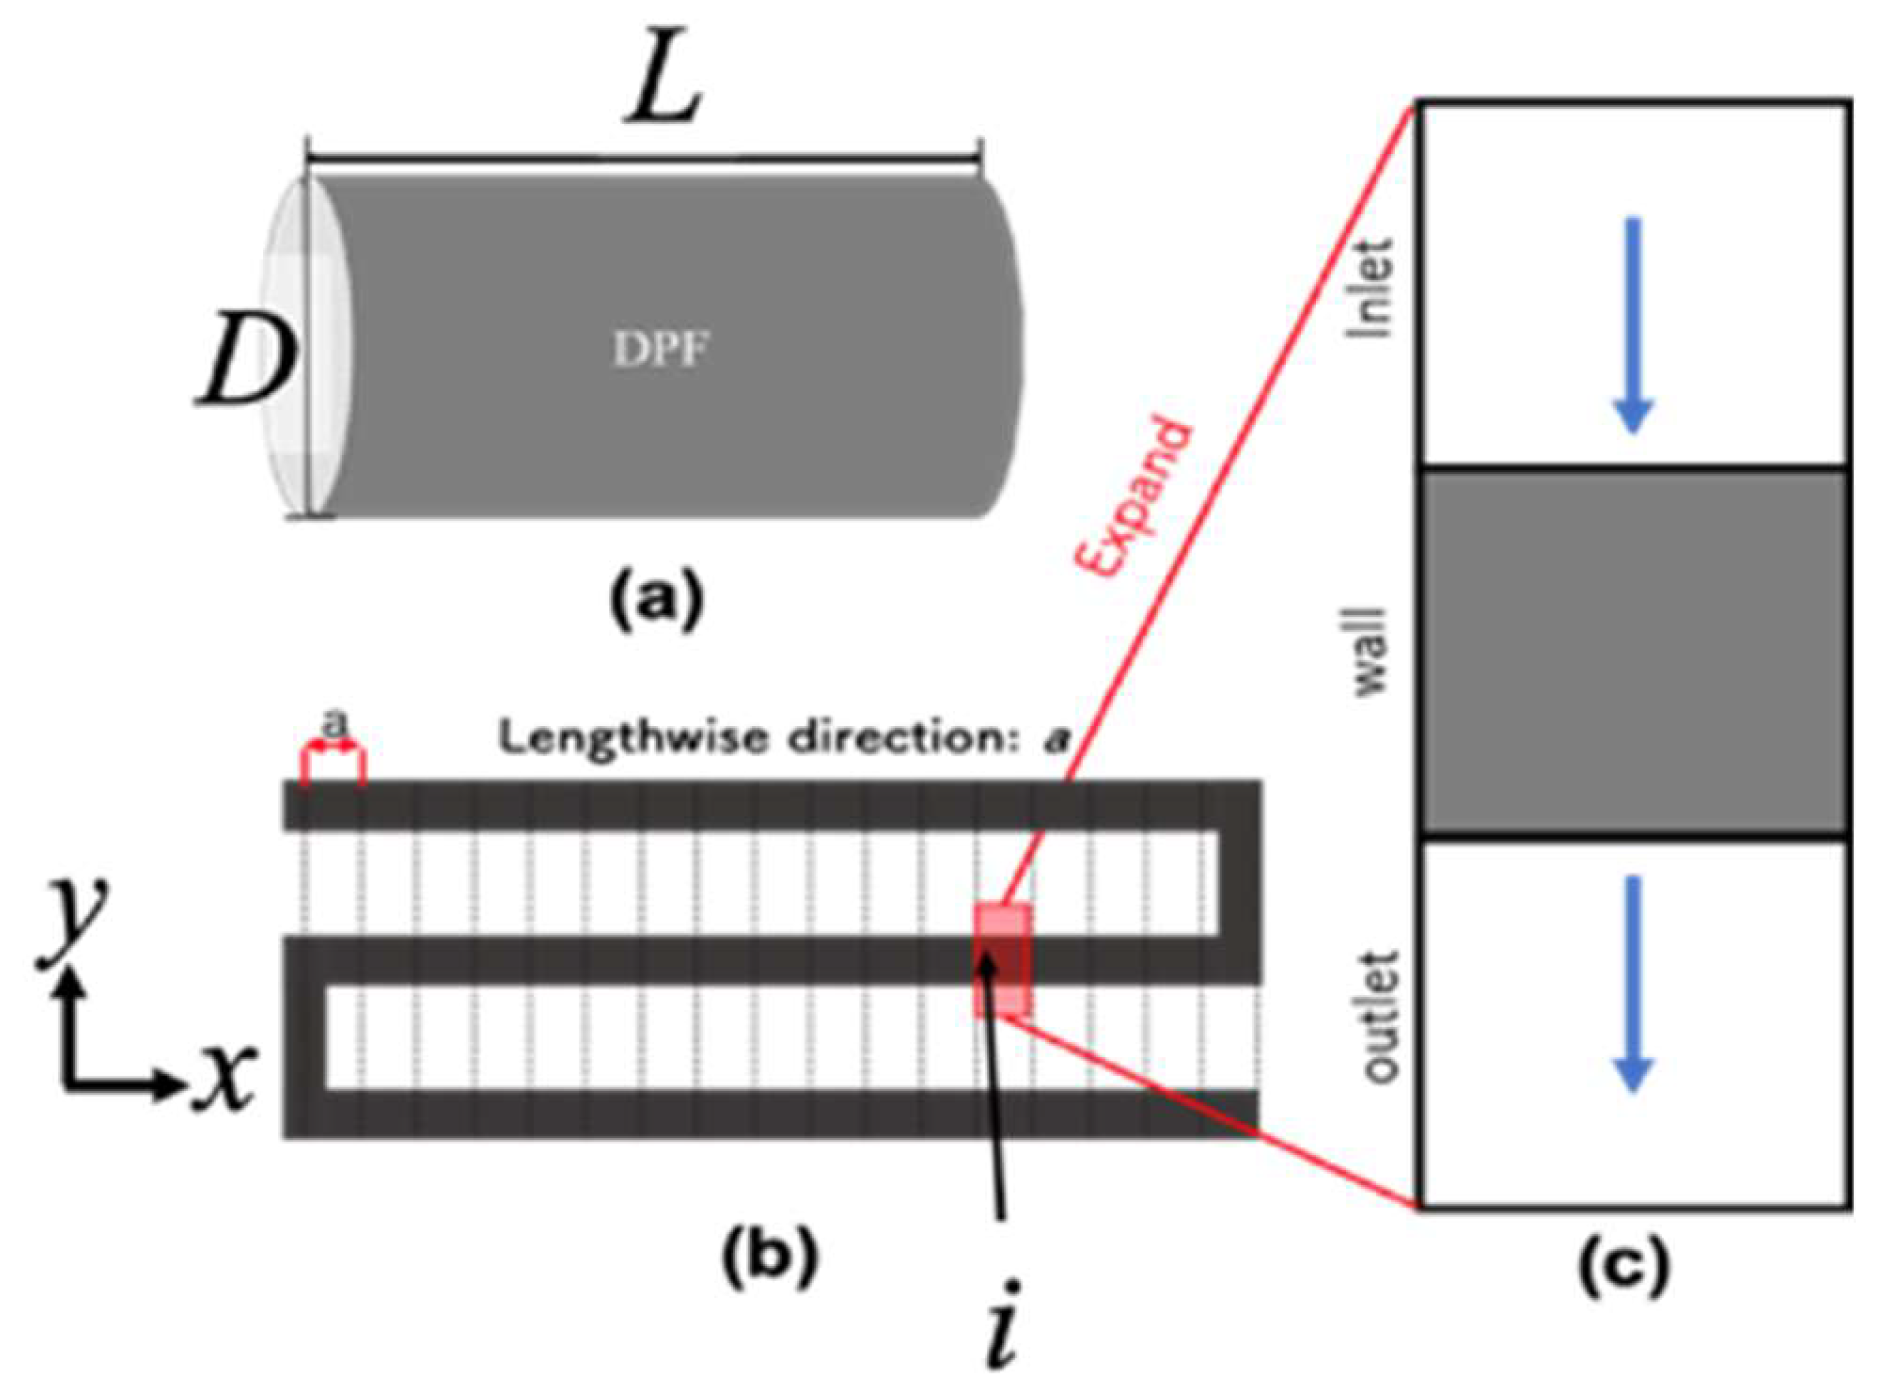
In this study, the numerical calculation was performed using the new DPF model with two modifications to the numerical calculation model of the previous study (10 to 16). The calculation model is shown below. The conceptual diagram of DPF is shown in Figure 4 (a), and the cross-sectional view is shown in Fig. 4 (b).
Exhaust Gas Flow in the DPF Length Direction (x-Direction)
This section describes the exhaust gas flow in the length direction (x-direction) of the DPF. As shown in Fig. 4 (b), the total exhaust gas flow rate entering the DPF, denoted as ΣFi [m³/s], is distributed among individual cells.
Each cell's flow rate Fni [m³/s] is determined by the cell flow velocity vni [m/s] and the fluid passage cross-sectional area σ [m²].
The pressure drop across the filter is characterized by the pipe friction coefficient λ, the effective length including PM deposit (Lwp + PM) [m], the characteristic diameter Dwalls [m], the mean flow velocity V [m/s], and the fluid density ρ [kg/m³], following the equation:
For initial PM deposition (when deposition begins from a clean filter state), we assume uniform distribution of PM-containing gas flow across all cells. Additionally, the pressure is assumed to be constant across all cells in the y-direction. The calculations are performed sequentially, starting from the i-th cell and progressing to the (i+1)-th cell. The following sections detail the PM deposition within the DPF wall, temperature considerations, PM oxidation, and oxidation reaction sites.
Figure 4.
Illustration of our DPF model for calculation. (a) Illustration of DPF with a total length of L and the diameter is D. (b) Cross-section of DPF. (c) One of each cell. It has an inlet a wall and an outlet.
Figure 4.
Illustration of our DPF model for calculation. (a) Illustration of DPF with a total length of L and the diameter is D. (b) Cross-section of DPF. (c) One of each cell. It has an inlet a wall and an outlet.
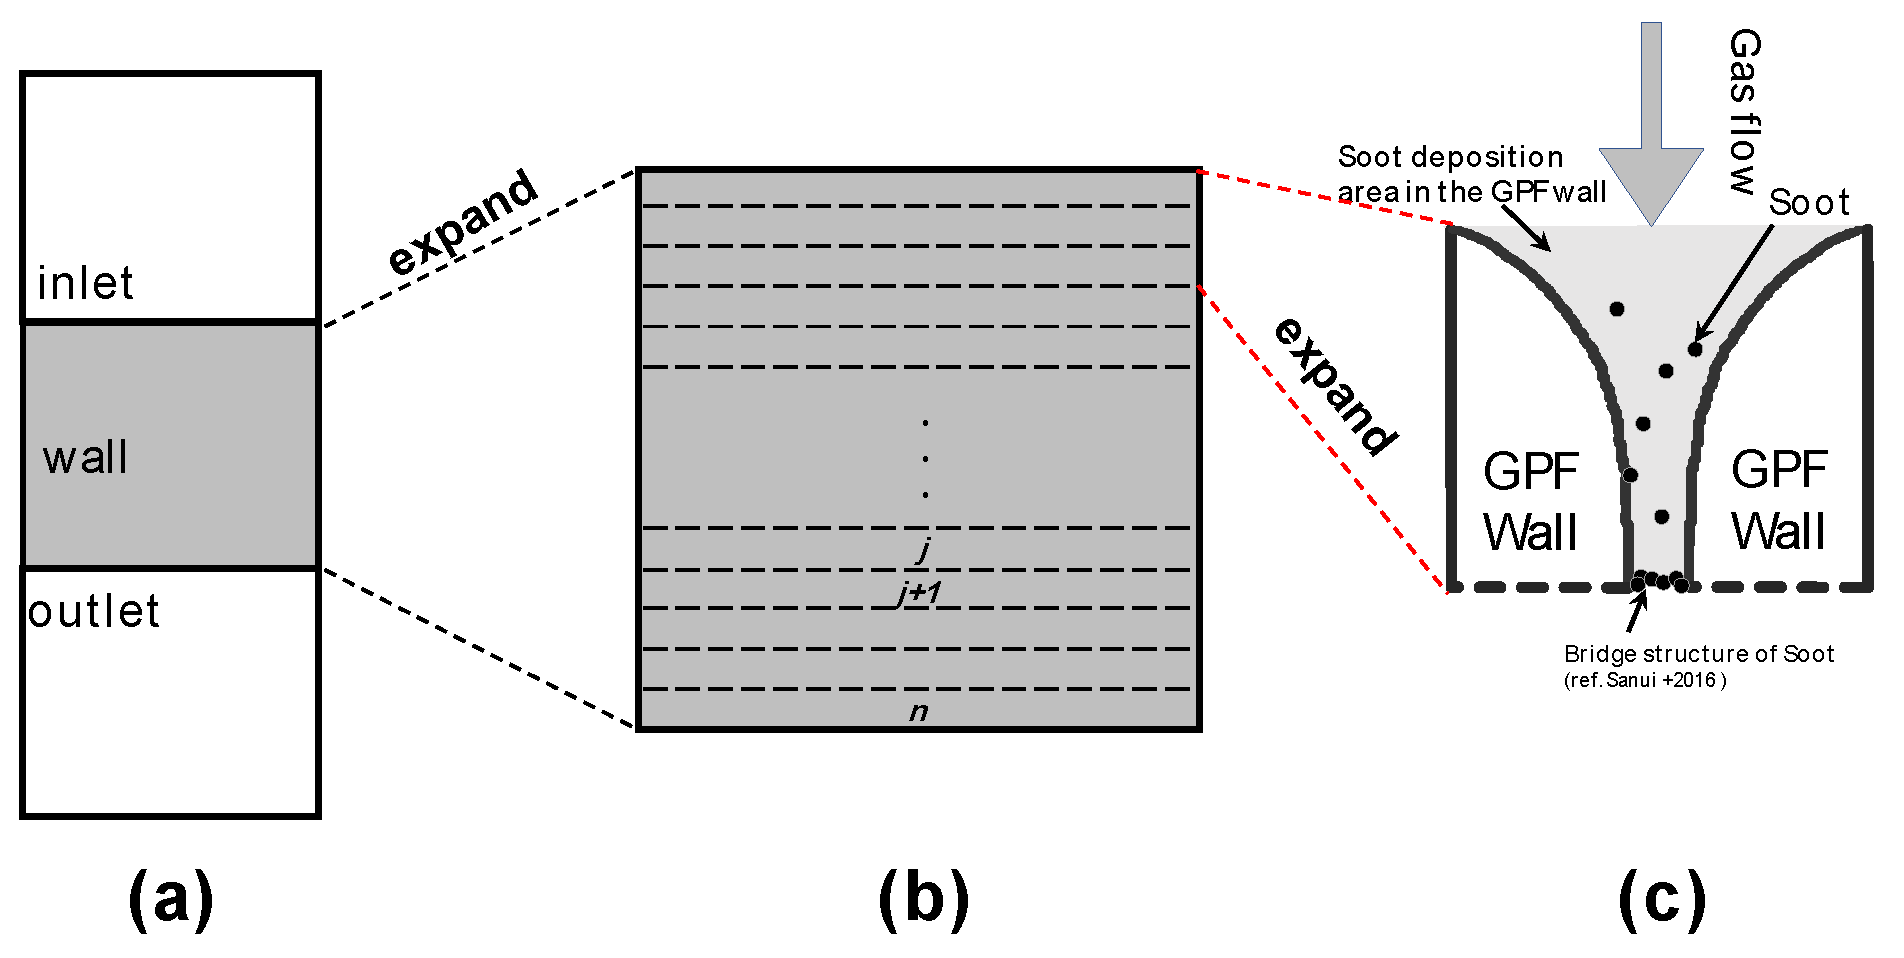
Sedimentation Inside the DPF Wall
Here, what will explain PM deposition inside the DPF wall. In previous studies, it has been reported that PM is cross-linked near the surface of the DPF wall several tens of μm immediately after the start of PM deposition (9). And then, PM is deposited only on the surface from the cross-linked site. In other words, the model in this study newly corrected that PM is deposited only on the surface of the wall instead of collecting PM over the entire thickness of the DPF wall. It has been reported that the porosity changes from the wall surface to the deep part (14). Therefore, it is assumed that the PM deposition rate decreases exponentially from the surface to the deep part (Figure 4).
Figure 4.
Conceptual diagram of DPF cross section (y-direction).
Calculation Model for the Regeneration Process
We study that the PM oxidation process on the DPF with a catalyst by a calculation model. Thereafter, the calculation is started with the PM oxidation by the following model. In the reaction equation of the PM oxidation process, the deposited PM is completely combusted to form CO2 directly. The chemical reaction formula of this step is
PM(C) + O2 → CO2
The PM oxidation reaction rate per unit time in the above reaction is
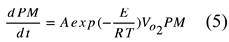
Where A is the frequency factor, PM is the PM content, Vo2 is the inflow oxygen content per total gas volume, E is the activation energy, R is the gas constant, and T is the temperature in [K]. Then, to calculate the temperature change, the thermal conduction between PM particles is assumed to be negligible. In the oxidation reaction, the gas and particles are assumed to be at the same temperature. We also neglected the effect of radiation and convection in PM oxidation. This is because PM is sparsely distributed in the gas layer with fine particles of several m. The heat capacity Q of the cell is given by

Here, V [mL] is the volume of the cell, S [mol] is the passage amount of the gas, μ is the transmittance of the DPF wall, CC and dc are the specific heat and density of the wall material (e.g. cordierite), and Cg is the specific heat of the exhaust gas.
In addition, the temperature rises ΔT [K] is expressed by
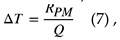
where RPM is the reaction amount. The following formula shows RPM.
Here, it is assumed that the PM is oxidized, and the temperature is maintained. On the other hand, the gas moves between cells while its temperature is preserved When PM oxidation of the neighboring cell begins, the temperature of the gas inlet sidewall, prior to the reaction, must be the same as the gas temperature. When the temperature of the gas is high, the following equation applies:
where TRis the modified temperature [K], TWis the wall temperature [K], and TPMis the oxidation temperature of PM [K]. Consider the temperature change associated with PM oxidation between the unit cells j and j+1 in y direction. Temperature increases when PM remains and heat is generated in oxidation, but the temperature decreases when the PM is eliminated. On the other hand, in the x direction, it is expected that there is a temperature rise due to a heat accumulation caused by the PM oxidation. The conditions in Table 1 and Table 2 are used in this study. Incidentally, in the first calculation of the PM oxidation, after calculating from the inlet to the back of the DPF inlet path side, the result as the temperature initial value, is calculated thereafter. In addition, the activation energy E of SSR and GPR is shown in Table 3.
Converter model
Previous studies and development of catalysts have been carried out in powder state by physically mixing catalysts and soot. In practice, the catalyst is applied to the interior of the DPF and used. Therefore, there is a soot combustion reaction difference between the catalyst of the powder state and the catalyst on the DPF. Because the contact state (frequency factor) between the powder and the DPF is different. We are making a model that convert the frequency factor of the reaction inside the DPF. The reaction's frequency factor is considered to depend on the specific surface area that the PM and catalyst can contact. Therefore, we thought that we could convert the frequency factor inside the DPF by taking the powder ratio to the specific surface area inside the DPF.
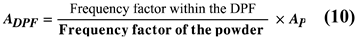
Where ADPF is the frequency factor in DPF and Ap is the frequency factor for Powder. For this reason, we modelled the contact condition between PM and catalyst and formulated the specific surface area for the two conditions: the powder and the inside of the DPF. We used this model to convert the frequency factor of particulate catalysts and used it to calculate this study.
Result
3D and 2D Mapping of Amount of PM Remaining
Figure 5 and Figure 6 present complementary visualizations of the regeneration conditions' dependence on various parameters. The data is shown for different initial PM deposition quantities (1g, 10g, 20g, and 30g), with the following key variables:
- X-axis: Activation energy
- Y-axis: Exhaust gas temperature
- Z-axis (Fig. 5): Remaining PM per unit deposit
- Color scale (Fig. 6): PM remaining amount (red indicating high amounts, blue indicating low amounts)
The results reveal distinct patterns based on initial PM deposition amounts:For low PM deposition (1g):
Low activation energy conditions (90-100 kJ/mol) achieve PM reduction below 0.5g even at 600°C
- Higher activation energies (>120 kJ/mol) require temperatures above 700°C for effective PM reduction
For moderate PM deposition (10g):
- Effective PM reduction (below 0.5g) requires:
- Temperatures ≥650°C at 90 kJ/mol activation energy
- Temperatures ≥750°C at 120 kJ/mol activation energy
For high PM deposition (20-30g):
- More severe conditions are required for effective regeneration
- At 90 kJ/mol activation energy, temperatures ≥650°C are needed
- At 100 kJ/mol, temperatures around 700°C are required
- At 120 kJ/mol, temperatures near 800°C become necessary
- Lower temperatures result in significant PM retention (>10g)
The catalyst's effectiveness is notably influenced by PM-catalyst contact:
- For small PM deposits, direct catalyst contact enables efficient combustion even at lower temperatures
- Larger PM deposits reduce direct catalyst contact, making gas-phase reactions more dominant
- Higher temperatures become increasingly important for larger deposits due to reduced catalyst contact
These results demonstrate that optimal regeneration conditions depend significantly on both the initial PM deposit amount and the catalyst's activation energy, with the contact between PM and catalyst playing a crucial role in the regeneration efficiency.
Dependence of Exhaust Gas Temperature and Amount of Remaining PM
Figure 7 shows the exhaust gas temperature dependence of the amount of PM remaining. In this case, activation energy is 100 kJ/mol, exhaust flow rate GA is 30 g/s, PM amount is 1 g, 10 g, 20 g, and 30 g, and temperature is 600, 650,700, 750, 800 ℃.In the case of the 600 ℃of the exhaust gas, PM is largely remaining on the DPF. When the amount of PM deposit is 30 g, the amount of unburned PM is 10.29 g. On the other hand, when the amount of PM deposit is 1g, the amount of unburned PM is 0.35 g. However, when the temperature of the exhaust gas becomes higher, there is a difference in the PM combustion amount. When the temperature of the exhaust gas is 650 ℃, the remaining amount of PM burned is as small as 2.7 g even when the PM accumulation amount is 30 g.
Figure 8 shows plotted pressure drop vs. elapsed time at the case of the amount of PM deposited 1 g and 30 g. First, we describe the case where the PM deposition amount is 1 g. In the case of the exhaust gas temperature is 600 ℃, despite the burning residue is 0.35 g, the pressure loss is as low as 11.21 kPa. When the exhaust gas temperature is 800 ℃, the pressure drop is as high as 12.77 kPa even if the remaining PM becomes almost 0 g. This is the effect of thermal expansion by the exhaust gas temperature. Though there is the amount of remaining PM when you want to keep the pressure loss drop, it seems to be desirable in the combustion of exhaust gas of low temperature.
In the case of PM deposition amount is 30 g. When the amount of PM deposited is large, a sudden increase in pressure drop occurs in 100 seconds after the start of the regeneration process. In the case of exhaust gas temperature is 800 ℃, the pressure drop is107 kPa. And after about 300 seconds the pressure drop decreases and remains almost unchanged until after 5400 seconds. However, in the case exhaust gas temperature is 600 ℃, the amount of PM is not decreased. When the exhaust gas temperature is 600 ℃, both the amount of PM remaining and the pressure drop are as high as 10.29 g and 33.12 kPa, respectively. When the exhaust gas temperature is 800 ℃, the residual burn is approximately 0 g and the pressure loss is 12.77 kPa. However, even when the temperature of the exhaust gas is 700 ℃. the pressure loss is as low as only 12.72 kPa, despite the presence of 0.61 g of residual burning. In addition, when the exhaust gas temperature was 750 ℃, the pressure loss was the lowest as 12.30 kPa with 0.04 g of the amount of PM remaining. It is proven that the reaction with the gas phase became more significant than the part in contact with the catalyst from the result of the case in which the temperature of the exhaust gas is low. In addition, it is suggested that the pressure loss rises, irrespective of the activation energy when the PM quantity is large. When it is desired to suppress the pressure loss even when the amount of PM deposited is high, it is considered desirable to suppress the exhaust gas to about 700 to 750 ℃.
Impact of Activation Energy.
Figure 9, Figure 10, and Figure 11 show the relationship between the activation energy and the PM remaining amount. Figure 9 shows the temperature of the exhaust gas is 600 ℃. Figure 10 shows the case where the temperature of the exhaust gas is 700 ℃. Figure 11 shows the case where the temperature of the exhaust gas is 800 ℃. When the exhaust gas temperature is 600 ℃and the activation energy is higher than 120 KJ/mol, there is no change in the PM remaining amount. When the exhaust gas temperature is 700 ℃, there is little change in the PM remaining amount at 140 kJ/mol or more. When the exhaust gas temperature is 800 ℃, there is little change in the PM remaining amount at 160 kJ/mol or more. A catalyst with an activation energy of less than 120kJ/mol is considered to be effective when the exhaust gas temperature is 600 ℃. On the other hand, when the exhaust gas temperature is 700 ℃, a catalyst having an activation energy of 140kj/mol or less is considered to be effective. In addition, when the exhaust gas temperature is 800 ℃, a catalyst having an activation energy of 160 kJ/mol or less is considered to be effective. We found that the higher the temperature, the wider the effective catalytic range. It is also found that the amount of PM combustion increased at low activation energy when the exhaust gas temperature was high.
Summary/Conclusions
Based on our numerical calculations and analysis, we draw the following conclusions:
1) We successfully mapped the relationship between exhaust gas temperature and activation energy for PM combustion catalysts. This comprehensive mapping enables the evaluation of catalyst activities under various conditions and provides a framework for optimizing DPF design based on specific catalyst properties.
2) Our analysis revealed distinct characteristics in the PM oxidation mechanism, which varies significantly with temperature and PM deposition conditions. At low exhaust gas temperatures, the reaction primarily occurs through catalyst contact, while gas-phase reactions become increasingly dominant with larger PM deposits. The pressure loss characteristics showed that maintaining exhaust gas temperatures between 700-750℃ provides optimal performance, particularly when dealing with high PM deposits. Furthermore, we identified a critical activation energy threshold between 100-120 kJ/mol that significantly influences catalytic effectiveness, with enhanced performance below this threshold even at lower temperatures.
3) The relationship between the catalyst loading method and DPF performance was clarified through our converter model, which successfully bridges the gap between powder-state catalyst experiments and actual DPF applications. This insight provides practical guidelines for catalyst implementation in DPF systems.
These findings contribute significantly to the development of more effective DPF systems by enabling precise catalyst selection for specific operating conditions. The proposed method addresses both environmental concerns and engine performance requirements. Future work could focus on extending this model to include additional catalyst types and operating conditions, further enhancing its practical applicability in DPF design optimization.
Acknowledgments
This work is supported by JSPS KAKENHI Grant Number 20K04325 and Creation of Life Innovation Materials for Interdisciplinary and International Researcher Development of the MEXT.
Definitions/Abbreviations
| A: | Frequency factor [m3/ (mol•sec)] |
| a: | Longitudinal mesh width [m] |
| b: | Lateral mesh width [m] |
| CC: | Specific heat of cordierite [J/ (kg•K)] |
| Cg: | Specific heat of exhaust gas [J/ (kg•K)] |
| D: | DPF diameter [m] |
| Dc: | Density of cordierite [kg/m3] |
| E: | Activation energy [J/mol] |
| ΣF: | Total flow rate [m3/s] |
| i: | Cell number in the x direction [-] |
| j: | Number in the wall thickness direction (y direction) in each i-th cell [-] |
| L: | Total length of DPF [m] |
| N: | Cell number from inlet in direction i [-] |
| PM: | PM content [mol] |
| Q: | Heat capacity [J/K] |
| R: | Gas constant [J/ (K•mol)] |
| Rpm: | Reaction amount of PM [mol] |
| S: | Gas Passage [kg] |
| T: | Absolute temperature used in the formula for PM |
| oxidation reaction rate [°C] | |
| Tw: | Wall surface temperature [°C] |
| TR: | Corrected temperature [°C] |
| TPM : | Oxidation heat temperature of PM [°C] |
| ΔT: | Temperature change [°C] |
| V: | Calculated unit cell deposition [m3] |
| Vi: | Flow rate [m/s] |
| VO2: | O2 concentration [mol/m3] |
| WT: | DPF wall-surface thickness [m] |
| α: | Flow rate of each cell (superficial velocity) [m/s] |
| μ: | Permeability of DPF wall-surface [-] |
| σ: | Cross-sectional area of each cell [m2] |
| φ: | porosity [-] |
References
- Murayama, T. Diesel engine no shoraizo. Journal of the marine engineering society in Japan 1994, 29, 881–888. [Google Scholar]
- Japan Petroleum Energy Center, “Diesel sha haigasu no kenko hyoka gijutsu siryo” (2000).
- Kakegawa, T. Clean diesel no kanousei -shin choki kisei no gaiyo to ohgata diesel no haishutsugasu teigen gijutsu-. Japan Automobile Manufacturers Association 2008, 42, 14–20. [Google Scholar]
- D. J. JAHNG, P. Kankyo to kenko risk -diesel haikigasu no risk management-. Environmental Science 1993, 6, 403–411.
- Robert Bosch GmBH,”Automotive handbook (Japanese) ”,Nikkei Bp, pp.497-501 (2011).
- Ichikawa, S.; Hamanaka, T. Development of honeycomb ceramic for diesel particulate filters (DPF). Journal of the ceramic society of Japan 2003, 38, 296–300. [Google Scholar]
- E. Wirojsakunchai, E. Schroeder, C. Kolodziej, D. E. Foster, N. Schmidt, T. Root, T. Kawai, T. Suga, T. Nevius amd T. Kusaka, “Detailed diesel exhaust particulate characterization and real-time DPF filtration efficiency measurements during PM filling process”, SAE Technical Paper, 2007-01-0320 (2007).
- R. Allanson, P. G. Blakeman, B. J. Cooper, H. Hess, P. J. Silcock and A. P. Walker, “Optimizing the low temperature performance and regeneration efficiency of the continuously regenerating diesel particulate filter (CR-DPF) system”, SAE Technical Paper, 2002-01-0428 (2002).
- S. Daido and N. Takagi, “Visualization of the PM deposition and oxidation behavior inside DPF wall”, SAE Technical Paper, 2009-01-1473 (2009).
- P. Karin, L. Cui, P. Rubio, T. Tsuruta and K. Hanamura, “Microscopic visualization of PM trapping and regeneration in micro-structural pore s of a DPF wall”, SAE Technical paper, 2009-01-1476 (2009).
- Nakamura, M.; Hanamura, K.; Shibuta, T.; Yoshino, H.; Iwasaki, K. Numerical simulation of trapping process in hexagonal diesel particulate filters. Transaction of Society of Automotive Engineers of Japan 2015, 46, 313–317. [Google Scholar]
- Sanui, R.; Hanamura, K. Electron microscopic time-lapse visualization of surface cavity filtration on particulate matter trapping process. Journal of Microscopy 2016, 263, 250–259. [Google Scholar] [CrossRef] [PubMed]
- Hanamura, K.; Karin, P.; Cui, L.; Rubio, P.; Tsuruta, T.; Tanaka, T.; Suzuki, T. Micro- and macroscopic visualization of particulate matter trapping and regeneration processes in wall-flow diesel particulate filters. International Journal of Engine Research 2009, 10, 305. [Google Scholar] [CrossRef]
- G. Konstandopoulos, and J.H.Johnson, “Wall-flow diesel particulate filters -Their pressure drop and collection efficiency”, SAE Technical Paper 890405, pp. 625–647 (1989).
- G. Konstandopoulos, “Flow resistance descriptors for diesel particulate filters: Definitions, measurements and testing”, SAE Technical paper, 2003-01-0846 (2003).
- Koltsakis, G.C.; Konstantinou, A.; Haralampous, O.A.; Samaras, Z.C. Measurement and intra-layer modeling of soot density and permeability in wall-flow filters. SAE paper 2006-01-0261 (2006).
- Uenishi, T.; Sato, S.; Tanaka, E.; Kusaka, J.; Daisho, Y. Research on internal transfer phenomena of the diesel particulate filter performance (second report) - numerical study of the effect of soot loading condition on soot cake layer. Transaction of Society of Automotive Engineers of Japan 2014, 132-14, 31–36. [Google Scholar]
- Karin, P. Microscopic Visualization and Characterization of Particulate Matter Trapping and Oxidation in Diesel Particulate Filters and Membrane Filter. Doctoral thesis 2010. [Google Scholar]
- Nakamura, M.; Hanamura, K.; Shibuta, T.; Yoshino, H.; Iwasaki, K. Numerical Simulation of Trapping Process in Hexagonal Diesel Particulate Filter. Transaction of Society of Automotive Engineers of Japan 2015, 46, 313–317. [Google Scholar]
- Nakamura, M.; Ozawa, M. Effect of Surface Cavity Shape on PM Deposition and Pressure Drop on DPF Porous Material. Journal of the Society of Materials Science Japan 2018, 67, 562–567. [Google Scholar] [CrossRef]
- Maki Nakamura and Masakuni Ozawa, “Phenomena of PM deposition and oxidation in the diesel particulate filter”, SAE Technical Paper, 2019-01-2288, 2019.
- Kengo Okai, “Characteristic Modeling of Catalytic Converter for Diesel Particulate Combustion”, Undergraduate thesis, 2020.
Figure 1.
Illustration of soot trapping system.
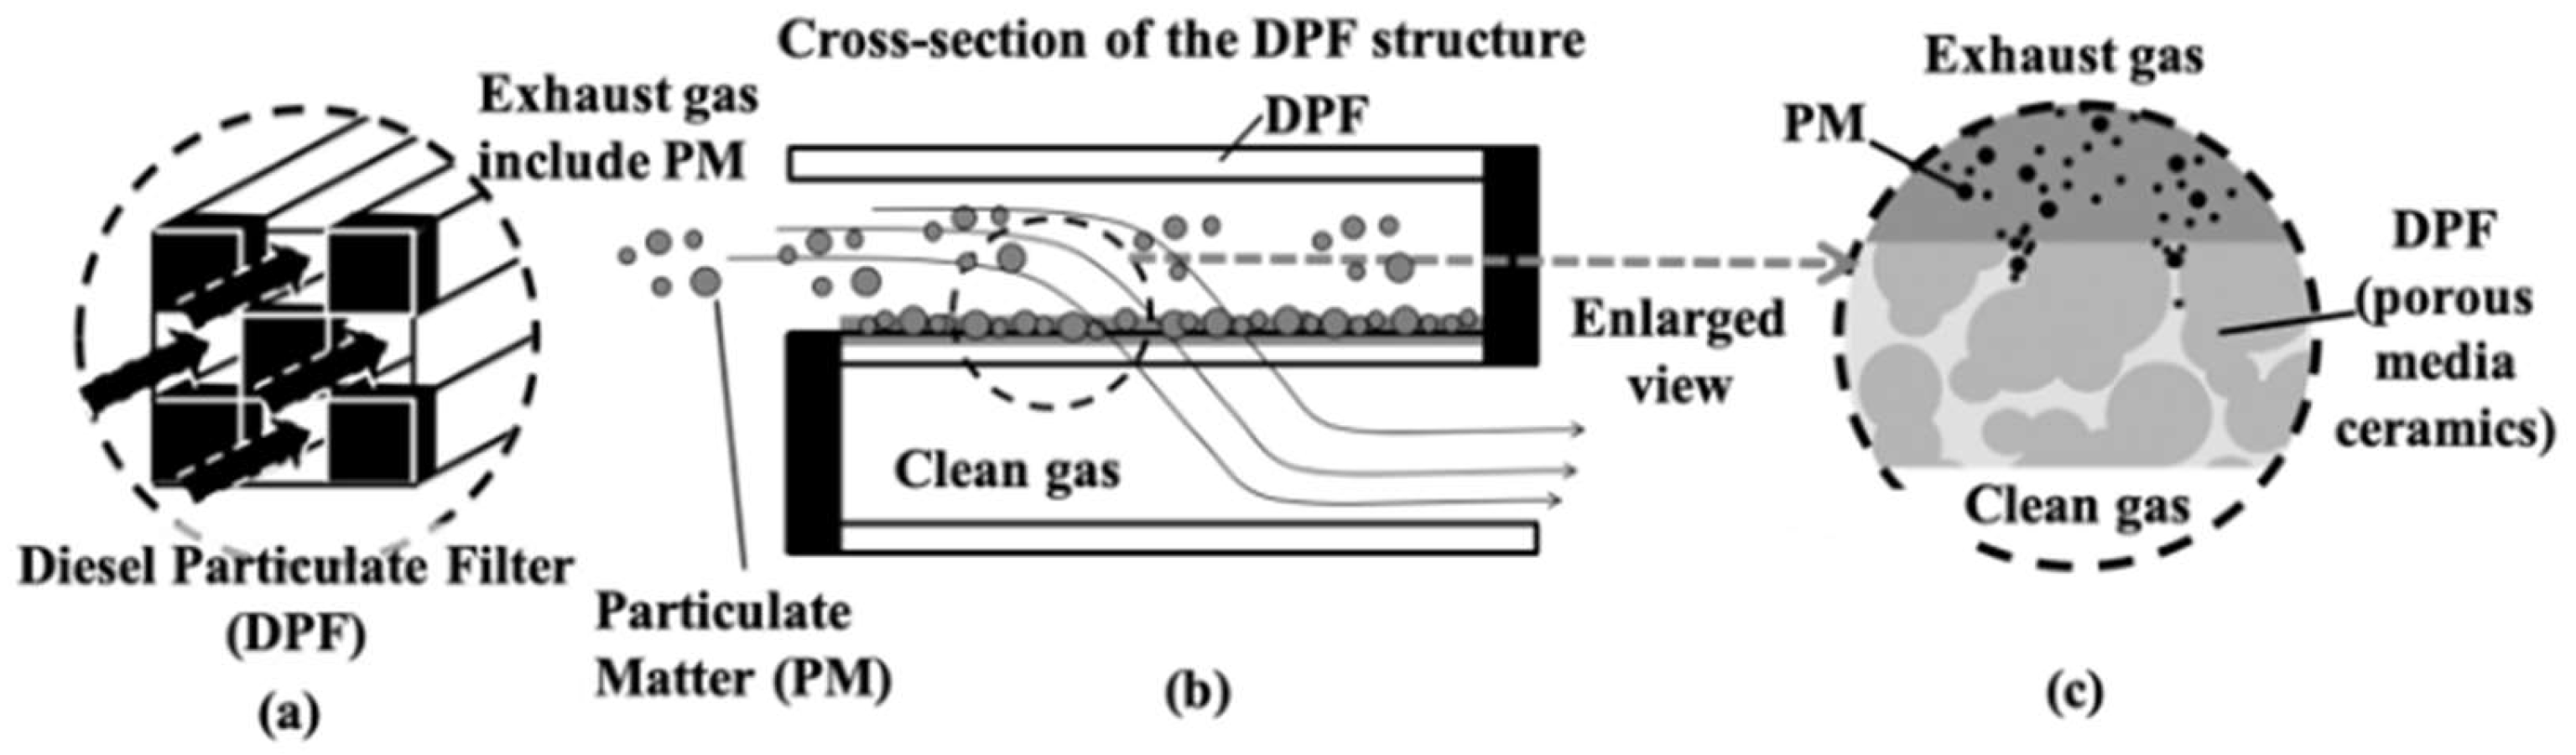
Figure 2.
Regeneration process.
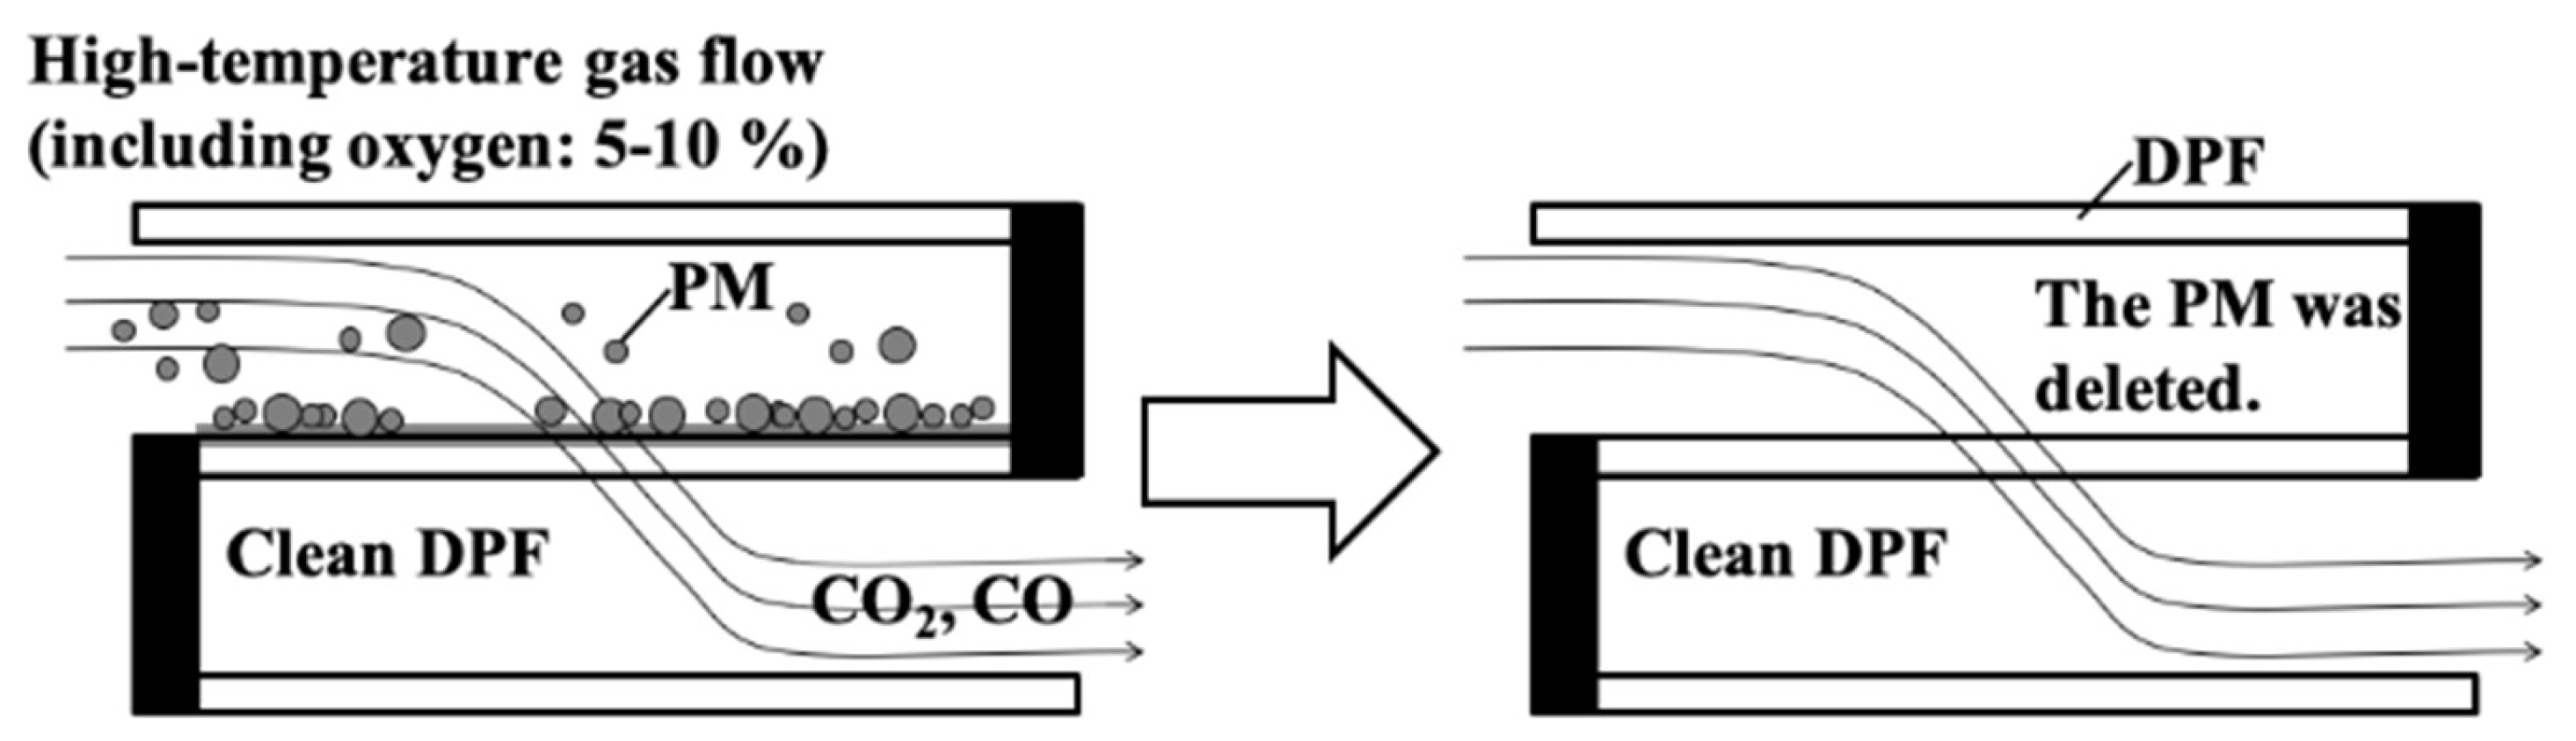
Figure 3.
Type of reaction. Left side: Reaction to soot in contact with the catalyst (SSR). Right side: Reaction to soot that is not in contact with the catalyst (GPR).
Figure 3.
Type of reaction. Left side: Reaction to soot in contact with the catalyst (SSR). Right side: Reaction to soot that is not in contact with the catalyst (GPR).
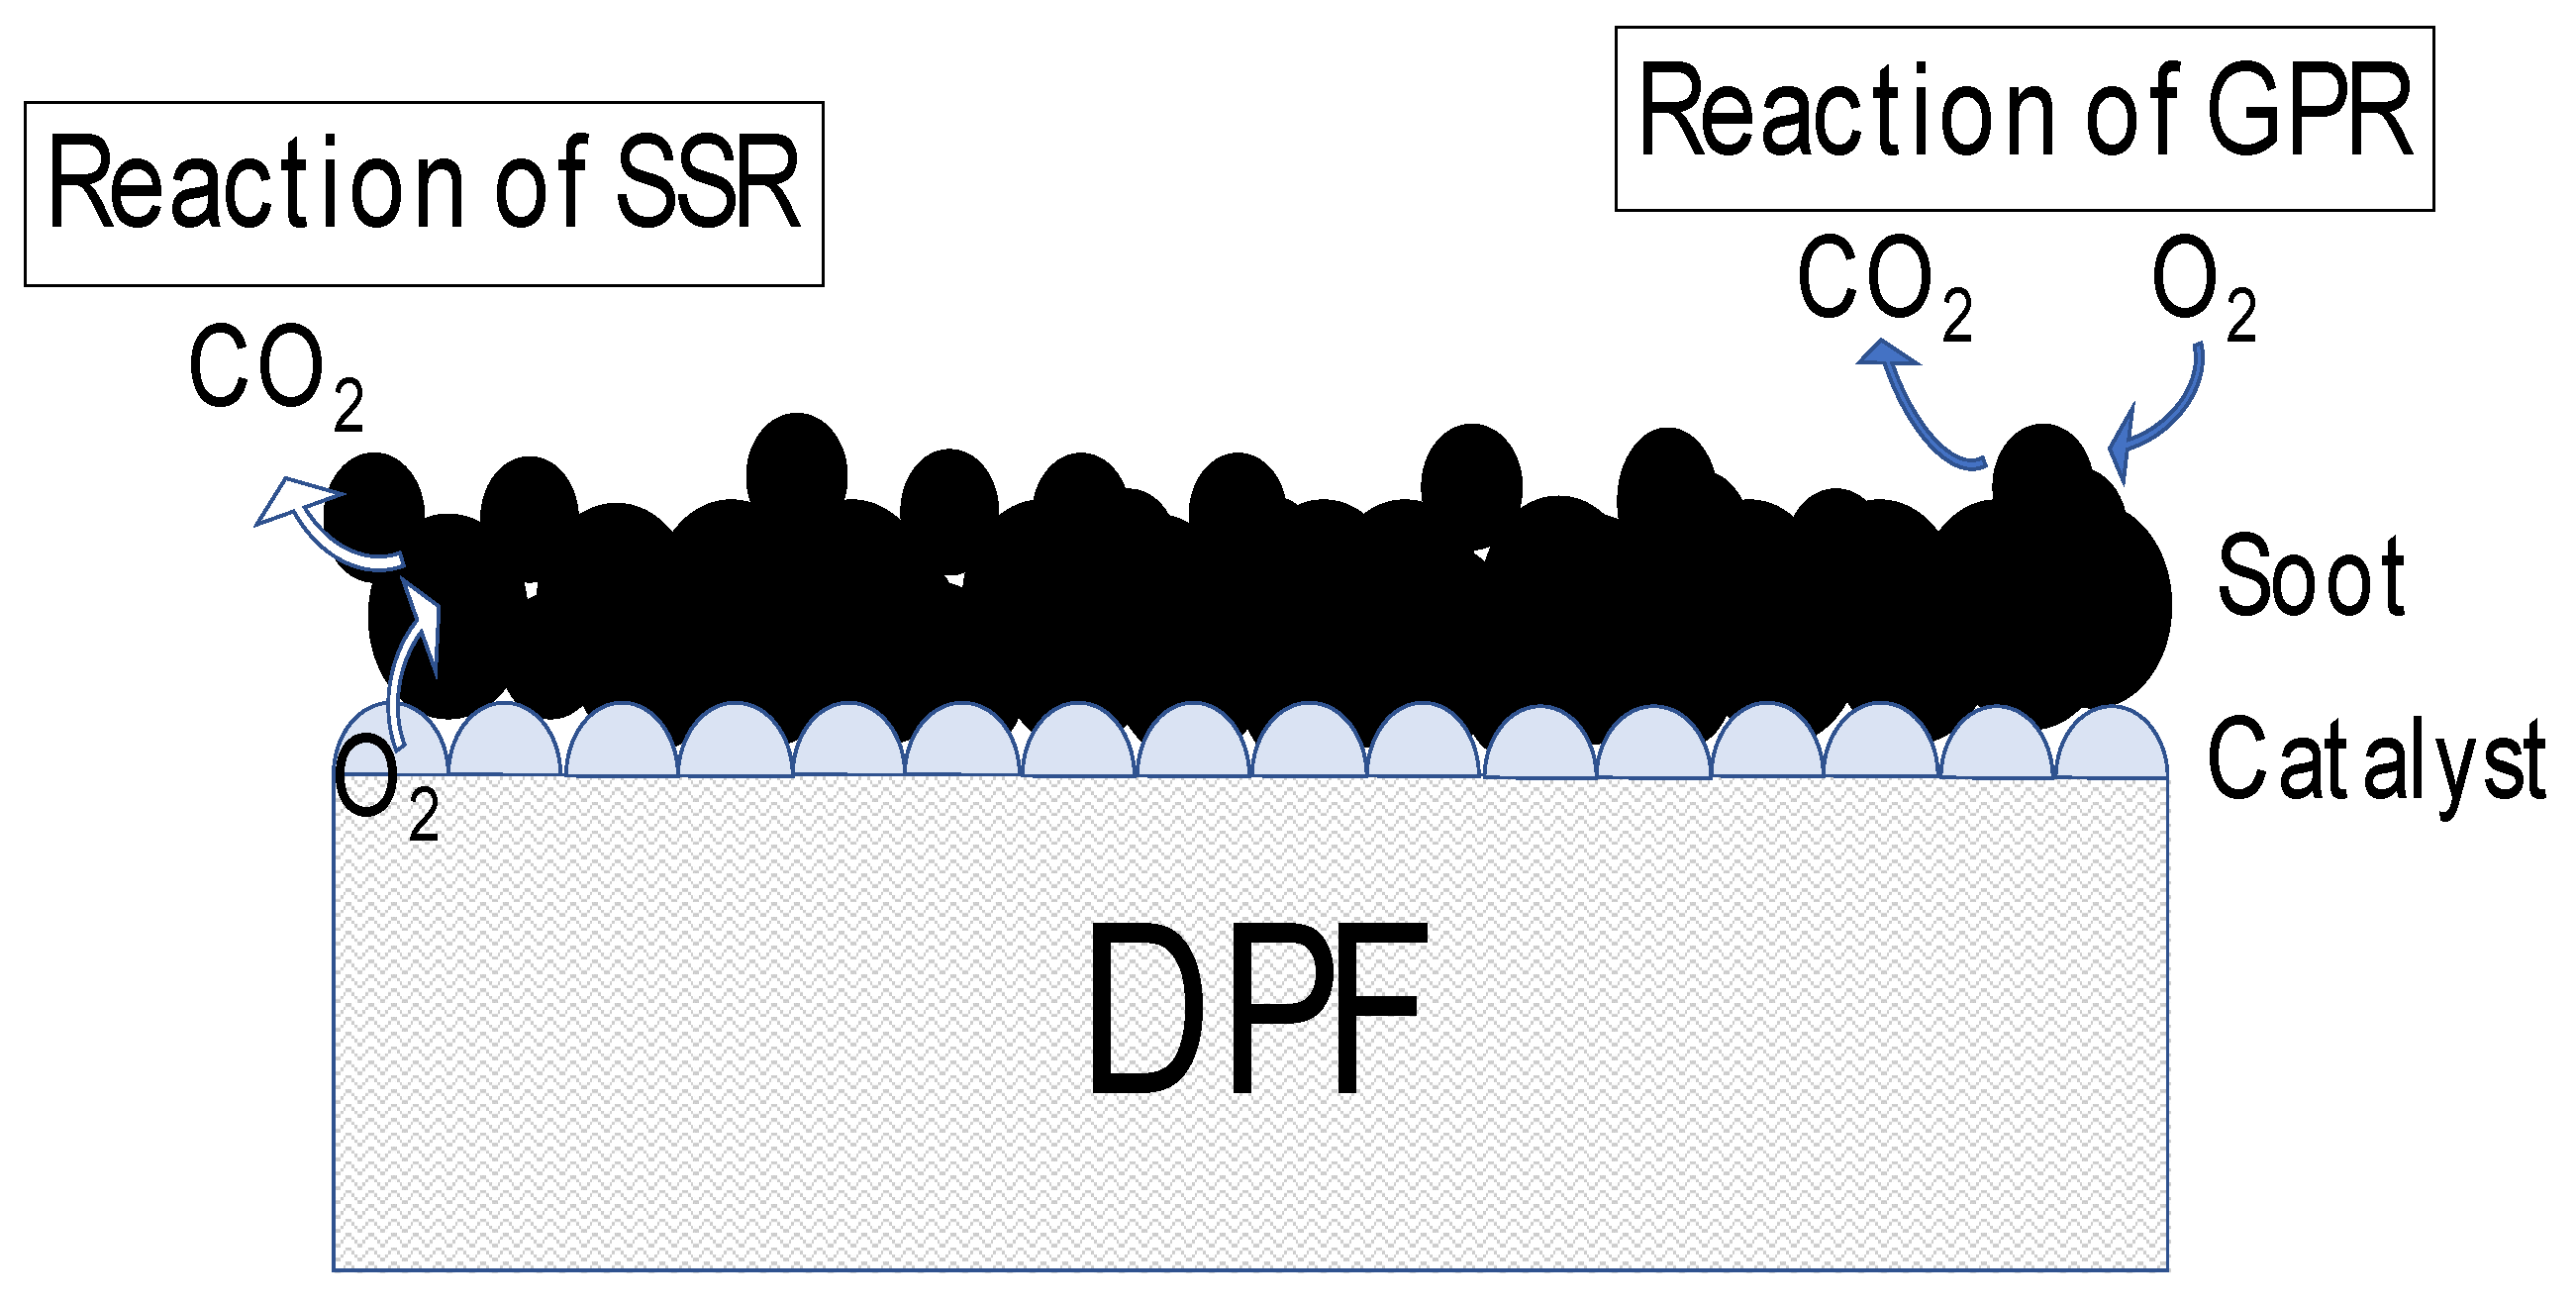
Figure 5.
The left side of (a) to (d) shows Dependence of regeneration conditions on DPF with catalyst. The X-axis shows the activation energy. The Y-axis shows exhaust gas temperature. The Z-axis shows the remaining PM per unit deposit including the space. PM sedimentation quantity showing the relation of the remaining amount is (a) (b) (c) (d) respectively 1g, 10g, 15g, 20g.
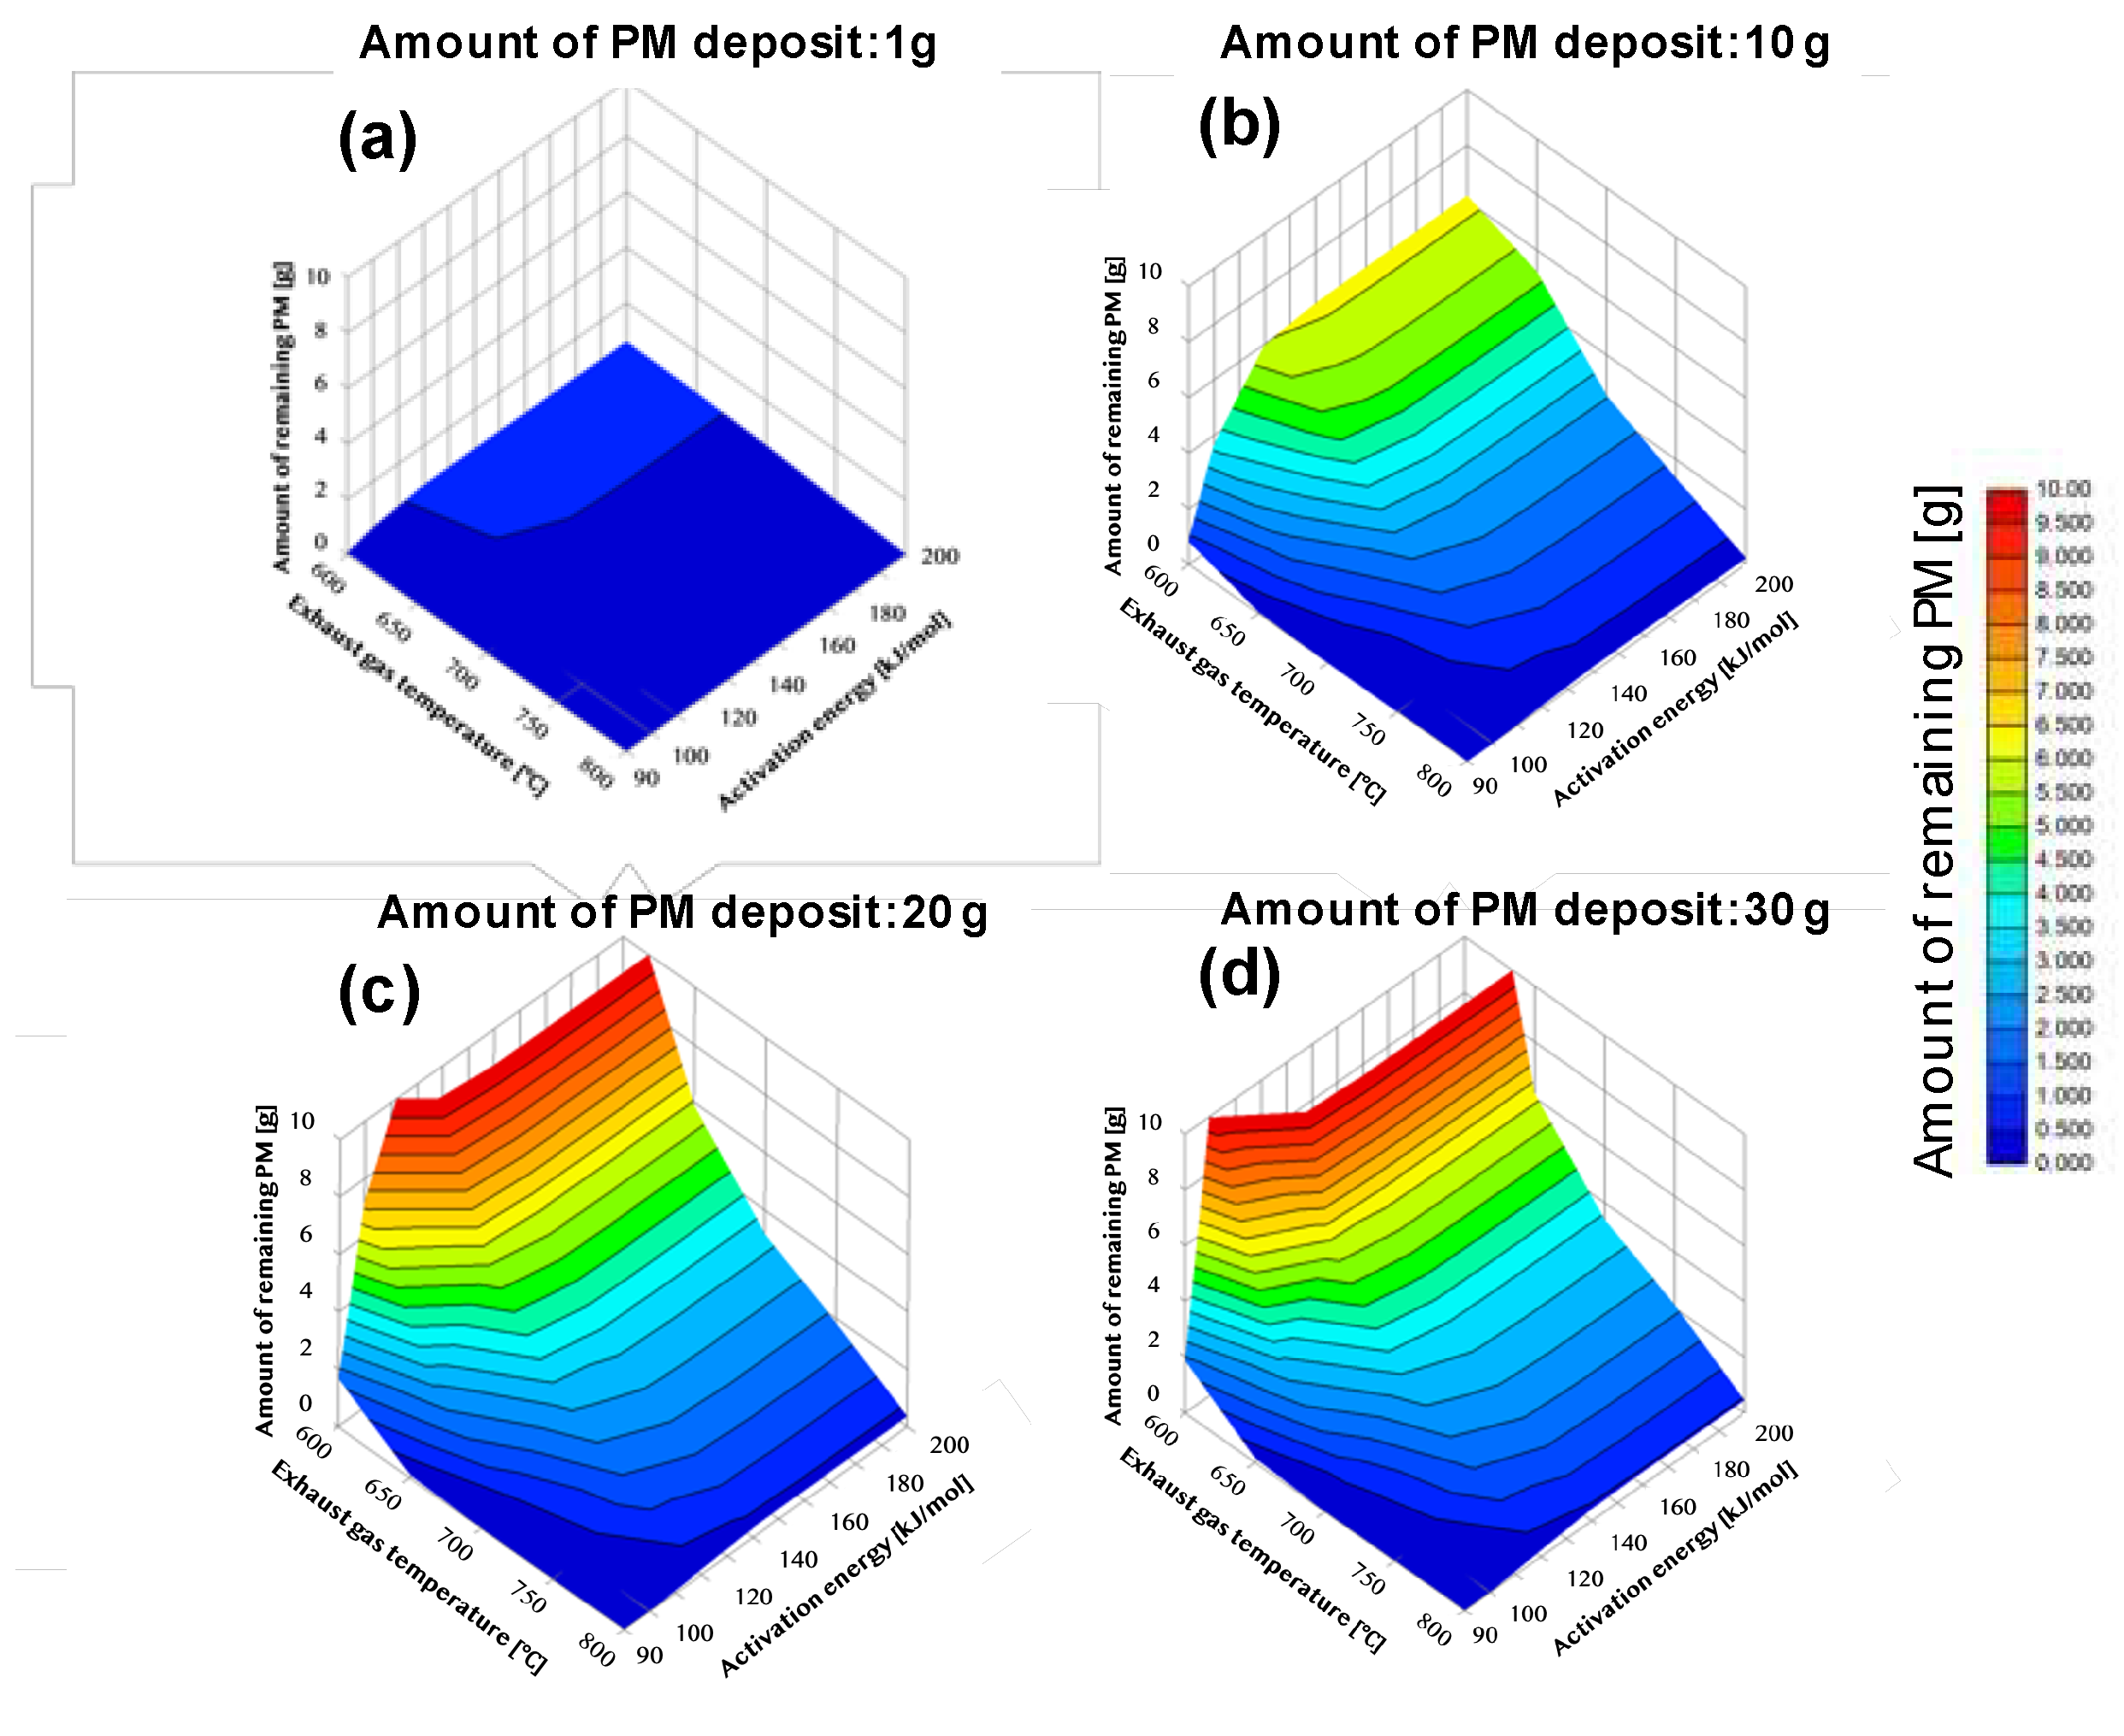
Figure 6.
The right-hand side of (a) to (d) shows the activation energy on the vertical axis and the temperature of the exhaust gas on the horizontal axis. PM remaining amount according to each condition is shown in the field, when the remaining amount of PM is large is shown in red, when the remaining amount is small in blue. PM sedimentation quantity showing the relation of the remaining amount is (a) (b) (c) (d) respectively 1g, 10g, 20 g,30 g.
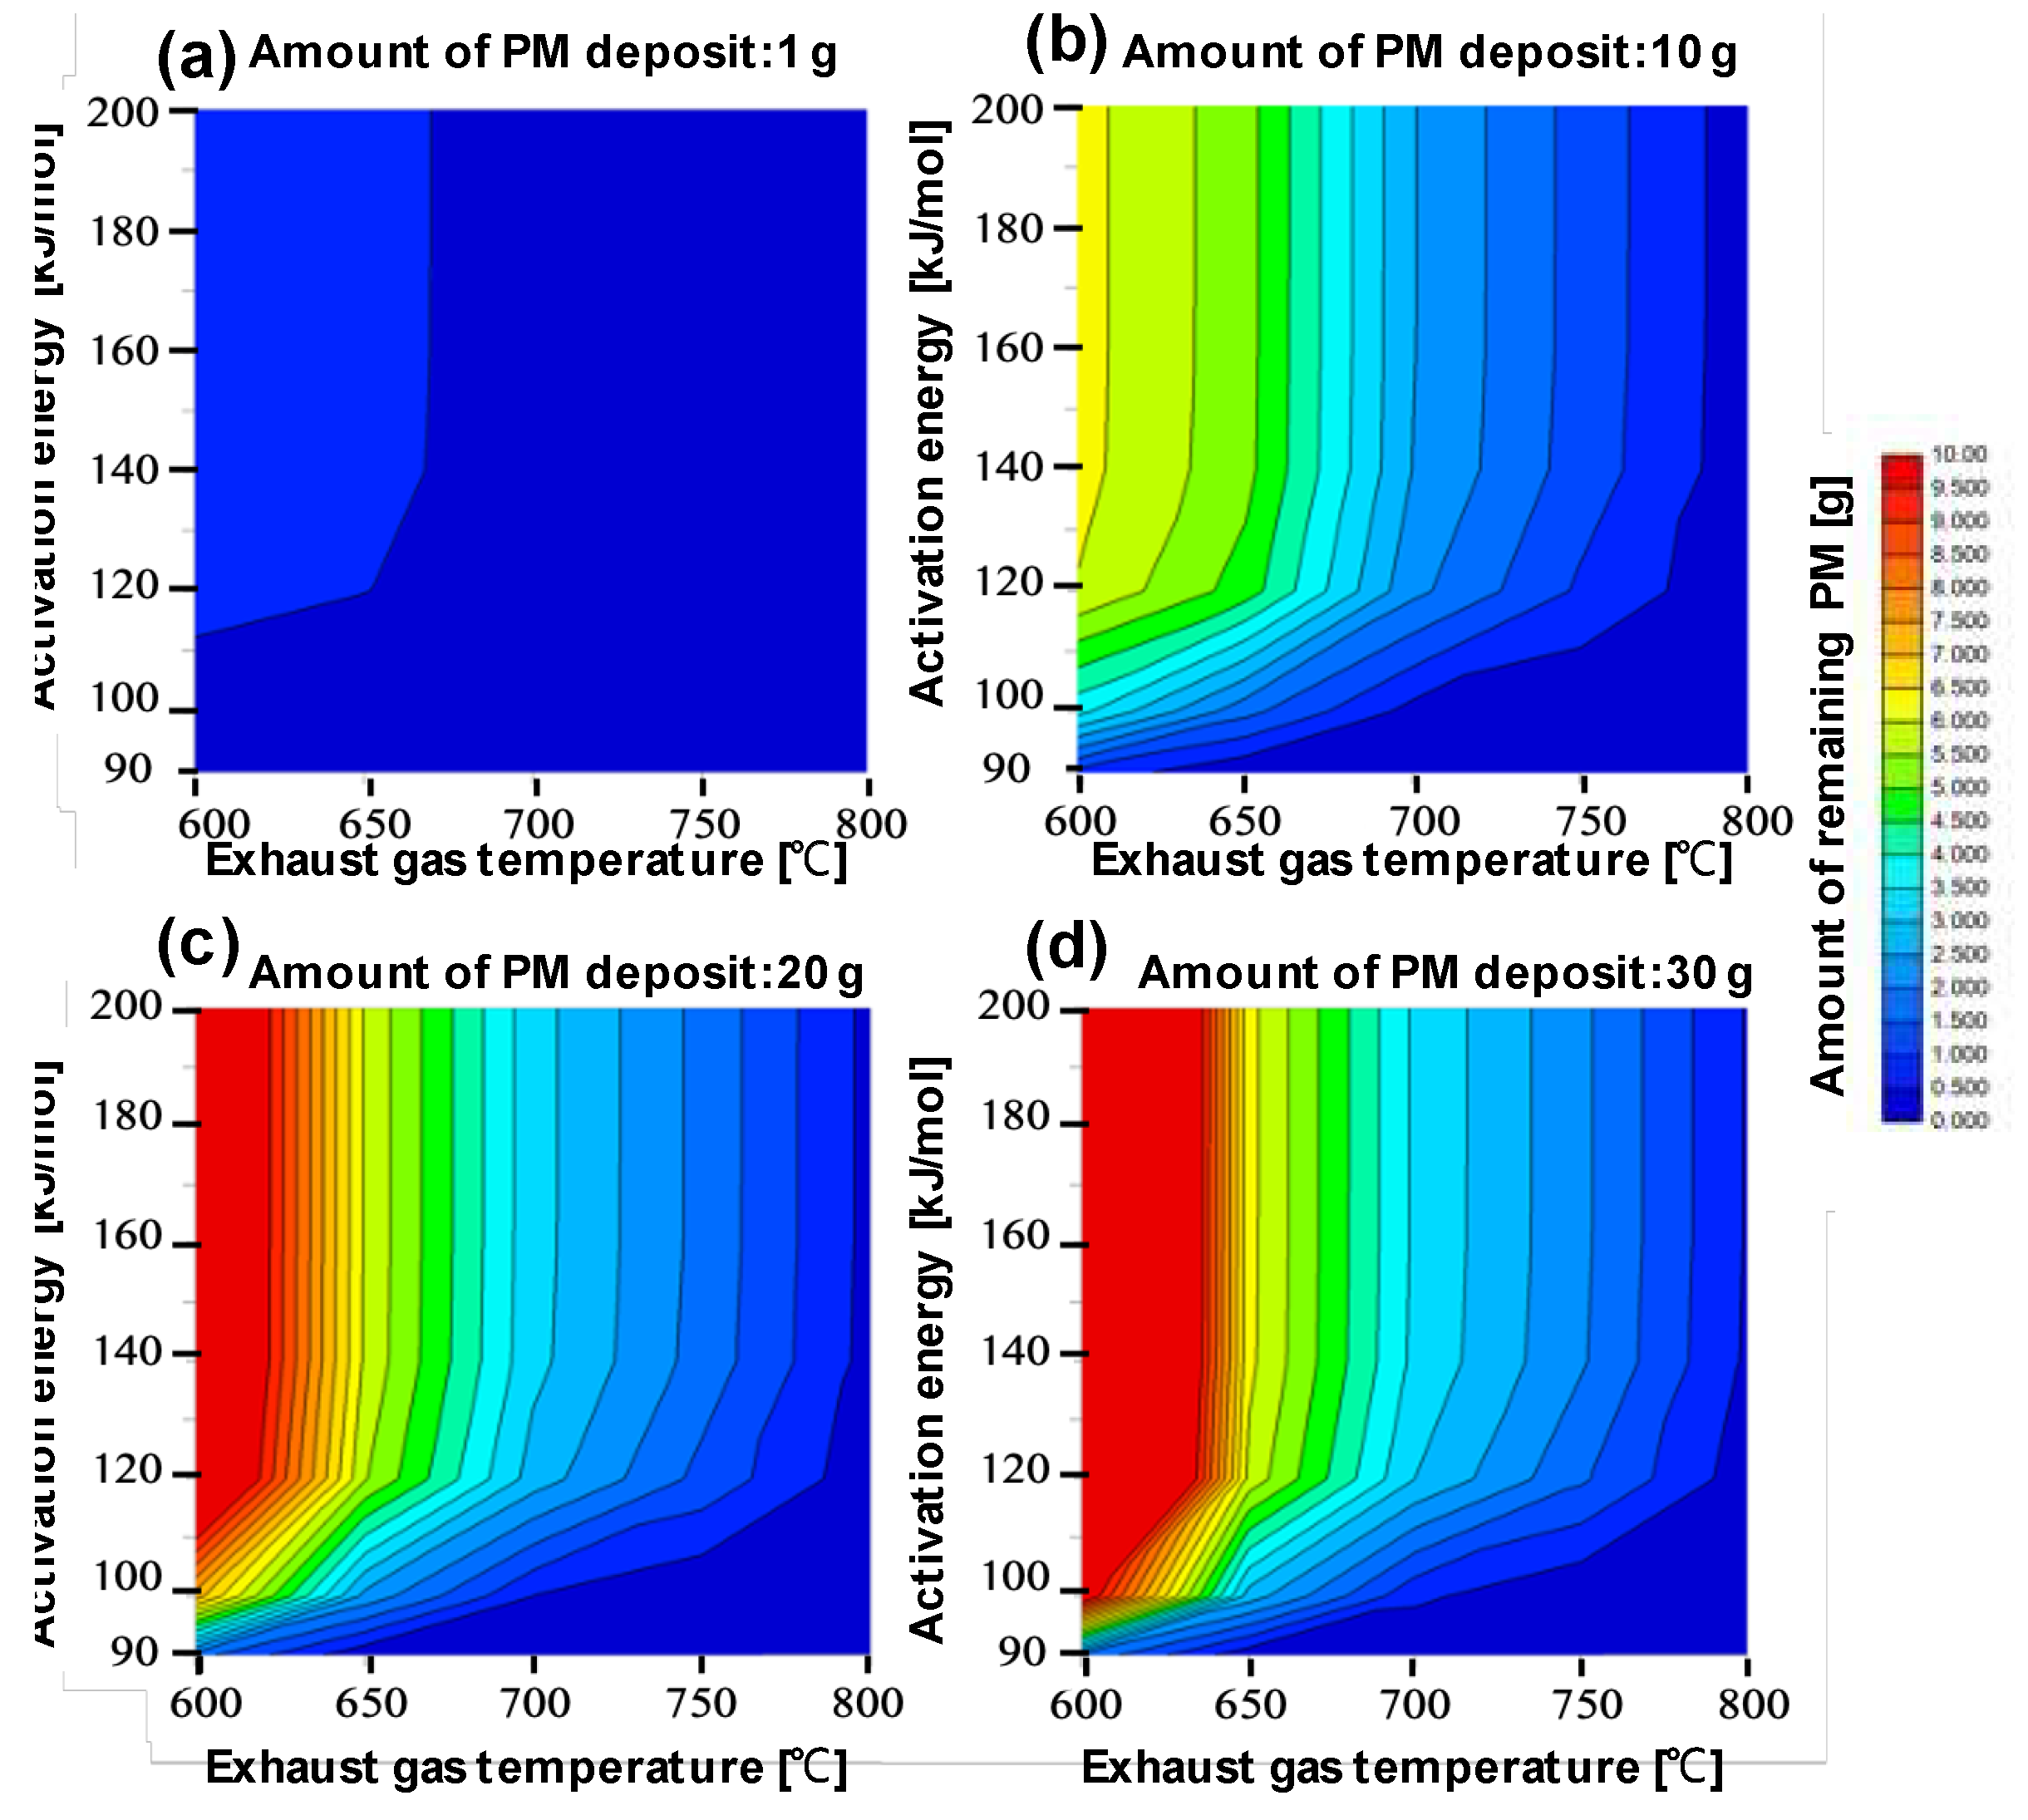
Figure 7.
Exhaust gas temperature dependence of the amount of PM remaining after 5400 seconds of regeneration is shown. The red line shows 1g of PM deposition, the blue line shows 10g of PM deposition, the green line shows 20g of PM deposition, and the yellow line shows 30g of PM deposition.
Figure 7.
Exhaust gas temperature dependence of the amount of PM remaining after 5400 seconds of regeneration is shown. The red line shows 1g of PM deposition, the blue line shows 10g of PM deposition, the green line shows 20g of PM deposition, and the yellow line shows 30g of PM deposition.
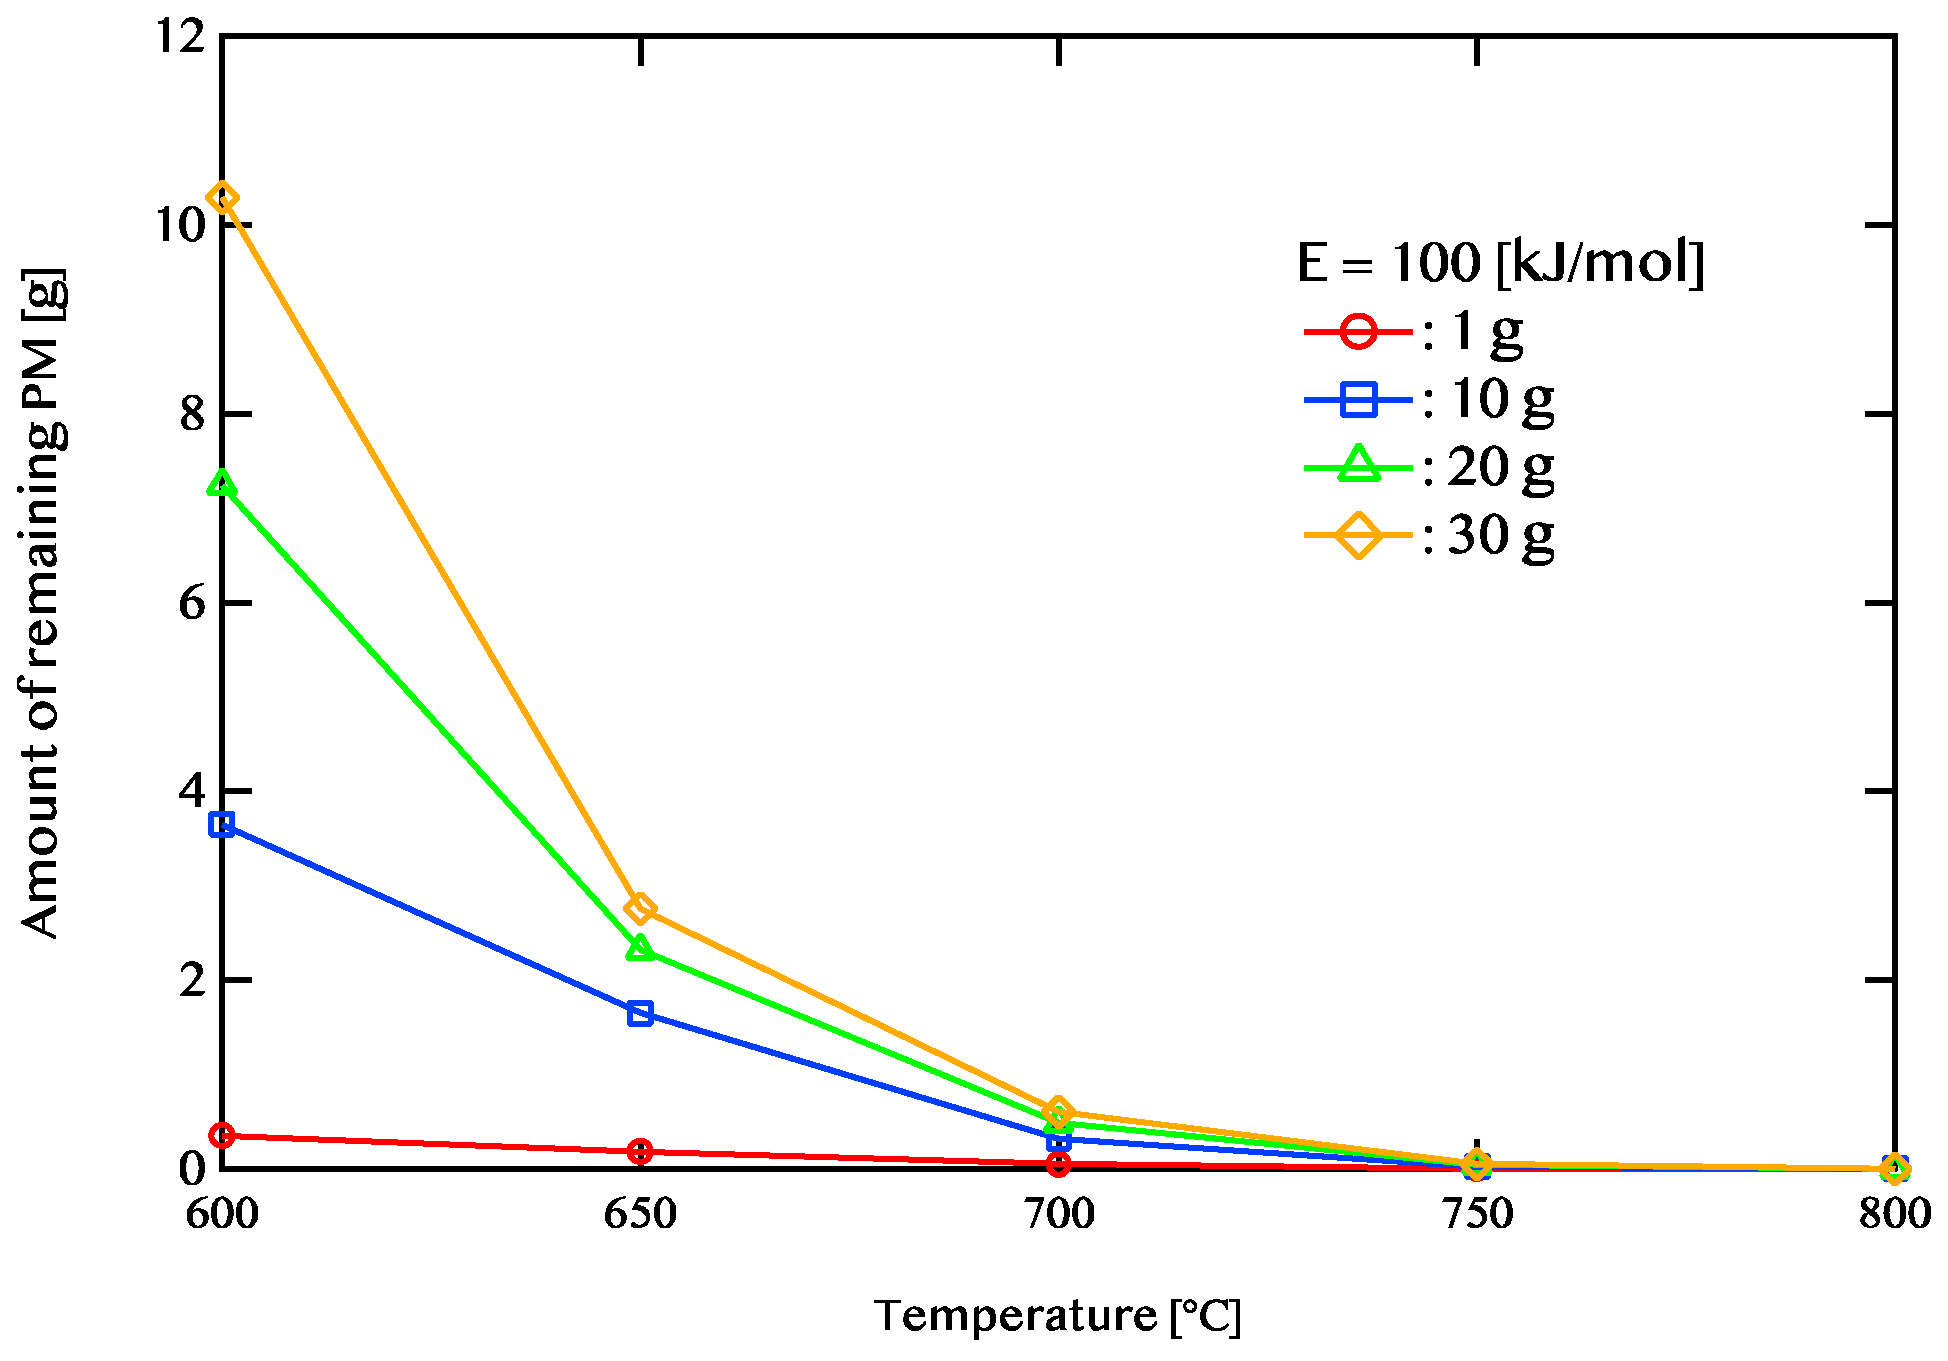
Figure 8.
Pressure drop vs. elapsed time. Case of the amount of PM deposited 1 g and 30 g.
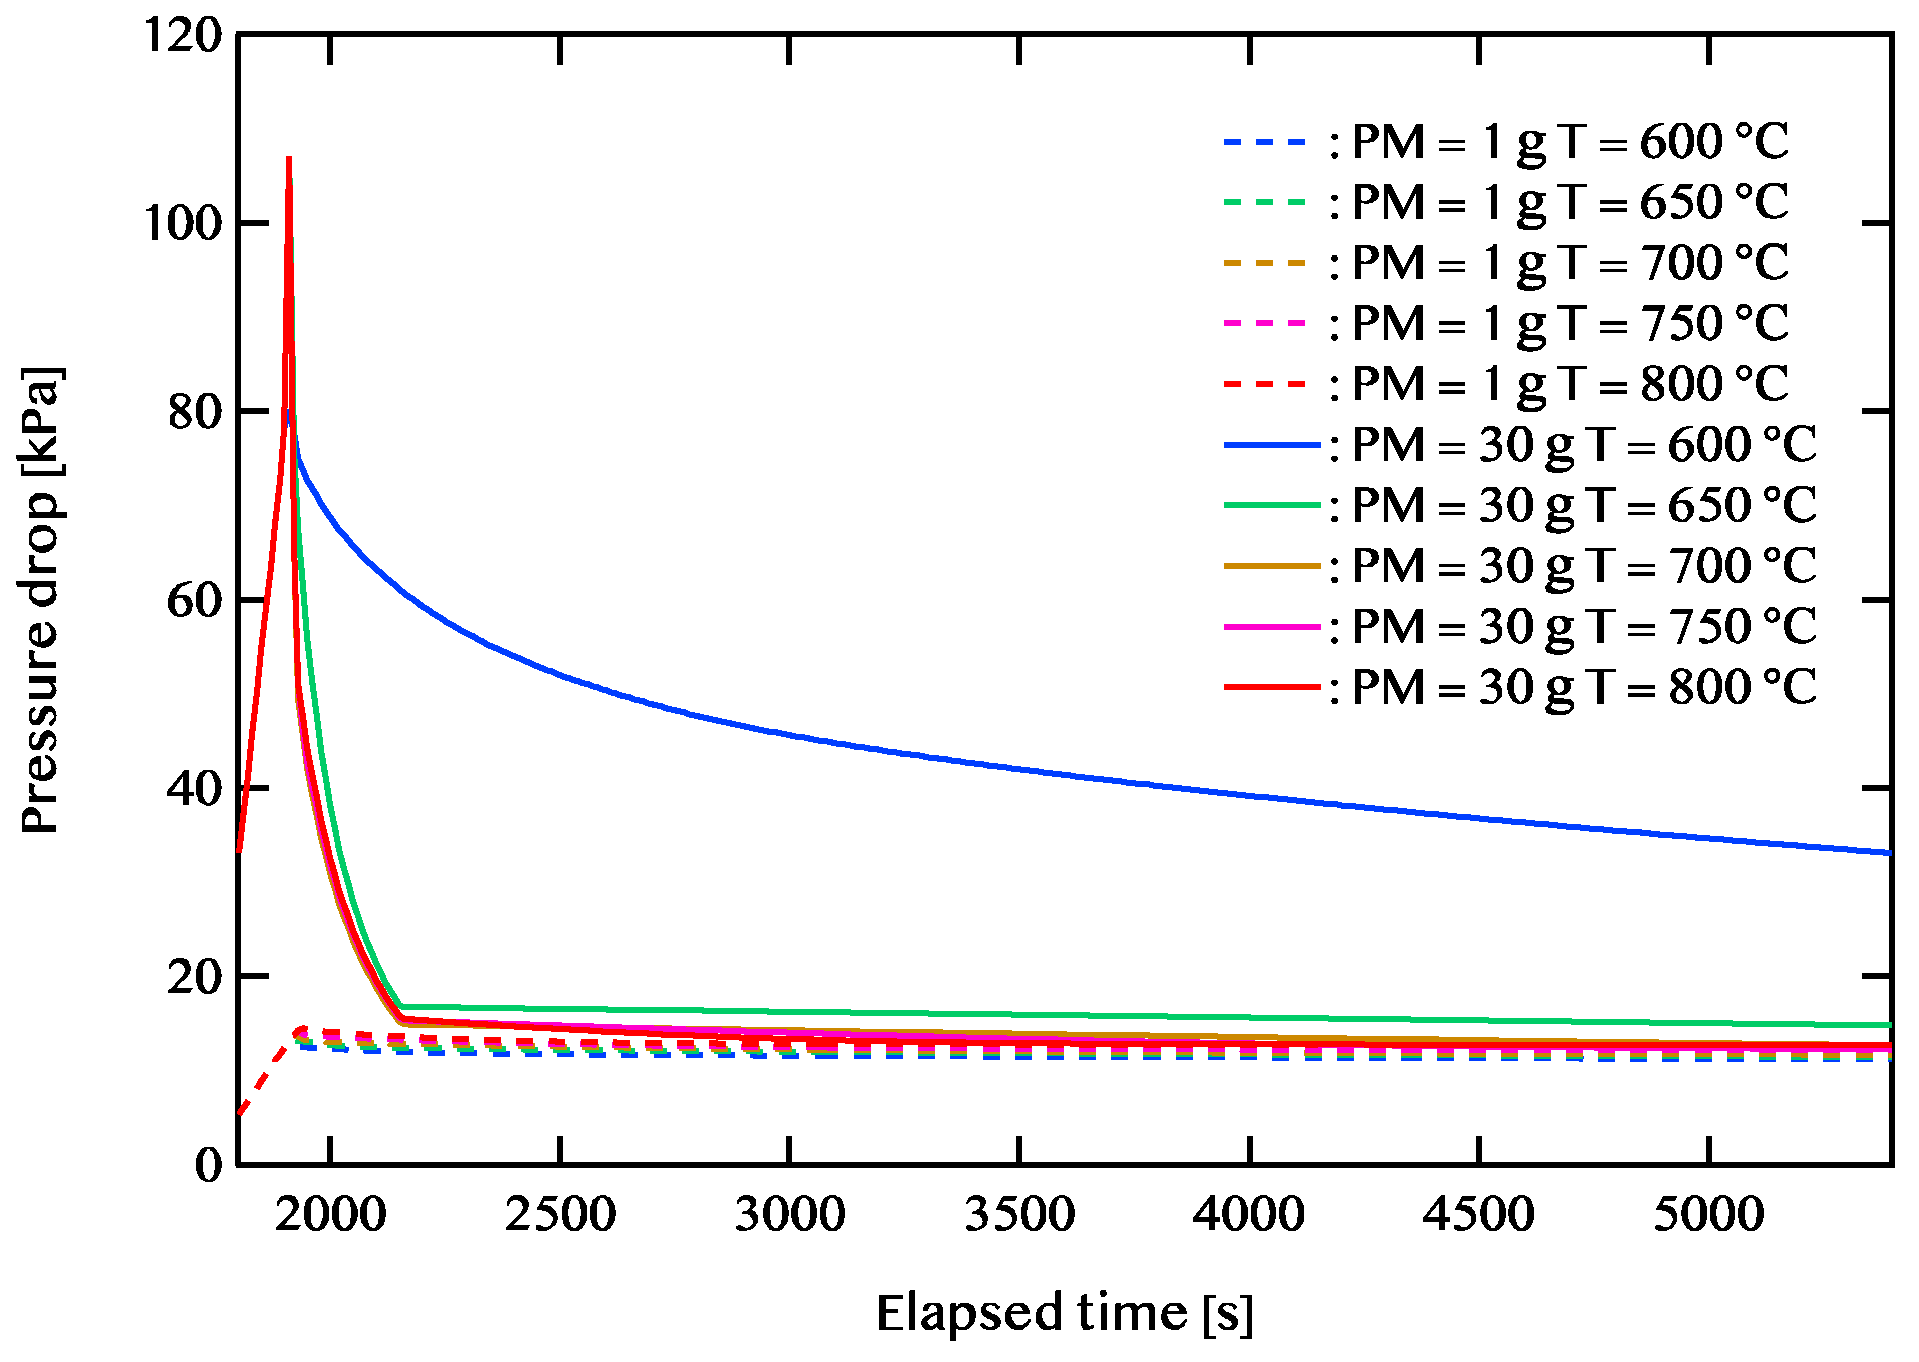
Figure 9.
Active energy dependence of the amount of PM remaining after 5400 seconds of regeneration is shown. The temperature of exhaust gas is 600 ℃. The red line shows 1g of PM deposition, the blue line shows 10g of PM deposition, the green line shows 20g of PM deposition, and the yellow line shows 30g of PM deposition.
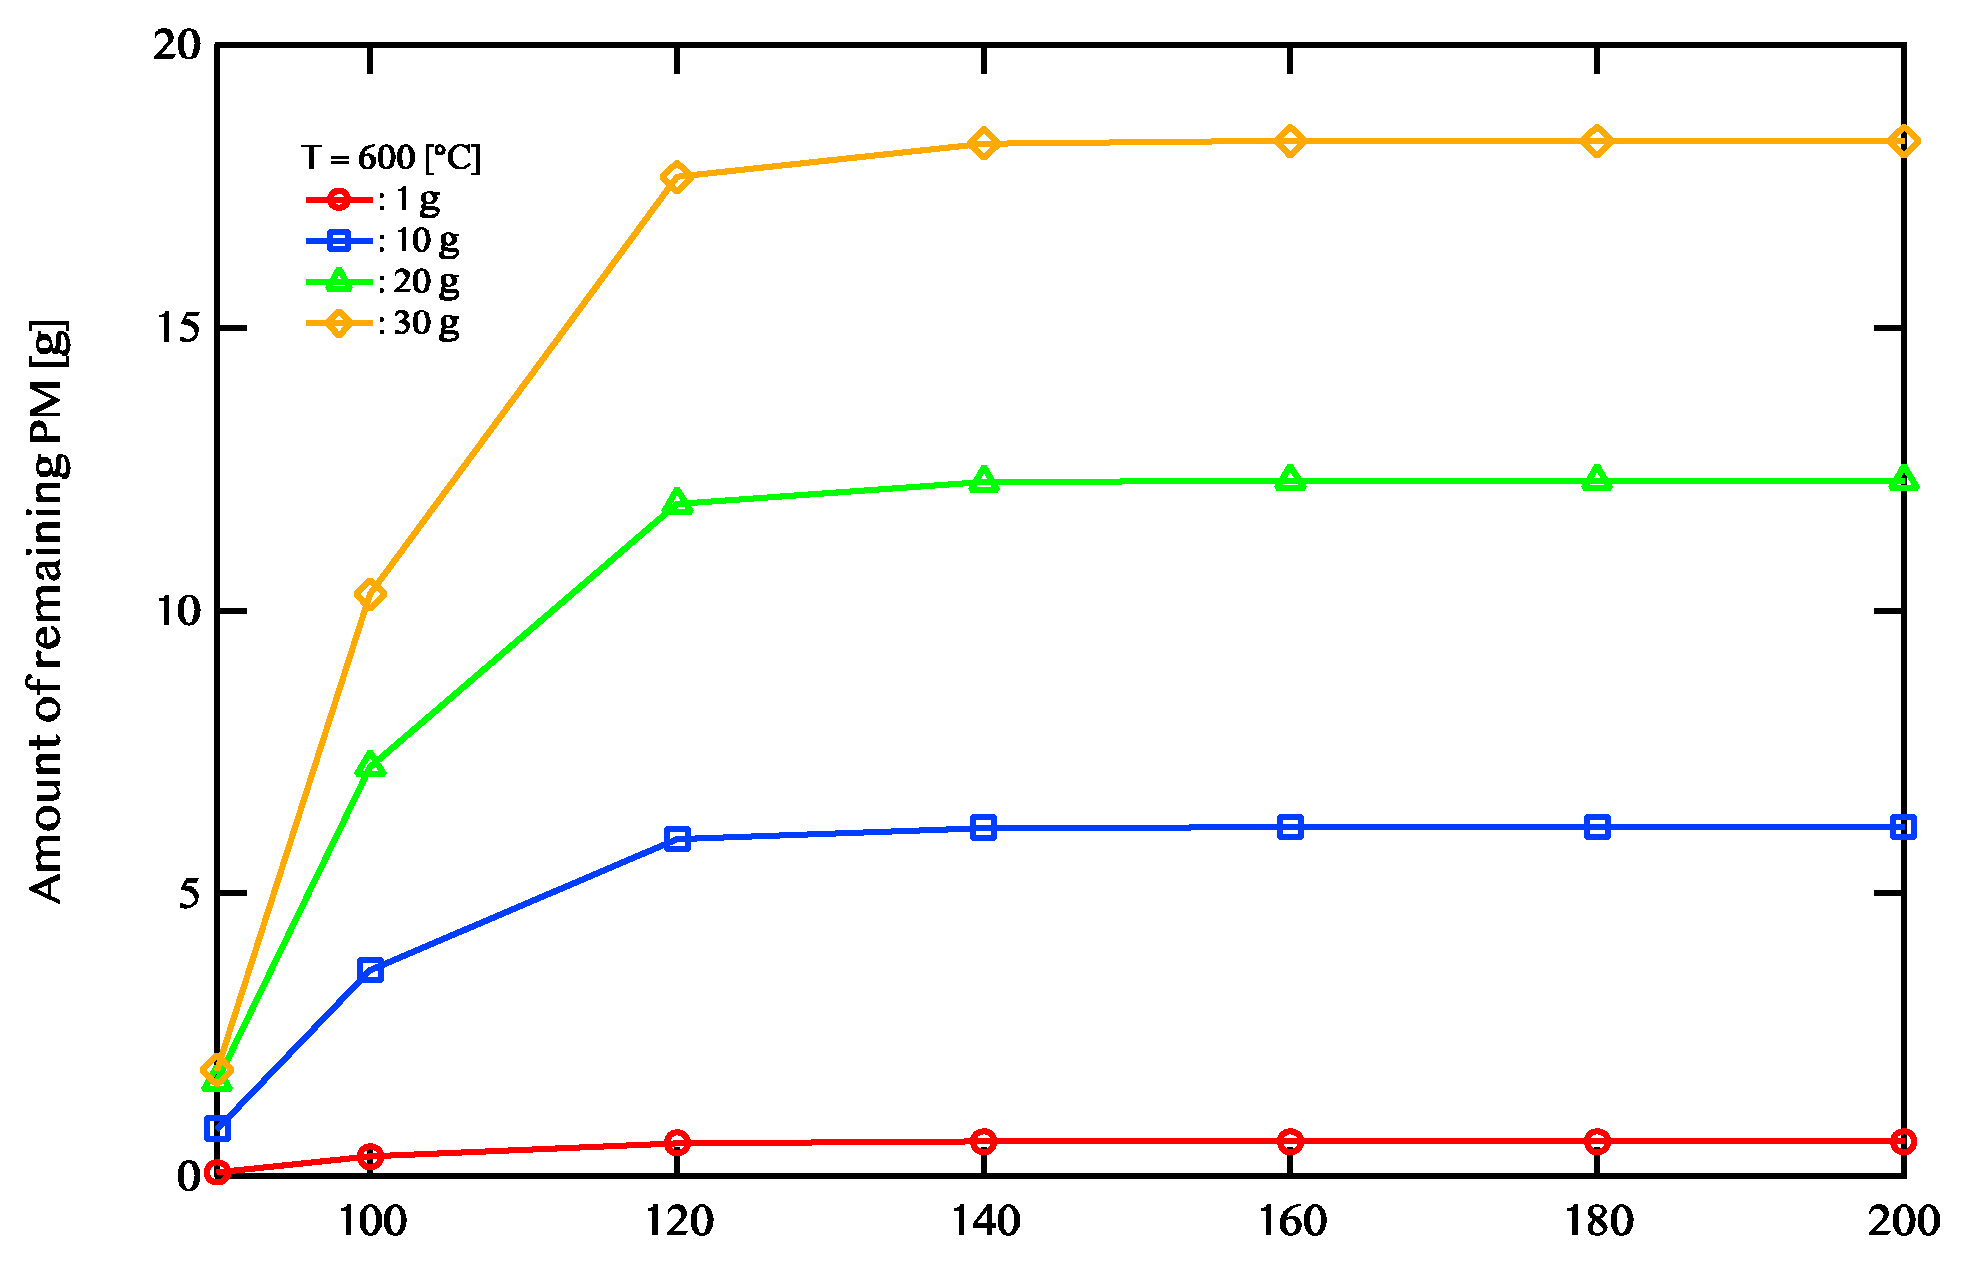
Figure 10.
Active energy dependence of the amount of PM remaining after 5400 seconds of regeneration is shown. The temperature of exhaust gas is 700 ℃. The red line shows 1g of PM deposition, the blue line shows 10g of PM deposition, the green line shows 20 g of PM deposition, and the yellow line shows 30g of PM deposition.
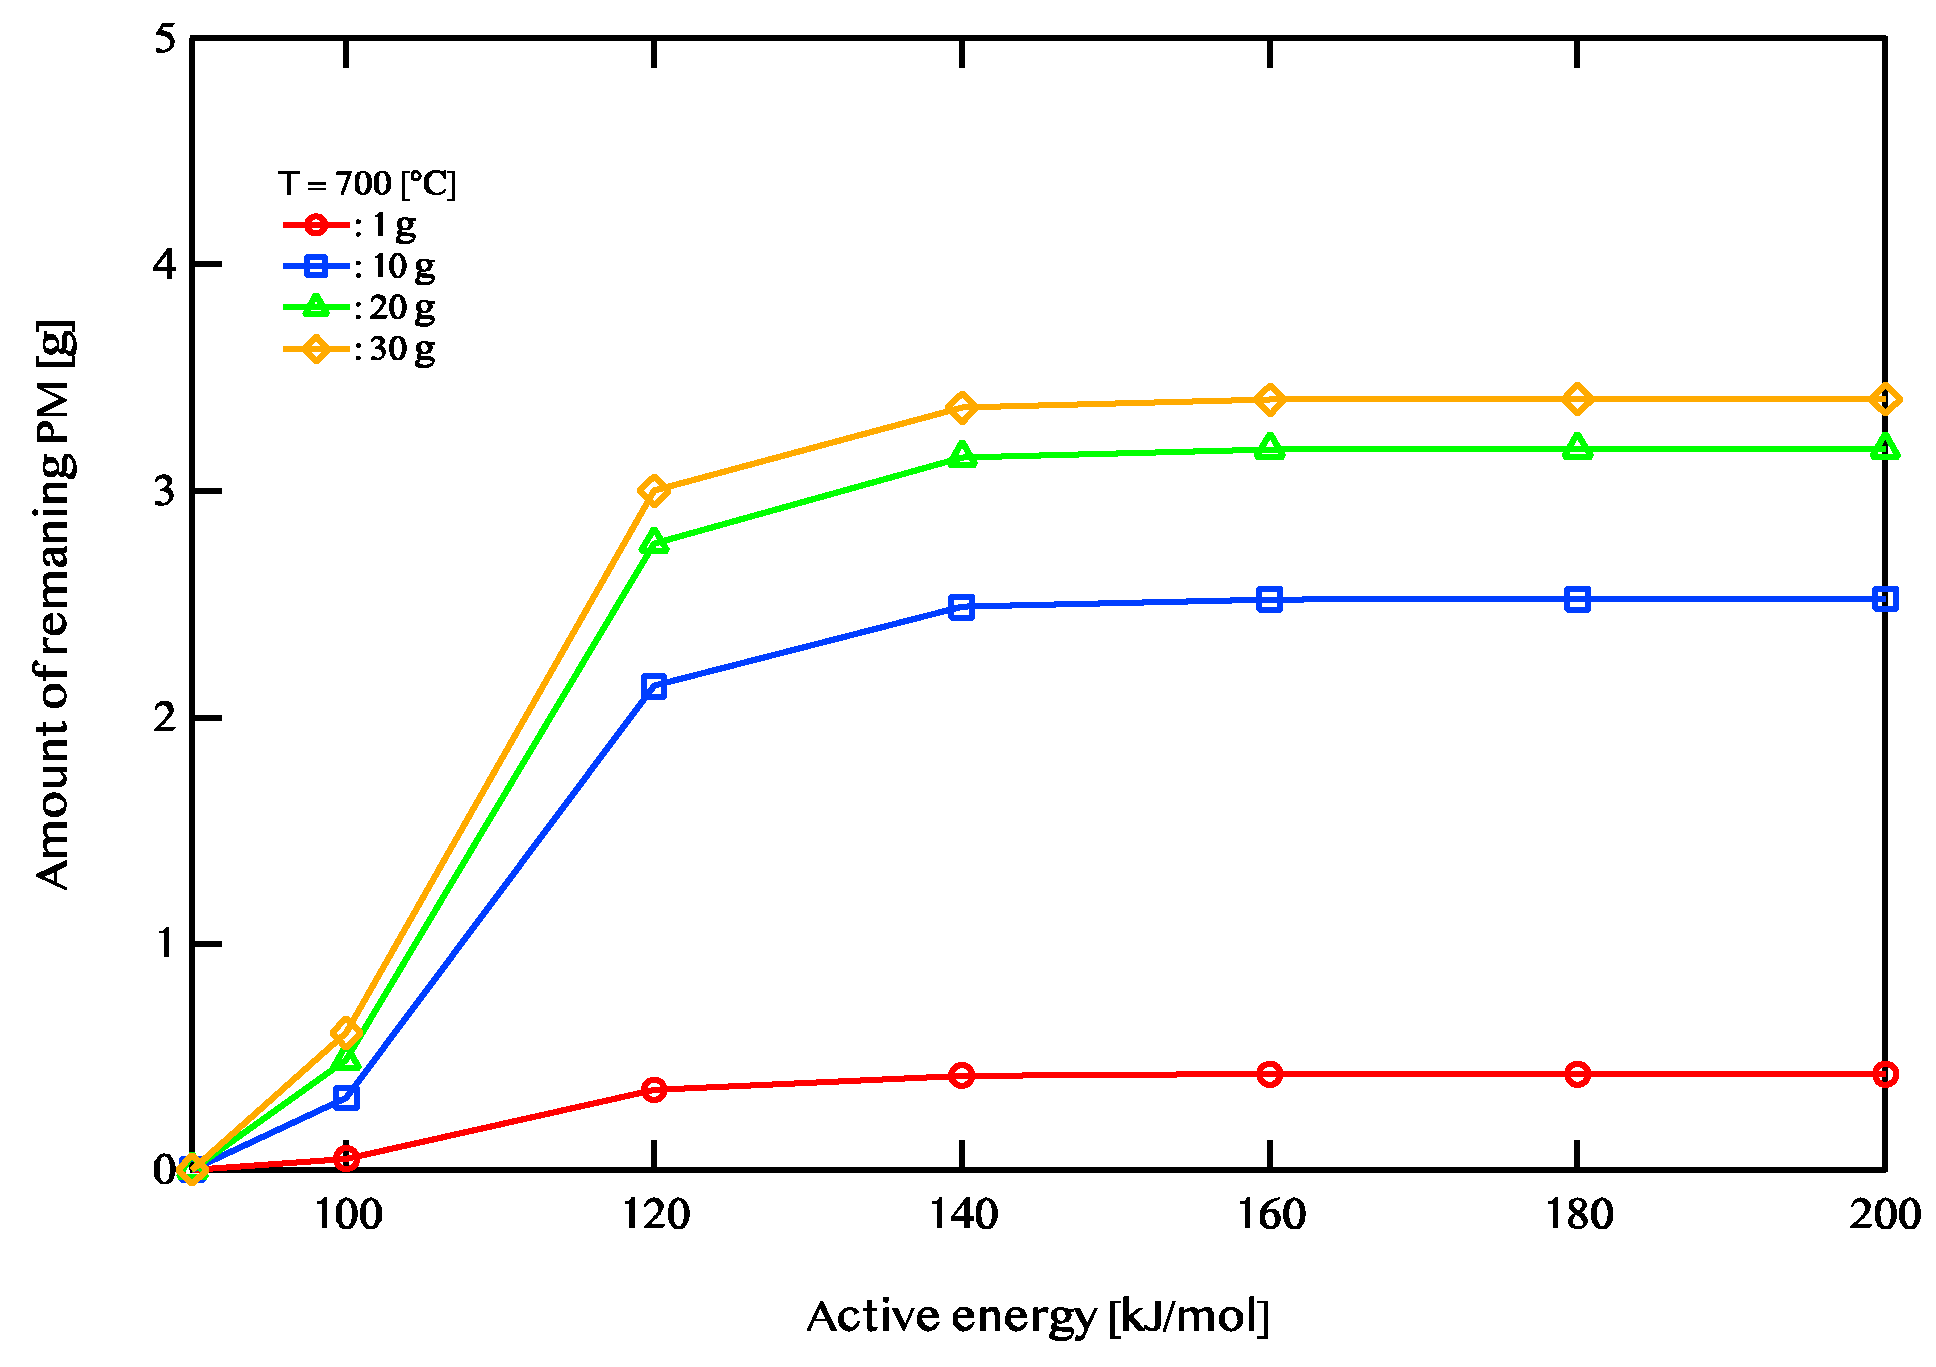
Figure 11.
Active energy dependence of the amount of PM remaining after 5400 seconds of regeneration is shown. The temperature of exhaust gas is 800 ℃. The red line shows 1g of PM deposition, the blue line shows 10g of PM deposition, the green line shows 20 g of PM deposition, and the yellow line shows 30g of PM deposition.
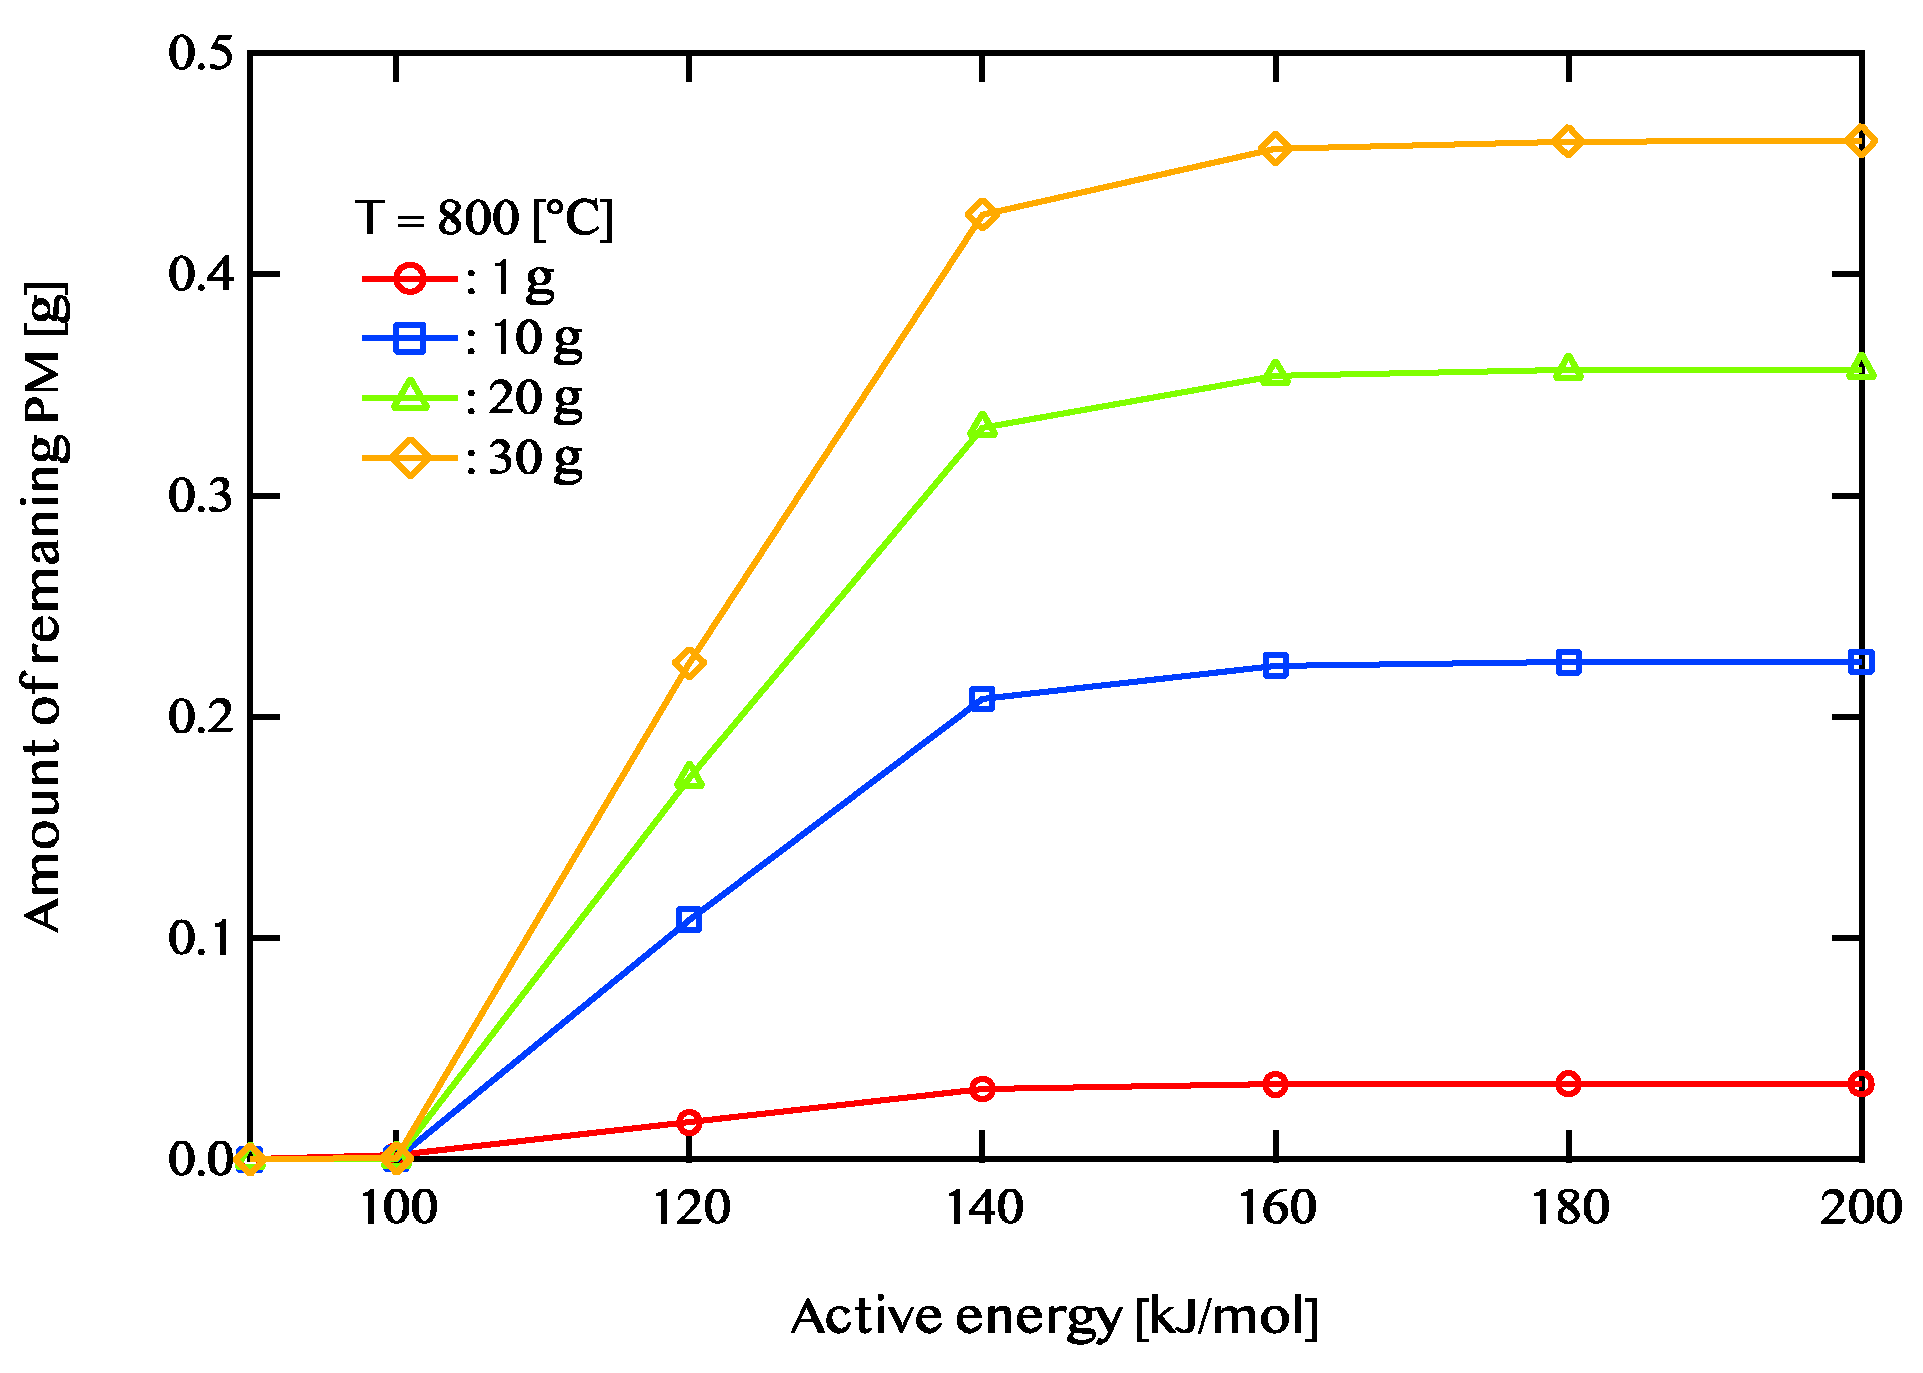

Table 1.
Thermal properties of solids.
| Oxidation heat of carbon [kJ/mol] | 292.51 |
| Specific heat of cordierite [J/(g・K)] | 0.75 |
| The density of cordierite [kg/m3] | 2.5 |
Table 2.
Parameters of a DPF ceramic part.
| The total length of DPF L [mm] | 110 |
| The diameter of DPF R [mm] | 130 |
| Wall thickness [mil] | 13 |
| Porosity [%] | 60 |
| Exhaust amount flow rate [g/s] | 30 |
Table 3.
Condition of Activation energy of SSR and GPR.
| Activation energy of SSR [kJ/mol] | 183 |
| Activation energy of GPR [kJ/mol] | 90, 100,120, 140,160,180,200 |
Disclaimer/Publisher’s Note: The statements, opinions and data contained in all publications are solely those of the individual author(s) and contributor(s) and not of MDPI and/or the editor(s). MDPI and/or the editor(s) disclaim responsibility for any injury to people or property resulting from any ideas, methods, instructions or products referred to in the content. |
© 2025 by the authors. Licensee MDPI, Basel, Switzerland. This article is an open access article distributed under the terms and conditions of the Creative Commons Attribution (CC BY) license (http://creativecommons.org/licenses/by/4.0/).
Copyright: This open access article is published under a Creative Commons CC BY 4.0 license, which permit the free download, distribution, and reuse, provided that the author and preprint are cited in any reuse.


